application of silica membranes in separations and hybrid ... · application of silica membranes in...
TRANSCRIPT

Application of silica membranes in separations andhybrid reactor systemsVerkerk, A.W.
DOI:10.6100/IR563416
Published: 01/01/2003
Document VersionPublisher’s PDF, also known as Version of Record (includes final page, issue and volume numbers)
Please check the document version of this publication:
• A submitted manuscript is the author's version of the article upon submission and before peer-review. There can be important differencesbetween the submitted version and the official published version of record. People interested in the research are advised to contact theauthor for the final version of the publication, or visit the DOI to the publisher's website.• The final author version and the galley proof are versions of the publication after peer review.• The final published version features the final layout of the paper including the volume, issue and page numbers.
Link to publication
General rightsCopyright and moral rights for the publications made accessible in the public portal are retained by the authors and/or other copyright ownersand it is a condition of accessing publications that users recognise and abide by the legal requirements associated with these rights.
• Users may download and print one copy of any publication from the public portal for the purpose of private study or research. • You may not further distribute the material or use it for any profit-making activity or commercial gain • You may freely distribute the URL identifying the publication in the public portal ?
Take down policyIf you believe that this document breaches copyright please contact us providing details, and we will remove access to the work immediatelyand investigate your claim.
Download date: 13. Jul. 2018

Application of silica membranes in separations and hybrid reactor systems
PROEFSCHRIFT
ter verkrijging van de graad van doctor aan de
Technische Universiteit Eindhoven, op gezag van de
Rector Magnificus, prof.dr. R.A. van Santen, voor een
commissie aangewezen door het College voor
Promoties in het openbaar te verdedigen
op donderdag 24 april 2003 om 16.00 uur
door
Arjan Willem Verkerk
geboren te Terneuzen

Dit proefschrift is goedgekeurd door de promotoren:
prof.dr.ir. J.T.F. Keurentjes
en
prof.dr. F. Kapteijn
Copromotor:
dr. L.J.P. van den Broeke
Verkerk, Arjan W.
Application of silica membranes in separations and hybrid reactor systems /
by Arjan W. Verkerk. – Eindhoven : Technische Universiteit Eindhoven,
2003.
Proefschrift. – ISBN 90-386-2944-3
NUR 913
Trefwoorden: keramische membranen / membraantechnologie / pervaporatie;
stofoverdracht / dehydratatie / fysisch-chemische simulatie en modellering;
Maxwell-Stefan theorie / superkritische vloeistoffen; koolstofdioxide
Subject headings: ceramic membranes / membrane technology / pervaporation;
mass transfer / dehydration / physicochemical simulation and modeling;
Maxwell-Stefan theory / supercritical fluids; carbon dioxide
Druk: Universiteitsdrukkerij, Technische Universiteit Eindhoven
© Copyright 2003, A.W. Verkerk

Voor mijn ouders


Contents
1. Introduction
1
2. Description of dehydration performance of amorphous silica pervaporation
membranes
17
3. Characteristics of gas permeation through a supported microporous silica
membrane
37
4. Separation of isopropanol/water mixtures by pervaporation with silica
membranes
61
5. Pervaporation-assisted esterification of levulinic acid with n-amyl alcohol
using a temperature resistant silica membrane
91
6. Pervaporation-assisted di-esterification of propionic acid with 1,4-butanediol
using a temperature resistant silica membrane
107
7. Use of silica membranes in novel membrane reactor applications
125
Summary 147
Samenvatting 149
Dankwoord 151


1
Chapter 1
Introduction*
Abstract
In this Chapter the integration of separation and reaction in a membrane reactor is discussed.
The use of a membrane reactor based on a silica pervaporation membrane has been studied for
esterification reactions. The main purpose of the pervaporation membrane is to remove the
water formed during the reaction, so that the equilibrium conversion can be exceeded. A
general introduction on membranes is given with emphasis on separation performance and the
integration with reactions. Furthermore, an outline of this thesis is presented.
* A part of this chapter has been published in Separation and Purification Technology 22-23 (2001) 689-695, “Properties of high flux ceramic pervaporation membranes for dehydration of alcohol/water mixtures” by A.W. Verkerk, P. van Male, M.A.G. Vorstman and J.T.F. Keurentjes

2
Membrane reactors for pervaporation-assisted esterifications
In this Chapter the main principles of combining a membrane separation process and an
esterification reaction in a membrane reactor are discussed. In such reactions high
temperatures and high pressures are often desirable to improve reaction kinetics. This implies
that membranes have to be stable at these reaction conditions. Current membrane reactors
predominantly use polymeric membranes, which have a limited stability at high temperatures.
A promising alternative for these polymer membranes is the use of inorganic membranes. A
number of different inorganic microporous membranes are currently available, including
zeolite membranes, carbon molecular sieve membranes and silica membranes [Bein, 1996;
Drioli and Romano, 2001].
Membrane reactors are being used for various purposes, ranging from controlled addition of
reactants [Coronas and Santamaria, 1999], and localization of homogeneous catalysts [Nair et
al., 2001], to the selective removal of one of the products. In this thesis the application of a
membrane reactor in pervaporation-assisted esterification reactions is studied. The membrane
reactor is used to exceed the equilibrium conversion by the selective removal of one of the
reaction products. An inorganic membrane is used in combination with a mono-esterification
and a di-esterification reaction, where the water produced during the reaction is selectively
removed by a supported silica pervaporation membrane.
Esterification reactions
A class of industrially relevant equilibrium reactions are esterification reactions in which
water is one of the products. Esters have various applications, ranging from plasticizers,
surface-active agents, flavor and perfume materials, to solvents for the production of various
chemicals. The annual production of these esters in the USA exceeded 5·106 tons in the year
1990 [Kirk-Othmer, 1994]. One of the main disadvantages of esterification reactions is that
they suffer from a low conversion. In addition to the low conversion, the presence of a
possible azeotrope between reactants and products also makes an esterification process more
difficult to operate. A simplified reaction equation is given by:
R(COOH)n + R(OH)m ! ester + H2O
In practice, there are two methods to improve the conversion of equilibrium reactions. In the
first approach, a large excess of one of the starting reagents is used. However, this results in a

3
Alcohols + carboxylic acids
H2O
dist.column
relatively inefficient use of reactor space, and an efficient separation is required afterwards. In
the second approach, the equilibrium conversion can be exceeded by removing one of the
reaction products. For esterification reactions water is the most appropriate component that
can be removed.
There are a number of ways to remove one of the reaction products. Distillation is an
appropriate technique for the removal of water from alcohols (see Figure 2a). However, for
these systems the formation of an azeotrope is a potential drawback, which limits the
(process) selectivity. Furthermore, in the case of the production of temperature-sensitive
products or for biocatalytic conversions, the application of distillation is not feasible as a
result of temperature constraints.
Membrane separations can be considered a viable alternative for a number of cases. For the
removal of water from organic streams, pervaporation seems to be the appropriate membrane
technique. The main purpose of the pervaporation membrane is to remove the water from the
reaction mixture in order the increase the product yield. In Figure 2b-d the various operation
methods are shown. In this thesis the set-up depicted in Figure 2d has been chosen for the
pervaporation-assisted reactions.
Figure 2a. Conventional set-up for the production of esters.

4
H2O
Alcohols + carboxylic acids
Alcohols + carboxylic acids
dist.column
H2O
Figure 2b. Production of esters using a distillation column and a pervaporation membrane.
Figure 2c. Production of esters using a pervaporation membrane whereby the condensed
vapor of the reactor is dehydrated.

5
H2O
Alcohols + carboxylic acids
Figure 2d. Production of esters with use of a pervaporation membrane whereby the liquid
stream is dehydrated.
In the literature, a number of papers describe the combination of pervaporation with an
esterification reaction (for an overview, see Waldburger and Widmer [1996]; Lipnizki et al.
[2000] ). However, the temperature of the process has always been below 373 K. David et al.
[1991] describe the pervaporation-assisted esterification of 1-propanol and 2-propanol with
propionic acid. They examine a basic kinetic model (Part I) and the influence of different
operation parameters (Part II). Keurentjes et al. [1994] examined the kinetics of the
esterification of tartaric acid with ethanol, and the equilibrium conversion was exceeded by
removing water by pervaporation. Waldburger et al. [1994] describe the use of a continuous
membrane reactor. Domingues et al. [1999] investigated the kinetics and equilibrium shift in
acetylation by means of pervaporation.
Pervaporation
Pervaporation is the selective evaporation of a component from a liquid mixture with the use
of a membrane. In general, a membrane is a permselective barrier or interface between two
phases. This is schematically illustrated in Figure 3. Membranes can be used for various
separations, like gas separation, pervaporation and water purification [Mulder, 1996]. Phase 1

6
Phase 1 Phase 2Membrane
Driving force
��������������������������������������������������������������������������������������������������������������������������������������������������������������������������������������������������������������������������������������������������������������������������������
Feed Permeate
Phase 1 Phase 2Membrane
Driving force
��������������������������������������������������������������������������������������������������������������������������������������������������������������������������������������������������������������������������������������������������������������������������������
FeedFeed PermeatePermeate
is the feed phase or upstream-side, while phase 2 is referred to as the permeate stream or
downstream-side. Separation is achieved because the membrane has the ability to transport
one type of species from the mixture more readily than other species. This transport may
occur through various transport mechanisms. The driving force for mass transport can be a
gradient in the pressure, electrical potential, concentration, temperature or chemical potential.
In the case of pervaporation, phase 1 in Figure 3 is a liquid phase and phase 2 is a vapor
phase. The stream leaving the membrane module at the feed-side is called the retentate. In the
field of pervaporation, two main applications have been commercialized. The first one is the
dehydration of alcohols and other solvents, and the second one is the removal of small
amounts of organic compounds from contaminated waters [Feng and Huang, 1997; Lipnizki
et al., 1999]. Some other promising applications are aroma recovery and beer dealcoholization
in the food industry, and product recovery from fermentation broths for enhanced
bioconversions [Fadeev et al., 2000].
Figure 3. Schematic representation of a membrane process.
Pervaporation comprises a number of consecutive steps. The membrane selectively adsorbs
one or more of the components, which diffuse through the membrane and evaporate at the
permeate side. The permeate stream is removed by applying either a vacuum or a sweeping
gas (see Figure 4a and Figure 4b). In Figure 4c five different steps are considered, which are
crucial for the overall performance of the separation process. These are 1) mass transfer from

7
Feed
Condensor
Retentate
Permeate
Vacuum pump
Membrane
Feed
Condensor
Retentate
Permeate
Membrane
Sweep gas
the bulk of the feed to the feed-membrane interface; 2) partitioning of the penetrants between
the feed and the membrane; the selective layer of the membrane is usually at the feed side of
the membrane; 3) diffusion inside the membrane; 4) desorption at the membrane-permeate
interface and 5) mass transfer from the permeate-membrane interface. The overall driving
force for pervaporation is the difference in partial vapor pressure between the feed and the
permeate side of the membrane. Parallel to the mass transfer of steps 1 and 3, also heat is
required for the evaporation process.
Figure 4a. Schematic representation of the pervaporation process with use of a vacuum pump.
Figure 4b. Schematic representation of the pervaporation process with use of a sweep gas.

8
• Transport from bulk to the membrane
Feed
Permeate
Selectivetoplayer
• Transport throughsupporting material
• Adsorption at the membrane
• Diffusion through membrane• Desorption vapour phase
Liquid boundery layer
Supporting material
• Transport from bulk to the membrane
Feed
Permeate
Selectivetoplayer
• Transport throughsupporting material
• Adsorption at the membrane
• Diffusion through membrane• Desorption vapour phase
Liquid boundery layer
Supporting material
Figure 4c. Schematic view of the transport through a pervaporation membrane.
Membrane performance
The performance of a pervaporation membrane is usually expressed in the flux and separation
factor. The total flux, Jtot, is the sum of the fluxes (ΣJi) of the components in the mixture. The
separation factor, α, is defined as:
jj
iix/yx/y=α (1)
in which y and x are the fractions of component i and j in the permeate and retentate,
respectively.
Usually there is a trade-off between the permeation and separation factor; i.e. when one factor
increases, the other decreases. As both of them are important factors in the separation process,
a Pervaporation Separation Index (PSI) [Huang and Feng, 1993] can be defined as a measure
of the separation ability of a membrane:
PSI=Jtot α (2)

9
Polymer pervaporation membranes
Selective polymeric membranes are available for the dehydration of alcohols, carboxylic
acids, amines and many other liquids. For polymer pervaporation membranes, extensive
research has been performed in order to find an optimized membrane material having
selective interaction with a specific component of the feed mixture to maximize the
performance in terms of separation factor, flux and stability. For polymeric pervaporation
membranes, various models describing the mass transport [Karlson and Trägårdh, 1993;
Heintz and Stephan, 1994a,b] are available. However, the performance of these polymeric
membranes is influenced by changes in process conditions, like changes in concentration,
temperature, and pressure [Waldburger and Widmer, 1996]. This limits the use of polymeric
membranes to relatively low temperatures.
Inorganic membranes
Inorganic membranes exhibit physical and chemical properties that are not (or only partially)
shown by organic membranes. Inorganic membranes have better structural stability without
the problems of swelling or compaction. Generally, they can withstand harsh chemical
environments and high temperatures. Furthermore, the ceramic membranes are not susceptible
to microbiological attack, and can be backflushed, steam sterilized or autoclaved [Hsieh et al.,
1988].
Inorganic microporous membranes have a narrow pore size distribution, and the pore
diameter is typically smaller than 1 nm. Most of the membranes are asymmetrical, i.e. they
consist of several macroporous support layers providing the mechanical strength with a
microporous selective top layer providing the selectivity. In general, the main transport
resistance is in the top layer and, therefore, this layer should be very thin to have high fluxes.
The interest in utilizing inorganic membranes has increased considerably, as ceramic
membranes with narrow pore size distributions have become commercially available [Koukou
et al., 1999; Velterop, 1999; Morigami et al., 2001; Van Veen et al., 2001]. An example of a
commercially available microporous ceramic membrane is the microporous alumina-
supported silica membrane developed by ECN (Petten, The Netherlands). The membranes
consist of four support layers of α- and γ-alumina, and the selective top layer at the outer wall
of the tube is made of amorphous silica [Koukou et al., 1999]. These silica membranes are
used in this thesis. In Table 1 an overview is given of the dimensions of the supported silica
membrane.

10
Table 1. Dimensions of the alumina-supported silica membrane.
Property
Average pore diameter silica layer 0.6 nm
Thickness silica layer 200 nm
Total thickness alumina support layer 3.1 mm
Length membrane 0.30 m
Outer diameter membrane 0.014 m
Comparison with literature
To study the performance of the silica membrane two isopropanol/water mixtures (95/5 wt%
and 90/10 wt%) have been dehydrated at 343 K. For the experimental procedure the reader is
referred to Chapter 2. A comparison is made with various literature studies dealing with the
dehydration of isopropanol by pervaporation.
An overview of the results for the fluxes and separation factor is given in Table 3. For the
silica membrane used in this study, after stabilization a PSI up to 1800 kg/(m2.h) was
obtained, where most of the other membranes used show a significantly lower value for the
PSI. There are two membranes that have a higher PSI, but these two membranes are limited to
low temperatures. Furthermore, all the polymeric membranes, except the CMC-CE-02, show
a decrease in PSI with increasing temperature. The only other silica membrane has a
considerably lower PSI, which may be a result of polarization effects or a lower water
adsorption capacity.

11
Ref
eren
ceM
embr
ane
type
or
mat
eria
lT (K
)J wa )
J wb )α
(-)
10/5
w
t%
PSI
kg/(m
2 h)
10/5
wt%
Com
men
ts
[Atra
et a
l., 1
999]
CM
C- C
E-01
CM
C- C
E-02
338
328
0.1
0.06 0.1
370/
520
800
80/3
0 70PS
I dro
psw
ith in
crea
sing
tem
p.PS
Iinc
reas
es w
ith
tem
pera
ture
[Nam
et a
l.,19
99]
Car
boxy
met
hyla
ted
poly
(vin
yl a
lcoh
ol)
353
0.5
0.2
1800
/37
0090
0/90
0
[Gha
zali
et a
l.,
1997
]C
hito
san
(cro
ss-l
inke
d)C
hito
san/
PS-c
ompo
site
303
303
0.1
0.3
2000 80
018
020
0PS
I is
roug
hly
the
sam
eat
33
3 K
[Hua
nget
al.,
19
99a]
Chito
san
, cro
ss-li
nked
,PS
supp
ort
10µ
m,n
oPV
A b
indi
ng
10µ
m, P
VA
bin
ding
1 µm
, PV
A b
indi
ng
323
323
323
6.0
0.9
1.6
5.0
0.4
0.7
7 00
0
350/
350
250/
350
40 0
00
300/
140
400/
350
Goi
ng fr
om32
3to
343
K,
αde
crea
ses
10- f
old
[Hua
nget
al.,
19
99b]
Sodi
um a
lgin
ate
343
1.0
2 50
02
500
[Van
Gem
erta
ndC
uper
us, 1
995]
Silic
a34
30.
350
015
0
This
thes
isSi
lica
343
2.1
600
1 25
0A
fter s
tabi
lizat
ion
PSI=
18
00
Ref
eren
ceR
efer
ence
Mem
bran
ety
peor
m
ater
ial
Mem
bran
ety
peor
m
ater
ial
T (K)
T (K)
J wa )J wa )
J wb )J wb )
α(-
)10
/5
wt%
α(-
)10
/5
wt%
PSI
kg/(m
2 h)
10/5
wt%
PSI
kg/(m
2 h)
10/5
wt%
Com
men
tsC
omm
ents
[Atra
et a
l., 1
999]
[Atra
et a
l., 1
999]
CM
C- C
E-01
CM
C- C
E-02
CM
C- C
E-01
CM
C- C
E-02
338
328
338
328
0.1
0.1
0.06 0.1
0.06 0.1
370/
520
800
370/
520
800
80/3
0 7080
/30 70
PSI d
rops
with
incr
easin
g te
mp.
PSIi
ncre
ases
with
te
mpe
ratu
re
PSI d
rops
with
incr
easin
g te
mp.
PSIi
ncre
ases
with
te
mpe
ratu
re
[Nam
et a
l.,19
99]
[Nam
et a
l.,19
99]
Car
boxy
met
hyla
ted
poly
(vin
yl a
lcoh
ol)
Car
boxy
met
hyla
ted
poly
(vin
yl a
lcoh
ol)
353
353
0.5
0.5
0.2
0.2
1800
/37
0018
00/
3700
900/
900
900/
900
[Gha
zali
et a
l.,
1997
][G
haza
liet
al.,
19
97]
Chi
tosa
n(c
ross
-lin
ked)
Chi
tosa
n/PS
-com
posit
eC
hito
san
(cro
ss-l
inke
d)C
hito
san/
PS-c
ompo
site
303
303
303
303
0.1
0.3
0.1
0.3
2000 80
020
00 800
180
200
180
200
PSI i
sro
ughl
yth
esa
me
at
333
KPS
I is
roug
hly
the
sam
eat
33
3 K
[Hua
nget
al.,
19
99a]
[Hua
nget
al.,
19
99a]
Chito
san
, cro
ss-li
nked
,PS
supp
ort
10µ
m,n
oPV
A b
indi
ng
10µ
m, P
VA
bin
ding
1 µm
, PV
A b
indi
ng
Chito
san
, cro
ss-li
nked
,PS
supp
ort
10µ
m,n
oPV
A b
indi
ng
10µ
m, P
VA
bin
ding
1 µm
, PV
A b
indi
ng
323
323
323
323
323
323
6.0
0.9
1.6
6.0
0.9
1.6
5.0
0.4
0.7
5.0
0.4
0.7
7 00
0
350/
350
250/
350
7 00
0
350/
350
250/
350
40 0
00
300/
140
400/
350
40 0
00
300/
140
400/
350
Goi
ng fr
om32
3to
343
K,
αde
crea
ses
10- f
old
Goi
ng fr
om32
3to
343
K,
αde
crea
ses
10- f
old
[Hua
nget
al.,
19
99b]
[Hua
nget
al.,
19
99b]
Sodi
um a
lgin
ate
Sodi
um a
lgin
ate
343
343
1.0
1.0
2 50
02
500
2 50
02
500
[Van
Gem
erta
ndC
uper
us, 1
995]
[Van
Gem
erta
ndC
uper
us, 1
995]
Silic
aSi
lica
343
343
0.3
0.3
500
500
150
150
This
thes
isTh
isth
esis
Silic
aSi
lica
343
343
2.1
2.1
600
600
1 25
01
250
Afte
r sta
biliz
atio
nPS
I=
1800
Afte
r sta
biliz
atio
nPS
I=
1800
Tab
le2.
Ove
rvie
wof
fluxe
san
d se
lect
iviti
es o
fvar
ious
per
vapo
ratio
n m
embr
anes
in th
esy
stem
wate
r/is
opro
pano
l
a)W
ater
flux
(kg/
m2 h
) of t
he 9
0/10
wt%
isopr
opan
ol/w
ater
mix
ture
b)W
ater
flux
(kg/
m2 h
) of t
he 9
5/5
wt%
isopr
opan
ol/w
ater
mix
ture
Ref
eren
ceM
embr
ane
type
or
mat
eria
lT (K
)J wa )
J wb )α
(-)
10/5
w
t%
PSI
kg/(m
2 h)
10/5
wt%
Com
men
ts
[Atra
et a
l., 1
999]
CM
C- C
E-01
CM
C- C
E-02
338
328
0.1
0.06 0.1
370/
520
800
80/3
0 70PS
I dro
psw
ith in
crea
sing
tem
p.PS
Iinc
reas
es w
ith
tem
pera
ture
[Nam
et a
l.,19
99]
Car
boxy
met
hyla
ted
poly
(vin
yl a
lcoh
ol)
353
0.5
0.2
1800
/37
0090
0/90
0
[Gha
zali
et a
l.,
1997
]C
hito
san
(cro
ss-l
inke
d)C
hito
san/
PS-c
ompo
site
303
303
0.1
0.3
2000 80
018
020
0PS
I is
roug
hly
the
sam
eat
33
3 K
[Hua
nget
al.,
19
99a]
Chito
san
, cro
ss-li
nked
,PS
supp
ort
10µ
m,n
oPV
A b
indi
ng
10µ
m, P
VA
bin
ding
1 µm
, PV
A b
indi
ng
323
323
323
6.0
0.9
1.6
5.0
0.4
0.7
7 00
0
350/
350
250/
350
40 0
00
300/
140
400/
350
Goi
ng fr
om32
3to
343
K,
αde
crea
ses
10- f
old
[Hua
nget
al.,
19
99b]
Sodi
um a
lgin
ate
343
1.0
2 50
02
500
[Van
Gem
erta
ndC
uper
us, 1
995]
Silic
a34
30.
350
015
0
This
thes
isSi
lica
343
2.1
600
1 25
0A
fter s
tabi
lizat
ion
PSI=
18
00
Ref
eren
ceR
efer
ence
Mem
bran
ety
peor
m
ater
ial
Mem
bran
ety
peor
m
ater
ial
T (K)
T (K)
J wa )J wa )
J wb )J wb )
α(-
)10
/5
wt%
α(-
)10
/5
wt%
PSI
kg/(m
2 h)
10/5
wt%
PSI
kg/(m
2 h)
10/5
wt%
Com
men
tsC
omm
ents
[Atra
et a
l., 1
999]
[Atra
et a
l., 1
999]
CM
C- C
E-01
CM
C- C
E-02
CM
C- C
E-01
CM
C- C
E-02
338
328
338
328
0.1
0.1
0.06 0.1
0.06 0.1
370/
520
800
370/
520
800
80/3
0 7080
/30 70
PSI d
rops
with
incr
easin
g te
mp.
PSIi
ncre
ases
with
te
mpe
ratu
re
PSI d
rops
with
incr
easin
g te
mp.
PSIi
ncre
ases
with
te
mpe
ratu
re
[Nam
et a
l.,19
99]
[Nam
et a
l.,19
99]
Car
boxy
met
hyla
ted
poly
(vin
yl a
lcoh
ol)
Car
boxy
met
hyla
ted
poly
(vin
yl a
lcoh
ol)
353
353
0.5
0.5
0.2
0.2
1800
/37
0018
00/
3700
900/
900
900/
900
[Gha
zali
et a
l.,
1997
][G
haza
liet
al.,
19
97]
Chi
tosa
n(c
ross
-lin
ked)
Chi
tosa
n/PS
-com
posit
eC
hito
san
(cro
ss-l
inke
d)C
hito
san/
PS-c
ompo
site
303
303
303
303
0.1
0.3
0.1
0.3
2000 80
020
00 800
180
200
180
200
PSI i
sro
ughl
yth
esa
me
at
333
KPS
I is
roug
hly
the
sam
eat
33
3 K
[Hua
nget
al.,
19
99a]
[Hua
nget
al.,
19
99a]
Chito
san
, cro
ss-li
nked
,PS
supp
ort
10µ
m,n
oPV
A b
indi
ng
10µ
m, P
VA
bin
ding
1 µm
, PV
A b
indi
ng
Chito
san
, cro
ss-li
nked
,PS
supp
ort
10µ
m,n
oPV
A b
indi
ng
10µ
m, P
VA
bin
ding
1 µm
, PV
A b
indi
ng
323
323
323
323
323
323
6.0
0.9
1.6
6.0
0.9
1.6
5.0
0.4
0.7
5.0
0.4
0.7
7 00
0
350/
350
250/
350
7 00
0
350/
350
250/
350
40 0
00
300/
140
400/
350
40 0
00
300/
140
400/
350
Goi
ng fr
om32
3to
343
K,
αde
crea
ses
10- f
old
Goi
ng fr
om32
3to
343
K,
αde
crea
ses
10- f
old
[Hua
nget
al.,
19
99b]
[Hua
nget
al.,
19
99b]
Sodi
um a
lgin
ate
Sodi
um a
lgin
ate
343
343
1.0
1.0
2 50
02
500
2 50
02
500
[Van
Gem
erta
ndC
uper
us, 1
995]
[Van
Gem
erta
ndC
uper
us, 1
995]
Silic
aSi
lica
343
343
0.3
0.3
500
500
150
150
This
thes
isTh
isth
esis
Silic
aSi
lica
343
343
2.1
2.1
600
600
1 25
01
250
Afte
r sta
biliz
atio
nPS
I=
1800
Afte
r sta
biliz
atio
nPS
I=
1800
Tab
le2.
Ove
rvie
wof
fluxe
san
d se
lect
iviti
es o
fvar
ious
per
vapo
ratio
n m
embr
anes
in th
esy
stem
wate
r/is
opro
pano
l
a)W
ater
flux
(kg/
m2 h
) of t
he 9
0/10
wt%
isopr
opan
ol/w
ater
mix
ture
b)W
ater
flux
(kg/
m2 h
) of t
he 9
5/5
wt%
isopr
opan
ol/w
ater
mix
ture

12
Outline of this thesis
In this thesis the application of silica membranes in separations and hybrid reactor systems
has been explored. The main focus of the research is on the combination of esterification
reactions with pervaporation. For this purpose, first the membrane performance has been
established. Secondly, the kinetics of the condensation reaction has to be determined.
Conclusively, these items can be combined, resulting in a description of a membrane reactor.
In Chapter 2 the dehydration performance of amorphous silica membranes is described.
Isopropanol/water mixtures have been used as a model system. The applied temperature range
is between 303 and 353 K, and the water concentration has been varied between 1 and 100
wt%. A generalized Maxwell-Stefan model has been set up to model the fluxes. The water
flux can be described well, for the alcohol flux binary adsorption and diffusion data are
required.
In Chapter 3 the insight in the transport through the silica membrane has been extended.
Permeation experiments have been performed with various gasses through the membrane with
and without the selective top layer. From the permeation behavior of various adsorbing gases
and the non-adsorbing helium it can be concluded that the mass transport through the
microporous silica top layer takes place by two different activated mechanisms.
To improve the description of the alcohol flux, in Chapter 4 diffusion and equilibrium
adsorption data have been taken into account using the Maxwell-Stefan theory. The mass
transport in the supported membrane has been described by a combined model consisting of
micropore diffusion and activated gaseous diffusion.
In Chapter 5 the mono esterification reaction of levulinic acid with n-amyl alcohol combined
with pervaporation has been carried out. Experiments have been performed at atmospheric
conditions and up to a temperature of 408 K. The concentration profiles have been described
with a theoretical model combining reaction kinetics and a linear relation for the water flux as
a function of the driving force.
Chapter 6 deals with the esterification reaction of a propionic acid with 1,4-butanediol
combined with pervaporation. The pervaporation-assisted reactions have been studied at
elevated pressures and at temperatures up to 453 K.
In Chapter 7 other novel applications of inorganic microporous membranes in separations and
reactions are discussed. The use of ceramic membranes in various areas like in catalytic
membrane reactors to localize a homogeneous catalyst, and the use in high-temperature and
high-pressure applications are evaluated. In particular, the supported silica membranes have
been used to regenerate carbon dioxide at supercritical conditions.

13
The main purpose of the research described in this thesis is to enlarge the operating window
of membrane reactors by using silica membranes. Therefore, the methodologies presented in
this thesis are of relevance for further development of membranes in various separations and
hybrid reactor systems.
It has been chosen to set-up this thesis in such a way that each individual Chapter provides
enough information to be read independently from the other Chapters. Consequently, some
information is repeated in different Chapters.
Notation
J flux (kg/(m2h))
PSI pervaporation separation index (kg/(m2h))
xi mol fraction of component i in the retentate (mol/mol)
yi mol fraction of component i in the permeate (mol/mol)
Greek letters
α separation factor (-)
Subscripts
i, j component i and j, respectively
tot total
w water
References
R. Atra, G. Vatai and E. Bekassy-Molnar, Isopropanol dehydration by pervaporation.
Chem. Eng. Process., 38 (1999) 149.
W.J.W. Bakker, I.A.A.C. Bos, W.L.P. Rutten, J.T.F. Keurentjes and M. Wessling,
Application of ceramic pervaporation membranes in polycondensation reactions, Int. Conf.
Inorganic Membranes, Nagano, Japan (1998) 448.
T. Bein, Synthesis and application of molecular sieve layers and membranes, Chem.
Mater., 8 (1996) 1636.
J. Coronas and J. Santamaria, Catalytic reactors based on porous ceramic
membranes, Catal. Today, 51 (1999) 377.

14
M.-O. David, R. Gref, T.Q. Nguyen and J. Néel, Pervaporation-esterification
coupling: Part I. Basic kinetic model, Trans. Inst. Chem. Eng., 69A (1991) 335.
M.-O. David, R. Gref, T.Q. Nguyen and J. Néel, Pervaporation-esterification
coupling: Part II. Modeling of the influence of different operation parameters, Trans. Inst.
Chem. Eng., 69A (1991) 341.
L. Domingues, F. Recasens and M.A. Larrayoz, Studies of a pervaporation reactor:
kinetics and equilibrium shift in benzyl alcohol acetylation. Chem. Eng. Sci., 54 (1999) 1461.
E. Drioli, M. Romano, Progress and new perspectives on integrated membrane
operations for sustainable industrial growth, Ind. Eng. Chem. Res., 40 (2001) 1277.
A.G. Fadeev, M.M. Meagher, S.S. Kelley and V.V. Volkov, Fouling of poly[-1-
(trimethylsilyl)-1-propyne] membranes in pervaporative recovery of butanol from aqueous
solutions and ABE fermentaion broth, J. Membr. Sci., 173 (2000) 133.
X. Feng and R.Y.M. Huang, Liquid separation by membrane pervaporation: a review,
Ind. Eng. Chem. Res., 36 (1997) 1048.
R.W. van Gemert and F.P. Cuperus, Newly developed ceramic membranes for
dehydration and separation of organic mixtures by pervaporation, J. Membr. Sci., 105 (1995)
287.
M. Ghazali, M. Nawawi and R.Y.M. Huang, Pervaporation dehydration of
isopropanol with chitosan membranes. J. Membr. Sci., 124 (1997) 53.
A. Heintz and W. Stephan, A generalized solution-diffusion model of the pervaporation
process through composite membranes Part I. Prediction of mixture solubilities in the dense
active layer using the UNIQUAC model, J. Membr. Sci., 89 (1994) 143.
A. Heintz and W. Stephan, A generalized solution-diffusion model of the pervaporation
process through composite membranes Part II. Concentration polarization, coupled diffusion
and the influence of the porous support layer, J. Membr. Sci., 89 (1994) 153.
H.P. Hsieh, R.R. Bhave and H.L. Fleming, Microporous alumina membranes, J.
Membr. Sci., 39 (1988) 221.
R.Y.M. Huang and X. Feng, Dehydration of isopropanol by pervaporation using
aromatic polyetherimide membranes, Sep. Sci. Technol., 28 (1993) 2035.
R.Y.M. Huang, R. Pal and G.Y. Moon, Crosslinked chitosan composite membrane for
the pervaporation dehydration of alcohol mixtures and enhancement of structural stability of
chitosan/polysulfone composite membranes, J. Membr. Sci., 160 (1999a) 17.

15
R.Y.M. Huang, R. Pal and G.Y. Moon, Characteristics of sodium alginate membranes
for the pervaporation dehydration of ethanol-water and isopropanol-water mixtures, J.
Membr. Sci., 160 (1999b) 101.
H.O.E. Karlsson and G. Trägårdh, Pervaporation of dilute organic-water mixtures. A
literature review on modelling studies and applications to aroma compound recovery, J.
Membr. Sci., 79 (1993) 121.
J.T.F. Keurentjes, G.H.R. Jansen and J.J. Gorissen, The esterification of tartaric acid
with ethanol: Kinetics and shifting the equilibrium by means of pervaporation, Chem. Eng.
Sci., 49 (1994) 4681.
Kirk-Othmer Encyclopedia of Chemical Technology, John Wiley & Sons, Inc, New
York (1994).
M.K. Koukou, N. Papyannakos, N.C. Markatos, M. Bracht, H.M. van Veen and A.
Roskam, Performance of Ceramic Membranes at Elevated Pressure and Temperature: Effect
of Non-Ideal Flow Conditions in a Pilot Scale Membrane Separator, J. Membr. Sci., 155
(1999) 241.
F. Lipnizki, R.W. Field and P. Ten, Pervaporation-based hybrid process: a review of
process design, applications and economics, J. Membr. Sci., 153 (1999) 183.
F. Lipnizki, S. Hausmanns, G. Laufenberg, R. Field and B. Kunz, Use of
pervaporation-bioreactor hybrid processes in biotechnology, Chem. Eng. Technol., 23 (2000)
569.
Y. Morigami, M. Kondo, J. Abe, H. Kita and K. Okamoto, The first large-scale
pervaporation plant using tubular-type module with zeolite NaA membrane, Separ. Purif.
Technol., 25 (2001) 251.
M. Mulder, Basic principles of membrane technology, Kluwer Academic Publishers,
Dordrecht (1996).
S.Y. Nam, H.J. Chun and Y.M. Lee, Pervaporation Separation of Water-Isopropanol
Mixtures Using Carboxymethyalated Poly(vinyl alcohol) Composite Membranes, J. Appl.
Polym. Sci., 72 (1999) 241.
D. Nair, J.T. Scarpello, L.S. White, L.M. Freitas dos Santos, I.F.J. Vankelecom and
A.G. Livingston, Semi-continuous nanofiltration-coupled Heck reactions as a new approach
to improve productivity of homogeneous catalysts, Tetrahedron Letters, 42 (2001) 8219.
F.M. Velterop, Pervatech bv selective ceramic membrane technology, Book of
Abstracts, Volume 2, Euromembrane 99, Leuven, 20-23 September 1999, Belgium, p. 118.

16
H.M. van Veen, Y.C. van Delft, C.W.R. Engelen and P.P.A.C. Pex, Dewatering of
organics by pervaporation with silica membranes, Separ. Purif. Technol., 22-23 (2001) 361.
R. Waldburger, F. Widmer and W. Heinzelmann, Kombination von Veresterung und
Pervaporation in einem kontinuierlichen Membranreaktor, Chem. Ing. Tech., 66 (1994) 850.
R.M. Waldburger and F. Widmer, Membrane reactors in chemical production
processes and the application to the pervaporation-assisted esterification, Chem. Eng.
Technol., 19 (1996) 117.

17
Chapter 2
Description of dehydration performance of
amorphous silica pervaporation membranes*
Abstract
The dehydration performance of a ceramic pervaporation membrane is studied for the
separation of isopropanol/water mixtures. The membranes are provided by ECN (The
Netherlands) and consist of a water-selective amorphous silica top layer and four alumina
supporting layers. For the system investigated, these membranes appear to combine high
selectivities with high permeabilities. This results in a very high Pervaporation Separation
Index (PSI is up to 6000 kg/(m2.h) at 353K). A generalized Maxwell-Stefan model has been
set up to model the fluxes. From this analysis it follows, that the water flux is only
proportional to its own driving force. It is experimentally demonstrated that this holds for a
wide range of operating conditions and feed compositions. From these data values of various
Maxwell-Stefan diffusivities are estimated.
* This chapter has been published in Journal of Membrane Science, 193 (2001) 227-238, “Description of dehydration performance of amorphous silica pervaporation membranes” by A.W. Verkerk, P. van Male, M.A.G. Vorstman and J.T.F. Keurentjes

18
Introduction
Compared to distillation, pervaporation can often be considered a better candidate for the
separation of close boiling, azeotropic or isomeric mixtures. These separations are
troublesome or are difficult to achieve by conventional means [Ray et al., 1997]. As a broad
range of mixtures can be separated using pervaporation, this opens the way to many different
applications [Van Gemert and Cuperus, 1995; Karlsson and Trägårdh, 1993; Fleming and
Slater, 1992]. Besides separation, also reaction combined with separation can be performed
[David et al., 1991; Keurentjes et al., 1994]. In this way, production yields can be increased
and considerable energy savings can be achieved.
For polymeric pervaporation membranes, extensive research has been performed in finding an
optimized membrane material having selective interaction with a specific component of the
feed mixture to maximize the performance in terms of separation factor, flux and stability
[Fleming and Slater, 1992]. However, the performance of these membranes is strongly
influenced by process conditions like component concentrations and temperature [Waldburger
and Widmer, 1996].
In this perspective, a membrane made of ceramics could mean a major improvement, due to
the multipurpose character and a far better stability. The interest in utilizing such membranes
in separations has increased, as ceramic membranes with narrow pore size distributions have
become commercially available [Velterop, 1999; Van Veen et al., 1999]. Inorganic
membranes exhibit unique physical and chemical properties that are not (or only partially)
shown by organic membranes, including a better structural stability without the problems of
swelling or compaction. Generally, they can withstand harsh chemical environments and high
temperatures. Furthermore, the ceramic membranes are not liable to microbiological attack,
and can be backflushed, steam sterilized or autoclaved [Hsieh et al., 1988].
For mass transport in inorganic pervaporation membranes, hardly any model is proposed in
literature. For polymeric pervaporation membranes, however, various models describing mass
transport have been presented. Karlsson and Trägårdh [1993] describe in their review several
models for pervaporation of dilute organic-water mixtures. The modeling of the process
involves four successive steps, which are crucial for the overall performance of the
pervaporation process. These are 1) mass transfer from the bulk of the feed to the feed-
membrane interface; 2) partitioning of the penetrants between the feed and the membrane; 3)
diffusion inside the membrane and 4) desorption at the membrane-permeate interface. Heintz
and Stephan [Part I and II, 1994] use a generalized solution-diffusion model to describe the

19
transport inside polymeric membranes (step 3). Diffusion coupling is taken into account by
the Maxwell-Stefan equations, the mixed solubility equilibrium is described with UNIQUAC.
The Maxwell-Stefan theory can also be applied to describe permeation through microporous∗
inorganic materials. Transport and separation of gases in inorganic membranes with
micropores has been studied by Bakker et al. [1996] and Van den Broeke et al. [Part I and II,
1999]. Van den Broeke et al. report both permeation of one-component [Part I, 1999] and
binary mixtures [Part II, 1999] through a silicalite-1 membrane. The adsorption is described
by a Langmuir isotherm for a single component system and the Ideal Adsorbed Solution
theory is used to describe multicomponent systems. The mass transport is described by the
Maxwell-Stefan theory. In this way, a good description of the separation behavior as a
function of different process conditions is given. Nair et al. [2000] studied gas and vapor
separation in microporous silica membranes. Mass transport in both phases showed an
activated diffusion behavior.
In this paper, we extend the Maxwell-Stefan theory to describe the mass transport inside a
ceramic pervaporation membrane [Van Veen et al., 1999]. Experiments have been performed
with isopropanol/water mixtures of which the composition of the feed and process conditions
(temperature and permeate pressure) have been varied. The membranes are characterized in
terms of flux and separation factor, thus giving an impression of the application potential.
Theory
The performance of a pervaporation membrane is usually expressed in terms of the flux and
separation factor. The total mass flux, Jtot (kg/(m2.h)), is the sum of the fluxes (Ji) of the
components in the mixture. To describe the transport of the components through the ceramic
pervaporation membrane the Maxwell-Stefan equations have been used. Like in the case of
gas transport through microporous materials, it is assumed that the transport through the
ceramic membrane takes place in the adsorbed phase. This is equivalent to surface diffusion.
The transport of a binary mixture of components i and j permeating through a membrane is
described as a ternary mixture of components i, j and M, in which M represents the
membrane. The transport equation for component i is based on the driving force of that
component, and the friction of this component with the membrane, M, and with the other
component, j in the system [Wesselingh and Krishna, 2000]:
∗ IUPAC-definition: dp<2 nm [1985]

20
( ) ( )MiiM
Mji
ij
ji uuÐx
uuÐx
dzd
RT−+−=−
µ1 (1)
in which:
R gas constant (J/(mol.K));
T temperature (K);
µi chemical potential of component i (J/mol);
z coordinate perpendicular to the membrane surface (m);
xi mol fraction of component i in the adsorbed phase (-);
Ðij Maxwell-Stefan micropore diffusivity between component i and j (m2/s);
ÐiM Maxwell-Stefan micropore diffusivity of component i in the membrane (m2/s);
ui diffusive velocity of component i (m/s).
Since the mol fraction of the membrane is not well defined, iM
MÐx is replaced by '
iMÐ1 ,
resulting in:
( ) ( )Mi'iM
jiij
ji uuÐ
uuÐx
dzd
RT−+−=− 11 µ
(2)
The molar flux of component i, Ni (mol/(m2.s)), can be written as:
iiitotii cuxcuN == (3)
with ci (mol/m3) the concentration of component i in the membrane.
The chemical potential for an ideal gas phase is given by:
+=
ref,i
iref,ii
p
plnRTµµ (4)
in which pi (Pa) is the partial pressure of component i in the gas phase. From this follows for
the left hand side of Eq. (2):

21
dzdp
pdz
p
plnRTd
RTdzd
RTi
i
ref,i
i
i 111 −=
−=−µ
(5)
Since we are interested in the fluxes with respect to the membrane, uM=0 [Wesselingh and
Krishna, 2000]. Combining Eq. (3) and Eq. (5) with Eq. (2) gives:
+
−=−
i
i'iMj
j
i
i
ij
ji
i cN
ÐcN
cN
Ðx
dzdp
p11 (6)
If a binary system is used in which the water (w) is selectively removed from the alcohol,
isopropanol (a), we found for this system that Nw >> Na [Verkerk et al., 2001; Chapter 1].
Therefore, we assume that Eq. (6) for the water flux can be reduced to:
dzdp
pc
ÐÐx
ÐÐN w
w
w
aw'wMa
'wMaw
w+
−= (7a)
Wolf and Schlünder [1999] have performed adsorption measurements of isopropanol/water
mixtures on silica gel and silica coated ceramics. They find linear adsorption of water on
silica coated ceramics. For the binary system, isopropanol and water are adsorbed in similar
amounts. From their work we can conclude that separation of isopropanol/water mixtures
with silica ceramic membranes is not caused by a difference in adsorption behavior.
Therefore, the separation has to be a diffusion-based process. If we assume xw/Ðaw << 1/
Ð’aM, the alcohol flux can be written as:
ww
a
aw
aMwa
a
aaMa N
cc
ÐÐx
dzdp
pcÐN
'' +−= (7b)
If the loading of component i is proportional with the partial vapor pressure of this component
in the membrane, i.e. linear adsorption, we can write:

22
i
ii p
cA = (8)
in which Ai (mol/(m3.Pa)) is the adsorption coefficient of component i. In literature the
Maxwell-Stefan diffusion is often considered a function of occupancy. We here consider the
most simple case of a constant diffusivity. If the diffusion coefficient, Ð’iM, does not depend
on the loading of the membrane and the partial pressure, pi, Eq. (7) yields after integration
over the thickness of the selective layer (L) for the flux equations (the terms for the pressure
gradient and Nw are taken constant):
( )pw
*w
w
aw'wMa
'wMaw
w ppL
A
)ÐÐx(
ÐÐN −
+−= (9a)
( ) waw
'aMap
a*a
a'aM
a NÐÐx
ppL
AÐN +−−= (9b)
in which pi* is the partial equilibrium vapor pressure of component i at the retentate side and
pip the partial pressure of component i at the permeate side.
The partial equilibrium vapor pressure of water in the retentate minus the partial vapor
pressure in the permeate, pw
*w pp − , is a measure for the driving force for the water transport.
The partial equilibrium vapor pressure of water can be calculated according to:
0w
rww
*w pxp ⋅⋅= γ (10)
in which γw is the activity coefficient of water in the liquid mixture (-), xrw is the mol fraction
of water in the mixture (mol/mol) and pw0 (Pa) is the vapor pressure of pure water. In this
paper, activity coefficients are calculated using the Wilson equation [Gmehling, 1981]. An
analogous relation applies for the partial equilibrium vapor pressure of the alcohol. From this
it follows, that the water flux will mainly be dependent on its own driving force (Eq. (9a)).
The alcohol flux, however, depends on its own driving force and an extra force, a drag force
by the water (Eq. (9b)).
23
The separation ability of a membrane can be expressed in terms of permeation and the
separation factor. The separation factor, α, is usually defined as follows:
raa
rww
x/y
x/y=α (11)
in which y and xr are the fractions of components in the permeate and retentate, respectively.
This separation factor, however, is the separation factor of the pervaporation process and is
not the separation factor of the membrane.
Usually, there is a trade-off between the permeation and the separation factor; i.e., when one
factor increases, the other decreases. As both of them are important factors in the separation
process, a Pervaporation Separation Index (PSI) [Huang and Feng, 1993] can be defined as a
measure of the separation ability of a membrane:
PSI=Jtot. α (12)
In this paper, both α and PSI are used to characterize the performance of the membrane
investigated.
Experimental
The membrane performance was measured with the set-up depicted in Figure 1. The tubular
ceramic pervaporation membrane (4) provided by ECN, The Netherlands, consisted of several
support layers of α- and γ-alumina. The permselective top layer, at the outer wall of the tube,
was made of amorphous silica [Van Veen et al., 1999] and had a thickness of 200 nm. The
tubular ceramic pervaporation membrane was placed in a glass vessel with heating jacket (1)
in a dead-end configuration. The vessel was filled with the alcohol/water mixture, which was
stirred with three pitched blade turbine stirrers (2) of 5 cm diameter mounted at the same shaft
at a stirring speed of 1400 rpm. From previous experiments, we know that at this stirring
speed no temperature and concentration polarization in the retentate occurs. The temperature
in the vessel was kept constant, measured with a Pt100 (3). A total reflux condenser on top of
the vessel (not depicted in Figure 1) was used to prevent vapor losses of the retentate. A

24
P
T
5 6 71
4
11
9
8
10
3
2
vacuum pump (Edwards RV5)(8) provided the vacuum. The permeate pressure was controlled
with a needle valve (10) and measured with an ATM 104 Pa absolute pressure transmitter (AE
Sensors) (9). Liquid nitrogen was used as a cooling agent for the cold traps (5,6 and 7). Cold
traps 5 and 6 were used alternately to collect the permeate. The connection from the
membrane to the cold traps 5 and 6 was thermostated to prevent condensation.
The compositions of the feed and permeate were analyzed using an automated Karl-Fischer
titration apparatus (Mitsubishi, model CA-100) and a refractive index measurement (Euromex
Refractometer RF 490) at 298 K, respectively.
Figure 1. Lab scale pervaporation set-up.
To establish the membrane performance, dehydration experiments were performed with
isopropanol/water mixtures. Isopropanol, analytical grade, was obtained from Merck
(Darmstadt, Germany). In order to obtain reproducible fluxes, the membrane was allowed to
stabilize once for 150 hours under pervaporation conditions prior to the measurements. With
this membrane, one of the three process conditions (temperature, wt% water in the retentate or
permeate pressure) was varied while keeping the other two constant. The applied temperature
range was between 303 K and 353 K, the water concentration was varied between 1 and 100
wt% and the permeate pressure was varied between 0 and 20·102 Pa.

25
Results and discussion
First the results will be discussed of the experiments in which permeate pressure, temperature
and water content of the feed are varied. Subsequently, fluxes will be described in relation
with the transport equations. Finally, the behavior of the separation factor and PSI will be
explained from the flux description.
Influence of process parameters
Figures 2a and 2b show the effect of the permeate pressure on the membrane performance.
The temperature of the mixture has been kept constant at 333K with a water content of 5 wt%.
Both the water and alcohol flux decrease linearly with increasing permeate pressure (Figure
2a). Within the experimental accuracy, the separation factor remains stable at a value of
around 2.4·103. As a consequence, the PSI decreases from 2800 to 2000 (kg/(m2.h)) with
increasing permeate pressure (Figure 2b). The decrease in water flux is in accordance with
Eq. (9a), which predicts that the water flux is proportional with the driving force, pw
*w pp − ,
which in turn decreases linearly with increasing permeate pressure.
Figure 2a. Alcohol and water flux for dehydration of isopropanol as a function of permeate
pressure (temperature 333 K, water content 5 wt%).
0.6
0.7
0.8
0.9
1
1.1
1.2
0 5 10 15 20 25permeate pressure (102 Pa)
wat
er fl
ux (k
g/(m
2 .h))
0.000
0.002
0.004
0.006
0.008
0.010
alco
hol f
lux
(kg/
(m2 .h
))
water fluxalcohol flux

26
Figure 2b. Separation factor and PSI for dehydration of isopropanol as a function of permeate
pressure (temperature 333 K, water content 5 wt%).
Figure 3a. Alcohol and water flux for dehydration of isopropanol at different temperatures
(303-353 K, 5 wt% water and permeate pressure of 102).
2000
2100
2200
2300
2400
2500
2600
0 5 10 15 20 25permeate pressure (102 Pa)
sepa
ratio
n fa
ctor
(-)
1000
1500
2000
2500
3000
3500
4000
PSI (
kg/(m
2 .h))
separation factor process
PSI
0
0.5
1
1.5
2
2.5
3
298 308 318 328 338 348 358
temperature (K)
wat
er fl
ux (k
g/(m
2 .h))
0.000
0.005
0.010
0.015
0.020
0.025
0.030al
coho
l flu
x (k
g/(m
2 .h))
water fluxalcohol flux

27
Figure 3b. Separation factor and PSI for dehydration of isopropanol at different temperatures
(process conditions as in Figure 3a).
Figures 3a and 3b show the influence of the temperature on the performance of the
membrane. The temperature has been varied from 303 to 353K. The water content and the
permeate pressure have been kept constant at 5 wt% and 102 Pa, respectively. Both the water
and alcohol flux increase with the temperature. As the alcohol flux does not increase to the
same extent as the water flux with increasing temperature, the separation factor and the PSI
do also increase.
Figures 4a and 4b show the membrane performance at different water contents in the feed.
The water flux increases with increasing water content. The alcohol flux versus water content
shows a maximum (see Figure 4a). As a consequence, the separation factor decreases and the
PSI shows a maximum (see Figure 4b).
0
500
1000
1500
2000
2500
3000
298 308 318 328 338 348 358temperature (K)
sepa
ratio
n fa
ctor
(-)
0
1000
2000
3000
4000
5000
6000
PSI (
kg/(m
2 .h))
separation factor process
PSI

28
0.00
0.50
1.00
1.50
2.00
2.50
3.00
3.50
4.00
0 20 40 60 80 100water content (wt%)
wat
er fl
ux (k
g/(m
2 .h))
0.000
0.002
0.004
0.006
0.008
0.010
0.012
0.014
0.016
0.018
0.020
alco
hol f
lux
(kg/
(m2 .h
))
water fluxalcohol flux
Figure 4a. Membrane performance for dehydration of isopropanol with different feed
compositions (wt% water:1-100%, temperature: 333 K and permeate pressure of 102 Pa).
Figure 4b. Membrane performance for dehydration of isopropanol with different feed
compositions (conditions as in Figure 4a).
0
500
1000
1500
2000
2500
3000
3500
4000
0 20 40 60 80 100water content (wt%)
sepa
ratio
n fa
ctor
(-)
0
500
1000
1500
2000
2500
3000
3500
4000
PSI (
kg/(m
2 .h))separation factor process
PSI (conc)

29
0
0.5
1
1.5
2
2.5
3
3.5
0 50 100 150 200driving force for water, pw
*-pwp (*102Pa)
wat
er fl
ux (k
g/(m
2 .h))
water flux (conc)
water flux (temperature)
water flux (permeate pressure)
Figure 5. Water flux for dehydration of isopropanol as a function of the driving force with
variations of water concentration, temperature and permeate pressure combined in one single
plot. Dashed line is to guide the eye.
Water flux
In Figure 5 the water flux is plotted as a function of the driving force for water for all the
experiments at which the water content, temperature and permeate pressure have been varied.
It appears that the water flux is only dependent on the driving force for water and is
independent of changes of experimental process conditions. The mass and molar fluxes are,
respectively:
( )pw
*ww pp*.J −= −41041 (13a)
( )pw
*ww pp*.N −= −61022 (13b)
To make a rough estimation for the diffusion coefficient, Ð’wM, the pure water flux (xa=0) Eq.
(6) can be reduced to:

30
( ) ( )pw
*w
pw
*w
w'wM
w pp*.ppL
AÐN −=−−= −61022 (from Figure 5) (14)
Wolf and Schlünder [1999] have performed adsorption measurements of water/isopropanol
mixtures on silica gel and silica coated ceramics. Although it had a different pore size
distribution and porosity than the membrane used in this study, their silica coated ceramics is,
in contrast to the silica gel, microporous. To make a rough estimation for the diffusivity of
water in the membrane, we use a value for the adsorption coefficient, Aw, from their work.
This adsorption coefficient, can be estimated to be in the order of 0.6 mol/(m3Pa) at 333 K.
The thickness of the membrane used in this study is 200 nm. With this, a diffusion coefficient,
Ð’wM can be calculated of 9·10-13 m2/s. This diffusion coefficient appears to be in the lower
regime of diffusion coefficients of water in inorganic substances found in literature, which are
an order higher [Hughes et al., 1995; Nomura et al., 1998].
In Eq. (13b) the constant 2.2·10-6 equals L)ÐÐx(
AÐÐ
aw'wMa
w'wMaw+
− (see Eq. (9a). Because the
thickness of the membrane is constant, and the water flux increases linearly with the driving
force, which includes variation of temperature between 303 and 353 K, the product
)ÐÐx(AÐÐ
aw'wMa
w'wMaw+
− shows to be temperature independent over this range. If xa lies,
approximately, between 0.2 and 0.5, Ðaw will be between 0.8·10-13 and 2·10-13 m2/s,
respectively.
Alcohol flux
At low alcohol content in the permeate, the analysis technique used is not very accurate.
Therefore, the alcohol flux is described only qualitatively. For all experiments, the alcohol
flux behaves different than the water flux. This is because the water flux is mainly dependent
on its own driving force (Eq. 9a). The alcohol flux, however, is dependent on both its own
driving force and the drag force from the water (Eq. 9b).
For dehydration of organic compounds we are only interested in the high alcohol content
regime. By taking the experimental data of the alcohol flux versus the water content and fit
them to Eq. 9b, see the parity plot in Figure 6, we obtain:
w*a
*aa N.p.cp.cN 21 += (15)

31
in which c1 is 0.016 mol/(Pa.m2.s) and c2 is 0.0083 Pa-1. At high retentate alcohol
concentrations, the influence of the dragging term is around 5%. This influence increases up
to 70% at low alcohol concentrations in the retentate.
Figure 4a shows a more or less constant behavior of the alcohol flux as a function of the water
content up to 50 wt% water content. However, it is difficult to draw solid conclusions from
this, as binary adsorption and diffusion data are required to describe this behavior. Future
work will deal with this.
Figure 6. The parity plot of the alcohol flux at different retentate compositions.
Selectivity and PSI
From the fluxes dependent on temperature and retentate mixture content, we can derive rules
for predicting the selectivity and PSI of the ceramic pervaporation membrane. From Figures
3a and 3b it follows, that with increasing temperature, the water flux increases more rapidly
than the alcohol flux. This means that with increasing temperature the selectivity slightly
increases. Secondly, because the equilibrium partial pressure of water strongly increases, the
PSI increases stronger than the exponentially increasing water flux.
If, at constant temperature, the water content increases in a water/alcohol mixture, the
equilibrium partial pressure of water increases. As a consequence, the water flux does also
0
0.002
0.004
0.006
0.008
0.01
0 0.002 0.004 0.006 0.008 0.01experimental alcohol flux (kg/(m2.h))
fitte
d al
coho
l flu
x (k
g/(m
2 .h))

32
increase with this increasing pressure. With exception of low alcohol contents in the mixture,
the alcohol flux remains almost constant at every feed mixture as can be seen from Figure 4a.
From the above, we are able to predict the dependence of the selectivity on the retentate
composition. If we assume the alcohol flux to be constant, and the permeate pressure to be
negligible, using Eq. 9a and Eq. 11 we obtain:
rawr
w
ra
a
w x..cx
xNN
γα 3== (16)
in which it should be noted that yw/ya=Nw/Na. For the high alcohol contents in the mixture, the
selectivity decrease can be mainly attributed to the decrease of the water activity coefficient;
for the regime with low alcohol contents in the mixture (which is, however, not used in
practical applications), the selectivity decrease is mainly caused by the decreasing alcohol
content. In Figure 7 the approximative relation of Eq. (16) is compared with the experimental
data.
Figure 7. The separation factor, measured and predicted at different water contents.
It is expected that these rules do not apply solely to isopropanol/water mixtures, but will also
count for other organic compounds as long as these compounds will not interact too much
with the silica surface.
0
500
1000
1500
2000
2500
3000
3500
4000
0 20 40 60 80 100water content (wt%)
sepa
ratio
n fa
ctor
(-) separation factor predicted
separation factor

33
We can conclude from the experimental results that the separation process is mainly caused
by a large difference in the diffusion coefficients of water and alcohol. It is not yet clear
whether the large difference can be fully attributed to the relative large size of the isopropanol
molecule compared to the water and the small pore size of the silica.
Concluding remarks
The amorphous silica pervaporation membranes used in this study for the separation of
isopropanol/water mixtures, combine high selectivities with high permeabilities, resulting in a
high PSI. Most polymeric pervaporation membranes, on the contrary, show either a high
selectivity or a high permeability, resulting in a lower PSI [Verkerk et al., 2001]. The water
transport through the membrane shows a remarkably linear relationship with the driving
force. The water transport is expected to increase further at elevated temperatures, still
providing a high selectivity. Measurements will be performed for this purpose in the near
future.
Notation
Ai adsorption coefficient of component i (mol/(m3.Pa))
ci molar density of component i (mol/m3)
c1 fit parameter (mol/(Pa.m2.s))
c2 fit parameter (1/Pa)
c3 constant (-)
ÐiM Maxwell-Stefan micropore diffusivity of component i in the membrane (m2/s)
Ðij Maxwell-Stefan micropore diffusivity between component i and component j (m2/s)
J mass flux of component i (kg/(m2.h))
L thickness of the selective layer (m)
Ni molar flux of component i (mol/(m2.s))
p pressure (Pa)
pi0 vapor pressure of the pure component i at the concerning temperature (Pa)
pi* the equilibrium vapor pressure of component i (Pa)
PSI pervaporation separation index (kg/(m2.h))
R gas constant (J/(mol.K))
T temperature (K)

34
ui diffusive velocity of component i (m/s)
xi mol fraction of component i in the adsorbed phase (-)
xri mol fraction of component i in the retentate (mol/mol)
yi mol fraction of component y in the permeate (mol/mol)
z coordinate perpendicular to the membrane surface (m)
Greek letters
α separation factor (-)
γi activity coefficient of component i in the mixture (-)
µi chemical potential of component i (J/mol)
Subscripts
a alcohol
i, j component i and j, respectively
M membrane
ref reference state
tot total
w water
Superscripts
p permeate side
r retentate side
* equilibrium
Acknowledgements
We thank P.P.A.C. Pex from ECN, Petten, The Netherlands for providing the ceramic
membranes. Furthermore, we thank the Dutch Polymer Institute for their financial support.
References
W.J.W. Bakker, F. Kapteijn, J. Poppe and J.A. Moulijn, Permeation characteristics of
a metal-supported silicalite-1 zeolite membrane, J. Membr. Sci., 117 (1996) 57.
M.-O. David, R. Gref, T.Q. Nguyen and J. Néel, Pervaporation-esterification
coupling: Part I. Basic kinetic model, Trans. Inst. Chem. Eng., 69A (1991) 335.

35
H.L. Fleming and C.S. Slater, Pervaporation, in W.S.W. Ho and K.K. Sirkar (Eds.),
Membrane Handbook, Chapman & Hall, New York, 1992, pp. 105-159.
R.W. van Gemert and F.P. Cuperus, Newly developed ceramic membranes for
dehydration and separation of organic mixtures by pervaporation, J. Membr. Sci., 105 (1995)
287.
J. Gmehling, U. Onken and W. Arlt, Vapor-liquid equilibrium data collection,
Dechema, Frankfurt/Main, 1981.
A. Heintz and W. Stephan, A generalized solution-diffusion model of the pervaporation
process through composite membranes Part I. Prediction of mixture solubilities in the dense
active layer using the UNIQUAC model, J. Membr. Sci., 89 (1994) 143.
A. Heintz and W. Stephan, A generalized solution-diffusion model of the pervaporation
process through composite membranes Part II. Concentration polarization, coupled diffusion
and the influence of the porous support layer, J. Membr. Sci., 89 (1994) 153.
H.P. Hsieh, R.R. Bhave and H.L. Fleming, Microporous alumina membranes, J.
Membr. Sci., 39 (1988) 221.
R.Y.M. Huang and X. Feng, Dehydration of isopropanol by pervaporation using
aromatic polyetherimide membranes, Sep. Sci. Technol., 28 (1993) 2035.
P.D.M. Hughes, P.J. McDonald, M.R. Halse, B. Leone and E.G. Smith, Water
diffusion in zeolite 4A beds measured by broad-line magnetic resonance imaging, Phys. Rev.,
51 (1995) 11332.
H.O.E. Karlsson and G. Trägårdh, Pervaporation of dilute organic-water mixtures. A
literature review on modelling studies and applications to aroma compound recovery, J.
Membr. Sci., 79 (1993) 121.
J.T.F. Keurentjes, G.H.R. Jansen and J.J. Gorissen, The esterification of tartaric acid
with ethanol: Kinetics and shifting the equilibrium by means of pervaporation, Chem. Eng.
Sci., 49 (1994) 4681.
B. N. Nair, K. Keizer, H. Suematsu, Y. Suma, N. Kaneko, S. Ono, T. Okubo and S.-I.
Nakao, Synthesis of gas and vapor molecular sieving silica membranes and analysis of pore
size connectivity, Langmuir, 16 (2000) 4558.
M. Nomura, T. Yamaguchi and S-I. Nakao, Ethanol/water transport through silicalite
membranes, J. Membr. Sci., 144 (1998) 161.
S.K. Ray, S.B. Sawant, J.B. Joshi and V.G. Pangarkar, Development of new synthetic
membranes for separation of benze-cyclohexane mixtures by pervaporation: a solubility
parameter approach, Ind. Eng. Chem. Res., 36 (1997) 5265.

36
K.S.W. Sing, Reporting physisorption data for gas/solid systems. With special
reference to the determination of surface area and porosity, Pure Appl. Chem., 57 (1985)
603.
L.J.P. van den Broeke, W.J.W. Bakker, F. Kapteijn and J.A. Moulijn, Transport and
separation properties of a silicalite-1 membrane-I. Operating conditions, Chem. Eng. Sci., 54
(1999) 245.
L.J.P. van den Broeke, F. Kapteijn and J.A. Moulijn, Transport and separation
properties of a silicalite-1 membrane-II. Variable separation factor, Chem. Eng. Sci., 54
(1999) 259.
H.M. van Veen, Y.C. van Delft, C.W.R. Engelen and P.P.A.C. Pex, Dewatering of
organics by pervaporation with silica membranes, Book of Abstracts, Volume 2,
Euromembrane 99, Leuven, 20-23 September 1999, Belgium, p. 209.
F.M. Velterop, Pervatech bv selective ceramic membrane technology, Book of
Abstracts, Volume 2, Euromembrane 99, Leuven, 20-23 September 1999, Belgium, p. 118.
A.W. Verkerk, P. van Male, M.A.G. Vorstman and J.T.F. Keurentjes, Properties of
high flux ceramic pervaporation membranes for dehydration of alcohol/water mixtures, Sep.
Purif. Technol., 22-23 (2001) 689.
R.M. Waldburger and F. Widmer, Membrane reactors in chemical production
processes and the application to the pervaporation-assisted esterification, Chem. Eng.
Technol., 19 (1996) 117.
J.A. Wesselingh and R. Krishna, Mass transfer in multicomponent mixtures, Delft
University Press, Delft, 2000.
H.E. Wolf and E.-U. Schlünder, Adsorption equilibrium of solvent mixtures on silica
gel and silica gel coated ceramics, Chem. Eng. Process., 38 (1999) 211.

37
Chapter 3
Characteristics of gas permeation through a
supported microporous silica membrane*
Abstract
Equilibrium adsorption and mass transport of gaseous species have been used to characterize
microporous silica membranes. Results are reported for the equilibrium adsorption of carbon
dioxide and n-butane on silica particles. The adsorption isotherms can be described with a
dual-site Langmuir model. The mass transport through tubular membranes is obtained with
and without the microporous silica top layer present. Steady-state and transient experiments
have been performed over the temperature range of 295 to 423 K and for a feed pressure up to
1 MPa. The mass transport through the support, without the silica layer, is predominantly
determined by Knudsen diffusion. For the transport through the supported membrane with the
silica top layer three different behaviors are observed. The permeance of helium increases
over the whole temperature range. For weakly adsorbing gases, like neon, argon, nitrogen,
and carbon dioxide, a minimum is observed in the permeance as a function of the
temperature. For hydrocarbons, like methane, i-butane and n-butane, which adsorb
considerably, the permeance decreases over the whole temperature range. From the
permeation behavior of the adsorbing gases and the non-adsorbing helium it can be concluded
that the mass transport through the microporous silica top layer takes place by two different
activated mechanisms.
* This chapter has been submitted to Journal of Membrane Science, “Characteristics of gas permeation through a supported microporous silica membrane” by A.W. Verkerk, E.L.V. Goetheer, L.J.P. van den Broeke and J.T.F. Keurentjes

38
Introduction
Due to their thermal and chemical stability inorganic microporous membranes are suited for
high temperature and high pressure applications, including gas separation, separation by
pervaporation and membrane reactors. At the moment a number of different inorganic
microporous membranes are available, including zeolite membranes, carbon molecular sieve
membranes and silica membranes [Bein, 1996; Drioli and Romano, 2001]. Inorganic
microporous membranes have a narrow pore size distribution, and the pore diameter is
typically smaller than 1 nm. Most of the membranes are asymmetrical, i.e. they consist of
several macroporous support layers providing the mechanical strength with a microporous
selective top layer providing the selectivity. In general, the main transport resistance is in the
top layer and, therefore, this layer should be very thin to have high fluxes. A disadvantage of
using a thin selective layer is that the resistance of the support can play a role, especially
when the support layer is at the permeate side. Furthermore, as a result of the synthesis
procedure ceramic and zeolite membranes can have defects in the top layer [Nomura et al.,
2001].
With respect to the mass transport and separation characteristics of microporous inorganic
membranes, only a limited description is available [Yoshioka et al., 2001]. This is one of the
reasons why, despite numerous successful demonstrations of inorganic membrane reactors at
the laboratory scale [Yoshioka et al., 2001; Thomas et al., 2001], up to now only a limited
number of large-scale applications have been realized [Morigani et al., 2001].
In this paper, the mass transport of pure gases through a microporous supported silica
membrane is investigated. Steady-state and transient permeation experiments have been
performed using tubular membranes with and without the microporous silica top layer
present. Furthermore, equilibrium adsorption measurements have been carried out to
characterize the silica used for the top layer.
Mass transport in microporous membranes
The permeation mechanism for diffusion in microporous membranes is mainly determined by
the ratio of the size of the permeating molecule to the pore diameter [Xiao and Wei, 1992].
For microporous membranes, i.e. membranes with a pore diameter smaller than 2 nm, two
diffusion mechanisms can be observed. The first mechanism occurs when there are pores
larger than about 1 nm. In this case the pore diameter is of the same order of the mean free
path of the molecules. During the transport through the pores the molecules still have to

39
overcome an energy barrier. This type of mass transport is referred to as activated gaseous
(AG) diffusion [Xiao and Wei, 1992]. For pores smaller than about 1 nm the mass transport
takes place by diffusion in an adsorbed layer. This mechanism is referred to as micropore
(MP) diffusion [Xiao and Wei, 1992; van den Broeke, 1995]. The existence of the two
different diffusion mechanisms has been demonstrated experimentally for silicalite-1 zeolite
membranes [Bakker et al., 1997].
According to Fick’s first law the diffusive flux is related to the gradient in the concentration
or pressure, given by:
dxdp
RTDJ −= (1)
in which:
J flux (mol/m2.s);
D diffusion coefficient (m2/s);
R gas constant (J/(mol.K));
T temperature (K);
p pressure (Pa);
x space coordinate.
For micropore diffusion the transport takes place in an adsorbed layer, and the diffusion
coefficient, DMP, can be described using a jump model:
−=
RTEexp
zD MP
MP21νλ (2)
in which:
z probability factor (-);
ν jump frequency (1/s);
λ distance between adjacent adsorption sites (m);
E activation energy (J/(mol));

40
The diffusion coefficient for activated gaseous transport, DAG, is given by:
−=
RTEexp
MwRTrD AG
AG π8
34
0 (3)
where r0 is the pore radius (m) and Mw is the molar mass (kg/mol).
In the following the results are presented in terms of the permeance, this quantity is defined as
the flux divided by the pressure difference across the membrane.
Isotherm models One of the characteristics of transport in microporous materials is the fact that mass transport
takes place in an adsorbed layer. The driving force, the gradient in the concentration or
pressure, can be related to the adsorption isotherm using the Maxwell-Stefan description of
diffusion [van den Broeke, 1995; Bakker et al., 1997]. Adsorption in microporous materials is
generally described with a Langmuir type of isotherm [Langmuir, 1918]. Due to the fact that
silica can have two distinct adsorption sites [Font et al., 1996; Natal-Santiago and Dumesic,
1998], two isotherm models have been compared. The first one is the Langmuir isotherm:
pbpbqq sat +
=1
(4)
in which q is the amount adsorbed (mol/kg), b the Langmuir parameter (Pa-1) and p the
pressure (Pa).
From the temperature dependence of the b parameter the heat of adsorption, ∆H (kJ/mol), can
be calculated from:
∆−=
RTHbb exp0 (5)

41
The second adsorption model takes into account the possibility of having two different types
of adsorption sites. This is known as the dual-site Langmuir adsorption isotherm, and reads:
pbpbq
pbpbqq
B
BB,sat
A
AA,sat +
++
=11
(6)
with the subscripts A and B indicating the two adsorption sites.
Experimental
Materials
Helium, neon, argon, nitrogen, carbon dioxide (all grade 5.0), krypton (grade 4.6), sulfur
hexafluoride (grade 2.8), tetrafluoro methane (grade 3.5), methane (grade 5.5), n-butane and i-
butane (both grade 2.5) were obtained from HoekLoos (Amsterdam, The Netherlands).
Pore size distribution
Silica particles, provided by ECN (Petten, The Netherlands), have been used for equilibrium
adsorption measurements. The silica particles were prepared in the same manner as the silica
top layer of the supported membranes. The pore size distribution of the silica particles was
obtained from the isotherm for nitrogen at 77 K. The isotherm was measured volumetrically
with an ASAP 2000 apparatus (Micromeritics).
Adsorption isotherms
Equilibrium adsorption measurements of carbon dioxide and n-butane on the silica particles at
temperatures between 293 and 353 K were performed on an IGAsorp system (Hiden
Analytical). The isotherms were obtained gravimetrically.
Alumina support and supported silica membrane
The alumina supports and the microporous alumina supported silica membranes were
obtained from ECN (Petten, The Netherlands). The supported silica membranes consist of the
alumina support plus the selective top layer, at the outer wall of the tube, which is made of
amorphous silica. The alumina support consists of four layers, three layers of α-alumina and

42
one of γ-alumina. In Table 1 an overview is given of the dimensions of the supports and the
silica membranes [Koukou et al., 1999].
Table 1a. Dimensions of the alumina support.
Layer Thickness Pore diameter
γ−alumina 1.6 µm 4 nm
α−alumina 50 µm 0.18 µm
α−alumina 50 µm 0.28 µm
α−alumina 2.9 mm 5.0 µm
Table 1b. Dimensions of the supported silica membrane.
Property
Average pore diameter silica layer 0.6 nm
Thickness silica layer 200 nm
Length membrane 0.30 m
Outer diameter membrane 0.014 m
Single component permeation
For the permeation experiments with gaseous species through both the alumina support and
the supported silica membrane, the set-up depicted in Figure 1 was used. The support or the
silica membrane was placed in an oven (Heraeus), and the temperature was measured with a
Pt100 thermometer. A dead-end configuration was used, and the temperature was varied
between 295 and 423 K. The volume, at the permeate side, of the membrane module was
equal to 45 mL. Before the start of a permeation experiment the feed and permeate side of the
(membrane) module were pressurized.
To start a permeation measurement the needle valve at the permeate side of the membrane
was opened to create a pressure difference across the membrane. To obtain the mass transport
through the membrane, the flux at the permeate side was measured with mass flow controllers
(Bronckhorst). For all the steady-state permeation experiments, with both the alumina support
and the supported silica membrane, the feed pressure was equal to 2.0⋅105 Pa and a pressure

43
difference of 1.0⋅105 Pa was used. For the transient permeation experiments with the
supported silica membrane, different feed pressures and pressure differences were applied. To
start a transient permeation measurement, the same procedure was followed as for the
permeation experiment. The only difference was, that after a pressure difference was applied,
the needle valve at the permeate side was closed. The pressure at the permeate side increases
up to the pressure at the feed side, which was held constant.
Figure 1. Experimental set-up used for the permeation experiments.
Results and discussion
Pore size distribution
In Figure 2a the adsorption isotherm of nitrogen on the silica particles at 77 K is given. The
pore size distribution has been obtained from the initial part of the liquid nitrogen isotherm,
up to p/p0 = 0.004, using a standard Horwath-Kawazoe routine. The pore size distribution of
the silica particles is shown in Figure 2b, from which follows that the pore size of the silica
particles is between 0.5 and 0.8 nm.
Adsorption isotherms
In Figure 3 adsorption isotherms of carbon dioxide and n-butane on the silica particles are
given. In Figure 3a a comparison is made between the adsorption isotherms of carbon dioxide
and n-butane on the silica particles at 293 K. The equilibrium isotherms of carbon dioxide on
silica at 293, 313, 333 and 353 K are plotted in Figure 3b. The experimentally obtained
isotherms have been fitted with both the Langmuir and the dual-site Langmuir isotherm
Gas supply
P P
P
Oven
Membrane module
∆

44
models. A Levenberg-Marquardt routine from Matlab [1999] has been used for the
minimization. The results for the Langmuir parameters obtained with the two isotherm
models are given in Tables 2 and 3, respectively.
Figure 2a. Nitrogen isotherm at a temperature of 77 K.
Figure 2b. Pore size distribution obtained from nitrogen isotherm at 77 K.
0.0
25.0
50.0
75.0
100.0
125.0
150.0
175.0
0.00 0.20 0.40 0.60 0.80 1.00relative vapor pressure (-)
volu
me
adso
rbed
(cm
3 /g)
0
0.2
0.4
0.6
0.8
1
1.2
0.4 0.45 0.5 0.55 0.6 0.65 0.7 0.75 0.8pore size (nm)
diffe
rent
ial p
ore
volu
me
(cm
3 /g n
m)
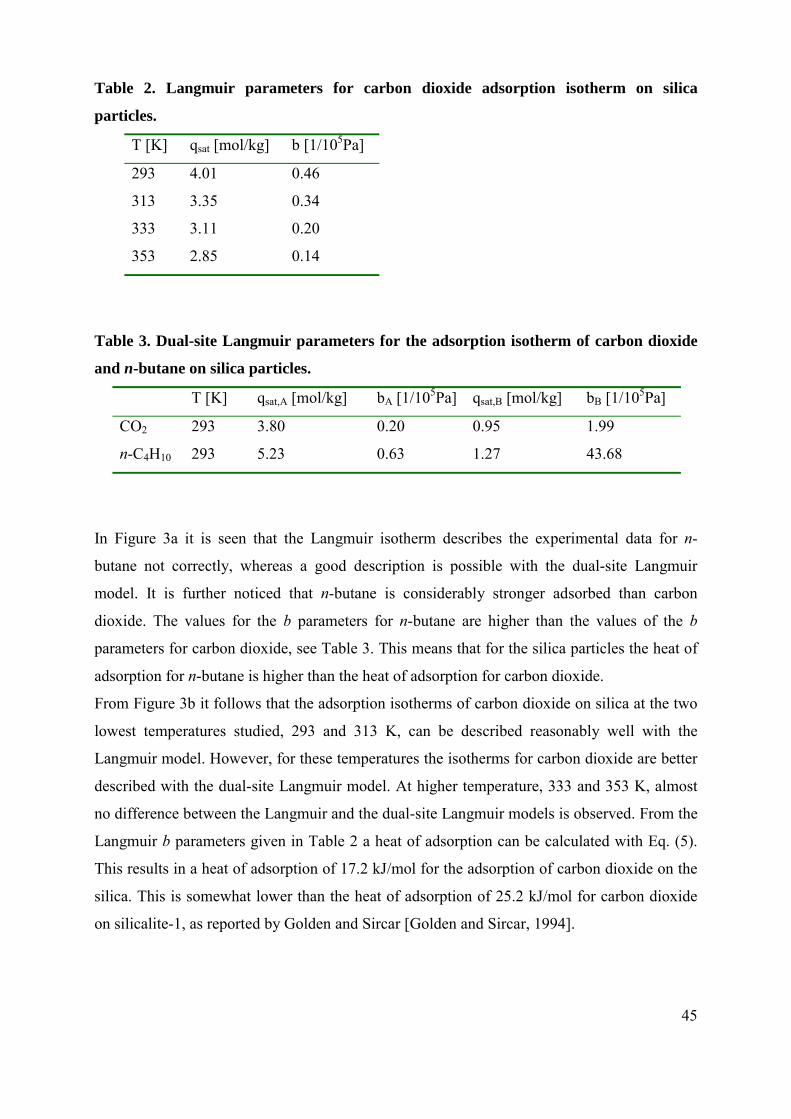
45
Table 2. Langmuir parameters for carbon dioxide adsorption isotherm on silica
particles.
T [K] qsat [mol/kg] b [1/105Pa]
293 4.01 0.46
313 3.35 0.34
333 3.11 0.20
353 2.85 0.14
Table 3. Dual-site Langmuir parameters for the adsorption isotherm of carbon dioxide
and n-butane on silica particles.
T [K] qsat,A [mol/kg] bA [1/105Pa] qsat,B [mol/kg] bB [1/105Pa]
CO2 293 3.80 0.20 0.95 1.99
n-C4H10 293 5.23 0.63 1.27 43.68
In Figure 3a it is seen that the Langmuir isotherm describes the experimental data for n-
butane not correctly, whereas a good description is possible with the dual-site Langmuir
model. It is further noticed that n-butane is considerably stronger adsorbed than carbon
dioxide. The values for the b parameters for n-butane are higher than the values of the b
parameters for carbon dioxide, see Table 3. This means that for the silica particles the heat of
adsorption for n-butane is higher than the heat of adsorption for carbon dioxide.
From Figure 3b it follows that the adsorption isotherms of carbon dioxide on silica at the two
lowest temperatures studied, 293 and 313 K, can be described reasonably well with the
Langmuir model. However, for these temperatures the isotherms for carbon dioxide are better
described with the dual-site Langmuir model. At higher temperature, 333 and 353 K, almost
no difference between the Langmuir and the dual-site Langmuir models is observed. From the
Langmuir b parameters given in Table 2 a heat of adsorption can be calculated with Eq. (5).
This results in a heat of adsorption of 17.2 kJ/mol for the adsorption of carbon dioxide on the
silica. This is somewhat lower than the heat of adsorption of 25.2 kJ/mol for carbon dioxide
on silicalite-1, as reported by Golden and Sircar [Golden and Sircar, 1994].
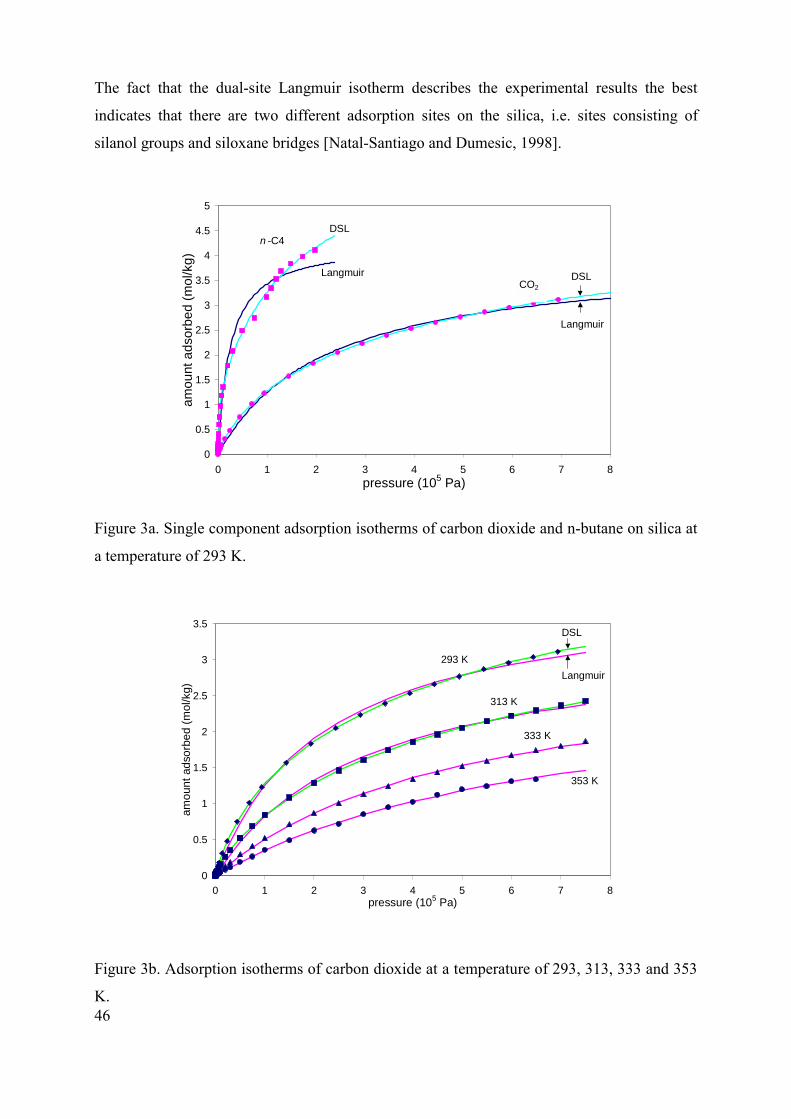
46
The fact that the dual-site Langmuir isotherm describes the experimental results the best
indicates that there are two different adsorption sites on the silica, i.e. sites consisting of
silanol groups and siloxane bridges [Natal-Santiago and Dumesic, 1998].
Figure 3a. Single component adsorption isotherms of carbon dioxide and n-butane on silica at
a temperature of 293 K.
Figure 3b. Adsorption isotherms of carbon dioxide at a temperature of 293, 313, 333 and 353
K.
0
0.5
1
1.5
2
2.5
3
3.5
4
4.5
5
0 1 2 3 4 5 6 7 8pressure (105 Pa)
amou
nt a
dsor
bed
(mol
/kg)
CO2
n -C4
Langmuir
Langmuir
DSL
DSL
0
0.5
1
1.5
2
2.5
3
3.5
0 1 2 3 4 5 6 7 8pressure (105 Pa)
amou
nt a
dsor
bed
(mol
/kg)
293 K
353 K
333 K
313 K
DSL
Langmuir

47
Figure 4a. Permeance of gaseous species through the alumina support as a function of the
inverse square root of the molecular mass, Mw-1/2, at a temperature of 295 K.
Figure 4b. Permeance of gaseous species through the alumina support as a function of the
inverse square root of the molecular mass, Mw-1/2, at a temperature of 423 K.
0
100
200
300
400
500
600
700
800
900
0 0.1 0.2 0.3 0.4 0.5 0.6molar mass-0.5(kg/mol)-0.5
perm
eanc
e 10
-8 (m
ol/(m
2 sPa)
)
InorganicNobleHydrocarbon(s)
Kr
Ne
Ar
CH4
CF4
N2CO2
He
295 K / support
0
100
200
300
400
500
600
700
0 0.1 0.2 0.3 0.4 0.5 0.6molar mass-0.5(kg/mol)-0.5
perm
eanc
e 10
-8 (m
ol/(m
2 sPa)
)
InorganicNobleHydrocarbon(s)
N2
CO2
Kr
NeAr
CH4
CF4
He
423 K / support

48
Steady-state permeation through the alumina support
The steady-state flux of the various gases through the alumina support have been measured
for two temperatures. In Figure 4a the fluxes obtained at 295 K are depicted as a function of
the inverse square root of the molar mass, Mw-1/2. Two linear dependencies can be
distinguished, one for the noble gases and one for the inorganic gases and methane. The
fluxes through the alumina support obtained at 423 K are depicted in Figure 4b. Now all the
fluxes lie on a single line as a function of Mw-1/2. The fluxes at 423 K are lower than the
fluxes at 295 K. From these results it follows that the transport through the alumina support is
predominantly determined by Knudsen diffusion. From the fact that in Figure 4a two regions
are observed, it is concluded that at a temperature of 295 K also viscous flow seems to
contribute to the mass transport.
Steady-state permeation through the supported silica membrane
The steady-state permeance of the various gases through the supported silica membrane have
also been obtained at two temperatures. The permeances at 295 K are given in Figure 5a as a
function of the kinetic diameter. For the inorganic and noble gases a decreasing permeance is
observed with an increase in molecular diameter. If the permeance is plotted as a function of
Mw-1/2, Figure 5b, two regimes can be observed; one regime for the inorganic and noble gases
and a regime for the hydrocarbons. The permeance of the noble and inorganic gases as a
function of the Mw-1/2 are more or less on a straight line.
The results for the steady-state permeances obtained at 423 K as a function of the kinetic
diameter are given in Figure 6a. By increasing the temperature up to 423 K the permeance of
the hydrocarbons and the inorganic gases become of the same order, while the permeance of
helium has increased considerably.
By plotting the permeances as a function of Mw-1/2, Figure 6b, again two regimes can be
distinguished. However, there is now a regime for the noble gases, which do not adsorb or
adsorb only weakly, and the second regime consists of the inorganic gases and the
hydrocarbons. From the results for the equilibrium isotherms of carbon dioxide and n-butane
it follows that at a temperature of 423 K still some adsorption takes place. Compared with the
results given in Figure 6a, the values of the permeances of carbon dioxide and nitrogen at 423
K are comparable with the values for the permeances of the hydrocarbons. The values for the
fluxes at 423 K are lower than the fluxes obtained at 295 K, indicating that micropore
diffusion is the dominant mechanism for mass transport.

49
Figure 5a. Permeance of gaseous species through the supported silica membrane as a function
of the kinetic diameter at a temperature of 295 K.
Figure 5b. Permeance of gaseous species through the supported silica membrane as a function
of the inverse square root of the molecular mass, Mw-1/2, at a temperature of 295 K.
0
0.2
0.4
0.6
0.8
1
1.2
1.4
1.6
1.8
2
0.2 0.25 0.3 0.35 0.4 0.45 0.5 0.55kinetic diameter (nm)
perm
eanc
e 10
-8 (m
ol/(m
2 sPa)
)
InorganicNobleHydrocarbons
He
Ne
Ar
CH4 nC4H10
iC4H10
N2
CO2
SF6295 K / silica
0
0.2
0.4
0.6
0.8
1
1.2
1.4
1.6
1.8
2
0 0.1 0.2 0.3 0.4 0.5 0.6molar mass-0.5(kg/mol)-0.5
perm
eanc
e 10
-8 (m
ol/(m
2 sPa)
)
InorganicNobleHydrocarbons
He
Ne
Ar
CH4nC4H10
iC4H10
N2
CO2
SF6
295 K / silica

50
Figure 6a. Permeance of gaseous species through the supported silica membrane as a function
of the kinetic diameter at a temperature of 423 K.
Figure 6b. Permeance of gaseous species through the supported silica membrane as a function
of the inverse square root of the molecular mass, Mw-1/2, at a temperature of 423 K.
0.1
1
10
0.2 0.25 0.3 0.35 0.4 0.45 0.5 0.55kinetic diameter (nm)
perm
eanc
e 10
-8 (m
ol/(m
2 sPa)
) InorganicNobleHydrocarbons
He
Ne
Ar
CH4
nC4H10 iC4H10N2 CO2
423 K / silica
0
0.1
0.2
0.3
0.4
0.5
0.6
0.7
0.8
0.9
0 0.1 0.2 0.3 0.4 0.5 0.6molar mass-0.5(kg/mol)-0.5
perm
eanc
e 10
-8 (m
ol/(m
2 sPa)
)
0
1
2
3
4
5
6
7
8
9
permeance 10
-8 (mol/(m
2sPa))
InorganicHydrocarbonsNoble
He
NeAr
CH4
nC4H10
iC4H10
N2CO2
423 K / silica
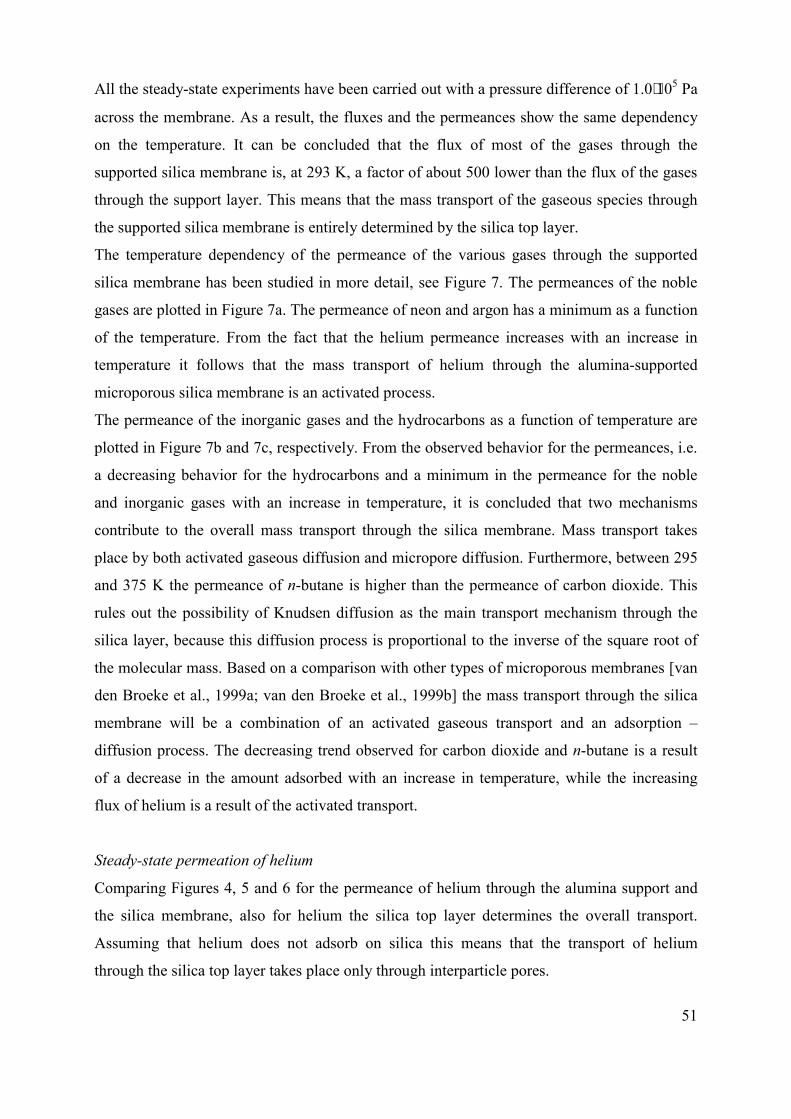
51
All the steady-state experiments have been carried out with a pressure difference of 1.0⋅105 Pa
across the membrane. As a result, the fluxes and the permeances show the same dependency
on the temperature. It can be concluded that the flux of most of the gases through the
supported silica membrane is, at 293 K, a factor of about 500 lower than the flux of the gases
through the support layer. This means that the mass transport of the gaseous species through
the supported silica membrane is entirely determined by the silica top layer.
The temperature dependency of the permeance of the various gases through the supported
silica membrane has been studied in more detail, see Figure 7. The permeances of the noble
gases are plotted in Figure 7a. The permeance of neon and argon has a minimum as a function
of the temperature. From the fact that the helium permeance increases with an increase in
temperature it follows that the mass transport of helium through the alumina-supported
microporous silica membrane is an activated process.
The permeance of the inorganic gases and the hydrocarbons as a function of temperature are
plotted in Figure 7b and 7c, respectively. From the observed behavior for the permeances, i.e.
a decreasing behavior for the hydrocarbons and a minimum in the permeance for the noble
and inorganic gases with an increase in temperature, it is concluded that two mechanisms
contribute to the overall mass transport through the silica membrane. Mass transport takes
place by both activated gaseous diffusion and micropore diffusion. Furthermore, between 295
and 375 K the permeance of n-butane is higher than the permeance of carbon dioxide. This
rules out the possibility of Knudsen diffusion as the main transport mechanism through the
silica layer, because this diffusion process is proportional to the inverse of the square root of
the molecular mass. Based on a comparison with other types of microporous membranes [van
den Broeke et al., 1999a; van den Broeke et al., 1999b] the mass transport through the silica
membrane will be a combination of an activated gaseous transport and an adsorption –
diffusion process. The decreasing trend observed for carbon dioxide and n-butane is a result
of a decrease in the amount adsorbed with an increase in temperature, while the increasing
flux of helium is a result of the activated transport.
Steady-state permeation of helium
Comparing Figures 4, 5 and 6 for the permeance of helium through the alumina support and
the silica membrane, also for helium the silica top layer determines the overall transport.
Assuming that helium does not adsorb on silica this means that the transport of helium
through the silica top layer takes place only through interparticle pores.
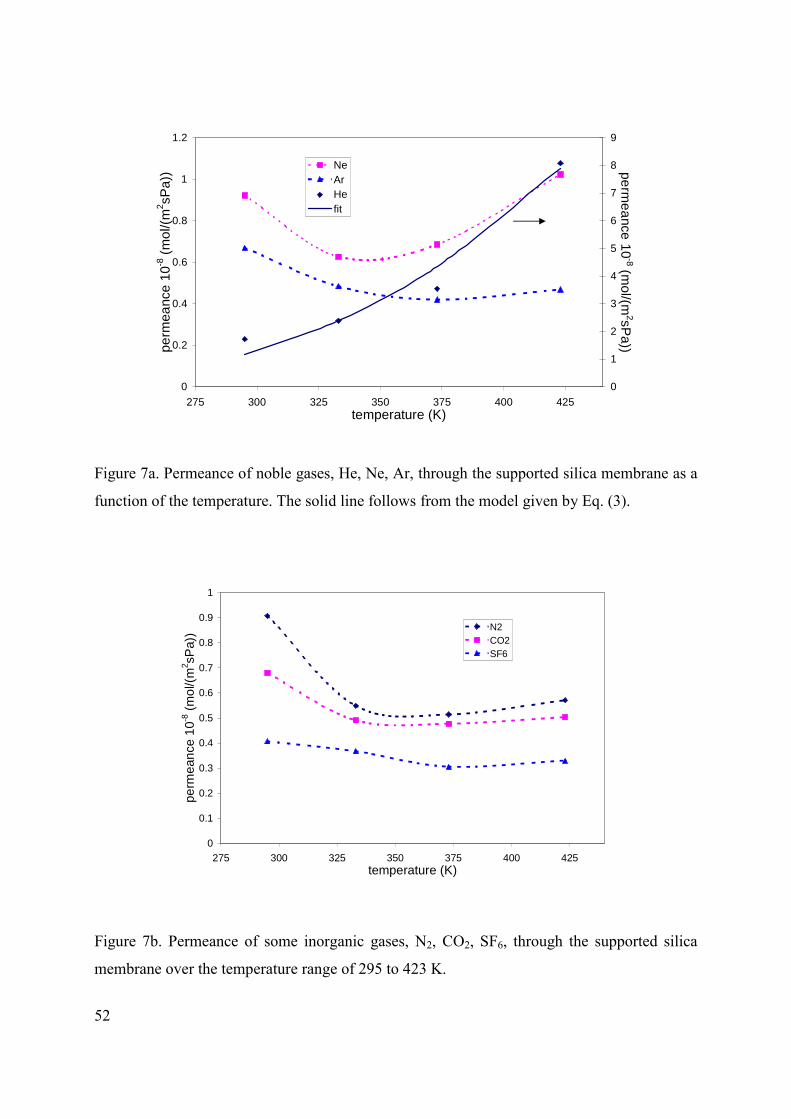
52
Figure 7a. Permeance of noble gases, He, Ne, Ar, through the supported silica membrane as a
function of the temperature. The solid line follows from the model given by Eq. (3).
Figure 7b. Permeance of some inorganic gases, N2, CO2, SF6, through the supported silica
membrane over the temperature range of 295 to 423 K.
0
0.2
0.4
0.6
0.8
1
1.2
275 300 325 350 375 400 425temperature (K)
perm
eanc
e 10
-8 (m
ol/(m
2 sPa)
)
0
1
2
3
4
5
6
7
8
9
permeance 10
-8 (mol/(m
2sPa))NeArHefit
0
0.1
0.2
0.3
0.4
0.5
0.6
0.7
0.8
0.9
1
275 300 325 350 375 400 425temperature (K)
perm
eanc
e 10
-8 (m
ol/(m
2 sPa)
) N2CO2SF6

53
Figure 7c. Permeance of some hydrocarbons, CH4, n-C4H10, i-C4H10, through the supported
silica membrane over the temperature range of 295 to 423 K.
Figure 8. Transient permeation profiles of pure gaseous helium, carbon dioxide and n-butane
at 293 K. Profiles are normalized on the pressure difference across the membrane. p is the
permeate pressure in 105 Pa.
0
0.2
0.4
0.6
0.8
1
1.2
1.4
1.6
1.8
275 300 325 350 375 400 425temperature (K)
perm
eanc
e 10
-8 (m
ol/(m
2 sPa)
)
CH4n-C4H10i-C4H10
0
0.2
0.4
0.6
0.8
1
0 200 400 600 800 1000time (s)
norm
aliz
ed p
ress
ure
(-)
He p: 1.0 -> 3.2nC4 p: 1.1 -> 2.0CO2 p: 1.1 -> 3.1CO2 p: 6.1 -> 8.0
T = 293 K; p (105Pa)

54
For helium the flux through the alumina support is given by Knudsen diffusion and is, at 295
K, about 500 times larger than the flux through the silica membrane. The γ-alumina layer of
the support has an average pore size of 4.0 nm [Koukou et al., 1999]. This means that the
interparticle pores of the silica layer are smaller than the pore diameter of the γ-alumina layer,
otherwise a similar behavior would be expected for the permeance of helium through the
silica top layer and the alumina support.
By fitting the permeance of helium through the silica membrane as a function of the
temperature using Eq. (1) and (3) the diameter of the interparticle pores, the surface area of
the defects and the activation energy for diffusion can be estimated. From this it follows that
with a diameter of the interparticle pores of about 2 nm the activation energy for diffusion is
15.9 kJ/mol. The surface area of interparticle pores is then about 0.6 % of the total silica
surface. The fact that there are two type of pores in the silica layer may be a result of the sol-
gel preparation technique. This is supported by the proposal of Yashioka et al. [2001] that
silica layers might consist of colloidal sol particles with intraparticle pores and somewhat
larger interparticle pores between the sol particles.
Transient profiles
Transient profiles of pure helium, carbon dioxide and n-butane at 293 K are compared in
Figure 8. The transient results are given in terms of a normalized pressure:
( )( )pf
pN pp
ppp
−−
= (7)
with pp the initial pressure at the permeate side. For carbon dioxide two profiles are given
with a different feed and permeate pressure but with almost the same pressure difference
across the membrane. The approach to equilibrium for the three gases, for comparable
pressure differences, increases in the order: carbon dioxide < n-butane < helium.
Despite the lower pressure difference applied for n-butane, the transient profiles for carbon
dioxide and n-butane follow the results for the equilibrium adsorption, i.e. the strongest
adsorbed species has the highest flux. For carbon dioxide the approach to equilibrium is faster
for a higher feed side pressure. These results indicate that the mass transport is a function of
the amount adsorbed.

55
Comparison with literature results
Mass transport through inorganic membranes has attracted considerable attention. However,
for different silica membranes different behaviors for the fluxes of light gases have been
observed. There are roughly speaking two different behaviors observed.
For the first type of silica membranes the permeance decreases significantly with an increase
in the size, i.e. the kinetic diameter, of the permeating molecules [Hassan et al., 1995; de Vos
and Verweij, 1998; Lu et al., 1999; Tsai et al., 2000]. Hassan et al. [1995] studied the
permeation of a number of pure gases through a hollow fiber silica membrane between 600
and 1000 K. For all gases an activated transport was observed. The permeance of methane is
more than four decades lower than the permeance of helium at 600 K. The mean pore size of
the silica hollow fibers were estimated to be between 0.59 and 0.85 nm. For helium the
activation energy for diffusion is found to be 19.2 kJ/mol.
For the Si(400) membranes used by de Vos and Verweij [1998] at 473 K the permeance
dropped from about 2·10-6 mol m-2 s-1 Pa-1 for hydrogen to about 5·10-9 mol m-2 s-1 Pa-1 for
methane. Furthermore, only a weak dependence on the temperature was observed. Between
300 and 473 K a slight increase in the permeance of hydrogen was observed, while for the
permeance of carbon dioxide a small decreasing behavior was obtained. The pore size of the
silica top layer is smaller than 0.5 nm. The heat of adsorption of carbon dioxide is equal to 24
kJ/mol, and for hydrogen the activation energy for diffusion was found to be equal to 14
kJ/mol.
Lu et al. [1999] reported results for the permeance of helium, nitrogen and sulfur
hexafluoride. Between 323 and 473 K the permeance of helium was about 5 times higher than
the permeance of nitrogen and about 2000 times higher than the permeance of sulfur
hexafluoride. For the three gases the permeance was more or less independent of the
temperature.
These studies [de Vos and Verweij, 1998; Lu et al., 1999; Tsai et al., 2000] included
permeation behavior through silica membranes obtained by different synthesis and calcination
procedures. By increasing the calcination temperature from 673 to 873 K the permeance
through the membranes of de Vos and Verweij [1998] drops by one order of magnitude.
Brinker and coworkers [1999; 2000] prepared two different membranes, one with pore sizes
of about 0.3 to 0.4 nm [Tsai et al., 2000] and one with pores clearly larger than 0.5 nm [Lu et
al., 1999]. The smaller pore size has a significant influence on the permeance. The ratio
between the permeance of helium and nitrogen goes from about 5 to about 300 by decreasing
the pore size.

56
For the second type of behavior, there is only a weak effect of the size of the molecules on the
flux. There seems to be only an effect of the kinetic diameter for helium, for all the other
gases about the same permeance is observed. Nair et al. [2000] studied the mass transport of a
number of gases, including helium, nitrogen and normal- and i-butane, through membranes
prepared by different aging times and by using different compositions for the silica sols. At
408 K the permeance of helium is about 1·10-8 mol m-2 s-1 Pa-1 and the permeance for the
other gases is more than a factor of 100 lower. The results of Nair et al. [2000] are
comparable to the results reported in this work. The helium permeance through the silica
membrane used in this work is about 8·10-8 mol m-2 s-1 Pa-1, at 423 K. The permeance of
nitrogen and SF6 are, respectively, a factor of 14.2 and 24.5 lower than the permeance of
helium.
The difference between the two types of membranes is probably due to a difference in pore
size and pore size distribution. The heat of adsorption of 17.2 kJ/mol of carbon dioxide on the
silica used in this study is lower than results reported in literature for silicalite-1 [Golden and
Sircar, 1994] and Si(400) silica [de Vos and Verweij, 1998]. Furthermore, the activation
energy for diffusion of helium is also lower than the results for the first type of membranes
[Hassan et al., 1995].
Conclusions
In this paper a supported microporous silica membrane has been characterized by means of
adsorption and gas permeation studies. The dual-site Langmuir adsorption isotherm describes
the isotherms for both carbon dioxide and n-butane on silica considerably well. The flux of
gaseous species through the supported silica membrane is about a factor of 500 lower than the
flux of the gases through the support layer, at the temperature range studied. The permeation
of the different gases through the silica layer is determined by equilibrium adsorption
behavior, more than by the size of the permeating molecules. The fact that helium, which is
not adsorbed, shows an activated diffusion behavior indicates that there are interparticle
pores. The diameter of the interparticle pores has been determined to be about 2 nm. As a
result, the overall transport through the supported silica membrane is a combination of an
activated gaseous diffusion and an adsorption – diffusion process.

57
Notation
b Langmuir parameter (1/Pa)
D diffusion coefficient (m2/s)
∆Η heat of adsorption (kJ/mol)
E activation energy (J/(mol))
J flux (mol/(m2.s))
Mw molar mass (kg/mol)
p gas phase pressure (Pa)
p0 saturated vapor pressure (Pa)
q amount adsorbed (mol/kg)
r0 pore radius (m)
R gas constant (J/(mol.K))
T temperature (K)
x space coordinate (m)
z probability factor (-)
Greek
ν jump frequency (1/s)
λ distance between adjacent adsorption sites (m)
Subscripts and superscripts
A site A
AG activated gaseous
B site B
f feed
MP micropore
N normalized
p permeate
sat saturation capacity
References
W.J.W. Bakker, L.J.P. van den Broeke, F. Kapteijn and J.A. Moulijn, Temperature
dependence of one-component permeation through a silicalite-1 membrane, AIChE J., 43
(1997) 2203.

58
T. Bein, Synthesis and application of molecular sieve layers and membranes, Chem.
Mater., 8 (1996) 1636.
R.M. de Vos and H. Verweij, Improved performance of silica membranes for gas
separation, J. Membr. Sci., 143 (1998) 37.
E. Drioli and M. Romano, Progress and new perspectives on integrated membrane
operations for sustainable industrial growth, Ind. Eng. Chem. Res., 40 (2001) 1277.
J. Font, R.P. Castro and Y. Cohen, On the loss of hydraulic permeability in ceramic
membranes, J. Colloid Interf. Sci., 181 (1996) 347.
T.C. Golden and S. Sircar, Gas adsorption on silicalite, J. Colloid Interf. Sci., 162
(1994) 182.
M.H. Hassan, J.D. Way, P.M. Thoen and A.C. Dillon, Single component and mixed
gas transport in a silica hollow fiber membrane, J. Membr. Sci., 104 (1995) 27.
M.K. Koukou, N. Papyannakos, N.C. Markatos, M. Bracht, H.M. van Veen and A.
Roskam, Performance of ceramic membranes at elevated pressure and temperature: Effect of
non-ideal flow conditions in a pilot scale membrane separator, J. Membr. Sci., 155 (1999)
241.
I. Langmuir, The adsorption of gases on plane surfaces of glass, mica and Platinum, J.
Am. Chem. Soc., 40 (1918) 1361.
Y. Lu, G. Cao, R.P. Kale, S. Prabakar, G.P. Lopez and C.J. Brinker, Microporous
silica prepared by organic templating: Relation between the molecular template and pore
structure, Chem. Mater., 11 (1999) 1223.
Matlab, The Mathworks, Version 5.3 (1999).
Y. Morigani, M. Kondo, J. Abe, H. Kita and K. Okamoto, The first large-scale
pervaporation plant using tubular-type module with zeolite NaA membrane, Sep. Purif.
Technol., 25 (2001) 251.
B.N. Nair, K. Keizer, H. Suematsu, Y. Suma, N. Kaneko, S. Ono, T. Okubo and S.-I.
Nakao, Synthesis of gas and vapour molecular sieving silica membranes and analysis of pore
size and connectivity, Langmuir, 16 (2000) 4558.
M.A. Natal-Santiago and J.A. Dumesic, Microcalorimetric, FTIR, and DRIFT studies
of the adsorption of methanol, ethanol, and 2,2,2-trifluorethanol on silica, J. Catal., 175
(1998) 252.

59
M. Nomura, T. Yamaguchi and S. Nakao, Transport phenomena through
intercrystalline and intracrystalline pathways of silicalite zeolite membranes, J. Membr. Sci.,
187 (2001) 203.
S. Thomas, R. Schafer, J. Caro and A. Seidel-Morgenstern, Investigation of mass
transfer through inorganic membranes with several layers, Catal. Today, 67 (2001) 205.
C.-Y. Tsai, S.-Y Tam, Y. Lu and C.J. Brinker, Dual-layer asymmetric microporous
silica membranes, J. Membr. Sci., 169 (2000) 255.
L.J.P. van den Broeke, Simulation of diffusion in zeolitic structures, AIChE J., 45
(1995) 2399.
L.J.P. van den Broeke, W.J.W. Bakker, F. Kapteijn and J.A. Moulijn, Transport and
separation properties of a silicalite-1 membrane: 1. Operating conditions, Chem. Eng. Sci.,
54 (1999) 245.
L.J.P. van den Broeke, F. Kapteijn and J.A. Moulijn, Transport and separation
properties of a silicalite-1 membrane: 2. Separation factor, Chem. Eng. Sci., 54 (1999) 259.
J. Xiao and J. Wei, Transport mechanism of hydrocarbons in zeolites: 1. Theory,
Chem. Eng. Sci., 47 (1992) 1123.
T. Yoshioka, E. Nakanishi, T. Tsuru and M. Asaeda, Experimental studies of gas
permeation through microporous silica membranes, AIChE J., 47 (2001) 2052.

60

61
Chapter 4
Separation of isopropanol/water mixtures by
pervaporation with silica membranes*
Abstract
Dehydration of isopropanol/water mixtures by pervaporation with an alumina supported
microporous silica membrane is studied experimentally and theoretically. Separation
experiments have been performed for different isopropanol/water ratios. The silica
pervaporation membrane combines a high water flux with a high separation factor. For the
pervaporation of isopropanol/water (5/95 wt%) mixture at 333 K, a water flux of about 3
kg/(m2 h) is obtained with a separation factor in excess of 500. The mass transport and the
separation performance are described with the Maxwell-Stefan theory. A combined model
taking micropore diffusion and activated gaseous diffusion into account, which is confirmed
by gas measurements, best describes the mass transport in the supported membrane. For the
permeation of binary isopropanol/water mixtures four different models for micropore
diffusion have been compared. The smaller water molecule permeates through both intra- and
interparticle pores, while isopropanol permeates mainly through the interparticle pores.
* This Chapter has been submitted to AIChE Journal, “Separation of alcohol/water mixtures by pervaporation with ceramic membranes” by A.W.Verkerk, M.W. de Koning, M.A.G. Vorstman, L.J.P. van den Broeke and J.T.F. Keurentjes

62
Introduction
Pervaporation is generally accepted to be a feasible membrane process for the dehydration of
aqueous systems. Especially for mixtures with close boiling points or for azeotropic or
isomeric mixtures pervaporation offers some clear advantages over more traditional
separation methods like distillation [Ray et al., 1997]. Pervaporation is a separation process in
which a component from a liquid mixture evaporates selectively through a membrane. A
broad range of mixtures can be separated by pervaporation [Fleming and Slater, 1992;
Karlsson and Trägårdh, 1993; Van Gemert and Cuperus, 1995; Li et al., 2001]. An interesting
aspect of pervaporation is that it can be used in different hybrid applications. Pervaporation
membranes can effectively be combined with other separation techniques [Moganti et al.,
1998; Hommerich and Rautenbach, 1998; Lipnizki et al., 1999], or can be used in integrated
systems combining separation and reaction [David et al., 1991a,b; Keurentjes et al., 1994;
Kwon et al., 1995; Tanaka et al., 2001].
For polymeric pervaporation membranes extensive research has been performed to optimize
the membrane material. Different polymeric membranes are available with a selective
interaction with a component in the feed mixture to maximize the performance in terms of
separation factor, flux and stability [Fleming and Slater, 1992]. However, the performance of
these membranes is still strongly influenced by the process conditions, like the concentration
of the organic component and the temperature [Waldburger and Widmer, 1996]. In this
perspective, ceramic membranes could mean a considerable improvement in terms of stability
and versatile character. The interest in utilizing ceramic membranes, like silica [Koukou et al.,
1999; Van Veen et al., 2001; Sekulic et al., 2002; Gallego-Lizon et al., 2002] or zeolite
membranes [Bein, 1996; Kita et al., 1997; Tavolaro and Drioli, 1999; Tuan et al., 2002] for
separations has increased since ceramic membranes with a narrow pore size distribution have
become commercially available. Furthermore, inorganic membranes exhibit unique physical
and chemical properties that are not (or only partially) shown by organic membranes,
including a better structural stability without the problems of swelling or compaction.
Generally, they can withstand harsh chemical environments and high temperatures.
Furthermore, the ceramic membranes are not liable to microbiological attack, and can be
back-flushed, steam sterilized or autoclaved [Hsieh et al., 1988].
Microporous silica membranes have been used for gas separation and pervaporation [Nair et
al., 2000]. They state that the mass transport obtained for the two separation processes
showed an activated diffusion behavior. For polymeric pervaporation membranes various
models describing the mass transport have been presented. The mass transport in inorganic

63
pervaporation membranes has only been studied to a limited extent and almost no diffusion
models are available in the literature. Karlsson and Trägårdh [1993] have reviewed several
models for pervaporation of dilute organic-water mixtures using polymer membranes. The
description of the mass transport involves four successive steps, which are crucial for the
overall performance of the pervaporation process. These are 1) mass transfer from the bulk of
the feed to the feed-membrane interface 2) partitioning of the species between the feed and
the membrane 3) diffusion inside the membrane and 4) desorption at the membrane-permeate
interface. Heintz and Stephan [1994a, 1994b] used a generalized solution-diffusion model to
describe the transport inside polymeric membranes (step 3). Diffusion coupling is taken into
account by the Maxwell-Stefan equations, and the solubility equilibrium of the mixture is
described with UNIQUAC.
The Maxwell-Stefan theory can also be applied to describe permeation through microporous
inorganic materials. Transport and separation of gases in inorganic membranes with
micropores has been described using the Maxwell-Stefan theory by Van den Broeke and
coworkers [Bakker et al., 1997; Van den Broeke et al., 1999a; Van den Broeke et al., 1999b].
The permeation of single component gases as well as binary mixtures of gaseous species
through a silicalite-1 membrane has been studied experimentally and theoretically. The
adsorption is described by a Langmuir isotherm for a single component system and the Ideal
Adsorbed Solution theory is used to describe the binary systems. A good description of the
separation of different mixtures for a wide range of process conditions is possible using
single-component equilibrium and diffusion data.
In this Chapter, the Maxwell-Stefan theory is used to describe the mass transport in a ceramic
membrane for the pervaporation of isopropanol/water mixtures. The permeation and
separation behavior is studied for different isopropanol/water compositions at the feed side of
the membrane. The silica membranes are characterized in terms of the flux and separation
factor, so that a clear indication of the application potential is obtained.
Theory
Maxwell-Stefan theory for microporous materials
According to Xiao and Wei [1992] different diffusion processes can take place in
microporous materials. It has been shown for the permeation of gaseous species through
silicalite-1 membranes that the mass transport can only be described by a combination of two
diffusion mechanisms; both micropore (MP) and activated gaseous (AG) diffusion have to be

64
taken into account [Bakker et al., 1997]. In this work the same approach is followed. The
mass flux of component i, Ji, through the microporous silica layer of the supported membrane
is equal to:
i,AGi,MPi JJ)(J ββ +−= 1 (1)
The relative contributions of the two diffusion processes are taken into account by the
parameter β, which has a value between 0 and 1. It has also been demonstrated that for gas
transport through microporous silica membranes, diffusion through intra- and interparticle
pores is possible [Yashioka et al., 2001]. The fact that there are two types of pores in the silica
layer may be a result of the sol-gel preparation technique. It has been proposed by Yashioka
et al. [2001] that the silica layer might consist of colloidal sol particles with intraparticle pores
and somewhat larger interparticle pores between the sol particles.
In the following the mass transport in the micropores of the silica layer is described with the
Maxwell-Stefan equations [Krishna, 1993; Krishna and Wesselingh, 1997]. The force on
species i is obtained from the friction between this species and its surrounding. The friction is
proportional to the velocity difference with respect to the other species:
∑≠=
−=n
ijjjijiji uuF
,1)(θξ ; i = 1, 2, …, n (2)
in which:
ξij friction coefficient between species i and j (N s/mol m);
θj fraction surface amount of species j (-);
ui, velocity of species i through the membrane (m/s).
The fractional occupancy θi is related to the amount adsorbed according to θi =qi/qsat,i. In
pervaporation the driving force, Fi, for diffusion through the membrane is the gradient in the
chemical potential across the membrane:
dzdF i
iµ
−= (3)

65
in which µi is the chemical potential (J/mol) and z a coordinate perpendicular to the
membrane surface (m). The total force species i encounters is given by the friction with the
membrane, M, and the friction with the other (mobile) species of the mixture adsorbed in the
pores of the membrane:
)uu(RT)uu(RTF vivjn
ij,ji
ijji −+−= ∑∑
≠='iM1 ÐÐ
θθ ; i = 1, 2, …, n (4)
in which:
ijÐ Maxwell-Stefan counter-exchange diffusion coefficient (m2/s);
'iMÐ Maxwell-Stefan surface diffusion coefficient (m2/s);
R gas constant (J/(mol.K));
T temperature (K);
θv fraction vacant sites (-).
The friction factor, ξij, equals the inverse of the Maxwell-Stefan diffusivity, Đij-1. The first
term on the right hand site of Eq. 4 refers to the interaction between the permeating
molecules. The diffusion in the adsorbed layer inside the pore is indicated by ĐiM, and the
adsorption sites in the pores of the selective silica membrane are denoted by a subscript v. For
a mixture with n components combining Eq. 2 to Eq. 4 yields:
)uu()uu(dzd
RT viv
jn
ij,ji
ij
ji −+−=− ∑≠=
'iM1 ÐÐ
1 θθµ ; i = 1, 2, …, n (5)
The Maxwell-Stefan diffusion coefficient for micropore diffusion of component i, relative to
the membrane, is defined according to [Mason and Malinauskas, 1983]:
viMÐ
θ
'iMÐ≡ (6)
This results in:

66
)1)(1,1
viiM
j
n
ijji
ij
ji u(uÐ
uuÐdz
dRT
−+−=− ∑≠=
θµ; i, j = 1, 2, …, n (7)
The molar flux of component i, Ni, is related to the velocity, according to:
iii,sati uqN θρ= (8)
in which:
ρ density of the silica (kg/m3);
qsat,i saturation capacity of component i (mol/kg).
Combination of Eq. 7 and Eq. 8 and taking the vacant sites stationary (uv = 0), yields:
i
i
i,satiMj
jn
ij,j i
i
i,satij
ji NqÐ
)NN(
qÐdzd
RT θθθθµρ 1
1+−=− ∑
≠=; i, j = 1, 2, …, n (9)
The chemical potential at the two sides of the membrane is obtained from the fugacity, f (Pa),
assuming equilibrium between the membrane and the bulk liquid:
)ln( 00
i
iii f
fRT+= µµ (10)
For low pressures the fugacity can be obtained from the partial pressure. This means that the
chemical potential can be related to the fractional occupancy, in the microporous membrane,
through the adsorption isotherm. The gradient in the chemical potential is related to the
gradient in the occupancy by the so-called matrix of thermodynamic factors, [Γ] (-):
dzd
dzd
RTj
n
ijj
jiii θµθ ∑
≠=
Γ=,1
, (11)
with:
j
iiji
pθ
θ∂
∂=Γ
ln, ; i, j = 1, 2, …, n (12)

67
in which pi is the partial vapor pressure of component i (Pa).
The final form of the Maxwell-Stefan equations in matrix form, for a mixture of n
components, then reads:
[ ] [ ] ( )JBdzdqMw sat =
Γ− θρ (13)
in which:
Mw molecular weight of permeating species (kg/mol);
q amount adsorbed (mol/kg).
The elements of the B matrix [B] are related to the Maxwell-Stefan diffusion coefficients:
∑≠=
+=n
i,jj ij
j
iMii Ð
θÐ
B1
1 (14a)
j)i( ≠−=ij
iij Ð
Bθ
(14b)
The partial pressure of the different components is obtained from:
0iiii pxp γ= (15)
where x is the mol fraction in the liquid phase (-). The activity coefficients, γi, and the
saturated vapor pressures, p0, have been calculated with the Wilson and Antoine relation,
respectively [Gmehling et al., 1981].
From Eq. 13 it follows that the flux through the membrane, in terms of the amount adsorbed
is given by:
( ) [ ]
−=
dzdqDMwJ MPMP ρ (16)
with the matrix of Fick diffusion coefficients equal to:

68
[ ] [ ] [ ]Γ= −1BDMP (17)
Activated diffusion
Besides micropore diffusion also an activated gaseous transport can take place inside
microporous membranes. In this case mass transport is similar to gaseous diffusion, however,
the molecules feel the force field inside the pores of the membrane [Xiao and Wei, 1992]. The
micropore and activated gaseous diffusion coefficient are given by:
−=
RTEexp
zD MP
MP21νλ (18a)
−=
RTEexp
MwRTrD AG
AG π8
34
0 (18b)
in which:
z probability factor (-);
ν jump frequency (1/s);
λ distance between adjacent adsorption sites (m);
E activation energy (J/(mol));
r0 pore radius (m).
The molar fluxes for micropore transport are given by Eq. 16, and the fluxes for activated
gaseous transport are given by:
=
dzdpD
RTMwJ AGAG ][)(
ρ (19)
with [DAG] a diagonal matrix . The mass transport across the membrane is described by Eq. 1
with Eq. 18 for micropore diffusion and Eq. 19 for activated gaseous diffusion.
Driving force
The results for the fluxes of water and isopropanol are plotted as a function of the driving
force for water across the membrane. From previous work [Verkerk et al., 2001, Chapter 2] it
is known that the water flux is linearly proportional to the driving force for water. Assuming a

69
vanishing permeate pressure, it then follows from Eq. 15 that the driving force for water is
equal to:
0w
rww
rw pxp γ=
Furthermore, mass transfer calculations for the support layer(s) using viscous and Knudsen
flow indicate that the resistance of the support is between 10-20% of the overall transport
resistance. The contribution of the support layer to the fluxes is neglected.
Equilibrium adsorption
From Eq. 16 it follows that for the description of the mass transport in the membrane the
equilibrium amount adsorbed is required. Adsorption in microporous materials is generally
described with Langmuir-type of isotherms. Due to the fact that silica can have two distinct
adsorption sites [Font et al., 1996; Natal-Santiago and Dumesic, 1998] we have compared two
isotherm models.
The first model is the single-site Langmuir isotherm:
ii
iiisati pb
pbqq
+=
1, (20)
where bi is the Langmuir parameter (Pa-1). The second model takes into account two different
adsorption sites. This is known as the dual-site Langmuir adsorption isotherm, and reads:
ii
iiisat
ii
iiisati pb
pbq
pbpb
qq,2
,2,,2
,1
,1,,1 11 +
++
= (21)
For the matrix of thermodynamic factors the individual isotherms of water and isopropanol in
the mixture are required. For the adsorption of a binary mixture the Langmuir isotherm can be
written as:
jjii
iiisati pbpb
pbqq
++=
1, (22)

70
Assumed is that the qsat for both components is the same. If this is not the case, the IAS theory
can be used [Kapteijn et al., 2000].
The relation for the binary Langmuir model can also be extended to a binary model assuming
adsorption on two different sites [Van de Graaf et al., 1999]. This gives:
jjii
iiisat
jjii
iiisati pbpb
pbq
pbpbpb
qq,2,2
,2,,2
,1,1
,1,,1 11 ++
+++
= (23)
For the calculation of the thermodynamic factors from the binary dual-site Langmuir
isotherm, however, no analytical solution can be obtained. For the binary Langmuir model the
matrix of thermodynamic factors, [Γ], is readily obtained:
[ ]
−
−−−
=Γij
ij
ji θθθθ
θθ 11
11 (24)
Binary diffusion
One of the main reasons to study mass transport in micropores is to elucidate the mechanism
of diffusion. This should lead to more efficient separation processes based on adsorption and
diffusion in microporous materials. For the diffusion of a binary mixture there are three
micropore Maxwell-Stefan diffusivities. It is assumed that for the diffusion in a mixture the
two single-component Maxwell-Stefan diffusivities, ĐiM, can be used to describe the transport
of the individual species with respect to the membrane. Further required is a description for
how the components of the mixture interact with each other in the micropores of the
membrane. This is represented by the so-called counter-exchange diffusion coefficient Đij.
For the counter-exchange Maxwell-Stefan diffusivity the Vignes relation can be used:
ji
j
ji
i
jMiMij ÐÐÐ θθθ
θθθ
++= (25)
One of the main advantages of the Vignes relation is that it uses the single-component
Maxwell-Stefan diffusivities, and, therefore, no additional parameters are introduced.
However, the single-component Maxwell-Stefan diffusivity, ĐiM, can be a function of the
amount adsorbed. Combining the possible concentration dependence of the single component

71
diffusivities with the different models for the single-component Maxwell-Stefan diffusivity
gives four binary models for the [B] matrix [Van den Broeke, 1995].
The single-component Maxwell-Stefan diffusivities can either be considered to be
independent of the amount adsorbed:
)(ÐÐ iMiM 0= (26)
or a function of the amount adsorbed:
viMiM )(ÐÐ θ0= (27)
with:
jiv θθθ −−=1 (28)
If there is no interaction in the pores between the adsorbed species the inverse of the binary
Maxwell-Stefan diffusivity is zero:
01 =-ijÐ (29)
In the following the experimental results for the binary fluxes will be compared with the
various models. In model 1 ( ( )0iMiM ÐÐ = and 0-1ij =Ð ) and in model 2 ( ( ) viMiM ÐÐ θ0=
and 01 =-ijÐ ) we assume that the adsorbed molecules have no interaction with each other in
the pores, and this results in the following relations for the [B] -1 matrix:
- Model 1:
[ ]
=−
)(Ð)(ÐB
jM
iM00
001 (30)
- Model 2:
[ ]
=−
)0()--(100)0()--(1wi
ji1
jM
iM
ÐÐ
B θθθθ
(31)

72
In model 3 ( ( )0iMiM ÐÐ = and ijÐ given by the Vignes relation (Eq. 25) and in model 4
( ( )0iMiM ÐÐ = and ijÐ = iMÐ (0)) the counter-exchange diffusivity is taken into account. In
the last model we assume that the counter-exchange diffusivity is equal to the mobility of the
slowest component in the mixture. This results in the following [B]-1 matrix:
- Model 3 and Model 4:
[ ]
++
=−
ijjMjjMiMjjMiM
ijMiMijiMijMiM
ÐÐÐÐÐÐÐÐÐÐÐÐ
YB )0()0()0()0()0()0()0()0()0()0(1
θθθθ
(32)
with:
ijijMjiM Ð)(Ð)(Ð
Y++
=θθ 00
1 (33)
Separation
To relate the separation performance to the water and isopropanol fluxes through the
membrane it is convenient to use the selectivity, S, defined as:
)0*()0*(
)1*()1*(
*
*
==
==
=zz
zJzJ
Sw
ipa
ipa
w
θθ
(34)
Usually there is a trade-off between flux and selectivity, therefore, a useful property to
characterize the membrane performance is the so-called pervaporation-separation index, PSI,
αJPSI = (35)
with the separation factor, α, defined as:
raa
rww
xyxy
//
=α (36)

73
Numerical solution
The dimensionless fluxes, J*, for the permeation of a binary mixture have been solved as a
function of time:
[ ]
∂∂−=
∂∂=
∂∂
**
*
*
*
dzdqD
z
zJ
Foθ
(37)
in which [D*] and z* are the matrix of dimensionless Fick diffusivities and dimensionless
space coordinate, respectively. The dimensionless partial differential equations have been
solved in Fortran using the Numerical Method of Lines (NUMOL) [Schiesser, 1991]. First,
the space coordinate, z*, is discretized, and this results in a set of ordinary differential
equations. This set of ordinary differential equations is then solved using the LSODE solver.
The single-component Maxwell-Stefan diffusivity for water and isopropanol have been
obtained by comparing the numerical results, Eq. 37, with the experimentally obtained fluxes
at a water driving force of 1800 Pa. The results for the binary fluxes, at a higher driving force
for water, are predicted. The fluxes at 1800 Pa are also used to determine the relative
contribution of micropore and activated gaseous diffusion for isopropanol. For the adsorption
behavior of water and isopropanol on silica in each model the two-component Langmuir
adsorption isotherms are used. For mixtures no analytical solution for the thermodynamic
factor can be calculated from the dual-site Langmuir model. The numerical fluxes, calculated
with Eq. 37, are compared with the experimental fluxes using Eq. 1:
=z
ÐqMwJJ iMi,sati*
iiρε
(38)
using a density of 1500 kg/m3 for the silica, a porosity, ε, of 0.5 and a thickness of 100 nm for
the silica layer.

74
Experimental
Pore size distribution
Silica particles, provided by ECN (Petten, The Netherlands), were used for equilibrium
adsorption measurements. The silica particles were prepared in the same manner as the silica
pervaporation membranes. The pore size distribution of the silica particles was measured with
an ASAP 2000 apparatus (Micromiretics) using liquid nitrogen at 77 K.
Equilibrium adsorption isotherms
The measurements for the single component equilibrium adsorption of isopropanol and water
on the silica particles at 333 K have been performed on an IGAsorp system (Hiden
Analytical). The isotherms were obtained gravimetrically. Isopropanol, analytical grade, was
obtained from Merck (Darmstadt, Germany).
Microporous silica membrane
Mass transport under gaseous and pervaporation conditions has been studied using a
supported silica membrane. Permeation experiments with gaseous species have been
performed to characterize the membrane. The tubular ceramic membrane provided by ECN,
The Netherlands, consists of several support layers of α- and γ-alumina. The permselective
top layer, at the outer wall of the tube, is made of amorphous silica [Koukou et al., 1999] and
has a thickness of 200 nm.
Single component permeation of gases
For the permeation experiments with gaseous species through the silica membrane, the
membrane was placed in an oven (Heraeus) and the temperature was controlled with a Pt100.
The membrane module was pressurized at the feed and permeate side up to 2.0⋅105 Pa.
Permeation experiments were performed with a fixed pressure difference of 1.0⋅105 Pa, using
a dead-end configuration and temperatures between 295 and 440 K. A permeation
measurement was started by opening a needle valve at the permeate side of the membrane to
create a pressure difference across the membrane. To obtain the mass transport through the
membrane the flux at the permeate side was measured with mass flow controllers
(Bronckhorst).
Helium (grade 5.0), carbon dioxide (grade 5.0), and n-butane (grade 2.5) were obtained from
HoekLoos (Amsterdam, The Netherlands).

75
Binary permeation of alcohol/water mixtures
The membrane performance for pervaporation was measured with the set-up depicted in
Figure 1. The tubular ceramic pervaporation membrane (4) was placed in a glass vessel with
heating jacket (1) in a dead-end configuration. The vessel was filled with the alcohol/water
mixture, which was stirred with three pitched blade turbine stirrers (2) of 5 cm diameter
mounted at the same shaft at a stirring speed of 1400 rpm. From previous experiments, we
know that at this stirring speed no temperature and concentration polarization in the retentate
occurs. The temperature in the vessel was kept constant, measured with a Pt100 (3). A total
reflux condenser on top of the vessel (not depicted in Figure 1) was used to prevent vapor
losses of the retentate. A vacuum pump (Edwards RV5)(8) provided the vacuum. The
permeate pressure was controlled with a needle valve (10) and measured with an ATM 100
mbar absolute pressure transmitter (AE Sensors) (9). Liquid nitrogen was used as a cooling
agent for the cold traps (5, 6 and 7). Cold traps 5 and 6 were used alternately to collect the
permeate. The connection from the membrane to the cold traps 5 and 6 was thermostated to
prevent condensation.
The compositions of the feed for water contents < 10 wt% were analyzed using an automated
Karl-Fischer titration apparatus (Mitsubishi, model CA-100). Above a water content of 10
wt%, the feed was analyzed with GC. The GC (Chrompack CP 9001) uses a FID detector
equipped with a RTX-5 column with a length of 30 m. The permeate was analyzed using
refractive index (Euromex Refractometer RF 490) at 298 K and GC.
Figure 1. Lab-scale pervaporation set-up.
P
T
5 6 71
4
11
9
8
10
3
2

76
To establish the membrane performance, dehydration experiments were performed with
isopropanol/water mixtures. In order to obtain reproducible fluxes, the membrane was
allowed to stabilize first for 150 hours under pervaporation conditions prior to the
measurements. For the pervaporation experiments the temperature was set at 333 K and the
permeate pressure was < 100 Pa. The water concentration was varied between 1 and 80 wt%.
Results and discussion
Pore size distribution
In Figure 2 the pore size distribution of the silica particles is given indicating that the pore
size distribution lies between 0.5 and 0.8 nm. The pore size distribution has been obtained
from the initial part of the liquid nitrogen isotherm using a standard Horwath-Kawazoe
routine.
Figure 2. Pore size distribution of silica, obtained from nitrogen adsorption at 77 K.
0
0.2
0.4
0.6
0.8
1
1.2
0.4 0.45 0.5 0.55 0.6 0.65 0.7 0.75 0.8pore size (nm)
diffe
rent
ial p
ore
volu
me
(cm
3 /g n
m)

77
Figure 3. Single-component adsorption isotherm of isopropanol (IPA) and water on silica at
333 K. The relative pressure equals the absolute pressure divided by the saturated vapor
pressure given in Table 1.
Equilibrium adsorption isotherms
Figure 3 shows the observed adsorption isotherms of isopropanol and water on silica at 333
K. The isotherms have both been fitted with the Langmuir and the dual-site Langmuir
adsorption isotherms. A Levenberg-Marquardt routine from Matlab [Matworks, 1999] has
been used for the minimization. The results for the Langmuir parameters are given in Table 1
and 2. The adsorption isotherms of isopropanol and water on silica can be described with the
Langmuir adsorption isotherm reasonably well. The dual-site Langmuir adsorption isotherm,
however, describes the isotherm for both isopropanol and water on silica considerably better.
As it is known that microporous silica can have two types of adsorption sites [Font et al.,
1996; Natal-Santiago and Dumesic, 1998], this supports this conclusion.
0
0.5
1
1.5
2
2.5
0 0.1 0.2 0.3 0.4 0.5relative pressure (-)
amou
nt ip
a ad
sorb
ed (m
ol/k
g)
0
1
2
3
4
5
6
7
8
9
10am
ount water adsorbed (m
ol/kg)
LangmuirDSLads, ipaLangmuirDSLads, water

78
Table 1. Langmuir parameters and saturated vapor pressure for the adsorption on silica
particles at 333 K
water isopropanol
qsat (mol/kg) 12.67 1.92
b (-) 2.03⋅10-4 1.37⋅10-2
p0 (Pa) 1.99⋅104 3.85⋅104
Table 2. Dual-site Langmuir parameters for the adsorption on silica particles at 333 K
Water isopropanol
qsat,1 (mol/kg) 1.3 0.5
qsat,2 (mol/kg) 17.3 1.6
b1 (-) 6.5 10-5 2.9 10-4
b2 (-) 5.0 10-2 4.6 10-2
Single component permeation of gases
In Figure 4 the steady-state molar flux of the three gaseous species, helium, carbon dioxide,
and n-butane, is given as a function of the temperature. From the fact that the helium flux
increases with an increase in temperature it follows that the mass transport of helium through
the alumina-supported microporous silica membrane is an activated process. On the other
hand, the fact that the flux of both carbon dioxide and n-butane decreases with an increase in
temperature indicates that another mechanism contributes to the overall mass transport
through the membrane as well. Furthermore, between 295 and 375 K the flux of n-butane is
higher than the flux of carbon dioxide. This rules out the possibility of Knudsen diffusion as
the main transport mechanism through the silica layer, because for this type of diffusion the
mass transport is proportional to the inverse of the square root of the molecular mass. Based
on a comparison with other microporous membranes [Van den Broeke et al., 1999a; Van den
Broeke et al., 1999b] the mass transport through the silica membrane will be a combination of
an activated gaseous and an adsorption - diffusion process. The increasing flux of helium is a
result of the activated transport, while the decreasing trend observed for carbon dioxide and n-
butane is a result of a decrease in the amount adsorbed with an increase in temperature.
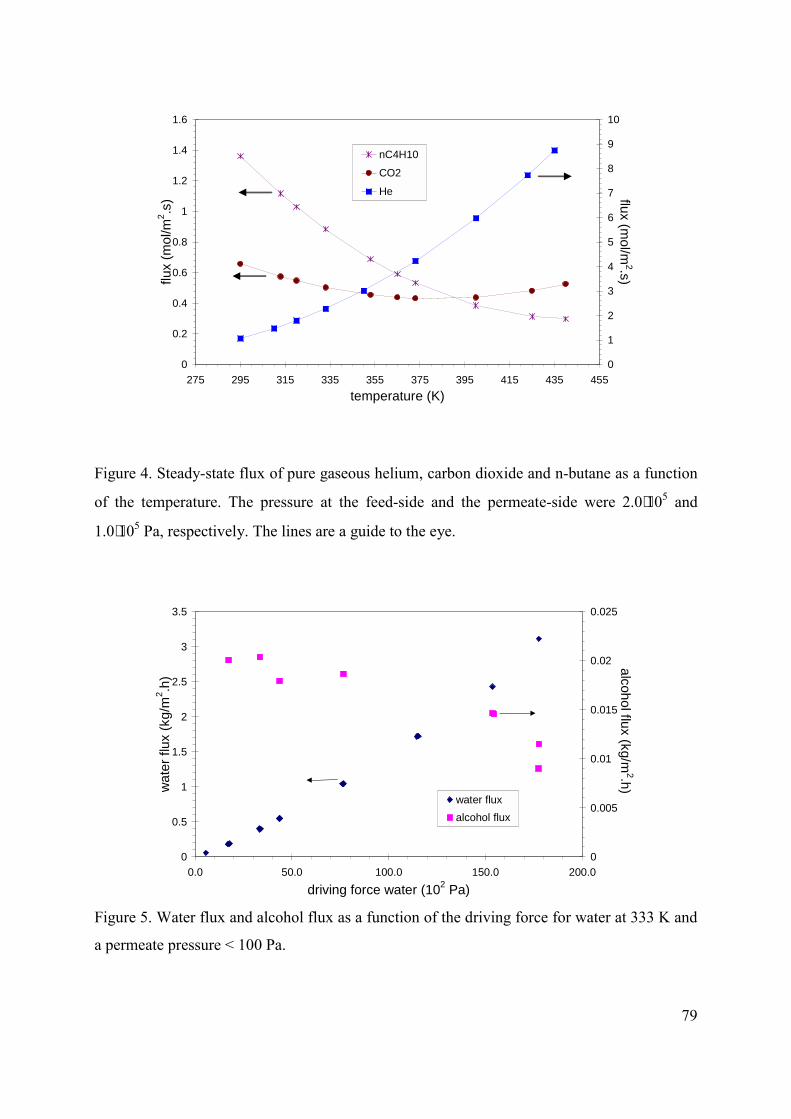
79
0
0.2
0.4
0.6
0.8
1
1.2
1.4
1.6
275 295 315 335 355 375 395 415 435 455temperature (K)
flux
(mol
/m2 .s
)
0
1
2
3
4
5
6
7
8
9
10
flux (mol/m
2.s)nC4H10
CO2
He
Figure 4. Steady-state flux of pure gaseous helium, carbon dioxide and n-butane as a function
of the temperature. The pressure at the feed-side and the permeate-side were 2.0⋅105 and
1.0⋅105 Pa, respectively. The lines are a guide to the eye.
Figure 5. Water flux and alcohol flux as a function of the driving force for water at 333 K and
a permeate pressure < 100 Pa.
0
0.5
1
1.5
2
2.5
3
3.5
0.0 50.0 100.0 150.0 200.0driving force water (102 Pa)
wat
er fl
ux (k
g/m
2 .h)
0
0.005
0.01
0.015
0.02
0.025
alcohol flux (kg/m2.h)
water fluxalcohol flux

80
Binary permeation of alcohol/water mixtures
The results of the pervaporation experiments are depicted in Figure 5. The water flux and the
alcohol flux are plotted as a function of the driving force for water. It can be seen that the
membrane is more permeable for water than for isopropanol, and with an increase in driving
force for water, the water flux increases and the alcohol flux decreases.
Figure 6. Separation factor and PSI as a function of the driving force for water at 333 K and a
permeate pressure < 100 Pa.
The separation factor, towards water, decreases from 1200 to 500 with an increase in the
driving force of water. This is depicted in Figure 6. The PSI, as a consequence, shows an
increasing behavior with an increase in driving force for water (see Figure 6) and reaches a
maximum value of about 1600 kg/(m2h). In order to make a comparison between the
experimental and numerical results, the selectivity, S, for different ratios of the micropore
diffusivity wMÐ / ipaMÐ has been calculated, using Eqs 30 - 33. The experimental results for
the fluxes at a driving force of 1800 Pa are taken as the starting point. At this pressure the
fractional occupancies of isopropanol and water, at the feed side of the membrane, are equal
to 0.995 and 0.005, respectively. These values are obtained from Eq. 22 and using the data of
Table 1. The results for the selectivity for different ratios of the micropore diffusivity are
given in Table 3. Models 3 and 4 give a maximum selectivity of 2.0. This low selectivity is
caused by the low water flux in these two models. The water flux is strongly influenced by the
0
200
400
600
800
1000
1200
1400
0.0 50.0 100.0 150.0 200.0driving force water (102 Pa)
sepa
ratio
n fa
ctor
(-)
0
200
400
600
800
1000
1200
1400
1600
1800
PSI (kg/m2.h)
sep. factorPSI
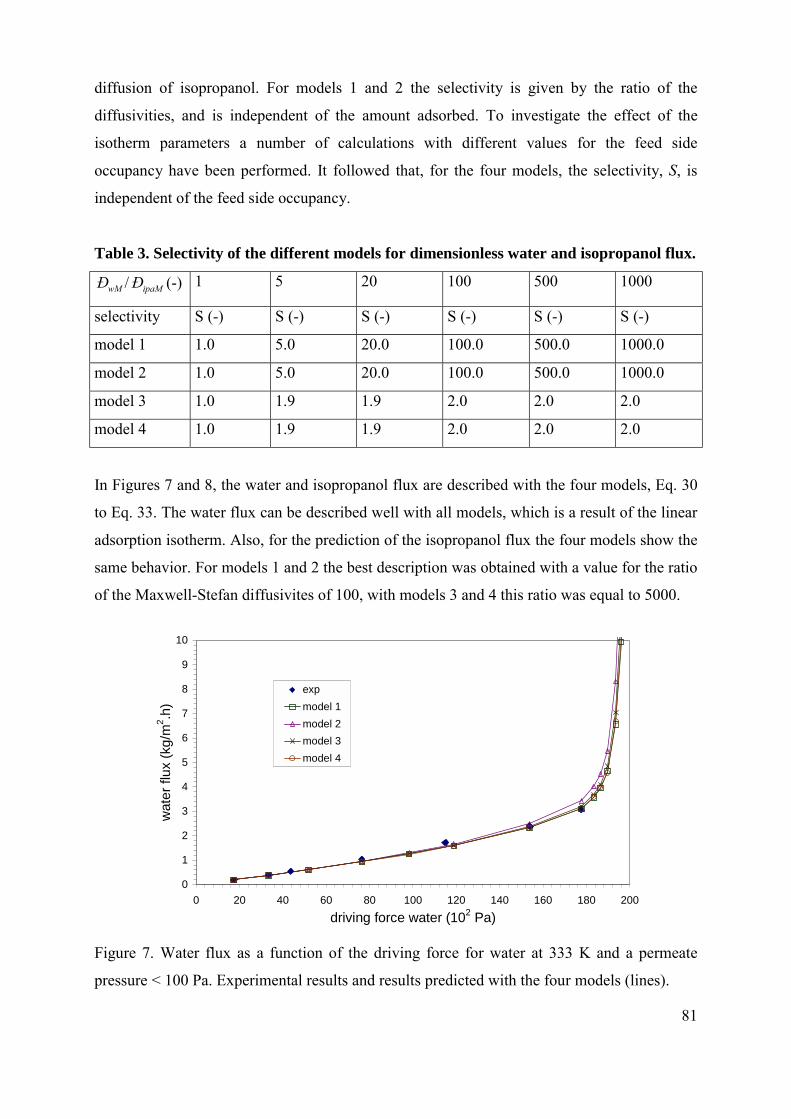
81
diffusion of isopropanol. For models 1 and 2 the selectivity is given by the ratio of the
diffusivities, and is independent of the amount adsorbed. To investigate the effect of the
isotherm parameters a number of calculations with different values for the feed side
occupancy have been performed. It followed that, for the four models, the selectivity, S, is
independent of the feed side occupancy.
Table 3. Selectivity of the different models for dimensionless water and isopropanol flux.
wMÐ / ipaMÐ (-) 1 5 20 100 500 1000
selectivity S (-) S (-) S (-) S (-) S (-) S (-)
model 1 1.0 5.0 20.0 100.0 500.0 1000.0
model 2 1.0 5.0 20.0 100.0 500.0 1000.0
model 3 1.0 1.9 1.9 2.0 2.0 2.0
model 4 1.0 1.9 1.9 2.0 2.0 2.0
In Figures 7 and 8, the water and isopropanol flux are described with the four models, Eq. 30
to Eq. 33. The water flux can be described well with all models, which is a result of the linear
adsorption isotherm. Also, for the prediction of the isopropanol flux the four models show the
same behavior. For models 1 and 2 the best description was obtained with a value for the ratio
of the Maxwell-Stefan diffusivites of 100, with models 3 and 4 this ratio was equal to 5000.
Figure 7. Water flux as a function of the driving force for water at 333 K and a permeate
pressure < 100 Pa. Experimental results and results predicted with the four models (lines).
0
1
2
3
4
5
6
7
8
9
10
0 20 40 60 80 100 120 140 160 180 200driving force water (102 Pa)
wat
er fl
ux (k
g/m
2 .h)
expmodel 1model 2model 3model 4

82
Figure 8. Alcohol flux as a function of the driving force for water at 333 K and a permeate
pressure < 100 Pa. Experimental results and results predicted with the four models (lines).
The fact that the four models give similar results means that the transport mechanism cannot
be determined from this comparison. However, a value of 100 for the ratio of the Maxwell-
Stefan diffusivites seems physically the most realistic.
The absolute values for the Maxwell-Stefan diffusivities are calculated with Eq. 16. The water
diffusivity, ĐwM, for model 1 and 2 is equal 1.5·10-11 m2/s and 8.3·10-12 m2/s, respectively. For
models 3 and 4 the same value for the diffusivity is obtained, with ĐwM = 7.4·10-11 m2/s.
From the single component permeation of the gaseous species it seems that the mass transport
through the silica membrane will be a combination of an activated gaseous (see Figure 4) and
an adsorption - diffusion process. To check how the activated gaseous diffusion plays a role in
the permeation of isopropanol/water mixtures through the membrane, activation energies of
isopropanol and water on silica are required. This is, however, difficult to determine as there
are two different contributing mass transport mechanisms, and the relative contribution of
each mechanism is not known.
To get an impression of the activation energies of isopropanol and water on silica the flux of
helium is used. First, the helium flux is corrected for pressure and molar mass. The activation
0
0.005
0.01
0.015
0.02
0.025
0 50 100 150 200driving force water (102 Pa)
alco
hol f
lux
(kg/
m2 .h
)
expmodel 1model 2model 3model 4

83
energies for water and isopropanol are fitted for three cases using Eq. 1, and different values
for the contribution of micropore diffusion using model 1 and activated diffusion. In the case
of β=0 only micropore diffusion contributes, for β=0.5 both micropore diffusion and activated
gaseous diffusion contribute, and for β=1 only activated gaseous diffusion occurs. Table 4
gives an overview of the activation energies for the activated gaseous diffusion of water and
isopropanol, using model 1 with a diffusivity of water of ĐwM = 1.5·10-11 m2/s.
Table 4. Activation energies for diffusion of water and isopropanol through the silica
membrane.
Relative contribution Eact,water (kJ/mol) Eact,ipa (kJ/mol)
Activated gaseous (β=1) 2.3 19.9
Micropore and activated gaseous (β=0.5) 4.4 21.9
Figure 9. Water flux as a function of the driving force for water for micropore and activated
gaseous diffusion. Experimental results and results predicted with Eq. (1) and model 1 (lines).
Figures 9 and 10 show the flux of water and isopropanol from the mixture as a function of the
driving force for water with different contributions of activated gaseous diffusion. The
0
1
2
3
4
5
6
7
8
9
10
0 20 40 60 80 100 120 140 160 180 200driving force water (102 Pa)
wat
er fl
ux (k
g/m
2 .h)
β=1
β=0.5
β=0exp

84
influence of the activated gaseous diffusion on the water flux is clearly visible at high water
driving forces over the membrane. With increasing influence of activated gaseous diffusion,
the water flux shifts towards a proportional relationship with the driving force for water. As
the contribution of activated gaseous diffusion increases, the decreasing trend of the
isopropanol flux is described better. Water permeates through both intra- and interparticle
pores, while isopropanol permeates mainly through the interparticle pores, because the best
description of the mass flux of isopropanol is obtained with a high value of β. For the flux of
isopropanol it is not possible to have only contribution of activated gaseous diffusion, because
from Figure 3 it follows that isopropanol adsorbs considerably on silica.
Figure 10. Alcohol flux as a function of the driving force for water for micropore and
activated gaseous diffusion. Experimental results and results predicted with Eq. (1) and model
1 (lines).
Concluding remarks
The amorphous silica pervaporation membranes used in this study for the separation of
isopropanol/water mixtures, combine high selectivities with high permeabilities, resulting in a
high PSI. The mass transport through the silica membrane seems a combination of an
activated gaseous and an adsorption - diffusion process. This means that the water and
isopropanol are diffusing through different types of pores. Water permeates through both
0
0.005
0.01
0.015
0.02
0.025
0 20 40 60 80 100 120 140 160 180 200driving force water (102 Pa)
alco
hol f
lux
(kg/
m2 .h
)
β=1
β=0.5
β=0exp

85
intra- and interparticle pores, while isopropanol permeates mainly through the interparticle
pores, because the best description of the mass flux of isopropanol is obtained with a high
value of β.
Acknowledgement
Mr. P.P.A.C. Pex and mr. H.M. van Veen (ECN, Petten, The Netherlands) are thanked for
supplying the silica particles and the silica membranes and for stimulating discussions.
Notation
bi Langmuir parameter (Pa-1)
[B] matrix of Maxwell-Stefan diffusivities (m2/s)
c total surface concentration of the mixture on the membrane (mol/m3)
D Fick diffusion coefficient (m2/s)
ijÐ Maxwell-Stefan counter-exchange diffusion coefficient (m2/s)
iMÐ Maxwell-Stefan surface diffusion coefficient (m2/s)
E activation energy (kJ/mol)
fi fugacity of component i (Pa)
fi 0 fugacity of component i for a chozen standard temperature and pressure (Pa)
Fi driving force on component i (N/mol)
Fo Fourier number (= wMÐ (0)t/L2) (-)
J mass flux (kg/m2 s)
(Ji) vector of mass fluxes (kg/(m2.s)) or (kg/(m2.h))
( *iJ ) vector of dimensionless fluxes (-)
L thickness membrane (m)
Mw molecular weight of permeating species (kg/mol)
N molar flux (mol/(m2.s))
(Ni ) vector of molar fluxes (mol/(m2.s))
pi partial vapor pressure (Pa)
pi0 saturated vapor pressure (Pa)
PSI pervaporation separation index (kg/(m2.h))
qi amount adsorbed (mol/kg)

86
ro pore radius (m)
R gas constant
S selectivity (-)
t time (s)
T temperature (K)
ui,j velocity of component i through the membrane (m/s)
xi mol fraction (-)
yi mol fraction (-)
Y factor defined in Eq. 33
z coordinate perpendicular to the membrane surface (m)
z* dimensionless membrane thickness (=z/L) (-)
z probability factor (-)
Greek
α separation factor (-)
β relative contribution of micropore and activated gas diffusion (-)
γi activity coefficient (-)
[Γ] matrix of thermodynamical factors (-)
ε porosity (-)
θj fraction surface amount (-)
θv fraction vacant sites (-)
λ distance between adjacent adsorption sites (m)
µi chemical potential (J/mol)
µi0 chemical potential for standard temperature and pressure (J/mol)
ν jump frequency (1/s)
ξij friction coefficient (N s/mol m)
ρ density of the silica (kg/m3)
super- and subscripts
1,2 adsorption site
a alcohol (or isopropanol)
AG activated gaseous
i,j component i and j
IPA isopropanol
M membrane

87
MP micropore
n number of components
r retentate
sat saturated
tot total
v vacant adsorption site
w water
References
W.J.W. Bakker, F. Kapteijn, J. Poppe and J.A. Moulijn, Permeation characteristics of
a metal-supported silicalite-1 zeolite membrane, J. Membr. Sci., 117 (1996) 57.
T. Bein, synthesis and applications of molecular sieve layers and membranes, Chem.
Mater., 8 (1996) 1636.
M.-O. David, R. Gref, T.Q. Nguyen and J. Neel, Pervaporation-esterification
coupling: Part I. Basick kinetic model, Trans. IchemE., 69 (1991) 335.
M.-O. David, T.Q. Nguyen and J. Neel, Pervaporation-esterification coupling: Part II.
Modelling of the influence of different operating parameters, Trans. IchemE., 69 (1991) 341.
H.L. Fleming and C.S. Slater, Pervaporation, in W.S.W. Ho and K.K. Sirkar (Eds.),
Membrane Handbook, Chapman & Hall, New York (1992).
J. Font, R.P. Castro and Y. Cohen, On the loss of hydraulic permeability in ceramic
membranes, J. Colloid Interf. Sci., 181 (1996) 347.
T. Gallego-Lizon, Y.S. Ho and L. Freitas dos Santos, Comparative study of
commercially available polymeric and microporous silica membranes for the dehydration of
IPA-water mixtures by pervaporation-vapour permeation, Desalination, 149 (2002) 3.
J. Gmehling, U. Onken and W. Arlt, Vapor-liquid equilibrium data collection,
Dechema, Frankurt/Main (1981).
A. Heintz and W. Stephan, A generalized solution-diffusion model of the pervaporation
process through composite membranes. Part I. Prediction of mixture solubilities in the dense
active layer using the UNIQUAC model, J. Membr. Sci., 89 (1994a) 143.

88
A. Heintz and W. Stephan, A generalized solution-diffusion model of the pervaporation
process through composite membranes. Part II. Concentration polarization, coupled diffusion
and the influence of the porous support layer, J. Membr. Sci., 89 (1994b) 153.
U. Hommerich and R. Rautenbach. Design and optimization of combined
pervaporation / distillation process for the production of MTBE, J. Membr. Sci., 146 (1998)
53.
H.P. Hsieh, R.R. Bhave and H.L. Fleming, Microporous alumina membranes, J.
Membr. Sci., 39 (1988) 221.
F. Kapteijn, J.A. Moulijn and R. Krishna, The generalized Maxwell-Stefan equations
for zeolites: Sorbate molecules with different saturation loadings, Chem. Eng. Sci., 55 (2000)
2923.
H.O.E. Karlsson and G. Trägårdh, Pervaporation of dilute organic-water mixtures. A
literature review on modelling studies and applications to aroma compound recovery, J.
Membr. Sci., 79 (1993) 121.
J.T.F. Keurentjes, G.H.R. Jansen and J.J. Gorissen, The esterification of tartaric acid
with ethanol: Kinetics and shifting the equilibrium by means of pervaporation, Chem. Eng.
Sci., 49 (1994) 4681.
H. Kita, K. Horii, Y. Ohtoshi, K. Tanaka and K-I. Okamoto, Synthesis of a zeolite NaA
membrane for pervaporation of water-organic liquid mixtures, J. Mater. Sci. Lett., 14 (1995)
206.
M.K. Koukou, N. Papyannakos, N.C. Markatos, M. Bracht, and H.M. van Veen and A.
Roskam, Performance of ceramic membranes at elevated pressure and temperature: Effect of
non-ideal flow conditions in a pilot scale membrane separator, J. Membr. Sci., 155 (1999)
241.
R. Krishna, A unified approach to the modeling of intraparticle diffusion in adsorption
processes, Gas. Sep. Purif., 7 (1993) 91.
R. Krishna and J.A. Wesselingh, The Maxwell-Stefan approach to mass transfer,
Chem. Eng. Sci., 52 (1997) 861.
S.J. Kwon, K.M. Song, W.H. Hong and J.S. Rhee, Removal of water produced from
lipase-catalyzed esterification in organic solvent by pervaporation, Biotech. Bioeng., 46
(1995) 393.

89
S. Li, V.A. Tan, R.D. Noble, and J.L. Falconer, Pervaporation of water / THF mixtures
using zeolite membranes, Ind. Eng. Chem. Res., 40 (2001) 4577.
R.F. Lipnizki, R.W. Field and P.-K. Ten, Pervaporation-based hybrid process: A
review of process design, applications and economics, J. Membr. Sci., 153 (1999) 183.
E.A. Mason and A.P. Malinauskas, Gas transport in porous media: The dusty gas
model, Elsevier, Amsterdam (1983).
S. Moganti, R.D. Noble and C. A. Koval, Analysis of membrane / distillation column
hybrid process, J. Membr. Sci., 93 (1998) 31.
Mathlab, The Mathworks, Version 5.3 (1999).
B.N. Nair, K. Keizer, H. Suematsu, Y. Suma, N. Kaneko, S. Ono, T. Okubo and S.-I.
Nakao, Synthesis of gas and vapor molecular sieving silica membranes and analysis of pore
size connectivity, Langmuir, 16 (2000) 4558.
M.A. Natal-Santiago and J.A. Dumesic, Microcalorimetric, FTIR, and DRIFT studies
of the adsorption of methanol, ethanol, and 2,2,2-trifluorethanol on silica, J. Catal., 175
(1998) 252.
S.K. Ray, S.B. Sawant, J.B. Joshi and V.G. Pangarkar, Development of new synthetic
membranes for separation of benzene - cyclohexane mixtures by pervaporation: a solubility
parameter approach, Ind. Eng. Chem. Res., 36 (1997) 5265.
W.E. Schiesser, The numerical method of lines: Integration of partial differential
equations, Academic Press, San Diego (1991).
J. Sekulic. M.W.J. Luiten, J.E. ten Elshof, N.E. Benes and K. Keizer, Microporous
silica and doped silica membrane for alcohol dehydration by pervaporation, Desalination,
148 (2002) 19.
K. Tanaka, R. Yoshikawa, C. Ying, H. Kita and K.-I. Okamoto, Application of zeolite
membranes to esterification reactions, Catal. Today, 67 (2001) 121.
A. Tavolaro and E. Drioli, Zeolite membranes, Adv. Mater., 11 (1999) 975.
V.A. Tuan, S. Li, J.L. Falconer and R.D. Noble, Separating organics from water by
pervaporation with isomorphously-substituted MFI zeolite membranes, J. Membr. Sci., 196
(2002) 111.
J.M. van de Graaf, F. Kapteijn and J.A. Moulijn, Modeling permeation of binary
mixtures through zeolite membranes, AIChE J., 45 (1999) 497.

90
L.J.P. van den Broeke, Simulation of diffusion in zeolitic structures, AIChE J., 41
(1995) 2399.
L.J.P. van den Broeke, W.J.W. Bakker, F. Kapteijn and J.A. Moulijn, Transport and
separation properties of a silicalite-1 membrane - I. Operating conditions, Chem. Eng. Sci.,
54 (1999a) 245.
L.J.P. van den Broeke, F. Kapteijn and J.A. Moulijn, Transport and separation
properties of a silicalite-1 membrane - II. Variable separation factor, Chem. Eng. Sci., 54
(1999b) 259.
R.W. van Gemert and F.P. Cuperus, Newly developed ceramic membranes for
dehydration and separation of organic mixtures by pervaporation, J. Membr. Sci., 105 (1995)
287.
H.M. van Veen, Y.C. van Delft, C.W.R. Engelen and P.P.A.C. Pex, Dewatering of
organics by pervaporation with silica membranes, Separ. Purif. Technol., 22-23 (2001) 361.
A.W. Verkerk, P. van Male, M.A.G. Vorstman and J.T.F. Keurentjes, Description of
dehydration performance of amorphous silica pervaporation membranes, J. Membr. Sci., 193
(2001) 227.
R.M. Waldburger and F. Widmer, Membrane reactors in chemical production
processes and the application to the pervaporation-assisted esterification, Chem. Eng.
Technol., 19 (1996) 117.
J. Xiao and J. Wei, Diffusion mechanism of hydrocarbons in zeolites - I. Theory,
Chem. Eng. Sci., 47 (1992) 1123.
T. Yoshioka, E. Nakanishi, T. Tsuru and M. Asaeda, Experimental studies of gas
permeation through microporous silica membranes, AIChE J., 47 (2001) 2053.

91
Chapter 5
Pervaporation-assisted esterification of levulinic
acid with n-amyl alcohol using a temperature
resistant silica membrane*
Abstract
A hybrid reaction and separation process combining the batch mono esterification of levulinic
acid with n-amyl alcohol with pervaporation has been studied. First the reaction kinetics
between 328 K and 408 K has been determined for this equilibrium reaction. The reaction
kinetics was obtained without the use of a catalyst. In the hybrid process, also studied at 348
K and 408 K, a supported silica membrane was used to remove the water formed during the
reaction by pervaporation. For the reaction in combination with pervaporation an increase of
about 20% in the conversion was observed as compared to the situation without water
removal. The reaction carried out at 408 K is about 14 times faster than the reaction at 348 K.
The pervaporation-assisted esterification at the two temperatures can be predicted using the
separately determined reaction kinetics combined with a single relation for the water flux as a
function of the driving force. The silica membrane showed stable operation for more than 900
h including operation at 408 K for over 80 h.
* This Chapter will be submitted as “Pervaporation-assisted esterification of levulinic acid with n-amyl alcohol using a temperature resistant silica membrane” by A.W. Verkerk, M.A.G. Vorstman and J.T.F. Keurentjes

92
Introduction
The combination of reaction and separation offers a wide range of opportunities for more
efficient processes. An interesting application is the removal of one of the components formed
during reaction in order to increase the conversion of equilibrium-limited reactions.
Esterifications represent an important group of reactions for which it is known that the
conversion is limited due to the reaction equilibrium. Furthermore, the presence of a possible
azeotrope between reactants and products makes an esterification process difficult to operate.
One option to obtain high yields in esterification reactions is the use of a large excess of one
of the starting reagents. However, this results in a relatively inefficient use of reactor space,
and an efficient separation is required afterwards. Alternatively, the reaction can be forced
towards completion by the removal of one of the reaction products. For esterifications, which
are condensation reactions, the water formed during reaction can be selectively removed by a
membrane.
For the removal of water from organic streams, pervaporation seems to be the appropriate
membrane technique. Selective membranes are available for the dehydration of alcohols,
carboxylic acids, amines and many other liquids [Van Veen et al., 2001]. A hybrid process
combining reaction and pervaporation has been used successfully for different esterification
reactions [Keurentjes et al., 1994; Waldburger et al., 1994; Zhu et al., 1996; Domingues et al.,
1999; Xuehui and Lefu, 2001]. In all these studies the pervaporation membranes used were
PVA type membranes. A general disadvantage of these polymer membranes is that the
operation is limited to relatively low temperatures, typically below 393 K. Furthermore, it is
well known that the performance of these PVA membranes is influenced by changes in
process conditions like concentration and temperature [Waldburger and Widmer, 1996].
From a reaction kinetics point of view, high temperatures are favorable. In this respect, stable
inorganic membranes, e.g. made of ceramics or zeolites, could represent a major
improvement. The use of inorganic membranes in various separation processes has increased
significantly, as ceramic membranes with a narrow pore size distribution have become
commercially available [Van Veen et al., 2001; Velterop, 1999]. Inorganic membranes exhibit
unique physical and chemical properties that are not (or only partially) shown by organic
membranes. Inorganic membranes have better structural stability without the problems of
swelling or compaction. Generally, they can withstand harsh chemical environments and high
temperatures. Furthermore, ceramic membranes are not liable to microbiological attack, and
can be backflushed, steam sterilized or autoclaved [Hsieh et al., 1988].

93
The present study explores the feasibility of a silica membrane as a pervaporation membrane
for the removal of water formed during the mono esterification of levulinic acid with n-amyl
alcohol. The reaction kinetics for this equilibrium reaction has been determined separately.
The reaction in combination with pervaporation has been carried out at two temperatures, 348
K and 408 K, and at atmospheric conditions. In this way the temperature resistance of the
silica membrane is demonstrated, as it shows stable operation for more than 900 h, including
operation at a 408 K for over 80 h.
Theory
The esterification of levulinic acid (CH3COCH2CH2COOH) with n-amyl alcohol (C5H11OH)
can be represented schematically by:
L + P ↔ E + W
Where L is levulinic acid, P is n-amyl alcohol, E is n-amyl levulinate and W is water.
Assuming a constant reaction volume, the rate of water formation is given by:
rW=k1CLCP – k2CECW (1)
in which CX denotes the concentration of component X and k1 and k2 are the forward and
backward reaction rate constants, respectively. The equilibrium constant, K, is given by:
[ ][ ][ ][ ] 2
1kk
CCCC
KPL
WE == (2)
The mass balance for water in a batch reactor with water removal through the pervaporation
membrane is equal to:
)( WWW VCdtdAJVr += (3)
in which:
V: reaction volume (L);

94
A: membrane surface area (m2);
JW: water flux through the membrane (mol.m-2.min-1).
During the reaction in combination with pervaporation, the reaction volume is assumed to be
constant. By substituting Eq 1 into Eq 3 we obtain:
WWEPLW J
VA)CCkCCk(
dtdC
−−= 21 (4)
For the other components a similar relation holds. From previous work [Verkerk et al., 2001]
it is clear that the silica pervaporation membrane removes water with high selectivity. This
means that the flux of the other components through the membrane is negligible.
Furthermore, the water flux depends linearly on the driving force for water, because water has
a linear adsorption isotherm on silica [Chapter 4].
The driving force for water is given by the difference between the equilibrium vapor pressure
of water at the feed side, p*W, and the pressure of water at the permeate side, pW
p. Because the
permeate pressure in the experiments was always smaller than 100 Pa, the driving force for
water can be described using the equilibrium vapor pressure of water in the reaction mixture.
The equilibrium vapor pressure for water can be expressed as:
0WWW
*W pxp γ= (5)
in which:
γW: activity coefficient of water in the retentate (-);
xW: mole fraction of water in the retentate (mol/mol);
p0W: vapor pressure of pure water (Pa).
The flux for water, JW, is equal to:
( )pW
*WW ppBJ −= (6)
in which B denotes the mobility constant.

95
14
3
3
2
5
5
Experimental
The reagents levulinic acid and n-amyl alcohol used were of analytical grade and were
obtained from Merck (Darmstadt, Germany). To determine the reaction rate constants, k1 and
k2, reactions of levulinic acid and n-amyl alcohol were performed at different temperatures,
ranging between 328 and 408 K. In a stirred reactor, with a total reflux condensor to prevent
losses of the product, an equimolar mixture of the reactants was added with a total volume of
300 mL. The reactants were heated separately to the reaction temperature and mixed in the
reactor. The temperature in the reactor was kept constant within 0.1 K and was measured with
a Pt100. To determine the reaction rate constant k1, samples were taken initially every 10
minutes, later every hour. The water content in the reaction mixture was analyzed by means of
an automated Karl Fisher titration apparatus (Mitsubishi, model CA-100). The conversion to
n-amyl levulinate was calculated using the acid number, measured with KOH titration.
The equilibrium constant, K, of the reaction of levulinic acid and n-amyl alcohol was
determined separately. The reactions were performed at temperatures between 328 K and 408
K in a small stainless steel pressure vessel of 15 mL, for a period of at least 30 days. If the
conversion did not change for 72 h equilibrium was assumed. The analysis of the water and
the products was performed as described above.
Figure 1. Lab scale pervaporation set-up.

96
The reaction of levulinic acid and n-amyl alcohol in combination with pervaporation was
performed in the set-up depicted in Figure 1. The tubular ceramic pervaporation membrane
[2] consisted of several support layers of α- and γ-alumina. The 200 nm permselective top
layer, at the outer wall of the tube, was of amorphous silica [Van Veen et al., 2001]. This
membrane, provided by ECN (Petten, The Netherlands), was chosen as it appeared to
combine high selectivities with high permeabilities [Verkerk et al., 2001]. In Table 1 an
overview is given of the dimensions of the supported membrane. The tubular ceramic
pervaporation membrane was used in a dead-end configuration in a glass reactor [1]. The
same reactor as used for the determination of the reaction kinetics was used. The reactor was
filled with an equimolar levulinic acid/n-amyl alcohol mixture. The ratio A/V in this hybrid
system was equal to 8.1 m-1 with a reaction volume of 300 mL. A total reflux condensor was
used to prevent losses of the product. The temperature in the vessel was kept constant within
0.1 K, measured with a Pt100. A vacuum pump (Edwards RV5) [4] provided the vacuum. The
permeate pressure was controlled with a needle valve and was measured with an ATM 100
mbar absolute pressure transmitter (AE Sensors). Liquid nitrogen was used as a cooling agent
for the cold traps [3], which were used alternately to collect the species at the permeate side
[5]. The amount permeated was weighed in order to calculate the flux through the membrane.
The connection from the membrane to the cold traps was thermostated to prevent
condensation. The water content of the reaction mixture and permeate were analyzed using
the automated Karl-Fischer titration apparatus (Mitsubishi, model CA-100) and by gas
chromatography, respectively. KOH titration was performed to analyze the acid content of the
reaction mixture.
Table 1. Dimensions of the alumina-supported silica membrane.
Property
Average pore diameter silica layer 0.6 nm
Thickness silica layer 200 nm
Total thickness alumina support layer 3.1 mm
Length membrane 0.055 m
Outer diameter membrane 0.014 m

97
From previous pervaporation experiments in which 2,3-butanediol/water mixtures were
separated, we know that no temperature and concentration polarization at the membrane
surface occurs. Activity coefficients are calculated using UNIFAC. Matlab [Mathworks,
1999] was used for the modeling of the reaction kinetics and the description of the hybrid
process.
Results and discussion
Determination of kinetic parameters
In Figure 2 the concentration profiles are given for the esterification at a reaction temperature
of 348 K. From the initial slope, the forward reaction rate constant, k1, has been calculated.
The forward reaction rate constant has been determined for each temperature using an initial
equimolar mixture of 3.92 mol/L for all experiments. In Figure 3 the Arrhenius plot for the
forward reaction rate constant is given. From this plot, the Arrhenius parameters, activation
energy, Ea, and the frequency factor, k0, have been calculated according to:
RTEaklnkln −= 01 (7)
From Figure 3 an activation energy of 60 kJ/mol and a frequency factor 36·103 L/(mol.min)
are obtained. These values are in good agreement with previous studies [Lehmus et al., 1999;
Lee et al., 2002].
Table 2 gives the equilibrium constant, K, determined at various temperatures. Initially, an
equimolar ratio of the reactants has been used. The equilibrium constants are calculated from
the acid content when the reaction is in equilibrium. It can be seen that with increasing
temperature, the equilibrium conversion also increases.

98
Figure 2. Concentration profiles for the esterification of levulinic acid with n-amyl alcohol at
348 K. The lines are to guide the eye.
Figure 3. Arrhenius plot of the forward reaction rate constant, k1.
0
0.5
1
1.5
2
2.5
3
3.5
4
4.5
0 100 200 300 400 500 600 700 800time (h)
conc
(mol
/L)
species L,P
species E
species W
-12
-11
-10
-9
-8
-7
-6
2.4 2.5 2.6 2.7 2.8 2.9 3 3.1
1000/T (K-1)
ln k
1 (ln
(L/(m
ol.m
in)))

99
Table 2. Esterification equilibrium constants at different temperatures.
Temperature (K) K (-)
328 2.3
348 2.9
373 3.4
398 4.1
408 4.9
Reaction combined with pervaporation
Figure 4a shows the concentration profile of the ester as a function of time for the reaction
with and without pervaporation at 348 K. Without pervaporation, equilibrium is reached after
approximately 500 h. In the case of reaction combined with pervaporation also the
concentration of water as a function of time is given. Initially, the membrane cannot remove
all the water formed. After 50 h, more water is removed by the membrane than is formed by
the reaction. From this time onwards, the backward reaction decreases because the water
concentration decreases. As a result, an increase in ester concentration is observed as
compared to the equilibrium reaction. The model predicts that even a conversion of 100% is
possible.
Figure 4b shows the concentration of n-amyl levulinate with and without pervaporation at 408
K. In the set-up without the membrane a temperature of 408 K cannot be maintained during
the reaction, because the liquid mixture starts to boil at atmospheric pressure. For the reaction
combined with pervaporation both the water concentration and the activity coefficient for
water have been plotted. Due to the fact that the water is removed by pervaporation its
concentration decreases, and a continuous increase of the activity coefficient of water is
expected. After 80 h, the activity coefficient of water is around 10.
Comparing Figures 4a and 4b it can be seen that the reaction at 408 K is much faster than the
reaction at 348 K. The conversion towards the ester with and without pervaporation and the
water concentration are modeled reasonably well for both temperatures. The concentration
profiles as a function of time are described using a value for k1 which is obtained from the
initial slope of the concentration profile and the water flux presented in Figure 5. At 408 K the
reaction without pervaporation reaches equilibrium after 40 h, according to the model
calculations. It is noted that in the model no boiling is taken into account. An equilibrium
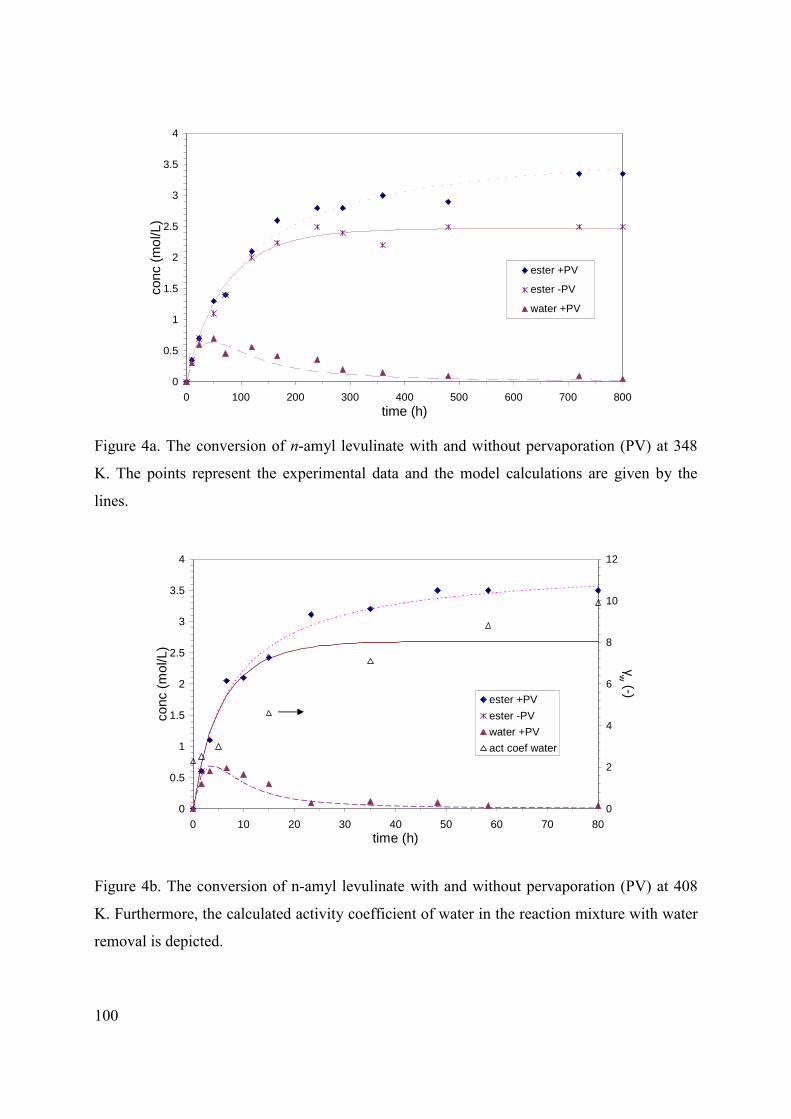
100
0
0.5
1
1.5
2
2.5
3
3.5
4
0 100 200 300 400 500 600 700 800time (h)
conc
(mol
/L)
ester +PV
ester -PV
water +PV
0
0.5
1
1.5
2
2.5
3
3.5
4
0 10 20 30 40 50 60 70 80time (h)
conc
(mol
/L)
0
2
4
6
8
10
12
γw (-)
ester +PVester -PVwater +PVact coef water
Figure 4a. The conversion of n-amyl levulinate with and without pervaporation (PV) at 348
K. The points represent the experimental data and the model calculations are given by the
lines.
Figure 4b. The conversion of n-amyl levulinate with and without pervaporation (PV) at 408
K. Furthermore, the calculated activity coefficient of water in the reaction mixture with water
removal is depicted.

101
conversion of 69 % is obtained. In the case of reaction combined with pervaporation a
monotonous increase in the concentration of the ester is observed, and after 80 h a conversion
of about 90 % is obtained.
It is seen that the concentration of the ester with and without pervaporation initially coincide
for the two temperatures. The initial slope of the concentration profiles is determined by the
reaction rate coefficient k1. This is clear from the limiting case for the reaction kinetics where
all the water is removed instantaneously i.e. CW=0. The reaction rate, Eq 1, then reduces to:
rE=k1CLCP
This implies that the removal of water only affects the (final) conversion, and not the initial
rate of reaction.
Membrane performance
The membrane performance is given by the water flux and the separation factor. The
separation factor is given by:
raa
rww
x/y
x/y=α (7)
in which y and xr are the molar fractions in the permeate and retentate, respectively. The
subscript w refers to the water and the subscript a to the other components. Usually, there is a
trade-off between the permeation and the separation factor; i.e. when one factor increases, the
other decreases. During the two esterification experiments the same silica membrane has been
used. It is noted that the membrane performance has not changed significantly over a total
period of 900 h.
In Figure 5 the water flux is depicted as a function of the driving force for water at the two
temperatures. It is seen that the water flux is linearly proportional to the driving force for
water, and the highest water flux is about 0.45 kg/(m2.h). In earlier studies a water flux of 2.4
kg/(m2.h) and a separation factor of about 2500 towards water has been obtained for the
dehydration of an isopropanol/water (95/5 wt%) mixture [Verkerk et al. 2001 and Chapter 2].
In the experiments performed in this study the separation factor appeared to be around 150.
This reduction in water flux and separation factor is most likely a result of the adsorption of
the species in the reaction mixture onto the supported silica membrane. It is also possible to

102
have a reaction between alcohols and the silica and alumina, which might reduce the
membrane performance even further.
Figure 5. The water flux as a function of the driving force for water obtained during the
pervaporation-assisted esterification.
Figure 6. Calculated conversion for the pervaporation-assisted esterification of levulinic acid
and n-amyl alcohol at three different temperatures.
0
0.1
0.2
0.3
0.4
0.5
0 0.1 0.2 0.3 0.4 0.5 0.6 0.7 0.8 0.9 1driving force for water, pw
* (.105Pa)
wat
er fl
ux (k
g/(m
2 .h))
408 K
348 K
0
20
40
60
80
100
0 10 20 30 40 50 60 70 80 90 100time (h)
conv
ersi
on (%
)
348 K
448 K
408 K

103
For this type of reactions there is a strong influence of the temperature, because the
equilibrium constant is relatively low. To illustrate this, the hybrid process is modeled at an
even higher temperature. In Figure 6 a comparison is made between the conversion at 448 K
and the two experimentally obtained results at 348 K and 408 K. The results for the
conversion at 448 K are calculated for a system where the values of k1, K and JW are
extrapolated from the data at lower temperatures. A conversion of 98% is achieved in 60 h,
instead of 400 h at 408 K.
Conclusions
It has been demonstrated that the silica membrane shows stable operation under reaction
conditions for more than 900 h, including operation at a 408 K for over 80 h. By removing the
water produced in the reaction using the supported silica pervaporation membrane, a
conversion of 100% towards the ester is possible. A theoretical model describes the reaction
kinetics for the hybrid process reasonably well using the separately determined reaction
kinetics. The reaction at a temperature of 408 K is about 14 times faster than the reaction at a
temperature of 348 K, which is mainly determined by the ratio of the forward reaction rate
constants at the two temperatures.
Acknowledgements
We gratefully thank P.P.A.C. Pex from ECN, Petten the Netherlands for providing the
ceramic pervaporation membranes. Furthermore, we thank the Dutch Polymer Institute for
their financial support.
Notation
A membrane surface area (m2)
B mobility constant (kg/(m2.min.Pa))
C concentration (mol/L)
Ea activation energy (J/mol)
k0 frequency factor (L/(mol.min))
JW water flux (mol/(m2.min1))
k reaction rate constant (L/(mol.min))

104
K equilibrium constant (-)
p0W vapor pressure of water (Pa)
p*W equilibrium vapor pressure of water (Pa)
r reaction rate (mol/(L.min))
R gas constant (J/(K.mol))
t time (min)
T temperature (K)
V reaction volume (L)
xW mol fraction of water in the retentate (mol/mol)
yW mol fraction of water in the permeate (mol/mol)
Greek letters
α separation factor (-)
γW activity coefficient of water in the retentate (-)
Subscripts and superscripts
1 forward reaction
2 backward reaction
a reaction mixture without water
E component E (n-amyl levulinate)
L component L (levulinic acid)
P component P (n-amyl alcohol)
p permeate
r retentate
W component W (water)
References
L. Domingues, F. Recasens and M.A. Larrayoz, Studies of a pervaporation reactor:
kinetics and equilibrium shift in benzyl alcohol acetylation, Chem. Eng. Sci., 54 (1999) 1461.
H.P. Hsieh, R.R. Bhave and H.L. Fleming, Microporous alumina membranes, J.
Membr. Sci., 39 (1988) 221.
J.T.F. Keurentjes, G.H.R. Jansen and J.J. Gorissen, The esterification of tartaric acid
with ethanol: Kinetics and shifting the equilibrium by means of pervaporation, Chem. Eng.
Sci., 49 (1994) 4681.

105
M-J. Lee, J-Y. Chiu and H-M. Lin, Kinetics of catalytic esterification of proponic acid
and n-butanol over amberlyst 35, Ind. Eng. Chem. Res., 41 (2002) 2882.
M.O. Lehmus, S. Toppinen, M.K. Seläntaus, N.M. Kopola and A.O.I. Krause, Kinetic
model of linear complex esterification between 2-butyl-2-ethyl-1,3-propanediol, adipic acid,
and octanoic acid, Ind. Eng. Chem. Res., 38 (1999) 4250.
Matlab, The Mathworks, Version 5.3 (1999).
H.M. van Veen, Y.C. van Delft, C.W.R. Engelen and P.P.A.C. Pex, Dewatering of
organics by pervaporation with silica membranes, Book of Abstracts, Volume 2,
Euromembrane 99, Leuven, 20-23 September 1999, Belgium, p. 209.
H.M. Van Veen, Y.C. Van Delft, C.W.R. Engelen and P.P.A.C. Pex, Dewatering of
organics by pervaporation with silica membranes, Sep. Purif. Technol., 22-23 (2001) 361.
F.M. Velterop, Pervatech bv selective ceramic membrane technology, Book of
Abstracts, Volume 2, Euromembrane 99, Leuven, 20-23 September 1999, Belgium, p. 118.
A.W. Verkerk, P. Van Male, M.A.G. Vorstman and J.T.F. Keurentjes, Description of
dehydration performance of amorphous silica pervaporation membranes, J. Membr. Sci., 193
(2001) 227.
A.W. Verkerk, P. van Male, M.A.G. Vorstman and J.T.F. Keurentjes, Properties of
high flux ceramic pervaporation membranes for dehydration of alcohol/water mixtures, Sep.
Purif. Technol., 22-23 (2001) 689.
R. Waldburger, F. Widmer and W. Heinzelmann, Kombination von Veresterung und
Pervaporation in einem kontinuierlichen Membranreaktor, Chem. Ing. Tech., 66 (1994) 850.
R.M. Waldburger and F. Widmer, Membrane reactors in chemical production
processes and the application to the pervaporation-assisted esterification, Chem. Eng.
Technol., 19 (1996) 117.
L. Xuehui and W. Lefu, Kinetic model for an esterification process coupled by
pervaporation, J. Membr. Sci., 186 (2001) 19.
Y. Zhu, R.G. Minet and T.T. Tsotis, A continuous pervaporation membrane reactor for
the study of esterification reactions using a composite polymeric/ceramic membrane, Chem.
Eng. Sci., 51 (1996) 4103.

106

107
Chapter 6
Pervaporation-assisted di-esterification of
propionic acid with 1,4-butanediol using a
temperature resistant silica membrane*
Abstract
The batch di-esterification of propionic acid with 1,4-butanediol coupled with pervaporation
has been studied. First, the reaction kinetics has been obtained, which could be described both
on a concentration and on an activity basis. In the hybrid process, studied at 398 K and 453 K
and at elevated pressures, a supported silica pervaporation membrane has been used to
remove the water formed upon reaction. At a temperature of 398 K, a reasonable description
could be given of the concentration profiles as a function of time for the hybrid process using
the reaction kinetics based on concentrations and a linear relation for the water flux as a
function of the driving force. At 453 K, however, the water concentration could not be
predicted properly. In both cases a conversion higher than the equilibrium conversion can be
obtained.
* This Chapter will be submitted as “Pervaporation-assisted di-esterification of propionic acid with 1,4-butanediol using a temperature resistant silica membrane” by A.W. Verkerk, M.A.G. Vorstman and J.T.F. Keurentjes

108
Introduction
Until now, esterification reactions have been combined only with polymeric pervaporation
membranes for the selective removal of water from the reaction mixture [Keurentjes et al.,
1994; Waldburger et al., 1994; Zhu et al., 1996; Domingues et al., 1999; Xuehui and Lefu,
2001]. A major drawback of polymeric membranes is the stability at higher temperatures. In
these studies the highest temperature used was 348 K. This implies that polymeric membranes
cannot be used for pervaporation-assisted reactions at elevated temperatures. However, from a
reaction kinetics point of view, high temperatures are often desirable. Therefore, one of the
challenges is to develop membrane reactors which have a stable performance at high
temperature and pressure.
In the previous Chapter the coupling of an esterification reaction with a pervaporation
membrane has been discussed, using the esterification of levulinic acid with n-amyl alcohol as
a model system. The process has been carried out at 348 K and 408 K and at atmospheric
pressure. For the hybrid experiments one single hydrophilic supported silica membrane could
be used as the performance of the silica membrane did not change significantly during the
reactions. In this Chapter, the feasibility of using an inorganic silica membrane as an
alternative for polymeric membranes has been studied for a pervaporation-assisted di-
esterification reaction. A closed set-up has been used, in which experiments could be
performed up to 453 K and 10·105 Pa.
Theory
The esterification of propionic acid with 1,4-butanediol can be represented schematically by
the following two reactions:
P + B ↔ ME + W (reaction 1)
P + ME ↔ DE + W (reaction 2)
where P is propionic acid, B is 1,4-butanediol, ME is mono-ester, DE is di-ester and W is
water.

109
Reaction kinetics based on concentration
We assume the reaction rate to be first order in all the reacting components, and as a reactor
configuration a batch reactor is considered. The reaction rate, r, for propionic acid is then
given by:
−+
−=
−=
22
11 K
CCCCk
KCC
CCkdt
dCr WDEMEPf
WMEBPf
PP (1)
in which:
CX concentration for component X (mol/L);
t time (min);
k forward (f) and backward (b) reaction rate constant for reaction 1 and 2, respectively
(L/(mol.min)).
The equilibrium constant, K, for each reaction is described by:
b
fkk
K1
11 = and
b
fkk
K2
22 = (2)
The reaction rate for each component is related to the temperature according to the Arrhenius
relation:
−=
RTEaexpkk 0 (3)
in which:
k0 frequency factor (L/(mol.min));
Ea activation energy (J/mol);
R gas constant (J/(mol.K));
T temperature (K).

110
Reaction kinetics based on activities
In non-ideal systems a description based on activities of each component, ai, is to be
preferred. The activity coefficient for component i, γi, is defined as:
i
ii x
a=γ (4)
with xi the mol fraction of component i.
The reaction rate for propionic acid based on activities is given by:
−+
−= '
''
'
22
11 K
CCCCk
KCC
CCkr WWDEDEMEMEPPf
WWMEMEBBPPfP
γγγγ
γγγγ (5)
When the activity coefficients do not change with the composition of the mixture, the reaction
rate and the equilibrium constant can be written as:
BP'
ff kk γγ11 = and MEP'
ff kk γγ22 = (6)
11 K'KBP
WME
=
γγγγ and 12 K'K
MEP
DEW
=
γγγγ (7)
Pervaporation-assisted reaction
From previous work [Verkerk et al., 2001 and Chapter 2] it is known that the water flux
through the silica pervaporation membrane is linearly proportional to the driving force for
water, and can be written as:
( )pW
*WW ppBJ −= (8)
in which:
JW water flux (mol/(m2.min));
B permeability constant (mol/(m2.min.Pa));
pW* partial equilibrium vapor pressure of component W in the retentate (Pa);
pWp partial pressure of component W in the permeate (Pa).

111
Under neglection of the volume change upon water removal, the mass balance for water can
now be written as:
WW
W JVA
dtdCr −
= (9)
in which:
A membrane area (m2);
V reaction volume (m3).
To express the performance of a pervaporation membrane, the separation factor, α, is
introduced:
( ) ( )rW
pW
rW
pW
m/m
m/m
−−=
11α (10)
in which mp and mr are the mass fractions of water in the permeate and retentate, respectively.
Experimental
Reagents
Propionic acid and 1,4-butanediol were of analytical grade and were obtained from Merck
(Darmstadt, Germany).
Reaction kinetics
All experiments have been performed in a fully automated set-up as depicted in Figure 1. The
whole set-up was thermostated and isolated to prevent condensation of species. During the
experiments to determine the reaction kinetics, the membrane module (7) did not contain a
membrane, and a stainless steel tube was used instead. To obtain the reaction kinetics,
experiments were performed at 398, 413, 433, and 453 K, respectively. 1,4-Butanediol was
added to a stirred reactor of 2.5 L (1) and was heated up to the desired reaction temperature.
Separately, propionic acid was heated in the supply vessel 1 (SV1). At t = 0, the propionic
acid (mass ratio propionic acid : 1,4-butanediol : water = 8.5 : 4.0 : 0.23 mol/L) was added to

112
Figure 1. Experimental set-up.
Legend
1. Reactor, Büchi 9. Vacuum pump, MZ 2C, Vacuubrand
2. Heating Unit, T326 wHT, Huber 10. Vacuum pump, RV5, Edwards
3. Stirrer, Büchi magnetic drive 300 11. Safety vessel
4. Temperature controller, Pt 100 12. Cold trap
5. Pressure controller, HEM 375, Kulite 13. Valve
6. Pump, CX28/28, Maag pump systems 14. Valve
7. Membrane module 15. Vacuum release valve
8. Pump, GA 45, Dosapro 16. Perm. pressure controller, AE Sensors
17. Waste vessel L. Level indicator
SV1. Supply Vessel 1 P. Pressure controller, HEM 375, Kulite
SV2. Supply Vessel 2 T. Temperature indicator
SV3. Supply Vessel 3
T
PT
TT
P
M
L
L
L
L L
L
P P TT
1
2
3
SV2 SV1
SV3
4
5
67
8
10
9
11
12 12
13
14 14
15 15
16
P
sample
TT
PPTTT
TTT
PP
MM
LL
LL
LL
LL LL
LL
PP PP TTTT
1
2
3
SV2 SV1
SV3
4
5
67
8
10
9
11
12 12
13
14 14
15 15
16
PP
sample
17

113
the reactor. The mixture was pumped at 7 L/min through the membrane module. To obtain
samples, the membrane module was bypassed and samples were collected in the sample loop.
The water concentration was analyzed by GC and Karl-Fisher titration, and the conversion
was determined from the acid number, measured with KOH titration and GC analysis. Since
the measured water and acid concentrations were often not in accordance with the
stoichiometry it was decided to base concentrations of all the components of the experiments
without pervaporation on the measured acid conversion. Ester concentrations were always
calculated from acid conversion and the ratio of the amounts of mono- and di-ester found
from the GC-measurement.
Reaction coupled with pervaporation
For the reaction experiments in combination with pervaporation, a tubular ceramic
pervaporation membrane was placed in the membrane module (7). The membrane consisted
of several support layers of α- and γ-alumina and was provided by ECN (Petten, The
Netherlands). The 200 nm permselective top layer, at the outer wall of the tube, was of
amorphous silica [Van Veen et al., 2001]. The pervaporation-assisted esterifications were
performed at 398 K and 453 K, respectively, and were carried out as described above. At the
permeate side of the membrane a vacuum pump (Edwards RV5) (10) provided the vacuum.
The permeate pressure was controlled with a needle valve and was measured with an ATM
100 mbar absolute pressure transmitter (AE Sensors) (16). Liquid nitrogen was used as a
cooling agent for the cold traps (12), which were used alternately to collect the permeate. The
water content of the reaction mixture and the permeate were analyzed using an automated
Karl-Fischer titration apparatus (Mitsubishi, model CA-100). The composition of the reaction
mixture at the feed and permeate side was analyzed using GC analysis.
For the description of the reaction kinetics based on activities, the activity coefficients were
calculated using the UNIFAC equation. Matlab [Mathworks, 1999] was used for the modeling
of the experiments with and without pervaporation.
Results and Discussion
Reaction kinetics based on concentrations
The concentration profiles for the reaction at 433 K are given in Figure 2. The kinetic
parameters for the reaction have been obtained from a fit of Eq. 1 to the experimental data.

114
The reaction rate constants have been determined using a Levenberg-Marquardt method in
Matlab. From Figure 2 it can be seen that the fitted kinetic parameters describe the
concentration profiles well. A similar procedure has been followed for each temperature. For
the forward reaction rates an Arrhenius plot has been constructed (Figure 3). It appears that
the results for a temperature of 413 K deviate from the linear relation. This is possibly due to
the fact that the pump capacity (6 in Figure 1) was too low during this experiment. The
reaction rate constants given in Figure 3, with the exception of the one at 413 K, are fitted to
obtain a relationship between the forward reaction rates, k1f and k2f, and the temperature. The
resulting Arrhenius parameters are given in Table 1.
Table 1. Arrhenius parameters for the reaction of propionic acid and 1,4-butanediol.
concentration based activity based
k01 (L/(mol.min)) 1.17·1010 9.05·109
k 02 (L/(mol.min)) 1.95·104 1.95·104
Ea1 (kJ/mol) 98.7 97.7
Ea2 (kJ/mol) 58.6 58.4
Figure 2. Concentration profiles at 433 K. The symbols represent the experimental data, the
lines are a fit with Eq. 1.
0
1
2
3
4
5
6
7
8
9
0 100 200 300 400 500time (min)
conc
(mol
/L)
P B ME W DE

115
Figure 3. Arrhenius plot for the forward reaction rates based on concentrations.
Figure 4. Arrhenius plot for the forward reaction rates based on activities.
Reaction kinetics based on activities
The same procedure has been used to describe the reaction kinetics using activities instead of
concentrations. For the forward reaction rates based on activities the Arrhenius plot is given
-8
-7
-6
-5
-4
-3
-2
2.1 2.2 2.3 2.4 2.5 2.61000/T (K-1)
ln k
(ln(
L/(m
ol.m
in)))
k1f'
k2f'
-8
-7
-6
-5
-4
-3
-2
2.1 2.2 2.3 2.4 2.5 2.6
1000/T (K-1)
ln k
(ln(
L/(m
ol.m
in)))
k1f
k2f

116
in Figure 4. As can be seen in Table 1, the Arrhenius parameters based on activities have
about the same values as the Arrhenius parameters based on concentrations. This is mainly
because the activity coefficients are almost constant during the reaction. Therefore, the use of
activities does not improve the description of the (measured) concentration profiles. In
conclusion, for this reaction system the results are described equally well on a concentration
and on an activity basis. In the following, therefore, the reaction kinetics based on
concentrations will be used to describe the experiments combined with pervaporation.
Reaction combined with pervaporation
Only two experiments for the reaction of propionic acid and 1,4-butanediol combined with
pervaporation have been performed at 398 K and 453 K, respectively. For each experiment a
new membrane has been used. In Figure 5 the concentration profiles are given for the reaction
at 398 K with pervaporation (closed symbols) and without pervaporation (open symbols).
From a comparison of the concentration profiles obtained with and without pervaporation, an
increased conversion in the initial part of the experiment with pervaporation compared to the
experiment without pervaporation is observed. Part of the difference can be explained,
because in the initial stage of the experiment without pervaporation, the temperature was
lower than reaction temperature. The reason for the remaining part is not clear; one could
think of some liquid remains in the installation from a previous experiment.
In the case of the pervaporation-assisted reaction, the water concentration first increases, as
more water is formed during the reaction than there is removed by the silica membrane. After
100 minutes the water concentration starts to decrease. The fact that the concentration profile
of propionic acid with pervaporation decreases monotonously indicates that the conversion
still increases after 500 minutes.
The concentration profiles of the reactions carried out at 453 K are given in Figure 6. Initially,
the membrane cannot remove all the water formed, and after about 100 minutes the water
removal begins to exceed the water production. For the experiment without pervaporation,
equilibrium is reached after about 200 minutes. For the experiment with pervaporation, the
concentration of propionic acid decreases during the whole experiment. It can be concluded
that the equilibrium conversion belonging to the initial composition is exceeded in the
pervaporation-assisted esterificiation reaction.
When comparing the concentration profiles for water obtained with pervaporation, the
profiles at the two temperatures show a similar behavior. In both cases, the maximum in the

117
water concentration occurs at about 100 minutes. Therefore, it is interesting to compare the
membrane performance at the two temperatures in more detail.
Figure 5. Concentration profiles of water and propionic acid obtained at 398 K with and
without pervaporation.
Figure 6. Concentration profiles of water and propionic acid obtained at 453 K with and
without pervaporation.
Membrane performance
The performance of the silica membrane is a combination of the water flux and the selectivity.
In Figure 7 the water flux is given as a function of the time for both temperatures. At 398 K a
0
1
2
3
4
5
6
7
8
9
0 100 200 300 400 500 600time (min)
conc
pro
pion
ic a
cid
(mol
/L)
0
1
2
3
4
5
6conc w
ater (mol/L)
P without PV
P with PV
W without PV
W with PV
0
1
2
3
4
5
6
7
8
9
0 100 200 300 400 500time (min)
conc
pro
pion
ic a
cid
(mol
/L)
0
1
2
3
4
5
6
conc water (m
ol/L)
P without PVP with PVW without PVW with PV

118
0
1
2
3
4
5
6
7
0 100 200 300 400 500 600time (min)
wat
er fl
ux (k
g/(m
2 .h)) 398 K
453 K
maximum water flux of 2.5 kg/(m2.h) is observed. After this maximum the water flux slowly
decreases. At 453 K the membrane removes a large amount of water initially, up to 6
kg/(m2.h). Then the water flux drops and becomes more or less constant. After 250 minutes
the water flux decreases slowly. The selectivity, given by Eq. 10, is depicted in Figure 8 as a
function of time for the two experiments. At 398 K, the selectivity during the experiment is
always lower than 10. At 453 K, the selectivity is initially around 125 and decreases sharply
as a function of time.
Figure 7. Water flux through the pervaporation membrane during reaction.
Figure 8. Separation factor for the pervaporation membrane during reaction.
0
20
40
60
80
100
120
140
0 100 200 300 400 500 600time (min)
sepa
ratio
n fa
ctor
(-) 398 K
453 K

119
According to Eq. 8, the water flux is proportional to the driving force for water. In an earlier
study in which isopropanol was dehydrated with the same type of membrane [Verkerk et al.
2001 and Chapter 2] a general relation for the water flux was obtained:
( )pW
*WW ppBJ −=
This relationship was confirmed for a maximum driving force for water of 20 kPa, and covers
the temperature range of 303 K up to 353 K and water fractions between 1 and 95 wt%. For
this temperature range the water flux can be described with a single mobility constant, B. This
mobility constant for water is independent of the temperature, which implies that the product
of the Henry adsorption coefficient and the diffusion coefficient is constant. In Figure 9 the
water fluxes in the hybrid process for the two experiments performed are given as a function
of the driving force for water. A comparison is made with the linear relation for the water flux
obtained for the dehydration of isopropanol, using a mobility constant B = 1.4·10-4
(kg/(m2.h.Pa)). During the hybrid process the driving force for water is about 100 kPa at 398
K and between 600 and 800 kPa at 453 K, respectively. The experimental water fluxes are
between 1 to 6 kg/(m2.h) for both cases. Compared to the water flux in the isopropanol/water
system, the measured water fluxes at the two reaction temperatures are considerably lower
than the linear relation predicts.
Figure 9. Water flux as a function of the driving force for water at 398 and 453 K compared to
the relation from Chapter 2.
0
1
2
3
4
5
6
7
0 100 200 300 400 500 600 700 800 900
driving force (kPa)
wat
er fl
ux (k
g/(m
2 .h))
398 K
453 K
IPA 333 K

120
Furthermore, it is noted that for the dehydration of isopropanol the separation factor based on
mass fractions is considerably higher than 1000. By taking both the behavior for the water
flux and the separation factor into account the water flux and the separation factor are much
lower than expected in both experiments. This indicates that non-water components permeate
through the membrane as well.
The increase in permeation of the hydrophobic components and the decrease of water
permeability could be explained by the chemisorption of alcohol onto the selective silica layer
and the supporting layers [Font et al., 1996; Dafinov et al., 2002]. The alcohol can be bonded
to the ceramic membrane covalently, whereby the alcohol imparts hydrophobic characteristics
to the membrane surface. Due to this mechanism, the water flux will be reduced and the flux
of the more hydrophobic organic species will increase. This can explain the low water flux as
well as the low separation factor.
Despite the non-selective permeability performance of the membrane, in Figure 10 the
concentration profiles for the hybrid processes are predicted with the reaction kinetics of
Table 1 and Eq. 8, using a constant mobility for water of B = 1.4·10-5 (kg/(m2.h.Pa)). In
Figure 10a the obtained concentration profiles in combination with pervaporation at 398 K are
predicted.
Figure 10a. Comparison of concentration profiles for the reaction at 398 K with and without
pervaporation. The lines are predicted concentration profiles for the reaction with
pervaporation.
0
1
2
3
4
5
6
7
8
9
0 100 200 300 400 500 600time (min)
conc
(mol
/L)
P with PV
W without PV
DE with PV
W with PV

121
Figure 10b. Comparison of concentration profiles for the reaction at 453 K with
pervaporation. The lines are predicted concentration profiles for the reaction with
pervaporation.
Figure 10c. Calculated concentration profiles for the reaction at 453 K with pervaporation.
0
1
2
3
4
5
6
7
8
9
0 100 200 300 400 500time (min)
conc
(mol
/L)
P
W
DE
0
1
2
3
4
5
6
7
8
9
0 1000 2000 3000 4000 5000 6000time (min)
conc
(mol
/L)
water di-ester
propionic acid

122
For all components a reasonable agreement is obtained between the model and the
experimental results. However, as can be seen in Figure 10b, at 453 K the water concentration
as a function of the time cannot be predicted with a constant mobility factor, while the other
species are reasonably well described. In Figure 10c the concentrations of the di-ester,
propionic acid and water are given as a function of the time up to 6000 minutes. Although the
water is removed relatively fast, it still takes a considerable amount of time to obtain a
complete conversion. For the hybrid process, at 453 K, a conversion of di-ester based on 1,4-
butanediol of 97.5% will be reached after 6000 minutes. The final conversion is
predominantly determined by the forward reaction rate constants.
Conclusions
For the reaction system studied, propionic acid and 1,4-butanediol, the reaction kinetics can
be described equally well by using concentrations or activities. The concept of obtaining a
conversion higher than the equilibrium conversions by removing water by pervaporation is
demonstrated. The concentration profiles obtained for the hybrid process at 398 K can be
predicted reasonably well using the reaction kinetics combined with a linear dependence
between the water flux and its driving force. The stability of the membrane in the reacting
system becomes an issue at both temperatures studied. At these temperatures the membrane
performance is low in terms of water flux and separation factor.
Notation ai activity of component i (-) A membrane area (m2) B permeability constant for water (mol/(m2.min.Pa)) C concentration (mol/L) Ea activation energy (J/mol) JW water flux (mol/(m2.min)) k reaction rate constants (L/(mol.min)) k0 frequency factor (L/(mol.min)) K equilibrium constant (-) mi mass fraction of component i (kg/kg) pW
* partial equilibrium vapor pressure of component W at the retentate (Pa)

123
pWp partial pressure of component W at the permeate (Pa)
R gas constant (J/(mol.K)) t time (min) T temperature (K) V reaction volume (m3) xi mol fraction of component i at the feed side (mol/mol) Greek letters
α separation factor (-) γi activity coefficient for a component i (-) Subscripts and superscripts 1,2 reaction 1 and 2 b backward B 1,4-butanediol DE di-ester f forward ME mono-ester p permeate P propionic acid r retentate W water References
A. Dafinov, R. Garcia-Valls and J. Font, Modification of ceramic membranes by alcohol
adsorption, J. Membr. Sci., 196 (2002) 69.
L. Domingues, F. Recasens and M.A. Larrayoz, Studies of a pervaporation reactor:
kinetics and equilibrium shift in benzyl alcohol acetylation, Chem. Eng. Sci., 54 (1999) 1461.
J. Font, R.P. Castro and Y. Cohen, On the loss of hydraulic permeability in ceramic
membranes, J. Colloid Interface Sci., 181 (1996) 347.
J.T.F. Keurentjes, G.H.R. Jansen and J.J. Gorissen, The esterification of tartaric acid
with ethanol: Kinetics and shifting the equilibrium by means of pervaporation, Chem. Eng.
Sci., 49 (1994) 4681.
Matlab, The Mathworks, Version 5.3 (1999).
H.M. Van Veen, Y.C. Van Delft, C.W.R. Engelen and P.P.A.C. Pex, Dewatering of
organics by pervaporation with silica membranes, Sep. Purif. Technol., 22-23 (2001) 361.

124
A.W. Verkerk, P. Van Male, M.A.G. Vorstman and J.T.F. Keurentjes, Description of
dehydration performance of amorphous silica pervaporation membranes, J. Membr. Sci., 193
(2001) 227.
R. Waldburger, F. Widmer and W. Heinzelmann, Kombination von Veresterung und
Pervaporation in einem kontinuierlichen Membranreaktor, Chem. Ing. Tech., 66 (1994) 850.
L. Xuehui and W. Lefu, Kinetic model for an esterification process coupled by
pervaporation, J. Membr. Sci., 186 (2001) 19.
Y. Zhu, R.G. Minet and T.T. Tsotis, A continuous pervaporation membrane reactor for
the study of esterification reactions using a composite polymeric/ceramic membrane, Chem.
Eng. Sci., 51 (1996) 4103.

125
Chapter 7
Use of silica membranes in novel membrane
reactor applications*
Abstract
In this Chapter a number of strategies for carrying out separations and reactions using
inorganic membranes is discussed for gas, liquid and supercritical systems. Some ideas about
integrating catalysis into the systems described in Chapters 5 and 6 will be presented. As an
example, the use of a heterogeneous catalyst for a pervaporation-assisted esterification
reaction is discussed. In the last section, an example is given where a homogeneous
hydrogenation reaction is carried out in supercritical carbon dioxide. In this case, the silica
membrane is used to localize the homogeneous catalyst at the feed side of the membrane.
* Parts of this chapter have been published in Angewandte Chemie International Edition 40 (2001) 4473-4474, “Homogeneous reactions in supercritical carbon dioxide using a catalyst immobilized by a microporous silica membrane” by L.J.P. van den Broeke, E.L.V. Goetheer, A.W. Verkerk, E. de Wolf, B.-J. Deelman, G. van Koten and J.T.F. Keurentjes; Langmuir 18 (2002) 6807-6812, “Permeation of carbon dioxide through a microporous silica membrane at subcritical and supercritical conditions” by A.W. Verkerk, E.L.V. Goetheer, L.J.P. van den Broeke and J.T.F. Keurentjes; and submitted to Journal of Catalysis, “Homogeneous reactions in supercritical carbon dioxide using a catalyst immobilized by a microporous silica membrane” by L.J.P. van den Broeke, E.L.V. Goetheer, A.W. Verkerk and J.T.F. Keurentjes

126
Membrane reactors
In this thesis the application of silica membranes in separations and hybrid reactor systems
has been explored. The main focus of the research has been on the combination of
esterification reactions with pervaporation for the simultaneous removal of water by the silica
membrane. First the transport properties of the silica membrane has been studied. Secondly,
the reaction kinetics for mono- and di-esterification reactions has been determined, and finally
the transport and reaction kinetics have been combined.
The dehydration performance of the silica pervaporation membranes is described using
isopropanol/water mixtures as a model system. The membranes are provided by ECN (Petten,
The Netherlands) and consist of a water-selective amorphous silica top layer and four alumina
supporting layers. For the system investigated, these membranes appear to combine high
selectivities with high water permeabilities.
To obtain an improved insight in the transport through the silica membrane, permeation
experiments have been performed with various gases using membranes with and without the
selective silica top layer. From the permeation behavior of adsorbing gases and non-adsorbing
helium it can be concluded that the mass transport through the microporous silica top layer
takes place by two different activated mechanisms, i.e. micropore diffusion and activated
gaseous diffusion. These insights are used to describe the membrane performance, i.e. the
mass transport and separation, for water/isopropanol mixtures. For this purpose, diffusion and
equilibrium adsorption data have been taken into account using the Maxwell-Stefan theory.
The mass transport in the supported membrane is described by a combined model taking
micropore diffusion and activated gaseous diffusion into account.
The principle of pervaporation-assisted esterification reactions is demonstrated for the batch
mono esterification of levulinic acid with n-amyl alcohol. For this hybrid system, the
esterification reaction has been studied below and above the boiling point of water. All
experiments were performed at atmospheric conditions and could be described with a model
combining reaction kinetics and the membrane transport.
The hybrid system has also been used at industrial reaction conditions. The batch di-
esterification of propionic acid with 1,4-butanediol coupled with pervaporation has been
carried out up to a temperature of 453 K and at pressures up to 10·105 Pa. For this system, it
has been demonstrated that it is possible to obtain a conversion higher than the equilibrium
conversion. One of the issues is that the stability of the membrane changes during the
reactions. This implies that further research is required with respect to the membrane
performance in aqueous and/or organic environments.

127
In this Chapter, two applications of the silica membrane reactor will be discussed. First, the
possible use of a membrane reactor with a heterogeneous catalyst is explored. The catalyst
can be used as a packed bed or as an additional layer on top of the water selective layer of the
membrane. Second, the use of the silica membrane for the regeneration of carbon dioxide at
supercritical conditions is studied. As an example, a homogeneous catalyzed hydrogenation
reaction in supercritical carbon dioxide is studied, where the catalyst is retained at the feed
side of the silica membrane.
Pervaporation membrane reactor
Heterogeneous catalyst as packed bed
The forward reaction rate of the esterification reactions has the largest influence on the
conversion. Therefore, the use of heterogeneous catalysis seems a logical solution to increase
the reaction rate. For esterification reactions various acid catalysts are available, including
titanium oxide, zirconium oxide, aluminum oxide and different zeolites. These catalysts can
be used as particles or pellets in packed beds or as an additional layer in catalytic membrane
reactors. In the following these two modes of operation will be evaluated. In principle, there
are three options to use heterogeneous catalysts in a packed-bed in combination with a
pervaporation membrane. Note that the selective layer of the membrane is at the feed side.
The first option is given in Figure 1a, where the packed-bed is considered as a separate
reactor. In the second and the third option, the catalyst is packed directly in the membrane
module. In this case, there are two possibilities. The catalyst can be placed at the outside of
the membrane (see Figure 1b), or the catalyst can be placed inside the tubular membrane
(Figure 1c).
Figure 1a. A packed-bed reactor for an esterification reaction in combination with a
pervaporation membrane.
Reactor Membrane module
Water
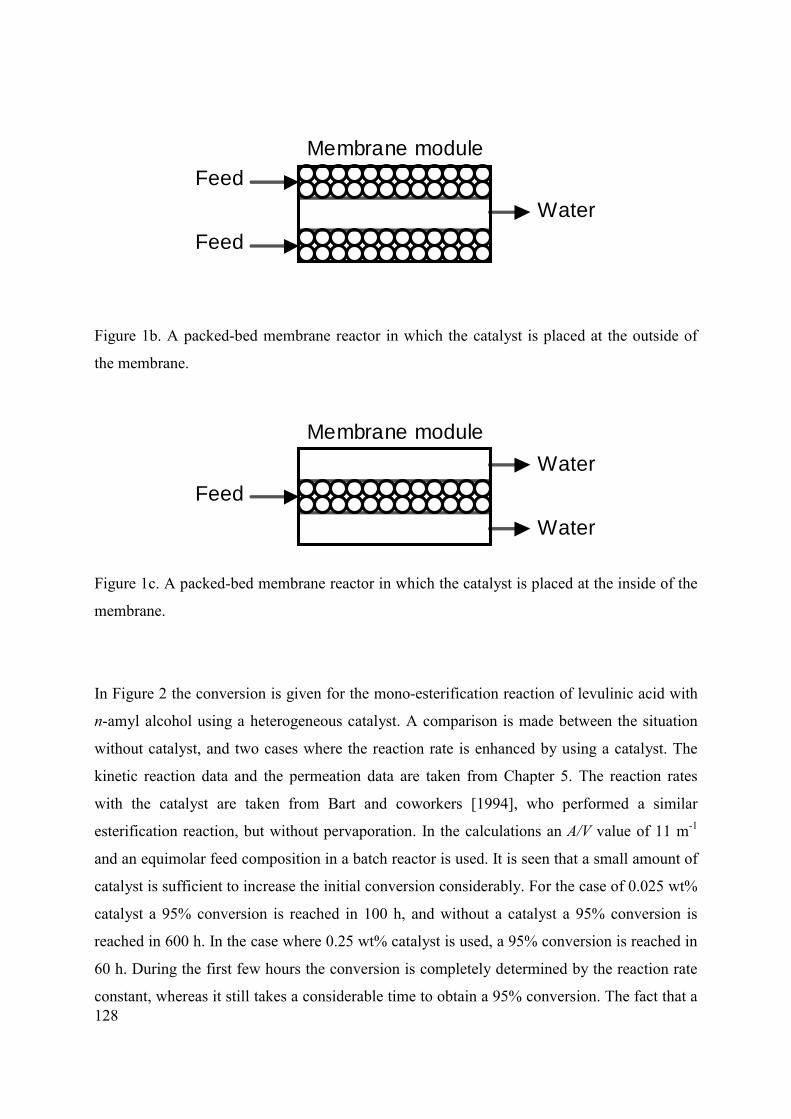
128
Figure 1b. A packed-bed membrane reactor in which the catalyst is placed at the outside of
the membrane.
Figure 1c. A packed-bed membrane reactor in which the catalyst is placed at the inside of the
membrane.
In Figure 2 the conversion is given for the mono-esterification reaction of levulinic acid with
n-amyl alcohol using a heterogeneous catalyst. A comparison is made between the situation
without catalyst, and two cases where the reaction rate is enhanced by using a catalyst. The
kinetic reaction data and the permeation data are taken from Chapter 5. The reaction rates
with the catalyst are taken from Bart and coworkers [1994], who performed a similar
esterification reaction, but without pervaporation. In the calculations an A/V value of 11 m-1
and an equimolar feed composition in a batch reactor is used. It is seen that a small amount of
catalyst is sufficient to increase the initial conversion considerably. For the case of 0.025 wt%
catalyst a 95% conversion is reached in 100 h, and without a catalyst a 95% conversion is
reached in 600 h. In the case where 0.25 wt% catalyst is used, a 95% conversion is reached in
60 h. During the first few hours the conversion is completely determined by the reaction rate
constant, whereas it still takes a considerable time to obtain a 95% conversion. The fact that a
Membrane module
WaterFeed
Feed
Membrane module
WaterFeed
Water

129
conversion higher than the equilibrium conversion of about 63% is obtained is a result of the
water removal by the membrane.
Figure 2. The calculated conversion of the catalyzed pervaporation-assisted esterification
reaction of levulinic acid with n-amyl alcohol at 373 K.
In Figure 3, the principle of a catalytic membrane reactor is schematically given. The
membrane module consists of several hollow fiber pervaporation membranes. On the support
of each fiber the water selective silica layer is deposited and on top of this silica layer the
catalytic layer is deposited. In this way, the water is directly removed at the place where it is
produced. The permselective layer should be as thin as possible in order to have good mass
transport. The catalytic layer, however, should have sufficient active sites. Therefore, for the
thickness of the catalytic layer there will be an optimum. There are two ways to deposit the
selective layer and the catalytic layer on a porous support. The first method is based on
chemical vapor deposition (CVD) [Brinkman et al., 1993]. A second method is chemical
vapor infiltration (CVI). Then the catalytic layer is deposited on a coarse support, and
subsequently the water selective layer is placed at the interface between the support and the
catalytic layer.
An alternative could be a membrane reactor in which the membrane itself is catalytically
active, e.g. by growing of a zeolite layer on a support. A restriction for an additional catalytic
0
25
50
75
100
0 10 20 30 40 50 60t (h)
conv
ersi
on (%
)
0.025 wt% catalyst
no catalyst
0.25 wt% catalyst

130
F
RP
P
catalytic layer
support
selective layer hollow fiber module
F
RP
P
catalytic layer
support
selective layer hollow fiber module
layer is, however, that both reactants and products should be able to diffuse through the
catalytic layer. For this purpose, the catalytic layer should preferably be mesoporous.
Figure 3. Catalytic pervaporation membrane.
Ceramic membranes
There are two main options to improve the overall performance of pervaporation-assisted
reactions. The first option is to use a newly developed (inorganic) membrane, which
combines a high water flux with a high selectivity. For example, the existing silica
membranes could be optimized in terms of pore size (distribution) and hydrophobicity. For
this purpose, different methods to optimize the sol-gel technique are described in literature
[Nair et al., 1998; Tsai et al., 2000].
The second option is to increase the membrane area per reactor volume, represented by A over
V. This can be done by using hollow fibers instead of tubular membranes. In Figure 4 an
example is given for three different values of A/V. The reaction kinetics at 453 K as
determined in Chapter 6 is used. By increasing A/V a higher conversion is obtained in a
shorter time. With an A/V of 5.5 m-1, a yield of 95% is achieved after 100 h. If the A/V is
increased to 143, a yield of 95% can be obtained within 13.5 h. The time to reach a yield of
95% for the three A/V ratios is given in Table 1. The effect of the A/V is clearly seen in Figure
4.
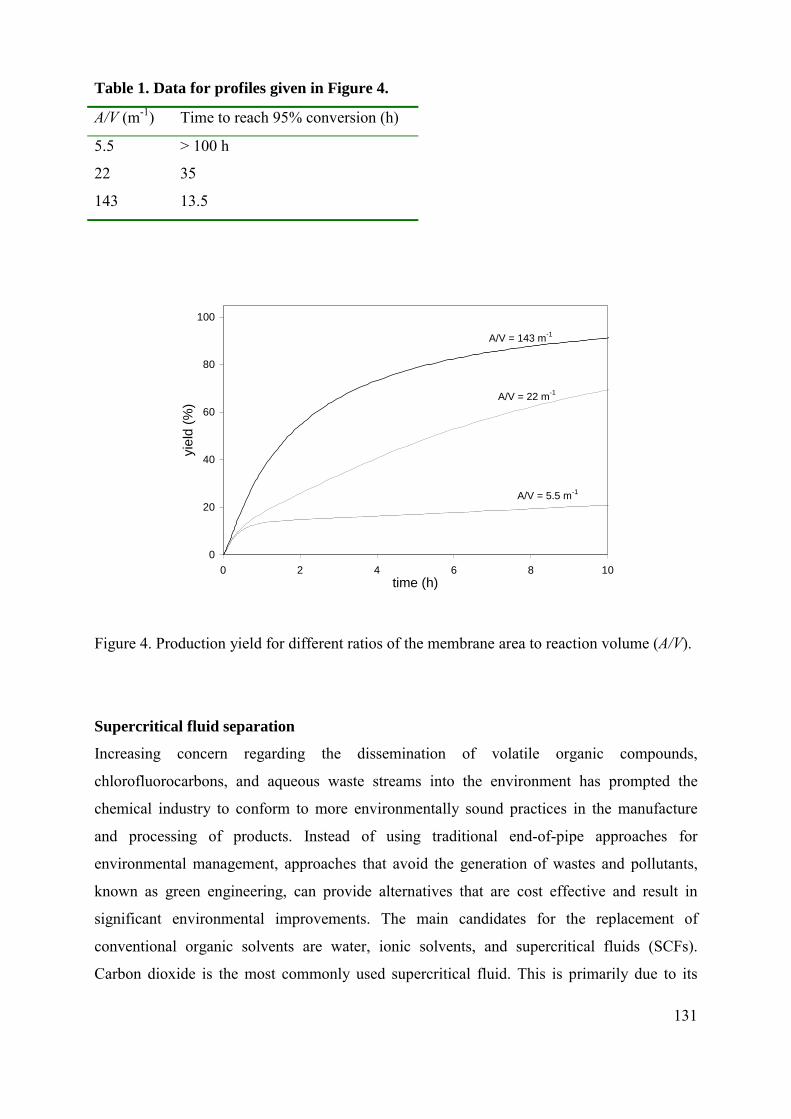
131
Table 1. Data for profiles given in Figure 4.
A/V (m-1) Time to reach 95% conversion (h)
5.5 > 100 h
22 35
143 13.5
Figure 4. Production yield for different ratios of the membrane area to reaction volume (A/V).
Supercritical fluid separation
Increasing concern regarding the dissemination of volatile organic compounds,
chlorofluorocarbons, and aqueous waste streams into the environment has prompted the
chemical industry to conform to more environmentally sound practices in the manufacture
and processing of products. Instead of using traditional end-of-pipe approaches for
environmental management, approaches that avoid the generation of wastes and pollutants,
known as green engineering, can provide alternatives that are cost effective and result in
significant environmental improvements. The main candidates for the replacement of
conventional organic solvents are water, ionic solvents, and supercritical fluids (SCFs).
Carbon dioxide is the most commonly used supercritical fluid. This is primarily due to its
0
20
40
60
80
100
0 2 4 6 8 10time (h)
yiel
d (%
)
A/V = 5.5 m-1
A/V = 143 m-1
A/V = 22 m-1

132
reasonable low critical temperature and pressure (304 K and 73.8⋅105 Pa), low cost, non-
flammability, and non-toxicity.
The permeation of supercritical carbon dioxide through inorganic membranes is interesting
from both a fundamental and a practical point of view. One of the main issues in high-
pressure applications is the regeneration of the supercritical fluid [McHugh and Krukonis,
1994; Marr and Gamse, 2000]. To remove small species from supercritical fluids the system
has to be depressurized to gaseous conditions. The subsequent compression to supercritical
conditions is the most energy consuming step [Marr and Gamse, 2000]. The use of
microporous inorganic membranes is a way to circumvent the depressurization.
We propose membranes to separate small species, like micelles and homogeneous catalysts,
from carbon dioxide while the supercritical conditions are maintained. The carbon dioxide
will permeate through the membrane and the small species dissolved in the carbon dioxide,
which have a size larger than the pores of the membrane, will be retained. In order to have a
reasonable flux of carbon dioxide, the driving force for permeation through the membrane
now determines the pressure drop.
Transport phenomena in microporous materials have extensively been studied for the
diffusion of gaseous species in materials such as zeolites and carbon molecular sieves [Kärger
and Ruthven, 1992; see also Chapter 3]. However, almost no studies are available dealing
with the diffusion in microporous materials at supercritical conditions. Only a number of
studies address the equilibrium adsorption in inorganic materials at elevated pressures
[Vermesse et al., 1996; Humayun and Tomasko, 2000].
So far, predominantly organic and polymeric membranes have been used for supercritical
separation processes [Semanova et al., 1992; Ohya et al., 1994; Sarrade et al., 1996; Alpers et
al., 1999]. Polymeric membranes have the disadvantage of swelling in carbon dioxide. As a
result often a hysteresis effect is observed in the amount solubilized in the polymer membrane
when the pressure is changed [Sarrade et al., 1996].
Inorganic membranes can withstand harsh chemical environments, high temperatures and
pressures, without a noticeable change in transport properties. Besides zeolite and carbon
membranes a number of other materials are available as microporous membranes, including
silica and activated alumina [Semanova et al., 1992; Ohya et al., 1994; Sarrade et al., 1996;
Alpers et al., 1999; Ruthven, 1984; Hsieh et al., 1988; Hassan et al., 1995; Bein, 1996;
Katsaros et al., 1997; Koukou et al., 1999; Poshusta et al., 1999]. Katsaros et al. [1997]
studied the permeation of pure helium and pure carbon dioxide through carbon membranes

133
with a pore size of 0.7 nm, up to pressures of 6⋅106 Pa. As a function of the pressure a clear
maximum in the carbon dioxide permeance was observed between 3⋅106 and 4⋅106 Pa. For
pressures above 4⋅106 Pa the carbon dioxide flux decreases. This makes this type of
membranes less suited for applications with supercritical carbon dioxide.
Another group of inorganic membranes with favorable characteristics for use in supercritical
applications are silica membranes. Silica has a low affinity for hydrophobic compounds, and
carbon dioxide does not adsorb too well on microporous silica, as compared to silicalite-1
zeolite or microporous and activated carbons [Humayun and Tomasko, 2000]. For high
pressure applications it is advantageous that the carbon dioxide is weakly adsorbed in the
microporous silica membrane. In general, adsorption in microporous materials is given by a
type I isotherm [Ruthven, 1984]. This type of adsorption is characterized by a plateau at high
pressures, the so-called saturation capacity. For supercritical applications with microporous
membranes it is important to have a reasonable driving force across the membrane at high
pressures. This means that even at high pressures the membrane material should not be
saturated with carbon dioxide. If at both sides of the membrane the amount adsorbed is equal
to the saturation capacity no permeation occurs.
In the next section single-component permeation of carbon dioxide through the ECN alumina-
supported silica membrane at supercritical conditions will be discussed.
Permeation of CO2
A number of permeation experiments using CO2 have been performed with both the
temperature and the pressure above the critical point. The same experimental set-up and
experimental procedure has been used as described in Chapter 3. The transient profiles
obtained at 313 K and with both the feed and permeate pressure above the critical pressure are
given in Figure 5. At the supercritical conditions studied the approach to equilibrium
increases with an increase in the feed-side pressure. The permeate pressure reaches steady
state after 100 to 150 s. It should be noted that there is a relatively large change in the density
for the experiment with the feed pressure of 124.9⋅105 Pa and the initial permeate pressure of
98.7⋅105 Pa as compared to the experiments at higher pressures. The fluxes calculated from
the profiles in Figure 5 increase more or less linearly with the pressure difference across the
membrane.

134
0
0.2
0.4
0.6
0.8
1
0 25 50 75 100 125t (s)
p N(-)
p: 98.7->124.9p:124.9->147.1p:147.5->172.1p:172.2->197.5Model
CO2; T=313Kp (105 Pa)
Permeance and mass transfer of CO2
The permeation results obtained with the microporous silica membrane cover a large pressure
range. From the results presented in Figure 5 it follows that the permeation is a function of the
feed-side pressure. For all cases the approach to equilibrium increases with an increase in the
feed-side pressure. However, the permeation coefficient is more or less independent of the
pressure difference across the membrane.
Figure 5. Transient profiles for the permeation of supercritical carbon dioxide. Normalized
pressure, pN, (see eq.7 in Chapter 3) as a function of time.
The fact that there is almost no effect of the pressure difference on the permeation behavior
makes a comparison of the mass transport of carbon dioxide through the silica membrane at
different pressures and temperatures possible. The mass transfer coefficient is calculated with
( )pfp ppk
dtdp
−= (1)
with pf and pp the pressure at the feed and permeate side, respectively, t the time, and k the
mass transfer coefficient. The results for the mass transfer coefficient are given in Figure 6 as

135
0
0.005
0.01
0.015
0 1 2 3 4 5 6pf (MPa)
k (1
/s)
T = 296 K
T = 313 K
T = 358 K
CO2
0
0.05
0.1
0.15
0.2
0 5 10 15 20pf (MPa)
k (1
/s)
T = 296 KT = 313 KT = 358 K
CO2
a function of the pressure at the feed-side. It is assumed that along the length of the membrane
the pressure of carbon dioxide is constant at both sides of the membrane.
Figure 6a. Mass transfer coefficient as a function of the feed pressure, up to 6 MPa.
Figure 6b. Mass transfer coefficient as a function of the feed pressure, up to 20 MPa.

136
For the three different temperatures (296, 313 and 358 K) the mass transfer coefficient
increases with the feed-side pressure. However, there is a different behavior for a pressure
below or above the critical pressure. In Figure 6a it is seen that below the critical pressure the
mass transfer coefficient is more or less independent of the temperature. The mass transfer
coefficient first increases with the pressure and becomes constant between 3⋅106 and 6⋅106 Pa.
Above the critical pressure, see Figure 6b, the mass transfer again increases with the feed
pressure, and the mass transfer coefficient also depends on the temperature. The strongest
increase in the rate constant is observed for the lowest temperature. With an increase in
temperature the relative increase in the mass transfer coefficient becomes smaller. When it is
assumed that there is only one mechanism for mass transport, the mass transfer coefficient
would increase monotonously with an increase in temperature and amount adsorbed [Fletcher
and Thomas, 1999]. Different mechanisms seem to contribute to the mass transport through
the supported silica membrane. Based on the results of Chapter 4 a possible mechanism could
be a combination of micropore diffusion and activated gaseous transport.
However, the transient permeation of carbon dioxide can be described by a simple “rate-
equation model” for a feed pressure between 1⋅105 and 200⋅105 Pa. The result for the mass
transfer coefficient at 2.0⋅107 Pa and 358 K corresponds with a value for the permeance of
8.0⋅10-8 mol m-2 s-1 Pa-1. The fact that carbon dioxide has a permeance through this type of
silica membranes opens the way to economically viable regeneration of liquid and
supercritical carbon dioxide.
Permeation of IPA/CO2 mixture
A mixture of CO2 and IPA (mol fraction IPA: 0.08) at 20 MPa and 353 K has been used in
order to evaluate the binary permeation behavior. The experimental set-up and procedure for
the transient measurement is the same as described in Chapter 3. The results are compared
with the pure CO2 transient experiment at the same conditions. From the transient profiles
(Figure 7) it can be seen that a small amount of IPA has a major influence on the permeation
behavior of CO2. In the mixture it takes about 100 times longer for CO2 to reach equilibrium.
The IPA seems to block both type of pores of the silica layer (see also Chapters 3 and 4). This
means that some adsorption of IPA takes place, which is in accordance with the equilibrium
adsorption isotherm (see Figure 3, Chapter 4).

137
Figure 7. Transient profiles at 353K for the permeation of scCO2 and a mixture of scCO2/IPA.
SCF membrane reactor
Although homogeneous catalysis offers many advantages over heterogeneous catalysis in
terms of catalytic selectivity and activity, the difficult separation of the catalyst from the
products and the use of environmentally harmful organic solvents are two major drawbacks
[Jessop et al., 1999; Adams, 2000]. The problem of catalyst separation has been addressed by
several groups and a number of new concepts for immobilization of homogeneous catalysts
have been developed [Herrmann and Kohlpainter, 1993; Knapen et al., 1994; Petrucci and
Kakkar, 1996; De Wolf et al., 1999]. With respect to the use of more environmentally-
friendly solvents, the application of high-density gases such as supercritical carbon dioxide
has some clear advantages [Jessop and Leitner, 1999; Adams, 2000, Wells and DeSimone,
2001; Lin and Akgermann, 2001]. Supercritical solvents are completely miscible with
gaseous reagents, and, therefore, avoiding possible diffusion limitation in gas–liquid
reactions. An important issue for successful operation of homogeneous catalysis in scCO2 is
the solubility of the catalyst, which can be achieved by attaching perfluoroalkyl groups to the
ligands [Kainz et al., 1997].
In this Chapter, a solution is presented that overcomes the two major drawbacks associated
with homogeneous catalysis. The solution consist of a continuous reactor for homogeneous
catalysis in scCO2 with an integrated catalyst separation by immobilization of a
18.5
19.0
19.5
20.0
20.5
21.0
21.5
0 5 10 15t (s)
p (M
Pa)
CO2/IPA (t*100)
CO2
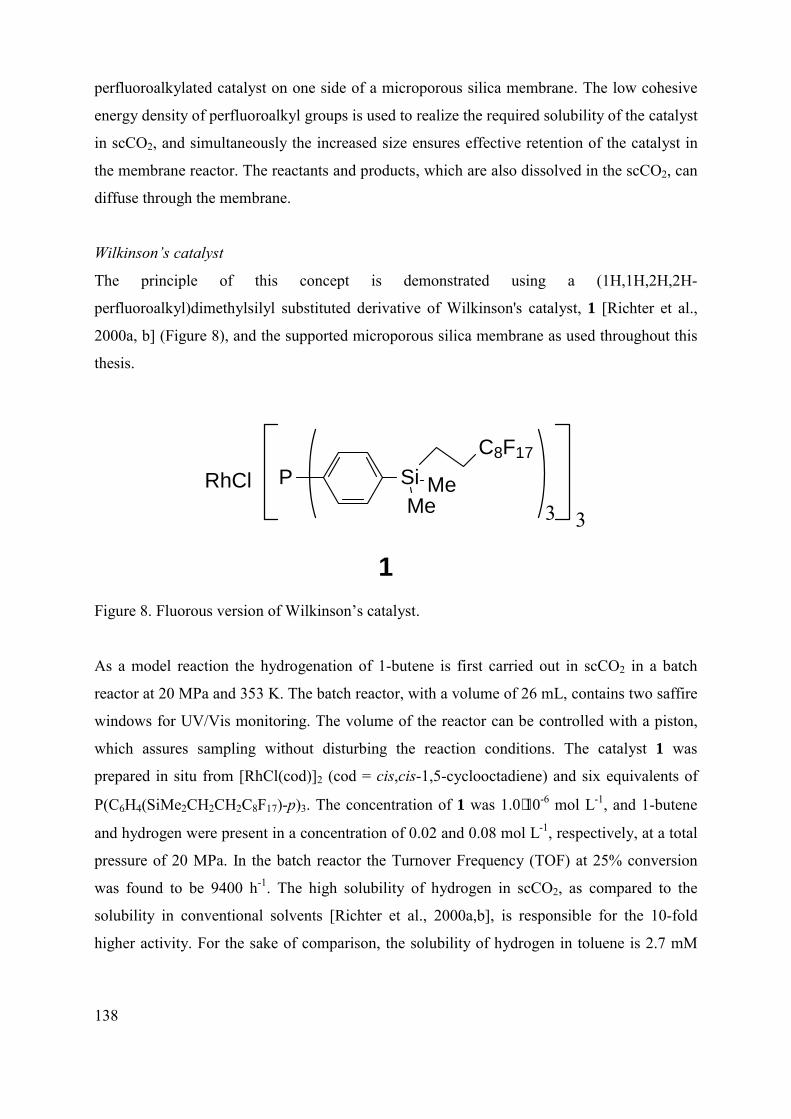
138
RhCl
1
SiMe
Me
C8F17P
3 3
perfluoroalkylated catalyst on one side of a microporous silica membrane. The low cohesive
energy density of perfluoroalkyl groups is used to realize the required solubility of the catalyst
in scCO2, and simultaneously the increased size ensures effective retention of the catalyst in
the membrane reactor. The reactants and products, which are also dissolved in the scCO2, can
diffuse through the membrane.
Wilkinson’s catalyst
The principle of this concept is demonstrated using a (1H,1H,2H,2H-
perfluoroalkyl)dimethylsilyl substituted derivative of Wilkinson's catalyst, 1 [Richter et al.,
2000a, b] (Figure 8), and the supported microporous silica membrane as used throughout this
thesis.
Figure 8. Fluorous version of Wilkinson’s catalyst.
As a model reaction the hydrogenation of 1-butene is first carried out in scCO2 in a batch
reactor at 20 MPa and 353 K. The batch reactor, with a volume of 26 mL, contains two saffire
windows for UV/Vis monitoring. The volume of the reactor can be controlled with a piston,
which assures sampling without disturbing the reaction conditions. The catalyst 1 was
prepared in situ from [RhCl(cod)]2 (cod = cis,cis-1,5-cyclooctadiene) and six equivalents of
P(C6H4(SiMe2CH2CH2C8F17)-p)3. The concentration of 1 was 1.0⋅10-6 mol L-1, and 1-butene
and hydrogen were present in a concentration of 0.02 and 0.08 mol L-1, respectively, at a total
pressure of 20 MPa. In the batch reactor the Turnover Frequency (TOF) at 25% conversion
was found to be 9400 h-1. The high solubility of hydrogen in scCO2, as compared to the
solubility in conventional solvents [Richter et al., 2000a,b], is responsible for the 10-fold
higher activity. For the sake of comparison, the solubility of hydrogen in toluene is 2.7 mM

139
CO2
1-buteneH2
catalyst (1)
CO2
1-buteneH2
butane
silica membrane
(at 1.0⋅105 Pa and 298 K) and in fluorous solvents, like c-C6F11CF3, it is 6.1 mM (at 1.0⋅105
Pa and 298 K).
Figure 9. Continuous reaction and separation concept.
Continuous membrane reactor
In the continuous membrane set-up (Figure 9), permeation and reaction experiments were
typically conducted with a feed pressure of 20 MPa and a trans-membrane pressure between
0.5⋅105 and 10⋅105 Pa. The membrane reactor is operated in a dead-end configuration. For the
permeation experiments (see Chapters 3 and 7) and the hydrogenation reaction in the
membrane reactor the same high-pressure set-up was used. The catalyst was first synthesized
in situ in a high-pressure reactor. The catalyst was introduced into the system by gently
flushing CO2 through the high-pressure reactor. The reaction was started by the addition of 1-
butene and hydrogen to the membrane module. The membrane was pressurized at the feed
and permeate side up to 20 MPa with the reaction mixture, by using a LKB HPLC pump and
was monitored by a Meyvis 802-C pressure module. The permeate needle valve was opened
to create various pressure differences across the membrane varying between 0.5⋅105 and
10⋅105 Pa to study the effect of the residence time on the conversion. The composition of the
permeate was monitored by GC and GC-MS. Experiments have been performed with a feed
side pressure up to 20 MPa. High fluxes of carbon dioxide through the microporous
membrane were obtained.
In the continuous process (during the continuous reaction experiments the concentration of 1
was 1.0⋅10-6 mol L-1, and 1-butene and hydrogen were present in a concentration of 0.02 and
0.08 mol L-1, respectively) about 2 permeated reactor volumes were needed to reach a

140
constant conversion of about 40% (Figure 10). In the experiment the pressure difference
applied is equal to 3⋅105 Pa, which corresponds to an average residence time of 62 min.
Figure 10. Conversion, of 1-butene to butane versus permeated volume per reactor volume,
for the continuous reaction/separation process.
The TOF, based on the initial amount of catalyst added, is equal to 4000 h-1, which is about
60% lower than in the batch experiment (TOF = 9400 h-1). Over night the pressure of the
system was reduced to 0.60 MPa, leaving no pressure difference between the feed and the
permeate side of the membrane. During the depressurization of the membrane reactor the
catalyst precipitated and no further reaction occurred. The precipitated catalyst was used for a
new cycle by pressurization of the membrane reactor. The shutdown procedure was carried
out twice to check the stability of the catalyst under those conditions. At the start of a new
cycle, the system was first pressurized to 20 MPa for 2 h to dissolve the catalyst before
creating a trans-membrane pressure difference. At the end of the third run a conversion of
about 33% was obtained (TOF = 3000 h-1). An overall Turnover Number of about 1.2⋅105 was
obtained (in 32 h), and a total of 32 reactor volumes had permeated through the membrane.
The overall operating time, including start-ups, reaction cycles, and shutdowns, was
approximately 75 h.
0
5
10
15
20
25
30
35
40
45
0 5 10 15 20 25 30 35
permeated volume of reaction mixt. per reactor volume(-)
conv
ersi
on (%
)shutdown 1 shutdown 2

141
In Figure 10 a relative decrease of 18% in conversion is observed (from 40% to 33%).
Analysis of the permeate stream by UV/Vis spectroscopy (a 2.2 mL high-pressure viewing
cell was used in combination with a spectrophotometer; measurements recorded at 280 and
410 nm) and by ICP-AAS showed that there was no transport of the catalyst or of the free
ligand through the membrane, so that it can be concluded that complete retention of 1
occurred. Even if the decrease in conversion would have been caused by leaching of the
catalyst, the retention of the catalyst per permeated reactor volume is still over 99%. The
leaching of catalyst appears highly unlikely since the size of 1, as obtained from a MMFF94
molecular mechanics structural optimization (4 nm) and dynamic light scattering (2 nm in c-
C6F11CF3), was found to be much larger than the average pore size of the membrane (0.6 nm).
Oxidation of 1 due to remaining traces of oxygen in the carbon dioxide or the feed is a more
likely explanation for the observed decrease in activity.
Concluding remarks
In this thesis the application of silica membranes in several separations and hybrid reactor
systems has been demonstrated. Pervaporation-assisted esterification reactions have been
studied at industrially relevant conditions. By removing the water formed a considerably
higher conversion than the equilibrium conversion has been obtained. A membrane reactor for
the immobilization of a homogeneous catalyst in a continuous process using a supercritical
solvent has also been successfully explored. The methodologies presented in this thesis can
make a contribution to the development of clean and more efficient chemical processes based
on membrane reactor technology.
Notation
A membrane area (m2)
k mass transfer coefficient (1/s)
p pressure (Pa)
t time (s)
V reaction volume (m3)
subscripts
f feed
N normalized

142
p permeate
References
D. Adams, Clean and green. . .but are they mean?, Nature, 407 (2000) 938.
A. Alpers, B. Keil, O. Lüdtke and K. Ohlrogge, Organic vapor separation: process
design with regards to high-flux membranes and the dependence on real gas behavior at high
pressure applications, Ind. Eng. Chem. Res., 38 (1999) 3754.
H.J. Bart, J. Reidetschläger, K. Schatka and A. Lehmann, Kinetics of esterification of
levulinic acid with n-butanol by homogeneous catalysis, Ind. Eng. Chem. Res., 33 (1994) 21.
T. Bein, Synthesis and applications of molecular sieve layers and membranes, Chem. Mater.,
8, (1996) 1636.
E. De Wolf, G. Van Koten and B.-J. Deelman, Fluorous phase separation techniques
in catalysis, Chem. Soc. Rev., 28 (1999) 37.
E. Drioli and M. Romano, Progress and new perspectives on integrated membrane
operations for sustainalbe industrial growth, Ind. Eng. Chem. Res., 40 (2001) 1277.
X. Feng and R.Y.M. Huang, Liquid separation by membrane pervaporation: a review,
Ind. Eng. Chem. Res., 36 (1997) 1048.
A. Figoli, W.F.C. Sager and M.H.V. Mulder, Facilitated oxygen transport in liquid
membranes: review and new concepts, J. Membr. Sci., 181 (2001) 97.
A.J. Fletcher and K.M. Thomas, Adsorption and desorption kinetics of n-octane and n-
nonane vapors on activated carbon, Langmuir, 15 (1999) 6908.
M.H. Hassan, J.D. Way, P.M. Thoen and A.C. Dillon, Single component and mixed
gas transport in a silica hollow fiber membrane, J. Membr. Sci., 104 (1995) 27.
A. Heintz and W. Stephan, A generalized solution-diffusion model of the pervaporation
process through composite membranes Part I. Prediction of mixture solubilities in the dense
active layer using the UNIQUAC model, J. Membr. Sci., 89 (1994) 143.
A. Heintz and W. Stephan, A generalized solution-diffusion model of the pervaporation
process through composite membranes Part II. Concentration polarization, coupled diffusion
and the influence of the porous support layer, J. Membr. Sci., 89 (1994) 153.
W.A. Herrmann and C.W. Kohlpainter, Water-soluble ligans, metal complexes and
catalysts: Synergism of homogeneous and heterogeneous catalysis, Angew. Chem. Int. Ed.
Engl., 32 (1993) 1524.

143
H.P. Hsieh, R.R. Bhave and H.L. Fleming, Microporous alumina membranes, J.
Membr. Sci., 39 (1988) 221.
R. Humayun and D.L. Tomasko, High-resolution adsorption isotherms of supercritical
carbon dioxide on activated carbon, AIChE J., 46 (2000) 2065.
A.F. Ismail and L.I.B. David, A review on the latest development of carbon
membranes for gas separation, J. Membr. Sci., 193 (2001) 1.
P.G. Jessop, T. Ikariya and R. Noyori, Homogeneous catalysis in supercritical fluids,
Chem. Rev., 99 (1999) 475.
P.G. Jessop and W. Leitner (eds),Chemical synthesis using supercritical fluids, 1st ed.,
Wiley-VCH Verlag GmbH, Weinheim (1999).
S. Kainz, D. Koch, W. Baumann and W. Leitner, Perfluoroalkyl-substituted
arylphosphanes as ligands for homogeneous catalysis in supercritical carbon dioxide, Angew.
Chem., Int. Ed. Engl., 6 (1997) 1628.
J. Kärger, and D.M. Ruthven, Diffusion in zeolites and other microporous solids,
Wiley: New York (1992).
H.O.E. Karlsson and G. Trägårdh, Pervaporation of dilute organic-water mixtures. A
literature review on modelling studies and applications to aroma compound recovery, J.
Membr. Sci., 79 (1993) 121.
F.K. Katsaros, T.A. Steriotis, A.K. Stubos, A. Mitropoulos, N.K. Kanellopoulos and S.
Tennison, High pressure gas permeability of microporous carbon membranes, Microporous
Mater., 8 (1997) 171.
S.E. Kentish and G.W. Stevens, Innovations in separations technology for the
recycling and re-use of liquid waste streams, Chem. Eng. J., 84 (2001) 149.
J.W.J. Knapen, A.W. van der Made, J.C. de Wilde, P.W.N.M. van Leeuwen, P.
Wijkens, D.M. Grove and G. van Koten, Homogeneous catalysts based on silane dendrimers
functionalized with arylnickel(II) complexes, Nature, 372 (1994) 659.
M.K. Koukou, N. Papayannakos, N.C. Markatos, M. Bracht, H.M. Van Veen and A.
Roskam, Performance of ceramic membranes at elevated pressure and temperature: effect of
non-ideal flow conditions in a pilot scale membrane separator, J. Membr. Sci., 155 (1999)
241.
B. Lin and A. Akgerman, Styrene hydroformylation in supercritical carbon dioxide:
rate and selectivity control, Ind. Eng. Chem. Res., 40 (2001) 1113.
F. Lipnizki, R.W. Field and P. Ten, Pervaporation-based hybrid process: a review of
process design, applications and economics, J. Membr. Sci., 153 (1999) 183.

144
F. Lipnizki, S. Hausmanns, G. Laufenberg, R. Field and B. Kunz, Use of
pervaporation-bioreactor hybrid processes in biotechnology, Chem. Eng. Technol., 23 (2000)
569.
R. Marr, and T. Gamse, Use of supercritical fluids for different processes including
new developments-a review, Chem. Eng. Process., 39 (2000) 19.
M.A. McHugh and V.J. Krukonis, Supercritical fluid extraction: principles and
practice, 2nd edition, Butterworth: Stoneham, Mass. (1994).
B.N. Nair, K. Keizer, T. Okubo and S-I. Nakano, Evolution of pore structure in
microporous silica membranes: Sol-gel procedures and strategies, Adv. Mater., 10 (1998)
249.
H. Ohya, T. Higashijima, Y. Tsuchiya, H. Tokunaga, M. Aihara, and Y.J. Negishi,
Separation of supercritical CO2 and iso-octane mixtures with and asymmetric polymide
membrane, J. Membr. Sci., 84 (1994) 185.
M.G.L. Petrucci and A.K. Kakkar, Heterogenizing homogeneous catalysis, Adv.
Mater., 8 (1996) 253.
J.C. Poshusta, R.D. Noble and J.L. Falconer, Temperature and pressure effects on
CO2 and CH4 permeation through MFI zeolite membranes, J. Membr. Sci., 160 (1999) 115.
B. Richter, E. De Wolf, G. Van Koten and B.-J. Deelman, Synthesis and properties of a
novel family of fluorous triphenylphosphine derivatives, J. Org. Chem., 65 (2000a) 3385.
B. Richter, A.L. Spek, G. Van Koten and B.-J. Deelman, Fluorous versions of
Wilkinson's catalyst. Activity in fluorous hydrogenation of 1-alkenes and recycling by
fluorous biphasic separation, J. Am. Chem. Soc., 122 (2000b) 3945.
D.M. Ruthven, Principles of adsorption and adsorption processes, Wiley: New York
(1984).
G. Saracco, H.W.J.P. Neomagus, G.F. Versteeg and W.P.M. van Swaaij, High-
temperature membrane reactors: potential and problems, Chem. Eng. Sci., 54 (1999) 1997.
S. Sarrade, G.M. Rios and M. Carlés, Nanofiltration membrane behavior in a
supercritical medium, J. Membr. Sci., 114 (1996) 81.
S.I. Semanova, H. Ohya, T. Higashijima, and Y.J. Negishi, Separation of supercritical
carbon dioxide and ethanol mixtures with an assymetric polyimide membrane, J. Membr. Sci.,
74 (1992) 131.
T. Suzuki, N. Tsuge and K. Nagahama, Solubilities of ethanol, 1-propanol, 2-propanol
and 1-butanol in supercritical dioxide at 313 K and 333 K, Fluid Phase Equilib., 67 (1991)
213.

145
C-Y. Tsai, S-Y. Tam, Y. Lu and C.J. Brinker, Dual-layer asymmetric microporous
silica membranes, J. Membr. Sci., 169 (2000) 255.
J. Vermesse, D. Vital, and P. Malbrunot, Gas adsorption on zeolites at high pressure,
Langmuir, 12 (1996) 4190.
R.M. Waldburger and F. Widmer, Membrane reactors in chemical production
processes and the application to the pervaporation-assisted esterification, Chem. Eng.
Technol., 19 (1996) 117.
S.L. Wells and J. DeSimone, CO2 technology platform: an important tool for
environmental problem solving, Angew. Chem. Int. Ed. Engl., 40 (2001) 518.

146

147
Summary
In this thesis the application of silica membranes in separations and hybrid reactor systems
has been explored. The main focus of the research is on the combination of esterification
reactions using pervaporation with simultaneous removal of water by the silica membrane.
The dehydration performance of the silica pervaporation membranes is described using
isopropanol/water mixtures as a model system. The membranes are provided by ECN (Petten,
The Netherlands) and consist of a water-selective amorphous silica top layer and four alumina
supporting layers. For the system investigated, these membranes appear to combine high
selectivities with high permeabilities. This results in a very high Pervaporation Separation
Index (PSI is up to 6000 kg/(m2.h) at 353K). A generalized Maxwell-Stefan model has been
set up to model the fluxes.
To obtain an improved insight in the transport through the silica membrane, permeation
experiments have been performed with various gasses through the membrane with and
without the selective top layer. From the permeation behavior of adsorbing gases and non-
adsorbing helium it can be concluded that the mass transport through the microporous silica
top layer takes place by two different activated mechanisms, i.e. micropore diffusion and
activated gaseous diffusion.
These insights are used to describe the membrane performance, i.e. the mass transport and
separation, of isopropanol/water mixtures. For this purpose, diffusion and equilibrium
adsorption data are taken into account using the Maxwell-Stefan theory. The mass transport in
the supported membrane is described by a combined model taking micropore diffusion and
activated gaseous diffusion into account.
The principle of pervaporation-assisted esterification reactions is demonstrated for the batch
mono esterification of levulinic acid with n-amyl alcohol. For this hybrid system, the
esterification reaction has been studied below and above the boiling point of water. All
experiments were performed at atmospheric conditions and could be described using a model
combining reaction kinetics and membrane performance.
The hybrid system has also been used at industrial reaction conditions. The batch di-
esterification of propionic acid with 1,4-butanediol coupled with pervaporation has been

148
carried out up to a temperature of 453 K and at pressures up to 10 bar. It has been
demonstrated that it is possible to obtain a conversion higher than the equilibrium conversion.
One of the issues is that the stability of the membrane changes during the reactions. This
implies that further research is required with respect to the membrane performance in aqueous
and/or organic environments.
Furthermore, the use of ceramic membranes in supercritical separations and reactions are
discussed. Ceramic membranes offer the opportunity for the regeneration of carbon dioxide at
supercritical conditions. Another application is the combination of homogeneous catalysis in
supercritical carbon dioxide where the catalyst is immobilized by the microporous silica
membrane.
The main purpose of the research described in this thesis is to enlarge the operating window
of silica membranes. The work described here reports the results for hybrid systems at
elevated temperatures and pressures. Pervaporation-assisted esterification reactions have been
carried out above the boiling point of water up to 453 K, and a homogeneous hydrogenation
reaction at 200 bar in CO2. The methodologies presented in this thesis are of relevance for the
further development of processes using inorganic membranes in separations and hybrid
reactor systems.

149
Samenvatting
In dit proefschrift is de toepassing van silica membranen in scheidingen en hybride
reactorsystemen onderzocht. Het belangrijkste deel van dit onderzoek is gericht op de
combinatie van veresteringen met pervaporatie waarbij tijdens de reactie het gevormde water
wordt verwijderd met behulp van een silica membraan.
Het silica pervaporatiemembraan is bestudeerd voor de scheiding van alcohol/water mengsels,
waarbij een isopropanol/water mengsel is gebruikt als modelsysteem. De membranen zijn
geleverd door ECN (Petten, Nederland) en bestaan uit een waterselectieve amorf silica
toplaag en vier alumina steunlagen. Voor het onderzochte modelsysteem blijkt het membraan
hoge selectiviteiten te combineren met een hoge waterpermeabiliteit. Dit resulteert in een zeer
hoge Pervaporatie Scheidings Index (PSI is 6000 kg/(m2.h) bij 353K). Een Maxwell-Stefan
model is ontwikkeld om de waterflux door het membraan te beschrijven.
Om een beter inzicht te verkrijgen in het transportmechanisme door het silica membraan zijn
permeatiemetingen uitgevoerd met verschillende gassen aan het membraan met en zonder
silica toplaag. Uit deze permeatiemetingen met verschillende adsorberende gassen en het niet-
adsorberende helium blijkt dat het massatransport door de microporeuze toplaag wordt
bepaald door twee verschillende geactiveerde mechanismen, namelijk microporie diffusie en
geactiveerde gasdiffusie.
Met deze inzichten zijn vervolgens de transport- en scheidingseigenschappen van het
membraan voor het scheiden van isopropanol/water mengsels opnieuw beschreven. Hiervoor
zijn in de Maxwell-Stefan theorie diffusie- en evenwichtsadsorptiegegevens voor beide
componenten meegenomen. Het massatransport in het membraan wordt het beste beschreven
door een model waarbij zowel microporie diffusie als geactiveerde gasdiffusie wordt
meegenomen.
Het principe van pervaporatie-geassisteerde esterificatie reacties is gedemonstreerd voor de
verestering van levulinezuur met n-amyl alcohol. Voor dit hybride systeem is de esterificatie
uitgevoerd bij een temperatuur van 348 en 408 K. Alle experimenten zijn uitgevoerd onder
atmosferische condities en kunnen worden beschreven met een model dat de reactiekinetiek
combineert met de transport- en scheidingseigenschappen van het membraan.

150
Het hybride systeem is ook gebruikt onder industriële reactiecondities. De batch verestering
van propionzuur met 1,4-butaandiol in combinatie met pervaporatie is uitgevoerd bij een
temperatuur van 453 K en drukken tot 10·105 Pa. Het is mogelijk om een conversie hoger dan
de evenwichtsconversie te verkrijgen. Een belangrijk punt van aandacht is de stabiliteit van de
membranen bij deze experimenten. Dit geeft aan dat verder onderzoek is vereist naar de
stabiliteit van deze membranen in waterige en/of organische milieus.
In dit proefschrift wordt tevens het gebruik van keramische membranen in superkritische
scheidingen en reacties besproken. Keramische membranen kunnen worden gebruikt voor de
regeneratie van koolstofdioxide onder superkritische omstandigheden. Een andere
mogelijkheid is om microporeuze silica membranen te gebruiken voor homogene katalyse in
superkritisch koolstofdioxide waarbij de katalysator wordt tegengehouden door het
membraan.
Dit proefschrift beschrijft de resultaten voor hybride systemen bij hoge temperaturen en
drukken. Pervaporatie-geassisteerde veresteringen zijn uitgevoerd tot 453 K en een homogeen
gekatalyseerde reactie bij 200·105 Pa in CO2. De methodologieën die hier zijn gepresenteerd
zullen relevant zijn voor de toekomstige ontwikkeling van processen waarbij anorganische
membranen in scheidingen en hybride reactorsystemen worden toegepast.

151
Dankwoord
Dit proefschrift is gebaseerd op werk dat is uitgevoerd bij de faculteit Scheikundige
Technologie van de Technische Universiteit Eindhoven. Bij deze wil ik iedereen bedanken
die op één of ander manier heeft bijgedragen aan het tot stand komen van dit proefschrift.
In de eerste plaats wil ik alle medewerkers van de capaciteitsgroep SPD bedanken voor de
prettige sfeer en collegialiteit in de groep.
In heb bijzonder wil ik Jos Keurentjes bedanken voor het in mij gestelde vertrouwen en de
mogelijkheid om te promoveren. Verder wil ik Marius Vorstman bedanken voor zijn
praktisch inzicht en het leeswerk dat hij heeft verricht. Verder wil ik mijn kamergenoten
bedanken. Marc, je bent beter met computers dan met koffiezetten; Mark, het was altijd
gezellig; en Jörgen bedankt voor de carpool en de echte koffie!
Alle experimenten heb ik niet alleen uitgevoerd. Ik wil daarom de afstudeerders Yvonne,
Barbara, Poul, Bart, Mattie, Maarten en François en stagiaire Ellen bedanken voor hun
enthousiasme en inzet. Jullie werk heeft mede geresulteerd in enkele mooie artikelen.
Paul Pex, Henk van Veen en Yvonne van Delft (allen werkzaam bij ECN) hartelijk bedankt
voor de stimulerende en vruchtbare discussies.
Voor de experimenten die onder industriële condities uitgevoerd zijn, is een volledig
geautomatiseerde opstelling gebouwd. De bouw hiervan had ik nooit alleen kunnen realiseren.
Ik wil hiervoor onder andere Jovita, Anton, Herbert, Marius, Chris, Piet, Vincent, Hans, Paul,
Hans en Henny hartelijk bedanken voor hun praktische hulp en inzicht.
Verder wil ik de leden van mijn begeleidingscommissie, Wridzer Bakker (Akzo Nobel), Gert
de Wit (GE), Feike de Jong (Shell), Henk Buijs (TNO), Corne van Zantvoort (DSM) en
Maurice Baars (DSM) bedanken voor hun constructieve opmerkingen en suggesties.
Verder wil ik Earl en Peter (jij die de status van MVP echt verdient) ontzettend bedanken. Het
blijkt dat een beetje divergeren van je onderzoek kan resulteren in prachtig werk.
Tenslotte wil ik het thuisfront bedanken voor al hun steun in de afgelopen vier jaar.
Arjan