applying the many-facet rasch model to detect - idosi.org
TRANSCRIPT

World Applied Sciences Journal 15 (Innovation and Pedagogy for Lifelong Learning): 70-77, 2011ISSN 1818-4952© IDOSI Publications, 2011
Corresponding Author: Rajab Esfandiari, Department of English, Faculty of Persian Literature and Foreign Languages, University of Tabriz, Tabriz, Iran.
70
Applying the Many-Facet Rasch Model to Detect Centrality in Self-Assessment, Peer-Assessment and Teacher assessment
Farahman Farrokhi, Rajab Esfandiari and Mehdi Vaez Dalili1 1 2
Department of English, Faculty of Persian Literature and Foreign Languages,1
University of Tabriz, Tabriz, IranDepartment of English, Faculty of Foreign Languages, University of Isfahan, Isfahan, Iran2
Abstract: In rater-mediated second language performance assessments, where human judgment is needed toevaluate the quality of a student’s response to a particular task on a set of criteria, raters are error-prone.These unwanted, rater-dependent systematic sources of variability, which are unrelated to the students’abilities and manifested in various ways, could endanger the fairness and validity of decisions made based onthe assigned ratings. Centrality or central tendency effect is one of the most pervasive sources of ratervariability which has been under-researched in EFL classroom-based assessment settings. The present studyaims to employ a many-facet Rasch model (MFRM), a relatively newly developed measurement model, to detectcentral tendency effect in self-assessment, peer-assessment and teacher assessment. To that end, 194assessors-188 self-and peer-assessors and 6 teacher assessors-were employed to assess 188 essays writtenby Iranian English majors at universities in Iran, using a six-point analytic rating scale. The data were collectedand analyzed, using Facets 3.68.1. The results of Facets analysis showed that the three types ofassessor-self-assessor, peer-assessor and teacher assessor-did not exhibit any sign of centrality either at grouplevel or at individual level. The findings are promising in that they provide evidence for the viability of bothself-assessors and peer-assessors for rating purposes along with teachers.
Key words: Rating scale Centrality Performance assessment Self-assessment Peer assessment
INTRODUCTION termed rater errors [3] or rater effects [4] and include
In any kind of performance testing or assessment, or central tendency. the performance is mediated by the rater’s behaviour. Rater variability, as mentioned previously, results inSecond language performance assessment is no construct-irrelevant variance, so attempts have been madeexception. Students’ test scores are affected by the to reduce or minimise it. In the context of second languagesystematic behaviour of assessors. Rater variability [1] is performance assessment, this has been done via raterthe term commonly applied to the raters’ unwanted training. Rater training can be effective in that it eliminatessystematic behaviour which adversely affects the extreme differences in rater severity, increases thestudents’ test scores. self-consistency of raters and reduces individual biases
Rater variability has been reported to manifest itself displayed by raters towards aspects of the ratingin various ways [2]. Raters sometimes vary in terms of situation” [5], but rater training has failed to eliminate theoverall severity/leniency relative to other raters; they may errors altogether and the effects of rater training arevary in terms of consistency-either in relation to other usually short-lived [5, 6].raters or within themselves; they may display individual Dissatisfaction with rater training promptedbiases with respect to items, students, or rating scale researchers to seek for other ways to control for ratercategories; they may vary in terms of their using the variability. One of the most recently employed approachesrating scale points or band levels. These sources of in second language performance assessment to detectconstruct-irrelevant variance have been collectively rater effects has been a many-facet Rasch model,
severity/leniency, randomness, bias, halo and centrality

World Appl. Sci. J., 15 (Innovation and Pedagogy for Lifelong Learning): 70-77, 2011
71
developed and further revised by the American Conceptual Definitions on Central Tendency Effect:statistician Mike Linacre [7]. This measurement model has Within the context of MFRM, Wolfe and McVay [15]held great promise in detecting and measuring rater define central tendency effect as “systematic error thateffects and has been applied across a variety of other causes the assigned ratings to be more tightly clustereddisciplines including medicine. The many-facet Rasch than ratings that do not contain error.” In like manner,measurement does not require that raters agree exactly, Myford and Wolfe [4] state that “central tendency isbut it allows for some variability in ratings in that each defined as overusing the middle categories of a ratingrater has a unique severity, each item has a unique scale.”difficulty and each examinee has a unique ability [7]. Myford and Wolfe [4] claim that central tendencyIt requires raters be self-consistent than agree exactly. effect is manifested in three different ways. A rater may be
In what follows, we present an overview of this able to discriminate high and low performing examinees,measurement model followed by studies done to detect but fails to discriminate average performing examineescentral tendency effect using this measurement model. and overuses middle categories for these average
Many-Facet Rasch Model (MFRM): A many-facet Rasch points or categories of the ratings scale and fails tomodel, a logistic latent trait model of probabilities, is an differentiate among examinee’s performance levels.extension of the basic Rasch model that allows As a result, the rater “resorts to assigning “middle-of-researchers to compare not only the difficulty of items and the-road” ratings”[4]. A rater may start overusing thethe proficiencies of students but also the severity of middle categories because he or she has been singled outassessors. Linacre [7] originally developed the MFRM as assigning too many high or low ratings. approach to take into account the role that assessorsplay, acknowledging that not all assessors exercise the Second Language (L2) Studies on Central Tendencysame degree of severity when they award ratings. Effect: Very few studies have investigated centralA many-facet Rasch model is essentially an additive linear tendency effect in L2 using MFRM and no study tomodel based on a logistic transformation of observed our knowledge has investigated it in self-assessment,ratings. The logistic transformation of successive peer-assessment and teacher assessment. Below wecategory probabilities function as the dependent mention the few studies which have investigated thisvariable and other facets such as student proficiency, rater error.item difficulty, assessor severity and other testing In Japan, Kozaki [16] employed GENOVA andsituation facets as independent variables [8]. FACETS to set multiple standards on performance
Specifications of the Many-Facet Rasch Measurement: performances of adult native Japanese speakers withThe many-facet Rash measurement (MFRM) belongs mixed levels of performance in translation from Japaneseto a growing family of Rasch models, which applies medical papers to English were chosen. All nineto a class of measurement models that aim at examinees were either professionally or amateurishlyproviding a fine-grained analysis of multiple variables involved in translation of Japanese into English.potentially having an impact on test or assessment Four professional and bilingual judges literate in bothoutcomes [1, 9]. Japanese and English were chosen to judge the
The primary specifications and requirements of the performance of the examinees on a 4-point rating scalemany-facet Rasch measurement include the following. on seven assessment categories. The judgment consistedFirst, a more able student is more likely to endorse any of three procedures to arrive at a cut-off score: assessingitem correct than any less able student; in other words, the categories independently, rank ordering thescores increase as ability increases [10, 11]. The second performances and pass-fail ratings by at least threespecification is local independence, which implies that judges. Judge behaviour was analyzed by Facets tostudents’ performance on later items should not be examine central tendency. Two of the ratersdependent on previous items [12]. The third specification (raters 2 and 3) were muted on two extreme examinees,is that it should be unidimensional. Unidimensionality showing leniency for the least able examinee andimplies measuring one latent or underling ability at a time awarding unexpectedly harsh rating to the most able[13]. In other words, all items on a test should measure the examinee. These two muted raters showed signs of centralsame single underlying variable or construct [1, 14]. tendency effect because they overused the midpoints of
performing examinees. A rater may not understand the
assessment. To that end, 9 performances of 20

World Appl. Sci. J., 15 (Innovation and Pedagogy for Lifelong Learning): 70-77, 2011
72
the scale, with the presence of 78% of all ratings falling METHODOLOGYin these two categories for these two muted raters,indicating that they might have awarded similar ratings to The Present Study: The present study uses many-facetthe examinees. Rasch measurement (MFRM) to detect central tendency
In New Zealand, Knock, Read and von Randow [5] effect in self-assessor, peer-assessor and teachercompared the effectiveness of on line and face-to-face assessor. The present study compensates the limitationsfeedback to individual raters within the context of a of the previous studies in the following ways: itlarge-scale academic writing assessment of students incorporates 194 raters, with 188 acting as student ratersentering a major English-medium university. and six others as teacher raters; it employs EnglishSixteen highly trained experienced native and non-native major students; it is conducted in a different EFLEnglish as second language teachers were equally divided setting-Iran; unlike previous studies, it employs ratherinto online and face-to-face groups. Four rater effects inexperienced raters and finally it employs a fully-were investigated: rater severity, internal consistency, crossed design, which was lacking in the previous studiescentral tendency and halo effect. Using group andindividual statistics indicators of Facets, the authors Research Question: In the present study, we wereclaimed that at group level there was a slight trend interested in how three rater types-namely, self-assessors,towards a central tendency effect after training especially peer-assessors and teacher assessors, showed variabilityfor the face-to-face group, although the trend was not in terms of central tendency effect, if any, in relation tosignificant. At individual level, however, they argued that each other. The following research question was,two raters exhibited central tendency effect before training therefore, generated: To what extent do self-assessors,and one of them showed a pronounced central tendency peer-assessors and teacher assessors display centraleffect after training. The authors claimed that this could tendency effect when assessing the essays of studentsbe due to monitoring raters while rating and concluded using an analytic rating scale?that “raters in a more normal rating situation would exhibitthis tendency less” [5]. They justified their conclusion, Participants: The participants in the present studystating that when the raters are monitored, they would consisted of 194 raters, who were subdivided into studentapply a ‘play-it-safe’ strategy. raters and teacher raters. Student raters were 188
In a longitudinal study spanning from March 2007 to undergraduate Iranian English majors enrolled inJune 2008 totalling 16 months, Knock [2] tried to test the Advanced Writing classes in two state-run universities ineffectiveness of individualised feedback to 19 highly Iran, comprising three fields of study: English Literature,trained raters and to see how the raters incorporated the Translation Studies and English Language Teaching.feedback into their subsequent rating. She further wanted The student raters were labelled either self-assessors orto know how the raters felt about the effectiveness of peer-assessors. Teacher assessors were six Iranianfeedback. The raters had to rate the data points on 8 teachers of English.administrations on an analytic rating scale. They were Student raters ranged in age from 18 to 29, with oneprovided with individual feedback online on four areas over 30 and another with unidentified age. One hundredincluding severity, bias, consistency / use of rating scale and thirty one student raters (69.7%) were female and 57categories and overall evaluation after the first four rating (30.3%) were male. Eighty-six (45.7%) were native Farsi-administrations. The rating data were analysed using speakers, 68 (36.2 %) were native Turkish speakers, fourFacets and the raters were interviewed via telephone and (2.1%) were native Kurdish speakers and another fourwere given questionnaires to gain their attitudes about (2.1%) were grouped as “Other”. Ninety-five (50.5%) werethe feedback. The results showed that there was no effect sophomores, 29 (15.4%) were juniors and 64 (34.0%) werefor the feedback after they received it and that both seniors. Only three of them (1.6%) had the experience ofspeaking and writing raters were not able to incorporate living in an English-speaking country. The number ofthe feedback more successfully. Further analysis of years they had studied English ranged from 1 to 24 yearsresults also showed that one rater out of 19 raters showed and most of them (61.7%) had studied the Englishcentral tendency effect, overusing the inner categories of language in language institutes before entering thethe scale. university.

World Appl. Sci. J., 15 (Innovation and Pedagogy for Lifelong Learning): 70-77, 2011
73
Teacher assessors were all male. They came from two Data Collection: One hundred and eighty five-paragraphlanguage backgrounds: four teacher assessors were essays were collected over a span of a year and a halfnative-Farsi speakers and the other two were native from 188 students enrolled in advanced writing courses inTurkish speakers. They ranged in age from 23 to 36. two universities in Iran. The students came from sixNone of them had the experience of living in an classes taught by four instructors. The students wereEnglish-speaking country. They had taught writing taught principles of writing for eight weekly meetings.courses from one to seven years. All of them had a degree Immediately after the eight weekly meetings, they werein English: three of them were PhD students in ELT, told by their respective teachers they would have to givetwo had MAs in ELT and one had a BA in English the midterm exam the following week. literature. At the exam, they were given 90 minutes to write a
The Rating Scale: For the purposes of the present study, to seven hundred words on the following topic: “In yourwe chose an analytic rating scale. The scale we developed opinion, what is the best way to choose a marriagefor the present study is based on Jacobs, Zinkgraf, partner? Use specific reasons and examples why youWormuth, Hartfiel and Hughey’s [17] ESL Composition think this approach is the best”. This topic was chosenProfile, but differs from it in many aspects (See Table 1). from a list of TOEFL TWE topics. All the students were
To develop our rating scale, we also referred to given the same topic in order to control for topic effect.writing textbooks in the literature because we Following the data collection, a rating session was held towanted the scale to reflect the structure of a standard give the student raters and teacher raters instructions onfive-paragraph essay. The scale contains fifteen items how to rate the essays. Facets 3.68.1 [19] was used towhich comprise the elemental features of a analyse data.five-paragraph essay: substance, thesis development,topic relevance, introduction, coherent support, Data Analysis: To analyse the data for the present study,conclusion, logical sequencing, range, word choice, we followed the detailed instructions put forward byword form, sentence variety, overall grammar, spelling, Myford and Wolfe [20]. To detect the central tendencyessay format and punctuation, capitalization and effect, Myford and Wolfe [20] present individual-levelhandwriting. statistical indicators and group-level statistical indicators.
A six-point rating scale was chosen because these To detect central tendency at the individual level,are “the most common number of scale steps in college Myford and Wolfe [20] propose infit and outfitwriting tests and a larger number of steps may provide a mean-square indices must be checked. degree of step separation difficult to achieve as well as To detect central tendency at group level,placing too great a cognitive burden on raters, while a Myford and Wolfe [20] employed the followinglower number may not allow for enough variation group-level statistical indicators. They point out thatamong the multifaceted elements of writing skills” [18]. the researcher using MFRM could use rater and
five-paragraph essay ranging in length from five hundred
Table 1: Essay Rating SheetEssay number: Rater’s name:
Very poor Poor Fair Good Very good Excellent1. Substance 1 2 3 4 5 62. Thesis development 1 2 3 4 5 63. Topic relevance 1 2 3 4 5 64. Introduction 1 2 3 4 5 65. Coherent support 1 2 3 4 5 66. Conclusion 1 2 3 4 5 67. Logical sequencing 1 2 3 4 5 68. Range 1 2 3 4 5 69. Word choice 1 2 3 4 5 610. Word form 1 2 3 4 5 611. Sentence variety 1 2 3 4 5 612. Overall grammar 1 2 3 4 5 613. Spelling 1 2 3 4 5 614. Essay format 1 2 3 4 5 615. Punctuation/capitalization/handwriting 1 2 3 4 5 6

World Appl. Sci. J., 15 (Innovation and Pedagogy for Lifelong Learning): 70-77, 2011
74
trait fit mean indices. They state that the researcher The Reliability of Separation Index: this index showsshould use a rating scale model if he or she wants to know how rater type is able to reliably distinguish amongwhether rater type shows central tendency. In so doing, students in terms of their performance. A lowthe researcher should check the Category Statistics table reliability of separation index suggests a group-levelof facets output. central tendency effect.
The researcher can use the following five group-level Fit Indices for Items: item fit mean square indicesstatistical indicators. which are significantly less than 1 show less
A Fixed Chi-square test: this tests the the item. Significantly low fit mean square for ahypothesis that all the students show the same particular item can signal rater’s type over usinglevel of performance measure. A non-significant one or more categories of the scale. In cases thatchi-square value indicates a group-level central those categories are middle categories, it can be atendency effect. sign of central tendency effect for rater type atThe Separation Ratio: this ratio is a measure of the group level. student performance measure relative to the precisionof those measures. A low separation ratio indicates RESULTSa group-level central tendency effect. The Separation Index: this index implies the Before reporting the results of the study,number of statistically distinct levels of student we should note that, following Wright, Linacre,performance. A low separation index indicates the Gustafson and Martin-Lof. [21], we set thepresence of group-level central tendency effect. infit and outfit mean squares between. 5-1.5.
variation than expected in the rater type’s ratings of
Table 2: Category statistics for rater type
Table 3: Student measurement report for central tendency effect
World Appl. Sci. J., 15 (Innovation and Pedagogy for Lifelong Learning): 70-77, 2011
75
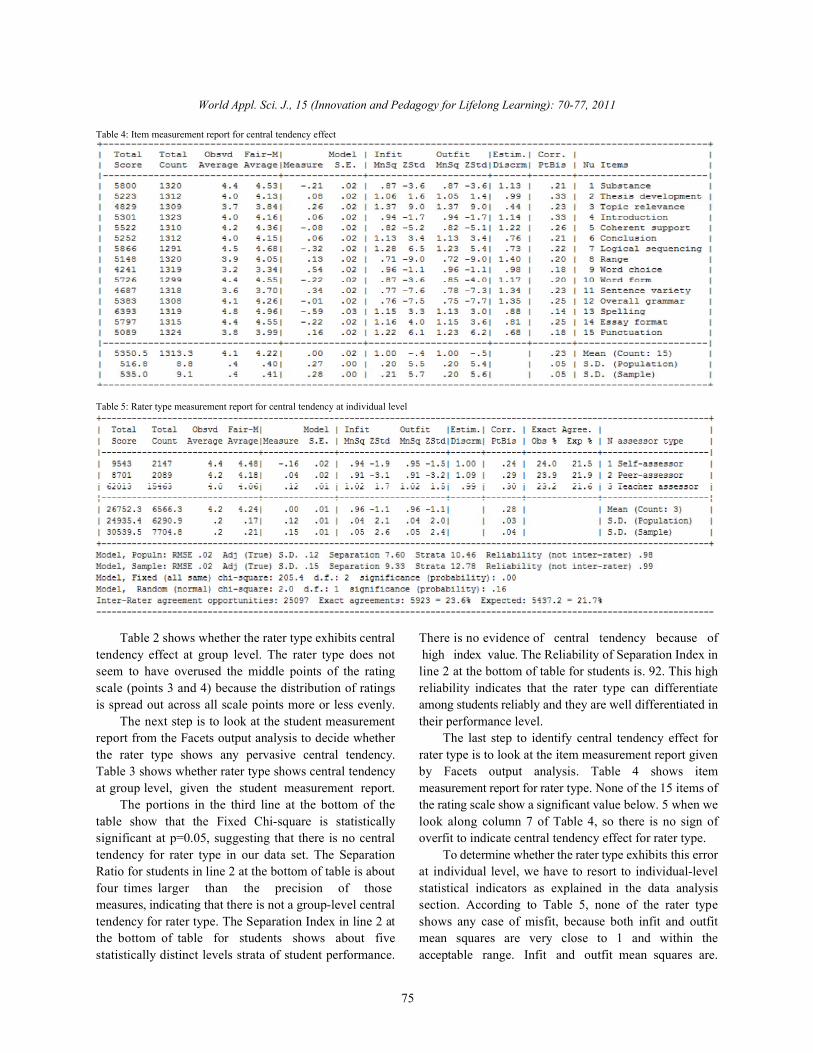
Table 4: Item measurement report for central tendency effect
Table 5: Rater type measurement report for central tendency at individual level
Table 2 shows whether the rater type exhibits central There is no evidence of central tendency because oftendency effect at group level. The rater type does not high index value. The Reliability of Separation Index inseem to have overused the middle points of the rating line 2 at the bottom of table for students is. 92. This highscale (points 3 and 4) because the distribution of ratings reliability indicates that the rater type can differentiateis spread out across all scale points more or less evenly. among students reliably and they are well differentiated in
The next step is to look at the student measurement their performance level. report from the Facets output analysis to decide whether The last step to identify central tendency effect forthe rater type shows any pervasive central tendency. rater type is to look at the item measurement report givenTable 3 shows whether rater type shows central tendency by Facets output analysis. Table 4 shows itemat group level, given the student measurement report. measurement report for rater type. None of the 15 items of
The portions in the third line at the bottom of the the rating scale show a significant value below. 5 when wetable show that the Fixed Chi-square is statistically look along column 7 of Table 4, so there is no sign ofsignificant at p=0.05, suggesting that there is no central overfit to indicate central tendency effect for rater type.tendency for rater type in our data set. The Separation To determine whether the rater type exhibits this errorRatio for students in line 2 at the bottom of table is about at individual level, we have to resort to individual-levelfour times larger than the precision of those statistical indicators as explained in the data analysismeasures, indicating that there is not a group-level central section. According to Table 5, none of the rater typetendency for rater type. The Separation Index in line 2 at shows any case of misfit, because both infit and outfitthe bottom of table for students shows about five mean squares are very close to 1 and within thestatistically distinct levels strata of student performance. acceptable range. Infit and outfit mean squares are.

World Appl. Sci. J., 15 (Innovation and Pedagogy for Lifelong Learning): 70-77, 2011
76
94 and. 95 for self-assessor;. 91 and. 91 for peer-assessor; different. This is an area for further research inand 1.02 and 1.02 for teacher assessor, respectively. self-assessment, peer-assessment and teacher assessmentWhat all this information from Table 5 implies is that rater because so far no study has touched upon it.type at individual level does not show central tendencyeffect. REFERENCES
DISCUSSION AND CONCLUSION 1. Eckes, T., 2008. Rater types in writing performance
In this study, we intended to employ a many-facet variability. Language Testing, 25(2): 155-185.Rasch measurement model to detect central tendency 2. Knoch, U., 2011. Investigating the effectiveness ofeffect in self-assessors, peer-assessors and teacher individualized feedback to rating behaviour-aassessors. The results of the Facets analysis revealed that longitudinal study. Language Testing, 28(2): 179-200.there was no evidence of central tendency effect for three 3. Engelhard, G., Jr, 2002. Monitoring raters intypes of assessor either at individual level or at group performance assessments. In G. Tindal andlevel. T. Haladyna (Eds.), Large-scale assessment programs
Lack of central tendency effect in the present study for ALL students: Development, implementation andis good news because centrality is detrimental and should analysis (pp: 261-287). Mahwah, NJ: Lawrencebe eliminated or reduced as far as possible if fair decisions Erlbaum Associates.are going to be made based on the raters’ ratings. One of 4. Myford, C.M. and E.W. Wolfe, 2004a. Detecting andthe main reasons why the rater type did not show measuring rater effects using many-facet Raschcentrality could be attributed to the strategy we adopted measurement: Part I. In E.V. Smith and R.M. Smithin this study. Myford and Wolfe [4] propose five (Eds), Introduction to Rasch measurementstrategies to minimise this error. Myford and Wolfe [4] (pp: 518-574). Maple Grove, MI: JAM Press.recommend researchers to “ask raters to assign ratings 5. Knoch, U., J. Read and T. von Randow, 2007.using a forced distribution, having them place a Re-training writing raters online: How does itpre-specified number of ratings in each rating category. compare with face-to-face training? AssessingAs an alternative, have raters rank order the rating, Writing, 12(2): 26-43.a process that forces raters to spread out ratings and 6. McNamara, T.F., 1996. Measuring second languagediscriminate among them.” We applied this strategy to our performance. New York: Longman.study, asking the assessors to spread the ratings across 7. Linacre, M., 1989/1994. Many-facet Raschthe rating scale so as not commit the central tendency measurement. Chicago: MESA press.error. The reason for adopting this strategy was that we 8. Engelhard, G. Jr. and C. Myford, 2009. Comparison ofcould maintain a trade-off between reliability and validity. single-and double-assessor scoring designs for the
The second main reason was lack of monitoring. assessment of accomplished teaching. Journal ofIn almost all the previous studies on central tendency Applied Measurement, 10(1): 52-69. effect, the raters were monitored, which is why there was 9. Sick, J., 2009. Rasch measurement in languageevidence of central tendency effect. When the raters are education part 3: The family of Rasch models.monitored, they try to adopt a “play-it-safe” strategy, Shiken: JALT Testing and Evaluation SIG Newsletter,starting to overuse the middle categories in order not be 13(1): 4-10.singled out as exhibiting discrepant ratings [22, 23]. 10. Lunz, M.E. and J.M. Linacre, 1998.This is in line with Knock, Read and von Randow [5] who Measurement designs using multifacet Raschconcluded that “raters in a more ‘normal’ rating situation modeling. In G.A. Marcoulides (Ed.),would exhibit this tendency less.” Modern methods for business research (pp: 47-77).
One implication of this study is that both Mahwah, NJ: Erlbaum.self-assessor and peer-assessor could be employed along 11. Smith, Jr. E.V., 2004. Evidence for the reliability ofwith teachers for rating purposes in L2 classrooms in measures and validity of measure interpretation:which teachers are hard pressed for time and do not have A Rasch measurement perspective. In E.V. Smith,enough time to spare rating the students’ assignments. Jr and R.M. Smith (Eds.), Introduction to RaschIt is possible that if all the rater errors were model (pp: 93-122). Maple Grove, Minnesota:simultaneously investigated, the results would be JAM Press.
assessments: A classification approach to rater
World Appl. Sci. J., 15 (Innovation and Pedagogy for Lifelong Learning): 70-77, 2011
77
12. Bachman, L., 2004. Statistical Analyses for Language 19. Linacre, J.M., 2011. FACETS (Version 3.68.1)Assessment. Cambridge: Cambridge University [Computer Software]. Chicago, IL: MESA Press.Press. 20. Myford, C.M. and E.W. Wolfe, 2004b. Detecting and
13. Bond, T.G. and C.M. Fox, 2007. Applying the Rasch measuring rater effects using many-facet Raschmodel: Fundamental measurement in the human measurement: Part II. In E.V. Smith and R.M Smithsciences (2nd edn.). Mahwah, NJ: Erlbaum. eds. Introduction to Rasch measurement
14. Baghaei, P., 2009. Understanding the Rasch model. (pp: 460-517). Maple Grove, MI: JAM Press.Mashhad: Mashhad Islamic Azad University Press. 21. Wright, B.D., J.M. Linacre, J.E. Gustafson and
15. Wolfe, E. and A. McVay, 2010. Rater Effects as a P. Martin-Lof, 1994. Reasonable mean-square fitFunction of Rater Training Context. United States of values. Rasch Measurement Transactions, 8(3): 370.America: Pearson. 22. Myford, C.M. and R.J. Mislevy, 1995. Monitoring and
16. Kozaki, Y., 2004. Using GENOVA and FACETS to set improving a portfolio assessment system. Princeton,multiple standards on performance assessment for NJ: Educational Testing Service, Center forcertification in medical translation from Japanese into Performance Assessment.English. Language Testing, 21(1): 1-27. 23. Wolfe, E.W., C.W.T. Chiu and C.M. Myford, 1999.
17. Jacobs, H.L., S.A. Zinkgraf, D.R. Wormuth, The manifestation of common rater effects inV.F. Hartfiel and J.B. Hughey, 1981. Testing ESL multi-faceted Rasch analyses. Princeton, NJ:composition: A practical approach. Rowley, Educational Testing Service, Center for PerformanceMA: Newbury House. Assessment.
18. Schaefer, E., 2008. Rater bias patterns in an EFLwriting assessment. Language Testing, 25(4): 465-93.