appzen & hackett final webinar slides-2
TRANSCRIPT

Presenters
Susie WestFounder & CEO
sharedserviceslink
Andy FosterVP Consulting Services
AppZen
Bryan DeGrawAssociate Principal, Finance
Advisory ServiceThe Hackett Group
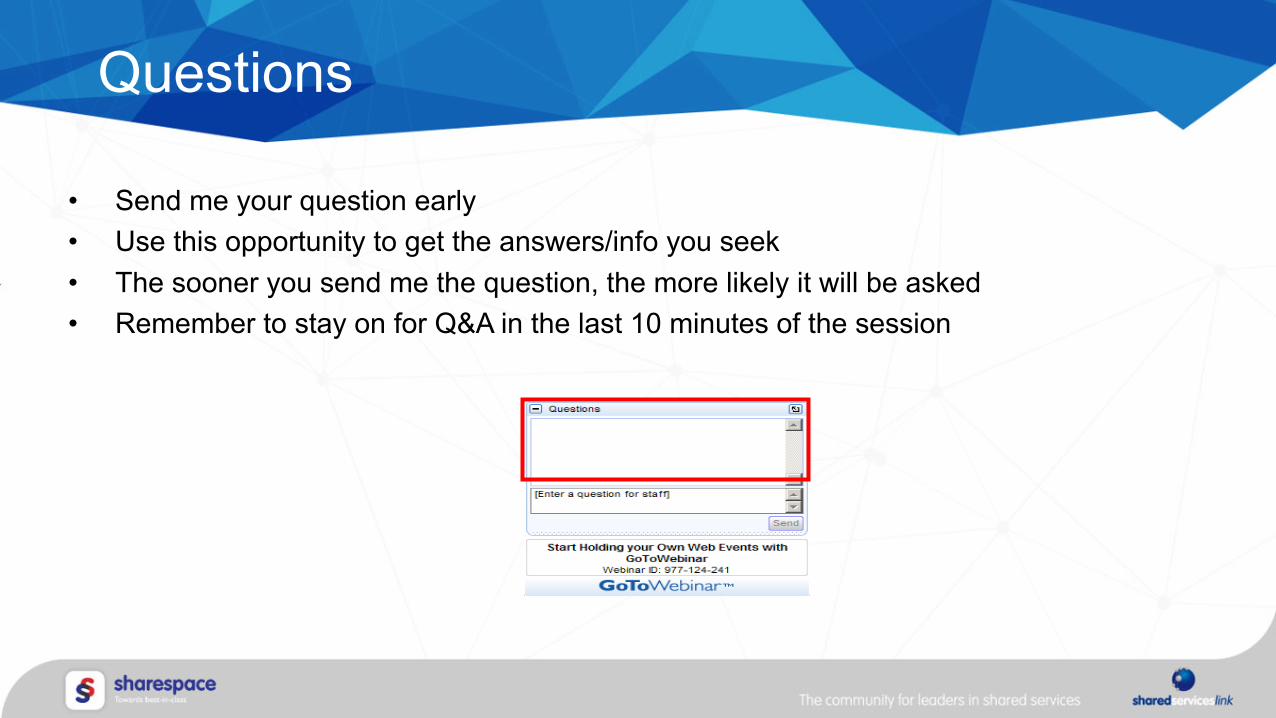
• Send me your question early • Use this opportunity to get the answers/info you seek• The sooner you send me the question, the more likely it will be asked• Remember to stay on for Q&A in the last 10 minutes of the session
Questions
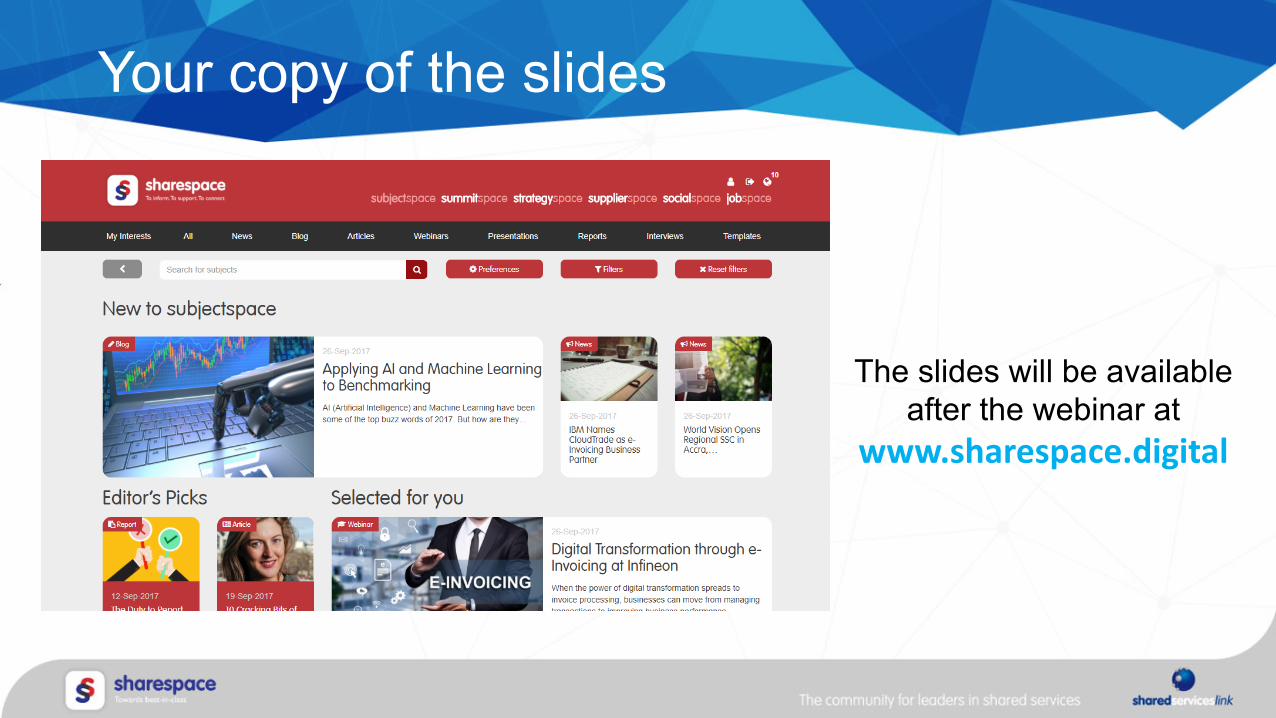
Your copy of the slides
The slides will be available after the webinar at
www.sharespace.digital
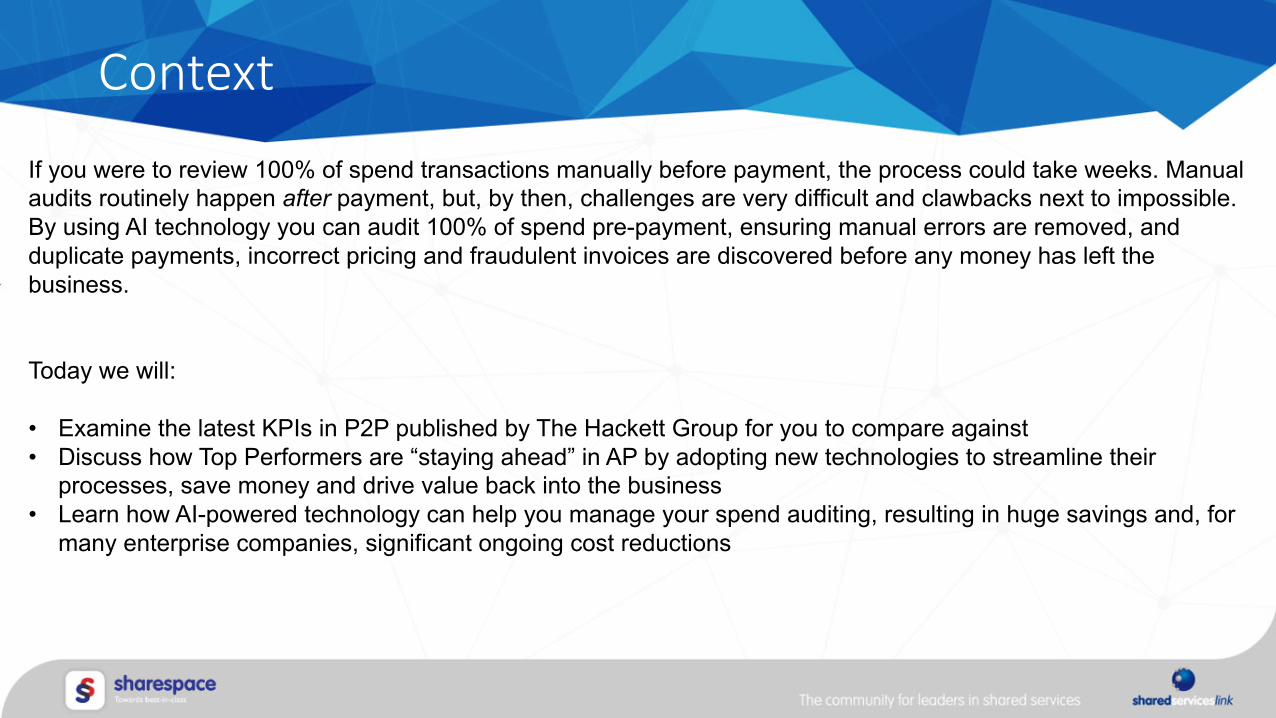
Context
If you were to review 100% of spend transactions manually before payment, the process could take weeks. Manual audits routinely happen after payment, but, by then, challenges are very difficult and clawbacks next to impossible.By using AI technology you can audit 100% of spend pre-payment, ensuring manual errors are removed, and duplicate payments, incorrect pricing and fraudulent invoices are discovered before any money has left the business.
Today we will:
• Examine the latest KPIs in P2P published by The Hackett Group for you to compare against• Discuss how Top Performers are “staying ahead” in AP by adopting new technologies to streamline their
processes, save money and drive value back into the business• Learn how AI-powered technology can help you manage your spend auditing, resulting in huge savings and, for
many enterprise companies, significant ongoing cost reductions
Poll
Are you able to identify duplicates in your spend processes?
1) Yes, across all systems
2) Yes, but only within individual systems e.g. receipts duplicated in expense claims
3) Sometimes, but only after both payments have been made
4) No, we find it very hard to spot duplicates at all
Poll
Canyoube100%surethatallcontractuallynegotiateddiscountsarereflectedinyourinvoicing?
1) Yes,we'reverysurewegetallthediscountswe'venegotiated
2)Yes,onthewholewethinkthatdiscountsareshownintheinvoiceswereceive
3)We'renotsurethateverydiscountcomesthrough,butwecertainlyseesome
4)No,wethinkwe'remissingquitealotofdiscounts

Appzen/sharedserviceslink Webcast
June 2020
The Hackett Group | P2P Top Performance
9© 2020 The Hackett Group, Inc. All rights reserved. Reproduction of this document or any portion thereof without prior written consent is prohibited.
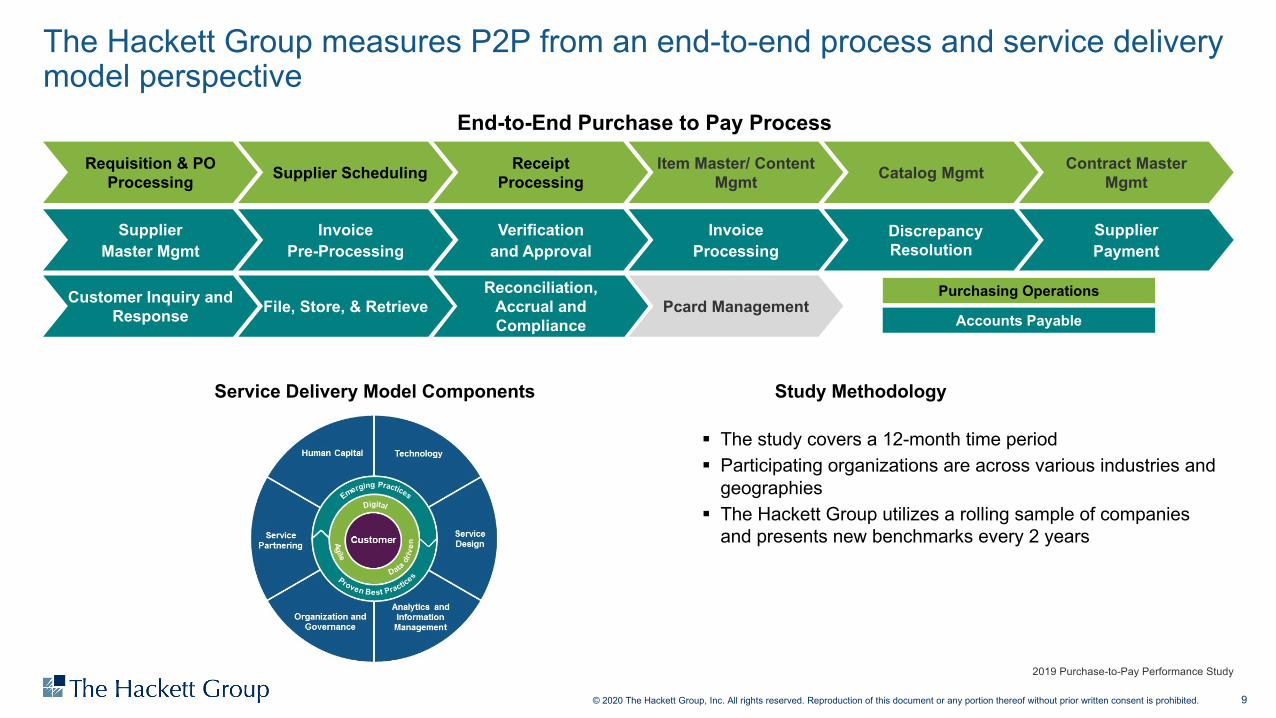
The Hackett Group measures P2P from an end-to-end process and service delivery model perspective
2019 Purchase-to-Pay Performance Study
§ The study covers a 12-month time period§ Participating organizations are across various industries and
geographies§ The Hackett Group utilizes a rolling sample of companies
and presents new benchmarks every 2 years
Service Delivery Model Components
SupplierMaster Mgmt
Verificationand Approval
InvoicePre-Processing
InvoiceProcessing
Discrepancy Resolution
SupplierPayment
Customer Inquiry and Response File, Store, & Retrieve
Reconciliation, Accrual and Compliance
Purchasing Operations
Accounts Payable
End-to-End Purchase to Pay Process
Requisition & PO Processing Supplier Scheduling Receipt
ProcessingItem Master/ Content
Mgmt Catalog Mgmt Contract Master Mgmt
Pcard Management
Study Methodology
10© 2020 The Hackett Group, Inc. All rights reserved. Reproduction of this document or any portion thereof without prior written consent is prohibited.
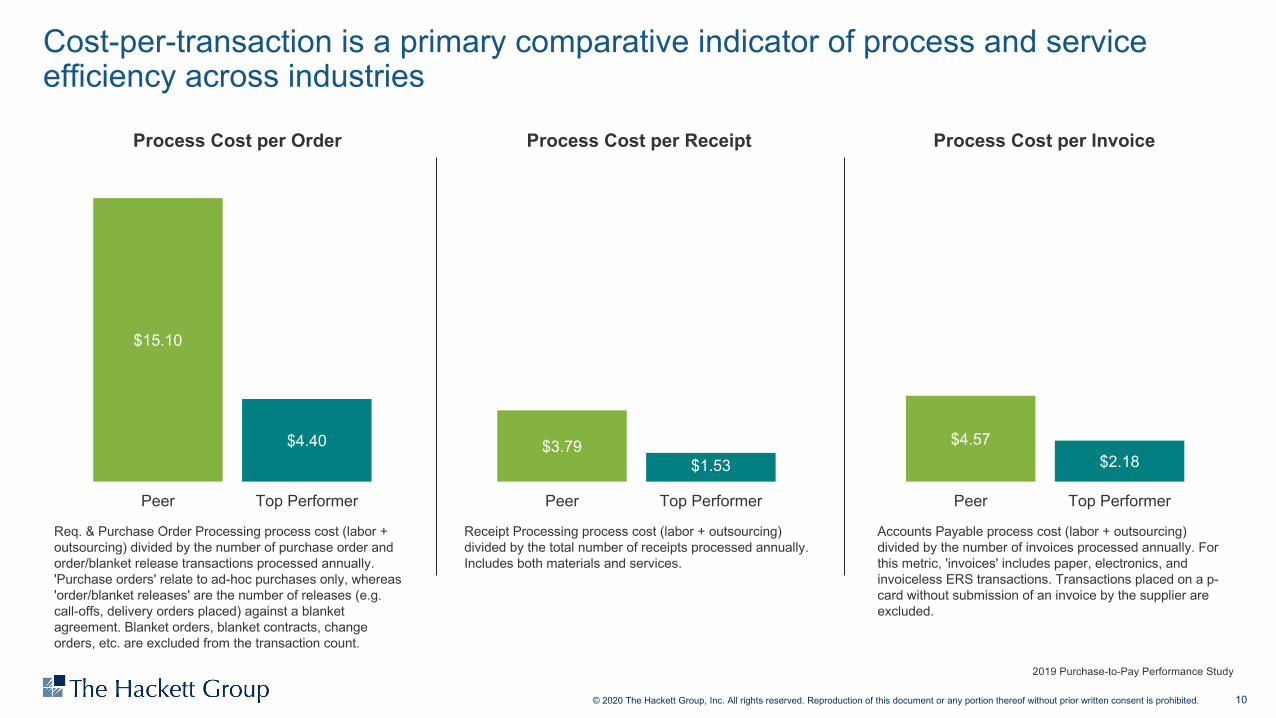
Cost-per-transaction is a primary comparative indicator of process and service efficiency across industries
2019 Purchase-to-Pay Performance Study
Req. & Purchase Order Processing process cost (labor + outsourcing) divided by the number of purchase order and order/blanket release transactions processed annually. 'Purchase orders' relate to ad-hoc purchases only, whereas 'order/blanket releases' are the number of releases (e.g. call-offs, delivery orders placed) against a blanket agreement. Blanket orders, blanket contracts, change orders, etc. are excluded from the transaction count.
Accounts Payable process cost (labor + outsourcing) divided by the number of invoices processed annually. For this metric, 'invoices' includes paper, electronics, and invoiceless ERS transactions. Transactions placed on a p-card without submission of an invoice by the supplier are excluded.
Receipt Processing process cost (labor + outsourcing) divided by the total number of receipts processed annually. Includes both materials and services.
Process Cost per Order Process Cost per Receipt Process Cost per Invoice
$15.10
$4.40
Peer Top Performer
$3.79 $1.53
Peer Top Performer
$4.57 $2.18
Peer Top Performer
11© 2020 The Hackett Group, Inc. All rights reserved. Reproduction of this document or any portion thereof without prior written consent is prohibited.
Supplier Master Data Management Process Cost per Supplier Master Update
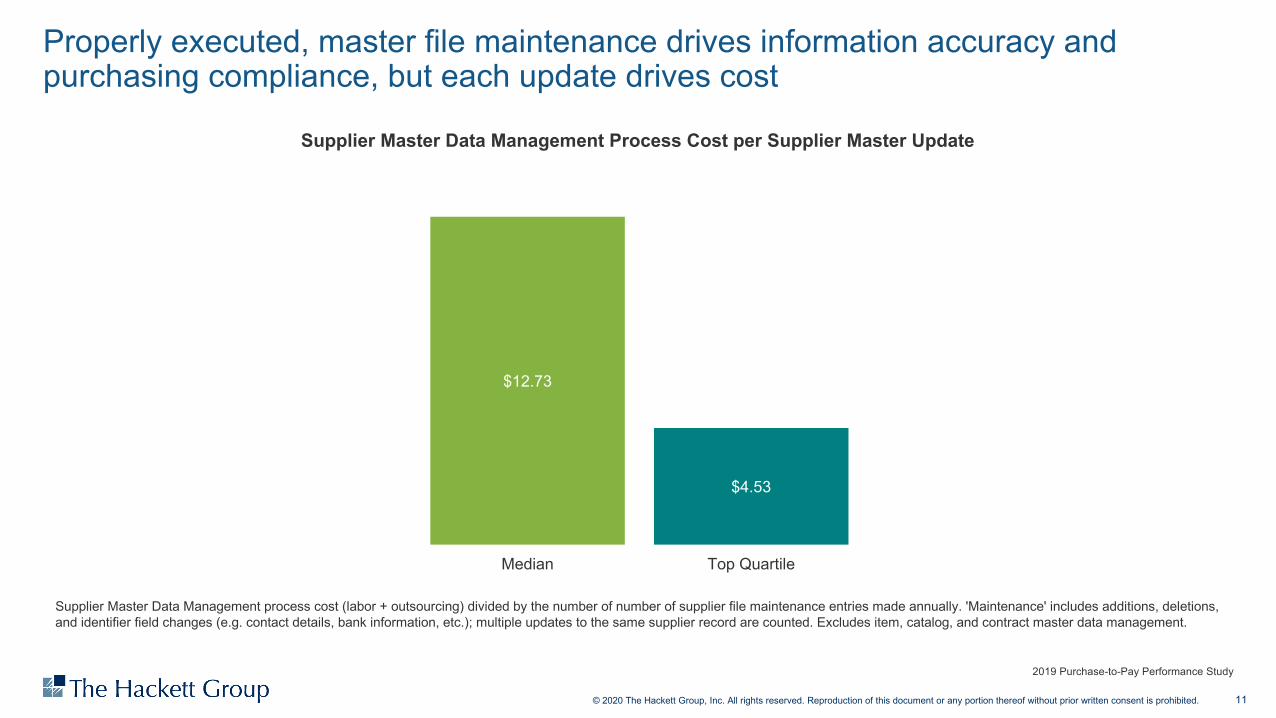
Properly executed, master file maintenance drives information accuracy and purchasing compliance, but each update drives cost
2019 Purchase-to-Pay Performance Study
$12.73
$4.53
Median Top Quartile
Supplier Master Data Management process cost (labor + outsourcing) divided by the number of number of supplier file maintenance entries made annually. 'Maintenance' includes additions, deletions, and identifier field changes (e.g. contact details, bank information, etc.); multiple updates to the same supplier record are counted. Excludes item, catalog, and contract master data management.
12© 2020 The Hackett Group, Inc. All rights reserved. Reproduction of this document or any portion thereof without prior written consent is prohibited.
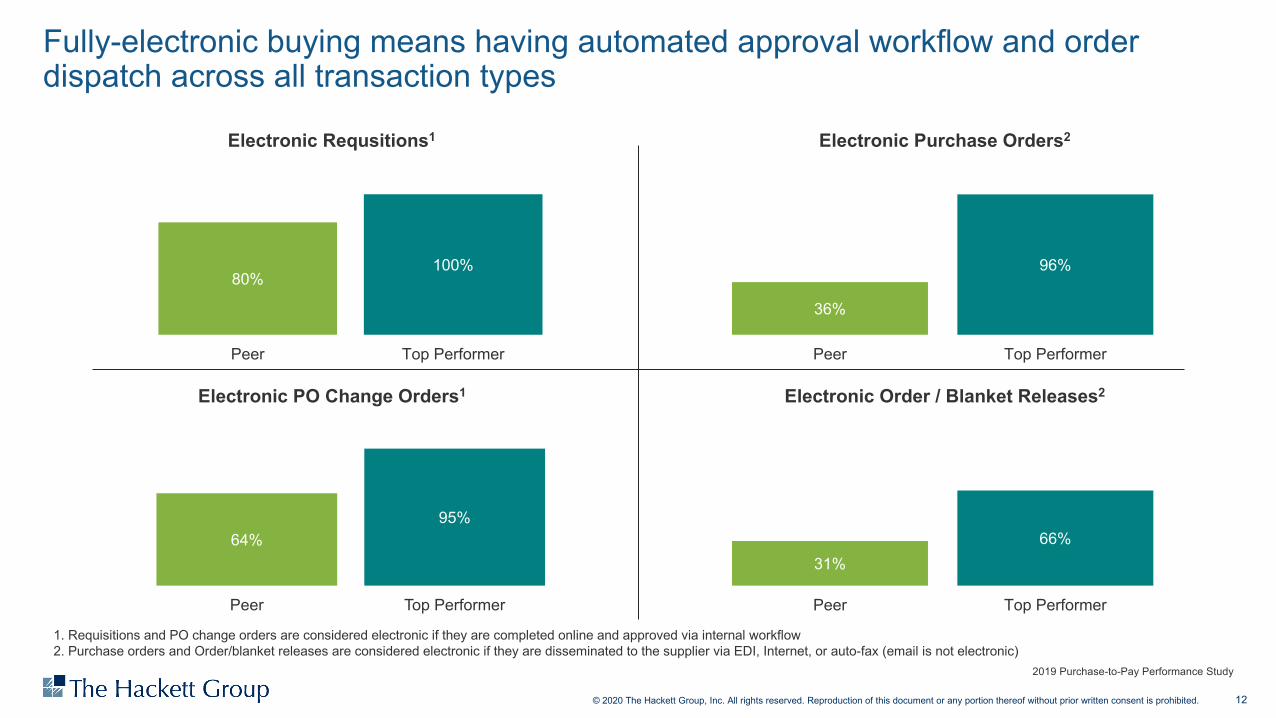
Fully-electronic buying means having automated approval workflow and order dispatch across all transaction types
2019 Purchase-to-Pay Performance Study
Electronic Requsitions1 Electronic Purchase Orders2
Electronic PO Change Orders1 Electronic Order / Blanket Releases2
1. Requisitions and PO change orders are considered electronic if they are completed online and approved via internal workflow2. Purchase orders and Order/blanket releases are considered electronic if they are disseminated to the supplier via EDI, Internet, or auto-fax (email is not electronic)
80%100%
Peer Top Performer
36%
96%
Peer Top Performer
64%95%
Peer Top Performer
31%66%
Peer Top Performer
13© 2020 The Hackett Group, Inc. All rights reserved. Reproduction of this document or any portion thereof without prior written consent is prohibited.
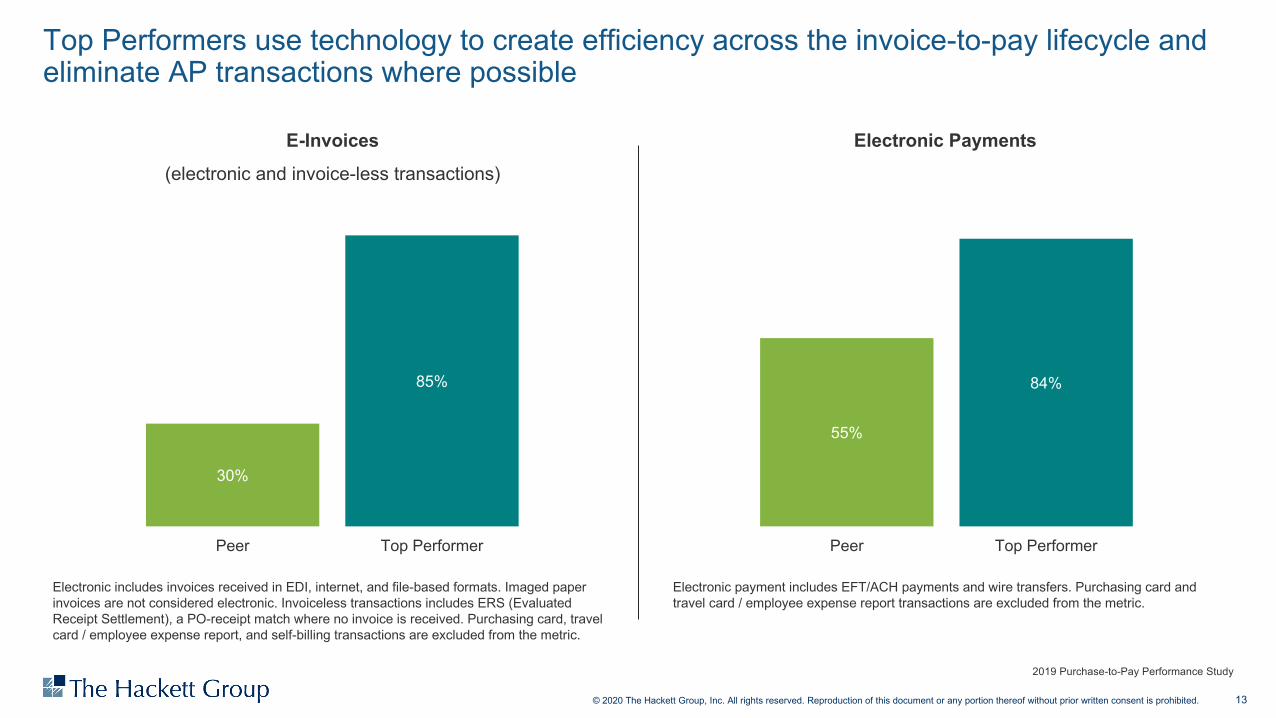
Top Performers use technology to create efficiency across the invoice-to-pay lifecycle and eliminate AP transactions where possible
2019 Purchase-to-Pay Performance Study
E-Invoices(electronic and invoice-less transactions)
Electronic Payments
Electronic includes invoices received in EDI, internet, and file-based formats. Imaged paper invoices are not considered electronic. Invoiceless transactions includes ERS (Evaluated Receipt Settlement), a PO-receipt match where no invoice is received. Purchasing card, travel card / employee expense report, and self-billing transactions are excluded from the metric.
Electronic payment includes EFT/ACH payments and wire transfers. Purchasing card and travel card / employee expense report transactions are excluded from the metric.
30%
85%
Peer Top Performer
55%
84%
Peer Top Performer
14© 2020 The Hackett Group, Inc. All rights reserved. Reproduction of this document or any portion thereof without prior written consent is prohibited.
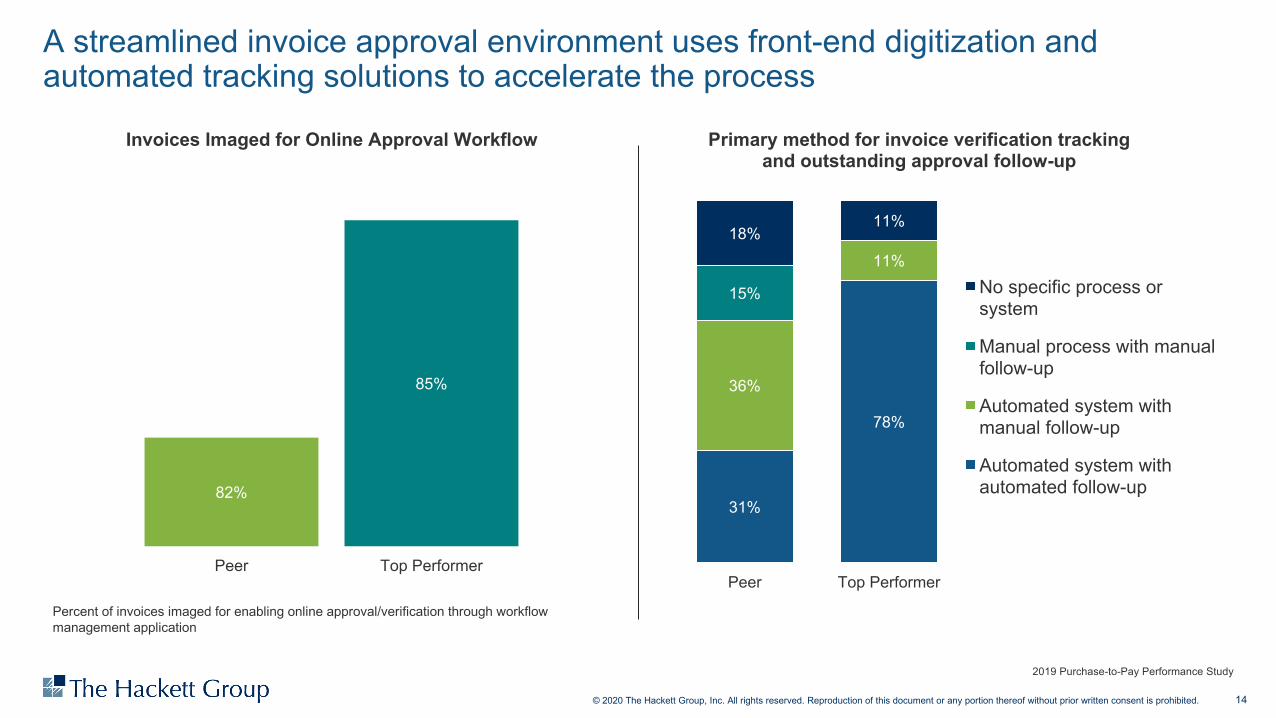
A streamlined invoice approval environment uses front-end digitization and automated tracking solutions to accelerate the process
2019 Purchase-to-Pay Performance Study
Invoices Imaged for Online Approval Workflow Primary method for invoice verification tracking and outstanding approval follow-up
31%
78%
36%
11%
15%
18%11%
Peer Top Performer
No specific process or system
Manual process with manual follow-up
Automated system with manual follow-up
Automated system with automated follow-up
Percent of invoices imaged for enabling online approval/verification through workflow management application
82%
85%
Peer Top Performer
15© 2020 The Hackett Group, Inc. All rights reserved. Reproduction of this document or any portion thereof without prior written consent is prohibited.
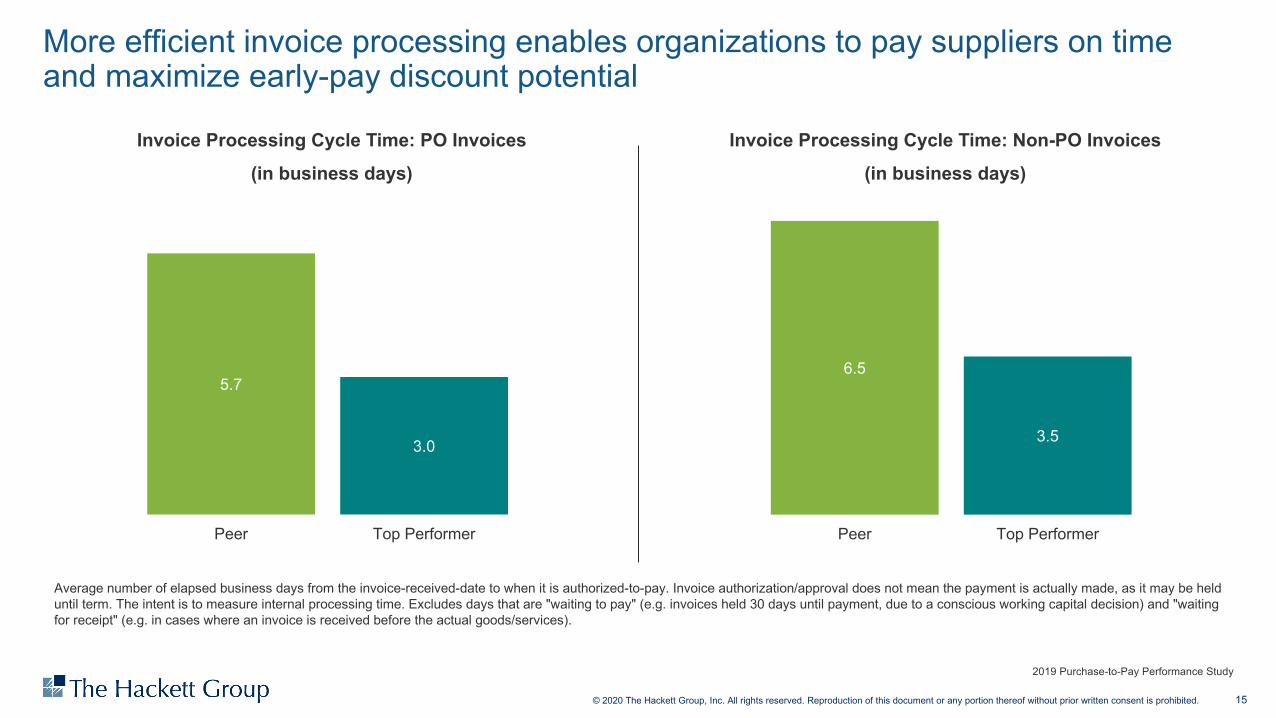
More efficient invoice processing enables organizations to pay suppliers on time and maximize early-pay discount potential
2019 Purchase-to-Pay Performance Study
Invoice Processing Cycle Time: PO Invoices(in business days)
Invoice Processing Cycle Time: Non-PO Invoices(in business days)
Average number of elapsed business days from the invoice-received-date to when it is authorized-to-pay. Invoice authorization/approval does not mean the payment is actually made, as it may be held until term. The intent is to measure internal processing time. Excludes days that are "waiting to pay" (e.g. invoices held 30 days until payment, due to a conscious working capital decision) and "waiting for receipt" (e.g. in cases where an invoice is received before the actual goods/services).
5.7
3.0
Peer Top Performer
6.5
3.5
Peer Top Performer
16© 2020 The Hackett Group, Inc. All rights reserved. Reproduction of this document or any portion thereof without prior written consent is prohibited.
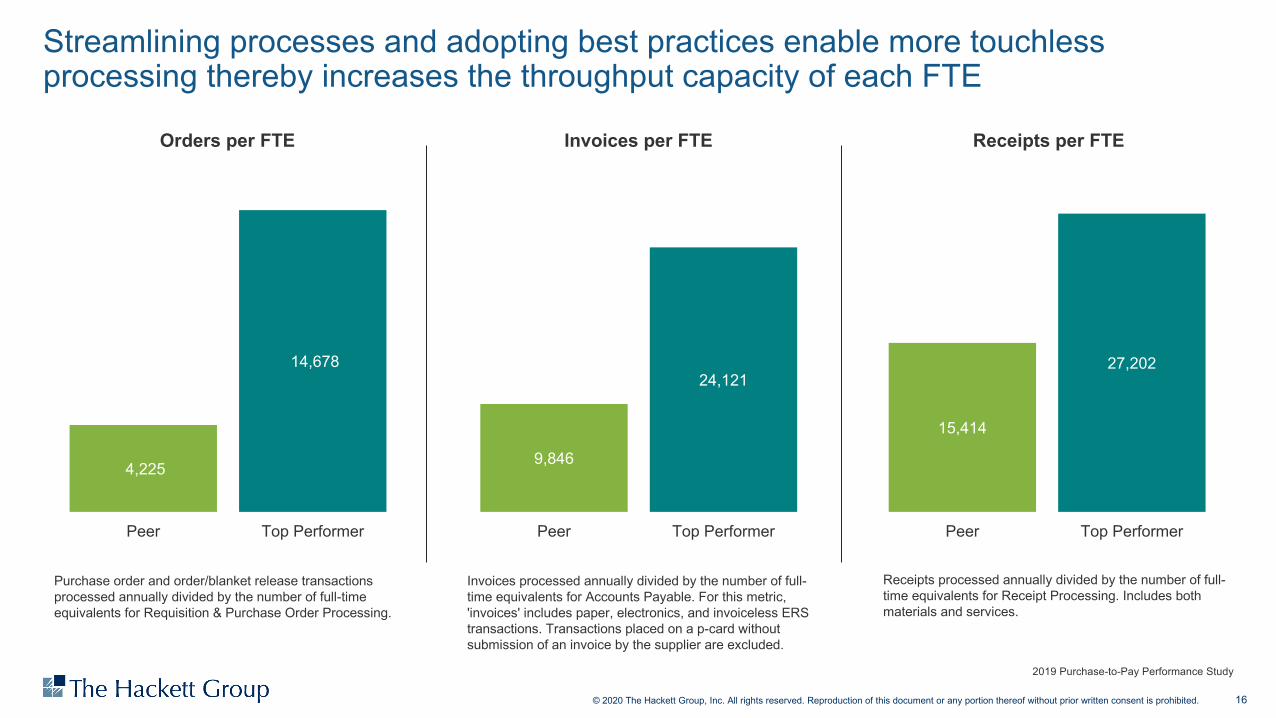
Streamlining processes and adopting best practices enable more touchless processing thereby increases the throughput capacity of each FTE
2019 Purchase-to-Pay Performance Study
Orders per FTE Invoices per FTE Receipts per FTE
Purchase order and order/blanket release transactions processed annually divided by the number of full-time equivalents for Requisition & Purchase Order Processing.
Invoices processed annually divided by the number of full-time equivalents for Accounts Payable. For this metric, 'invoices' includes paper, electronics, and invoiceless ERS transactions. Transactions placed on a p-card without submission of an invoice by the supplier are excluded.
Receipts processed annually divided by the number of full-time equivalents for Receipt Processing. Includes both materials and services.
9,846
24,121
Peer Top Performer
15,414
27,202
Peer Top Performer
4,225
14,678
Peer Top Performer
17© 2020 The Hackett Group, Inc. All rights reserved. Reproduction of this document or any portion thereof without prior written consent is prohibited.
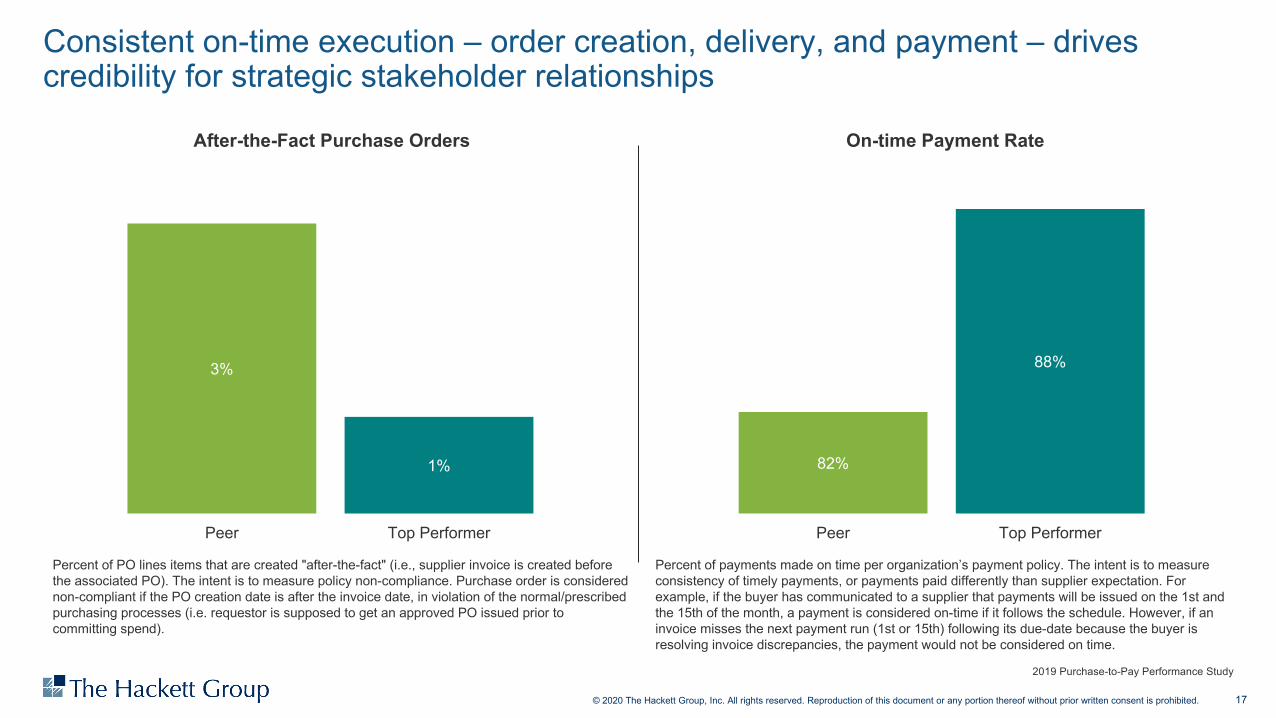
Consistent on-time execution – order creation, delivery, and payment – drives credibility for strategic stakeholder relationships
2019 Purchase-to-Pay Performance Study
After-the-Fact Purchase Orders On-time Payment Rate
Percent of PO lines items that are created "after-the-fact" (i.e., supplier invoice is created before the associated PO). The intent is to measure policy non-compliance. Purchase order is considered non-compliant if the PO creation date is after the invoice date, in violation of the normal/prescribed purchasing processes (i.e. requestor is supposed to get an approved PO issued prior to committing spend).
Percent of payments made on time per organization’s payment policy. The intent is to measure consistency of timely payments, or payments paid differently than supplier expectation. For example, if the buyer has communicated to a supplier that payments will be issued on the 1st and the 15th of the month, a payment is considered on-time if it follows the schedule. However, if an invoice misses the next payment run (1st or 15th) following its due-date because the buyer is resolving invoice discrepancies, the payment would not be considered on time.
3%
1%
Peer Top Performer
82%
88%
Peer Top Performer
18© 2020 The Hackett Group, Inc. All rights reserved. Reproduction of this document or any portion thereof without prior written consent is prohibited.
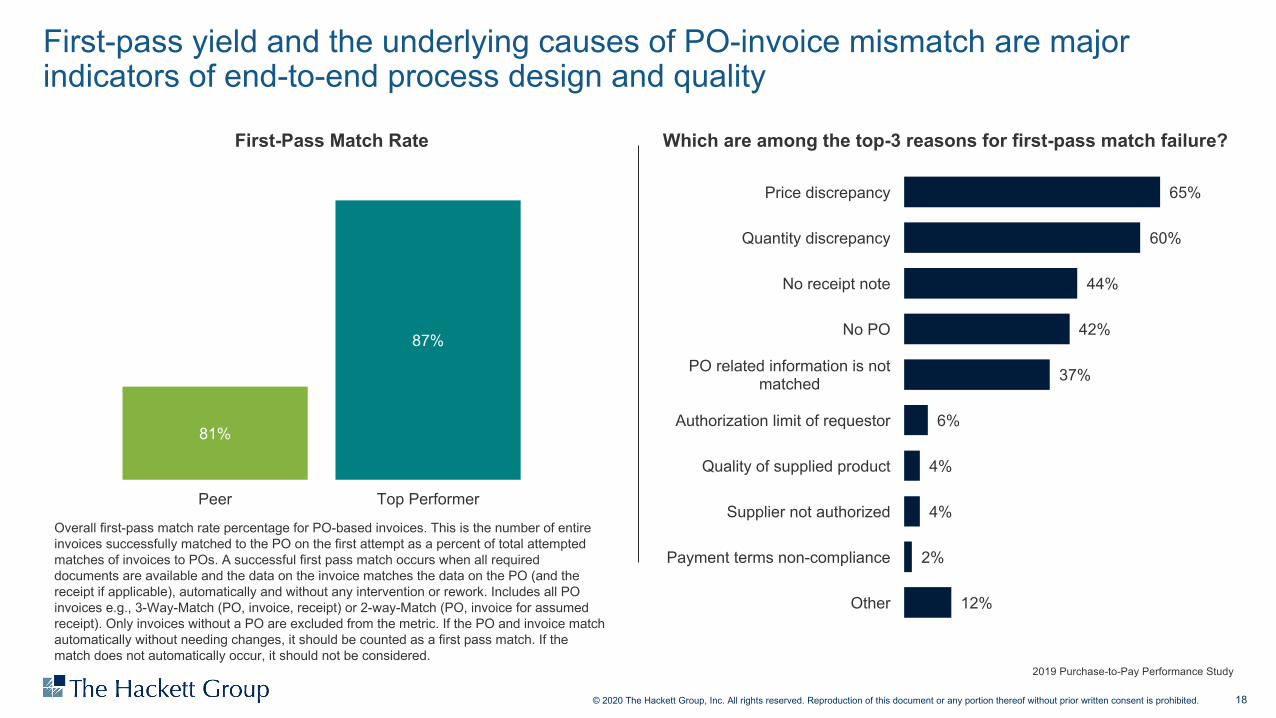
First-pass yield and the underlying causes of PO-invoice mismatch are major indicators of end-to-end process design and quality
2019 Purchase-to-Pay Performance Study
First-Pass Match Rate Which are among the top-3 reasons for first-pass match failure?
Overall first-pass match rate percentage for PO-based invoices. This is the number of entire invoices successfully matched to the PO on the first attempt as a percent of total attempted matches of invoices to POs. A successful first pass match occurs when all required documents are available and the data on the invoice matches the data on the PO (and the receipt if applicable), automatically and without any intervention or rework. Includes all PO invoices e.g., 3-Way-Match (PO, invoice, receipt) or 2-way-Match (PO, invoice for assumed receipt). Only invoices without a PO are excluded from the metric. If the PO and invoice match automatically without needing changes, it should be counted as a first pass match. If the match does not automatically occur, it should not be considered.
65%
60%
44%
42%
37%
6%
4%
4%
2%
12%
Price discrepancy
Quantity discrepancy
No receipt note
No PO
PO related information is not matched
Authorization limit of requestor
Quality of supplied product
Supplier not authorized
Payment terms non-compliance
Other
81%
87%
Peer Top Performer
19© 2020 The Hackett Group, Inc. All rights reserved. Reproduction of this document or any portion thereof without prior written consent is prohibited.
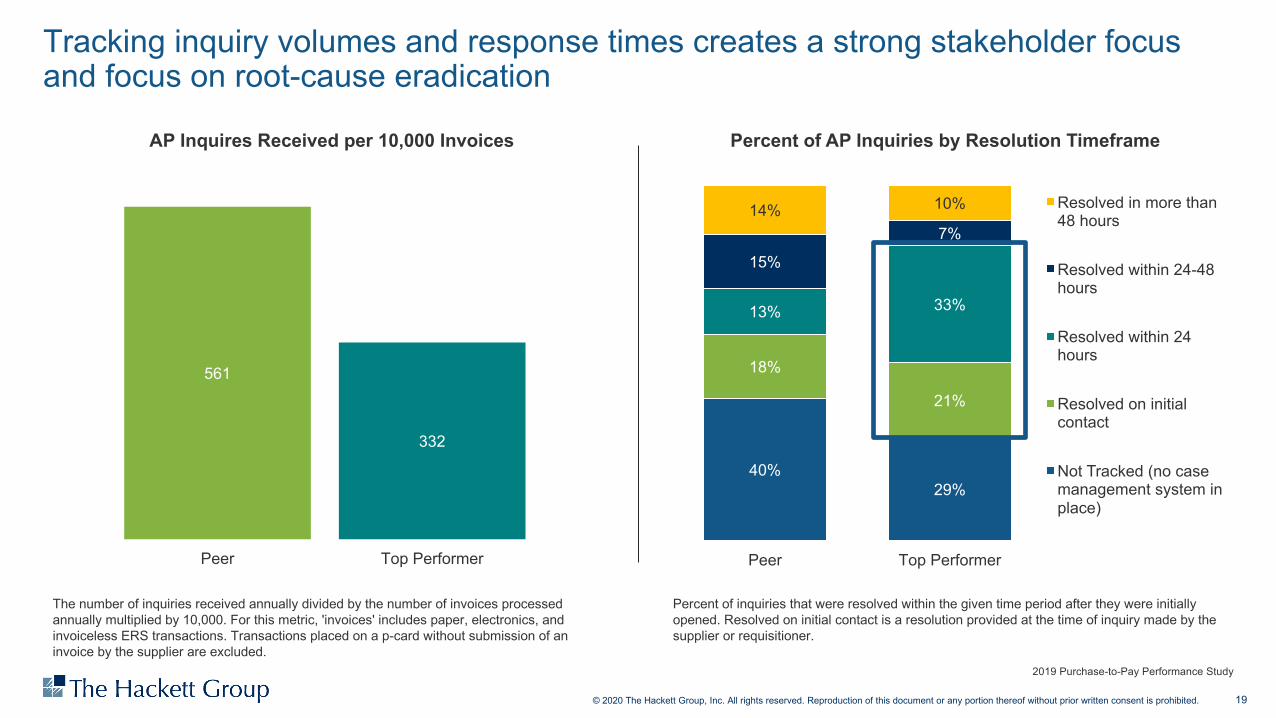
Tracking inquiry volumes and response times creates a strong stakeholder focus and focus on root-cause eradication
2019 Purchase-to-Pay Performance Study
AP Inquires Received per 10,000 Invoices Percent of AP Inquiries by Resolution Timeframe
40%29%
18%
21%
13% 33%
15%
7%14% 10%
Peer Top Performer
Resolved in more than 48 hours
Resolved within 24-48 hours
Resolved within 24 hours
Resolved on initial contact
Not Tracked (no case management system in place)
The number of inquiries received annually divided by the number of invoices processed annually multiplied by 10,000. For this metric, 'invoices' includes paper, electronics, and invoiceless ERS transactions. Transactions placed on a p-card without submission of an invoice by the supplier are excluded.
Percent of inquiries that were resolved within the given time period after they were initially opened. Resolved on initial contact is a resolution provided at the time of inquiry made by the supplier or requisitioner.
561
332
Peer Top Performer
20© 2020 The Hackett Group, Inc. All rights reserved. Reproduction of this document or any portion thereof without prior written consent is prohibited.
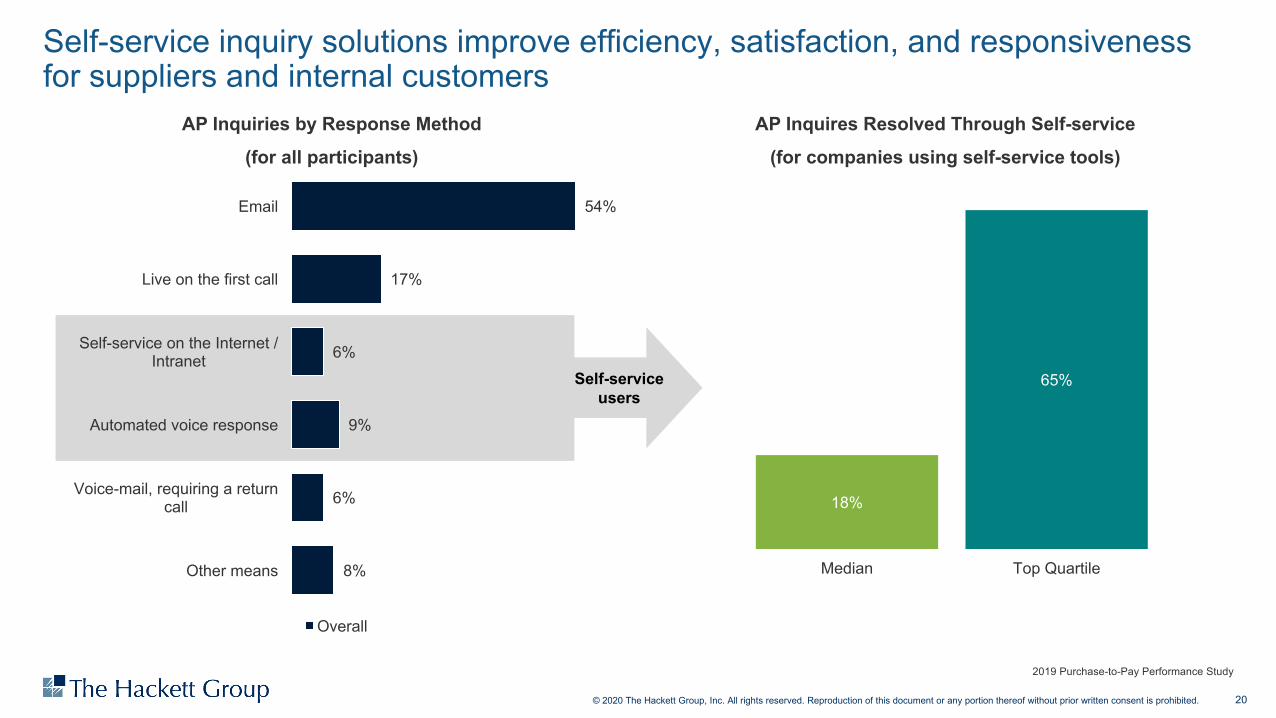
Self-service inquiry solutions improve efficiency, satisfaction, and responsiveness for suppliers and internal customers
2019 Purchase-to-Pay Performance Study
Self-service users
AP Inquiries by Response Method(for all participants)
AP Inquires Resolved Through Self-service(for companies using self-service tools)
18%
65%
Median Top Quartile
54%
17%
6%
9%
6%
8%
Live on the first call
Self-service on the Internet / Intranet
Automated voice response
Voice-mail, requiring a return call
Other means
Overall
21© 2020 The Hackett Group, Inc. All rights reserved. Reproduction of this document or any portion thereof without prior written consent is prohibited.
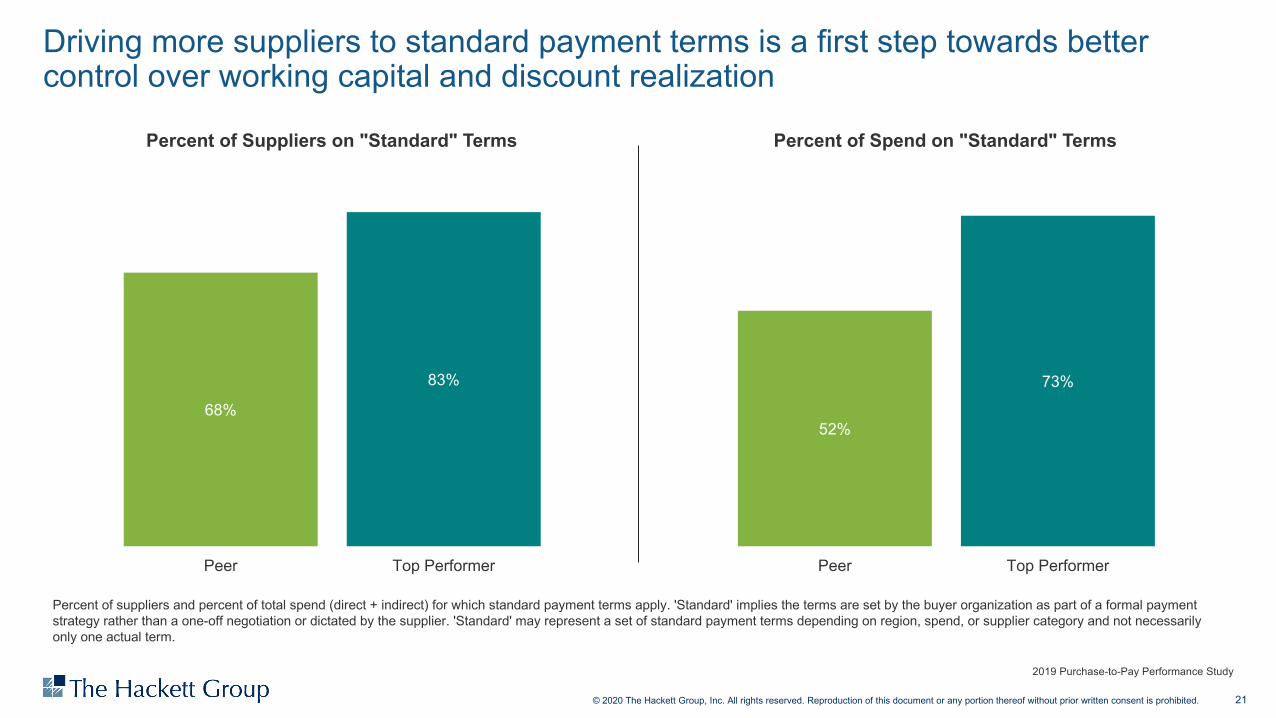
Driving more suppliers to standard payment terms is a first step towards better control over working capital and discount realization
2019 Purchase-to-Pay Performance Study
Percent of Suppliers on "Standard" Terms Percent of Spend on "Standard" Terms
Percent of suppliers and percent of total spend (direct + indirect) for which standard payment terms apply. 'Standard' implies the terms are set by the buyer organization as part of a formal payment strategy rather than a one-off negotiation or dictated by the supplier. 'Standard' may represent a set of standard payment terms depending on region, spend, or supplier category and not necessarily only one actual term.
68%
83%
Peer Top Performer
52%
73%
Peer Top Performer
22© 2020 The Hackett Group, Inc. All rights reserved. Reproduction of this document or any portion thereof without prior written consent is prohibited.
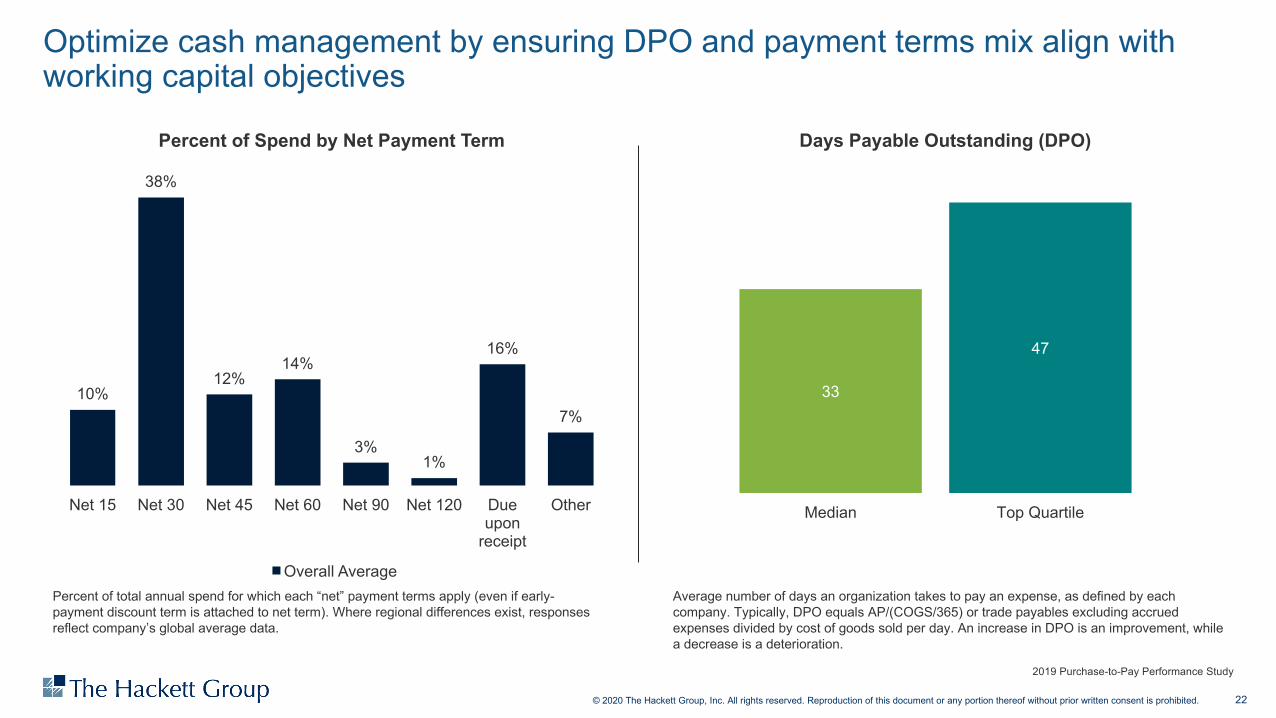
33
47
Median Top Quartile
Optimize cash management by ensuring DPO and payment terms mix align with working capital objectives
2019 Purchase-to-Pay Performance Study
10%
38%
12%14%
3%1%
16%
7%
Net 15 Net 30 Net 45 Net 60 Net 90 Net 120 Due upon
receipt
Other
Overall Average
Percent of Spend by Net Payment Term Days Payable Outstanding (DPO)
Percent of total annual spend for which each “net” payment terms apply (even if early-payment discount term is attached to net term). Where regional differences exist, responses reflect company’s global average data.
Average number of days an organization takes to pay an expense, as defined by each company. Typically, DPO equals AP/(COGS/365) or trade payables excluding accrued expenses divided by cost of goods sold per day. An increase in DPO is an improvement, while a decrease is a deterioration.
23© 2020 The Hackett Group, Inc. All rights reserved. Reproduction of this document or any portion thereof without prior written consent is prohibited.
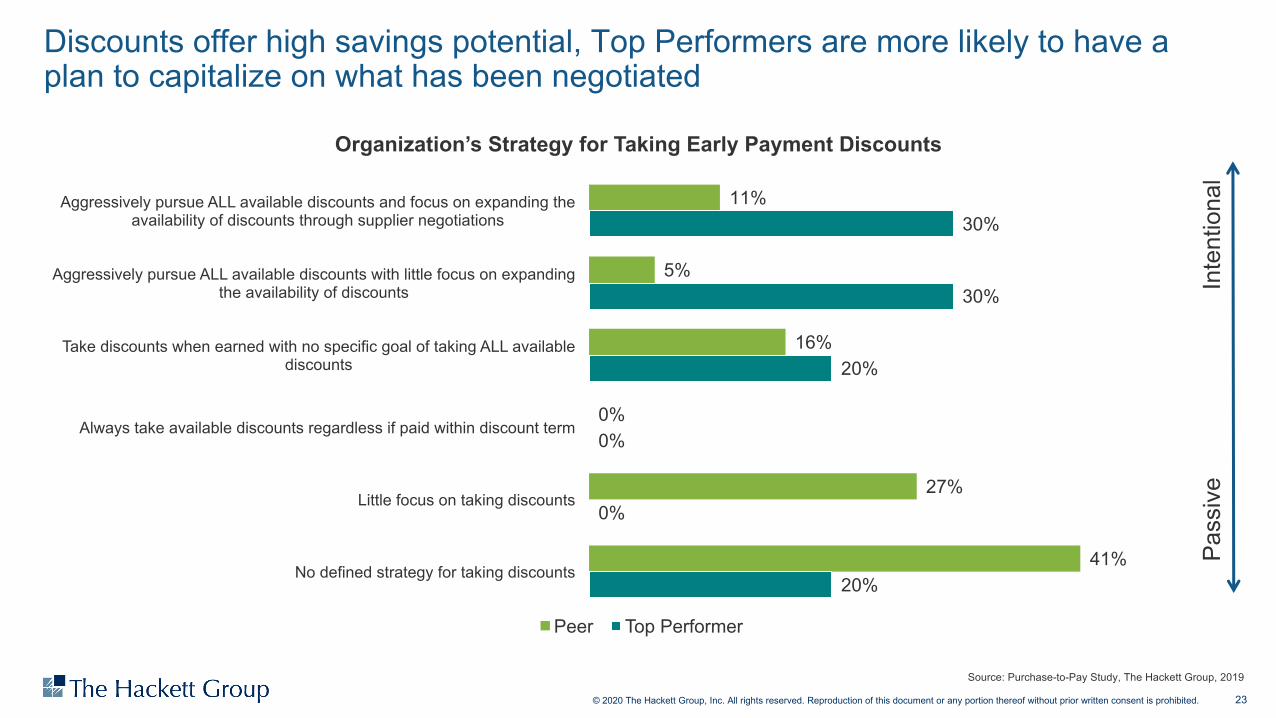
Discounts offer high savings potential, Top Performers are more likely to have a plan to capitalize on what has been negotiated
11%
5%
16%
0%
27%
41%
30%
30%
20%
0%
0%
20%
Aggressively pursue ALL available discounts and focus on expanding the availability of discounts through supplier negotiations
Aggressively pursue ALL available discounts with little focus on expanding the availability of discounts
Take discounts when earned with no specific goal of taking ALL available discounts
Always take available discounts regardless if paid within discount term
Little focus on taking discounts
No defined strategy for taking discounts
Peer Top Performer
Organization’s Strategy for Taking Early Payment Discounts
Source: Purchase-to-Pay Study, The Hackett Group, 2019
Inte
ntio
nal
Pass
ive
24© 2020 The Hackett Group, Inc. All rights reserved. Reproduction of this document or any portion thereof without prior written consent is prohibited.
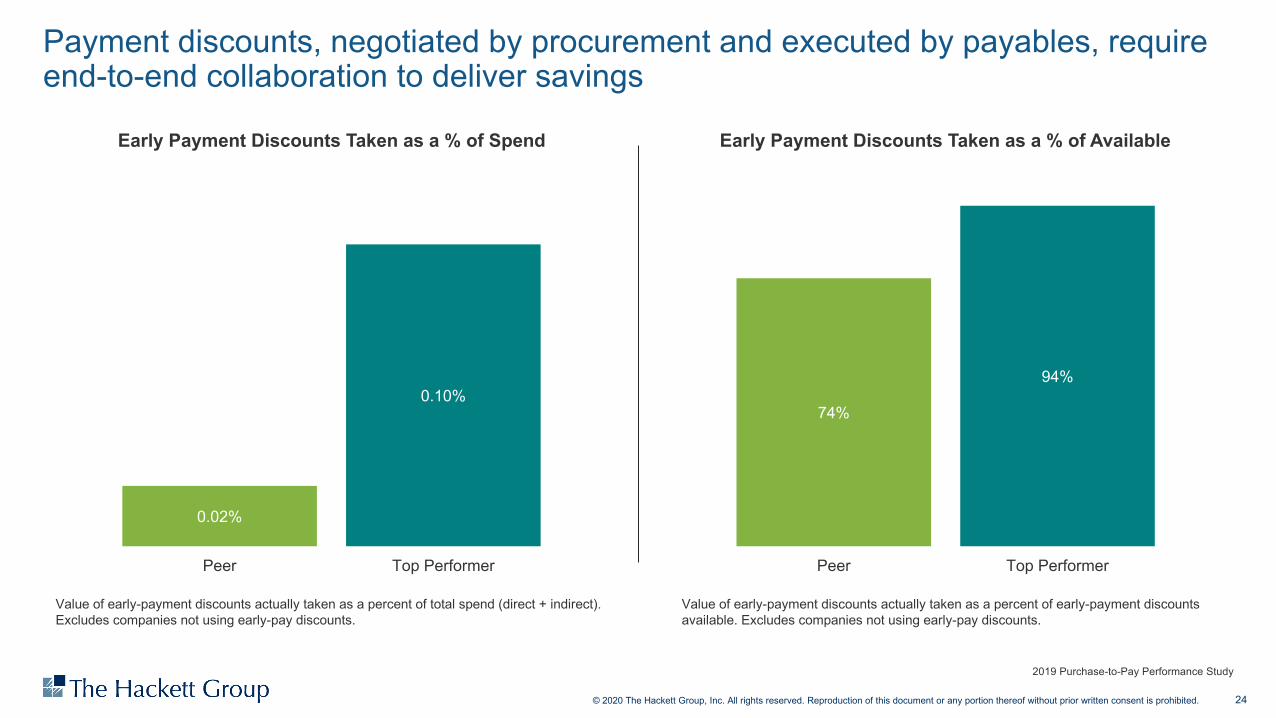
Payment discounts, negotiated by procurement and executed by payables, require end-to-end collaboration to deliver savings
2019 Purchase-to-Pay Performance Study
Early Payment Discounts Taken as a % of Spend Early Payment Discounts Taken as a % of Available
Value of early-payment discounts actually taken as a percent of total spend (direct + indirect). Excludes companies not using early-pay discounts.
Value of early-payment discounts actually taken as a percent of early-payment discounts available. Excludes companies not using early-pay discounts.
0.02%
0.10%
Peer Top Performer
74%
94%
Peer Top Performer
25© 2020 The Hackett Group, Inc. All rights reserved. Reproduction of this document or any portion thereof without prior written consent is prohibited.
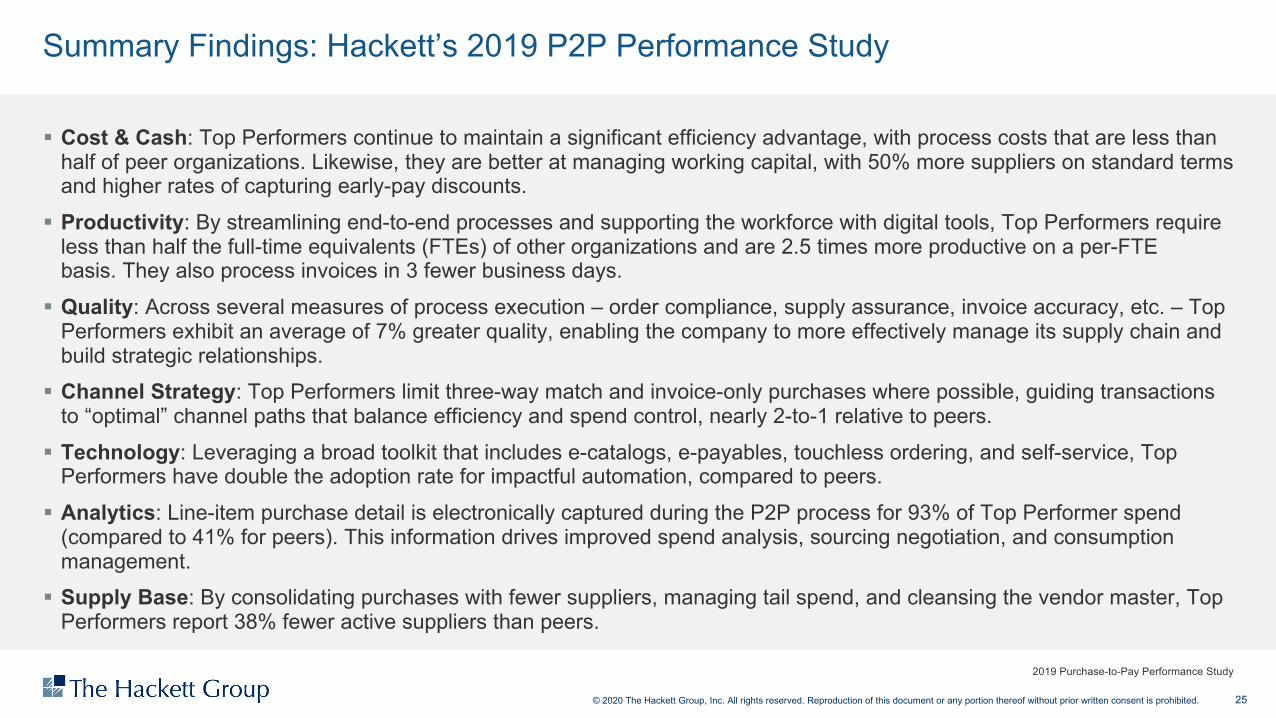
§ Cost & Cash: Top Performers continue to maintain a significant efficiency advantage, with process costs that are less than half of peer organizations. Likewise, they are better at managing working capital, with 50% more suppliers on standard terms and higher rates of capturing early-pay discounts.
§ Productivity: By streamlining end-to-end processes and supporting the workforce with digital tools, Top Performers require less than half the full-time equivalents (FTEs) of other organizations and are 2.5 times more productive on a per-FTE basis. They also process invoices in 3 fewer business days.
§ Quality: Across several measures of process execution – order compliance, supply assurance, invoice accuracy, etc. – Top Performers exhibit an average of 7% greater quality, enabling the company to more effectively manage its supply chain and build strategic relationships.
§ Channel Strategy: Top Performers limit three-way match and invoice-only purchases where possible, guiding transactions to “optimal” channel paths that balance efficiency and spend control, nearly 2-to-1 relative to peers.
§ Technology: Leveraging a broad toolkit that includes e-catalogs, e-payables, touchless ordering, and self-service, Top Performers have double the adoption rate for impactful automation, compared to peers.
§ Analytics: Line-item purchase detail is electronically captured during the P2P process for 93% of Top Performer spend (compared to 41% for peers). This information drives improved spend analysis, sourcing negotiation, and consumption management.
§ Supply Base: By consolidating purchases with fewer suppliers, managing tail spend, and cleansing the vendor master, Top Performers report 38% fewer active suppliers than peers.
Summary Findings: Hackett’s 2019 P2P Performance Study
2019 Purchase-to-Pay Performance Study
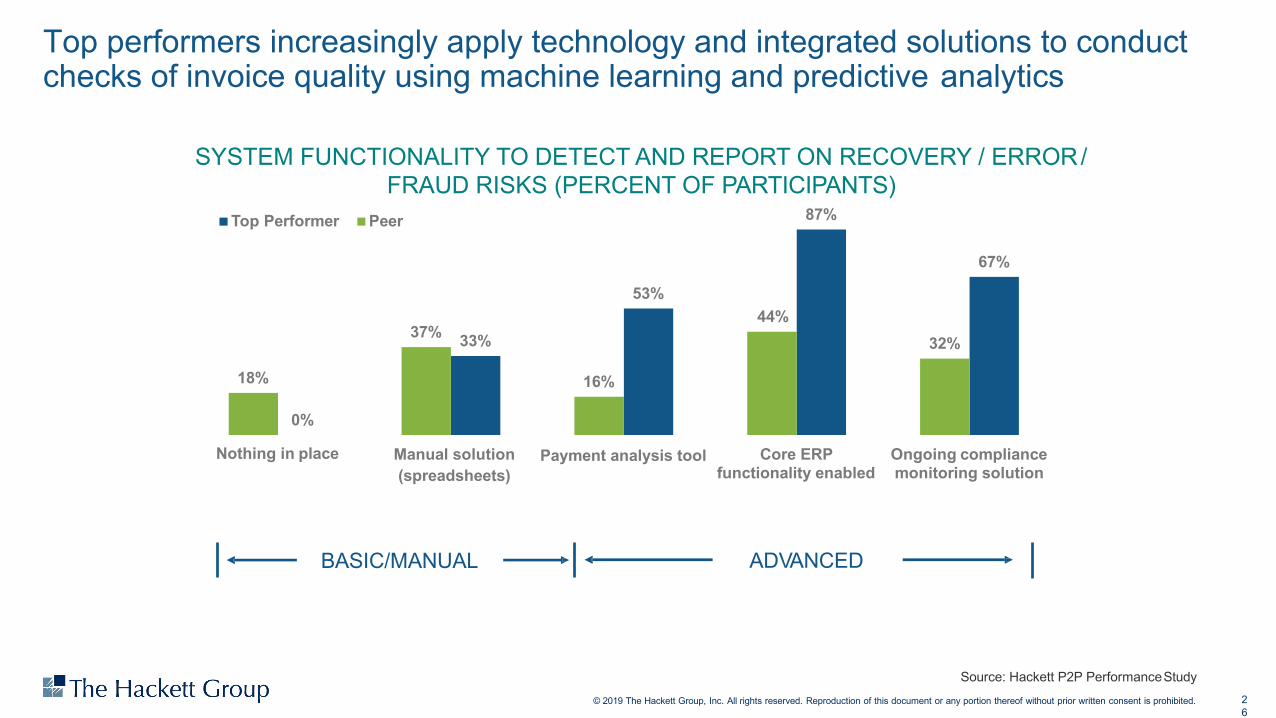
Top performers increasingly apply technology and integrated solutions to conduct checks of invoice quality using machine learning and predictive analytics
67%
87%
33%
0%
32%
53%44%
16%
37%
18%
Ongoing compliance monitoring solution
Core ERP functionality enabled
Manual solution(spreadsheets)
Nothing in place
Top Performer Peer
ADVANCEDBASIC/MANUAL
SYSTEM FUNCTIONALITY TO DETECT AND REPORT ON RECOVERY / ERROR/FRAUD RISKS (PERCENT OF PARTICIPANTS)
Source: Hackett P2P PerformanceStudy© 2019 The Hackett Group, Inc. All rights reserved. Reproduction of this document or any portion thereof without prior written consent is prohibited. 2
6
Payment analysis tool
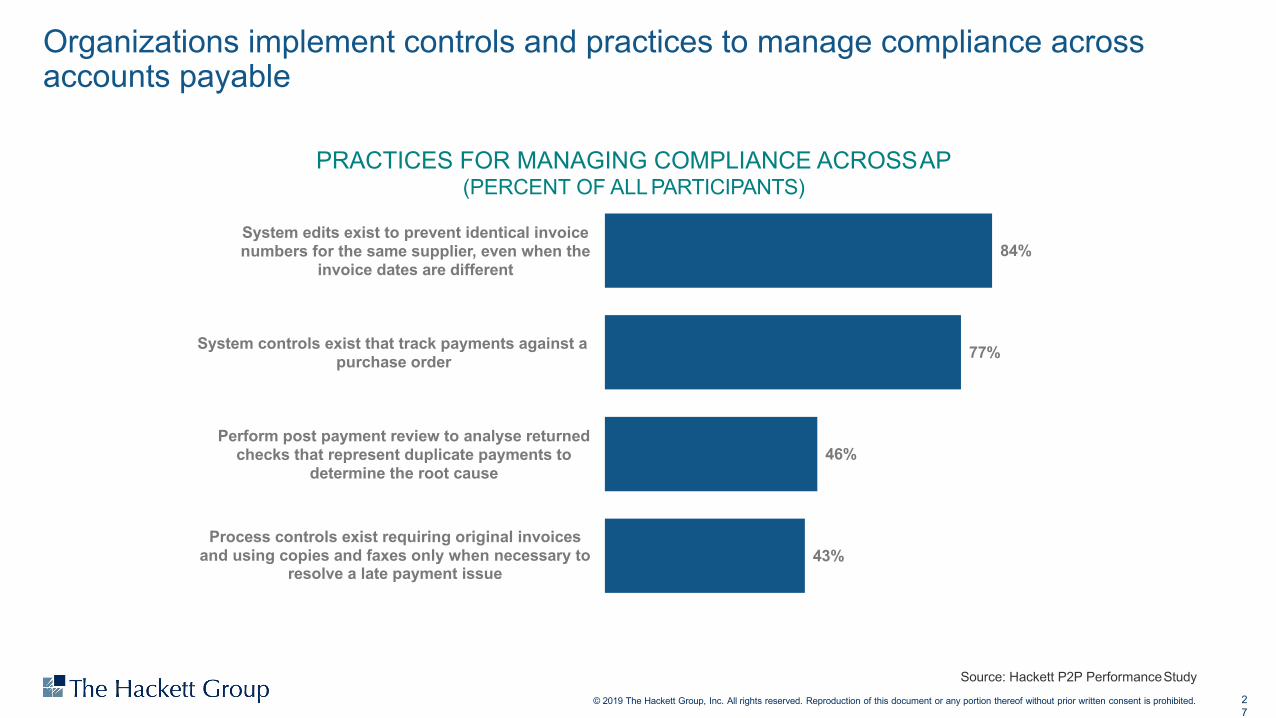
Organizations implement controls and practices to manage compliance across accounts payable
PRACTICES FOR MANAGING COMPLIANCE ACROSSAP(PERCENT OF ALL PARTICIPANTS)
84%
Source: Hackett P2P PerformanceStudy© 2019 The Hackett Group, Inc. All rights reserved. Reproduction of this document or any portion thereof without prior written consent is prohibited. 2
7
77%
46%
43%
System edits exist to prevent identical invoice numbers for the same supplier, even when the
invoice dates are different
System controls exist that track payments against a purchase order
Perform post payment review to analyse returned checks that represent duplicate payments to
determine the root cause
Process controls exist requiring original invoices and using copies and faxes only when necessary to
resolve a late payment issue

Accounts payable recoveries by type
26%
16%
15%
10%
9%
7%
7%
4%
5%
Duplicate Payments
Uncollected Credit Memos
Pricing Errors/Overpayments
Purchase Returns
Sales Tax Recovery
Missed Rebates (e.g. volume-based)
Unclaimed Property Escheatment
Missed Early PaymentDiscounts
Other
AP RECOVERIES BY TYPE (AVERAGE)
Source: Hackett P2P PerformanceStudy
Duplicate Payments are the most common types
of Accounts Payable recoveries.
28© 2019 The Hackett Group, Inc. All rights reserved. Reproduction of this document or any portion thereof without prior written consent is prohibited.
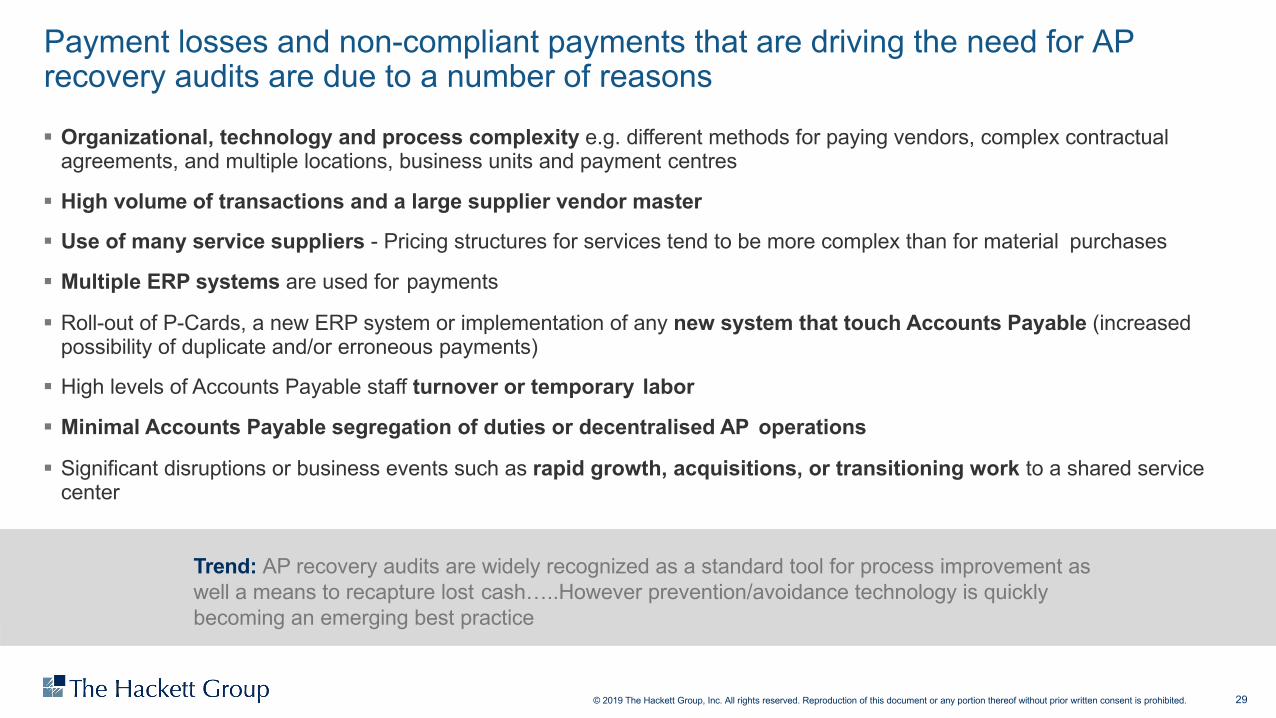
Payment losses and non-compliant payments that are driving the need for AP recovery audits are due to a number of reasons
§ Organizational, technology and process complexity e.g. different methods for paying vendors, complex contractual agreements, and multiple locations, business units and payment centres
§ High volume of transactions and a large supplier vendor master
§ Use of many service suppliers - Pricing structures for services tend to be more complex than for material purchases
§ Multiple ERP systems are used for payments
§ Roll-out of P-Cards, a new ERP system or implementation of any new system that touch Accounts Payable (increased possibility of duplicate and/or erroneous payments)
§ High levels of Accounts Payable staff turnover or temporary labor
§ Minimal Accounts Payable segregation of duties or decentralised AP operations
§ Significant disruptions or business events such as rapid growth, acquisitions, or transitioning work to a shared service center
Trend: AP recovery audits are widely recognized as a standard tool for process improvement as well a means to recapture lost cash…..However prevention/avoidance technology is quickly becoming an emerging best practice
29© 2019 The Hackett Group, Inc. All rights reserved. Reproduction of this document or any portion thereof without prior written consent is prohibited.
30© 2020 The Hackett Group, Inc. All rights reserved. Reproduction of this document or any portion thereof without prior written consent is prohibited.
Atlanta | Chicago | Frankfurt | Hyderabad | London | Miami | Montevideo
New York | Paris | Philadelphia | Portland | San Francisco | Seattle | Sydney | Vancouver
For further information about this performance study, please contact:
Bryan DeGraw
Associate PrincipalFinance Advisory Services
+770 225 7238| [email protected]
31© 2020 The Hackett Group, Inc. All rights reserved. Reproduction of this document or any portion thereof without prior written consent is prohibited.
Statement of Confidentiality and Usage Restrictions
This document contains trade secrets and other information that is company sensitive, proprietary, and confidential, the disclosure of which would provide a competitive advantage to others. As a result, the reproduction, copying, or redistribution of this document or the contents contained herein, in whole or in part, for any purpose is strictly prohibited without the prior written consent of The Hackett Group.
Copyright © 2019 The Hackett Group, Inc. All rights reserved. World-Class Defined and Enabled.
www.thehackettgroup.com
Reproduction of this document or any portion thereof without prior written consent is prohibited.
32© 2020 The Hackett Group, Inc. All rights reserved. Reproduction of this document or any portion thereof without prior written consent is prohibited.
Poll
Are you confident that you pick up all potential compliance violations in your AP process?
1) Yes, 100% of our payments are compliant with external regulations and internal policy
2) Yes, but our focus is on external regulations rather than internal policy
3) Yes, but our focus is on internal policy rather than external regulations
4) No, we have compliance concerns in our AP process

Copyright @ 2020 AppZen, Inc. | All rights reserved.
Audit 100% of Spend with Artificial Intelligence
33
Copyright @ 2020 AppZen, Inc. | All rights reserved.
Becoming a Top Performer…..
• Eliminate duplicates and other invoicing errors such as incorrect pricing
• Implement controls and practices to manage compliance across accounts payable
• Payment discounts require end-to-end collaboration to deliver savings
• Touchless processing to increase the throughput capacity of each FTE
• Why AppZen recommend Discovery, rather than Recovery, audit
……requires controls and checks across the entire purchase-to-pay process
34
35
Finance teams are under pressureq Contain costs with fast-turn projects
q Find operational efficiencies
q Adapt to remote work
36
Spend control with AIq Review, understand and validate
every line of every transaction, before payment
q Automate & accelerate processes
q Real-time, line-level visibility across 100% of spend
q AI that sits along side existing investments in AP Automation
Copyright @ 2020 AppZen, Inc. | All rights reserved.
What do Top Performers aim to eliminate from their AP?
37
Copyright @ 2020 AppZen, Inc. | All rights reserved.
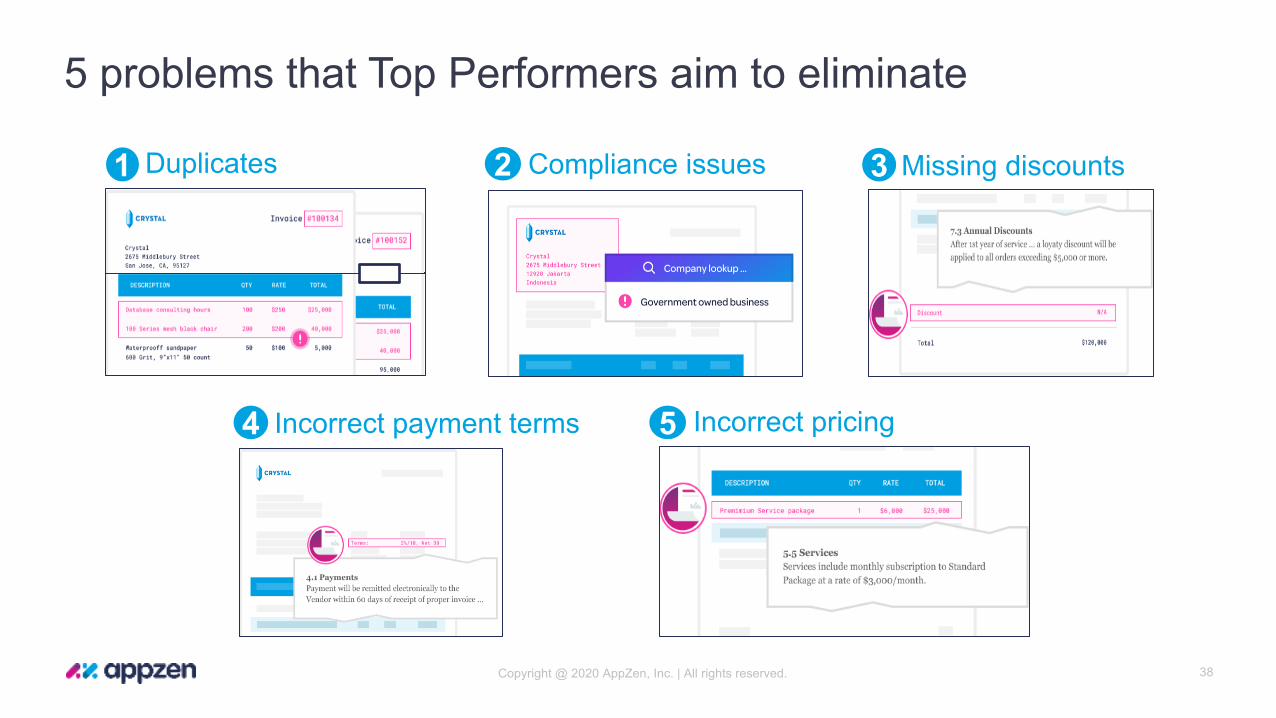
5 problems that Top Performers aim to eliminate
38
Duplicates Compliance issues Missing discounts
Incorrect payment terms Incorrect pricing
1 2 3
4 5
Copyright @ 2020 AppZen, Inc. | All rights reserved.
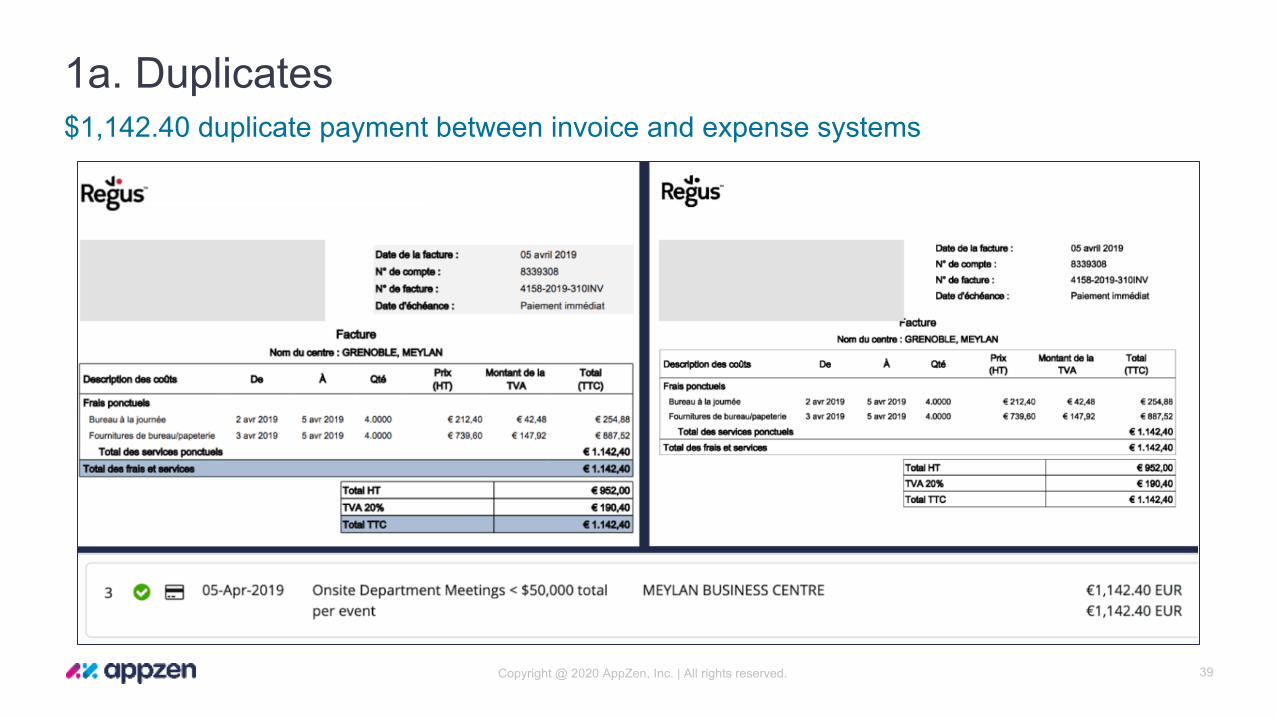
1a. Duplicates
39
$1,142.40 duplicate payment between invoice and expense systems
Copyright @ 2020 AppZen, Inc. | All rights reserved.
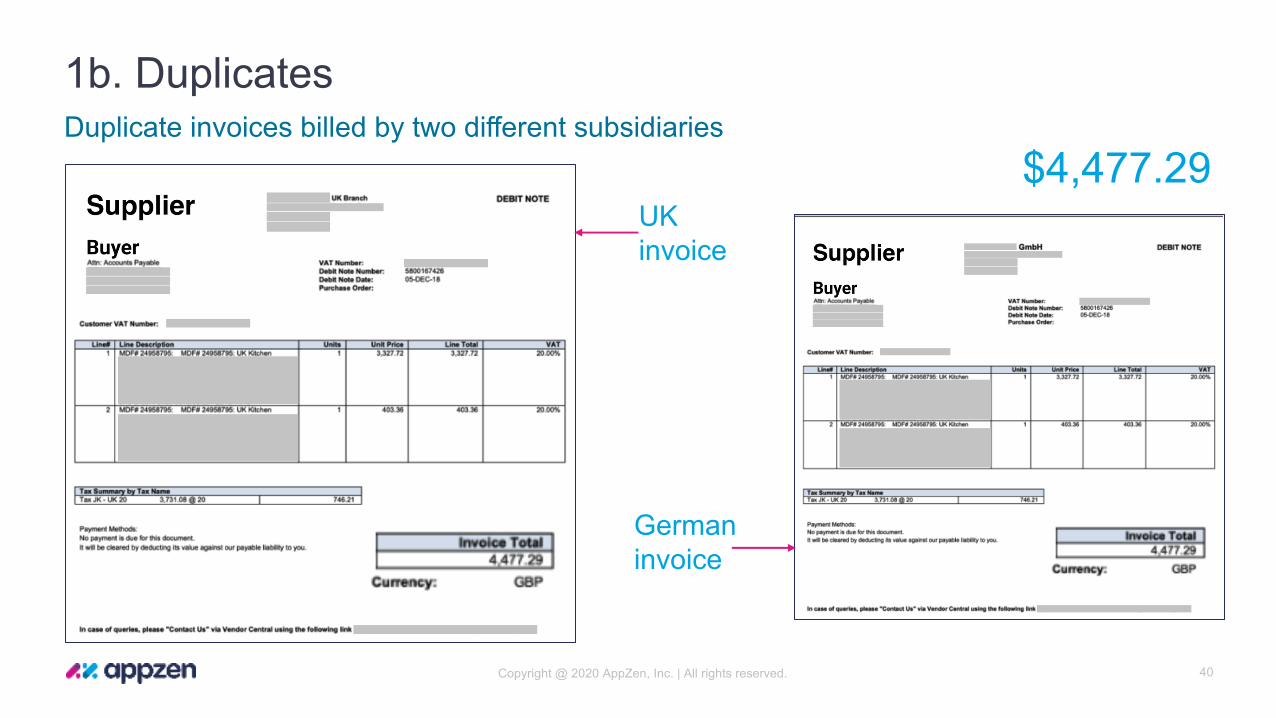
1b. Duplicates
40
Duplicate invoices billed by two different subsidiaries
• German invoice
$4,477.29
German invoice
UK invoice
Copyright @ 2020 AppZen, Inc. | All rights reserved.
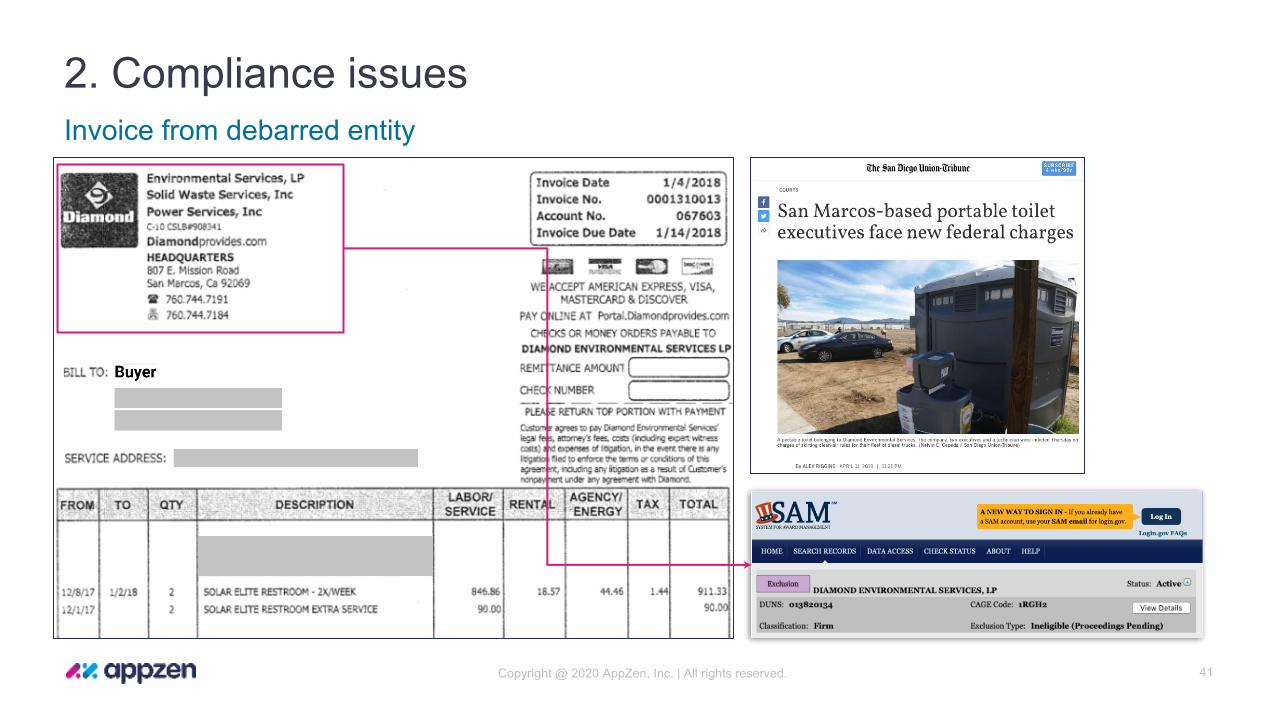
2. Compliance issues
41
Invoice from debarred entity
Copyright @ 2020 AppZen, Inc. | All rights reserved.
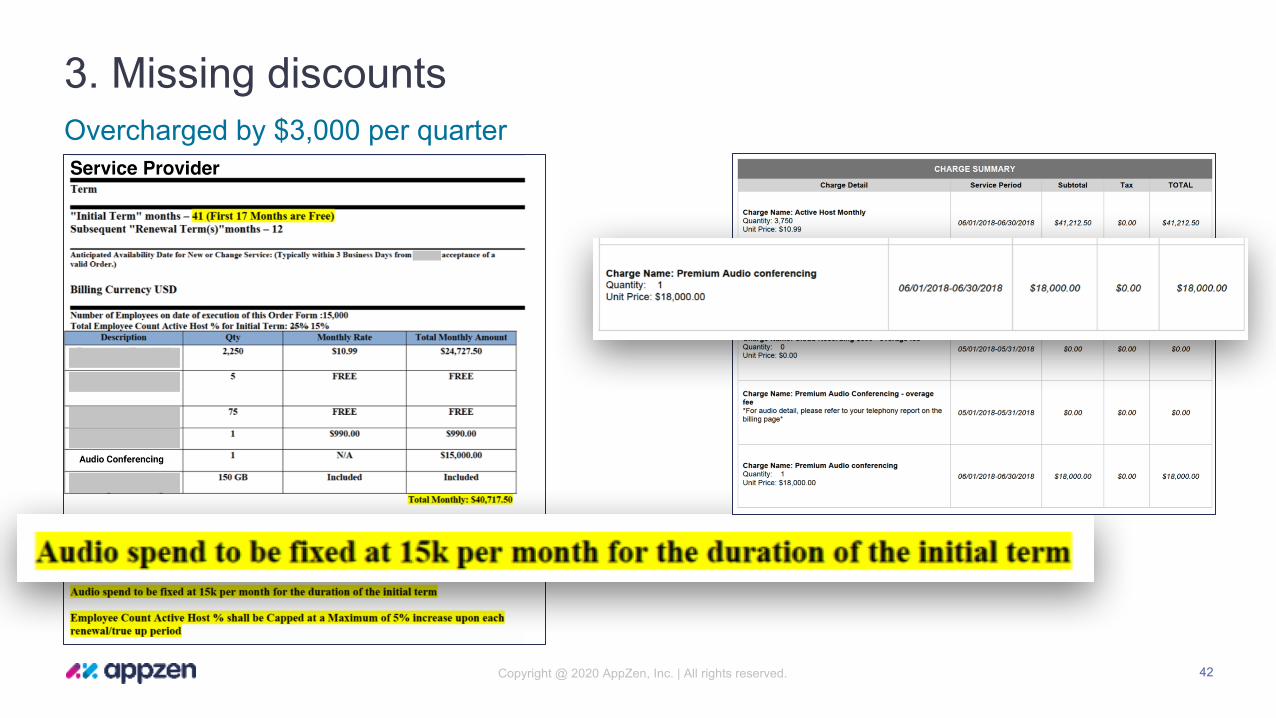
3. Missing discounts
42
Overcharged by $3,000 per quarter
42
Copyright @ 2020 AppZen, Inc. | All rights reserved.
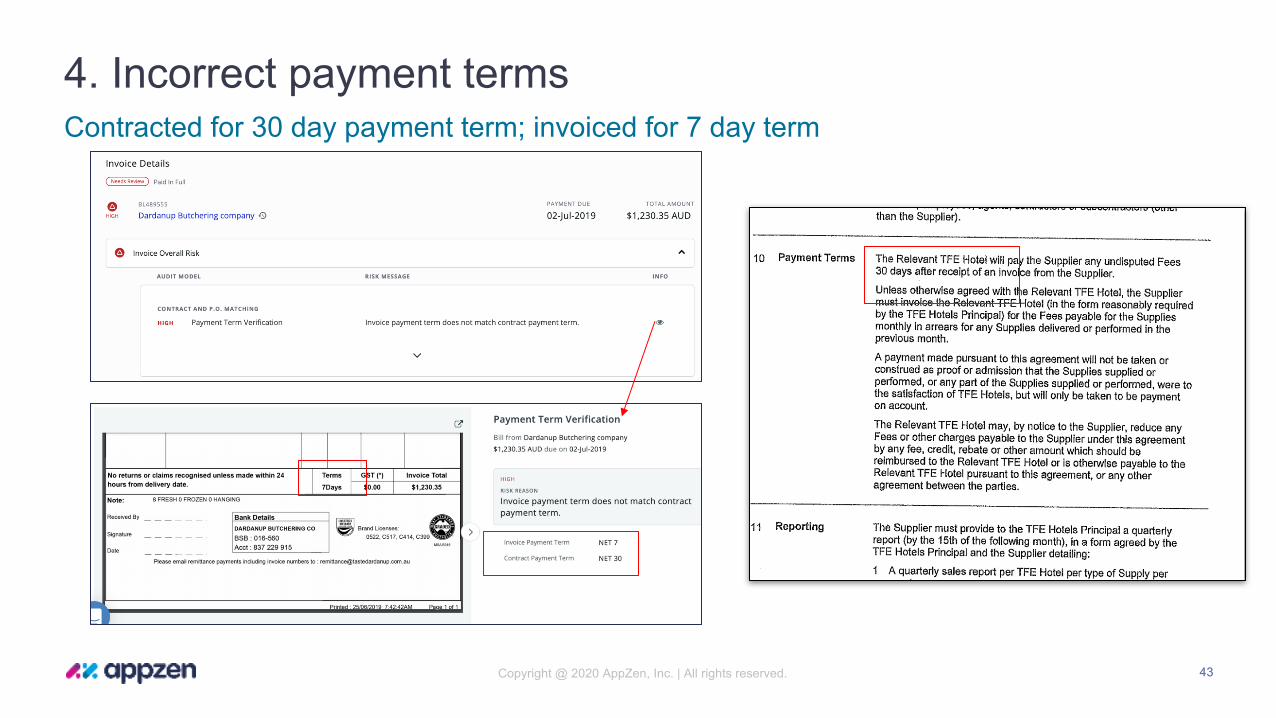
4. Incorrect payment terms
43
Contracted for 30 day payment term; invoiced for 7 day term
43
Copyright @ 2020 AppZen, Inc. | All rights reserved.
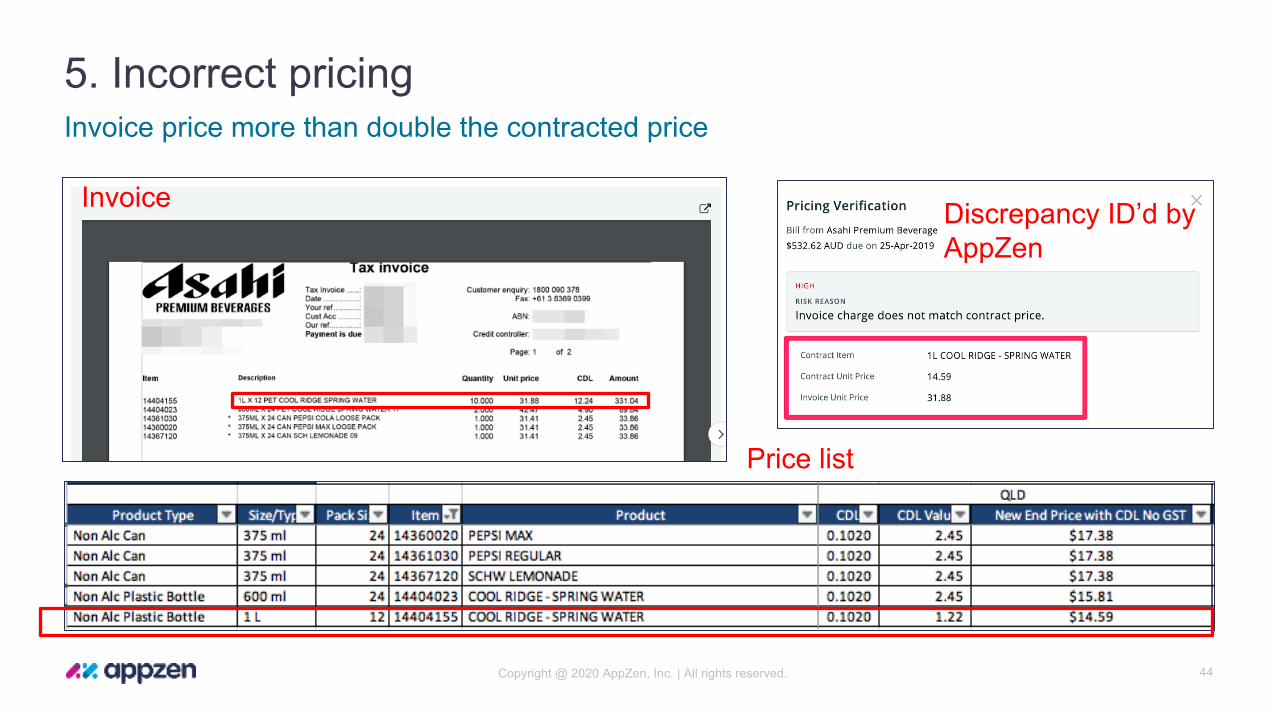
5. Incorrect pricing
44
Invoice price more than double the contracted price
• \Invoice Discrepancy ID’d by
AppZen
Price list

Copyright @ 2020 AppZen, Inc. | All rights reserved.
How we do it
45
Copyright @ 2020 AppZen, Inc. | All rights reserved.
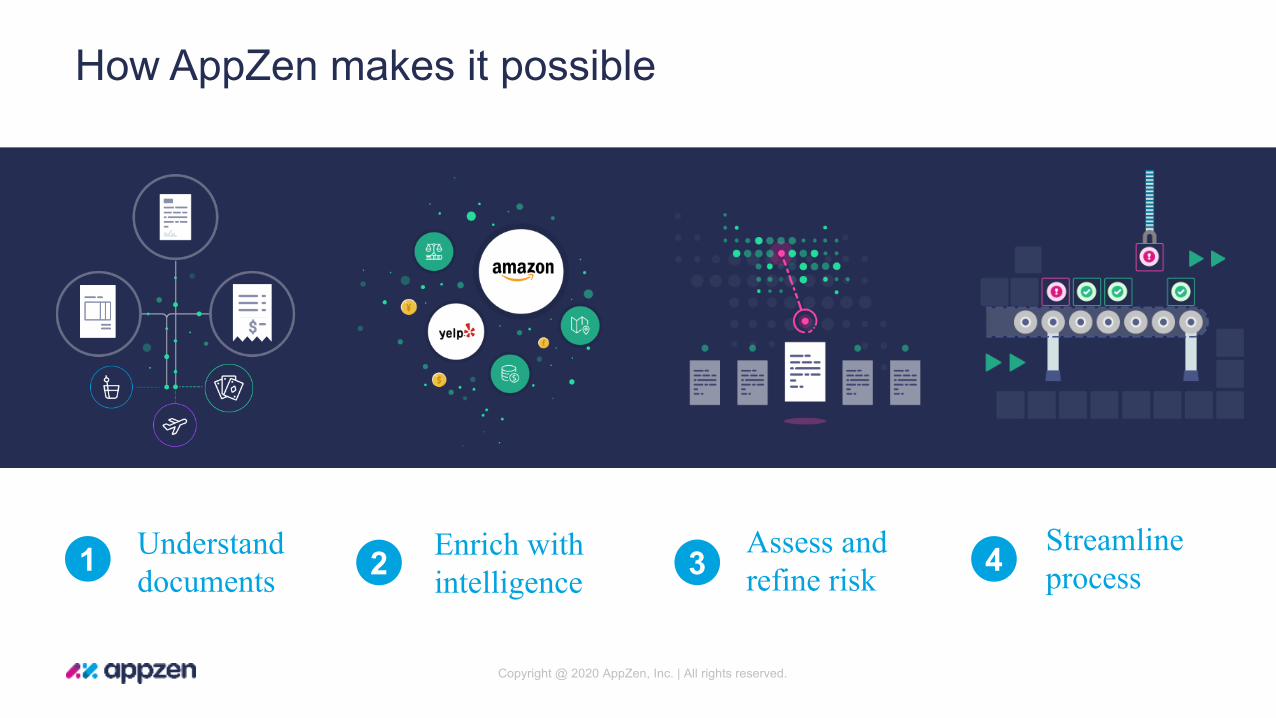
1 2 3 4Understand documents
Enrich with intelligence
Assess and refine risk
Streamline process
How AppZen makes it possible
Copyright @ 2020 AppZen, Inc. | All rights reserved.
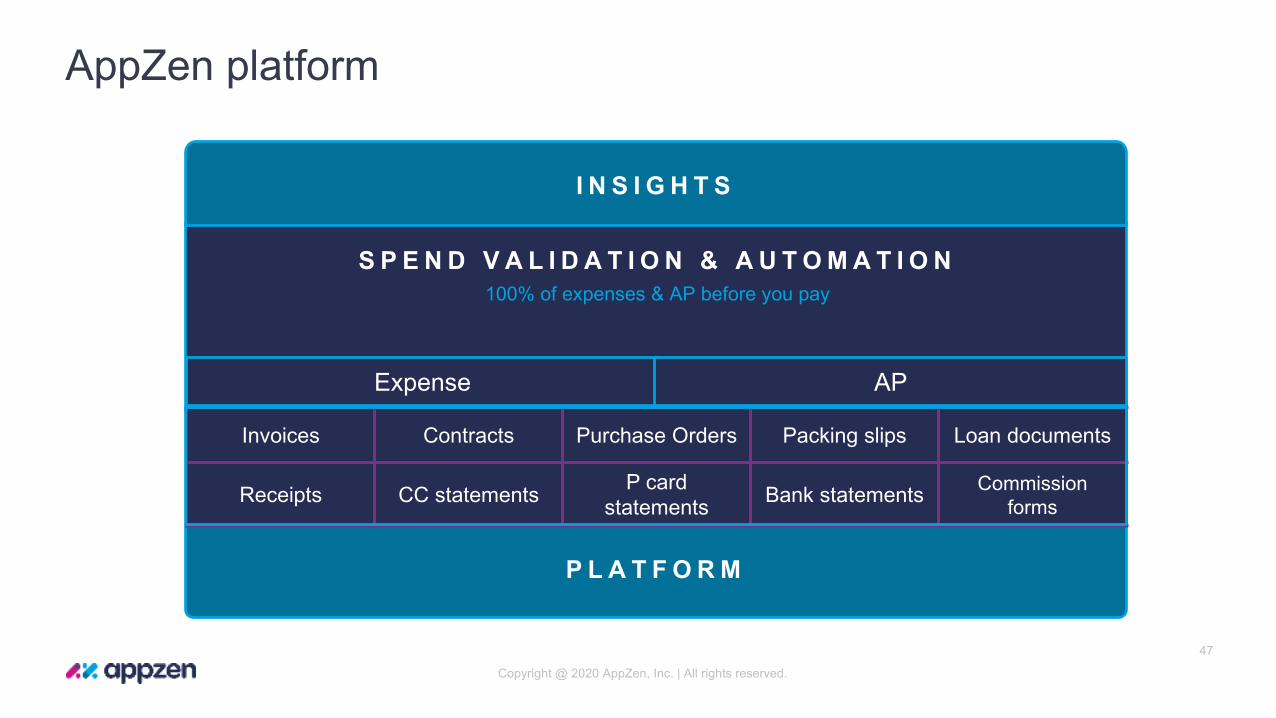
AppZen platform
47
S P E N D V A L I D A T I O N & A U T O M A T I O N100% of expenses & AP before you pay
P L A T F O R M
I N S I G H T S
Invoices Contracts Purchase Orders Packing slips Loan documents
Receipts CC statements P card statements Bank statements Commission
forms
Expense AP
Copyright @ 2020 AppZen, Inc. | All rights reserved.
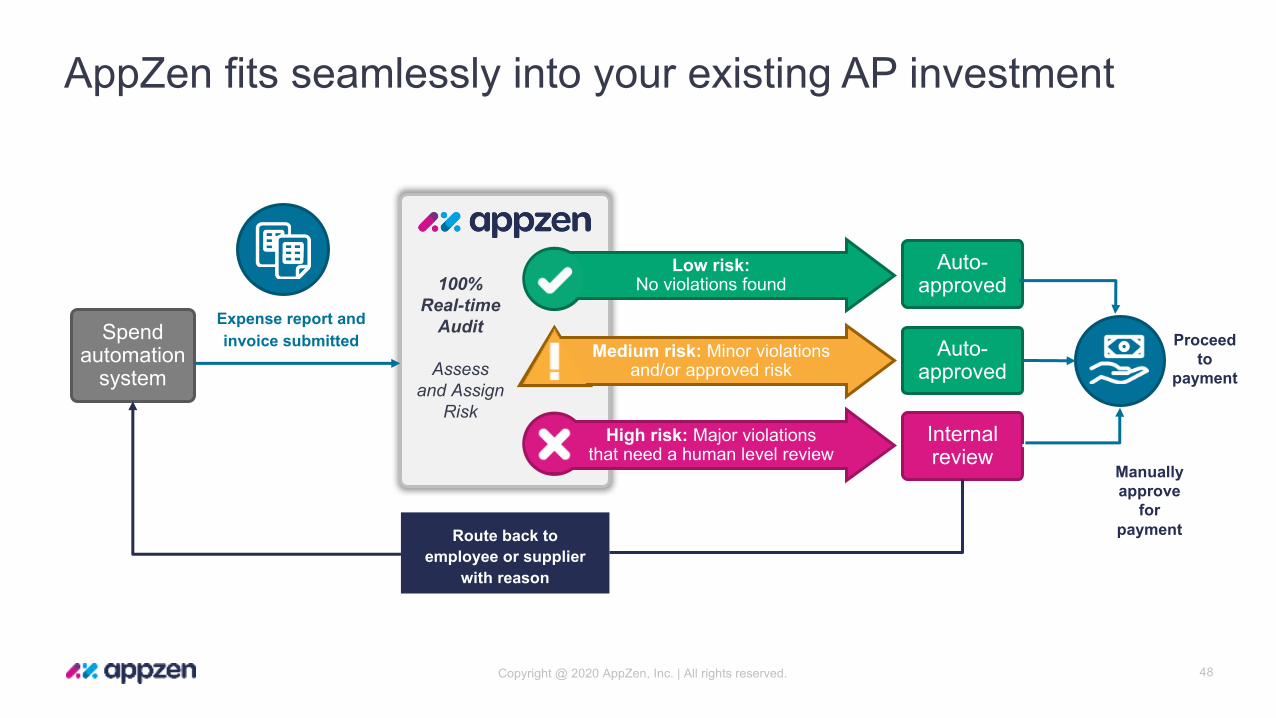
AppZen fits seamlessly into your existing AP investment
48
100% Real-time
Audit
Assessand Assign
Risk
Spend automation
system
High risk: Major violations that need a human level review
Route back to employee or supplier
with reason
Internal review
Medium risk: Minor violations and/or approved risk
Auto-approved
Low risk: No violations found
Proceed to
payment
Auto-approved
Expense report and invoice submitted
Manually approve
for payment
Copyright @ 2020 AppZen, Inc. | All rights reserved.
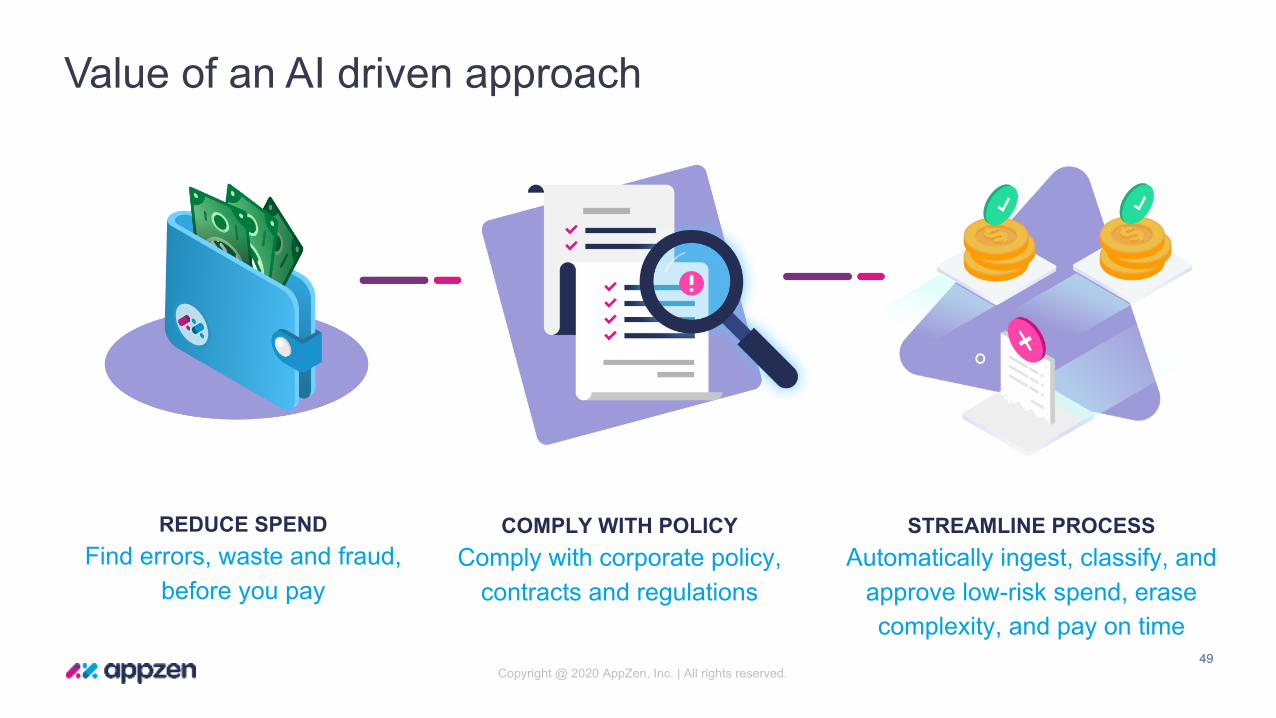
Value of an AI driven approach
4949
REDUCE SPENDFind errors, waste and fraud,
before you pay
COMPLY WITH POLICYComply with corporate policy,
contracts and regulations
STREAMLINE PROCESSAutomatically ingest, classify, and
approve low-risk spend, erase complexity, and pay on time
Copyright @ 2020 AppZen, Inc. | All rights reserved.
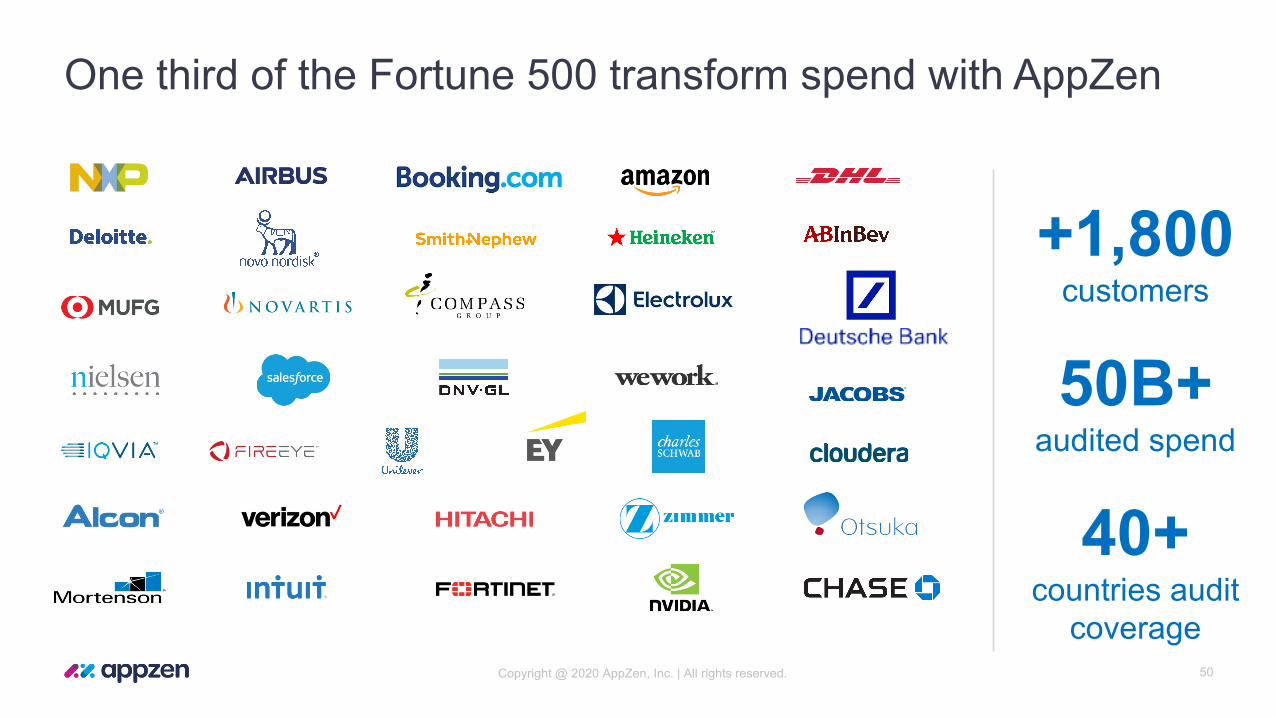
One third of the Fortune 500 transform spend with AppZen
50
+1,650enterprise customers
+1,800customers
50B+audited spend
40+countries audit
coverage


Your Questions Answered
NextFromsharedserviceslinkwww.sharespace.digital
January23rdJanuary16th January30th
January23rdJanuary16th January30th
We want to hear how your organization is adapting!
We want to explore:• What have been the biggest impacts to finance, compliance and
shared services professionals?• Whether companies are seeing increase in attempts of fraud in
the supply chain.• What changes companies are making to working capital and
early payment programs• Has this event been a catalyst to automate and move away from
paper?
Covid-19 and Shared Services: How are you Responding?
Nearly everything is changing. Business strategies are evolving, and everyone is having to adapt.
We have seen a huge amount of resilience from shared services professionals – from working remotely, to adapting processes and doing what it takes to keep companies open for business.
Covid-19 and Shared Services: How are you Responding?
Are you happy to participate in our current study on P2P and Fraud? (It only takes 5 minutes and is multiple choice)
1) Yes – please call me and ask the questions
2) Yes – please email me the link
3) No thanks