april 2010 - your markets monthly
DESCRIPTION
Our April edition covers Gold forcast, tracking the stock market recovery relative to previous stock market crashs, trading fundamental news and the definition of many major economic fundamental figures + more...TRANSCRIPT

April 2010Volume 2, Edition 3
Don’t forget to join
www.toptraderthinking.com
as a FREE Member so you can access a whole lot of other great info for Top Traders!
CONTACT US FOR A FREE EVALUATION OF YOUR SHARE PORTFOLIO OR TRADING HISTORY
Or call us DIRECTLY (in Aust.)1300 73 66 11Outside Australia+617 5504 2222
•FUTURES•GLOBAL SHARES•CFDs•FX TRADING•PRECIOUS METALS•RECOMMENDATION PROGRAMS•ONLINE TRADIN G•FREE WEBINARS for members•P ERSONAL SERVICE•DAILY MARKET REPORTS
AND MUCH MORE…
In this edition:
• Extract from the PD Global Report - by Philip Dooley
• Tracking the recovery where we are today
• Using Fundamentals to Trade the Market
• What do the major US Economic Figures & Reports actual mean & measure? - Extract from TopTraderThinking.com
• Technical Indicator of the Month: Majority Rule - by Jason Achjian
• Recommendation Program update - Commodities Basket Recommendations - William Chien's CFDs - Top Trader - Seasonal Spread Trading

20-Apr-10
Our Affiliates & Partners include:
Extract from the PD Global Report #50 by Philip Dooley
GOLD
I last dealt with Gold on February 9th in report no.39. I was right about the low in February and the subse quent rally.However for it to continue strongly through to early May the low y esterday at 1123 needs to hold . Below is a weekly chart illustrating the forecasts for gold since 2007.
February 9th: The rally to mid February has not occurred, the market instead returning to and breaking support around the 1074 area last visited in December. That is, the time to mid February has instead played out on the downside. However an important low may now be forming in gold before a strong rally gets underway to early May that will take it above the December high of 1227. For the rally to get going support should be in place by mid February and the price be heading up by the 18th. If it cannot do that then it is heading down to May. Last traded 1070.
To receive Philip Dooley's full report or get on hi s email distribution list; please contact Philip di rectly on either 1300 73 66 11 or by email to:

Contributor information:Guy Bower is professional futures, options and spread trader. Guy is the author of two books:
Options: A Complete Guide and Hedging: Simple Strategies
Tracking the recovery – where we are today
It is worth revisiting how far the Australian sharemarket has come from the lows of March 2009, as shown in the chart below. The chart compares the six worst bear markets to the current sharemarket recovery to 31 March 2010 (shown as the highlighted red line).
The good news is that the recovery is taking a similar trajectory to the other extreme bear markets and, if history is any guide, the Australian sharemarket could return to the highs of 1 November 2007 in one to three and a half years. This represents a 25% gain from current levels. We can also take comfort in the fact that the Australian economy is particularly strong and that it is benefiting in a big way from the global two speed economy, with our major trading partners still growing strongly.
The Current Recovery in ContextAll Ordinaries Accumulation Index (Q’tly Data): Var ious Bear Market Cycles (100=Cycle Peak)

Using Fundamentals to Trade the Market
Fundamental analysis can easily become an academic and philosophical form of analysis. In fact if you listen to almost any of the economists being interviewed on the news or business channels, you’ll agree they offer far more “opinion” than practical trading advice. Great stuff for dinner party conversation, but nothing that will help you make money.
We are however interested in how fundamentals affect the market and of course how we can trade it. For the short term trader, much of the practice of using fundamentals involves trading the market behaviour at and around the time of key data releases.
With that in mind, the key to applying fundamentals is threefold:
>> Have a good source of fundamental data and estimates.
>> Plan the possible trades with scenarios.
>> Trade the plan.
Back when I was an analyst at Thomson Reuters, I would conduct a survey one day ahead of key Australian data releases (CPI, employment, current account and so on). I would call around to 18 of the top economists to ask for their estimate. Then I’d table it up and send it to clients, press and back to the economists themselves.
There was an ongoing joke in my office with a particular chief economist from one of the big banks. He would very rarely have an opinion of his own. The conversation would run like this:
ME: “Hi…….. Just wondering what your estimate is for tomorrow’s number.”HIM: “Hmmm, not sure. What’s everyone else saying?”ME: “Up 0.2%.”HIM: “OK, put me down for 0.2.“
Suffice to say this guy was probably earning at least 10 times what we analysts were and this went on for years.
Conducting that survey taught me a few things. Number one was that the economists really have no idea. Number two was that the market would always react to the actual number relative to the average expectation rather than just the absolute number.
This is the interesting point as it provides the trading opportunity. If we know a market is likely to react a certain way if the actual number differs from the expectation, then we can run through scenarios beforehand and have our trades pretty much mapped out.
Plan the trade, trade the plan.Suppose we are looking at an upcoming announcement from the RBA regarding interest rates. From our sources we know the market has priced in an increase of either 25 or 50 basis points. Here are some possible scenarios regarding the announcement:

Larry Williams
Tom Scollon
Daryl Guppy
Making the most of these scenarios involve being quick off the mark. It’s the first few seconds of the move that can make you the most and risk the least. The risk/reward stats to shift thereafter.
Sources of DataWith the proliferation of FX trading platforms, there are a stack of data calendars available online and many of them are free. One great one is www.forexfactory.com. It lists all the major releases from the major countries. It has good estimates, historical data charts and good data descriptions.
Examples of trading off data releasesStrangely, this is harder to find online. However one reasonable sources are the Podcasts from Daily FX. Some of them are quite long and detailed, but download a few of them here:http://itunes.apple.com/podcast/past-live-forex-trading-events/id352744377
The more you watch, the more you’ll get a feel for how to trade around data releases. The limitation is they cover FX markets only, but the general concepts are the same.
Contributor information:Guy Bower is professional futures, options and spread trader. Guy is the author of two books:
Options: A Complete Guide and Hedging: Simple Strategies

Guy Bower
Catherine Davey
Sari Mustonen-Kirk
What do the major US Economic Figures & Reports act ual mean & measure? Find out here… Extract from: www.toptraderthinking.com
EMPLOYMENT REPORTNon-farm employment measures the net change in jobs, ‘hiring less firings’ (otherwise known as establishment survey). The data broken down to sectors, for example, manufacturing hour worked provides an indication of industrial production and capacity utilisation, construction jobs are a barometer for housing starts and hiring’s indicates how retail sales have fared during the month.Employment is more of a coincidental, lagging economic indicator, however it is the most important data release. Generally, it has been the one most followed by a change in the Fed fund rate.The Unemployment rate is based on a household survey of labour force, and is closely watched as a measure of labour market tightness and potential wage pressure.The establishment survey provides a broader measure of employment, and is less volatile. The household survey gains importance at turning points in the economy, as this highlights self-employment trends and new business.
NATIONAL ASSOCIATION OF PURCHASING MANAGERS INDEX ( NAPM)This index is based on a survey of 300 purchasing executives. NAPM consists of 6 components: employment 20%, production 25%, new orders 30%, inventories 10%, supplier delivery times 15%. It is the sum of percentage positive responses plus half of those indicating no change. A 50+ reading suggests manufacturing is expanding, below 45 indicates recession.The supplier deliveries component is used to gauge inflation, as delivery times typically lengthen when production bottlenecks or shortages arise, signalling the onset if inflationary pressures.
CHICAGO PURCHASING MANAGERS REPORT (PMI)Similar to National Association of Purchasing Managers (NAPM), with subindices for production, new orders, order backlogs, inventories, employment, supplier deliveries and prices. Readings above 50 signal industrial expansion, it is a good directional indicator for the NAPM, as it is released one day prior.
CONSTRUCTION SPENDINGCompares the value of new contract awards to building public works and utilities as well as those new orders received by manufacturers in capital goods. Contracts on commercial and manufacturing buildings, streets, highways, bridges, dams and pipelines are included.
RETAIL SALESMeasures net sales for retail trade, including credit and cash. Manufacturers, wholesalers and retailers’ sales are excluded, with all data adjusted for seasonal and trading day differences. This figure is revised monthly and is a comprehensive measure of consumer demand.
LEADING INDICATORSThis is generally not a very reliable indicator as it fails to highlight turning points in GDP due to its heavy reliance on manufacturing data. The index is a weighted average of eleven indicators ranging from manufacturing orders, plant & equipment contracts, M2 money measure to S&P 500 index. A more reliable measure of turning points in the economy is the ratio of coincident-to-lagging indicator; this has a lead-time of 8 to 12 months.
PRODUCER PRICE INDEX (PPI)This series is organised in stages, processing, finished goods, intermediate materials and crude products, with the main focus on finished goods. The report comprises of three indices that measure average changes in prices received in primary markets of the US by producers of commodities at all stages of production.The headline figure is for finished goods, i.e. those ready to be shipped to wholesalers and retailers. PPI is a good leading indicator for the CPI, although the PPI doesn’t include services and therefore divergences can occur. The core excludes the volatile food and energy components.Several key commodity indices that are published regularly by the Commodity Research Bureau or Journal of Commerce can be helpful in anticipating changes in the PPI. The weighting’s in the overall index are as follows: Food 24%, Gasoline 7%, Passenger Cars 7%, Apparel 6%.
INDUSTRIAL PRODUCTIONMeasures the activity amongst manufacturers, mining and utility concerns. This index does not cover production on farms, in trade or service, construction or transportation. The broad index provides a breakdown fro activity within durable and non-durable goods. Weekly data on steel production, rail freight traffic and the Business Week Index can be employed to forecast the Fed’s index.

CAPACITY UTILISATIONThis ratio compares actual output to potential output. Capacity is based on the maximum amount of production that can be generated during a given period, allowing for the existing plant and equipment and normal operating schedule. The monthly charge n the index closely parallels the month-to-month swings in the industrial sector.
HOUSING STARTS AND PERMITSA start is counted when excavation begins for footings or foundation, and it measures the total number of units (single and multi-family units) that are started in a given period. Naturally, the data is a leading indicator for residential construction, and an indicator for other housing related products.Permits data refers to the permits issued by local authorities, this is important, as there is often a lag between the issuance of a permit and actual construction. Permits can also lapse and therefore construction does not begin. Both series are key indicators of activity in the residential construction and may be a signal for changes in the overall economy.
CORPORATE PROFITSQuarterly report that measures total earnings of those corporations organised for profit, with data published on a pre-tax basis as well as after tax basis.
GROSS NATIONAL PRODUCT (GNP)The most encompassing measure of economic activity, this indicator measures the total output of goods and services during a given period of time. It represents the sum of personal consumption expenditure, gross private domestic investment, net exports of goods and services government purchasers of goods and services. The estimates are published in real and current terms. The implicit price deflator, the measurement of ongoing inflationary pressures, is also included. GNP is important as it clearly portrays the current status of the US economy. Monthly indicators, industrial production can outline the general shape of the GNP for a given quarterly period.
DURABLE GOODS ORDERSA key measure id demand in the business sector, as orders lead production with a very short lag. Durable goods are those with a life expectancy of three years or more, for example, primary and fabricated metals, electrical and transportation equipment. The market focuses on non-defence industries, which are considered a better barometer of business activity.
AUTOMOTIVE SALESA very important number as it reflects one-fifth of retail sales, and is a reliable gauge for consumer confidence. Data on retail sales is published in two formats:A ten-day report on three domestic manufacturers occurs three times each month. As the month progresses, these reports provide an important clue to how strong or weak monthly sales may be.The other format is published as the average selling rate for the month for both domestic and foreign automobiles. This is a more comprehensive report than the ten-day series. Auto sales are an important component of total retail sales the month-to-month swings in the annual selling rate can be an important determinant of the monthly charge in all retail sales.
PRODUCTIIVITY Measures the constant dollar valuation of goods and services produced within a certain time period in relation to hours paid. The index shows the change in the ratio of total output to labour input, with output measuring real gross national product. The hours and employment data are from US payroll survey of establishments.
BALANCE OF PAYMENTSMeasure the interactions of over one hundred countries within the US< including the current account, the balance of goods and services – unilateral transfers remittances abroad, personal money to former residents and IS foreign aid grants: and capital account inflows or outflows of US private, government and foreign capital.
WEEKLY DATA JOHNSON REDBOOKThis is a private survey of retailers, and provides a clue as to the current month’s retail sales report. It represents the percentage change for the month to date on the average of the whole previous month, with the data for the first two weeks less important that the last two weeks.
MORTGAGE BANKERS ASSOC. MORTGAGE APPLICATIONS INDEXThe earliest possible indicator for housing activity, incorporating the purchase and refinancing component. An important indicator as it foreshadows homes sales by approximately 3 months.
INITIAL JOBLESS CLAIMSSeasonally adjusted levels in initial claims filed for state benefits, and any change provides a signal of labour market developments, and is included in the government’s leading economic indicators index.
FED BEIGE BOOKA report on economic and financial conditions submitted by 12 Federal Reserve district banks to the FOMC just prior to their meetings.

Technical Indicator of the MonthBy: Jason Achjian
Majority Rule
WhatThis indicator calculates the percentage of the most recent specified periods in which a security had rising values. It may be used either as a trend-following device or as an overbought/oversold indicator.
How # of Up Days (during n)Majority Rule = x 100 n
Where ‘n’ = number of periods
WhenWhen the indicator is at a relatively high level (generally greater than 75%) the ‘Majority Rule’ states that statistically, a reversal is likely. When a high reading is recorded the quantity of up days that have occurred over the nominated period is not usual in the context of the market movement being reviewed and the probability of a down day is more likely.When the Majority Rule indicator is low (generally less than 25%) this could be seen as an oversold market and taken as a buy signal.
You can now place orders, get market quotes and vie w your eBridge Trader account from your internet enabled mobile phone - Just type the following URL into your mobile phone internet browser and use your standard login details: mobile.ebridgetrader.com
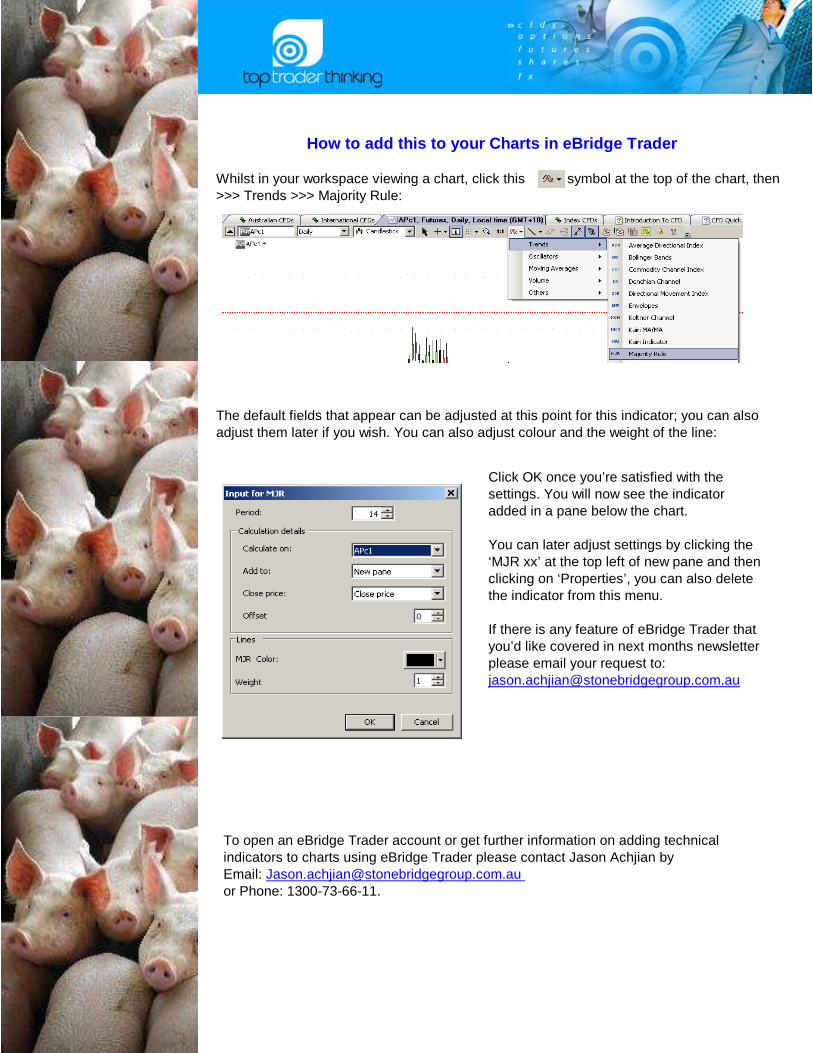
Click OK once you’re satisfied with the settings. You will now see the indicator added in a pane below the chart.
You can later adjust settings by clicking the ‘MJR xx’ at the top left of new pane and then clicking on ‘Properties’, you can also delete the indicator from this menu.
If there is any feature of eBridge Trader that you’d like covered in next months newsletter please email your request to: [email protected]
How to add this to your Charts in eBridge Trader
Whilst in your workspace viewing a chart, click this symbol at the top of the chart, then >>> Trends >>> Majority Rule:
The default fields that appear can be adjusted at this point for this indicator; you can also adjust them later if you wish. You can also adjust colour and the weight of the line:
To open an eBridge Trader account or get further information on adding technical indicators to charts using eBridge Trader please contact Jason Achjian by Email: [email protected] or Phone: 1300-73-66-11.

http://www.toptraderthinking.com/toptrader/shop.asp?id=42http://www.toptraderthinking.com/toptrader/shop.asp?id=42
http://www.toptraderthinking.com/toptrader/shop.asp?id=42
http://www.toptraderthinking.com/toptrader/shop.asp?id=42
http://www.toptraderthinking.com/toptrader/shop.asp?id=42
http://www.toptraderthinking.com/toptrader/shop.asp?id=42
http://www.toptraderthinking.com/toptrader/shop.asp?id=42
http://www.toptraderthinking.com/toptrader/shop.asp?id=42
http://www.toptraderthinking.com/toptrader/shop.asp?id=42
http://www.toptraderthinking.com/toptrader/shop.asp?id=42
http://www.toptraderthinking.com/toptrader/shop.asp?id=42
http://www.toptraderthinking.com/toptrader/shop.asp?id=42
http://www.toptraderthinking.com/toptrader/shop.asp?id=42http://www.toptraderthinking.com/toptrader/shop.asp?id=42
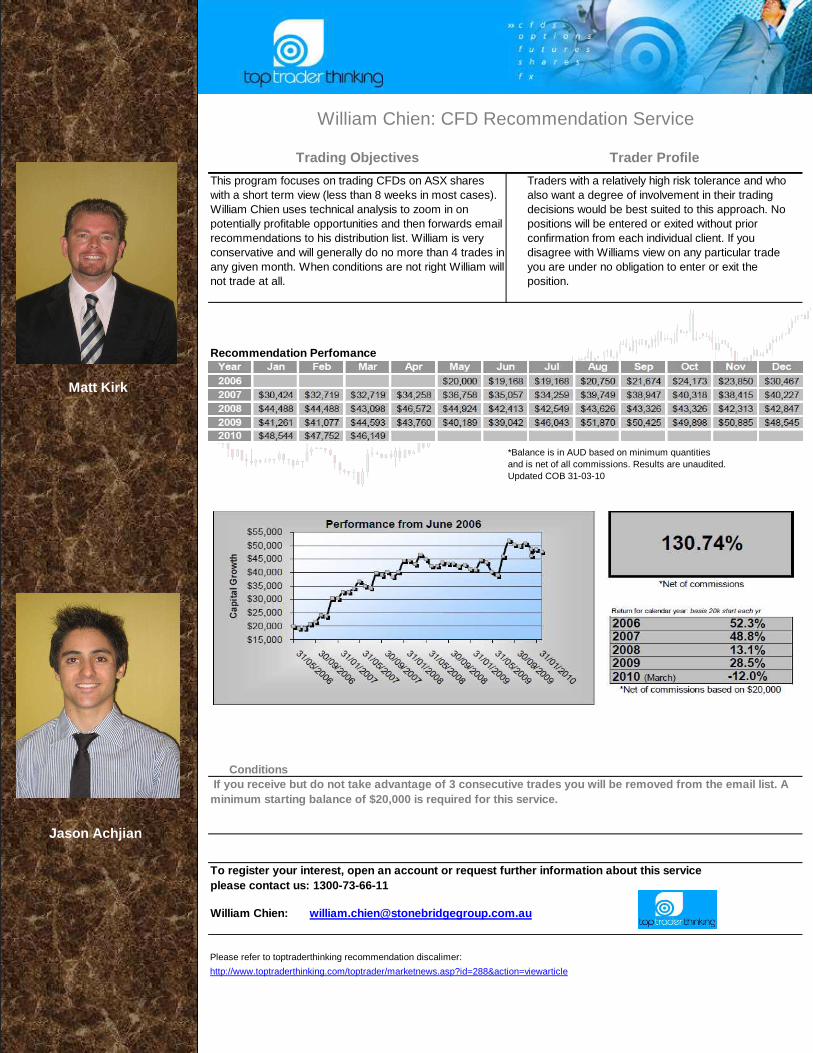
Recommendation Perfomance
Conditions
William Chien: [email protected]
William Chien: CFD Recommendation Service
*Balance is in AUD based on minimum quantities and is net of all commissions. Results are unaudited.Updated COB 31-03-10
Trading Objectives Trader Profile
This program focuses on trading CFDs on ASX shares with a short term view (less than 8 weeks in most cases). William Chien uses technical analysis to zoom in on potentially profitable opportunities and then forwards email recommendations to his distribution list. William is very conservative and will generally do no more than 4 trades in any given month. When conditions are not right William will not trade at all.
Traders with a relatively high risk tolerance and who also want a degree of involvement in their trading decisions would be best suited to this approach. No positions will be entered or exited without prior confirmation from each individual client. If you disagree with Williams view on any particular trade you are under no obligation to enter or exit the position.
If you receive but do not take advantage of 3 cons ecutive trades you will be removed from the email l ist. A minimum starting balance of $20,000 is required for this service.
To register your interest, open an account or reque st further information about this service please contact us: 1300-73-66-11
Please refer to toptraderthinking recommendation discalimer:
http://www.toptraderthinking.com/toptrader/marketnews.asp?id=288&action=viewarticle
Matt Kirk
Jason Achjian

Jason Achjian: [email protected]
Top-Trader - Seasonal Spreads in Futures & Options
The brokerage rate charged is US $15.00 per side of each trade +GST. If you receive and do not take advantage of 3 consecutive trades you will no longe r receive fully detailed email recommendations. Min imum starting balance of $15,000 is required.
Commissions / Conditions
In Brief Trader Profile
Top-Trader is a recommendation program designed to take advantage of historically high probability seasonal opportunities in a wide range of markets using futures and options spreads. On average, one trade per week is generated and the length of time in each trade is approx. 2-3 weeks. Stop losses are based on closing prices i.e. exits are made the following day if the market closes outside of the stop level.
This program suits those who want to take advantage of opportunities in stock indices, interest rates, currencies and commodities markets. Traders with a relatively high risk tolerance and who also want a degree of involvement in their trading decisions are best suited to this approach. No positions will be entered or exited without prior confirmation from each individual client.
To register your interest, open an account or reque st further information about this service please contact us: 1300-73-66-11
Please refer to toptraderthinking recommendation discalimer:
http://www.toptraderthinking.com/toptrader/marketnews.asp?id=288&action=viewarticle
Recommendation Perfomance
*Last updated COB 31-03-10. Balance is net of commissionsPast performance is no guarantee of future results
William Chien
Philip Dooley

Please contact the Futures dealing desk for further information on recommendation programsPhone: 1300 73 66 11 Email: [email protected]
RECOMMENDATION PROGRAMS – UPDATE
TOP-TRADER - SEASONAL SPREAD TRADING
MINIMUM ENTRY LEVEL $A20,000
OCTOBER 2007 TO MARCH 2010
MINIMUM ENTRY LEVEL $A10,000
WILLIAM CHIENS CFD RECOMMENDATIONS
UP 130.74% NET OF COMMISSIONS
JUNE 2008 TO MARCH 2010
JUNE 2006 TO MARCH 2010
NOTE: RESULTS ARE UNAUDITED – PLEASE CALL OR EMAIL TO REQUEST SUPPORTING DOCUMENTATION IF YOU ARE CONSIDERING PARTICIPATING IN ANY OF OUR RECOMMENDATION PROGRAMS
COMMODITY BASKET RECOMMENDATIONS (CBR)
MINIMUM ENTRY LEVEL $A15,000 UP 37.81% NET OF COMMISSIONS
UP 48.33% NET OF COMMISSIONS

Toptraderthinking.com is THE trusted source of information to assist traders to ‘know more, stress less and trade better’. Acting as a filter to sift the wheat from the chaff so to speak, we bring our members analysis, opinions, products and services provided by credible, professional and industry-committed players.
toptraderthinking.com is non-prescriptive; recognising that each trader must find his/her own ‘fit’ to achieve sustainable trading success. To this end we endeavor to represent all products, opinions, commentary, analysis and methodologies in a fair and objective manner. Our site is categorised by not only product type according to the Traders Wheel but also by experience levels and areas of interest. Our inventories provide insightful tools to assist traders in further defining fit and enjoying success in trading.
We recognise that our members and contributing alliance partners are critical to the ongoing success of toptraderthinking.com and we seek to build an e-community where all participants can grow and prosper.
To receive recommendations on an ongoing basis you must be a client of StoneBridge Group Gold Coast Derivatives desk. To open an account email [email protected] or contact the dealing desk on 1300 73 66 11. Please see our Recommendations & Information disclaimer on www.toptraderthinking.com Click on 'Market News' to read thoroughly prior to entering into any of our trades. There is always a risk of loss in derivatives trading. Past performance is no indication of future results. Do not trade with funds you cannot afford to lose. Seek independent financial consultation before entering any trade recommendation program. All information and recommendations are general advice only and we have not taken your personal financial position into consideration
WANT TO RECEIVE OUR RECOMMENDATIONS?
About Us – www.toptraderthinking.com

�
�
�
�
�
�
uROk 33 DAY CHALLENGE - BRILLIANT FOR TRADERS
A complete DIY life management and goal achievement tool the uROk 33 Day Challenge is great for traders as well. We all know that to t rade successfully and consistently we need a plan but we also need a balanced life. The uROk 33 Day Challenge will help you reach new h eights in all areas including: Health, Wealth, Self, Love, Work, Create and Y (per sonal purpose and who you really are).
The Challenge is ideal for both new and seasoned tr aders and will help you cement what you've learned and take action to realise the goals you truly desire in the markets and in life in general.
Includes:
1. uROk 33 DAY CHALLENGE Dream Your Life, Live Your Dream PERSONAL PLANNING WORKBOOK
2. GUIDED VISUALISATION CD by SARI
Dream Your Life, Live Your Dream for Contribution & Achievement Compact Disc.
3. uROk.tv MEMBERSHIP
It's easy, it's enjoyable and it actually works. If you're ready to have more, be more, give more, do more, and get more out of life (and tradin g the markets) then order this revolutionary programme today.
PAY ONLINE WITH Mastercard and Visa http://www.toptraderthinking.com/toptrader/shop.asp ?id=82
(Aust Only) Call Matt on 0409 208 658 for AMEX orde rs or email: [email protected]