april 29, 2016 scotiabank rory johnston 416.862.3908 ...scotiabank commodity price index is...
TRANSCRIPT

Scotiabank Commodity Price Index is available on scotiabank.com, Bloomberg at SCOT and Reuters at SM1C
Rory Johnston 416.862.3908 [email protected]
April 29, 2016 Global Economics
Scotiabank Economics
Scotia Plaza 40 King Street West, 63rd Floor
Toronto, Ontario Canada M5H 1H1
Tel: 416.866.6253 Fax: 416.866.2829
Email: [email protected]
This report has been prepared by Scotiabank Economics as a resource for the clients of Scotiabank. Opinions, estimates and projections contained herein are our own as of the date hereof and are subject to change without notice. The information and opinions contained herein have been compiled or arrived at from sources believed reliable but no representation or warranty, express or implied, is made as to their accuracy or completeness. Neither Scotiabank nor its affiliates accepts any liability whatsoever for any loss arising from any use of this report or its contents.
TM Trademark of The Bank of Nova Scotia. Used under license, where applicable.
Scotiabank Commodity Price Index
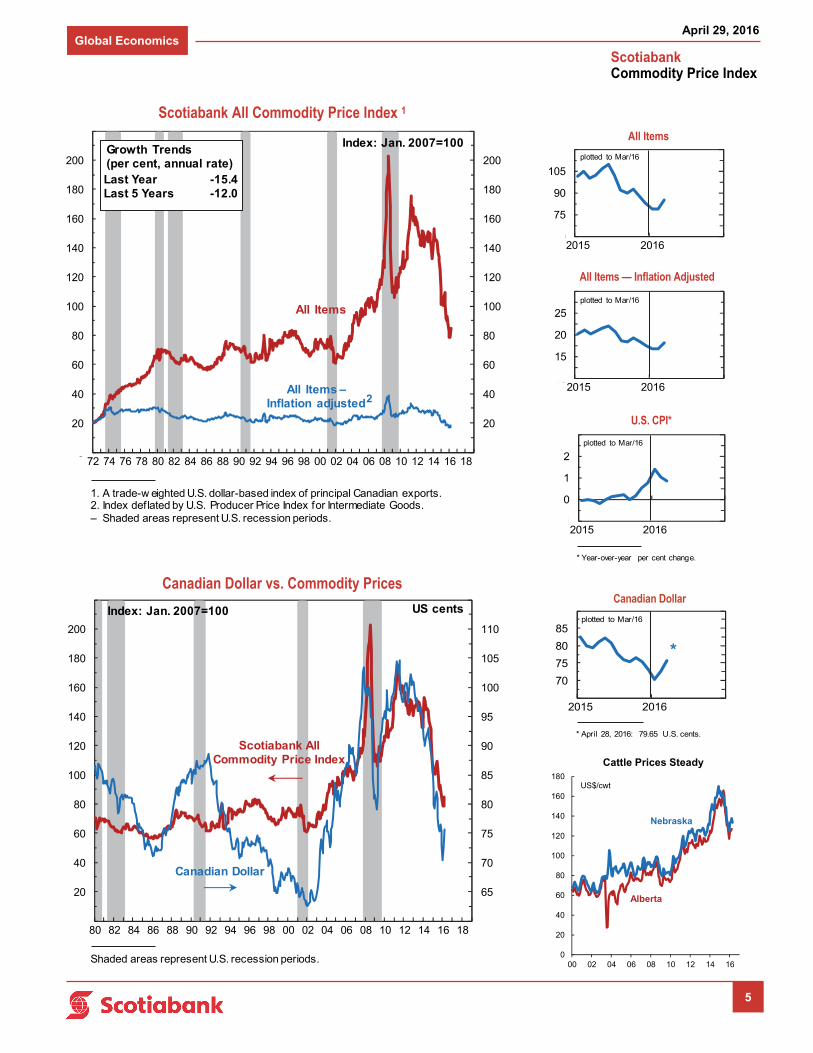
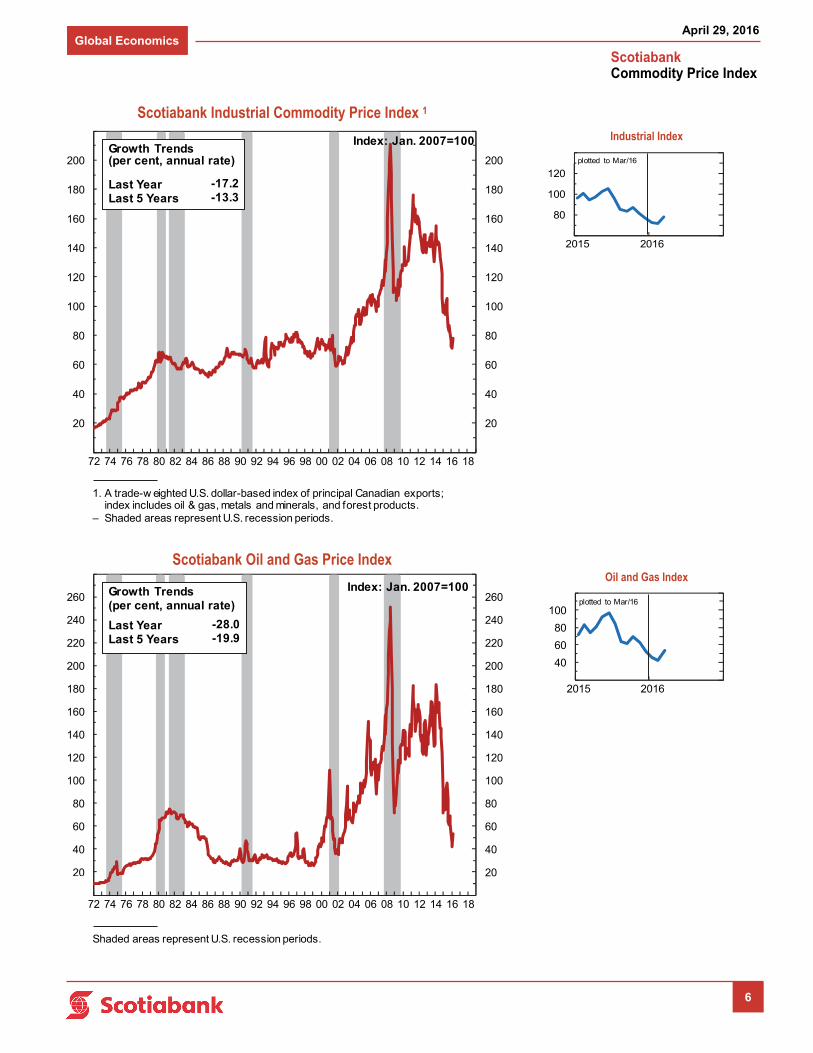
Volatility abounds and sharp rallies have elevated most commodities off recent bottoms. Scotiabank’s Commodity Price Index lifted off a more than 12-year low in February, rallying 7.8% m/m in March. While the direction of this recent price activity is in line with Scotiabank Economics’ view, the frenetic pace of these rallies is aggressive based on our reading of the fundamentals. There is a risk of a short-term correction in prices, though we expect commodity prices will rise further as the year progresses. That said, it is also unlikely that prices re-test the exceptionally low levels reached earlier this year given that they were also likely the result of speculative momentum.
Oil & Gas
The Oil & Gas Index increased by 26.5% m/m as crude oil lifted off its February lows. West Texas Intermediate (WTI) rose from $26.19/bbl on February 11 to average $37.55/bbl in March. Oil prices are forecast to continue rising: Scotiabank Economics expects WTI to reach $45-50/bbl by year-end and average $42/bbl in 2016 before reaching an average of $53/bbl in 2017 and $55-60/bbl by end-2017. In the meantime, the light sweet inland benchmark continues to test fresh yearly highs ($46/bbl as of writing) but these recent gains are at risk of near-term retracement. We do not believe that the current pace of appreciation — driven more in our view by financial activity rather than slower-moving fundamentals — is sustainable and prices may fall again before continuing their gradual path back to finding new equilibrium levels.
While the spot price of WTI has risen sharply off its February 11 low (+78% as of writing), thirteen-month forward contracts have risen at a far more subdued pace (+30%) over the same period. This has caused a significant narrowing of the contango (the front-month contract discount relative to the thirteenth-month), from $11.53/bbl on February 11th to $3.72/bbl today (Chart 1). Given that the oil market remained oversupplied by an estimated 1.5-2.0 mbpd in 16Q1, inventories will continue to swell — albeit at a reduced pace (Chart 2) — throughout the remainder of the year and spot prices may need to fall in order to compensate for necessary storage costs. We anticipate subdued supply and healthy demand growth over the
Commodities Lift Off Unsustainable Lows, But Pace Appears Overheated
Oil and iron ore prices are likely getting ahead of underlying fundamentals.
WTI expected to reach $45-50/bbl by year-end, but interim prices may ease slightly from current levels.
Chinese exchanges move to blunt potentially speculative activity in overheated metals markets.
-15
-10
-5
0
5
10
15
2014 2015 2016
Source: Bloomberg, Scotiabank Economics.
Chart 1: WTI Contango Narrowing Too Quickly
Backwardation
Contango
Front-monthcontract premium (discount) to 13th month, $/bbl
-15%
-10%
-5%
0%
5%
10%
15%
20%
25%
30%
35%
2014 2015 2016
Chart 2: US Crude Inventory Builds Are Slowing
Source: EIA, Scotiabank Economics.
Crude
Distillate
Gasoline
weekly inventory build (draw), y/y % change

April 29, 2016 Global Economics
2
Scotiabank Commodity Price Index
next 18 months to close the gap by 17H2, at which point the market will begin digesting inventories accumulated during the glut. Commercial crude inventories remain at 87-year highs in the U.S., but the pace of builds has slowed considerably from almost 30% y/y in November to a more manageable 10% y/y in April.
There are definite areas of strength in the oil market, despite the near-term price risks. U.S. gasoline demand set a new March record at 9.25 Mbpd as motorists kicked off the spring/summer driving season early and with a bang (Chart 3). Petroleum demand in India is also booming — up over 600 kbpd y/y in March to 4.33 Mbpd (+16.4% y/y) — and the country is poised to be the single-largest contributor to global demand growth this year.
Meanwhile, U.S. crude production continues to slip, down almost 300 kbpd year-to-date and more than 650 kbpd since production peaked last June. Similarly, China and Mexico are also showing signs of production strain amidst the lower price environment, down 185 kbpd and 60 kbpd year-to-date, respectively. Finally, recent unplanned supply outages — Kuwaiti strike, attacks on Nigerian and Iraqi pipelines, ongoing strife in Libya, and Venezuela’s acute power crisis — highlight that spare capacity remains extremely tight and the current surplus is only a few geopolitical misfortunes away from an acute deficit.
Headwinds remain, however. Another way of looking at those unplanned supply outages is that they are not inherently permanent; the owners of those wells have every incentive to restart production and return to the market if circumstances allow, further glutting the system. Furthermore, the magnitude of the current rally may breathe new life into U.S. tight oil producers, with a similar price bump last year temporarily reversing initial output declines (Chart 4). This is unlikely to fundamentally reverse the declining trend, but it may slow its pace and further delay market balance. Indeed, it appears that many companies are already taking advantage of higher prices and selling forward large volumes of production, which may also help explain the less dramatic price gains further along the curve.
China also remains a key concern and general question mark. China accounted for roughly half of global demand growth over the past decade (Chart 5), but demand growth this year is expected to slow to less than 300 kbpd (+2.5% y/y) from more than 600 kbpd last year. Despite this slowdown, Chinese crude imports are soaring, up an average of 1.4 Mbpd y/y (22%) through February and March. Refinery throughput volumes, however, have failed to keep pace and China has absorbed 1.35 Mbpd of “excess” crude (domestic production plus net imports minus refinery throughputs) over that same period, with those barrels likely finding a home in strategic reserves or speculative storage (difficult to differentiate due to the lack of inventory transparency). Low prices make filling strategic reserves attractive, and it is possible that the same speculation seen in Chinese metals markets (see Metals & Minerals section) has resulted in large volumes being purchased on the gamble that prices rise considerably in the future. It is important to differentiate this type of speculative storage from a safer, essentially intertemporal-demand-shifting, carry-trade where an investor locks in a return by buying deeply discounted spot cargoes and selling them forward (spot-future spread minus storage and interest costs = profit).
Finally, many questions remain regarding the future production path of major OPEC producers. Saudi Arabia’s fiscal break-even price, the crude price that
2.9
3.0
3.1
3.2
'06 '08 '10 '12 '14 '16
12-Month MA Total Vehicle Miles Driven
TrillionMiles
Chart 3: The Great American Roadtrip Begins Anew
Source: FRED, Scotiabank Economics.
0
20
40
60
80
100
120
8
8.5
9
9.5
10
2014 2015 2016
6-Week Lagged USCrude Production, LHS
Front-MonthWTI, RHS
Mbpd $/bbl
Chart 4: Premature Rally May Prolong US Supply Adjustment
Source: EIA, Bloomberg, Scotiabank Economics.
-3
-2
-1
0
1
2
3
4
'05 '07 '09 '11 '13 '15
Rest of World
China
Chart 5: China Has Driven Global Crude Demand Over Past Decade
y/y oil demand growth(Mbpd)
Source: IEA, Scotiabank Economics.

April 29, 2016 Global Economics
3
Scotiabank Commodity Price Index
is required to balance its budget, dropped sharply to $66.70/bbl in 2016 from $94.80 in 2015, according to the IMF. While the Kingdom has shown a willingness to run significant deficits (net foreign assets fell by US$115 billion in 2015), this move further buttresses state finances against a lower-for-longer price outlook. Add to this Riyadh’s unwillingness to compromise on Iran’s post-sanctions export plans (which recently precipitated the collapse of the major producer meeting in Doha, Qatar) and the Kingdom’s newest Vision 2030 strategy aimed at dramatically reducing economic oil dependence. Meanwhile, both Iraq and Iran are expected to further increase production this year, with exports from the latter returning to the market faster than had been originally expected despite lingering sanctions-related complications.
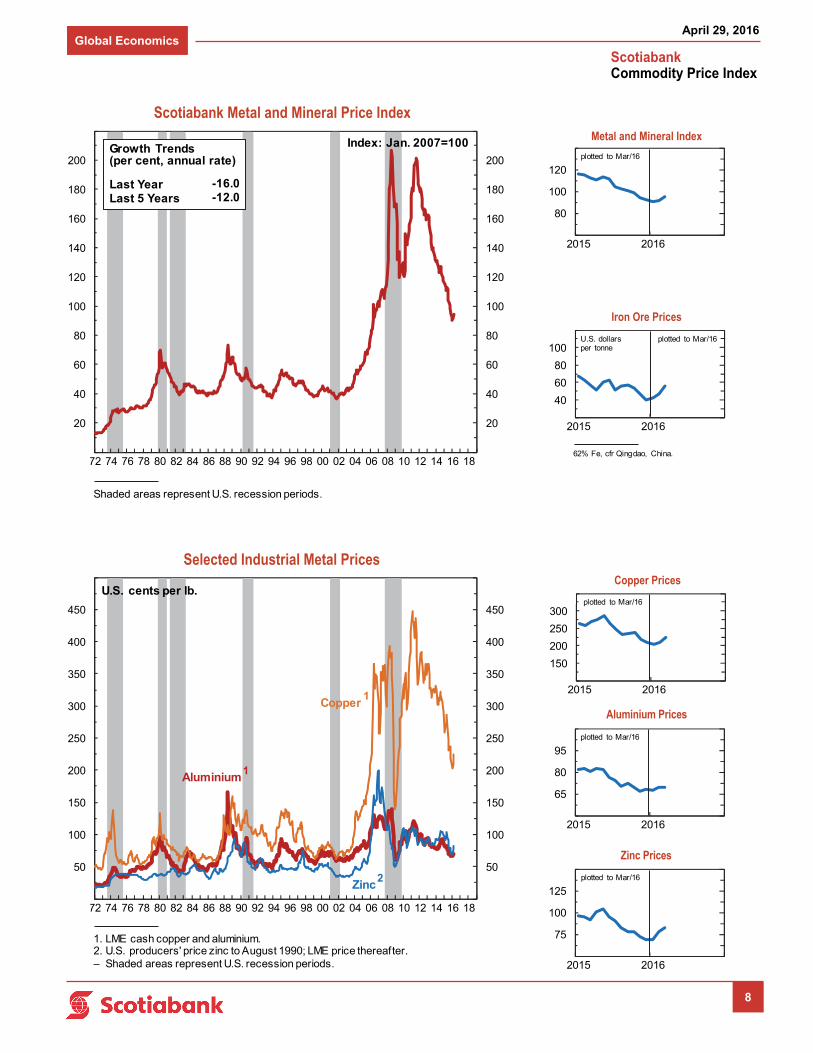
Metals & Minerals
The Metal & Mineral Index advanced by 3.2% m/m in March on the back of significant price gains across the board (Iron Ore +19.7% m/m; Copper +7.7%; Zinc +5.4%; and Nickel +5.0%).
Iron ore (62% Fe delivered to Qingdao) experienced frenzied price momentum, jumping from $51.44/t at the beginning of March to a high of $70.46/t mid-April. A good deal of this strength can be chalked up to booming steel prices on the back of Chinese government credit stimulus and restocking before summer construction. However, there have also been exceptionally high trading volumes — recent sessions have seen daily iron ore trading volumes exceed annual imports and the average holding period for these contracts is steadily declining (Chart 6), raising suspicions of increased speculative activity. In an effort to tamp down speculation, the Dalian Commodity Exchange and the Shanghai Futures Exchange increased trading margin requirements for iron ore, hot rolled coil, and steel rebar; prices have since fallen from highs reached earlier this week. It will be difficult for iron ore to maintain current price levels with new low-cost supply coming online in both Australia (Roy Hill, 55 Mt/y) and Brazil (S11D, 90 Mt/y).
The base metals are also being swept up in the generally bullish commodity sentiment as well as benefitting from China’s most recent stimulus push. Copper continues to experience near-term weakness but longer-term prospects are strong as developing markets increase electrical distribution network density and carbon-conscious global policies push for increased copper-intensive renewable energy market share. Codelco, the world’s largest copper producer, is aiming to reduce production costs by roughly 9% to $1.26/lb this year from $1.39/lb in 2015. Meanwhile, zinc remains a market with fundamental support and prices are forecast to rise materially through 2017. The closing of the Century (Australia) and Lisheen (Ireland) zinc mines as well as Glencore’s decision to idle roughly 500 kt of supply until prices recover have left the zinc concentrates market in deficit.
Scotiabank Commodity Price Index
March 2016 Growth Trends
(per cent change)
Weights One One Three One Five
Month Month Months Year Years
All Commodity Price Index 100.0 7.8 145.7 10.0 -15.4 -12.0
Industrials 84.7 9.8 205.7 8.2 -17.2 -13.3 Oil & Gas 39.9 26.5 1577.5 1.6 -28.0 -19.9
Metal & Minerals 30.1 3.2 46.6 10.3 -16.0 -12.0
Forest Products 14.7 3.4 50.0 13.8 -0.5 -0.8
Agriculture 15.3 1.3 16.3 16.6 -8.4 -5.9
Feb Jan Dec MarAll Commodity Price Index 78.6 78.9 82.7 100.2
Industrials 71.2 72.3 76.6 94.4 Oil & Gas 42.0 45.4 52.9 73.8
Metal & Minerals 91.7 90.4 92.4 112.6
Forest Products 108.6 108.4 108.8 112.9
Agriculture 119.4 115.1 116.3 132.0
(Compound Annual Growth Rates)
Index: January 2007 = 100
112.3
20152016
120.9
Mar84.7
78.253.2
94.6
Re-designed Index: Net export weights in 2010, data re-estimated back through 2007, January 2007=100. As of March 20, 2015, the ‘London Gold Fix’, was replaced by the ‘LBMA Gold Price’. The Bank of Nova Scotia - Scotia Mocatta is one of seven initial participants in the ‘LBMA Gold Price’ auction.
0
5
10
15
20
25
2015 2016Source: Bloomberg, Scotiabank Economics.Note: 10-trading day MA estimated av. hold period for an iron ore contract on Dalian Commodity Exchange; open interest / volume x trading hours.
Chart 6: Investors Aren't Holding Iron Ore Contracts As Long
As They Used To
Estimated Hours Held

April 29, 2016 Global Economics
4
Scotiabank Commodity Price Index
Forest Products & Agriculture
Forest Products also experienced strong gains (+3.4% m/m) as lumber prices rallied ahead of the spring building season. Inventories were kept lean after recent harsh winters pushed back building demand and led to inventory hangovers; however, this year’s mild winter has seen demand rise early, putting increased pressure on replenishment buying in February and March. The Agricultural Index advanced 1.3% m/m on the back of a rally in canola (+5.2% m/m) and beef (+2.6% m/m). Beef prices have since eased slightly due to a small oversupply of fed cattle but demand is expected to ramp up ahead of barbeque season.
1 LME Base metals *March 24, 2016 2 London PM Fix and LBMA PM prices 3 U.S. Northcentral region 4 Delivered to the Eastern U.S. +FOB mill price including export tax for shipments to the United States.
Industrial Commodity Price Outlook
1999 2000 2008 2009 2013 2014 2015 2017F
Apr 28 Avg F
OIL & GAS
West Texas Intermediate Crude Oil 19.25 30.20 99.62 61.78 98 93 49 46.03 42 53
Brent Blend Spot 17.86 28.47 97.95 62.26 109 99 54 48.14 43 54
Natural Gas, Average Alberta Plantgate 2.55 4.50 7.88 3.85 3.74 4.22 2.56 1.92 2.00-2.25 2.25-2.50
(Feb)
Nymex Natural Gas 2.31 4.32 8.90 4.15 3.73 4.28 2.63 2.08 2.25-2.50 2.50-2.75
M ETALS
Uranium 10.20 8.29 63.17 46.65 38.50 33.50 36.82 27.50 31 37
Zinc1 0.49 0.51 0.85 0.75 0.87 0.98 0.88 0.85 0.83 1.25
Aluminium1 0.62 0.70 1.17 0.76 0.84 0.85 0.75 0.75 0.72 0.76
Nickel1 2.73 3.92 9.57 6.65 6.80 7.65 5.37 4.15 3.90 4.50
Copper1 0.71 0.82 3.15 2.34 3.32 3.11 2.50 2.23 2.20 2.30
Gold 2 279 279 872 973 1,410 1,266 1,160 1,256 1,190 1,250
FOREST PRODUCTS
Lumber, Western
Spruce-Pine-Fir 2×4s 368 282 215 178 356 349 277 278 320 350
Oriented Strandboard (OSB)3 259 207 171 163 315 217 208 247 260 290
Newsprint4 510 560 695 560 608 604 538 545 537 550
Pulp4, Northern Bleached
Softwood Kraft 543 685 856 720 941 1,025 972 950 950 950
Supercalendered A Paper4
(35 lb. offset) 803 820 866 798 811 781 775 745 745 770
(Mar)Linerboard4, 42 lb. 383 453 569 545 728 740 740 725 710 700-710
(Mar)
(U.S. dollars per ton)
(U.S. dollars per ounce)
(Cdn dollars per mcf)
(U.S. dollars per mmbtu)
(U.S. dollars per pound)
(U.S. dollars per mfbm)
(U.S. dollars per barrel)
(U.S. dollars per barrel)
(U.S. dollars per thousand sq. ft.)
(U.S. dollars per tonne)
2016F
+ + +
(Mar)
+
(Mar)
April 29, 2016 Global Economics
5
Scotiabank Commodity Price Index
Scotiabank All Commodity Price Index 1
Canadian Dollar vs. Commodity Prices
All Items — Inflation Adjusted
0
20
40
60
80
100
120
140
160
180
200
220
0
20
40
60
80
100
120
140
160
180
200
220
72 74 76 78 80 82 84 86 88 90 92 94 96 98 00 02 04 06 08 10 12 14 16 18
1. A trade-w eighted U.S. dollar-based index of principal Canadian exports.2. Index deflated by U.S. Producer Price Index for Intermediate Goods.– Shaded areas represent U.S. recession periods.
All Items
Index: Jan. 2007=100
All Items –Inflation adjusted2
Growth Trends(per cent, annual rate)Last Year -15.4Last 5 Years -12.0
60
65
70
75
80
85
90
95
100
105
110
115
0
20
40
60
80
100
120
140
160
180
200
220
80 82 84 86 88 90 92 94 96 98 00 02 04 06 08 10 12 14 16 18
Shaded areas represent U.S. recession periods.
Canadian Dollar
Index: Jan. 2007=100
Scotiabank All Commodity Price Index
US cents
60
75
90
105
120
2015 2016
plotted to Mar/16
-1
0
1
2
3
2015 2016
* Year-over-year per cent change.
plotted to Mar/16
All Items
Canadian Dollar
U.S. CPI*
65
70
75
80
85
90
2015 2016
* April 28, 2016: 79.65 U.S. cents.
*
plotted to Mar/16
10
15
20
25
30
2015 2016
plotted to Mar/16
0
20
40
60
80
100
120
140
160
180
00 02 04 06 08 10 12 14 16
Cattle Prices Steady
US$/cwt
Alberta
Nebraska
April 29, 2016 Global Economics
6
Scotiabank Commodity Price Index
Scotiabank Industrial Commodity Price Index 1
Industrial Index
0
20
40
60
80
100
120
140
160
180
200
220
0
20
40
60
80
100
120
140
160
180
200
220
72 74 76 78 80 82 84 86 88 90 92 94 96 98 00 02 04 06 08 10 12 14 16 18
1. A trade-w eighted U.S. dollar-based index of principal Canadian exports;index includes oil & gas, metals and minerals, and forest products.
– Shaded areas represent U.S. recession periods.
Index: Jan. 2007=100Growth Trends(per cent, annual rate)
Last Year Last 5 Years
-17.2-13.3
0
20
40
60
80
100
120
140
160
180
200
220
240
260
280
0
20
40
60
80
100
120
140
160
180
200
220
240
260
280
72 74 76 78 80 82 84 86 88 90 92 94 96 98 00 02 04 06 08 10 12 14 16 18
Shaded areas represent U.S. recession periods.
Index: Jan. 2007=100Growth Trends(per cent, annual rate)
Last Year Last 5 Years
-28.0-19.9
20
40
60
80
100
120
2015 2016
plotted to Mar/16
Scotiabank Oil and Gas Price Index Oil and Gas Index
60
80
100
120
140
2015 2016
plotted to Mar/16
April 29, 2016 Global Economics
7
Scotiabank Commodity Price Index
Western Canadian Oil Prices
0
20
40
60
80
100
120
140
160
0
20
40
60
80
100
120
140
160
72 74 76 78 80 82 84 86 88 90 92 94 96 98 00 02 04 06 08 10 12 14 16 18
– Shaded areas represent U.S. recession periods.* Edmonton Par light oil price estimate for March 2011: US$xx.xx.
U.S. dollars per bbl
Light Sweet Oil Prices at Edmonton
0
40
80
120
160
0
40
80
120
160
10 11 12 13 14 15 16 17 18
WCS Heavy Oil at Hardisty
Light Sweet Oil Prices at Edmonton
0
2
4
6
8
10
12
14
0
2
4
6
8
10
12
14
72 74 76 78 80 82 84 86 88 90 92 94 96 98 00 02 04 06 08 10 12 14 16 18
U.S. dollars per mcf
Crude Oil Prices
Natural Gas Prices
Natural Gas Export Prices
0
10
20
30
40
50
60
70
80
2015 2016
WTI Oil
WCS Heavy Oil at
Hardisty
* WCS April 2016: US$27.91 to date.TMX/Shorcan Energy Brokers: WCS differentials to WTI Oil futures.
plotted to Mar/16
*
U.S. dollars per barrel
0
1
2
3
4
5
6
2015 2016
NYMEX**
NEB Average Export*
* Average short and long-term contract price; estimate for latest month;U.S. dollars per mcf.
** Monthly average of daily NYMEX nearby futures prices.
plotted to Mar/16
U.S. dollars per mcf
April 29, 2016 Global Economics
8
Scotiabank Commodity Price Index
Scotiabank Metal and Mineral Price Index
Selected Industrial Metal Prices
0
20
40
60
80
100
120
140
160
180
200
220
0
20
40
60
80
100
120
140
160
180
200
220
72 74 76 78 80 82 84 86 88 90 92 94 96 98 00 02 04 06 08 10 12 14 16 18
Shaded areas represent U.S. recession periods.
Index: Jan. 2007=100Growth Trends(per cent, annual rate)
Last Year Last 5 Years
-16.0-12.0
0
50
100
150
200
250
300
350
400
450
500
0
50
100
150
200
250
300
350
400
450
500
72 74 76 78 80 82 84 86 88 90 92 94 96 98 00 02 04 06 08 10 12 14 16 18
1. LME cash copper and aluminium.2. U.S. producers' price zinc to August 1990; LME price thereafter.– Shaded areas represent U.S. recession periods.
U.S. cents per lb.
Aluminium1
Copper1
Zinc2
60
80
100
120
140
2015 2016
plotted to Mar/16
20
40
60
80
100
120
2015 2016
plotted to Mar/16
62% Fe, cfr Qingdao, China.
U.S. dollars per tonne
100
150
200
250
300
350
2015 2016
plotted to Mar/16
50
65
80
95
110
2015 2016
plotted to Mar/16
Aluminium Prices
50
75
100
125
150
2015 2016
plotted to Mar/16
Metal and Mineral Index
Iron Ore Prices
Copper Prices
Zinc Prices

April 29, 2016 Global Economics
9
Scotiabank Commodity Price Index
Nickel Prices
0
2
4
6
8
10
12
14
16
18
20
22
24
26
0
2
4
6
8
10
12
14
16
18
20
22
24
26
72 74 76 78 80 82 84 86 88 90 92 94 96 98 00 02 04 06 08 10 12 14 16 18
LME cash settlement price since 1980.– Shaded areas represent U.S. recession periods.
U.S. dollars per lb.
0
200
400
600
800
1,000
1,200
1,400
1,600
1,800
2,000
0
200
400
600
800
1,000
1,200
1,400
1,600
1,800
2,000
72 74 76 78 80 82 84 86 88 90 92 94 96 98 00 02 04 06 08 10 12 14 16 18
Price on April 28, 2016: 1,256.00 U.S. dollars.
per ounce
Gold Prices (U.S. Dollar)
2
4
6
8
10
12
2015 2016
plotted to Mar/16
8
10
12
14
16
18
2015 2016
U.S. dollars per lb. plotted to Mar/16
800
1,000
1,200
1,400
1,600
2015 2016
* April 28, 2016: 1,256.00 U.S. dollars.
*
plotted to Mar/16
8101214161820
2015 2016
plotted to Mar/16
U.S. dollars per ounce
* April 28, 2016: 17.35 U.S. dollars.
*
Silver Prices
Nickel Prices
Cobalt Prices
Gold Prices (U.S. Dollar)

April 29, 2016 Global Economics
10
Scotiabank Commodity Price Index
Selected Forest Product Prices
Scotiabank Forest Product Price Index
0
100
200
300
400
500
600
700
800
900
1,000
1,100
0
100
200
300
400
500
600
700
800
900
1,000
1,100
72 74 76 78 80 82 84 86 88 90 92 94 96 98 00 02 04 06 08 10 12 14 16 18
1. New sprint and pulp delivered to U.S.A.2. Western S.P.F. 2x4 lumber.– Shaded areas represent U.S. recession periods.
U.S. dollars per tonne
Pulp1
Lumber2
Newsprint1
U.S. dollars per mfbm
100
110
120
130
140
2015 2016
plotted to Mar/16
700
760
820
880
2015 2016
U.S. dollars per ton plotted to Mar/16
100
150
200
250
300
2015 2016
U.S. dollars per thousand sq. ft.
plotted to Mar/16
Newsprint Prices
800
900
1000
1100
1200
2015 2016
plotted to Mar/16
475
525
575
625
2015 2016
plotted to Mar/16
200
250
300
350
400
2015 2016
plotted to Mar/16
0
20
40
60
80
100
120
140
0
20
40
60
80
100
120
140
72 74 76 78 80 82 84 86 88 90 92 94 96 98 00 02 04 06 08 10 12 14 16 18
Shaded areas represent U.S. recession periods.
Index: Jan. 2007=100Growth Trends(per cent, annual rate)
Last Year Last 5 Years
-0.5-0.8
Forest Product Index
Supercalendered Paper
OSB Prices
Pulp Prices
Lumber Prices

April 29, 2016 Global Economics
11
Scotiabank Commodity Price Index
Scotiabank Agricultural Price Index
Selected Agricultural Prices
30
50
70
90
110
130
150
170
190
210
230
30
50
70
90
110
130
150
170
190
210
230
72 74 76 78 80 82 84 86 88 90 92 94 96 98 00 02 04 06 08 10 12 14 16 18
Shaded areas represent U.S. recession periods.
Index: Jan. 2007=100
Growth Trends(per cent, annual rate)
Last Year Last 5 Years
-8.4-5.9
100
120
140
160
180
2015 2016
plotted to Mar/16
250
325
400
475
550
625
2015 2016
U.S. dollars per tonne
plotted to Mar/16
200
250
300
350
400
2015 2016
plotted to Mar/16
0
20
40
60
80
100
2015 2016
plotted to Mar/16
100
120
140
160
180
2015 2016
plotted to Mar/16
Canola Prices
Agricultural Index
Wheat Prices
Hog Prices
Cattle Prices
0
20
40
60
80
100
120
140
160
180
0
20
40
60
80
100
120
140
160
180
72 74 76 78 80 82 84 86 88 90 92 94 96 98 00 02 04 06 08 10 12 14 16 18
0
100
200
300
400
500
600
700
800
0
100
200
300
400
500
600
700
800
72 74 76 78 80 82 84 86 88 90 92 94 96 98 00 02 04 06 08 10 12 14 16 18
1. Dark Northern Spring, No. 1 14% at Duluth, Minnesota; before April 2011 Canadian Wheat Board asking export price #1 CWRS.2. Cash cattle and hogs at Toronto; from January 1993 average of Ontario markets.
U.S. dollars per tonne
Wheat1
Cattle2
Hogs2
U.S. dollars per cwt

This Index has been designed to track the spot or transactions prices paid in U.S. dollars for key Canadian commodities and resource-based manufactured goods in export markets. The weight of each component is based upon its net export value in 2010. Prior to January 2007, the weight of each component was based on its export value in 1995-97, except for crude oil & refined petroleum products, uncoated freesheet paper and linerboard, where net exports were used. Canada imports a significant quantity of these products, and use of their export value alone would have overstated the importance in Canada’s trade performance.
The following prices are included:
OIL & GAS
Crude Oil & Refined Petroleum Products (US$ per bbl) MSW light sweet crude oil at Edmonton (previously Edmonton Par crude) and Western Canadian Select heavy oil at Hardisty, Alberta; price differentials off WTI near-by futures from TMX/Shorcan Energy Brokers.
Natural Gas (US$ per mcf) Average export price quoted by the National Energy Board.
Natural Gas Liquids (NGLs – Propane, Butane, Ethane & Pentanes-Plus) (US$ per bbl), Propane at Edmonton & Sarnia.
METALS & MINERALS
Copper & Products (US$ per lb) LME official cash settlement price for grade A copper.
Zinc (US$ per lb) LME SHG cash settlement: prior to Sept 1990, U.S. producers’ price for high-grade zinc delivered.
Lead (US$ per lb) LME official cash settlement price; prior to Jan. 1991, U.S. producers’ price for common grade delivered.
Aluminium & Products (US$ per lb) since 1979, LME official cash settlement price.
Nickel (US$ per lb) since 1980, LME official cash settlement price.
Gold (US$ per oz) ‘LBMA Gold Price PM’ as of March 20, 2015.
Potash (US$ per tonne) Standard potassium chloride, spot price, FOB Vancouver.
Sulphur (US$ per tonne) Solid, spot price, FOB Vancouver.
Metallurgical Coal (US$ per tonne) Contract price for premium-grade hard coking coal, FOB Vancouver.
Iron Ore (US cents per dmtu) Spot price fines 62% Fe, CFR Qingdao, China; prior to Jan 2011, term-contract price for concentrates 66% Fe from Labrador/Quebec to Northern Europe (FOB Sept-Iles).
Uranium (US$ per lb) Spot price for U3O8.
Molybdenum (US$ per lb) since March 1992, MW dealer oxide.
Cobalt (US$ per lb) MW dealer price.
FOREST PRODUCTS
Lumber & Wood Products, Western Spruce-Pine-Fir 2x4 No.2 & Btr (US$ per mfbm) FOB mill.
Oriented Strandboard (US$ per thousand sq. ft.), U.S. North Central region, 7/16 inch.
Pulp, Bleached Northern Softwood Kraft (US$ per tonne) Transactions price, delivery USA.
Newsprint (US$ per tonne) Average transactions price, 48.8 gsm, delivery Eastern USA.
Groundwood Specialty Papers (US$ per ton) Supercalendered-A paper, 35 lb., delivery USA.
Linerboard (US$ per ton), delivery Eastern USA with zone discounts.
AGRICULTURE
Wheat & Flour (US$ per tonne), DNS No 1 14% protein Duluth, Minn; prior to April 2011 No.1 CWRS, 13.5% protein at St. Lawrence.
Barley (US$ per tonne), since Dec.1994, No.1 at Lethbridge, Alberta.
Canola & Oilseeds (US$ per tonne) No.1 Canada, in store Vancouver.
Cattle & Beef (US$ per cwt) Steers over 1,051 pounds at Toronto; from Jan 1993, Ontario average.
Hogs & Pork (US$ per cwt) 100 Index Hogs at Toronto; from Jan 1993, Ontario average.
Fish & Seafood (US$ per lb) West Coast silver coho salmon; Atlantic lobster prices; prior to 1986 cod fillets & blocks.
Scotiabank Commodity Price Index — Components And Weights
Index
Components
OIL & GAS INDEX 46,537 39.90Crude Oil & Refined Products 33,231 28.49Natural Gas & LNG 11,741 10.07NGLs 1,565 1.34
METAL & MINERAL INDEX 35,109 30.10Copper 3,160 2.71Zinc 1,255 1.08Lead 579 0.50Alum inium 6,045 5.18Nickel 4,246 3.64Gold 4,678 4.01Coal 4,757 4.08Iron Ore 3,346 2.87Potash 5,161 4.42Sulphur 457 0.39Uranium 891 0.76Cobalt 288 0.25Molybdenum 246 0.21
FOREST PRODUCTS INDEX 17,081 14.66Lum ber & Wood Products 4,673 4.01OSB 812 0.70Pulp 6,818 5.85Newsprint 2,734 2.34Groundwood Spec. Papers 1,971 1.69Linerboard 87 0.07
AGRICULTURAL INDEX 17,901 15.35Wheat & Flour 4,693 4.02Barley & Feedgrains 1,088 0.93Canola & Oilseeds 5,398 4.63Cattle & Beef 1,640 1.41Hogs & Pork 2,378 2.04Fish & Seafood 2,704 2.32TOTAL INDEX 116,643 100.00
Net Export Value In 2010
(millions of dollars)
Index Weight
(per cent)
April 29, 2016
Technical Note Scotiabank Commodity Price Index — Principal Canadian Exports
January 2007 = 100
Global Economics
12
Scotiabank Commodity Price Index