aquamaps: mapping biodiversity hotspots and assessing impacts of climate change k.kaschner (fao...
TRANSCRIPT
AquaMaps: Mapping Biodiversity Hotspots and Assessing Impacts of Climate Change
K.Kaschner (FAO & Albert-Ludwigs-University of Freiburg), M. Taconet (FAO), A. Ellenbroek (FAO), N. Bailly (WFC), L. Pagano (CNR)
EGEE’0922 September 2009Barcelona (Spain)
www.d4science.eu

2EGEE’09 Barcelona, 22 September 2009 AquaMaps – Biodiversity Hotspots & Climate Change
• Our problem
• One solution
- & its limitations
• Towards better solution.....
Outline

3EGEE’09 Barcelona, 22 September 2009 AquaMaps – Biodiversity Hotspots & Climate Change
We want to save the
world....
Our Problem
4EGEE’09 Barcelona, 22 September 2009 AquaMaps – Biodiversity Hotspots & Climate Change
• Long-term protection of marine biodiversity
• Implementation of Ecosystems Approach to Fisheries
Our Goals

5EGEE’09 Barcelona, 22 September 2009 AquaMaps – Biodiversity Hotspots & Climate Change
Who‘s involved?
Production systems / Fleets
Resources of commercial interest
Broader ecosystem
Physical environment
FAO
WFC
RFBs
CoML / OBIS
IOC
IUCN
Fisheries
biod
iversity
Environm
ent
GBIF
Environmental Monitoring
Ecosystems approach to Fisheries
Marine Conservation
ESA

6EGEE’09 Barcelona, 22 September 2009 AquaMaps – Biodiversity Hotspots & Climate Change
Marine mammal species (n = 115) Currently available point occurence data
Our Problem, More Specifically: Limited Information about Species
Occurrence

7EGEE’09 Barcelona, 22 September 2009 AquaMaps – Biodiversity Hotspots & Climate Change
800,000 occurrence records (www.gbif.org)
300,000 described marine species
> 1,000 000 potential species
Our Problem, More Specifically: Limited Information about Species
Occurrence
......not a lot of data / species
8EGEE’09 Barcelona, 22 September 2009 AquaMaps – Biodiversity Hotspots & Climate Change
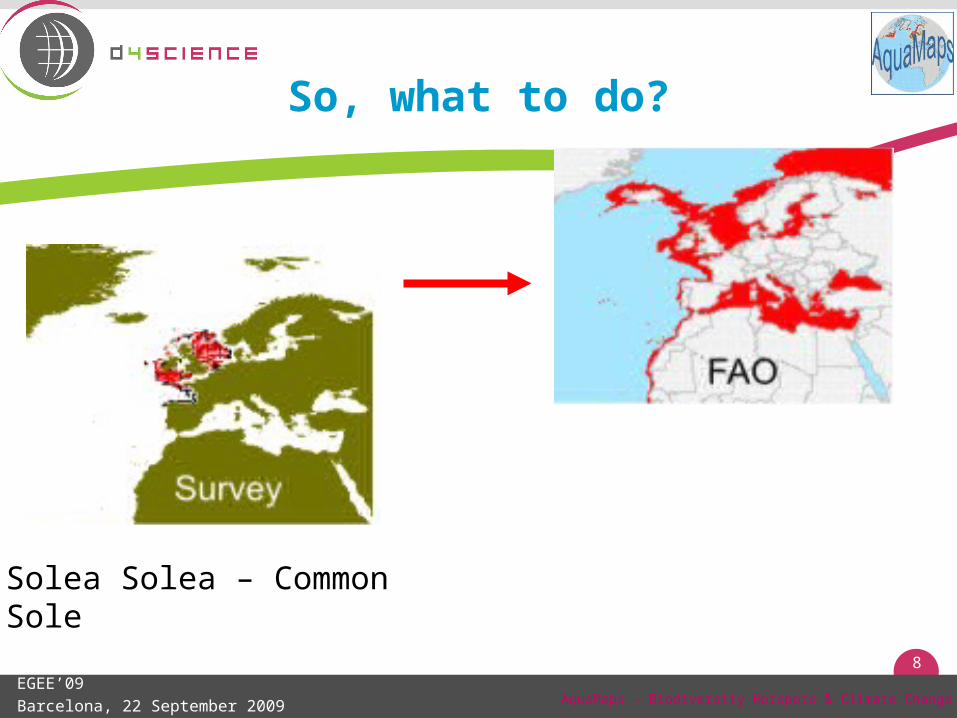
So, what to do?
Solea Solea – Common Sole

9EGEE’09 Barcelona, 22 September 2009 AquaMaps – Biodiversity Hotspots & Climate Change
The Solution: Species Distribution Modelling
• Input– Occurrence data & information– Environmental layers
• Algorithms– RES / AquaMaps (ecological niche model)– BioClim– Maxent….
• Predictions– Existing distribution (mostly annual average)– Temporal projections (future/historic)

10EGEE’09 Barcelona, 22 September 2009 AquaMaps – Biodiversity Hotspots & Climate Change
Our Solution: AquaMaps
www.aquamaps.org
11EGEE’09 Barcelona, 22 September 2009 AquaMaps – Biodiversity Hotspots & Climate Change
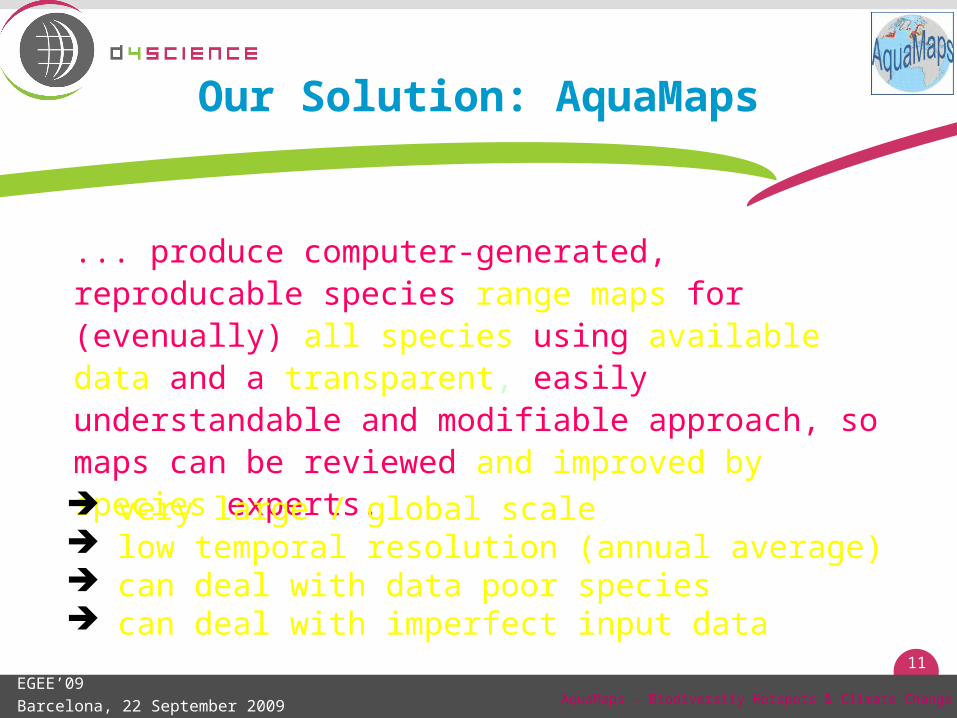
Our Solution: AquaMaps
... produce computer-generated, reproducable species range maps for (evenually) all species using available data and a transparent, easily understandable and modifiable approach, so maps can be reviewed and improved by species experts.
very large / global scale low temporal resolution (annual average) can deal with data poor species can deal with imperfect input data
12EGEE’09 Barcelona, 22 September 2009 AquaMaps – Biodiversity Hotspots & Climate Change
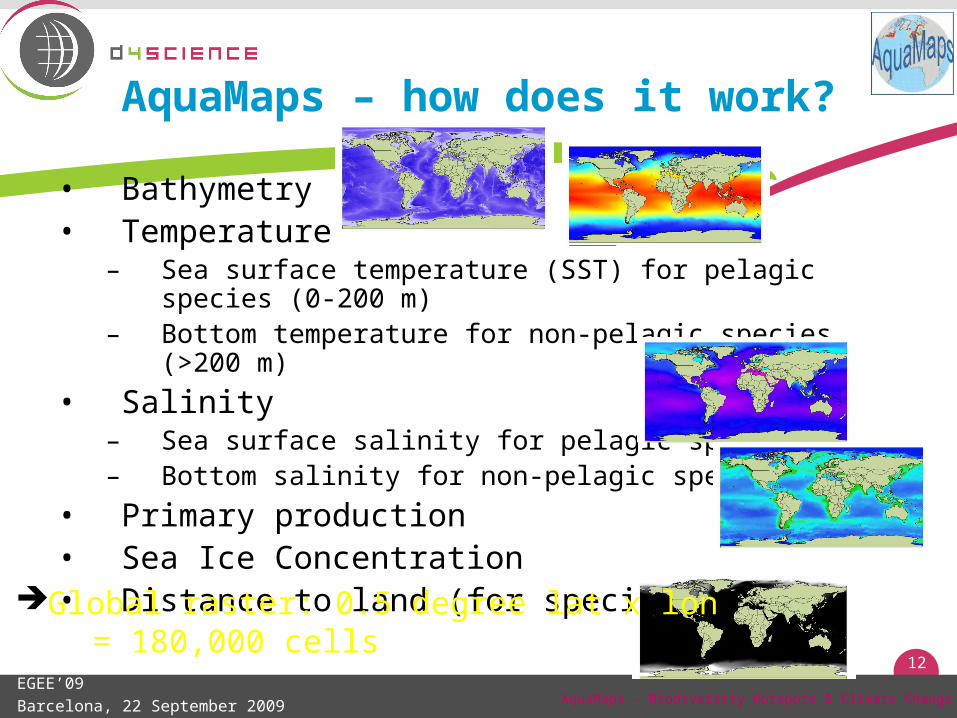
AquaMaps – how does it work?
• Bathymetry• Temperature
– Sea surface temperature (SST) for pelagic species (0-200 m)– Bottom temperature for non-pelagic species (>200 m)
• Salinity– Sea surface salinity for pelagic species– Bottom salinity for non-pelagic species
• Primary production• Sea Ice Concentration• Distance to land (for special cases)
Global raster: 0.5 degree lat x lon = 180,000 cells

13EGEE’09 Barcelona, 22 September 2009 AquaMaps – Biodiversity Hotspots & Climate Change
AquaMaps – how does it work?
Probability
Observed min
Observed max
Optimal range10th to 90th percentiles
Environmentallayer values
75th percentile +(IQR*1.5)
25th percentile -(IQR*1.5)
IQR = interquartile range
Environmental envelopes

14EGEE’09 Barcelona, 22 September 2009 AquaMaps – Biodiversity Hotspots & Climate Change
AquaMaps – how does it work?

15EGEE’09 Barcelona, 22 September 2009 AquaMaps – Biodiversity Hotspots & Climate Change
Solea Solea – Common Sole
Ready et al, accepted
AquaMaps – how does it work?

16EGEE’09 Barcelona, 22 September 2009 AquaMaps – Biodiversity Hotspots & Climate Change
www.aquamaps.org
> 9000 species covered
AquaMaps – how does it work?

17EGEE’09 Barcelona, 22 September 2009 AquaMaps – Biodiversity Hotspots & Climate Change
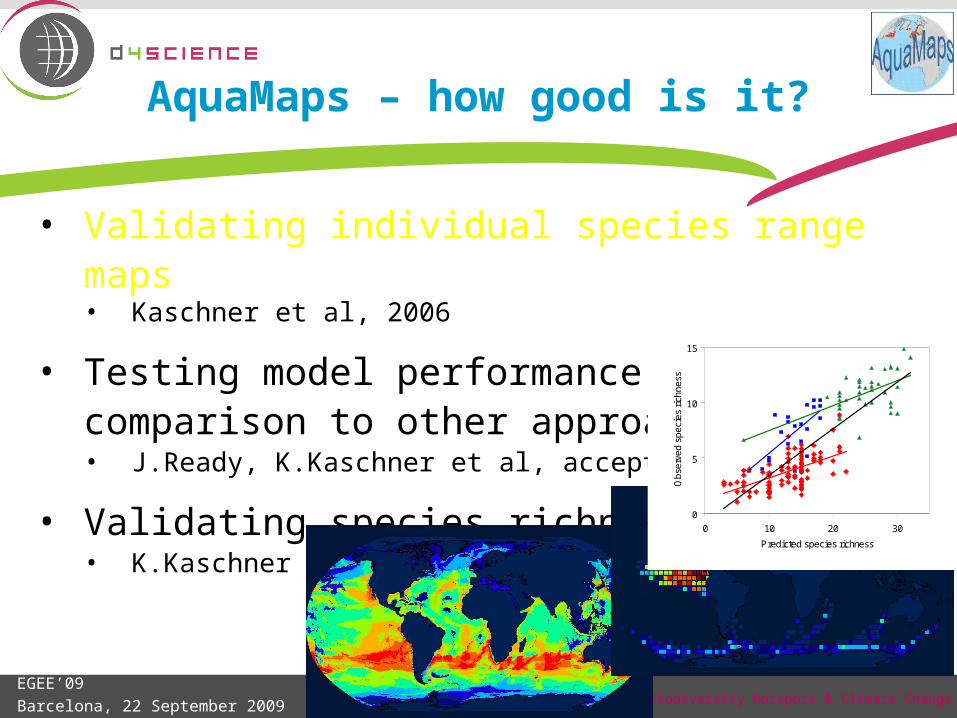
AquaMaps – how good is it?
• Validating individual species range maps• Kaschner et al, 2006
Southern elephant sealSouthern elephant seal

18EGEE’09 Barcelona, 22 September 2009 AquaMaps – Biodiversity Hotspots & Climate Change
• Validating individual species range maps• Kaschner et al, 2006
• Testing model performance in comparison to other approaches• J.Ready, K.Kaschner et al, accepted
AquaMaps – how good is it?
19EGEE’09 Barcelona, 22 September 2009 AquaMaps – Biodiversity Hotspots & Climate Change
• Validating individual species range maps• Kaschner et al, 2006
• Testing model performance in comparison to other approaches• J.Ready, K.Kaschner et al, accepted
• Validating species richness maps• K.Kaschner et al, in prep 0
5
10
15
0 10 20 30
Predicted species richness
Ob
serv
ed s
pe
cie
s ri
chn
ess
AquaMaps – how good is it?

20EGEE’09 Barcelona, 22 September 2009 AquaMaps – Biodiversity Hotspots & Climate Change
AquaMaps – what can we do with it?

21EGEE’09 Barcelona, 22 September 2009 AquaMaps – Biodiversity Hotspots & Climate Change
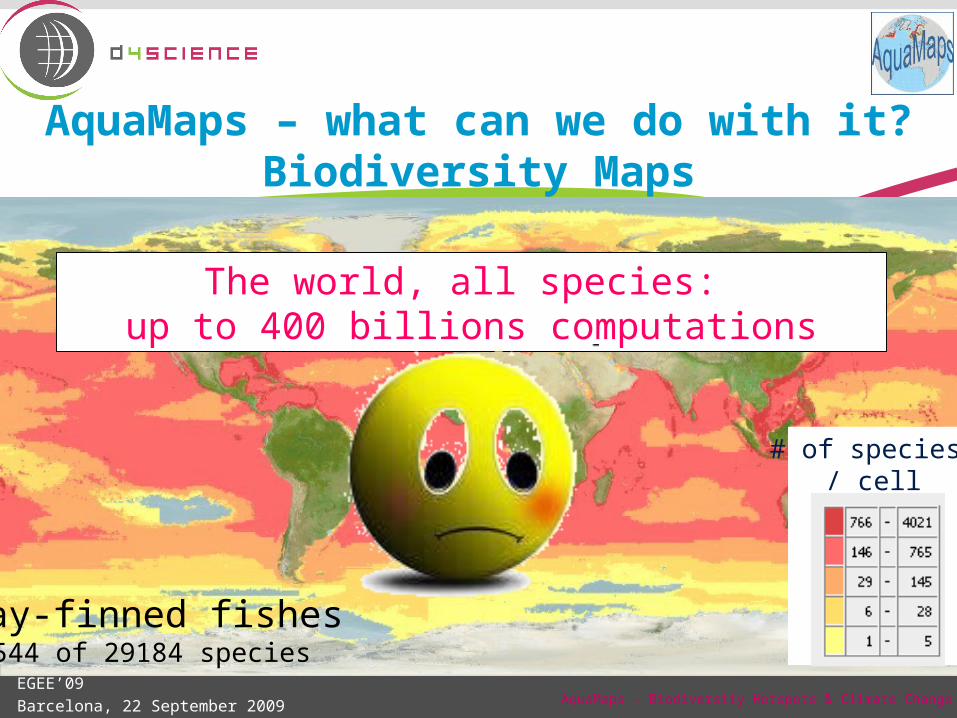
AquaMaps – what can we do with it?Biodiversity Maps
45 of 57 species
# of species / cell
Scombridae

22EGEE’09 Barcelona, 22 September 2009 AquaMaps – Biodiversity Hotspots & Climate Change
AquaMaps – what can we do with it?Biodiversity Maps
Species richness
Gadidae: 23 of 25 species
Mean length
Mean trophic level
23EGEE’09 Barcelona, 22 September 2009 AquaMaps – Biodiversity Hotspots & Climate Change
AquaMaps – what can we do with it?Biodiversity Maps
6544 of 29184 speciesRay-finned fishes
# of species / cell
The world, all species: up to 400 billions computations

24EGEE’09 Barcelona, 22 September 2009 AquaMaps – Biodiversity Hotspots & Climate Change
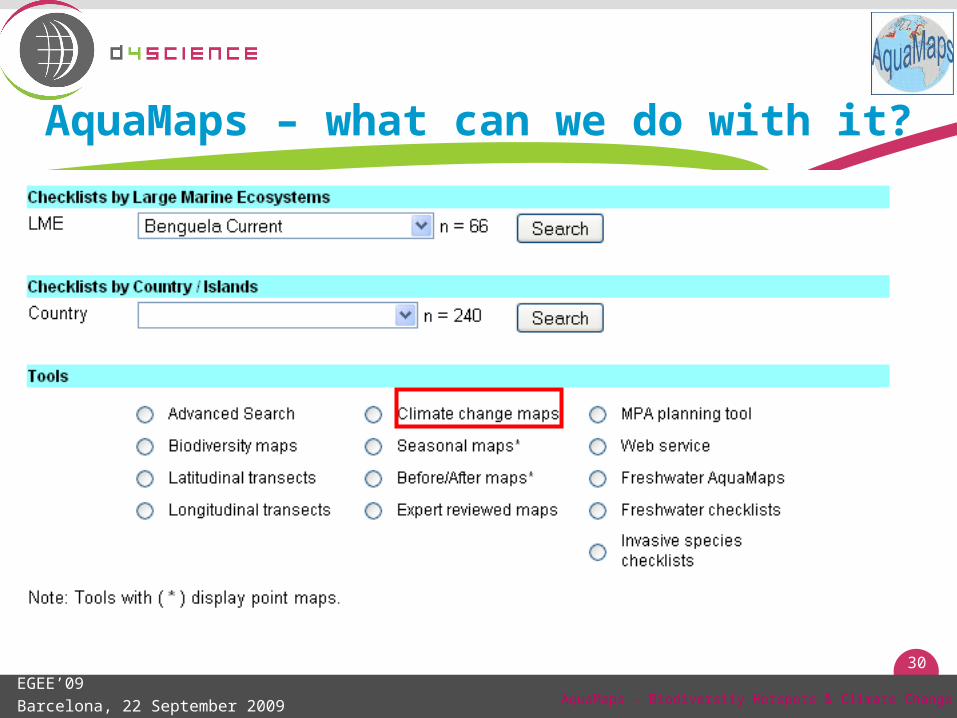
AquaMaps – what can we do with it?

25EGEE’09 Barcelona, 22 September 2009 AquaMaps – Biodiversity Hotspots & Climate Change
AquaMaps – what can we do with it?Longitudinal Transects

26EGEE’09 Barcelona, 22 September 2009 AquaMaps – Biodiversity Hotspots & Climate Change
AquaMaps – what can we do with it?
Latitudinal gradientsLongitudinal gradients
40ºN
10ºE 20ºE 30ºE0ºE
30ºN
50ºN
35ºN
45ºN
5ºE 15ºE 25ºE
Several lat / lon transects computed globally for many species

27EGEE’09 Barcelona, 22 September 2009 AquaMaps – Biodiversity Hotspots & Climate Change
AquaMaps – what can we do with it?

28EGEE’09 Barcelona, 22 September 2009 AquaMaps – Biodiversity Hotspots & Climate Change
AquaMaps – what can we do with it?MPA Planning
Species selectionbased on:
• IUCN criteria
• Area dependence
• Resilience
• Fisheries
• Popularity
All marine mammals (n = 115)
Kaschner, 2007
0.00
0.05
0.10
0.15
0.20
0.25
0.30
0 5 10 15 20 25 30 35 40
Species richness category
Mean s
eam
ount density
Spearman’s rho = 0.76, p < 0.0001

29EGEE’09 Barcelona, 22 September 2009 AquaMaps – Biodiversity Hotspots & Climate Change
AquaMaps – what can we do with it?MPA Planning
Wood et al, in review
ResNet optimization, all species: Several weeks using Supercomputers
30EGEE’09 Barcelona, 22 September 2009 AquaMaps – Biodiversity Hotspots & Climate Change
AquaMaps – what can we do with it?

31EGEE’09 Barcelona, 22 September 2009 AquaMaps – Biodiversity Hotspots & Climate Change
AquaMaps – what can we do with it?Modelling Impacts of Climate Change
Kaschner et al, in prep
Marine Mammals (n = 115)
Biodiversity gain [%]
%%%%%%%%%%
0
150
100
120
130
140
225
180
300
600
%%%%%%%%%%
%%%%%%%%%%
0
150
100
120
130
140
225
180
300
600
0
150
100
120
130
140
225
180
300
600
%%%%%%%
% 0
20
2.5
5
10
15
100
25
%%%%%%%
%%%%%%%%
% 0
20
2.5
5
10
15
100
25
Biodiversity loss [%]

32EGEE’09 Barcelona, 22 September 2009 AquaMaps – Biodiversity Hotspots & Climate Change
AquaMaps – what can we do with it?Modelling Impacts of Climate Change
Kaschner et al, in prep
-200
-100
0
100
200
300
400
500
-77.5 -62.5 -47.5 -32.5 -17.5 -2.5 12.5 27.5 42.5 57.5 72.5 87.5
Latitude
Cha
nge
in s
peci
es r
ichn
ess
[%]
Pinn
Odnz
Ziph
Myst
Marine Mammals (n = 115)
Relative change in species richness by latitude & different taxonomic groups

33EGEE’09 Barcelona, 22 September 2009 AquaMaps – Biodiversity Hotspots & Climate Change
AquaMaps – what can we do with it?Modelling Impacts of Climate Change
WorldFish Centre Project:
Hotspots, Fisheries and Climate Change in South China Sea
- 6,188 half degree cells- 2,540 species- 5+3 environmental parameters
Local multispecies map, several climate scenarios:
up to 1 billion computations

34EGEE’09 Barcelona, 22 September 2009
Requirements– harmonization of time series data– querying, with aggregation and reallocation rules– combining biodiversity information with fisheries Catch
time series– spatial dimension and mapping (GIS)
ICIS
Fisheries
Fishing activity / Catch
Integrated Capture Information System product: harmonized and reallocated
catch statistics
Implementing an Ecosystems Approach to Fisheries
AquaMaps – Biodiversity Hotspots & Climate Change

35EGEE’09 Barcelona, 22 September 2009 AquaMaps – Biodiversity Hotspots & Climate Change
This is where we’re going….
D4Science: Collaborative virtual laboratories (VREs) in support to science
• working environment with access to multidisciplinary data sources and chain workflow processes • Facilitates control of data sharing and collaborative reporting• Provides access to GRID Infrastructure, storage and computing powers to all regional fisheries bodies

36EGEE’09 Barcelona, 22 September 2009
Local
Dynamic AquamapsEnvironmental monitoring
ICIS/time series
D4
Scie
nce
Aquamaps
WFC
Fisheries Biodiversity Oceanography
Habitats Geo-forms HydrographyVulnerable Marine Ecosystems
Satelliteoceanography
Species occurence
FishBase
OBIS
ESA
Fishing activity / Catch
GIS areas - species
FAO
RFBs
Catch statistics
Reference system
Catch statistics
Reference system
SealifeBase
UBC
G-POD
end-users services
AquaMaps – Biodiversity Hotspots & Climate Change
This is where we’re going….

37EGEE’09 Barcelona, 22 September 2009
Local
Dynamic AquamapsEnvironmental monitoring
ICIS/time series
D4
Scie
nce
Aquamaps
WFC
Fisheries Biodiversity Oceanography
Habitats Geo-forms HydrographyVulnerable Marine Ecosystems
Satelliteoceanography
Species occurence
FishBase
OBIS
ESA
Fishing activity / Catch
GIS areas - species
FAO
RFBs
Catch statistics
Reference system
Catch statistics
Reference system
SealifeBase
UBC
G-POD
end-users services
AquaMaps – Biodiversity Hotspots & Climate Change
This is where we’re going….

38EGEE’09 Barcelona, 22 September 2009 AquaMaps – Biodiversity Hotspots & Climate Change
Thank you

39EGEE’09 Barcelona, 22 September 2009 AquaMaps – Biodiversity Hotspots & Climate Change
Acknowledgements
• D4Science Contract n°: RI-212488
• INCOFISH Project (www.incofish.org) & AquaMaps (www.aquamaps.org)
– Jon Ready, Eli Agbayani, Josephine Rius Barile, Kathy Kesner-Reyes, Paul D. Eastwood, Andrew B. South, Sven O. Kullander, Tony Rees, Chris Close, Reg Watson, Daniel Pauly & Rainer Froese
• ‘Sea Around Us’ project (www.seaaroundus.org) & Pew Charitable Trusts of Philadelphia, USA
– Reg Watson, Andrew Trites, Daniel Pauly
• The Sloan Foundation & the FMAP Project (www.fmap.ca):
– Boris Worm, Derek Tittensor, Tim Guerodette