are good jobs disappearing in canada? › medialibrary › media › ... · are good jobs...
TRANSCRIPT

FRBNY Economic Policy Review / August 2005 23
Are Good Jobs Disappearing in Canada?
1. Introduction
oncerns that international competition is driving jobs offshore are not new. In the early 1980s, it was argued that
many manufacturing jobs in advanced economies were being lost to developing countries, leaving behind a service sector polarized among a set of high-wage “knowledge” jobs on the one hand and low-wage personal service jobs on the other (Bluestone and Harrison 1982). This phenomenon was referred to as deindustrialization.
Recently, a new version of the deindustrialization hypothesis has emerged. Some observers are suggesting that employers now use outsourcing abroad not only for manufacturing, but also for jobs in the service sector that have high-skill requirements (BusinessWeek 2003, 2004). The rise of information and communication technologies combined with the availability of relatively skilled workers in fast-growing countries would now allow firms to contract out “intelligent” jobs in sectors such as engineering and informatics. Countries such as China, India, and some in Eastern Europe would provide the skilled workforce required for these jobs, which generally pay high wages in countries in the Organisation for Economic Co-operation and Development.
These changes in the behaviour of firms have potentially important implications for the types of jobs available to Canadian workers. One may argue that unless jobs affected by the new (and old) forms of outsourcing are replaced elsewhere
in the Canadian economy by others providing similar wages, the fraction of well-paid jobs in Canada should decline over time.
An alternative view is that the new forms of outsourcing outlined above are fairly recent and thus are unlikely to affect a substantial fraction of Canadian jobs. If so, one would expect to see little change in the fraction of well-paid jobs during the past few years.
Other factors may have altered the proportion of well-paid jobs in Canada. Growing competition may have induced some firms to cut their labour costs by reducing wages. The decline in union density observed over the past two decades (Akyeampong 2004) and the drop in the proportion of jobs coming from large firms (Statistics Canada forthcoming) may also have affected pay rates.1 Each of the three factors above may have tended to reduce the proportion of well-paid jobs. In contrast, skill-biased technological changes may have tended to increase the proportion of well-paid jobs.
This study assesses what actually happened—that is, whether well-paid jobs have been disappearing in Canada in recent years.
Apart from the obvious implications it has for Canadians’ living standards and for the ability of governments to collect personal income taxes and to finance social transfers, the analysis of trends in the relative importance of well-paid jobs is important for several reasons. Lack of well-paid jobs may restrict upward earnings mobility, increase families’ difficulty
René Morissette and Anick Johnson
René Morissette is assistant director of research of the Business and Labour Market Analysis Division of Statistics Canada; Anick Johnson is an economist in the Input-Output Division of Statistics Canada.<[email protected]><[email protected]>
The authors thank Erica Groshen for helpful comments on a first draft of this paper. The views expressed are those of the authors and do not necessarily reflect the position of the Federal Reserve Bank of New York, the Federal Reserve System, or Statistics Canada.
C

24 Are Good Jobs Disappearing in Canada?
moving out of poverty, alter young individuals’ decisions regarding schooling, and restrict households’ ability to accumulate savings for precautionary motives.
Until recently, lack of comparable data on hourly wages precluded such analysis in Canada. As is well known, the Canadian census and the Survey of Consumer Finances (SCF) asked individuals how many hours per week they had worked during the month of the survey (usually in April or May) while collecting information about the total earnings they had received in the previous year from one or several jobs. As a result, the census and SCF could not be used to measure the hourly wage rates received by individuals in a given job. With the redesign of the Labour Force Survey (LFS), consistent data on hourly wages at the job level are now available going back to 1997.
In this paper, we take advantage of this fact and examine how the fraction of jobs falling into certain wage categories has evolved during the 1997-2004 period. Furthermore, we assemble data from several household surveys that contain hourly wage data at the job level and that have been conducted since 1981. While these surveys do not necessarily provide a consistent time series of hourly wages—changes in wages that are obtained using these surveys may reflect real changes in pay rates as well as spurious changes resulting from the use of intrinsically distinct surveys—they allow us to analyze how relative wages of specific subgroups have evolved over the past two decades. For instance, they allow us to assess whether wages of newly hired employees have fallen relative to those of their counterparts who have greater seniority, a pattern that could signal important changes in the employer-employee relationship.
Assessing whether well-paid jobs are disappearing in Canada also implies studying the evolution of nonwage benefits over time. To do so, we use data from the Longitudinal Administrative Databank and the Pension Plans in Canada Database of Statistics Canada to examine how workers’ pension coverage—the most important of all nonwage benefits—has evolved over the past two decades.
In response to the growing competition they face within industries and from abroad, Canadian employers may seek greater flexibility in various ways. First, they may alter their wage offers for newly hired employees, a scenario we can investigate using the aforementioned surveys. Second, they may rely heavily on temporary jobs when hiring these new employees. To quantify the extent to which they have done so since the late 1980s, we combine the General Social Surveys (GSS) of 1989 and 1994 with the redesigned LFS. This allows us to document the evolution of the relative importance of temporary jobs among new employees during the 1989-2004 period.
It is important to emphasize that our main interest in this paper is to study the evolution of the relative importance of jobs that pay fairly well and of those that pay little in real terms, not in relative terms. Hence, our goal is not to analyze the evolution of hourly wage inequality.
Our main findings can be summarized as follows. First, we find little evidence that the relative importance of well-paid jobs—however defined—has fallen over the past two decades or since the second half of the 1990s. Second, we find little evidence that the relative importance of low-paid jobs—those paying less than $10.00 per hour—has risen during these two periods. Third, we show, along with numerous other studies, that the wage gap between workers under age thirty-five and their older counterparts has risen substantially over the past two decades, but the wage gap between university graduates and other workers has shown little change. Fourth—and more important—we demonstrate that, within age groups, wages of newly hired male and female employees—those with two years of seniority or less—have fallen considerably relative to those of others. Fifth, in the private sector, the fraction of new workers employed in temporary jobs has risen substantially, increasing from 11 percent in 1989 to 21 percent in 2004. Among employees with one year of seniority or less, the incidence of temporary work rose from 14 percent in 1989 to 25 percent in 2004. Sixth, pension coverage has fallen among males of all ages and among females under age forty-five. Taken together, these last three findings suggest that Canadian firms (existing or newly born) have responded to growing competition within industries and from abroad in at least three ways: by reducing their wage offers for new employees, by offering temporary jobs to a growing fraction of these employees, and by reducing their propensity to offer defined-benefit pension plans.
2. Data
To study the evolution of the relative importance of low-paid jobs and well-paid jobs, we assemble data from a wide variety of household surveys: the Survey of Work History of 1981 (SWH), the Survey of Union Membership of 1984 (SUM), the Labour Market Activity Surveys of 1986-1990 (LMAS), and the Labour Force Surveys of 1997-2004. All of these surveys cover the same population, are based on the Labour Force Survey sample design, and contain information on hourly wages received in the main job held by paid workers.2
In all of these surveys, the information on hourly wages is obtained by dividing the job-specific earnings reported by respondents for a given time interval (for example, one week,

FRBNY Economic Policy Review / August 2005 25
one month, one year) by the number of hours worked during this time interval. The question asked to obtain information about respondents’ earnings refers to the “usual wage or salary before taxes and other deductions.” However, as Appendix A shows, some surveys use different earnings concepts or different hours concepts. For instance, the Labour Force Survey explicitly includes tips and commissions in the calculation of earnings and explicitly excludes overtime in the calculation of work-hours. In contrast, all surveys prior to 1987 make no explicit reference to tips and commissions when calculating earnings and make no explicit reference to overtime in the calculation of work-hours.
Combined with the fact that these surveys differ in terms of the length of their questionnaires, their structures (LFS is a cross-sectional survey, LMAS is a longitudinal survey that yields, among other things, cross-sectional data), and the procedures used to impute wages and detect outliers, these differences probably explain why Canadian labour economists have refrained so far from combining them to produce a time series of hourly wages in Canada.3 While a few studies have combined SWH and LMAS to analyze trends in wage inequality (Doiron and Barrett 1996, Dinardo and Lemieux 1997, and Morissette, Myles, and Picot 1994), none has combined them to assess trends in wage levels.4
Since it is unclear whether trends in wage levels obtained from all of the aforementioned surveys are unbiased, we refrain from making definitive statements regarding the evolution of low-paid, middle-paid, and well-paid jobs over the 1981-2004 period. When assessing whether well-paid jobs are disappearing in Canada, we focus our attention on recent trends, that is, on changes in the fraction of jobs falling in certain (real) wage categories during the 1997-2004 period. We do so using the Labour Force Survey, which provides consistent hourly wage data at the job level since 1997.
We select two samples. The first consists of all individuals ages seventeen to sixty-four who are employed as paid workers in the main job they hold in May.5 In order to be as inclusive as possible and provide measures of job quality for all Canadians involved in the labour market, this sample includes full-time students as well as other individuals. The second sample consists of individuals ages twenty-five to sixty-four and is aimed at measuring the evolution of wages for individuals who have completed their school-to-work transition. Since the Survey of Work History of 1981 contains no indicator for student status, this sample excludes individuals under age twenty-five in order to omit (most) full-time students. Depending on the year considered, the first sample includes between 34,000 and 52,000 observations while the second sample consists of 26,000 to 43,000 observations.
To examine the evolution of the relative importance of low-paid jobs and well-paid jobs, we classify jobs into eight categories: those paying less than $8.00 per hour (2001 dollars), $8.00 to $9.99, $10.00 to $14.99, $15.00 to $19.99, $20.00 to $24.99, $25.00 to $29.99, $30.00 to $34.99, and those paying $35.00 or more. If we assume 2,000 hours of work per year, the lower bound is associated with a job paying annual wages of (almost) $16,000, which is close to the low-income cutoff (before tax) for a single person living in an urban area consisting of either 30,000 to 99,999 residents ($16,048) or 100,000 to 499,999 residents ($16,160).6 The upper bound implies a job paying at least $70,000 per year.
To assess the extent to which temporary jobs have become more frequent among newly hired employees, we combine the General Social Surveys of 1989 and 1994 with the redesigned Labour Force Survey. The target population for the 1989 GSS and the 1994 GSS consists of all persons ages fifteen and over living in the ten provinces, except persons residing full time in institutions. When combined with the LFS from 1997 to 2004, these two surveys allow us to study the evolution of the incidence of temporary jobs during the 1989-2004 period.
3. Hourly Wages, 1981-2004
We assemble all aforementioned surveys and show the evolution of median wages over the 1981-2004 period (Table 1). Even though they display some year-to-year variation, median wages have, in the aggregate, trended neither upward nor downward over the past two decades or in recent years. They have been stagnating for both samples. This constancy in overall median wages masks a small decline in men’s wages and a sizable increase in women’s wages, a pattern that is consistent with the narrowing of the male-female earnings gap documented by Baker et al. (1995).
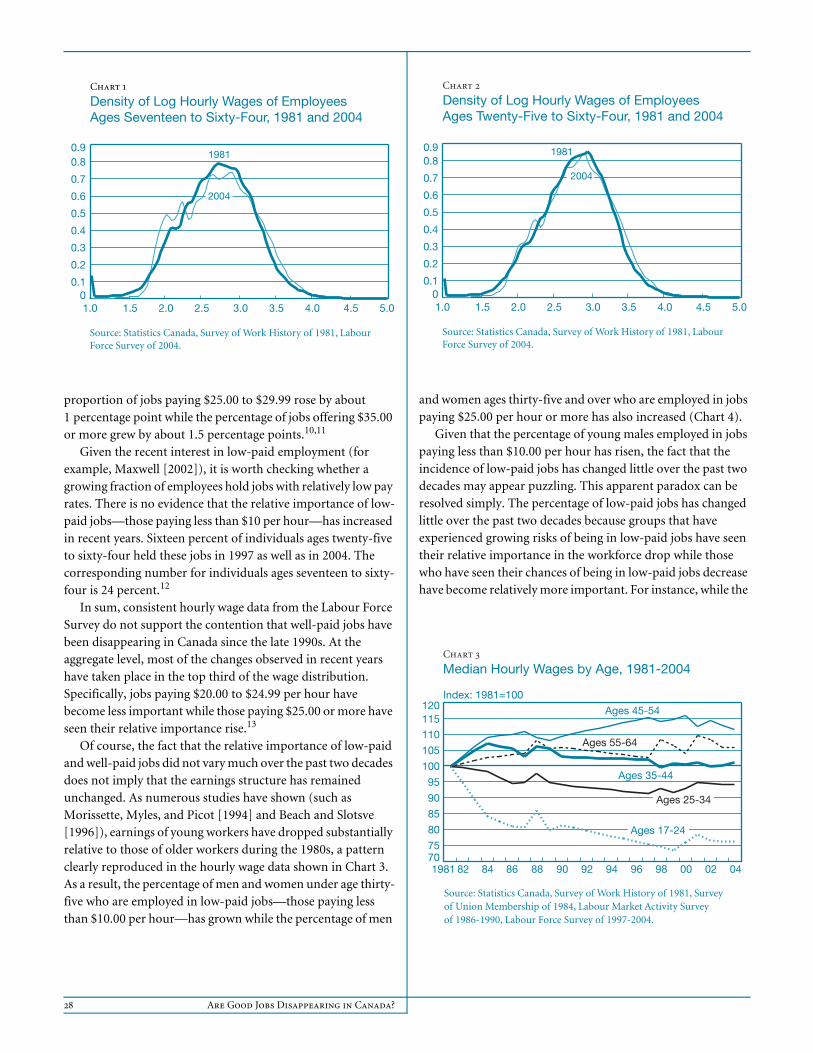
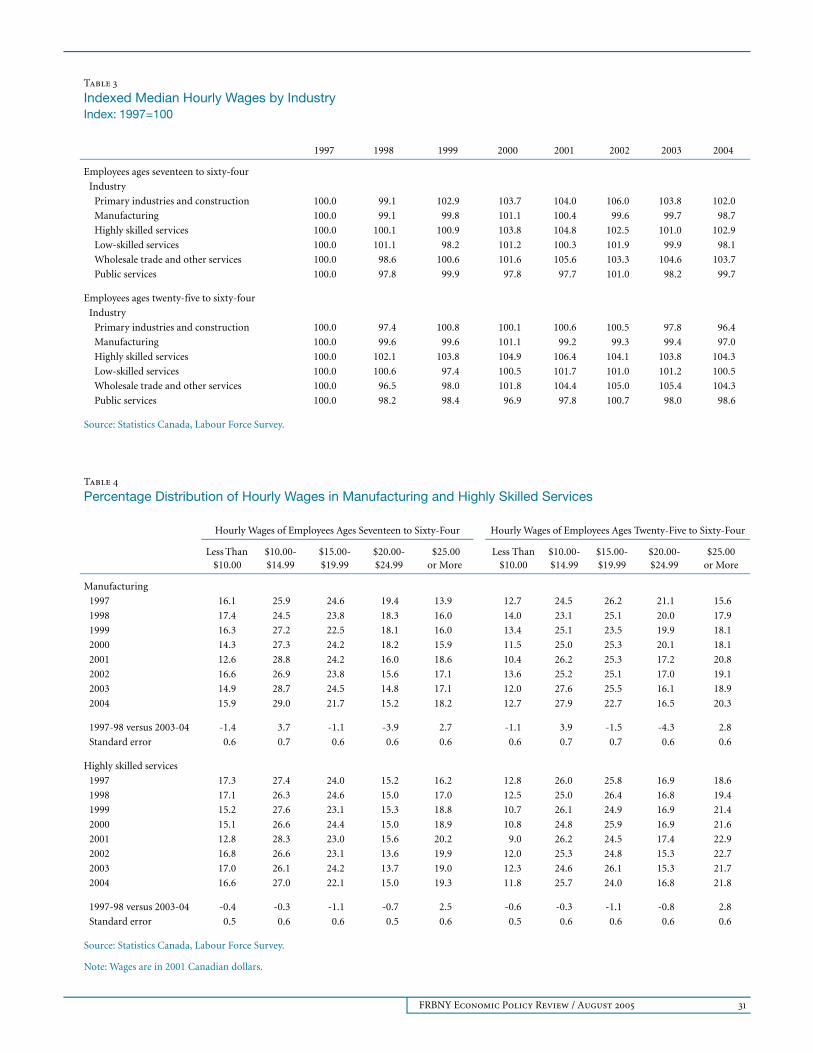
How has the relative importance of low-paid and high-paid jobs evolved over the past two decades? For both samples, the various surveys suggest that very moderate changes took place between 1981 and 2004. In fact, a visual inspection of each of the wage categories allows us to detect only two trends over the past two decades. First, for both samples, the fraction of jobs paying $30.00 or more appears to have risen by 2 to 3 percentage points since the early or mid-1980s (Table 2). Second, during this period, the proportion of jobs paying less than $8.00 per hour seems to have dropped by 2 percentage points among individuals ages twenty-five to sixty-four.7 These two patterns are confirmed by the kernel density estimates of (log) hourly wages for 1981 and 2004 (Charts 1 and 2).8,9

26 Are Good Jobs Disappearing in Canada?
However, the kernel density functions for employees ages seventeen to sixty-four add some nuance to the numbers in Table 2: they suggest that the fraction of jobs paying between $6.00 (log wages = 1.79) and $10.00 (log wages = 2.30) per hour rose between 1981 and 2004 while the fraction of jobs paying less than $6.00 per hour fell. As a result, the fraction of jobs
paying less than $10.00 per hour rose slightly during this period: it increased by about 1 percentage point.
When we restrict our attention to data from the Labour Force Survey, three trends emerge. For both samples, the fraction of jobs paying $20.00 to $24.99 fell by about 2 percentage points between 1997 and 2004. Meanwhile, the
Table 1
Median Hourly Wages
Men and Women Men Women
Sample Size Median Wage Sample Size Median Wage Sample Size Median Wage
Employees ages seventeen to sixty-four
1981 34,392 15.16 19,881 17.29 14,511 12.85
1984 32,952 15.61 17,713 18.24 15,239 12.92
1986 36,237 14.90 19,840 17.85 16,397 12.77
1987 42,944 15.14 23,284 17.85 19,660 12.85
1988 35,796 15.44 19,426 17.98 16,370 13.25
1989 35,763 15.33 19,105 17.75 16,658 13.08
1990 35,300 15.25 18,770 17.77 16,530 13.10
1997 46,891 15.26 24,108 17.17 22,783 13.52
1998 47,592 15.39 24,499 17.15 23,093 13.55
1999 47,952 15.27 24,604 17.22 23,348 13.55
2000 48,318 15.38 24,887 17.43 23,431 13.67
2001 50,263 15.38 25,488 17.43 24,775 13.91
2002 51,045 15.52 25,764 17.39 25,281 13.69
2003 51,827 15.23 25,980 17.13 25,847 13.90
2004 51,162 15.33 25,448 16.92 25,714 13.93
1981 versus 2004 — 1.1% — -2.2% — 8.5%
1997 versus 2004 — 0.4% — -1.5% — 3.0%
Employees ages twenty-five to sixty-four
1981 26,437 16.60 15,649 18.95 10,788 13.83
1984 25,597 17.06 14,065 20.05 11,532 14.13
1986 29,269 16.77 16,358 19.38 12,911 14.10
1987 34,811 17.04 19,135 19.64 15,676 14.28
1988 29,019 17.16 15,878 19.74 13,141 14.22
1989 29,300 16.79 15,752 19.51 13,548 14.18
1990 29,215 16.71 15,526 19.23 13,689 14.07
1997 39,705 16.71 20,430 18.83 19,275 14.87
1998 40,247 16.77 20,687 18.84 19,560 14.94
1999 40,519 16.85 20,761 18.96 19,758 14.79
2000 40,616 17.10 20,920 19.20 19,696 14.93
2001 41,950 17.00 21,279 19.23 20,671 15.00
2002 42,808 17.06 21,516 19.03 21,292 15.04
2003 43,297 17.08 21,656 18.94 21,641 15.18
2004 42,754 16.92 21,216 18.58 21,538 15.31
1981 versus 2004 — 1.9% — -2.0% — 10.7%
1997 versus 2004 — 1.2% — -1.4% — 2.9%
Source: Statistics Canada, Survey of Work History of 1981, Survey of Union Membership of 1984, Labour Market Activity Survey of 1986-1990,Labour Force Survey of 1997-2004.
Note: Wages are in 2001 Canadian dollars.

FRBNY Economic Policy Review / August 2005 27
Table 2
Percentage Distribution of Hourly Wages
Less Than $8.00
$8.00-$9.99
$10.00-$14.99
$15.00-$19.99
$20.00-$24.99
$25.00-$29.99
$30.00-$34.99
$35.00 or More
Employees ages seventeen to sixty-four
1981 12.1 10.3 26.7 22.9 13.6 7.5 3.2 3.8
1984 12.0 11.0 24.2 21.8 15.9 8.1 3.9 3.2
1986 15.0 8.7 26.9 19.4 14.5 8.3 3.3 4.0
1987 14.0 10.4 25.0 21.1 14.6 7.9 3.3 3.7
1988 12.2 9.5 25.3 21.8 14.9 8.1 3.8 4.4
1989 13.7 9.4 25.4 21.8 14.0 7.9 3.7 4.1
1990 13.2 10.6 25.5 21.1 14.4 7.7 3.8 3.9
1997 12.4 11.2 24.3 21.7 15.1 7.5 4.2 3.7
1998 12.0 11.5 24.1 22.1 14.4 7.9 4.2 3.9
1999 12.7 10.0 25.7 20.3 14.7 8.6 4.0 4.1
2000 11.7 10.5 25.4 21.6 14.4 8.6 3.8 4.0
2001 10.6 9.6 26.1 21.4 14.1 9.0 4.5 4.7
2002 12.3 11.5 24.3 20.7 13.3 8.3 4.6 4.9
2003 11.9 11.9 24.5 21.3 12.9 8.6 4.5 4.5
2004 12.6 11.0 25.2 19.7 13.4 8.6 4.6 5.0
Change
1986-2004 -2.4 2.3 -1.7 0.3 -1.2 0.3 1.3 1.0
1981-2004 0.5 0.7 -1.6 -3.1 -0.2 1.1 1.4 1.2
1997-98 versus 2003-04 0.0 0.1 0.6 -1.3 -1.6 0.9 0.4 0.9
Standard error 0.2 0.2 0.3 0.3 0.3 0.3 0.3 0.2
Employees ages twenty-five to sixty-four
1981 8.8 8.4 24.8 24.7 15.6 9.1 3.9 4.6
1984 6.9 8.0 23.4 24.0 18.9 10.0 4.9 4.0
1986 9.0 6.9 26.0 21.8 17.3 10.1 4.0 4.8
1987 8.4 8.2 24.2 23.8 17.3 9.6 4.1 4.5
1988 7.5 7.2 23.8 24.1 17.4 9.8 4.7 5.5
1989 8.2 7.3 24.9 24.1 16.4 9.6 4.6 5.0
1990 8.4 8.3 24.8 23.4 16.6 9.2 4.5 4.7
1997 7.0 8.7 24.3 24.3 17.5 8.9 5.0 4.4
1998 6.6 9.2 23.9 24.7 16.7 9.3 5.0 4.6
1999 7.0 8.0 25.3 22.6 17.1 10.2 4.8 4.8
2000 6.4 8.3 25.0 24.1 16.8 10.2 4.5 4.8
2001 5.7 7.3 25.2 23.7 16.4 10.7 5.4 5.6
2002 6.8 9.4 24.1 23.1 15.5 9.8 5.5 5.8
2003 6.5 9.4 24.4 23.9 15.1 10.1 5.4 5.3
2004 6.9 8.8 25.1 22.2 15.6 10.2 5.5 5.9
Change
1986-2004 -2.2 1.9 -1.0 0.4 -1.7 0.1 1.5 1.1
1981-2004 -2.0 0.4 0.2 -2.6 0.0 1.0 1.6 1.3
1997-98 versus 2003-04 -0.1 0.1 0.6 -1.5 -1.8 1.0 0.5 1.1
Standard error 0.2 0.2 0.3 0.3 0.3 0.3 0.3 0.2
Source: Statistics Canada, Survey of Work History of 1981, Survey of Union Membership of 1984, Labour Market Activity Survey of 1986-1990,Labour Force Survey of 1997-2004.
Note: Wages are in 2001 Canadian dollars.
28 Are Good Jobs Disappearing in Canada?
Chart 1
Density of Log Hourly Wages of Employees Ages Seventeen to Sixty-Four, 1981 and 2004
Source: Statistics Canada, Survey of Work History of 1981, Labour Force Survey of 2004.
00.1
0.2
0.3
0.4
0.5
0.6
0.7
0.80.9
5.04.54.03.53.02.52.01.51.0
1981
2004
Chart 2
Density of Log Hourly Wages of Employees Ages Twenty-Five to Sixty-Four, 1981 and 2004
Source: Statistics Canada, Survey of Work History of 1981, Labour Force Survey of 2004.
00.1
0.2
0.3
0.4
0.5
0.6
0.7
0.80.9
5.04.54.03.53.02.52.01.51.0
1981
2004
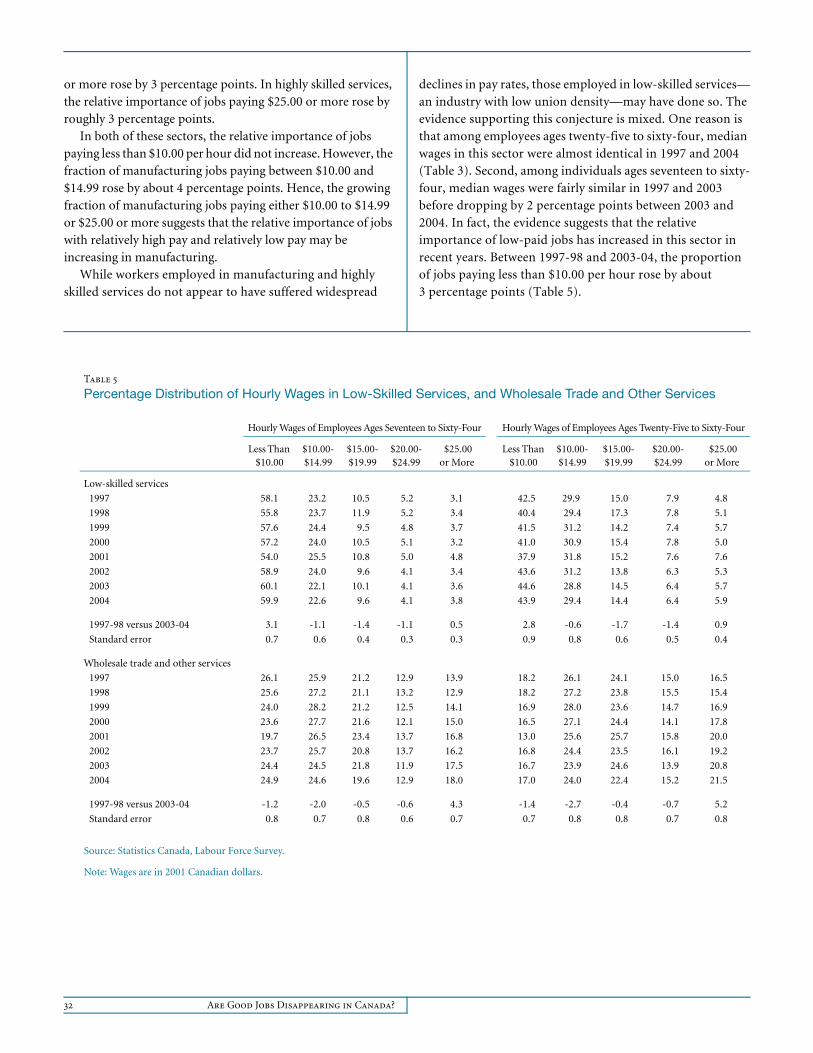
Chart 3
Median Hourly Wages by Age, 1981-2004
Source: Statistics Canada, Survey of Work History of 1981, Survey of Union Membership of 1984, Labour Market Activity Survey of 1986-1990, Labour Force Survey of 1997-2004.
Index: 1981=100
7075
80
85
90
95
100
105
110
115120
0402009896949290888684821981
Ages 45-54
Ages 25-34
Ages 55-64
Ages 35-44
Ages 17-24
proportion of jobs paying $25.00 to $29.99 rose by about 1 percentage point while the percentage of jobs offering $35.00 or more grew by about 1.5 percentage points.10,11
Given the recent interest in low-paid employment (for example, Maxwell [2002]), it is worth checking whether a growing fraction of employees hold jobs with relatively low pay rates. There is no evidence that the relative importance of low-paid jobs—those paying less than $10 per hour—has increased in recent years. Sixteen percent of individuals ages twenty-five to sixty-four held these jobs in 1997 as well as in 2004. The corresponding number for individuals ages seventeen to sixty-four is 24 percent.12
In sum, consistent hourly wage data from the Labour Force Survey do not support the contention that well-paid jobs have been disappearing in Canada since the late 1990s. At the aggregate level, most of the changes observed in recent years have taken place in the top third of the wage distribution. Specifically, jobs paying $20.00 to $24.99 per hour have become less important while those paying $25.00 or more have seen their relative importance rise.13
Of course, the fact that the relative importance of low-paid and well-paid jobs did not vary much over the past two decades does not imply that the earnings structure has remained unchanged. As numerous studies have shown (such as Morissette, Myles, and Picot [1994] and Beach and Slotsve [1996]), earnings of young workers have dropped substantially relative to those of older workers during the 1980s, a pattern clearly reproduced in the hourly wage data shown in Chart 3. As a result, the percentage of men and women under age thirty-five who are employed in low-paid jobs—those paying less than $10.00 per hour—has grown while the percentage of men
and women ages thirty-five and over who are employed in jobs paying $25.00 per hour or more has also increased (Chart 4).
Given that the percentage of young males employed in jobs paying less than $10.00 per hour has risen, the fact that the incidence of low-paid jobs has changed little over the past two decades may appear puzzling. This apparent paradox can be resolved simply. The percentage of low-paid jobs has changed little over the past two decades because groups that have experienced growing risks of being in low-paid jobs have seen their relative importance in the workforce drop while those who have seen their chances of being in low-paid jobs decrease have become relatively more important. For instance, while the

FRBNY Economic Policy Review / August 2005 29
Men and Women Ages Seventeen to Sixty-Four
Chart 5
Median Hourly Wages of University Graduates and Other Employees, 1981-2004Index: 1981=100
7075
80
85
90
95
100
105
110
115120
Men and Women Ages Twenty-Five to Sixty-Four
7075
80
85
90
95
100
105
110
115120
University graduates
Others
University graduates
Others
Men Ages Twenty-Five to Thirty-Four
7075
80
85
90
95
100
105
110
115120
04 02 00989694929088 8684821981
Women Ages Twenty-Five to Thirty-Four
7075
80
85
90
95
100
105
110
115120
04 02 00989694929088 8684821981
University graduates
Others
Others
Source: Statistics Canada, Survey of Work History of 1981, Survey of Union Membership of 1984, Labour Market Activity Survey of 1986-1990,Labour Force Survey of 1997-2004.
University graduates
Chart 4
Employees in Low-Paying and High-Paying Jobs,1981-2004
Source: Statistics Canada, Survey of Work History of 1981, Surveyof Union Membership of 1984, Labour Market Activity Survey of 1986-1990, Labour Force Survey of 1997-2004.
05
101520253035404550
0402009896949290888684821981
Women under 35,low pay
Men 35 or older,high pay
Men under 35,low pay
Women 35 or older,high pay
Percent
incidence of low pay among males ages seventeen to twenty-four has increased from 48 percent in 1986 to 60 percent in 2004, this group accounted for only 8 percent of all employees in 2004, down from 10 percent in 1986 (Appendix C). Con-versely, while the incidence of low pay among women ages thirty-five and over has decreased between 1986 and 2004, this group accounted for a larger share of the employed population in 2004 than it did in 1986. As a result, the percentage of jobs paying less than $10.00 per hour has remained virtually constant at 24 percent between 1986 and 2004.
While median hourly wages of various age groups have changed substantially over the past two decades, median hourly wages of university graduates and of nonuniversity graduates have evolved in a similar fashion between 1981 and 1997.14 This pattern is observed both in the aggregate (Chart 5, top panels) and for men and women of various ages (Chart 5, bottom panels; Chart 6).15 During the 1981-2004 period, the

30 Are Good Jobs Disappearing in Canada?
Men Ages Thirty-Five to Forty-Four
Chart 6
Median Hourly Wages of University Graduates and Other Employees, 1981-2004Index: 1981=100
7075
80
85
90
95
100
105
110
115120
Women Ages Thirty-Five to Forty-Four
7075
80
85
90
95
100
105
110
115120
University graduates
Others
Men Ages Forty-Five to Sixty-Four
7075
80
85
90
95
100
105
110
115120
04 02 00989694929088 8684821981
Women Ages Forty-Five to Sixty-Four
7075
80
85
90
95
100
105
110
115120
04 02 00989694929088 8684821981
University graduates University graduates
Others
Source: Statistics Canada, Survey of Work History of 1981, Survey of Union Membership of 1984, Labour Market Activity Survey of 1986-1990,Labour Force Survey of 1997-2004.
Others
University graduates
Others
wage gap between university graduates and nonuniversity graduates appears to have widened only for males ages twenty-five to thirty-four and for males ages forty-five to sixty-four (lower left panels of Charts 5 and 6). Furthermore, it did so only after 1997.16
4. Trends by Industry, 1997-2004
While there is no evidence that well-paid jobs have, in the aggregate, disappeared since 1997, they may well have been disappearing in some industries. For instance, growing competition within industries and from abroad may have led some manufacturing firms to reduce wages. Other businesses operating in highly skilled services such as engineering and informatics may have done the same. We assess whether this is
the case in Tables 3-6. First, we show indexed median hourly wages—that is, median wages set to 100 in 1997—in six major industrial groups.17 We then examine potential changes in the wage distribution within these industries.
For both samples, median hourly wages remained virtually unchanged in manufacturing between 1997 and 2003. They varied by less than 1 percentage point on a year-to-year basis but displayed no specific trend during this period (Table 3). They dropped slightly between 2003 and 2004. In contrast, median hourly wages in highly skilled services rose by 3 to 4 percentage points between 1997 and 2004. Hence, trends in median wages provide little evidence that the relative importance of well-paid jobs has shrunk in these two sectors since the late 1990s.
Table 4 confirms this view. Between 1997-98 and 2003-04, the fraction of manufacturing jobs paying $20.00 to $24.99 per hour fell by 4 percentage points but the fraction paying $25.00
FRBNY Economic Policy Review / August 2005 31
Table 3
Indexed Median Hourly Wages by IndustryIndex: 1997=100
1997 1998 1999 2000 2001 2002 2003 2004
Employees ages seventeen to sixty-four
Industry
Primary industries and construction 100.0 99.1 102.9 103.7 104.0 106.0 103.8 102.0
Manufacturing 100.0 99.1 99.8 101.1 100.4 99.6 99.7 98.7
Highly skilled services 100.0 100.1 100.9 103.8 104.8 102.5 101.0 102.9
Low-skilled services 100.0 101.1 98.2 101.2 100.3 101.9 99.9 98.1
Wholesale trade and other services 100.0 98.6 100.6 101.6 105.6 103.3 104.6 103.7
Public services 100.0 97.8 99.9 97.8 97.7 101.0 98.2 99.7
Employees ages twenty-five to sixty-four
Industry
Primary industries and construction 100.0 97.4 100.8 100.1 100.6 100.5 97.8 96.4
Manufacturing 100.0 99.6 99.6 101.1 99.2 99.3 99.4 97.0
Highly skilled services 100.0 102.1 103.8 104.9 106.4 104.1 103.8 104.3
Low-skilled services 100.0 100.6 97.4 100.5 101.7 101.0 101.2 100.5
Wholesale trade and other services 100.0 96.5 98.0 101.8 104.4 105.0 105.4 104.3
Public services 100.0 98.2 98.4 96.9 97.8 100.7 98.0 98.6
Source: Statistics Canada, Labour Force Survey.
Table 4
Percentage Distribution of Hourly Wages in Manufacturing and Highly Skilled Services
Hourly Wages of Employees Ages Seventeen to Sixty-Four Hourly Wages of Employees Ages Twenty-Five to Sixty-Four
Less Than $10.00
$10.00-$14.99
$15.00-$19.99
$20.00-$24.99
$25.00or More
Less Than $10.00
$10.00-$14.99
$15.00-$19.99
$20.00-$24.99
$25.00or More
Manufacturing
1997 16.1 25.9 24.6 19.4 13.9 12.7 24.5 26.2 21.1 15.6
1998 17.4 24.5 23.8 18.3 16.0 14.0 23.1 25.1 20.0 17.9
1999 16.3 27.2 22.5 18.1 16.0 13.4 25.1 23.5 19.9 18.1
2000 14.3 27.3 24.2 18.2 15.9 11.5 25.0 25.3 20.1 18.1
2001 12.6 28.8 24.2 16.0 18.6 10.4 26.2 25.3 17.2 20.8
2002 16.6 26.9 23.8 15.6 17.1 13.6 25.2 25.1 17.0 19.1
2003 14.9 28.7 24.5 14.8 17.1 12.0 27.6 25.5 16.1 18.9
2004 15.9 29.0 21.7 15.2 18.2 12.7 27.9 22.7 16.5 20.3
1997-98 versus 2003-04 -1.4 3.7 -1.1 -3.9 2.7 -1.1 3.9 -1.5 -4.3 2.8
Standard error 0.6 0.7 0.6 0.6 0.6 0.6 0.7 0.7 0.6 0.6
Highly skilled services
1997 17.3 27.4 24.0 15.2 16.2 12.8 26.0 25.8 16.9 18.6
1998 17.1 26.3 24.6 15.0 17.0 12.5 25.0 26.4 16.8 19.4
1999 15.2 27.6 23.1 15.3 18.8 10.7 26.1 24.9 16.9 21.4
2000 15.1 26.6 24.4 15.0 18.9 10.8 24.8 25.9 16.9 21.6
2001 12.8 28.3 23.0 15.6 20.2 9.0 26.2 24.5 17.4 22.9
2002 16.8 26.6 23.1 13.6 19.9 12.0 25.3 24.8 15.3 22.7
2003 17.0 26.1 24.2 13.7 19.0 12.3 24.6 26.1 15.3 21.7
2004 16.6 27.0 22.1 15.0 19.3 11.8 25.7 24.0 16.8 21.8
1997-98 versus 2003-04 -0.4 -0.3 -1.1 -0.7 2.5 -0.6 -0.3 -1.1 -0.8 2.8
Standard error 0.5 0.6 0.6 0.5 0.6 0.5 0.6 0.6 0.6 0.6
Source: Statistics Canada, Labour Force Survey.
Note: Wages are in 2001 Canadian dollars.
32 Are Good Jobs Disappearing in Canada?
or more rose by 3 percentage points. In highly skilled services, the relative importance of jobs paying $25.00 or more rose by roughly 3 percentage points.
In both of these sectors, the relative importance of jobs paying less than $10.00 per hour did not increase. However, the fraction of manufacturing jobs paying between $10.00 and $14.99 rose by about 4 percentage points. Hence, the growing fraction of manufacturing jobs paying either $10.00 to $14.99 or $25.00 or more suggests that the relative importance of jobs with relatively high pay and relatively low pay may be increasing in manufacturing.
While workers employed in manufacturing and highly skilled services do not appear to have suffered widespread
declines in pay rates, those employed in low-skilled services—an industry with low union density—may have done so. The evidence supporting this conjecture is mixed. One reason is that among employees ages twenty-five to sixty-four, median wages in this sector were almost identical in 1997 and 2004 (Table 3). Second, among individuals ages seventeen to sixty-four, median wages were fairly similar in 1997 and 2003 before dropping by 2 percentage points between 2003 and 2004. In fact, the evidence suggests that the relative importance of low-paid jobs has increased in this sector in recent years. Between 1997-98 and 2003-04, the proportion of jobs paying less than $10.00 per hour rose by about 3 percentage points (Table 5).
Table 5
Percentage Distribution of Hourly Wages in Low-Skilled Services, and Wholesale Trade and Other Services
Hourly Wages of Employees Ages Seventeen to Sixty-Four Hourly Wages of Employees Ages Twenty-Five to Sixty-Four
Less Than $10.00
$10.00-$14.99
$15.00-$19.99
$20.00-$24.99
$25.00or More
Less Than $10.00
$10.00-$14.99
$15.00-$19.99
$20.00-$24.99
$25.00or More
Low-skilled services
1997 58.1 23.2 10.5 5.2 3.1 42.5 29.9 15.0 7.9 4.8
1998 55.8 23.7 11.9 5.2 3.4 40.4 29.4 17.3 7.8 5.1
1999 57.6 24.4 9.5 4.8 3.7 41.5 31.2 14.2 7.4 5.7
2000 57.2 24.0 10.5 5.1 3.2 41.0 30.9 15.4 7.8 5.0
2001 54.0 25.5 10.8 5.0 4.8 37.9 31.8 15.2 7.6 7.6
2002 58.9 24.0 9.6 4.1 3.4 43.6 31.2 13.8 6.3 5.3
2003 60.1 22.1 10.1 4.1 3.6 44.6 28.8 14.5 6.4 5.7
2004 59.9 22.6 9.6 4.1 3.8 43.9 29.4 14.4 6.4 5.9
1997-98 versus 2003-04 3.1 -1.1 -1.4 -1.1 0.5 2.8 -0.6 -1.7 -1.4 0.9
Standard error 0.7 0.6 0.4 0.3 0.3 0.9 0.8 0.6 0.5 0.4
Wholesale trade and other services
1997 26.1 25.9 21.2 12.9 13.9 18.2 26.1 24.1 15.0 16.5
1998 25.6 27.2 21.1 13.2 12.9 18.2 27.2 23.8 15.5 15.4
1999 24.0 28.2 21.2 12.5 14.1 16.9 28.0 23.6 14.7 16.9
2000 23.6 27.7 21.6 12.1 15.0 16.5 27.1 24.4 14.1 17.8
2001 19.7 26.5 23.4 13.7 16.8 13.0 25.6 25.7 15.8 20.0
2002 23.7 25.7 20.8 13.7 16.2 16.8 24.4 23.5 16.1 19.2
2003 24.4 24.5 21.8 11.9 17.5 16.7 23.9 24.6 13.9 20.8
2004 24.9 24.6 19.6 12.9 18.0 17.0 24.0 22.4 15.2 21.5
1997-98 versus 2003-04 -1.2 -2.0 -0.5 -0.6 4.3 -1.4 -2.7 -0.4 -0.7 5.2
Standard error 0.8 0.7 0.8 0.6 0.7 0.7 0.8 0.8 0.7 0.8
Source: Statistics Canada, Labour Force Survey.
Note: Wages are in 2001 Canadian dollars.

FRBNY Economic Policy Review / August 2005 33
Pay rates did not deteriorate in wholesale trade and other services either. In this sector, the fraction of jobs paying less than $20.00 fell by about 4 percentage points. In contrast, the fraction of jobs paying $25.00 or more rose by at least 4 percentage points.
In primary industries and construction, the relative importance of jobs paying less than $10.00 per hour did not increase (Table 6). For both samples, the fraction of jobs paying $20.00 to $24.99 appears to have fallen slightly, but the fraction of jobs paying $25.00 or more appears to have increased by 2 or 3 percentage points.
Taken together, these findings confirm that the Canadian economy has not witnessed a deterioration in the relative
importance of well-paid jobs since 1997. Likewise, there has not been a widespread increase in the relative importance of low-paid jobs since then. Jobs paying less than $10.00 per hour have become more important only in low-skilled services.
5. Wages of Newly Hired Employees
While the analysis of the overall distribution of real wages provides useful information about the quality of the stock of jobs held by Canadian employees at a given point in time, it is not best suited for detecting changes in the wages firms offer
Table 6
Percentage Distribution of Hourly Wages in Primary Industries and Construction, and Public Services
Hourly Wages of Employees Ages Seventeen to Sixty-Four Hourly Wages of Employees Ages Twenty-Five to Sixty-Four
Less Than $10.00
$10.00-$14.99
$15.00-$19.99
$20.00-$24.99
$25.00 or More
Less Than $10.00
$10.00-$14.99
$15.00-$19.99
$20.00-$24.99
$25.00 or More
Primary industries and construction
1997 15.2 22.5 23.0 20.1 19.2 9.3 20.4 24.5 23.3 22.6
1998 16.4 21.9 22.0 18.1 21.6 11.2 19.7 23.3 20.4 25.4
1999 15.1 24.4 18.8 19.1 22.8 10.3 20.7 19.9 22.2 26.9
2000 12.9 23.8 22.0 19.8 21.6 8.5 20.7 23.4 22.4 25.1
2001 11.4 24.4 21.4 18.8 24.1 7.6 20.3 22.5 21.4 28.2
2002 14.3 22.3 21.5 17.2 24.8 9.9 19.3 22.4 19.4 29.1
2003 15.0 22.4 22.7 17.7 22.2 10.1 19.8 24.3 19.7 26.0
2004 13.6 25.2 21.3 17.0 23.1 9.0 21.5 22.8 19.2 27.5
1997-98 versus 2003-04 -1.5 1.6 -0.5 -1.8 2.2 -0.7 0.6 -0.4 -2.4 2.8
Standard error 0.7 0.8 0.8 0.7 0.8 0.6 0.8 0.9 0.8 0.9
Public services
1997 9.2 21.1 26.2 19.0 24.7 6.6 20.0 26.8 20.1 26.4
1998 9.2 21.4 27.1 17.7 24.7 6.2 20.5 27.9 18.8 26.6
1999 8.8 22.9 24.5 18.9 24.9 6.2 21.7 25.0 20.1 26.9
2000 9.4 23.5 25.9 17.5 23.7 6.8 22.3 26.6 18.6 25.6
2001 8.7 22.7 25.6 17.4 25.6 6.3 21.2 26.3 18.5 27.7
2002 9.9 20.6 25.0 17.5 26.9 7.4 19.6 25.7 18.5 28.8
2003 9.8 22.5 24.7 16.9 26.1 7.3 21.3 25.4 17.9 28.1
2004 9.3 23.0 23.8 16.9 26.9 7.1 21.8 24.2 17.9 28.9
1997-98 versus 2003-04 0.4 1.6 -2.3 -1.5 1.9 0.8 1.3 -2.6 -1.5 2.0
Standard error 0.3 0.5 0.5 0.5 0.5 0.3 0.5 0.6 0.5 0.6
Source: Statistics Canada, Labour Force Survey.
Note: Wages are in 2001 Canadian dollars.

34 Are Good Jobs Disappearing in Canada?
Men Ages Twenty-Five to Sixty-Four
Chart 7
Median Hourly Wages by Seniority, 1981-2004Index: 1981=100
80
85
90
95
100
105
110
115
120
125Men Ages Twenty-Five to Thirty-Four
80
85
90
95
100
105
110
115
120
125
Men Ages Thirty-Five to Forty-Four
80
85
90
95
100
105
110
115
120
125
04 02 00989694929088 8684821981
Men Ages Forty-Five to Sixty-Four
80
85
90
95
100
105
110
115
120
125
04 02 00989694929088 8684821981
Source: Statistics Canada, Survey of Work History of 1981, Labour Market Activity Survey of 1986-1990, Labour Force Survey of 1997-2004.
Two years of seniority or less
More than two years of seniority
Two years of seniority or less
More than two years of seniority
More than two years of seniority
Two years of seniority or less
More than two years of seniority
Two years of seniority or less
workers when new positions become available (as a result of quits and/or firm expansion). Apart from the well-known changes in the age-wage structure shown above, the fact that the relative importance of low-paid jobs and well-paid jobs has changed little since the early 1980s or late 1990s could mask two offsetting trends: falling wages among newly hired employees and increasing wages among those with greater seniority.
Analyzing the evolution of wages of newly hired employees is important because changes in wage offers for new hires are an important channel through which Canadian firms may respond to growing competition within industries and from abroad. More intense competition on the product market could induce some companies to reduce their labour costs by cutting the wages offered to newly hired employees while maintaining or increasing the wages of workers with greater seniority. Such shifts may indicate fundamental changes in the employer-employee relationship that could affect the quality of Canadian jobs in the years ahead.
To assess whether wages of newly hired employees have evolved differently compared with those of their counterparts with greater seniority, we restrict our attention to employees ages twenty-five to sixty-four. We do so in order to exclude (most) individuals who are attending school full-time and thus have not completed their school-to-work transition.
Have wages of newly hired employees evolved differently compared with those of other workers during the 1981-2004 period? The answer is yes. When combined, all aforementioned surveys suggest that median hourly wages of male and female employees with two years of seniority or less fell substantially relative to those of other employees. Among men ages twenty-five to sixty-four, median wages of newly hired workers appear to have dropped 13 percent between 1981 and 2004. In contrast, median wages of their counterparts with more than two years of seniority were 4 percentage points higher in 2004 than their 1981 value (Chart 7, upper left panel). As a result, the wage gap between newly hired males and other males has risen substantially over the past two decades. The gap also widened
FRBNY Economic Policy Review / August 2005 35
Women Ages Twenty-Five to Sixty-Four
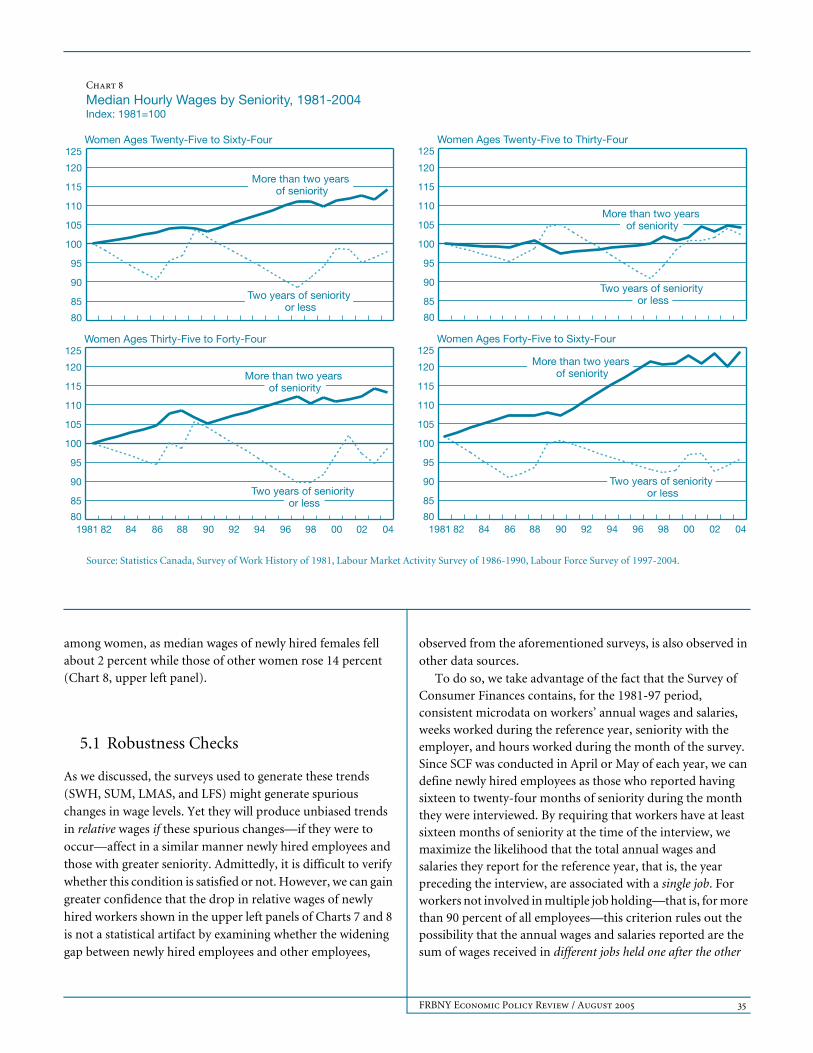
Chart 8
Median Hourly Wages by Seniority, 1981-2004Index: 1981=100
80
85
90
95
100
105
110
115
120
125Women Ages Twenty-Five to Thirty-Four
80
85
90
95
100
105
110
115
120
125
Women Ages Thirty-Five to Forty-Four
80
85
90
95
100
105
110
115
120
125
04 02 00989694929088 8684821981
Women Ages Forty-Five to Sixty-Four
80
85
90
95
100
105
110
115
120
125
04 02 00989694929088 8684821981
Source: Statistics Canada, Survey of Work History of 1981, Labour Market Activity Survey of 1986-1990, Labour Force Survey of 1997-2004.
Two years of seniority or less
More than two years of seniority
Two years of seniority or less
More than two years of seniority
More than two years of seniority
Two years of seniority or less
More than two years of seniority
Two years of seniority or less
among women, as median wages of newly hired females fell about 2 percent while those of other women rose 14 percent (Chart 8, upper left panel).
5.1 Robustness Checks
As we discussed, the surveys used to generate these trends (SWH, SUM, LMAS, and LFS) might generate spurious changes in wage levels. Yet they will produce unbiased trends in relative wages if these spurious changes—if they were to occur—affect in a similar manner newly hired employees and those with greater seniority. Admittedly, it is difficult to verify whether this condition is satisfied or not. However, we can gain greater confidence that the drop in relative wages of newly hired workers shown in the upper left panels of Charts 7 and 8 is not a statistical artifact by examining whether the widening gap between newly hired employees and other employees,
observed from the aforementioned surveys, is also observed in other data sources.
To do so, we take advantage of the fact that the Survey of Consumer Finances contains, for the 1981-97 period, consistent microdata on workers’ annual wages and salaries, weeks worked during the reference year, seniority with the employer, and hours worked during the month of the survey. Since SCF was conducted in April or May of each year, we can define newly hired employees as those who reported having sixteen to twenty-four months of seniority during the month they were interviewed. By requiring that workers have at least sixteen months of seniority at the time of the interview, we maximize the likelihood that the total annual wages and salaries they report for the reference year, that is, the year preceding the interview, are associated with a single job. For workers not involved in multiple job holding—that is, for more than 90 percent of all employees—this criterion rules out the possibility that the annual wages and salaries reported are the sum of wages received in different jobs held one after the other

36 Are Good Jobs Disappearing in Canada?
during the reference year.18 Requiring that these workers have at most twenty-four months of seniority allows us to measure earnings of individuals who have been hired fairly recently while ensuring a reasonable sample size. Following Johnson and Kuhn (2004), we construct hourly wages by dividing the annual wages and salaries received by workers in the previous year by the number of weeks they worked during the
previous year times the number of hours they worked during the month of the survey.19 We then compare trends in the resulting hourly wages with those derived from the special surveys used above.
Table 7 presents the results of this comparison. Both data sources indicate that median wages of newly hired men and women fell between 1981 and 1986.20 However, the drop
Table 7
Median Hourly Wages of Employees, by Seniority—Various Data SourcesIndex: 1981=100
Data Source
Special Surveys Survey of Consumer Finances
Sixteen to Twenty-Four Months of Seniority
Twenty-Five Months of Seniority or More
Sixteen to Twenty-FourMonths of Seniority
Twenty-Five Months of Seniority or More
Men
1981 100.0 100.0 100.0 100.0
1986 96.9 106.4 90.0 99.2
1987 97.7 106.6 89.8 100.2
1988 103.4 108.8 96.4 100.6
1989 98.0 107.9 95.6 98.8
1990 104.5 106.0 94.6 100.6
1997 88.2 105.3 86.0 96.5
1998 90.9 105.7 — —
1999 91.6 105.1 — —
2000 94.8 106.4 — —
2001 97.0 104.8 — —
2002 94.0 104.1 — —
2003 93.1 103.7 — —
2004 88.5 104.3 — —
Minimum sample size 1,002 10,436 667 8,361
Change, 1981-97 -11.8 5.3 -14.0 -3.5
Women
1981 100.0 100.0 100.0 100.0
1986 98.4 102.9 93.6 103.2
1987 100.1 104.0 98.7 105.4
1988 101.0 104.2 95.5 100.8
1989 103.1 103.9 104.1 103.7
1990 104.6 103.3 100.5 107.2
1997 96.8 111.0 103.0 109.2
1998 100.1 111.0 — —
1999 98.4 109.9 — —
2000 101.8 111.4 — —
2001 102.0 111.8 — —
2002 101.3 112.6 — —
2003 98.5 111.7 — —
2004 100.2 114.1 — —
Minimum sample size 934 7,106 757 6,317
Change, 1981-97 -3.2 11.0 3.0 9.2
Source: For columns 1 and 2: Statistics Canada, Survey of Work History of 1981, Labour Market Activity Survey of 1986-1990, Labour Force Survey of 1997-2004.

FRBNY Economic Policy Review / August 2005 37
observed is less pronounced using SWH-LMAS than using SCF. For instance, SWH-LMAS suggest that wages of newly hired men (women) fell by 3 (2) percentage points between these two years while SCF shows a drop of 10 (6) percentage points.
Trends for the second half of the 1980s are more similar, presumably because they involve only LMAS on the one hand and SCF on the other. Both LMAS and SCF suggest that median wages of newly hired men and women rose between 1986 and 1990. The increase amounts to 5 to 8 percentage points for men and 6 to 7 percentage points for women, and suggests that wages of new entrants are procyclical. Furthermore, both surveys show that median wages of other men stagnated during this period.
The possibility of spurious changes in wage levels is highlighted by comparing changes in median wages resulting from LMAS-LFS with those resulting from SCF. LMAS-LFS suggest that median wages of newly hired men fell by 16 percentage points between 1990 and 1997. In contrast, SCF suggests that the drop amounted to only 9 percentage points. Likewise, LMAS-LFS suggest that wages of newly hired women fell by 8 percentage points while SCF suggests that they rose slightly.
Clearly, the numbers above suggest that transitions from SWH to LMAS and those from LMAS to LFS might involve spurious changes in median wages. However, whether they are spurious or not, these changes often operate in opposite directions. When we use SCF as a benchmark, combining SWH and LMAS produces higher growth rates of wages for newly hired employees, but combining LMAS and LFS produces lower growth rates. For newly hired men, the two potential “biases” almost cancel out. As a result, whether we use SCF or combine SWH and LFS, we find that median wages of newly hired males fell between 12 and 14 percent between 1981 and 1997.
Most important, both SCF and the special surveys used in this study indicate that the earnings gap between newly hired employees and other employees widened between 1981 and 1997. The aforementioned special surveys suggest that median wages of newly hired males (females) grew 17 (14) percentage points less than those of other males (females) between these two years. The corresponding numbers from SCF are 11 and 6 percentage points for men and women, respectively. These similar qualitative patterns, observed in both data sources, provide strong evidence that the drop in relative wages of newly hired workers shown in the upper left panels of Charts 7 and 8 is not a statistical artifact.
5.2 Compositional Effects
As we discussed, earnings of young workers have dropped relative to those of their older counterparts during the 1980s. Since labour turnover is much higher among young workers than among older ones, the drop in relative wages of newly hired employees shown above could simply result from the widening of the age-earnings differential.
The data do not support this contention because relative wages of newly hired workers generally fell within age groups. For instance, whatever age group is considered, median wages of newly hired males grew at least 10 percentage points less than those of their counterparts with greater seniority during the 1981-2004 period (Chart 7, upper right panel and lower panels). Furthermore, median wages of newly hired women ages forty-five to sixty-four grew by at least 25 percentage points less than those of women with more than two years of seniority (Chart 8, lower right panel). The only exception is found among women ages twenty-five to thirty-four, where wages of new employees and those of other employees displayed very similar growth rates between 1981 and 2004 (Chart 8, upper right panel).
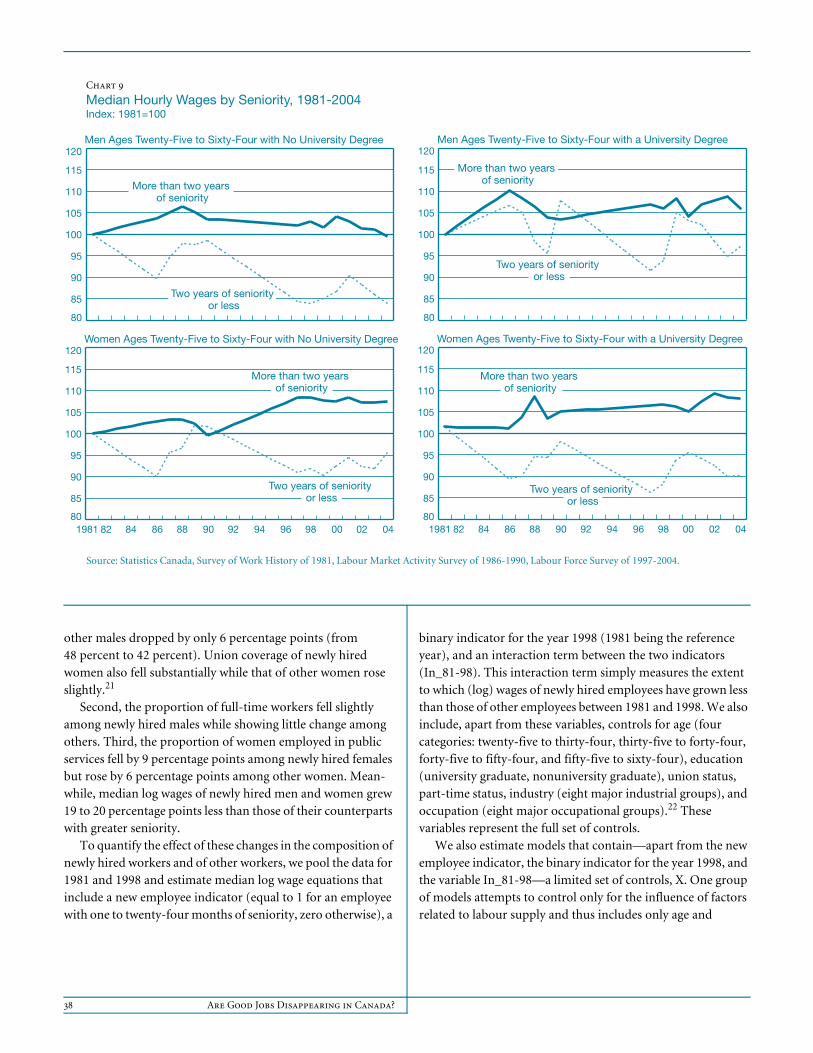
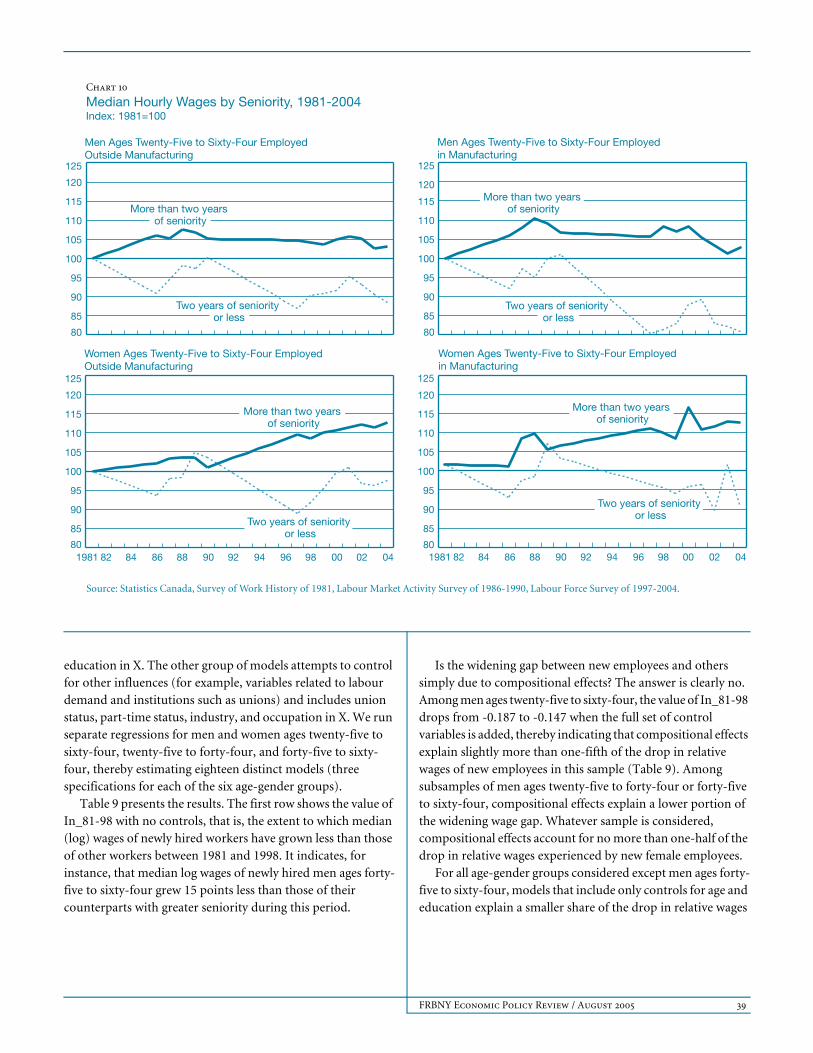
While newly hired workers, both young and older, generally suffered a decline in their wages relative to those of their counterparts with greater seniority, the same qualitative pattern was observed among university graduates and nonuniversity graduates (Chart 9). Furthermore, the drop in relative wages of new employees took place both in manufacturing and in other sectors (Chart 10). In fact, the data suggest that real wages of newly hired males employed in manufacturing fell 19 percent between 1981 and 2004.
What factors underlie the drop in relative wages of newly hired employees? To answer this question, a natural avenue is to assess whether the composition of newly hired workers has changed in ways that tend to depress their wages relative to those of other workers. To examine whether or not this is the case, we present selected characteristics of newly hired employees and other employees in 1981 and 1998, the last year for which the Labour Force Survey has occupation (SOC 1980) and industry (SIC 1980) codes that are comparable to those in the Survey of Work History of 1981.
Indeed, compositional effects appear to have played a role. First, relative union coverage of newly hired employees fell drastically between 1981 and 1998. For instance, union density among newly hired men fell from 38 percent in 1981 to 18 percent in 1998 (Table 8). In contrast, union density among
38 Are Good Jobs Disappearing in Canada?
Men Ages Twenty-Five to Sixty-Four with No University Degree
Chart 9
Median Hourly Wages by Seniority, 1981-2004Index: 1981=100
80
85
90
95
100
105
110
115
120Men Ages Twenty-Five to Sixty-Four with a University Degree
80
85
90
95
100
105
110
115
120
Women Ages Twenty-Five to Sixty-Four with No University Degree
80
85
90
95
100
105
110
115
120
04 02 00989694929088 8684821981
Women Ages Twenty-Five to Sixty-Four with a University Degree
80
85
90
95
100
105
110
115
120
04 02 00989694929088 8684821981
Source: Statistics Canada, Survey of Work History of 1981, Labour Market Activity Survey of 1986-1990, Labour Force Survey of 1997-2004.
Two years of seniority or less
More than two years of seniority
Two years of seniority or less
More than two years of seniority
More than two years of seniority
Two years of seniority or less
More than two years of seniority
Two years of seniority or less
other males dropped by only 6 percentage points (from 48 percent to 42 percent). Union coverage of newly hired women also fell substantially while that of other women rose slightly.21
Second, the proportion of full-time workers fell slightly among newly hired males while showing little change among others. Third, the proportion of women employed in public services fell by 9 percentage points among newly hired females but rose by 6 percentage points among other women. Mean-while, median log wages of newly hired men and women grew 19 to 20 percentage points less than those of their counterparts with greater seniority.
To quantify the effect of these changes in the composition of newly hired workers and of other workers, we pool the data for 1981 and 1998 and estimate median log wage equations that include a new employee indicator (equal to 1 for an employee with one to twenty-four months of seniority, zero otherwise), a
binary indicator for the year 1998 (1981 being the reference year), and an interaction term between the two indicators (In_81-98). This interaction term simply measures the extent to which (log) wages of newly hired employees have grown less than those of other employees between 1981 and 1998. We also include, apart from these variables, controls for age (four categories: twenty-five to thirty-four, thirty-five to forty-four, forty-five to fifty-four, and fifty-five to sixty-four), education (university graduate, nonuniversity graduate), union status, part-time status, industry (eight major industrial groups), and occupation (eight major occupational groups).22 These variables represent the full set of controls.
We also estimate models that contain—apart from the new employee indicator, the binary indicator for the year 1998, and the variable In_81-98—a limited set of controls, X. One group of models attempts to control only for the influence of factors related to labour supply and thus includes only age and
FRBNY Economic Policy Review / August 2005 39
Men Ages Twenty-Five to Sixty-Four Employed Outside Manufacturing
Chart 10
Median Hourly Wages by Seniority, 1981-2004Index: 1981=100
80
85
90
95
100
105
110
115
120
125
Men Ages Twenty-Five to Sixty-Four Employed in Manufacturing
80
85
90
95
100
105
110
115
120
125
Women Ages Twenty-Five to Sixty-Four Employed Outside Manufacturing
80
85
90
95
100
105
110
115
120
125
04 02 00989694929088 8684821981
Women Ages Twenty-Five to Sixty-Four Employed in Manufacturing
80
85
90
95
100
105
110
115
120
125
04 02 00989694929088 8684821981
Source: Statistics Canada, Survey of Work History of 1981, Labour Market Activity Survey of 1986-1990, Labour Force Survey of 1997-2004.
Two years of seniority or less
More than two years of seniority
Two years of seniority or less
More than two years of seniority
More than two years of seniority
Two years of seniority or less
More than two years of seniority
Two years of seniority or less
education in X. The other group of models attempts to control for other influences (for example, variables related to labour demand and institutions such as unions) and includes union status, part-time status, industry, and occupation in X. We run separate regressions for men and women ages twenty-five to sixty-four, twenty-five to forty-four, and forty-five to sixty-four, thereby estimating eighteen distinct models (three specifications for each of the six age-gender groups).
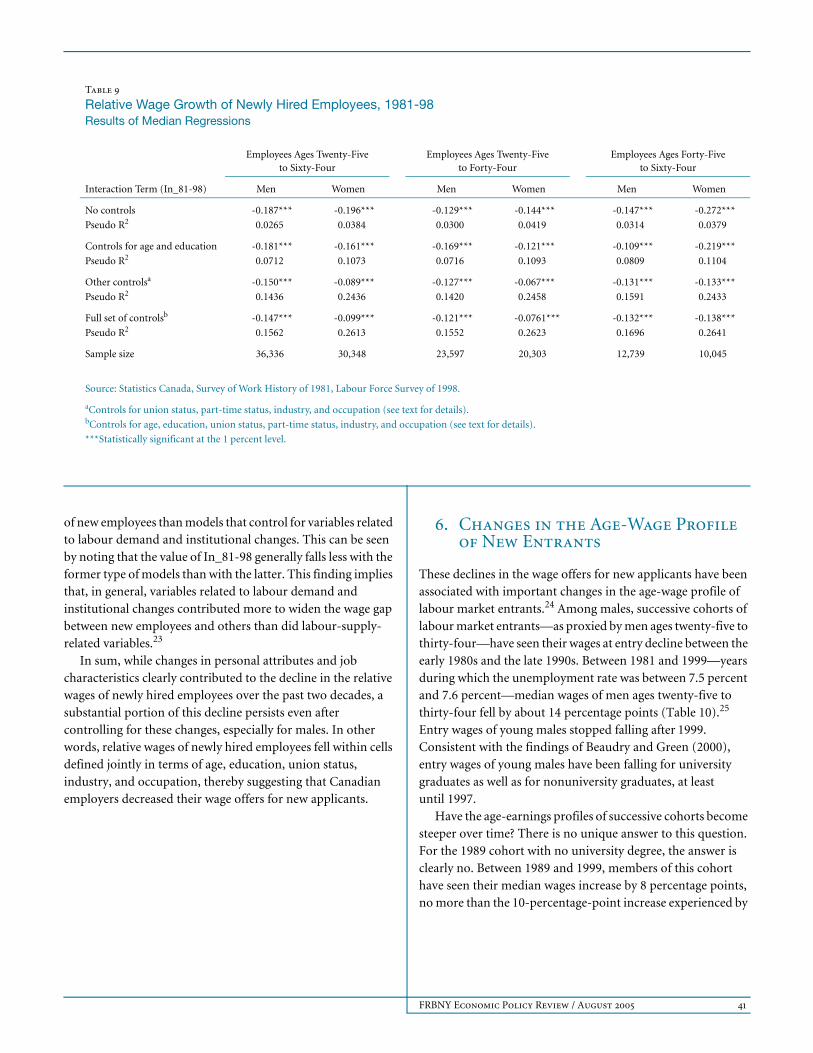
Table 9 presents the results. The first row shows the value of In_81-98 with no controls, that is, the extent to which median (log) wages of newly hired workers have grown less than those of other workers between 1981 and 1998. It indicates, for instance, that median log wages of newly hired men ages forty-five to sixty-four grew 15 points less than those of their counterparts with greater seniority during this period.
Is the widening gap between new employees and others simply due to compositional effects? The answer is clearly no. Among men ages twenty-five to sixty-four, the value of In_81-98 drops from -0.187 to -0.147 when the full set of control variables is added, thereby indicating that compositional effects explain slightly more than one-fifth of the drop in relative wages of new employees in this sample (Table 9). Among subsamples of men ages twenty-five to forty-four or forty-five to sixty-four, compositional effects explain a lower portion of the widening wage gap. Whatever sample is considered, compositional effects account for no more than one-half of the drop in relative wages experienced by new female employees.
For all age-gender groups considered except men ages forty-five to sixty-four, models that include only controls for age and education explain a smaller share of the drop in relative wages

40 Are Good Jobs Disappearing in Canada?
Table 8
Descriptive Statistics for Newly Hired Employees and Other Employees
Men Ages Twenty-Five to Sixty-Four Women Ages Twenty-Five to Sixty-Four
Newly Hired Employeesa Other Employees Newly Hired Employeesa Other Employees
1981 1998 1981 1998 1981 1998 1981 1998
Age
25-34 53.1 48.7 33.7 26.3 47.9 46.0 35.5 26.2
35-44 23.0 28.8 28.0 36.0 28.0 32.5 28.7 35.8
45-54 15.4 16.5 22.0 26.9 16.6 17.7 22.0 28.6
55-64 8.5 6.1 16.4 10.9 7.5 3.8 13.8 9.4
University degree
Yes 16.3 22.4 15.5 20.8 13.4 21.8 11.8 20.0
No 83.7 77.6 84.5 79.2 86.6 78.2 88.2 80.0
Unionized
Yes 38.3 18.1 48.0 41.8 26.9 16.2 37.6 40.0
No 61.7 81.9 52.0 58.2 73.1 83.8 62.4 60.0
Full-time worker
Yes 95.9 91.8 98.1 97.1 70.5 70.1 81.5 81.4
No 4.1 8.2 1.9 2.9 29.5 29.9 18.5 18.6
Industry
Agriculture and fishing 2.1 2.5 0.7 1.0 1.7 1.7 1.0 0.7
Forestry and mining 6.9 3.7 4.0 2.9 0.8 0.7 0.7 0.5
Construction 15.8 11.3 5.2 5.1 1.7 1.2 1.2 1.0
Manufacturing 21.7 20.5 29.7 28.8 13.7 12.4 15.7 11.4
Distributive services 15.0 18.1 20.2 18.9 7.7 8.7 9.1 8.8
Business services 8.1 12.6 7.1 8.6 11.8 16.5 13.3 14.5
Consumer services 15.5 20.0 10.7 13.8 25.9 31.2 21.2 19.7
Public services 14.9 11.5 22.5 21.1 36.6 27.6 37.9 43.5
Occupation
Professional/manager 8.4 13.2 14.2 17.8 4.5 14.2 9.2 17.9
Natural/social science 13.5 14.2 13.8 16.0 23.4 19.4 22.1 26.4
Clerical 3.9 5.5 8.4 6.4 30.8 24.4 36.3 27.9
Sales 8.4 8.5 8.5 6.4 8.8 10.2 8.5 6.5
Services 9.9 10.0 8.9 9.1 17.5 17.7 11.8 11.1
Primary/processing 26.4 24.3 25.6 25.0 10.5 8.3 8.6 6.7
Construction 15.6 10.2 7.6 6.7 0.2 0.2 0.2 0.1
Other 14.0 14.1 13.1 12.6 4.3 5.7 3.4 3.5
Average seniority (months) 11.9 10.2 146.7 150.0 11.6 10.5 107.1 131.3
Median (log) wages 2.84 2.71 2.96 3.01 2.51 2.42 2.67 2.78
Sample size 4,132 5,629 11,517 15,058 3,682 5,453 7,106 14,107
Source: Statistics Canada, Survey of Work History of 1981, Labour Force Survey of 1998.
aOne to twenty-four months of seniority.
FRBNY Economic Policy Review / August 2005 41
of new employees than models that control for variables related to labour demand and institutional changes. This can be seen by noting that the value of In_81-98 generally falls less with the former type of models than with the latter. This finding implies that, in general, variables related to labour demand and institutional changes contributed more to widen the wage gap between new employees and others than did labour-supply-related variables.23
In sum, while changes in personal attributes and job characteristics clearly contributed to the decline in the relative wages of newly hired employees over the past two decades, a substantial portion of this decline persists even after controlling for these changes, especially for males. In other words, relative wages of newly hired employees fell within cells defined jointly in terms of age, education, union status, industry, and occupation, thereby suggesting that Canadian employers decreased their wage offers for new applicants.
6. Changes in the Age-Wage Profile of New Entrants
These declines in the wage offers for new applicants have been associated with important changes in the age-wage profile of labour market entrants.24 Among males, successive cohorts of labour market entrants—as proxied by men ages twenty-five to thirty-four—have seen their wages at entry decline between the early 1980s and the late 1990s. Between 1981 and 1999—years during which the unemployment rate was between 7.5 percent and 7.6 percent—median wages of men ages twenty-five to thirty-four fell by about 14 percentage points (Table 10).25 Entry wages of young males stopped falling after 1999. Consistent with the findings of Beaudry and Green (2000), entry wages of young males have been falling for university graduates as well as for nonuniversity graduates, at least until 1997.
Have the age-earnings profiles of successive cohorts become steeper over time? There is no unique answer to this question. For the 1989 cohort with no university degree, the answer is clearly no. Between 1989 and 1999, members of this cohort have seen their median wages increase by 8 percentage points, no more than the 10-percentage-point increase experienced by
Table 9
Relative Wage Growth of Newly Hired Employees, 1981-98Results of Median Regressions
Employees Ages Twenty-Five to Sixty-Four
Employees Ages Twenty-Five to Forty-Four
Employees Ages Forty-Five to Sixty-Four
Interaction Term (In_81-98) Men Women Men Women Men Women
No controls -0.187*** -0.196*** -0.129*** -0.144*** -0.147*** -0.272***
Pseudo R2 0.0265 0.0384 0.0300 0.0419 0.0314 0.0379
Controls for age and education -0.181*** -0.161*** -0.169*** -0.121*** -0.109*** -0.219***
Pseudo R2 0.0712 0.1073 0.0716 0.1093 0.0809 0.1104
Other controlsa -0.150*** -0.089*** -0.127*** -0.067*** -0.131*** -0.133***
Pseudo R2 0.1436 0.2436 0.1420 0.2458 0.1591 0.2433
Full set of controlsb -0.147*** -0.099*** -0.121*** -0.0761*** -0.132*** -0.138***
Pseudo R2 0.1562 0.2613 0.1552 0.2623 0.1696 0.2641
Sample size 36,336 30,348 23,597 20,303 12,739 10,045
Source: Statistics Canada, Survey of Work History of 1981, Labour Force Survey of 1998.
aControls for union status, part-time status, industry, and occupation (see text for details).bControls for age, education, union status, part-time status, industry, and occupation (see text for details).
***Statistically significant at the 1 percent level.

42 Are Good Jobs Disappearing in Canada?
the 1981 cohort between 1981 and 1988 (Table 10).26 This suggests that, compared with the 1981 cohort, the 1989 cohort has been experiencing a lower but not steeper age-wage profile. In contrast, members of the 1997 cohort have seen their median wages increase by 13 percentage points between 1997 and 2004, slightly more than the increase registered by the 1981 cohort between 1981 and 1988. Likewise, university graduates belonging to the 1997 cohort have enjoyed a 23-percentage-point increase in their median wages between 1997 and 2004, slightly more than the 19-percentage-point increase experienced by the 1981 cohort between 1981 and 1988 (Table 10).
Some evidence of a steepening of the age-wage profile of male entrants can be found by examining the median wages of the 1989 cohort of university graduates fifteen years after entry, that is, in 2004. During the 1989-2004 period, members of this
cohort have experienced a 35-percentage-point increase in median (log) wages, much more than the 27-percentage-point increase registered by the 1981 cohort between 1981 and 1997.27 As a result, their median wages in 2004 fully converged to those of the 1981 cohort in 1997. However, this pattern of full convergence is not observed among members of the 1989 cohort who had no university degree. Contrary to their counterparts with a university degree, by 2004 these individuals still had lower wages than the 1981 cohort had in 1997.
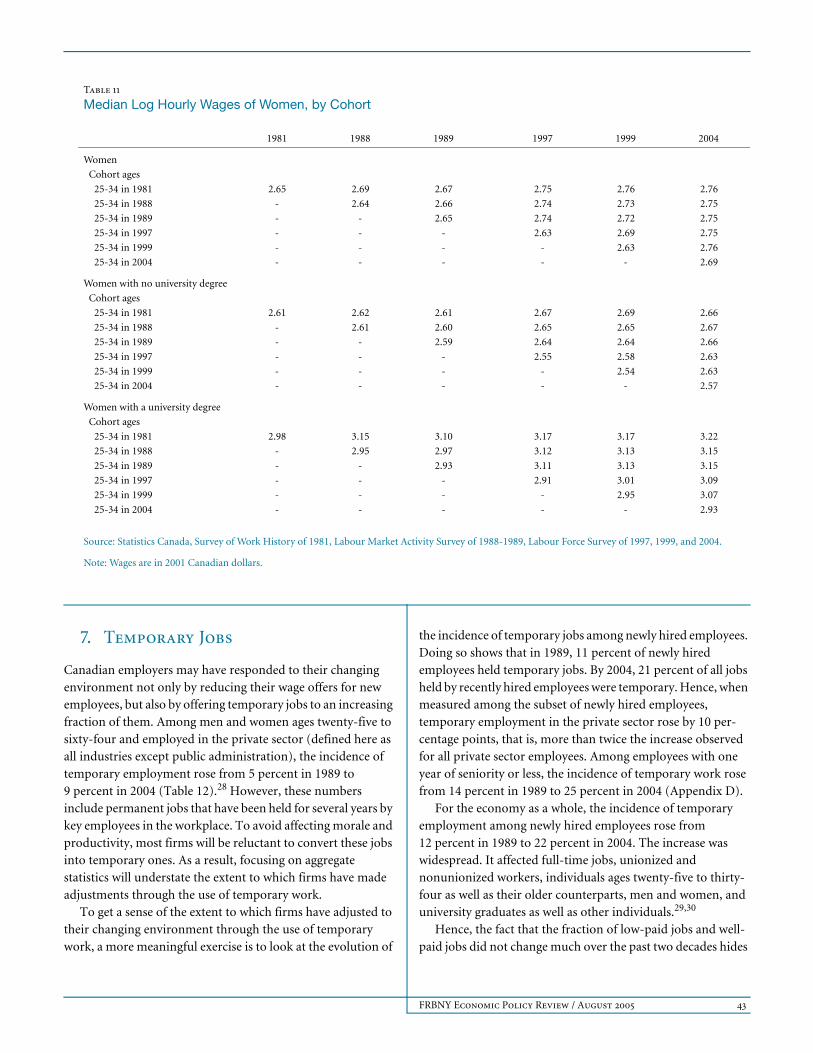
Changes in the age-wage profile were less pronounced among young women. Even though there is some evidence that entry wages fell between 1981 and 1989 (especially for university graduates), by 2004 members of the 1989 cohort had roughly the same wages as those of the 1981 cohort in 1997 (Table 11). This was true for women with a university degree as well as for others.
Table 10
Median Log Hourly Wages of Men, by Cohort
1981 1988 1989 1997 1999 2004
Men
Cohort ages
25-34 in 1981 2.91 3.03 3.02 3.06 3.05 3.02
25-34 in 1988 - 2.88 2.89 2.97 3.00 3.00
25-34 in 1989 - - 2.85 2.96 2.98 2.98
25-34 in 1997 - - - 2.79 2.86 2.92
25-34 in 1999 - - - - 2.77 2.92
25-34 in 2004 - - - - - 2.80
Men with no university degree
Cohort ages
25-34 in 1981 2.88 2.98 2.98 2.97 3.00 2.93
25-34 in 1988 - 2.84 2.85 2.92 2.94 2.92
25-34 in 1989 - - 2.83 2.91 2.91 2.92
25-34 in 1997 - - - 2.74 2.79 2.87
25-34 in 1999 - - - - 2.72 2.83
25-34 in 2004 - - - - - 2.73
Men with a university degree
Cohort ages
25-34 in 1981 3.08 3.27 3.24 3.35 3.35 3.43
25-34 in 1988 - 3.05 3.03 3.26 3.30 3.37
25-34 in 1989 - - 3.00 3.22 3.30 3.35
25-34 in 1997 - - - 2.97 3.10 3.20
25-34 in 1999 - - - - 3.03 3.20
25-34 in 2004 - - - - - 3.02
Source: Statistics Canada, Survey of Work History of 1981, Labour Market Activity Survey of 1988-1989, Labour Force Survey of 1997, 1999, and 2004.
Note: Wages are in 2001 Canadian dollars.
FRBNY Economic Policy Review / August 2005 43
7. Temporary Jobs
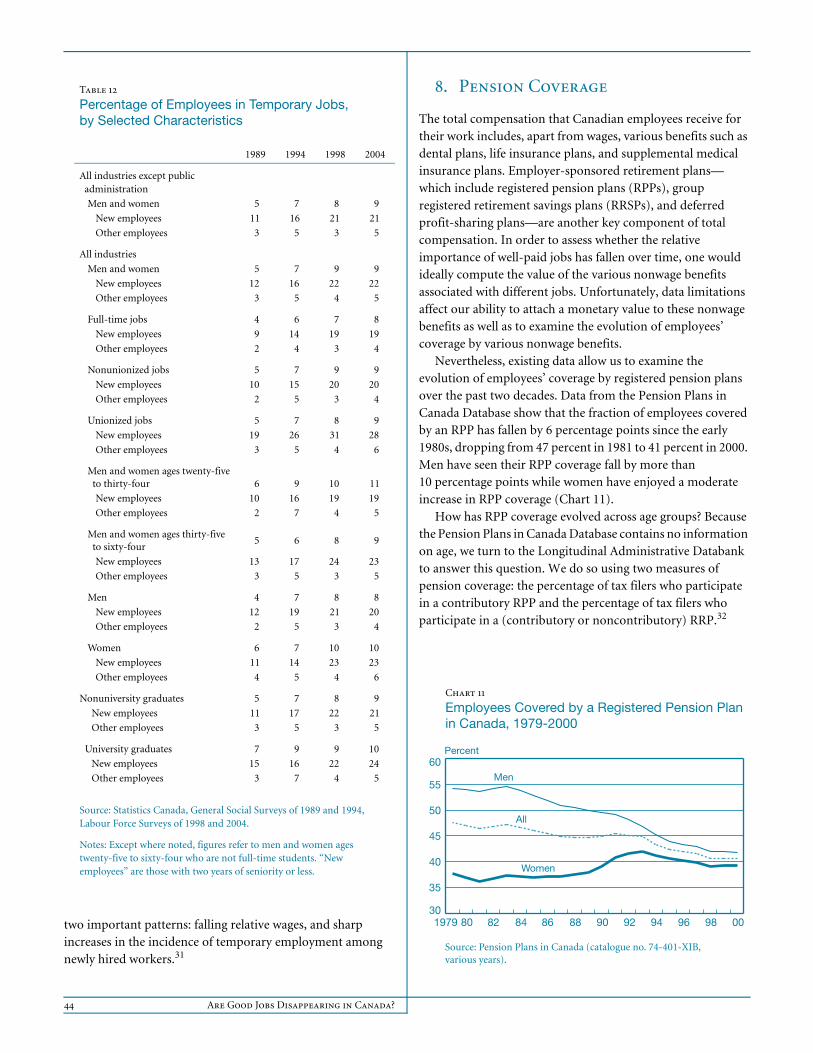
Canadian employers may have responded to their changing environment not only by reducing their wage offers for new employees, but also by offering temporary jobs to an increasing fraction of them. Among men and women ages twenty-five to sixty-four and employed in the private sector (defined here as all industries except public administration), the incidence of temporary employment rose from 5 percent in 1989 to 9 percent in 2004 (Table 12).28 However, these numbers include permanent jobs that have been held for several years by key employees in the workplace. To avoid affecting morale and productivity, most firms will be reluctant to convert these jobs into temporary ones. As a result, focusing on aggregate statistics will understate the extent to which firms have made adjustments through the use of temporary work.
To get a sense of the extent to which firms have adjusted to their changing environment through the use of temporary work, a more meaningful exercise is to look at the evolution of
the incidence of temporary jobs among newly hired employees. Doing so shows that in 1989, 11 percent of newly hired employees held temporary jobs. By 2004, 21 percent of all jobs held by recently hired employees were temporary. Hence, when measured among the subset of newly hired employees, temporary employment in the private sector rose by 10 per-centage points, that is, more than twice the increase observed for all private sector employees. Among employees with one year of seniority or less, the incidence of temporary work rose from 14 percent in 1989 to 25 percent in 2004 (Appendix D).
For the economy as a whole, the incidence of temporary employment among newly hired employees rose from 12 percent in 1989 to 22 percent in 2004. The increase was widespread. It affected full-time jobs, unionized and nonunionized workers, individuals ages twenty-five to thirty-four as well as their older counterparts, men and women, and university graduates as well as other individuals.29,30
Hence, the fact that the fraction of low-paid jobs and well-paid jobs did not change much over the past two decades hides
Table 11
Median Log Hourly Wages of Women, by Cohort
1981 1988 1989 1997 1999 2004
Women
Cohort ages
25-34 in 1981 2.65 2.69 2.67 2.75 2.76 2.76
25-34 in 1988 - 2.64 2.66 2.74 2.73 2.75
25-34 in 1989 - - 2.65 2.74 2.72 2.75
25-34 in 1997 - - - 2.63 2.69 2.75
25-34 in 1999 - - - - 2.63 2.76
25-34 in 2004 - - - - - 2.69
Women with no university degree
Cohort ages
25-34 in 1981 2.61 2.62 2.61 2.67 2.69 2.66
25-34 in 1988 - 2.61 2.60 2.65 2.65 2.67
25-34 in 1989 - - 2.59 2.64 2.64 2.66
25-34 in 1997 - - - 2.55 2.58 2.63
25-34 in 1999 - - - - 2.54 2.63
25-34 in 2004 - - - - - 2.57
Women with a university degree
Cohort ages
25-34 in 1981 2.98 3.15 3.10 3.17 3.17 3.22
25-34 in 1988 - 2.95 2.97 3.12 3.13 3.15
25-34 in 1989 - - 2.93 3.11 3.13 3.15
25-34 in 1997 - - - 2.91 3.01 3.09
25-34 in 1999 - - - - 2.95 3.07
25-34 in 2004 - - - - - 2.93
Source: Statistics Canada, Survey of Work History of 1981, Labour Market Activity Survey of 1988-1989, Labour Force Survey of 1997, 1999, and 2004.
Note: Wages are in 2001 Canadian dollars.
44 Are Good Jobs Disappearing in Canada?
two important patterns: falling relative wages, and sharp increases in the incidence of temporary employment among newly hired workers.31
8. Pension Coverage
The total compensation that Canadian employees receive for their work includes, apart from wages, various benefits such as dental plans, life insurance plans, and supplemental medical insurance plans. Employer-sponsored retirement plans—which include registered pension plans (RPPs), group registered retirement savings plans (RRSPs), and deferred profit-sharing plans—are another key component of total compensation. In order to assess whether the relative importance of well-paid jobs has fallen over time, one would ideally compute the value of the various nonwage benefits associated with different jobs. Unfortunately, data limitations affect our ability to attach a monetary value to these nonwage benefits as well as to examine the evolution of employees’ coverage by various nonwage benefits.
Nevertheless, existing data allow us to examine the evolution of employees’ coverage by registered pension plans over the past two decades. Data from the Pension Plans in Canada Database show that the fraction of employees covered by an RPP has fallen by 6 percentage points since the early 1980s, dropping from 47 percent in 1981 to 41 percent in 2000. Men have seen their RPP coverage fall by more than 10 percentage points while women have enjoyed a moderate increase in RPP coverage (Chart 11).
How has RPP coverage evolved across age groups? Because the Pension Plans in Canada Database contains no information on age, we turn to the Longitudinal Administrative Databank to answer this question. We do so using two measures of pension coverage: the percentage of tax filers who participate in a contributory RPP and the percentage of tax filers who participate in a (contributory or noncontributory) RRP.32
Table 12
Percentage of Employees in Temporary Jobs, by Selected Characteristics
1989 1994 1998 2004
All industries except public administration
Men and women 5 7 8 9
New employees 11 16 21 21
Other employees 3 5 3 5
All industries
Men and women 5 7 9 9
New employees 12 16 22 22
Other employees 3 5 4 5
Full-time jobs 4 6 7 8
New employees 9 14 19 19
Other employees 2 4 3 4
Nonunionized jobs 5 7 9 9
New employees 10 15 20 20
Other employees 2 5 3 4
Unionized jobs 5 7 8 9
New employees 19 26 31 28
Other employees 3 5 4 6
Men and women ages twenty-five to thirty-four 6 9 10 11
New employees 10 16 19 19
Other employees 2 7 4 5
Men and women ages thirty-five to sixty-four
5 6 8 9
New employees 13 17 24 23
Other employees 3 5 3 5
Men 4 7 8 8
New employees 12 19 21 20
Other employees 2 5 3 4
Women 6 7 10 10
New employees 11 14 23 23
Other employees 4 5 4 6
Nonuniversity graduates 5 7 8 9
New employees 11 17 22 21
Other employees 3 5 3 5
University graduates 7 9 9 10
New employees 15 16 22 24
Other employees 3 7 4 5
Source: Statistics Canada, General Social Surveys of 1989 and 1994, Labour Force Surveys of 1998 and 2004.
Notes: Except where noted, figures refer to men and women ages twenty-five to sixty-four who are not full-time students. “New employees” are those with two years of seniority or less.
Chart 11
Employees Covered by a Registered Pension Plan in Canada, 1979-2000
Source: Pension Plans in Canada (catalogue no. 74-401-XIB, various years).
30
35
40
45
50
55
60
0098969492 9088868482801979
Men
All
Women
Percent

FRBNY Economic Policy Review / August 2005 45
Table 13
Percentage of Tax Filers Contributing to a Registered Pension Plan
Age Group
17-24 25-34 35-44 45-54 55-64 17-64 25-64
Women
1986 8.1 27.5 32.4 31.2 30.1 25.5 30.0
1987 8.7 27.3 32.9 31.5 29.5 25.8 30.1
1988 9.2 27.6 34.2 33.3 29.8 26.8 31.0
1989 9.0 27.2 34.4 34.2 29.7 27.1 31.2
1990 9.2 27.6 34.9 35.3 30.3 27.9 31.8
1991 8.9 27.6 35.2 36.3 30.4 28.4 32.2
1992 8.3 28.1 35.8 37.6 31.2 29.2 33.0
1993 7.3 28.0 35.7 38.5 31.6 29.4 33.3
1994 6.2 27.1 35.0 38.9 31.6 29.0 33.0
1995 5.5 26.3 34.4 39.3 31.9 28.7 32.8
1996 5.0 25.1 33.6 39.2 31.8 28.3 32.2
1997 5.3 24.0 32.2 38.6 31.1 27.5 31.3
1998 5.6 23.7 31.5 37.6 29.2 26.9 30.6
1999 6.1 23.5 30.7 36.5 28.1 26.4 30.0
2000 6.5 24.0 30.6 36.6 29.5 26.7 30.3
2001 6.9 24.3 30.5 36.5 28.7 26.8 30.3
Men
1986 8.1 26.1 37.4 38.1 34.3 28.5 33.0
1987 8.6 25.6 36.7 37.4 33.1 28.1 32.3
1988 9.2 25.5 36.4 37.6 32.2 28.2 32.1
1989 8.8 24.7 35.5 37.3 31.2 27.7 31.4
1990 8.7 24.5 35.1 37.4 31.0 27.8 31.3
1991 7.9 24.0 34.5 37.5 30.6 27.6 31.0
1992 7.1 23.8 33.9 37.5 30.2 27.5 30.8
1993 6.3 23.2 33.3 37.8 30.1 27.3 30.7
1994 5.4 22.1 32.2 37.2 29.2 26.4 29.8
1995 5.0 21.3 31.3 36.8 28.7 25.9 29.2
1996 4.7 20.3 30.3 36.2 27.8 25.3 28.5
1997 4.8 19.7 29.4 35.5 26.9 24.7 27.8
1998 4.9 19.3 28.5 34.6 25.7 24.0 27.2
1999 5.2 18.5 26.9 32.9 24.3 23.0 25.9
2000 5.6 18.4 26.3 32.1 24.4 22.7 25.5
2001 6.0 18.5 25.7 31.5 24.0 22.5 25.2
Both sexes
1986 8.1 26.7 35.2 35.2 32.8 27.2 31.7
1987 8.6 26.3 35.0 34.9 31.8 27.1 31.3
1988 9.2 26.5 35.4 35.7 31.3 27.6 31.6
1989 8.9 25.9 35.0 36.0 30.7 27.5 31.3
1990 8.9 25.9 35.0 36.5 30.8 27.8 31.5
1991 8.4 25.7 34.8 36.9 30.5 28.0 31.5
1992 7.7 25.8 34.8 37.6 30.6 28.3 31.8
1993 6.7 25.4 34.4 38.1 30.7 28.2 31.9
1994 5.8 24.4 33.5 38.0 30.1 27.6 31.3
1995 5.2 23.6 32.8 38.0 30.0 27.2 30.9
1996 4.8 22.6 31.8 37.6 29.4 26.6 30.2
1997 5.0 21.7 30.7 36.9 28.6 26.0 29.4
1998 5.3 21.4 29.9 36.0 27.1 25.4 28.8
1999 5.6 20.9 28.7 34.6 25.9 24.6 27.8
2000 6.0 21.1 28.3 34.2 26.5 24.6 27.8
2001 6.4 21.3 28.0 33.9 26.0 24.5 27.6
Source: Statistics Canada, Longitudinal Administrative Databank (1 percent file).

46 Are Good Jobs Disappearing in Canada?
The first measure, which covers roughly three-quarters of all RPP members, is available since 1986 and is shown in Table 13. The second measure is available only since 1991 and is presented in Table 14.33
The percentage of male tax filers contributing to an RPP fell substantially in most age groups since 1986. It dropped by between 7 and 12 percentage points among men ages twenty-five to sixty-four (Table 13). In contrast, it rose slightly for women ages forty-five to fifty-four while falling by 3 percentage
points or less for other women. As a result, the percentage of tax filers contributing to an RPP has changed little among women during the 1986-2001 period while it has fallen among men.
Most of these qualitative patterns hold when we consider the percentage of tax filers who participate in a (contributory or noncontributory) registered pension plan. For instance, using this more comprehensive measure of employees’ RPP coverage and restricting our attention to the 1991-2001 period,
Table 14
Percentage of Tax Filers with a Positive Pension Adjustment
Age Group
17-24 25-34 35-44 45-54 55-64 17-64 25-64
Women
1991 11.9 34.2 41.5 41.7 34.1 33.9 38.2
1992 11.4 35.1 42.5 43.5 35.3 35.1 39.4
1993 10.5 35.0 42.7 44.6 35.9 35.4 39.9
1994 9.3 33.6 41.7 44.6 35.5 34.6 39.1
1995 8.9 33.2 41.7 45.5 36.3 34.9 39.4
1996 8.4 31.9 40.9 45.5 36.3 34.4 38.8
1997 9.0 31.7 40.6 45.6 36.2 34.4 38.8
1998 9.9 31.7 40.0 45.0 34.7 34.1 38.4
1999 10.3 31.4 39.4 44.4 34.1 33.8 38.0
2000 11.0 32.3 39.8 45.2 35.0 34.5 38.7
2001 11.4 32.9 40.0 45.5 35.5 35.0 39.1
Men
1991 12.5 35.7 48.5 51.7 42.0 39.3 43.9
1992 11.6 35.3 48.1 52.0 41.6 39.3 43.9
1993 10.6 34.1 47.0 51.5 40.9 38.6 43.1
1994 9.5 32.2 45.2 50.4 39.4 37.1 41.6
1995 9.7 31.8 44.7 50.4 39.2 37.1 41.4
1996 9.3 30.8 43.6 49.6 38.4 36.4 40.6
1997 9.9 30.3 42.4 48.5 37.5 35.7 39.9
1998 10.5 30.3 41.8 47.8 36.6 35.4 39.5
1999 11.0 30.3 41.0 47.0 35.9 35.1 39.1
2000 11.7 30.8 41.0 46.8 36.1 35.3 39.3
2001 12.3 31.0 40.6 46.4 35.9 35.2 39.1
Both sexes
1991 12.2 35.0 45.3 47.2 38.9 36.8 41.3
1992 11.5 35.2 45.5 48.2 39.2 37.4 41.8
1993 10.6 34.5 45.0 48.4 38.9 37.1 41.6
1994 9.4 32.8 43.6 47.8 37.8 36.0 40.5
1995 9.3 32.4 43.3 48.1 38.1 36.1 40.5
1996 8.9 31.3 42.4 47.7 37.6 35.5 39.8
1997 9.5 31.0 41.6 47.2 37.0 35.1 39.4
1998 10.2 31.0 41.0 46.5 35.8 34.8 39.0
1999 10.7 30.8 40.3 45.8 35.2 34.5 38.6
2000 11.3 31.5 40.4 46.0 35.7 34.9 39.0
2001 11.9 31.9 40.3 46.0 35.7 35.1 39.1
Source: Statistics Canada, Longitudinal Administrative Databank (1 percent file).

FRBNY Economic Policy Review / August 2005 47
we still find that pension coverage fell among men ages twenty-five to sixty-four and rose among women ages forty-five to fifty-four.34
Some differences are worth noting, however. The two measures of pension coverage yield different conclusions regarding the evolution of pension coverage of women ages fifty-five to sixty-four and of individuals ages seventeen to twenty-four. Among these groups, the percentage of tax filers contributing to an RPP has fallen slightly between 1991 and 2001 while the percentage of tax filers participating in an RPP has been either stagnant or increasing slightly.
Taken together, the results confirm the findings of Morissette and Drolet (2001), that is, they indicate that since the mid-1980s, RPP coverage has fallen substantially for men ages twenty-five and over, has dropped slightly for women ages twenty-five to thirty-four, and has risen for women ages forty-five to fifty-four.35
9. Conclusion
Recent media reports in the United States and Canada have suggested that new forms of outsourcing may be driving jobs offshore and contributing to the elimination of well-paid jobs in the Canadian labour market. Our examination of consistent hourly wage data from the Labour Force Survey shows little evidence to support the notion that well-paid jobs have been disappearing in Canada between 1997 and 2004. Likewise, we find little evidence that the proportion of jobs paying less than $10.00 per hour has risen during this period. Low-paid jobs have increased their relative importance only in low-skilled services. Furthermore, median wages have shown little growth between 1997 and 2003. This is somewhat surprising in light of the fact that real GDP per capita grew about 3 percent per year on average during the 1997-2003 period.36
While we refrain from making definitive statements about the evolution of wage levels over the 1981-2004 period, the data examined also provide little support for the view that the relative importance of well-paid jobs, however defined, has been trending downward over the past two decades. Nor do we find support for the notion that the relative importance of jobs paying $10.00 per hour has been trending upward during this period.37
In contrast, the data clearly indicate that the wage gap between newly hired employees and other employees has been
widening over the past two decades, even within age groups. The widening appears to have occurred in the first half of the 1980s as well as between the early 1990s and the late 1990s. While the reasons underlying this pattern are currently unknown, one explanation is that since the 1980s, Canadian employers may have responded to technological changes and/or more intense competition within industries and from abroad by cutting wages for newly hired workers while maintaining wages of workers with greater seniority. They might have done so in order to maintain morale and productivity among their core workers.
Whatever factors are at work here, the drop in the relative wages of newly hired employees shown in this paper is important for at least three reasons. First, it may help explain the substantial decline in quit rates observed in Canada between the late 1980s and the late 1990s.38 Second, it may have increased the earnings losses experienced by Canadian displaced workers between the 1980s and the 1990s. Third, unless it is offset by a steepening of the wage-seniority profile, it may signal changes in firms’ wage offers, which may induce a reduction in the relative importance of well-paid jobs in the years to come, with obvious implications for Canadians’ living standards.
Although the relative importance of well-paid jobs does not seem to have changed much over the past two decades, other changes have affected job quality. First, the relative importance of temporary jobs has increased substantially among newly hired employees. Second, sizable changes in nonwage benefits have been observed. Compared with the early 1980s, fewer male employees are now covered by a registered pension plan. Whether or not this decline in male RPP coverage has been offset by an increase in coverage by group registered retirement savings plans is currently unknown and remains an issue that cannot be addressed because of a lack of suitable data. How-ever, even if increases in group RRSP coverage have fully offset the decline in RPP coverage observed among men, one consequence is that the investment risk associated with employer-sponsored pension plans has been shifted, in many cases, onto male workers, rather than being borne by their employers. This is because group RRSPs, contrary to most RPPs, do not guarantee workers a defined benefit at the time of their retirement.39 Whatever the preferences of male employees are regarding the type of employer-sponsored pension plan they are offered, this change should be kept in mind in subsequent attempts to assess the evolution of the relative importance of well-paid jobs and low-paid jobs in Canada.

48 Are Good Jobs Disappearing in Canada?
Wage and Hours Concepts Used in Household Surveys, 1981-2004
Survey Wage Concept Hours Concept
Survey of Work History of 1981 Usual wage or salary before taxes and other deductions; no
reference is made to tips, commissions, bonuses, and overtime.
Usual days per week plus usual hours per
day; no reference is made to overtime.
Survey of Union Membership of 1984 Same as above. Weeks worked in 1984 plus usual hours per
day; no reference is made to overtime.
Labour Market Activity Survey of 1986 Same as above. Usual paid days per week plus usual paid hours
per day; no reference is made to overtime.
Labour Market Activity Survey of 1987-1990 Usual wage or salary before taxes and other deductions, including
tips, commissions, bonuses, and paid overtime, all together.
Same as above.
Labour Force Survey of 1997-2004 Wage or salary before taxes and other deductions, including
tips and commissions; whether respondents include overtime
pay is unclear.
Usual paid hours per week; explicitly
excludes overtime.
Appendix A

FRBNY Economic Policy Review / August 2005 49
Appendix B
Table B1
Percentage Distribution of Hourly Wages of Male Workers
Hourly Wage
Less Than $8.00
$8.00- $9.99
$10.00-$14.99
$15.00- $19.99
$20.00- $24.99
$25.00-$29.99
$30.00- $34.99
$35.00 or More
Employees ages seventeen to sixty-four
1981 8.3 7.6 23.1 24.7 17.1 10.1 4.2 5.0
1984 7.5 7.7 19.1 23.5 20.5 11.3 5.7 4.7
1986 10.1 6.7 22.7 20.3 18.1 12.0 4.5 5.7
1987 9.5 7.8 20.6 22.7 18.6 10.9 4.8 5.3
1988 8.0 6.9 20.1 23.7 18.7 11.2 5.3 6.1
1989 9.4 6.9 20.4 23.8 17.6 10.8 5.2 6.0
1990 9.0 7.5 21.3 22.8 18.5 10.3 5.2 5.5
1997 9.0 9.1 21.4 22.6 17.8 9.5 5.4 5.4
1998 8.6 9.1 21.2 22.8 17.3 9.9 5.7 5.5
1999 8.8 7.9 23.3 20.6 17.3 10.7 5.2 6.2
2000 8.2 8.2 22.6 22.2 17.3 10.8 4.8 5.9
2001 6.9 7.5 23.2 22.2 16.5 11.4 5.6 6.8
2002 8.6 9.1 22.9 21.3 15.5 10.1 5.6 7.1
2003 8.1 10.0 22.4 22.5 14.7 10.5 5.3 6.6
2004 9.0 9.4 23.4 20.1 15.5 10.4 5.2 7.0
Change
1986-2004 -1.1 2.8 0.8 -0.2 -2.6 -1.6 0.7 1.3
1981-2004 0.7 1.8 0.4 -4.5 -1.7 0.4 1.0 2.0
1997-2003 -0.8 0.9 1.0 -0.1 -3.0 1.0 -0.1 1.2
1997-2004 0.0 0.3 2.1 -2.5 -2.3 0.9 -0.2 1.6
Employees ages twenty-five to sixty-four
1981 5.3 5.6 20.6 26.1 19.2 12.1 5.1 6.0
1984 3.3 4.3 17.2 25.2 23.8 13.5 7.1 5.7
1986 5.0 4.5 20.2 22.2 21.2 14.5 5.5 6.9
1987 4.5 5.1 18.3 25.0 21.7 13.1 5.8 6.4
1988 3.7 4.2 17.3 25.8 21.6 13.5 6.5 7.5
1989 4.4 4.5 18.4 25.7 20.5 13.0 6.3 7.2
1990 4.5 4.6 19.4 25.0 21.5 12.2 6.2 6.6
1997 3.9 6.2 20.3 25.0 20.6 11.3 6.4 6.4
1998 3.7 6.2 20.0 25.2 20.1 11.7 6.7 6.5
1999 3.9 5.2 21.9 22.7 20.1 12.6 6.2 7.4
2000 3.6 5.4 21.0 24.3 20.1 12.8 5.7 7.0
2001 3.0 4.6 20.8 24.4 19.1 13.5 6.7 8.1
2002 3.9 6.2 21.6 23.5 17.9 11.9 6.6 8.5
2003 3.5 6.7 21.3 24.9 17.1 12.3 6.3 7.8
2004 3.7 6.7 22.4 22.5 17.9 12.3 6.2 8.3
Change
1986-2004 -1.3 2.2 2.2 0.3 -3.3 -2.2 0.7 1.4
1981-2004 -1.7 1.1 1.8 -3.7 -1.3 0.3 1.1 2.3
1997-2003 -0.4 0.5 1.0 -0.1 -3.5 1.1 -0.1 1.4
1997-2004 -0.2 0.5 2.1 -2.6 -2.7 1.1 -0.2 1.9
Source: Statistics Canada, Survey of Work History of 1981, Survey of Union Membership of 1984, Labour Market Activity Survey of 1986-1990,Labour Force Survey of 1997-2004.
Note: Wages are in 2001 Canadian dollars.

50 Are Good Jobs Disappearing in Canada?
Appendix B (Continued)
Table B2
Percentage Distribution of Hourly Wages of Female Workers
Hourly Wage
Less Than $8.00
$8.00-$9.99
$10.00-$14.99
$15.00-$19.99
$20.00-$24.99
$25.00-$29.99
$30.00-$34.99
$35.00 or More
Employees ages seventeen to sixty-four
1981 17.3 14.1 31.9 20.4 8.7 3.8 1.7 2.2
1984 17.4 15.0 30.5 19.7 10.3 4.2 1.6 1.3
1986 21.0 11.3 32.1 18.2 10.1 3.7 1.7 1.8
1987 19.5 13.5 30.4 19.3 9.9 4.2 1.5 1.7
1988 17.2 12.6 31.5 19.5 10.3 4.4 2.1 2.5
1989 18.6 12.2 31.1 19.6 9.8 4.5 2.1 2.1
1990 17.8 14.1 30.2 19.2 9.6 4.8 2.1 2.1
1997 16.2 13.6 27.5 20.7 12.1 5.3 2.9 1.8
1998 15.7 14.0 27.2 21.3 11.3 5.7 2.6 2.2
1999 16.9 12.3 28.2 19.9 11.9 6.5 2.8 1.7
2000 15.5 13.0 28.5 21.0 11.2 6.1 2.7 1.9
2001 14.5 11.9 29.2 20.6 11.6 6.5 3.3 2.5
2002 16.4 14.2 25.9 20.0 11.0 6.5 3.6 2.5
2003 15.7 13.9 26.7 20.1 11.1 6.5 3.7 2.2
2004 16.3 12.6 27.0 19.4 11.2 6.7 4.0 2.9
Change
1986-2004 -4.7 1.3 -5.1 1.1 1.1 3.0 2.3 1.1
1981-2004 -1.0 -1.5 -4.9 -1.0 2.6 2.9 2.3 0.7
1997-2003 -0.5 0.4 -0.8 -0.6 -1.1 1.3 0.8 0.5
1997-2004 0.1 -0.9 -0.5 -1.3 -0.9 1.5 1.1 1.1
Employees ages twenty-five to sixty-four
1981 14.0 12.5 31.0 22.7 10.4 4.8 2.2 2.6
1984 11.5 12.8 31.4 22.5 12.7 5.4 2.1 1.6
1986 14.2 10.0 33.4 21.3 12.3 4.5 2.2 2.1
1987 13.2 12.0 31.5 22.4 11.8 5.2 1.9 2.1
1988 12.0 10.8 31.7 22.1 12.4 5.5 2.6 3.0
1989 12.6 10.6 32.3 22.3 11.7 5.5 2.5 2.5
1990 12.9 12.5 31.1 21.6 11.2 5.7 2.6 2.5
1997 10.4 11.6 28.6 23.5 14.1 6.2 3.5 2.1
1998 9.7 12.4 28.2 24.1 13.1 6.8 3.1 2.6
1999 10.4 11.1 29.0 22.5 14.0 7.7 3.3 2.0
2000 9.3 11.5 29.3 23.9 13.1 7.3 3.3 2.3
2001 8.6 10.2 29.9 23.1 13.6 7.7 4.0 2.9
2002 10.0 12.8 26.8 22.7 12.9 7.6 4.3 3.0
2003 9.6 12.2 27.6 22.8 12.9 7.8 4.5 2.7
2004 10.2 10.9 27.8 21.9 13.2 8.0 4.7 3.5
Change
1986-2004 -4.0 0.9 -5.6 0.6 0.9 3.5 2.6 1.3
1981-2004 -3.8 -1.6 -3.2 -0.8 2.8 3.1 2.6 0.9
1997-2003 -0.8 0.6 -1.0 -0.7 -1.2 1.6 1.0 0.6
1997-2004 -0.3 -0.7 -0.8 -1.6 -1.0 1.7 1.3 1.3
Source: Statistics Canada, Survey of Work History of 1981, Survey of Union Membership of 1984, Labour Market Activity Survey of 1986-1990, Labour Force Survey of 1997-2004.
Note: Wages are in 2001 Canadian dollars.

FRBNY Economic Policy Review / August 2005 51
Appendix C
Incidence of Low Pay and Changes in theWorkforce Composition, by Age and SexPercent
1986 2004
Incidence of Low Pay
Share of Workforce
Incidence of Low Pay
Share of Workforce
Men ages
17-24 48.2 10.3 60.2 8.2
25-34 12.6 17.0 14.5 12.2
35-44 7.5 13.6 8.8 13.4
45-54 6.4 8.7 7.1 11.6
55-64 9.8 5.6 12.1 5.3
Women ages
17-24 62.0 9.7 69.2 8.1
25-34 23.9 14.1 22.8 11.6
35-44 22.3 10.9 19.6 13.3
45-54 24.9 6.7 19.4 11.8
55-64 30.1 3.4 24.9 4.8
Incidence
of low pay 23.7 100.0 23.6 100.0
Source: Statistics Canada, Labour Market Activity Survey of 1986, Labour Force Survey of 2004.
Note: Incidence of low pay is the share of employees earning less than $10.00 per hour (2001 Canadian dollars).
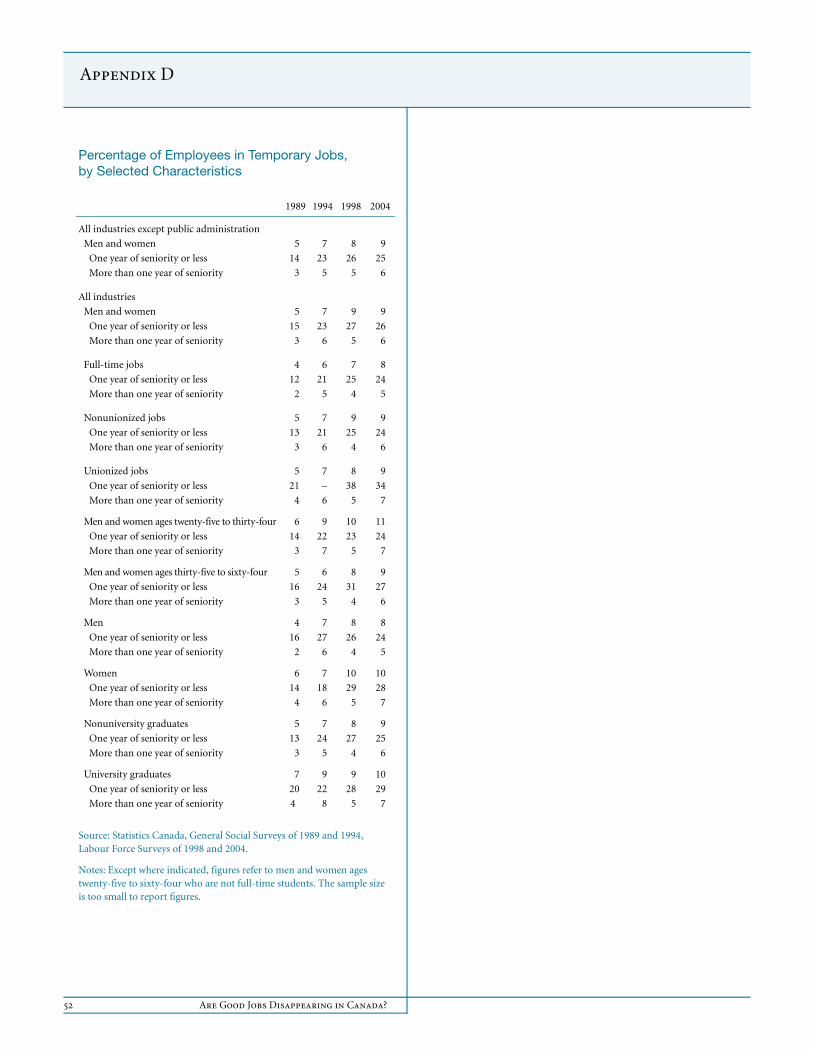
52 Are Good Jobs Disappearing in Canada?
Appendix D
Percentage of Employees in Temporary Jobs,by Selected Characteristics
1989 1994 1998 2004
All industries except public administration
Men and women 5 7 8 9
One year of seniority or less 14 23 26 25
More than one year of seniority 3 5 5 6
All industries
Men and women 5 7 9 9
One year of seniority or less 15 23 27 26
More than one year of seniority 3 6 5 6
Full-time jobs 4 6 7 8
One year of seniority or less 12 21 25 24
More than one year of seniority 2 5 4 5
Nonunionized jobs 5 7 9 9
One year of seniority or less 13 21 25 24
More than one year of seniority 3 6 4 6
Unionized jobs 5 7 8 9
One year of seniority or less 21 – 38 34
More than one year of seniority 4 6 5 7
Men and women ages twenty-five to thirty-four 6 9 10 11
One year of seniority or less 14 22 23 24
More than one year of seniority 3 7 5 7
Men and women ages thirty-five to sixty-four 5 6 8 9
One year of seniority or less 16 24 31 27
More than one year of seniority 3 5 4 6
Men 4 7 8 8
One year of seniority or less 16 27 26 24
More than one year of seniority 2 6 4 5
Women 6 7 10 10
One year of seniority or less 14 18 29 28
More than one year of seniority 4 6 5 7
Nonuniversity graduates 5 7 8 9
One year of seniority or less 13 24 27 25
More than one year of seniority 3 5 4 6
University graduates 7 9 9 10
One year of seniority or less 20 22 28 29
More than one year of seniority 4 8 5 7
Source: Statistics Canada, General Social Surveys of 1989 and 1994, Labour Force Surveys of 1998 and 2004.
Notes: Except where indicated, figures refer to men and women ages twenty-five to sixty-four who are not full-time students. The sample size is too small to report figures.

Endnotes
FRBNY Economic Policy Review / August 2005 53
1. The proportion of jobs in firms with 500 or more employees
dropped from 51 percent in 1983 to 42 percent in 2001.
2. The main job is the job that involves the greatest number of work-
hours per week.
3. For instance, the Labour Market Activity Survey of 1989 imputes
wages, excluding overtime pay, based on the following vector of
covariates: 1) class of worker, 2) province, 3) sex, 4) age group,
5) education level, and 6) union status. In contrast, the Labour Force
Survey includes the first five covariates defined above as well as these
covariates: student status, a renter/houseowner indicator, and
occupation. LFS does not use union status to impute wages.
4. Picot, Myles, and Wannell (1990) use the Survey of Work History
of 1981 and the Labour Market Activity Survey of 1986 to examine
how the proportion of jobs below or above a certain distance from the
median has varied between 1981 and 1986. Thus, they do not examine
how the fraction of jobs paying, say, between $10.00 and $14.99 (in
constant dollars) has evolved during this period.
5. Since the Survey of Union Membership of 1984 has been conducted
in December, statistics for this year refer to individuals ages seventeen
to sixty-four who were employed as paid workers in the main job they
held in December.
6. See “Low-Income Cutoffs from 1994-2003 and Low-Income
Measures from 1992-2001” (Statistics Canada catalogue
no. 75F0002MIE - No. 002).
7. Numbers are given separately for men and women in Appendix B.
Consistent with the increase in women’s median hourly wages shown
in Table 1, the numbers reveal that during the 1981-2004 period,
women have been increasingly employed in jobs paying $20.00 or
more per hour.
8. The first pattern emerges clearly for both samples: the density
function for 2004 lies above that for 1981 when log wages exceed
roughly 3.25, that is, when hourly wages exceed $25.79 (Charts 1 and
2). The second pattern can be seen by noting that for employees ages
twenty-five to sixty-four, the density function for 2004 lies below that
for 1981 at log wages <= 2.0, that is, when hourly wages are below
$7.39 (Chart 2).
9. The kernel densities shown in Charts 1 and 2 are based on the
Gaussian functional form and on an optimal band width. See
Silverman (1986) for details.
10. All of these changes are statistically significant at conventional
levels.
11. Between 1997 and 2004, the proportion of jobs paying between
$10.00 and $14.99 has risen by 0.9 percentage point and the
proportion of jobs paying between $15.00 and $19.99 has dropped by
1.9 percentage points. However, these proportions have remained
virtually unchanged between 1997 and 2003, thereby casting doubt on
the presence of specific trends in these wage categories.
12. The careful reader will have noticed that the fraction of jobs paying
$8.00 to $9.99 fell between 2000 and 2001 and then rose between 2001
and 2002. This pattern is due to heaping, that is, the tendency of
respondents to report wages at integer values (such as $10.00). To
ensure the robustness of our conclusion regarding the evolution of
the fraction of low-paid jobs between 1997 and 2004, we recalculated
the numbers based on two alternative wage categories: $8.00 to
$10.33 and $8.00 to $10.67. Under these two alternative categories,
the fraction of low-paid jobs (those paying less than $10.33 or less
than $10.67) rose by at most 0.7 percentage point (from 24.9 to
25.6 percent) between 1997 and 2004, thereby confirming that there is
little evidence that the fraction of low-paid jobs has risen in recent years.
13. These conclusions hold when jobs are weighted by their weekly
hours.
14. Changes in the coding of the LFS education question in the early
1990s imply that we can control only broadly for educational
attainment by distinguishing university graduates from other
individuals.
15. The pattern is consistent with the findings of Burbidge, Magee,
and Robb (2002), who examine median weekly earnings of full-time
workers, using data from the Survey of Consumer Finances.
16. It is important to emphasize that these patterns do not imply that
the wage gap between university graduates and high-school graduates
has not widened. Using census data, Morissette, Ostrovsky, and Picot
(2004) show that between 1980 and 2000, the university-to-high-
school earnings ratio did rise for young men and women employed in
the private sector.
17. The six major industrial groups are: primary industries and
construction, manufacturing, highly skilled services, low-skilled
services, wholesale trade and other services, and public services.
Highly skilled services include the following industries (NAICS 1997):
transportation and warehousing (48-49), information and cultural

54 Are Good Jobs Disappearing in Canada?
Endnotes (Continued)
Note 17 Continued
industries (51), finance and insurance (52), real estate, rental, and
leasing (53), professional, scientific, and technical services (54),
management of companies and enterprises (55), administrative and
support, waste management, and remediation services (56). Low-
skilled services include retail trade (44-45) and accommodation and
food services (72). During the 1997-2004 period, the distribution of
employment across major industrial groups for individuals ages
seventeen to sixty-four was: primary industries and construction
(8.4 percent), manufacturing (17.2 percent), highly skilled services
(21.9 percent), low-skilled services (18.8 percent), wholesale trade and
other services (11.0 percent), public services (22.7 percent).
18. Annual wages and salaries reported for the reference year will
be associated with more than one job only if workers held several
jobs at a given point in time during that year. Since multiple job
holding affected at most 6 percent of employed individuals between
1981 and 1997 (Sussman 1998), this limitation is unlikely to affect
our results.
19. Individuals with any self-employment income during the
reference year are excluded from the construction of our SCF
sample of newly hired employees.
20. Data from the 1984 Survey of Union Membership cannot be used
for this comparison because the survey does not include seniority as a
continuous variable. In the survey, seniority is measured using the
categories 6 months or less, 7-12 months, 13-60 months, 61-120
months, 121-240 months, and more than 240 months.
21. To assess the extent to which the drop in union coverage of new
employees was due to compositional effects, we pooled the 1981 and
1998 data and ran a linear probability model of union coverage. The
model was estimated for new male and new female employees
separately. The vector of covariates used included all variables listed in
Table 8 except (log) wages. The results indicate that after we control
for age, education, full-time status, industry, occupation, and
seniority, the decline in union coverage among new male employees
between 1981 and 1998 amounts to 16 percentage points, that is,
80 percent of the decline observed in the raw data. For women, the
decline in union coverage amounts to 7 percentage points, that is,
60 percent of the drop observed in the raw data. Hence, most of the
decline in union coverage observed among new employees persists
after controlling for compositional effects.
22. We use discrete age categories because the Survey of Work History
of 1981 does not include age as a continuous variable. As mentioned
above, changes in the coding of the LFS education question in the early
1990s imply that we can control only broadly for educational
attainment by distinguishing university graduates from other
individuals. The indicator for union coverage equals 1 if a person
is a member of a union and zero otherwise.
23. One could argue that changes in unmeasured worker quality may
have contributed to the widening of the wage gap between new
employees and others. This could occur if a greater fraction of low-
ability workers had been drawn into the labour market in 1998 than in
1981. Simple statistics on the evolution of male employment rates do
not support this view. In 1998, the employment rate of men ages
twenty-five to fifty-four was, at 84.4 percent, no higher than the rate
of 89.7 percent observed in 1981. Thus, it seems unlikely that the
widening of the wage gap between new employees and others resulted
from the entry of workers with low unmeasured quality.
24. The goal of this section is simply to provide descriptive evidence
on the evolution of the age-wage profiles of successive cohorts of
labour market entrants over the past two decades. Assessing the extent
to which changes in the age-wage profiles of successive cohorts of
labour market entrants are due to factors specific to a given birth
cohort, cyclical effects, longer term trends, and declines in wage offers
for newly hired employees is beyond the scope of this paper. For an
econometric analysis that performs this task for the 1981-98 period,
see Townsend and Green (2002).
25. As the table shows, median log wages of this group were equal to
2.77 in 1999, down from 2.91 in 1981.
26. The Canadian unemployment rate was fairly similar across all of
these years. It was 7.5 percent in 1981, 7.8 percent in 1988, 7.5 percent
in 1989, and 7.6 percent in 1999.
27. The unemployment rate was higher in 1997 (9.1 percent) than it
has been so far in 2004 (varying between 7.0 and 7.5 percent); the
stronger wage growth experienced by the 1989 cohort could partly
reflect a cyclical effect, rather than a steepening of the age-wage profile.
28. The 1989 GSS, the 1994 GSS, and the 1997-2004 LFS allow us to
distinguish full-time students from other individuals; thus, the sample
used in Table 12 consists of employees ages twenty-five to sixty-four
who are not full-time students.

Endnotes (Continued)
FRBNY Economic Policy Review / August 2005 55
29. Data not shown indicate that the increase in temporary
employment among newly hired employees was even greater for
individuals ages seventeen to twenty-four. In 2004, fully 32 percent of
newly hired employees ages seventeen to twenty-four (who were not
full-time students) held a temporary job, almost three times the rate of
11 percent observed in 1989.
30. All of these qualitative conclusions hold when we define newly
hired employees as those who have one year of seniority or less.
See Appendix D.
31. Because the 1989 GSS contains no data on hourly wages, it is
impossible to assess the extent to which the decrease in relative wages
of newly hired employees during the 1989-2004 period is due to the
growing incidence of temporary employment.
32. This second measure is calculated using the fraction of tax filers
who have a positive pension adjustment. The pension adjustment is
the sum of credits for the year, if any, from deferred profit-sharing
plans or benefit provisions of registered pension plans sponsored by
the tax filer’s employer. Membership in deferred profit-sharing plans
is a very small proportion of membership in RPPs: in 1993, the former
represented only 7 percent of the latter (Frenken 1995). As a result,
changes in the percentage of tax filers with positive pension
adjustments should reflect mainly changes in the percentage of tax
filers who are members of RPPs.
33. The sample used for Tables 13 and 14 consists of tax filers ages
seventeen to sixty-four who had annual earnings (wages and salaries
plus net income from self-employment) of at least $1,000 in 1994
constant dollars.
34. Interestingly, the percentage of women ages forty-five to fifty-four
contributing to an RPP in 2001 was very similar to its value in 1991.
35. Morissette and Drolet (2001) find an increase in RPP coverage
among women ages thirty-five to fifty-four, but do not distinguish
those who are thirty-five to forty-four from those who are forty-five
to fifty-four.
36. See Statistics Canada’s Cansim database (Tables 397-0017 and
051-0001).
37. One limitation of the study is that we cannot assess with current
data whether unpaid work-hours rose over the past two decades. Had
they increased, trends in the relative importance of low-paid jobs and
well-paid jobs might have been less favourable than those presented in
this study.
38. Morissette (2004) finds that while permanent layoff rates did not
change much between the late 1980s and the late 1990s, permanent
quit rates fell substantially for men and women of all ages.
39. On January 1, 2000, 85 percent of RPP members belonged to
defined-benefit RPPs. See Pension Plans in Canada (catalogue
no. 74-401-XIB, Table 11, p. 36, January 1, 2000).

References
56 Are Good Jobs Disappearing in Canada?
Akyeampong, E. B. 2004. “The Union Movement in Transition.”
Perspectives on Labour and Income 16, no. 3 (autumn): 39-47.
Statistics Canada catalogue no. 75-001-XPE.
Baker, M., D. Benjamin, A. Desaulniers, and M. Grant. 1995. “The
Distribution of the Male/Female Earnings Differential, 1970-
1990.” Canadian Journal of Economics 28, no. 3 (August):
479-501.
Beach, C. M., and G. A. Slotsve. 1996. Are We Becoming Two
Societies? Income Polarization and the Myth of the
Declining Middle Class in Canada. Toronto: C. D. Howe
Institute.
Beaudry, P., and D. A. Green. 2000. “Cohort Patterns in Canadian
Earnings: Assessing the Role of Skill Premia in Inequality Trends.”
Canadian Journal of Economics 33, no. 4 (November): 907-36.
Bluestone, B., and B. Harrison. 1982. The Deindustrialization
of America. New York: Basic Books.
Burbidge, J. B., L. Magee, and A. L. Robb. 2002. “The Education
Premium in Canada and the United States.” Canadian Public
Policy 28, no. 2 (June): 203-17.
BusinessWeek. 2003. “The Rise of India.” December 8. Available at
<http://www.businessweek.com/>.
———. 2004. “Programming Jobs Are Heading Overseas by the
Thousands. Is There a Way for the U.S. to Stay on Top?” March 1.
Available at <http://www.businessweek.com/>.
Dinardo, J., and T. Lemieux. 1997. “Diverging Male Wage Inequality in
the United States and Canada, 1981-1988: Do Institutions Explain
the Difference?” Industrial and Labor Relations Review 50,
no. 4 (July): 629-51.
Doiron, D. J., and G. F. Barrett. 1996. “Inequality in Male and Female
Earnings: The Role of Hours and Wages.” Review of Economics
and Statistics 78, no. 3 (August): 410-20.
Frenken, H. 1995. “Tax Assistance for Pensions and RRSPs.”
Perspectives on Labour and Income 7, no. 4 (winter): 9-13.
Statistics Canada catalogue no. 75-001-XWE.
Johnson, S., and P. Kuhn. 2004. “Increasing Male Earnings Inequality
in Canada and the U.S., 1981-1997: The Role of Hours Changes
versus Wage Changes.” Canadian Public Policy 30, no. 2 (June):
155-75.
Maxwell, J. 2002. “Smart Social Policy—‘Making Work Pay.’”
Canadian Policy Research Networks.
Morissette, R. 2004. “Have Permanent Layoff Rates Increased in
Canada?” Analytical Studies Branch Research Paper Series.
Statistics Canada catalogue no. 11F0019MIE2004218.
Morissette, R., and M. Drolet. 2001. “Pension Coverage and Retirement
Savings of Young and Prime-Aged Workers in Canada, 1986-
1997.” Canadian Journal of Economics 34, no. 1 (February):
100-19.
Morissette, R., J. Myles, and G. Picot. 1994. “Earnings Inequality and
the Distribution of Working Time in Canada.” Canadian
Business Economics 2, no. 3 (spring): 3-16.
Morissette, R., Y. Ostrovsky, and G. Picot. 2004. “Relative Wage
Patterns among the Highly Educated in a Knowledge-Based
Economy.” Analytical Studies Branch Research Paper Series.
Statistics Canada catalogue no. 11F0019MIE2004232.
(Forthcoming in R. G. Lipsey and A. O. Nakamura, eds., Services
Industries in a Knowledge-Based Economy. Calgary:
University of Calgary Press.)
Picot, G., J. Myles, and T. Wannell. 1990. “Good Jobs/Bad Jobs and the
Declining Middle, 1967-1986.” Analytical Studies Branch Research
Paper Series. Statistics Canada catalogue no. 11F0019MIE1990028.
Silverman, B. W. 1986. Density Estimation for Statistics and
Data Analysis. London: Chapman and Hall.
Statistics Canada. Forthcoming. Business Dynamics in Canada: 2001.
Sussman, D. 1998. “Moonlighting: A Growing Way of Life.”
Perspectives on Labour and Income 10, no. 2 (summer): 24-31.
Statistics Canada catalogue no. 75-001-XWE.
Townsend, J. H., and D. A. Green. 2002. “The Sources of Declining
Entry Wages for the Less Educated in Canada.” In Essays on
Trade Liberalization and Labour Market Outcomes.
The views expressed are those of the authors and do not necessarily reflect the position of the Federal Reserve Bank of New York, the Federal Reserve System, or Statistics Canada. The Federal Reserve Bank of New York provides no warranty, express or implied, as to the accuracy, timeliness, completeness, merchantability, or fitness for any particular purpose of any information contained in documents produced and provided by the Federal Reserve Bank of New York in any form or manner whatsoever.