ars.els-cdn.com€¦ · web viewfigure s1. a) 2d gixd pattern of pdi-cys/auev film immersed in 0.1...
TRANSCRIPT
SUPPORTING INFORMATION
PERYLENE-DIIMIDE-CYSTEINE DERIVATIVES SELF-ASSEMBLED ONTO (111) GOLD SURFACE: EVIDENCE OF ORDERED AGGREGATION.
E.Kozma1, F.Galeotti1, G.Grisci1, L.Barba2, G. Arrighetti2 , M. Catellani1, G.Scavia1, W.Porzio1(*)
1Istituto per lo studio delle Macromolecole del CNR via E. Bassini 15 20133 Milano Italy2Istituto di Cristallografia-Sincrotrone Elettra, Strada Statale 14-Km 163,5 Area Science Park, 34149
Basovizza, Trieste, Italy
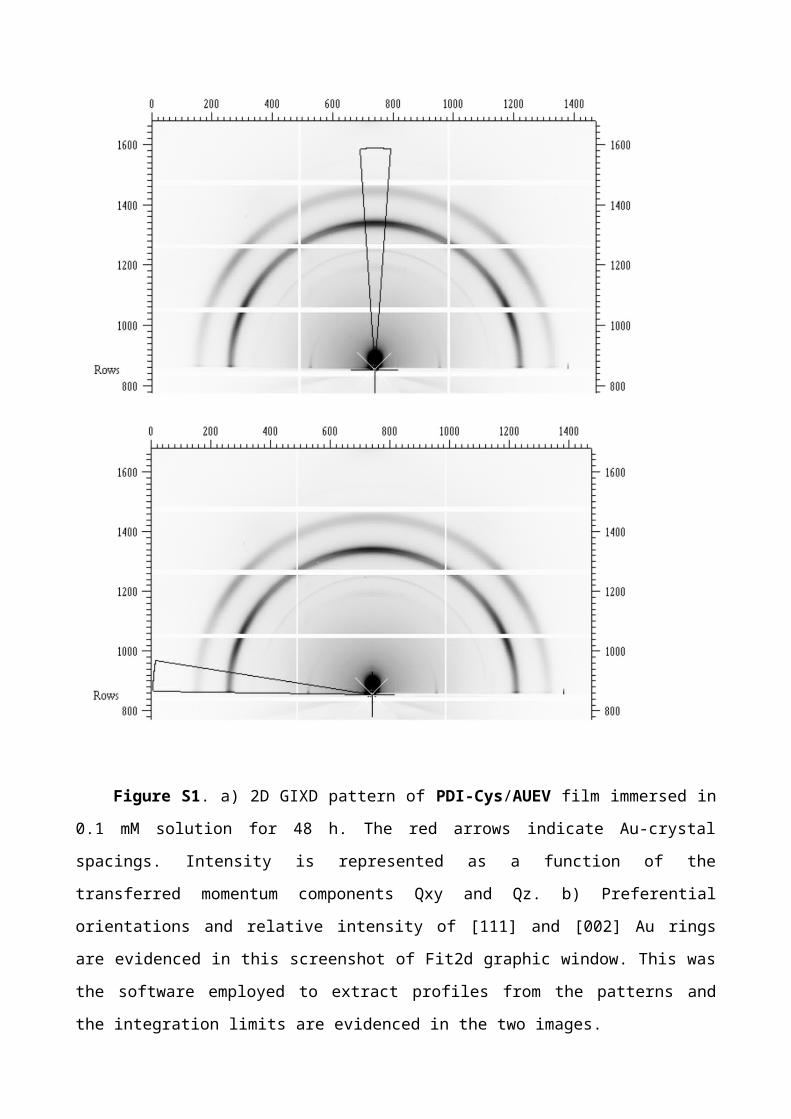
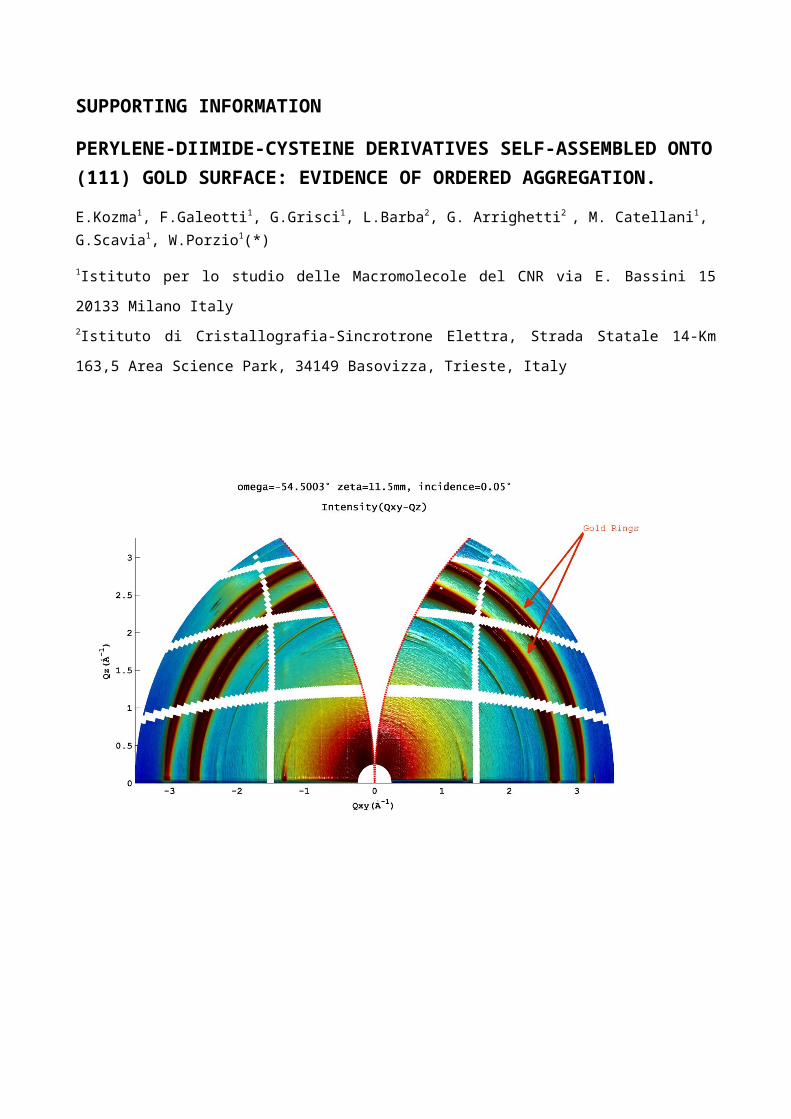
Figure S1. a) 2D GIXD pattern of PDI-Cys/AUEV film immersed in 0.1 mM solution for 48 h.
The red arrows indicate Au-crystal spacings. Intensity is represented as a function of the
transferred momentum components Qxy and Qz. b) Preferential orientations and relative intensity
of [111] and [002] Au rings are evidenced in this screenshot of Fit2d graphic window. This was the
software employed to extract profiles from the patterns and the integration limits are evidenced in
the two images.

Figure S2. Height images of AUEV after 48h PDI-Cys deposition

Figure S3. PDI-Cys/AUAN height images at different deposition times at 6 h (a, b,c) , 24 h (d,e,f)
and 48 h (g,h,i).
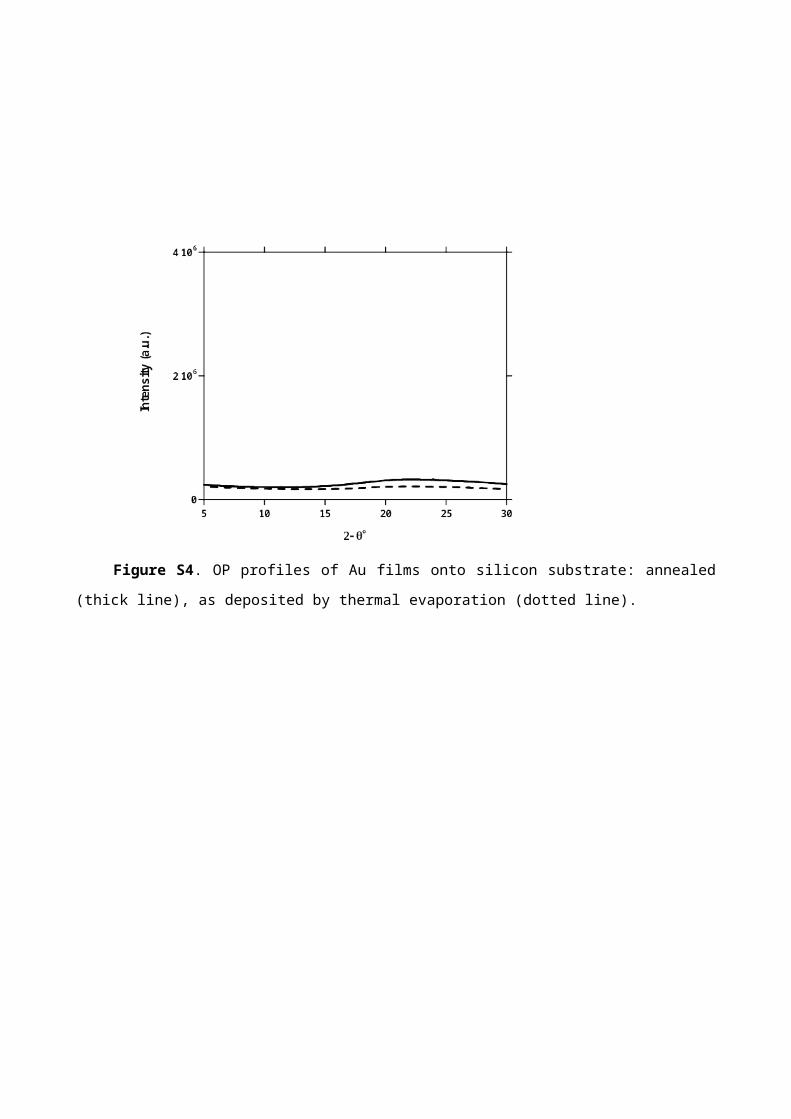
Figure S4. OP profiles of Au films onto silicon substrate: annealed (thick line), as deposited by
thermal evaporation (dotted line).
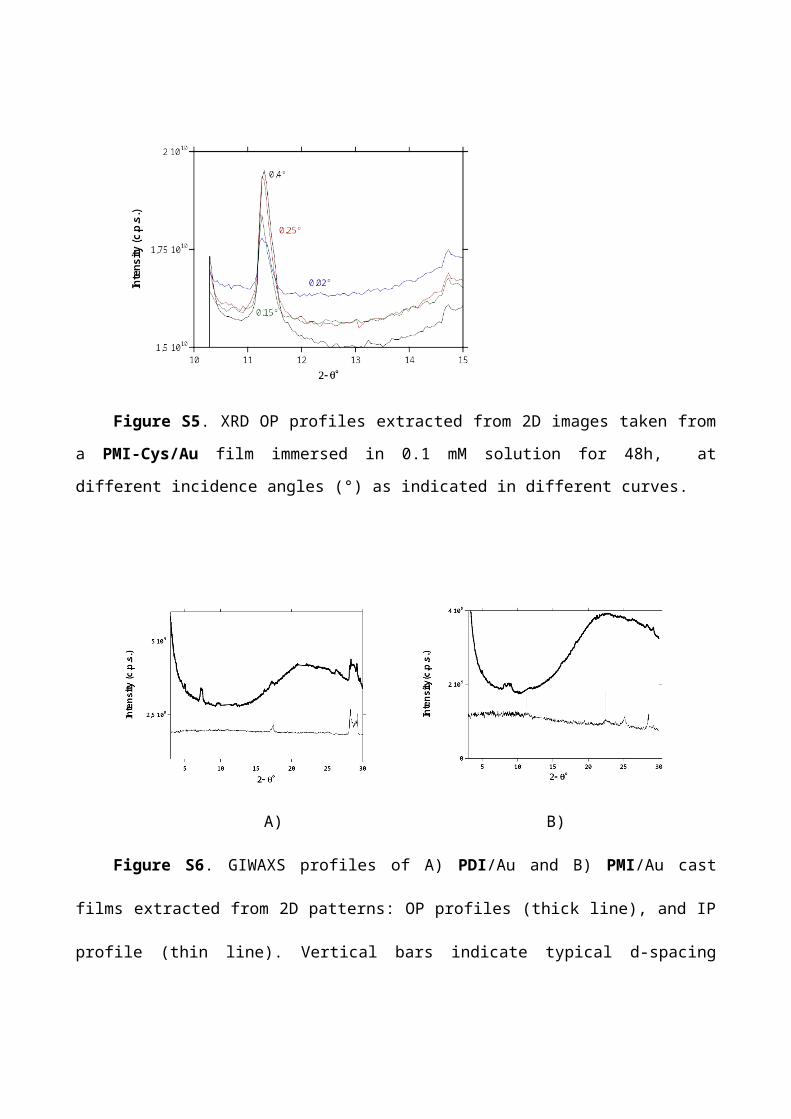
Figure S5. XRD OP profiles extracted from 2D images taken from a PMI-Cys/Au film
immersed in 0.1 mM solution for 48h, at different incidence angles (°) as indicated in different
curves.
A) B)
Figure S6. GIWAXS profiles of A) PDI/Au and B) PMI/Au cast films extracted from 2D
patterns: OP profiles (thick line), and IP profile (thin line). Vertical bars indicate typical d-spacing
denoting molecular packing (see text). High angle peaks (25°-27° 2-theta) are attributed to the
substrate impurities.
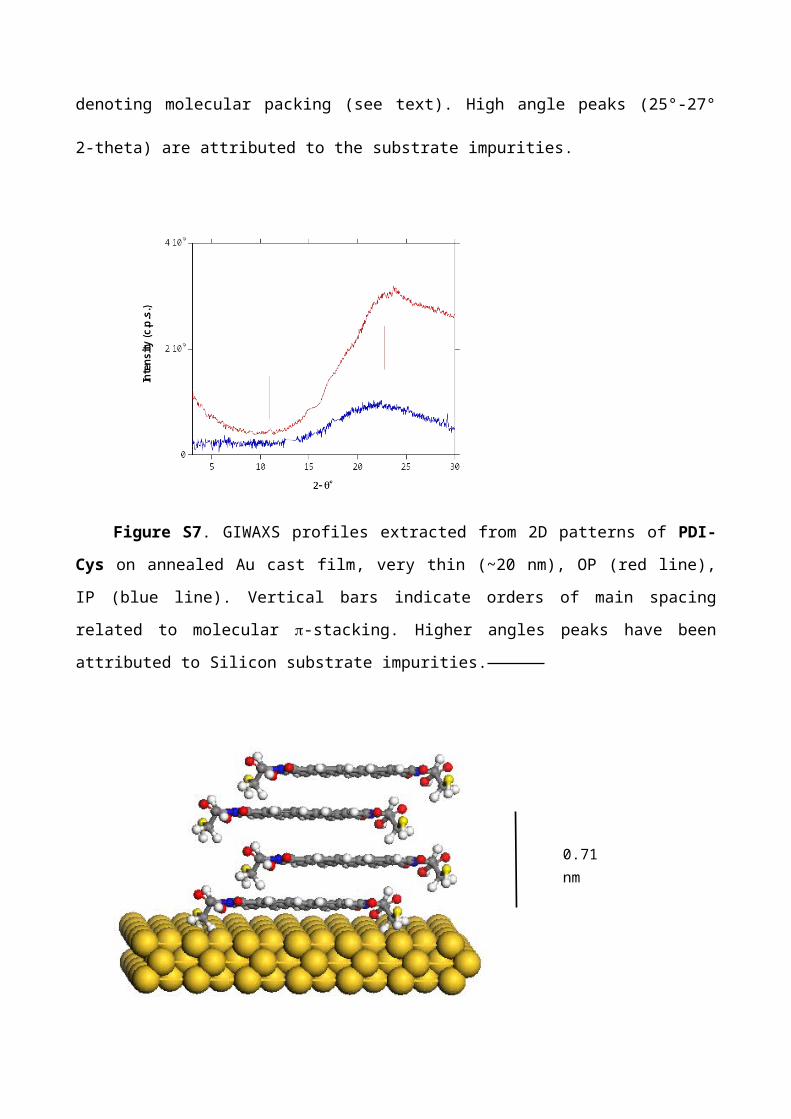
Figure S7. GIWAXS profiles extracted from 2D patterns of PDI-Cys on annealed Au cast film,
very thin (~20 nm), OP (red line), IP (blue line). Vertical bars indicate orders of main spacing
related to molecular -stacking. Higher angles peaks have been attributed to Silicon substrate
impurities.
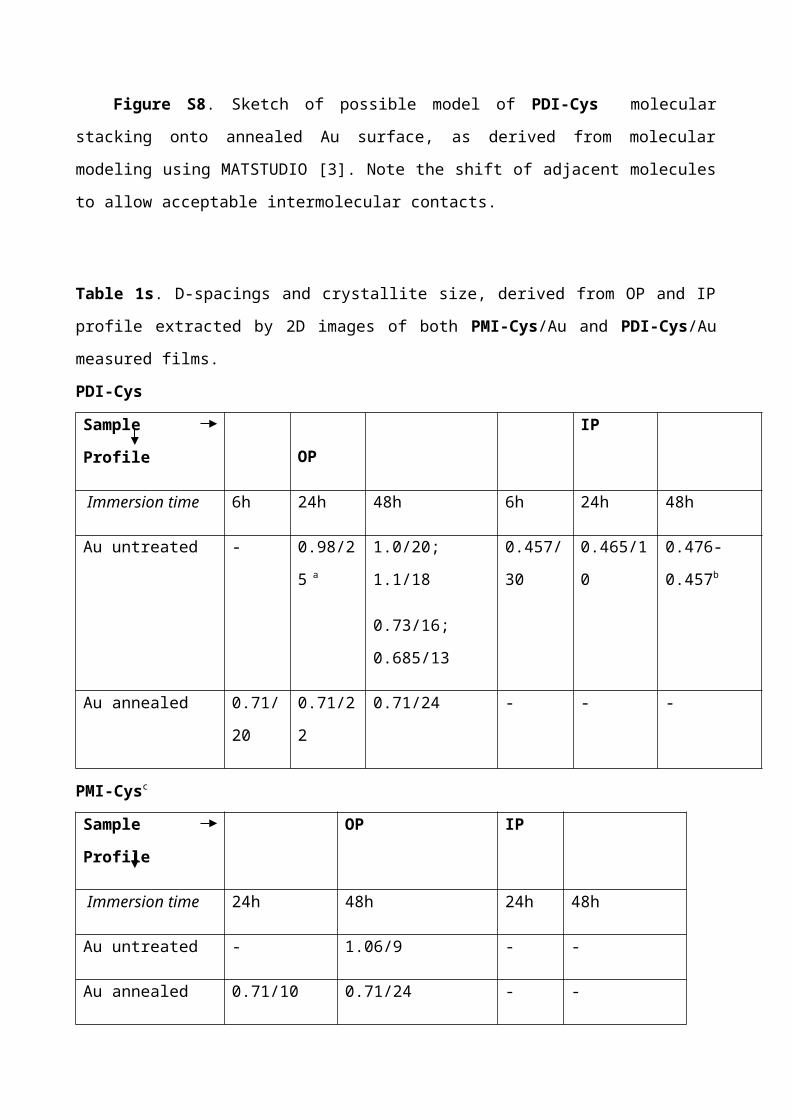
Figure S8. Sketch of possible model of PDI-Cys molecular stacking onto annealed Au surface,
as derived from molecular modeling using MATSTUDIO [3]. Note the shift of adjacent molecules to
allow acceptable intermolecular contacts.
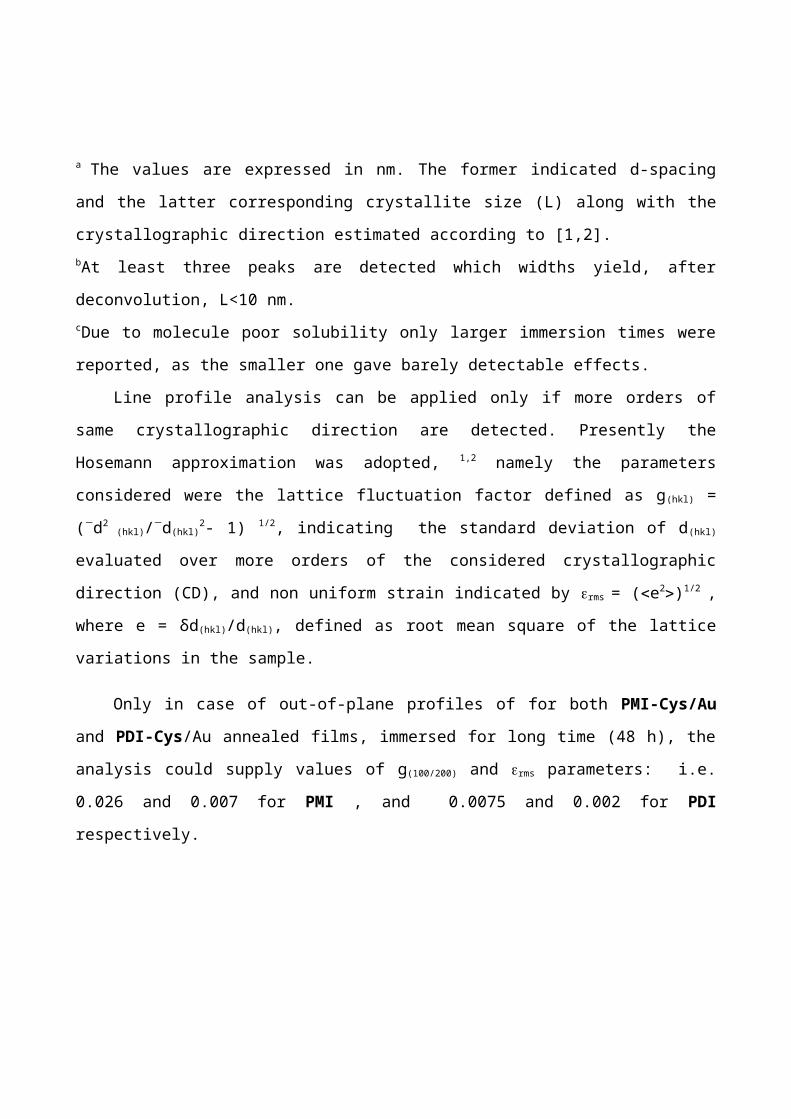
Table 1s. D-spacings and crystallite size, derived from OP and IP profile extracted by 2D images of
both PMI-Cys/Au and PDI-Cys/Au measured films.
PDI-Cys
Sample Profile
OP
IP
Immersion time 6h 24h 48h 6h 24h 48h
Au untreated - 0.98/25 a 1.0/20; 1.1/18
0.73/16; 0.685/13
0.457/30 0.465/10 0.476- 0.457b
Au annealed 0.71/20 0.71/22 0.71/24 - - -
0.71 nm
PMI-Cysc
Sample Profile OP IP
Immersion time 24h 48h 24h 48h
Au untreated - 1.06/9 - -
Au annealed 0.71/10 0.71/24 - -
a The values are expressed in nm. The former indicated d-spacing and the latter corresponding
crystallite size (L) along with the crystallographic direction estimated according to [1,2]. bAt least three peaks are detected which widths yield, after deconvolution, L<10 nm. cDue to molecule poor solubility only larger immersion times were reported, as the smaller one
gave barely detectable effects.
Line profile analysis can be applied only if more orders of same crystallographic direction are
detected. Presently the Hosemann approximation was adopted, 1,2 namely the parameters
considered were the lattice fluctuation factor defined as g(hkl) = (d2 (hkl)/d(hkl)
2- 1) 1/2, indicating the
standard deviation of d(hkl) evaluated over more orders of the considered crystallographic direction
(CD), and non uniform strain indicated by rms = (e2)1/2 , where e = δd(hkl)/d(hkl), defined as root
mean square of the lattice variations in the sample.
Only in case of out-of-plane profiles of for both PMI-Cys/Au and PDI-Cys/Au annealed films,
immersed for long time (48 h), the analysis could supply values of g(100/200) and rms parameters: i.e.
0.026 and 0.007 for PMI , and 0.0075 and 0.002 for PDI respectively.
REFERENCES
[1] A. M. Hindeleh, R. Hosemann, Microparacrystals – the intermediate stage between crystalline
and amorphous. J. Mater. Sci. 1991, 19 , 5127–36 and ref. therein.
[2] S. Enzo, G. Fagherazzi, A. Benedetti, S. Polizzi , A profile-fitting procedure for analysis of
broadened X-ray-diffraction peaks. 1. Methodology, J. Appl. Cryst. 1988, 21, 536–540.
[3] MATSTUDIO modeling release 4.0, Accelrys Inc. 9685 Scranton Rd. San Diego CA (USA) 2003
(www.accelrys.com).