ars.els-cdn.com · web viewsupplementary materials. comparative analysis of separation...
TRANSCRIPT

SUPPLEMENTARY MATERIALS
Comparative analysis of separation technologies for processing CO2
rich natural gas in ultra-deepwater oil fields
Ofélia de Queiroz Fernandes Araújo*1, Alessandra de Carvalho Reis, José Luiz de Medeiros
Chemical Engineering Department, Federal University of Rio de Janeiro
Email: [email protected], [email protected], [email protected]
Jailton Ferreira do Nascimento, Wilson Mantovani Grava, Ana Paula Santana Musse
CENPES - PETROBRAS
Emails: [email protected], [email protected], [email protected]
APPENDIX A. Design and Capacity Data of Ultra-Deepwater FPSOsTable A1.
APPENDIX B. Process Flowsheets as Simulated in ASPEN-HYSYSFigures B1, B2, B3, B4, B5 and B6.
APPENDIX C. Process Equipment Data and DimensioningFigures C1, C2, C3, C4 and C5.
APPENDIX D. Formulae for Operational ExpendituresTable D1, Eq. (D1), Eq. (D2)
1 Corresponding author. Email address: [email protected] (Ofelia Araujo). Tel.: +55(21)3938-7637.

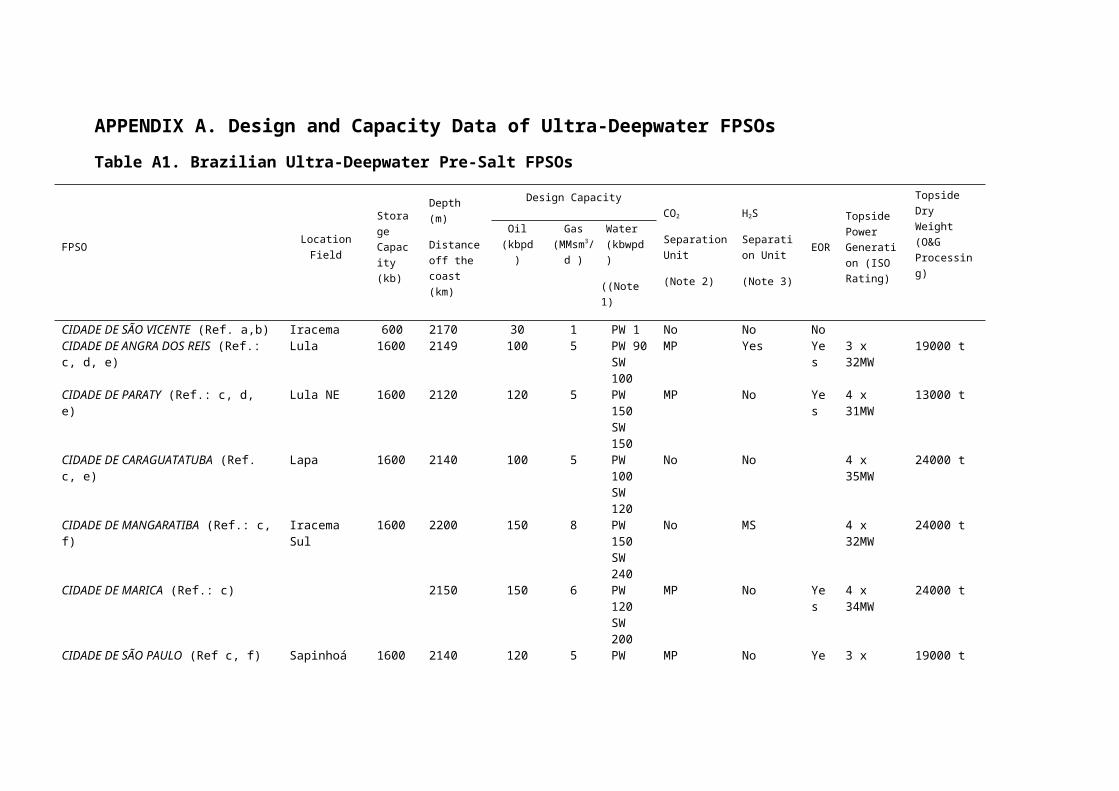
APPENDIX A. Design and Capacity Data of Ultra-Deepwater FPSOs
Table A1. Brazilian Ultra-Deepwater Pre-Salt FPSOs
FPSO Location FieldStorage Capacity (kb)
Depth (m)
Distance off the coast (km)
Design Capacity CO2
Separation Unit
(Note 2)
H2S
Separation Unit
(Note 3)
EOR
Topside Power Generation (ISO Rating)
Topside Dry Weight (O&G Processing)Oil
(kbpd)Gas
(MMsm3/d )
Water (kbwpd)
((Note 1)
CIDADE DE SÃO VICENTE (Ref. a,b) Iracema 600 2170 30 1 PW 1 No No NoCIDADE DE ANGRA DOS REIS (Ref.: c, d, e)
Lula 1600 2149 100 5 PW 90SW 100
MP Yes Yes 3 x 32MW 19000 t
CIDADE DE PARATY (Ref.: c, d, e) Lula NE 1600 2120 120 5 PW 150SW 150
MP No Yes 4 x 31MW 13000 t
CIDADE DE CARAGUATATUBA (Ref. c, e)
Lapa 1600 2140 100 5 PW 100 SW 120
No No 4 x 35MW 24000 t
CIDADE DE MANGARATIBA (Ref.: c, f) Iracema Sul 1600 2200 150 8 PW 150 SW 240
No MS 4 x 32MW 24000 t
CIDADE DE MARICA (Ref.: c) 2150 150 6 PW 120SW 200
MP No Yes 4 x 34MW 24000 t
CIDADE DE SÃO PAULO (Ref c, f) Sapinhoá 1600 2140 120 5 PW 120SW 150
MP No Yes 3 x 33MW 19000 t
CIDADE DE ITAGUAI (Ref. c, h) Iracema Norte 1600 2240 150 8 PW 150SW 264
No MS 4 x 32 MW 24000 t
CIDADE DE ILHABELA (Ref.: c) Sapinhoá 1600 2140 150 6 PW MP Yes Yes 4 x 34 MW 24000 t
(310 km off the coast)
120SW 180
CIDADE DE SAQUAREMA (Ref. c, e) Lula 1600 2150 150 6 PW 120SW 200
MP No Yes 4 x 34 MW 24000 t
CIDADE DE MARICÁ (Ref. c, e) Sapinhoá North
1600 2120 150 6 PW 120SW 200
MP No Yes 4 x 34 MW 24000 t
P-66 (Standard FPSO) (Ref., c) Lula South 2188(304 km off the coast)
150 7 PW 120SW 180
MP No Yes 4 x 31 MW 19000 t
P-67 (Standard FPSO): FPSO Lula Norte (Ref., c)
Lula North 2170(250 km off the coast)
150 7 PW 120SW 180
MP No Yes 4 x 31 MW 19000 t
P-68 (Standard FPSO): FPSO Lula Extremo Sul (Ref., c)
Iara Horst 2500 150 7 PW 120SW 180
MP No Yes 4 x 31 MW 19000 t
P-69 (Standard FPSO): FPSO Atapu Norte (Ref., c)
Lula West 2500 150 7 PW 120SW 180
MP No Yes 4 x 31 MW 19000 t
P-70 (Standard FPSO): FPSO Atapu Sul (Ref., c)
Lula Extreme South, Transfer of Right Tupi South
2500 150 7 PW 120SW 180
MP No Yes 4 x 31 MW 19000 t
P-71 (Standard FPSO): FPSO Berbigão (Ref., c)
Iara NW 2500 150 7 PW 120SW 180
MP No Yes 4 x 31 MW 19000 t
P-72 (Standard FPSO): FPSO Itaipu (Ref., c)
Transfer of Right Tupi NE
2500 150 7 PW 120SW 180
MP No Yes 4 x 31 MW 19000 t
P-73 (Standard FPSO): Transfer of 2500 150 7 PW MP No Yes 4 x 31 MW 19000 t

FPSO Búzios 6 (Ref., c) Right Entorno de Iara
120SW 180
P-74 (Transfer of Rights) FPSO Búzios 1 (Ref. c, g)
Buzios I 2500 150 7 PW 150SW 200
MP MS Yes 4 x 31 MW 22000 t
P-75 (Transfer of Rights) FPSO Búzios 2 (Ref. c, g)
Búzios II 2500 150 7 PW 150SW 200
MP No Yes 4 x 31 MW 22000 t
P-76 (Transfer of Rights) FPSO Búzios 3 (Ref. c, g)
Búzios III 2500 150 7 PW 150SW 200
MP MS Yes 4 x 31 MW 22000 t
P-77 (Transfer of Rights): FPSO Búzios 4(Ref. c, g)
Búzios IV 2500 150 7 PW 150SW 200
MP MS Yes 4 x 31 MW 22000 t
Note 1: PW=Produced Water, SW=Treated Seawater for Injection; Note 2: MP = Membrane Permeation; Note 3: MS = Molecular SieveSources:(a) http://abarrelfull.wikidot.com/cidade-de-sao-vicente-fpso; (b) http://www.inocean.no/fpso-success(c) Andrade, A.M.T., Vaz, C.E.M., Ribeiro, J., Lopreato, L.G.R., Nascimento, R.F.S. Offshore production units for Pre-salt projects. OTC-25691-MS. Offshore Technology Conference, Houston, USA, 2015.(d) http://www.sbmoffshore.com/wp-content/uploads/2013/07/FPSO_CIDADE_DE_PARATY_Petrobras_Brazil.pdf (e) http://subseaiq.com/data/PrintProject.aspx?project_id=274(f) http://www.modec.com/fps/fpso_fso/projects/(g) http://www.petrobras.com.br/fatos-e-dados/encomendas-a-estaleiros-carta-ao-valor-pro.htm(h) http://www.petrobras.com.br/fatos-e-dados/navio-plataforma-cidade-de-itaguai-chega-ao-brasil-para-integracao-de-modulos.htm

APPENDIX B. Process Flowsheets as Simulated in ASPEN-HYSYS
Figure B1. Process Flowsheet for MP Alternative for CO2 Removal from NG
Figure B2. Process Flowsheet for PA with PC Alternative for CO2 Removal from NG

Figure B3. Process Flowsheet for CA with MDEA-PZ Alternative for CO2 Removal from NG
Figure B4. Process Flowsheet for PA+MP Alternative for CO2 Removal from NG
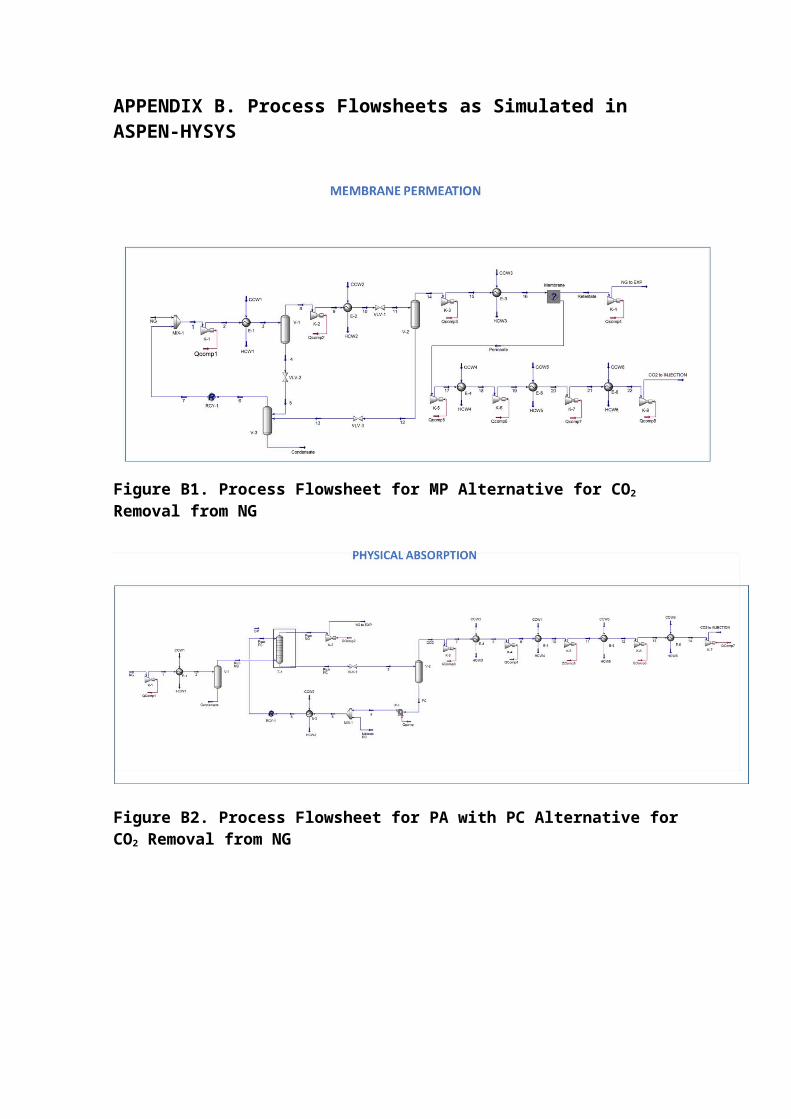
Figure B5. Process Flowsheet for CA+MP Alternative for CO2 Removal from NG
Figure B6. Process Flowsheet for MP+MP Alternative for CO2 Removal from NG

APPENDIX C. Process Equipment Data and Dimensioning
Table C1. Overall Heat Transfer Coefficient for Several Types of Heat Exchangers
Type of heat exchangerU (W/m2K)
Minimum
Maximum
Average
Water Coolers
Gas (< 3.5 Mpa) 200 285 242.5
Gas (3.5 - 7 Mpa) 285 455 370.0
Gas (> 7 Mpa) 455 570 512.5
MEA 740 850 795.0
Water Condensers
Amine Regenerator 570 625 597.5
Reboilers
Vapor 795 910 852.5
Others
MEA - MEA 680 740 710.0
Source: Campbell. John M. Gas Conditioning and Processing. USA: Campbell Petroleum Series. 1992. 7th Edition.
P.S.: MEA values were used for MDEA.

Table C2. Equipment Dimensioning – CA Process
Equipment D (m) H (m) Maximum Pressure (bar) Area (m2) Power (kW)
V-1 2.3 9.1 50
Separator 3.9 15.6 4.5
V-100 1.6 6.5 11.5
V-101 1.2 4.9 35.5Lean/Rich Exchanger 4.5 4630.2
E-1 50.5 2090.9
E-3 12 306.1
E-4 36 190.4
E-5 100 263.7
E-100 50.5 3998.8
Reboiler 4 1716.8
Condenser 4 600.5
Booster Pump 1905.5
K-1 14078.4
K-2 7107.4
K-3 3002.6
K-4 3035.3
K-5 2427.7
K-6 1439.6Absorber 2.3 13.2 50
Regenerator 4.0 13.2 4

Table C3. Equipment Dimensioning – PC Process
Equipment D (m) H (m) Maximum Pressure (bar) Area (m2) Power (kW)
V-1 1.53 9.08 50
V-2 4.80 19.19 1
E-1 50.5 2091.1
E-2 50.5 272.9
E-3 4 698.4
E-4 12 460.6
E-5 36 257.0
E-6 100 275.5
P-1 3812.84
K-1 14078.16
K-2 5261.75
K-3 8012.39
K-4 7164.01
K-5 6622.62
K-6 5648.52
K-7 5029.38
T-1 2.01 6.61 50
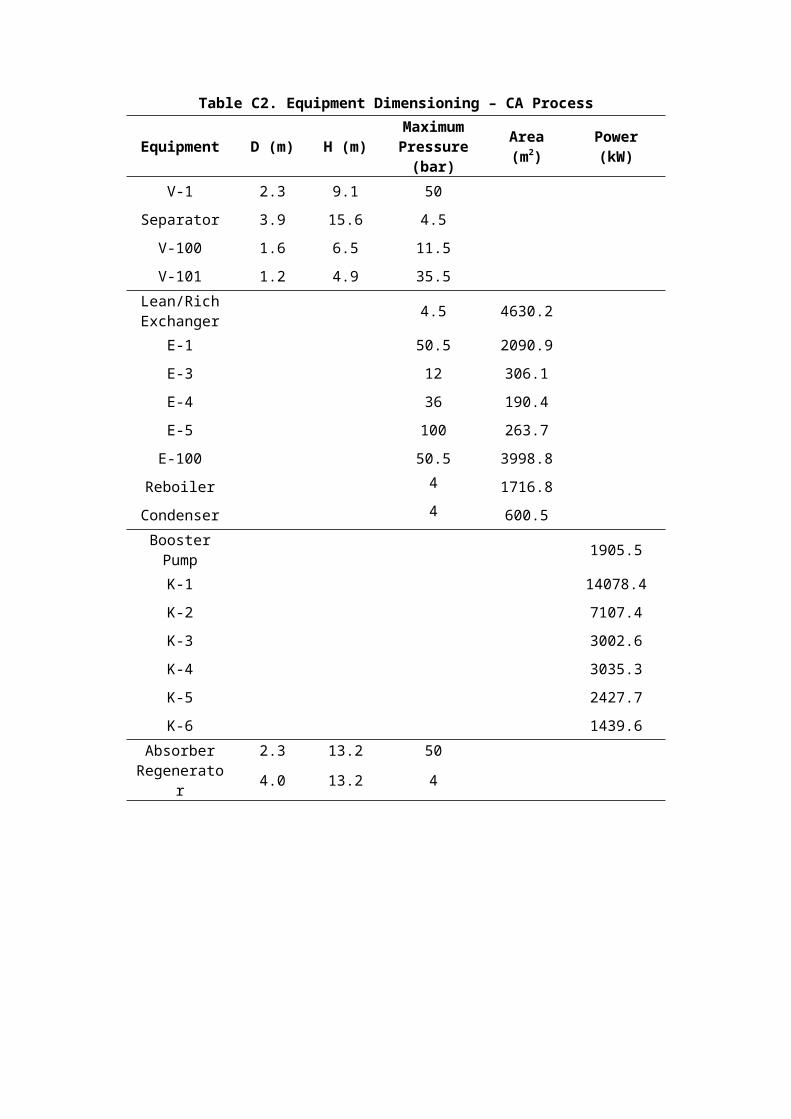
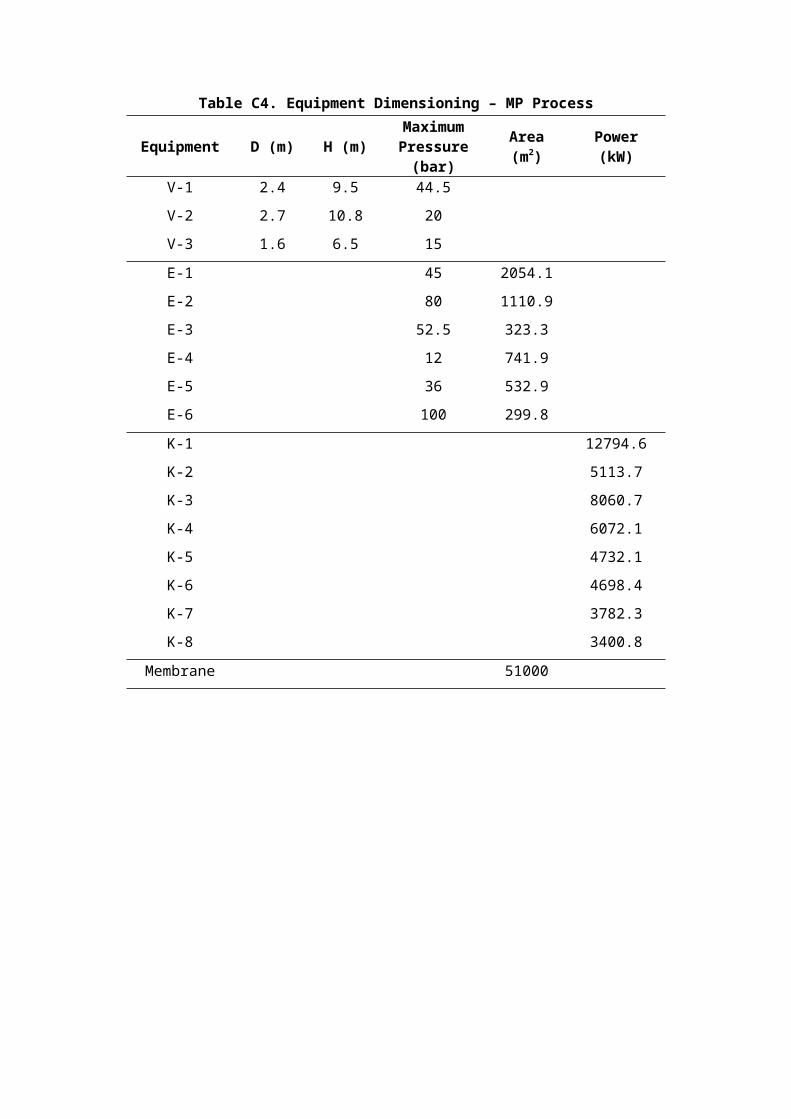
Table C4. Equipment Dimensioning – MP Process
Equipment D (m) H (m) Maximum Pressure (bar) Area (m2) Power (kW)
V-1 2.4 9.5 44.5
V-2 2.7 10.8 20
V-3 1.6 6.5 15
E-1 45 2054.1
E-2 80 1110.9
E-3 52.5 323.3
E-4 12 741.9
E-5 36 532.9
E-6 100 299.8
K-1 12794.6
K-2 5113.7
K-3 8060.7
K-4 6072.1
K-5 4732.1
K-6 4698.4
K-7 3782.3
K-8 3400.8
Membrane 51000

Table C5. Equipment Dimensioning – CA+MP Process
Equipment D (m) H (m)Maximum Pressure
(bar)
Area (m2) Power (kW)
Separator 1.2 4.7 4.5
V-2 2.7 10.8 20
V-1-2 2.4 9.5 44.5
V-3 1.6 6.5 15
Lean/Rich
Exchanger4.5 264.9
E-3 12 414.2
E-4 36 266.3
E-5 100 257.7
E-100 50.5 23.6
E-1-2 45 2054.1
E-2 80 1110.9
E-3-2 52.5 323.3
Reboiler 4 46.5
Condenser 4 26.6
Booster Pump 52.1
K-2 6760.2
K-3 4552.0
K-4 4703.9
K-5 3925.3
K-6 3390.8
K-1-2 12794.6
K-2-2 5113.7
K-3-2 8060.7
Absorber 1.6 23.1 50
Regenerator 1 19.8 4
Membrane 45000
APPENDIX D. Formulae for Operational Expenditures
Operational Expenditures can be estimated by the method of Turton et al. (2009) via Eq.
(D1) with Table D1.
OPEX=F1∗CAPEXOffshore+F2∗COL+F3∗(C RM+CWT+CUT ) (D1)
Where CRM is the cost of raw materials, CWT is the cost for wastewater treatment and CUT is
the cost of utilities. The cost of labor (COL) is calculated according to the number of
workers estimated (NOP) following Eq. (D2) (Turton et al., 2009).
NOP=4 .5∗(6 . 29+31 .7∗P2+0.23∗NEQ )0 .5(D2)
Where P is the number of solid handling equipment and NEQ is the total number of items of
process equipment.
Table D1. Cost Factors Used in OPEX Formula (Eq. (D1))
Cost Factors Value
F1 0.18
F2 2.76
F3 1.23