arturo marroquín ríosconference.ifas.ufl.edu/citrus14/presentations/icbc 2014 wed pdf/am... ·...
TRANSCRIPT
Arturo Marroquín Ríos Clearwater Beach, Florida
September 17th, 2014

Facts about
MEXICO:

Population: 119,426,000 P
Surface: 1,964,380 Km2
Agricultural land: 53%
Lifespan Average: 74 years
“Country of youth” (54% of total popultation
under 30 years old)
…and in
terms of
economy?

Countries in: North America, Latin America
Europe, Asia-Pacific.
45
Source: Mexico Secretary of Economy

9.46 9.34 9.67 10.79
11.29 10.89 10.90 10.93 11.14
13.50 12.63 12.43
13.17 12.77 8.96
4.40
5.70
3.98
5.19
3.33
4.05 3.76
6.53
3.57
4.40 3.82 3.57
3.97
-
1.00
2.00
3.00
4.00
5.00
6.00
7.00
8.00
9.00
10.00
-
2.00
4.00
6.00
8.00
10.00
12.00
14.00
16.00
2000 2001 2002 2003 2004 2005 2006 2007 2008 2009 2010 2011 2012 2013
Infla
tio
n
Ex
ch
an
ge
ra
te
Peso - Dollar USA Inflation
GDPcomposition by sector
(%) Agricultural Industrial Services
India 17.4 25.8 56.8
China 10 43.9 46.1
Argentina 9.3 29.7 61
Brasil 5.5 26.4 68.1
Russia 4.2 37.5 58.3
Mexico 3.6 36.6 59.8
Spain 3.1 26.1 70.8
Italy 2 24.5 73.5
France 1.9 18.7 79.4
Canada 1.7 28.4 69.9
Japon 1.1 25.6 73.3
USA 1.1 20.5 78.4
Germany 0.8 30.1 69.1
Source: BANXICO (Mexican Central Bank)
Source: OECD

Meat and
Poultry,
35%
Animal
Feed,
31%
Fruits,
Vegetables
and
Processing
food,
27%
Fish and
Seafood,
4%
Tobacco,
3%
Source: INEGI and SIAP
People working in
the Agricultural sector (6.9M)
Source: INEGI and SIAP
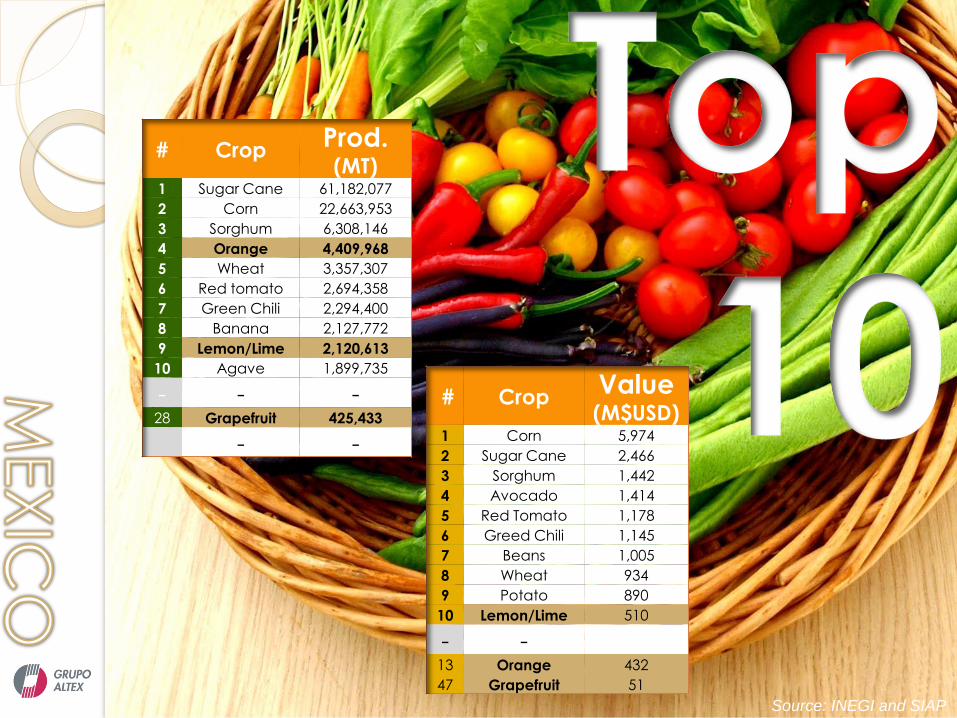
# Crop Prod. (MT)
1 Sugar Cane 61,182,077
2 Corn 22,663,953
3 Sorghum 6,308,146
4 Orange 4,409,968
5 Wheat 3,357,307
6 Red tomato 2,694,358
7 Green Chili 2,294,400
8 Banana 2,127,772
9 Lemon/Lime 2,120,613
10 Agave 1,899,735
- - - 28 Grapefruit 425,433
- -
# Crop Value (M$USD)
1 Corn 5,974
2 Sugar Cane 2,466
3 Sorghum 1,442
4 Avocado 1,414
5 Red Tomato 1,178
6 Greed Chili 1,145
7 Beans 1,005
8 Wheat 934
9 Potato 890
10 Lemon/Lime 510
- - 13 Orange 432
47 Grapefruit 51

Source: INEGI and SIAP
Infrastructure
Growth
Education
Security


World Citrus Production
Source: FAO
-
5
10
15
20
25
30M
MT
Orange Grapefruit
Tangerine Lemmon and Limes

Source: SAGARPA -SIAP
Veracruz
Michoacán
San Luis Potosí
Tamaulipas
Nuevo León
Puebla
Oaxaca
Colima
Sonora
Yucatán
Tabasco
Orange
64%
Lemon
and Limes
30%
Grapefruit
3%
Tangerine
3%
Citrus
producing
regions
Estado kHas %
Veracruz 216 43% Michoacán 43 9%
San Luis Potosí 40 8% Tamaulipas 36 7% Nuevo León 27 5%
Puebla 24 5% Oaxaca 20 4% Colima 19 4%
Yucatán 17 3%
Tabasco 15 3% Others 42 8%
Total 499.9 100% Source: SAGARPA - SIAP


Source: SAGARPA -SIAP
Veracruz
San Luis Potosí
Tamaulipas
Nuevo León
Puebla
86% is concentrated in 5 states.
…where the most important
OJ processors are located.
Total Production:
3.6 M MT
Total Surface area:
321 k ha.
Estado Thousands
of Has %
Veracruz 159 49%
Tamaulipas 30 17%
San Luis Potosí 38 9%
Nuevo León 25 7%
Puebla 20 5%
Others 48 15%
Total 321 100%

-
500,000
1,000,000
1,500,000
2,000,000
2,500,000
3,000,000
3,500,000
2009 2010 2011 2012 2013 2014 2015e
Veracruz Other States
Mexico’s orange production
in Veracruz state over
the last year
Source: ANAPROCI
MM
T o
f fr
uit
-
500,000
1,000,000
1,500,000
2,000,000
2,500,000
3,000,000
3,500,000
2009 2010 2011 2012 2013 2014 2015e
Veracruz Other States-
500,000
1,000,000
1,500,000
2,000,000
2,500,000
3,000,000
3,500,000
2009 2010 2011 2012 2013 2014 2015e
Veracruz Other States
2009 – 2014/15
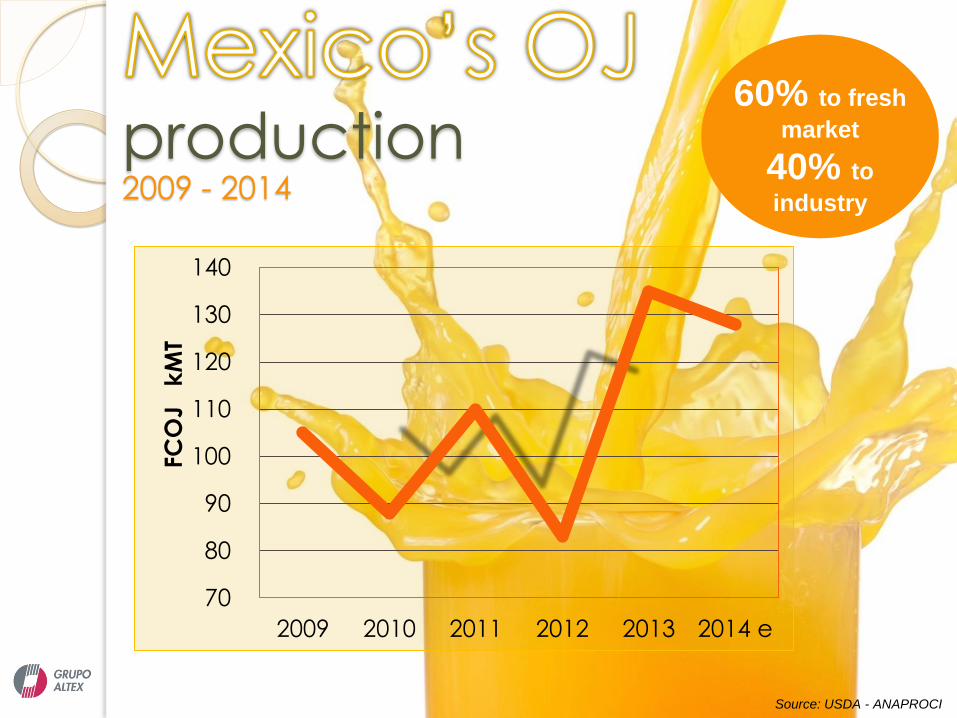
production 2009 - 2014
Source: USDA - ANAPROCI
60% to fresh
market
40% to
industry
70
80
90
100
110
120
130
140
2009 2010 2011 2012 2013 2014 e
FC
OJ k
MT

-
2
4
6
8
10
12
14
16
18
20
2009 2014
Fru
it
kM
T
+42%
Mexico’s OJ Installed Capacity
Stability
of orange
production (2.5 million MT)
but…
of
Installed
capacity
over the fruit

U.S. OJ Imports Mex Imports
Share 2005
17%
Mex Imports
Share 2013
31%
2005 –
Ju
n2014
1.3% 9.1%
-
100,000
200,000
300,000
400,000
500,000
2005 2006 2007 2008 2009 2010 2011 2012 2013 2014 Jul
México
Others
Belize
Costa Rica
Brazil
Source: U.S. Department of Commerce

Source: Altex
Jan Feb Mar Apr May Jun Jul Aug Sep Oct Nov Dec
Orange
Limes
Lemon
Grapefruit
Tangerine

Image at: gardeningblog.net

China
15% India
15%
Argentina
9%
Brazil
8%
USA
5%
Turkey
5%
Spain
4%
Iran
4%
Italy
2%
Egypt
2% Others
17%
Lemon & Lime
Source: FAO
production

Export
18%
Domestic
58%
Industry
24%
Persian
Lime
42%
Key
Lime
54%
Italian
4%
State k Ha. %
Michoacán 39 26%
Veracruz 39 26%
Colima 19 12%
Oaxaca 15 10%
Tabasco 7 5%
Guerrero 7 5%
Yucatán 5 3%
Tamaulipas 4 2%
Others 15 10%
Total 150 100%
Total Production:
2.12 M MT
Total Surface area:
150 k ha.
Concentrated in:
8 states
Processing (after Argentina)
Source: USDA - SIAP

Guerrero
Colima
Oaxaca
Michoacán
2% Export
78% Domestic
20% Industry
54% of mexican Lemon and
Lime production
lime
Source: USDA - SIAP

Veracruz
Jalisco
Oaxaca
Yucatán
Tabasco
Puebla
40% Export
30% Domestic
30% Industry
42% of mexican Lemon and
Lime production
lime
Source: USDA - SIAP
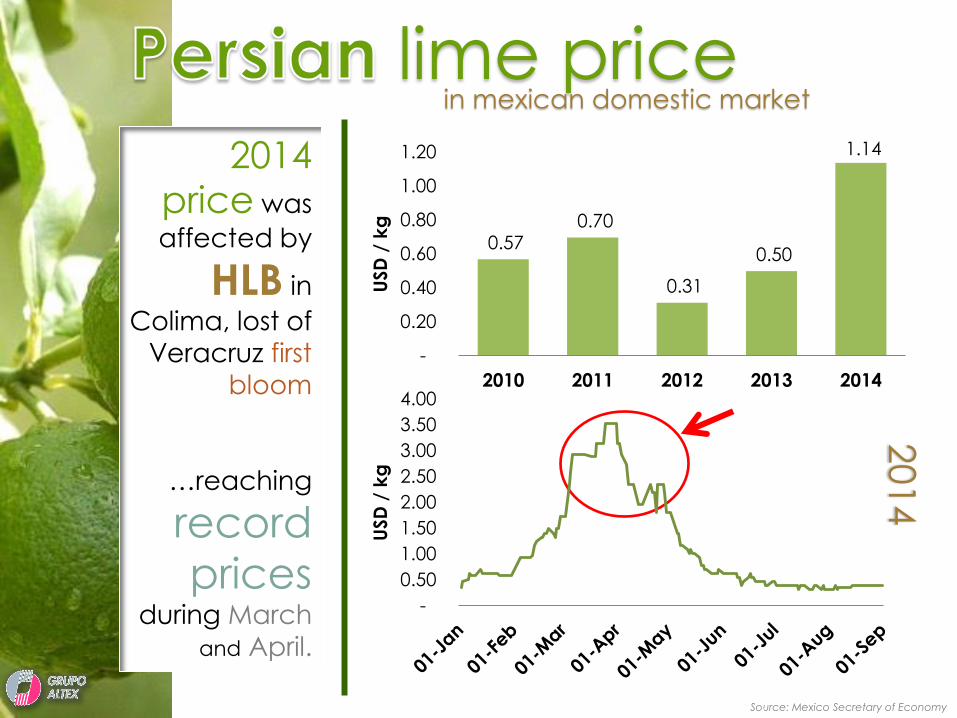
Source: Mexico Secretary of Economy
0.57 0.70
0.31
0.50
1.14
-
0.20
0.40
0.60
0.80
1.00
1.20
2010 2011 2012 2013 2014U
SD
/ k
g
-
0.50
1.00
1.50
2.00
2.50
3.00
3.50
4.00U
SD
/ k
g
lime price in mexican domestic market
2014
2014
price was
affected by
HLB in
Colima, lost of
Veracruz first bloom
…reaching
record
prices
during March
and April.
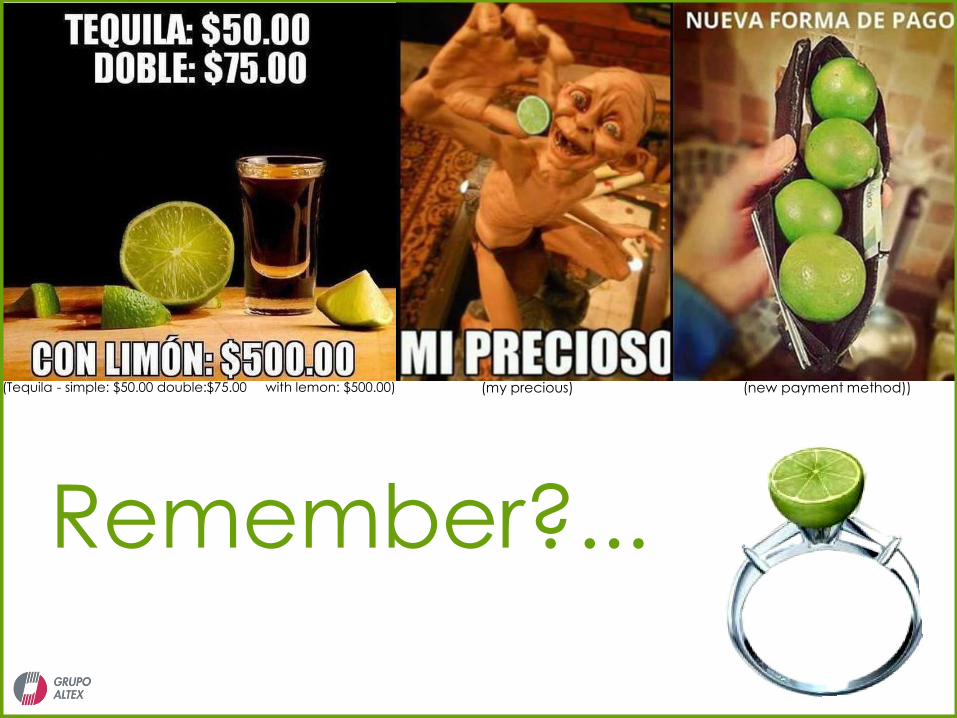
Remember?...
(my precious) (new payment method)) (Tequila - simple: $50.00 double:$75.00 with lemon: $500.00)

0
100,000
200,000
300,000
400,000
500,000
600,000
700,000
2007 2008 2009 2010 2011 2012
TM Evolución de Producción de Limón en México por Estado 2007 - 2012
COLIMA MICHOACAN VERACRUZ OAXACA
Even though Colima’s production of limes decreased by 30% during the last 6 years, other states like Veracruz, Michoacán &
Oaxaca made up the difference.
Mexican Lime production
Source: SIAP -SAGARPA

San Luis Potosí
Colima
Tamaulipas
Yucatán
Italian
38% Export
2% Domestic
60% Industry
4% of mexican Lemon and
Lime production
lemon
Source: USDA - SIAP

… unfortunately we also have
,
this is the current status:

Source: SAGARPA / SENASICA (2014)

2009 2010 2011 2012 2013 2014
HLB Psyllid
Chronology of Detections
Source: SAGARPA / SENASICA

Veracruz
Tamaulipas
Nuevo León
San Luis Potosí
4 major orange production
states are officially free of
HLB…
… there are only positive psyllids…


Sour orange rootstock
Temperatures up to 100 °F
Low
density plantation
Orange groves
mixed with other
citrus crops.
(more natural enemies)

Mayas
NOTE: We’re open to any suggestions.


Small farmers MT/ha.
Competencies
Integration
Productivity
Profitability
Quality of life
Food Safety
(Between 5 - 10 ha)
INCREASE YIELD.
Very low
compared to
Brasil & Florida
HLB
Mature
Trees
69%
Actual Plantation
Rate must increase ( )

What is
doing?

2. Financing
3. Value chain integration
“Altex’s
Entrepreneur Farmers model”
1.- Human, technical and
entrepreneurial training
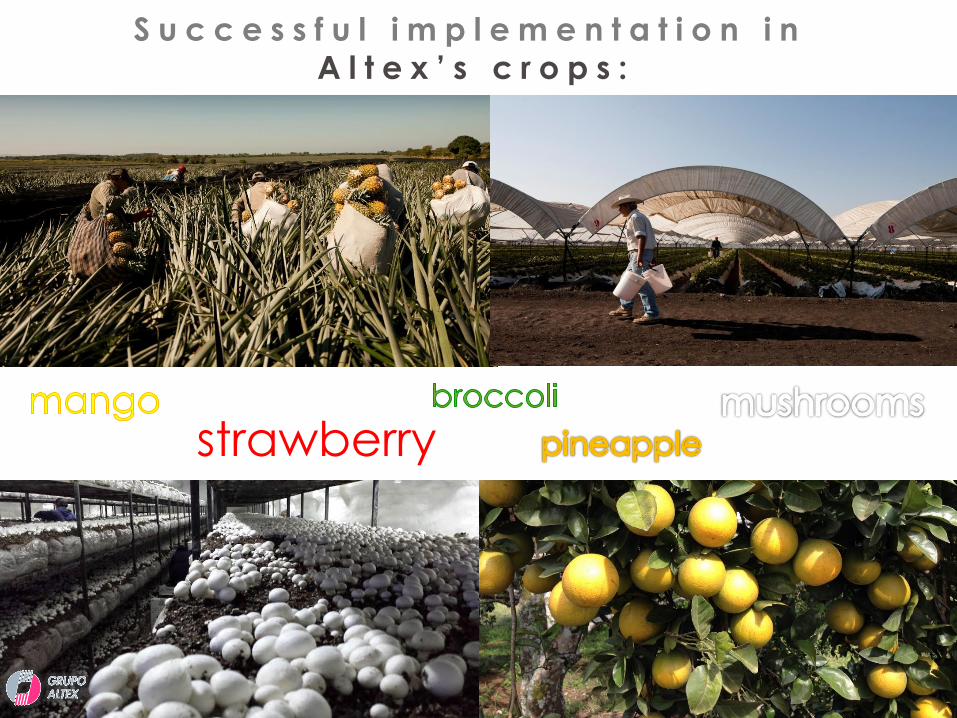
strawberry
S u c c e s s f u l i m p l e m e n t a t i o n i n
A l t e x ’ s c r o p s :

Clearwater Beach, Florida September 17th, 2014
NOTE: The images and photographs you see in this presentation (taken from searches on Printerest®, Google Chrome® and others, are not meant for commercial purposes.