arvi monitoring brings more efficiency in waste collection and recycling of materials, serkkola...
TRANSCRIPT

Monitoring brings moreefficiency in wastecollection and recycling of materials
16 01 2017
Sakari Oikarinen, Tietomitta OyAri Serkkola, Aalto University

16 01 2017
Ari Serkkola, Aalto UniversitySakari Oikarinen, Tietomitta Oy
Gate-to-gate approach in monitoring serviceresearch and planning

Why monitoring of waste management is needed?
• Promotes source sorting of waste in properties, organizations and enterprises
• Makes waste collection more effective
• Points out costs of waste management and makes them transparent
• Cuts down stress of environment


Pick-upindicators
Transportindicators
Unload(Load)
indicators
Natural resources Industrial resources
Waste-as-resource
Gate 1 Gate 2
Waste flow monitoring

Weigh-in data collection in real time monitoring
• Bin or container has an identification ID code (RFID Radio Frequency IDentification).
• Reader identity ID and data is transferred to TCS (Transport Control System) in truck.
• Data transfers wirelessly to waste management server (IT company e.g. Tietomitta) and to our msard-cloud service (www.msard.com).
• Weight and other reference data is analyzed, and reported in real time to producers and waste management companies.
• Communicates over an HTTP resource API (REST API).

Real time reporting architecture

Pilot towns in Finland
1. Helsinki: Mixed waste in Laajasalosuburb
2. Kotka: Biowaste in Kotka region
3. Turku: Mixed waste in Turku region
4. Forssa: Security paper waste in Southern Finland
5. Vaasa: Digital consignment note

16 01 2017
Ari Serkkola, Aalto UniversitySakari Oikarinen, Tietomitta Oy
Waste monitoring indicators and applications for producers

Indicators for households and other waste producers
Indicator issue Indicator type Description of indicatorProducer of waste Amount Amount of waste fraction (kg) per
container type when emptying (week, month, year)
Fulfilment procent Weight (kg) per container litres x capacity weight (kg)
Utilization rate Weight of the waste fraction compared to other fractions
Costs Costs of waste kg per occupant inone month and year.
Etc.

Waste monitoring reporting for producers

Waste monitoring reporting for producers

Waste monitoring reporting for producers

16 01 2017
Ari Serkkola, Aalto UniversitySakari Oikarinen, Tietomitta Oy
Waste monitoring indicators and applications for transportation

Indicators for transportationIndicator issue Indicator type Describtion of indicatorTransportation of waste Amount Amount of waste fraction (kg) in
unloading container (day, week, month, year)
Route area Weight of the waste fraction in the routing area (day, week, month, year)
Productivity of customer Number of bins, distance, weight per collection costs
Costs Kilometers per costsKilometers per waste amounts
Percentage of driving empty Driving distances without a load / total driving distances x 100
Etc.

Productivity of customer

Kotka pilot: Biowaste collection and monitoring in Kymenlaakso Jäte Oy
Indicator issue Indicator type Description of indicatorBiowaste management Mass Number of container pickups in
time series
Amount of biowaste (kg) percontainer when emptying
Weight based billing Transportation and processingcosts per weight > bill
Etc.


Cost of biowaste Unit Calculation Price
Jätemaksu
Average weight of biowaste bin
Weight of biowaste in oneyear
Average cost
Weight based billing
0,240 m3 × 145 kg/m3 = 35 kg
35 kg/vko × 52 vko = 1820 kg
1000 kg = 88 €
1,820 t × 8,8 €/kg = 160,16 Tyhjennyskerta 240 l bin 2,91 € × 52 vko = 151,31
Vuokra 240 l bin 1,5 €/kk × 12 €/kk = 18,00
Yhteensä 329,47

Forssa pilot: Security paper collecting and monitoring in Loimi-Häme JätehuoltoOy &Tietomitta
Indicator issue Indicator type Description of indicatorTransportation of waste Order, customer count Shortest routes
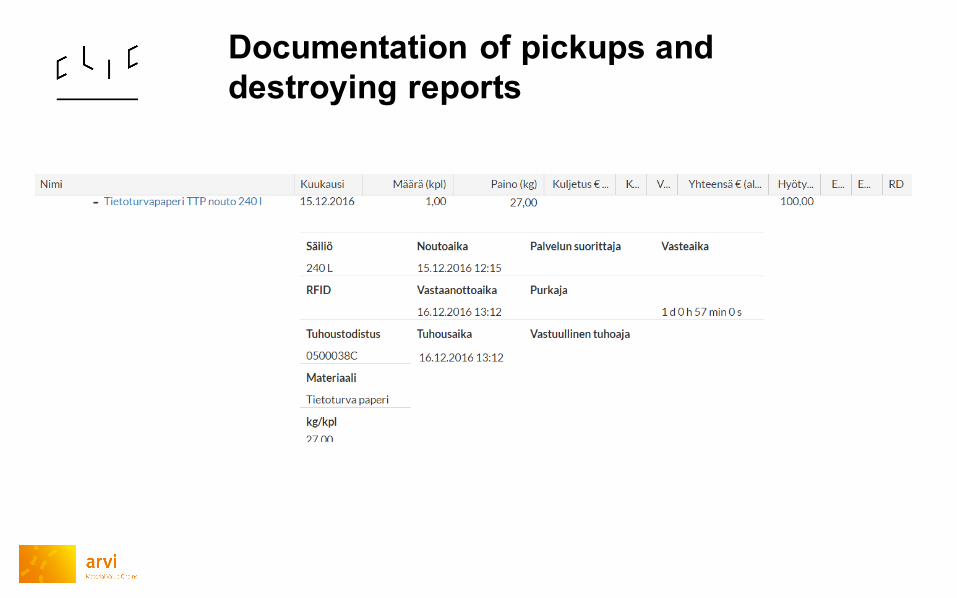
Documentation of pickups and destroying reports
Pickup time, kg, destroy time, costs, list of previous bins
Statistics Diagrams of time, kg, cost
Options Can be used also in case of: hazardous waste, medicine wasteand electronic waste.

1 2
34
Documentation of pickups and destroying reports

Documentation of pickups and destroying reports

16 01 2017
Ari Serkkola, Aalto UniversitySakari Oikarinen, Tietomitta Oy
Spatial indicators and analytics based on monitoring data

Objectives
To study spatial indicators based on:1. the utilization of (open) public
data – big data2. state-of-the art mathematical
analytics methods (e.g. neurocomputing, deep learning)
3. integrated analysis with other tools (e.g. LCA, mass and energy balance computations)
Resulting spatial outputs:
• Trends, type profiles, scaled quantities
• Classification and comparison information (between areas and waste producers)
• Forecasts
HarriNiska, University of Eastern Finland

Pilot Helsinki Laajasalo: Mixed waste collection in HSY
Weight data (kg) in monitored containers
+ Socioeconomic grid database (Statistics Finland) (250 x 250 m)

Pilot Helsinki Laajasalo: Spatial indicators based on external data
Waste generation in different regions• Generation (kg) per household, per capita (eur), per
built area (m2), etc.Efficiency of waste management in different regions• Fullness rates (%) of containers• Transportation distances (km), costs (euro) and
emissions (CO2) per quantity (kg)

Other spatial modellingExample: biogas production modellingCombining spatial waste monitoring data with energy and emission balance calculations (e.g. Huopana et al. 2013)
Model
Iisalmi
Siilinjärvi
Kiuruvesi
Leppävirta
Suonenjoki
Vuorela
PielavesiLapinlahti
JuankoskiNilsiäKeitele
Rautalampi
Tahkovuori
Varpaisjärvi
Karttula
Maaninka
Varkaus
Kuopio
5
10
15
20
25
Sludges
Biowaste
Biogas energy potential inside the radius of 15 km, GWh/year
Iisalmi
Siilinjärvi
Kiuruvesi
Leppävirta
Suonenjoki
Vuorela
Pielavesi
Lapinlahti
Juankoski
NilsiäKeitele
Rautalampi
Tahkovuori
Varpaisjärvi
Karttula
Maaninka
Varkaus
Kuopio
1.
2
4
6
8
10
12
14
16
18GWh/year
Monitoring data
Lapinlahti
Kuopio
Optimization
Enables the finding of optimal production sites (in terms of costs, emissions, energy efficiency) Can be used to define most feasible local waste management operations

16 01 2017
Ari Serkkola, Aalto UniversitySakari Oikarinen, Tietomitta Oy
Monitoring utilities for stakeholders
Utilities for waste producers
• New monitoring information improves sorting by producers.
• Optimizes right container size and emptying schedule in apartment houses.
• Peaks in the produced waste can be followed per real estate.
• Cost visibility encourages to plan more efficient waste points.
• Lost food in biowaste will degree 15 percent with monitoring feedback (Lisa Dahlén et.al 2010).

Utilities for waste collection and transportation
• Evaluates tranportation cost per kg, km, day and route.
• Helps to plan pick-up and transport routes
• Reports number of emptied / not emptied containers in routes
• Reports average weights of routing area
• It is easier to forecast the number of trucks needed during theseasons
• Applicates weight based billing
• Evaluates fuel consumption and emissions in routes and seasons

Utilities of spatial analysis for decisionmakers
• Identifies housing companies, housing estates and regions, where waste amount are different compared to other estates.
• Identifies explanatory factors, which cause differences (e.g. building type, socioeconomic status, waste management services, etc.)
• Points out environmental effects spatially (driving kilometerscompared to produced energy versus emissions; smell of landfill spatially; effluent of polluted water or soil)

“Measured waste is recycled knowledge”
Ari Serkkola Sakari Oikarinen
[email protected] [email protected]
0407514350 02077805507
16 01 2017