assessing potential bias in population level research...
TRANSCRIPT
Assessing Potential Bias in Population Level
Research with Aboriginal Children:
Literature Review, Psychometric, and
Administration Report
Submitted To:
Debbie Jeffrey
First Nations Education Steering Committee
#113 – 100 Park Royal South
West Vancouver, BC, Canada, V6T 1Z3
Prepared By:
Directions Evidence and Policy Research Group, LLP
510 West Hastings Street, Suite #803
Vancouver, BC, Canada, V6B 1L8
January 16, 2016
Table of Contents
ACKNOWLEDGMENTS ........................................................................................................................ 3
THE EARLY DEVELOPMENT INSTRUMENT (EDI).................................................................................... 4
EXECUTIVE SUMMARY ....................................................................................................................... 5 LITERATURE REVIEW ...................................................................................................................................... 5 TEST VALIDATION AND BIAS ............................................................................................................................ 7 ADMINISTRATION OF THE EDI IN BRITISH COLUMBIA ........................................................................................... 7 IS THERE BIAS IN THE ADMINISTRATION OF THE EDI? ........................................................................................... 8
INTRODUCTION ................................................................................................................................. 9
LITERATURE REVIEW ........................................................................................................................ 11 BIAS IN THE INSTRUMENT .............................................................................................................................. 13 BIAS IN THE IMPLEMENTATION OF THE INSTRUMENT ......................................................................................... 15 CONCLUSIONS TO BE DRAWN FROM THE LITERATURE ......................................................................................... 16
TEST VALIDATION AND BIAS ............................................................................................................. 16 METHOD .................................................................................................................................................... 16
The EDI ................................................................................................................................................ 16 Data source ......................................................................................................................................... 17 Psychometric analyses ....................................................................................................................... 17 Dimensionality analysis ..................................................................................................................... 17 Scale-Level Bias: Multi-Group Exploratory Factor Analysis (MG-EFA) ............................................. 18 Item-Level Bias: Differential Item Functioning (DIF) ......................................................................... 18
RESULTS ..................................................................................................................................................... 19 Dimensionality analysis ..................................................................................................................... 19 Scale-Level Bias: Multi-Group Factor Analysis .................................................................................. 19 Item-Level Bias: Differential Item Functioning .................................................................................. 24
DISCUSSION ................................................................................................................................................ 30
ADMINISTRATION OF THE EDI IN BRITISH COLUMBIA ........................................................................ 31 OUTREACH TO PARENTS, TEACHERS AND PRINCIPALS ......................................................................................... 31 ASSESSOR TRAINING .................................................................................................................................... 32 DELIVERY OF THE ASSESSMENT ...................................................................................................................... 33 REPORTING ON RESULTS ............................................................................................................................... 34
IS THERE BIAS IN THE ADMINISTRATION OF THE EDI? ........................................................................ 36 EXPERIMENT ............................................................................................................................................... 36 RESULTS ..................................................................................................................................................... 37
CONCLUSION ................................................................................................................................... 42
REFERENCES .................................................................................................................................... 44

Assessing Potential Bias in Population Level Research With Aboriginal Children: Literature Review, Psychometric, and Administration Report
Directions Evidence and Policy Research Group, LLP 3
Acknowledgments
Great thanks are to be extended to the staff at the Human Early Learning Partnership (HELP) and the
First Nations Education Steering Committee (FNESC) for their participation and support through the
preparation of this report.

Assessing Potential Bias in Population Level Research With Aboriginal Children: Literature Review, Psychometric, and Administration Report
Directions Evidence and Policy Research Group, LLP 4
The Early Development Instrument (EDI)
How was it intended to be used?
The Early Development Instrument was implemented to establish an understanding of BC children’s developmental readiness, to highlight differences in children’s development across neighbourhoods, and to assess how well communities are doing in supporting young children and families.
How has it been used?
Since 2000, all school districts have implemented the EDI, reaching over 95 percent of kindergarten children in BC. This has allowed the province to establish a baseline for early child development for five-year-olds.
Over the past ten years, the Province and communities have used EDI data to guide the development, implementation, and improvement of policies, programs, services and community initiatives. Examples include early literacy programs, neighbourhood drop-in centres, parent education programs, and new vision and hearing screening programs.
How is the EDI used currently?
The Ministry of Children and Family Development plans to use EDI data to help inform work associated with the implementation of Early Years Strategy initiatives such as the Early Years Centres and the Child Care Major Capital Program. The EDI helps identify areas of greatest need.
The Province continues to use EDI data to guide the development, implementation, and evaluation of policies, programs, and community initiatives.
Information provided by the British Columbia Ministries of Child and Family Development, Education, and Health

Assessing Potential Bias in Population Level Research With Aboriginal Children: Literature Review, Psychometric, and Administration Report
Directions Evidence and Policy Research Group, LLP 5
Executive Summary
The Early Development Instrument (EDI) is a tool for assessing and monitoring the state of early
childhood development within communities. To be informative and useful to communities, any
population monitoring tool must provide valid and reliable data that is free of bias. Aboriginal children
tend to receive lower EDI scores than their non-Aboriginal peers (Janus, 2002; Lapointe et al., 2007:
McTurk et al., 2008). A number of researchers and stakeholders have suggested that this result reflects a
bias against Aboriginal children within the EDI, and argue that EDI scores underestimate the true abilities
of Aboriginal children (Walton, 2007).
In response to concerns about the validity and potential bias of the EDI for use with Aboriginal children,
the First Nations Education Steering Committee commissioned an independent assessment of the EDI.
This report details the findings of a review of the literature, psychometrics, and administrative
procedures regarding the EDI with respect to Aboriginal children, and of an experimental simulation of
the EDI assessment.
Literature Review
Aboriginal students struggle in the current school system and many reports about Aboriginal learning
have concluded that the school system systematically discriminates against Aboriginal students and is
biased against their educational achievement (e.g., Battiste & McLean, 2005; Canadian Council on
Learning, 2007; Minister’s National Working Group on Education, 2002; Royal Commission on Aboriginal
Peoples, 1996). Low EDI scores may represent a very early instance of the bias that operates against
Aboriginal students in a school system that is not well prepared to support their learning and that
presents barriers to their success throughout their academic careers.
Several potential sources of EDI bias against Aboriginal children have been discussed in the literature.
The EDI consists of a checklist that is completed by kindergarten teachers after they have observed and
interacted with their students for several months. Thus, if the EDI is biased, the bias may reside in
teachers’ subjective assessments of students or in the instrument itself—or both.
Potential sources of bias can be found in the assumptions about early childhood development and
school readiness that underlie the EDI but that are not universal. Behaviours, knowledge, and skills
associated with school readiness and high EDI scores may not be valued and fostered among children in
all cultures (Li, D’Angiulli & Kendall, 2007).
Teachers’ expectations present another potential source of bias. Teachers often have lower
expectations for Aboriginal students than for their non-Aboriginal peers (Riley & Ungerleider, 2012).
Lowered expectations may bias teachers’ appraisals of Aboriginal students and introduce bias into their
EDI scoring practices.
Assessing Potential Bias in Population Level Research With Aboriginal Children: Literature Review, Psychometric, and Administration Report
Directions Evidence and Policy Research Group, LLP 6
Low Aboriginal EDI scores may alternatively reflect other factors relevant to school readiness, including:
poverty; oppression and marginalization that impede healthy child development; and the legacy of
residential schooling.
To investigate the potential for bias against Aboriginal children in the EDI, researchers have analyzed the
structure and functioning of the instrument. Guhn, Gadermann and Zumbo (2007) examined whether
the EDI measures school readiness in the same way for both Aboriginal and non-Aboriginal children,
using differential item functioning (DIF). If some of the EDI items are biased against Aboriginal children
then this bias should be revealed by a DIF analysis. The analysis conducted by Guhn and colleagues did
not reveal any evidence of bias. Silburn, Brinkman, Ferguson-Hill, Styles, Walker and Shepherd (2009)
conducted a similar analysis of the Australian adaptation of the EDI: they found that most items
functioned similarly for Indigenous and non-Indigenous children, but for two items non-Indigenous
children scored higher than Indigenous children with similar domain scores.
Muhajarine, Puchala and Janus (2011) examined the equivalence of the EDI for Aboriginal and non-
Aboriginal children at the subdomain level. They analyzed EDI results for 2,468 kindergarteners (388
Aboriginal, 2080 non-Aboriginal) and found that the specific subdomains in which each group was rated
as having challenges were the same for Aboriginal and non-Aboriginal children.
Janus (2002, unpublished) compared EDI scores with other assessments of children’s abilities and found
some differences in the functioning of the EDI for Aboriginal and non-Aboriginal children. Non-verbal
cognitive test showed stronger correlations with the EDI in the Aboriginal group while correlations in the
non-Aboriginal group were very weak. Janus also observed that parental ratings of behaviour were
generally not correlated with EDI scores for Aboriginal children, while parental ratings generally were
correlated with EDI scores for non-Aboriginal children.
To assess bias in the implementation of the EDI—rather than in the instrument itself— Hertzman (2008,
unpublished) looked at two groups of Aboriginal children: one group of children was known to be
Aboriginal by their kindergarten teachers; the second group was later identified as Aboriginal in their
Ministry of Education records but were not known to be Aboriginal by their kindergarten teachers.
Hertzman hypothesized that, if teachers are biased against Aboriginal children in their assignment of EDI
scores, then known Aboriginal children should receive lower EDI scores than unknown Aboriginal
children. The results indicated that known Aboriginal children did, in fact, receive lower EDI scores than
unknown Aboriginal children.
In another assessment of implementation bias, Silburn et al. (2009) examined Australian EDI (AEDI)
scores for Indigenous children under two different testing conditions: with and without an Indigenous
consultant assisting their teacher during AEDI scoring. Silburn and colleagues observed few differences,
indicating either that teachers are not biased in their scoring of Indigenous children or that the influence
of an Indigenous consultant does not attenuate any bias that exists.
Assessing Potential Bias in Population Level Research With Aboriginal Children: Literature Review, Psychometric, and Administration Report
Directions Evidence and Policy Research Group, LLP 7
In sum, the evidence regarding bias toward Aboriginal children in the EDI is mixed. The psychometric
evidence indicates that EDI items function similarly for Aboriginal and non-Aboriginal children, but one
unpublished study with a small sample does suggest that the EDI may measure different constructs for
Aboriginal and non-Aboriginal children. Similarly, the implementation research suggests—on the basis of
one unpublished study—that Aboriginal children may be assessed differently than non-Aboriginal
children.
Test Validation and Bias
Directions undertook an independent analysis of Waves 2 to 5 of EDI data to assess the possibility of bias
against Aboriginal children. The data were provided by the Human Early Learning Partnership (HELP) and
consisted of EDI scores from a total of 166,058 children in British Columbia.
To examine scale-level bias, Directions conducted a multi-group exploratory factor analysis. Results
revealed that a unidimensional (one-factor) model fits both the Aboriginal and the non-Aboriginal
groups, suggesting that the factor structure is the same for both groups. When the factor analyses were
run using the five domains on which the EDI scoring is currently based, the results were the same. In
other words, there is no difference in the factor structure between the two groups across all five
domains of the EDI.
To make group-level comparisons on the EDI scores between Aboriginal and non-Aboriginal children, the
establishment of strict invariance is recommended (Wu, Li, & Zumbo, 2007). Directions was not able to
demonstrate strict invariance at the scale level, suggesting that group-level comparisons of Aboriginal
and non-Aboriginal children should not be made.
To examine item-level bias, Directions conduct a DIF analysis and did not find any evidence that any of
the 103 EDI items function differently across Aboriginal and non-Aboriginal children.
Administration of the EDI in British Columbia
Directions reviewed the efforts currently made to support Aboriginal children during the administration
of the EDI in British Columbia, including:
Outreach to parents, teachers and principals;
Assessor training;
Delivery of the assessment; and
Reporting on the results.
Based on this review, Directions developed the following recommendations to improve the
implementation process and avoid potential bias:
Provide targeted outreach to Aboriginal families, including a brief Q&A answering concerns
specifically raised by Aboriginal organizations;
Provide Indigenous Cultural Competency Training to teachers who administer the EDI;

Assessing Potential Bias in Population Level Research With Aboriginal Children: Literature Review, Psychometric, and Administration Report
Directions Evidence and Policy Research Group, LLP 8
Provide additional information in the EDI Guide so that cultural considerations are taken into
account where appropriate;
Support ongoing in-service and professional development related to Aboriginal education for all
teachers;
Pilot the use of an Indigenous Cultural Consultant to co-deliver the EDI with the kindergarten
teacher when administering the assessment for self-identified Aboriginal children;
The HELP team could offer working sessions with Aboriginal communities and school districts to
support the development of learning supports specific to Aboriginal children;
The HELP team should work with FNESC to develop templates for presenting the EDI findings to
Aboriginal families; and
HELP should work with FNESC to clearly identify the rules for releasing Aboriginal-specific data.
Is there bias in the administration of the EDI?
To examine whether there is bias in the administration of the EDI, Directions conducted simulations of
the implementation of the EDI. Teachers watched videos of children and were asked to assess them
using the EDI. It was critical that, for some teachers, the children in the videos were labelled as
Aboriginal, but for other teachers, the same children in the same videos were not be labelled as
Aboriginal. If children receive similar EDI scores whether they are labelled as Aboriginal or not, then we
would infer that there is no discernible implementation bias.
The results of the simulation study did not show any consistent trends favouring either Aboriginal or
non-Aboriginal children and any observed differences were very small. In short, no implementation bias
was revealed by the simulation experiment.
While no bias was observed in this study of a small sample of teachers, it is important to note that this
does not constitute proof of the absence of bias among the wider population of teachers. The potential
for bias in the implementation of the instrument remains. For that reason, we believe there is merit in
considering the recommendations made earlier in this report concerning the preparation that teachers
receive regarding the implementation of the Early Development Instrument.

Assessing Potential Bias in Population Level Research With Aboriginal Children: Literature Review, Psychometric, and Administration Report
Directions Evidence and Policy Research Group, LLP 9
Introduction
The Early Development Instrument (EDI) is a tool for assessing and monitoring the state of early
childhood development within communities. It was developed to measure school readiness among
populations of children and to inform communities about the level of vulnerability among cohorts of
children entering the K-12 system. The instrument is based on a definition of school readiness as the
ability to meet the demands of schooling in a Canadian context—such as listening to teachers and co-
operating with instructions—and to benefit from the learning opportunities available at school (Janus et
al., 2007). School readiness is associated with behavioural, social, and academic outcomes (Doherty,
2007; Forget-Dubois et al., 2007; Pulkkinen & Tremblay, 1992; Sandford, Offord, McLeod, Boyle, Byrne &
Hall, 1994), so fostering high levels of school readiness among their children is a valuable investment for
communities. The goal of the EDI is to inform communities in their efforts to improve school readiness
among their children.
The EDI is used in the vast majority of communities across Canada.1 In British Columbia, researchers at
the Human Early Learning Partnership (HELP) have implemented the EDI in classrooms across the
province. HELP researchers make EDI data publicly available in order to increase public awareness of the
importance of early child development and to help communities to mobilize their resources to support
vulnerable children and their families. As a result, school districts have become involved in community
coalitions to plan and implement new early childhood development programs. BC’s provincial
government has funded innovative child development projects and has extended the mandate of
education to include children from birth to age five. Many communities that have implemented early
childhood development programs in response to low EDI scores have seen improved scores suggesting a
reduced level of vulnerability among their children (Mort, Hughes, Dockendorf, Quigg & Hertzman,
2008).
To be informative and useful to communities, any population monitoring tool must provide valid and
reliable data that is free of bias. The validity and reliability of the EDI have been extensively tested and
are well-documented (Janus & Offord, 2000; 2007; Janus & Duku, 2007; Forget-Dubois et al, 2007) but
there remain questions about the potential for bias in the instrument. In particular, Aboriginal children
tend to receive lower EDI scores than their non-Aboriginal peers (Janus, 2002; Lapointe et al., 2007:
McTurk et al., 2008). A number of researchers and stakeholders have suggested that this result reflects a
bias against Aboriginal children within the EDI, and argue that EDI scores underestimate the true abilities
of Aboriginal children (Walton, 2007).
In response to concerns about the validity and potential bias of the EDI for use with Aboriginal children,
the First Nations Education Steering Committee has commissioned an independent assessment of the
EDI to assess the possible location and potential effects of bias with respect to Aboriginal children in the
design, delivery, and interpretation of the EDI. This report constitutes the findings of a review of the
1 Full population level coverage has been implemented in British Columbia, Alberta, Saskatchewan, Manitoba,
Ontario, Quebec, New Brunswick, Prince Edward Island, Yukon, and the Northwest Territories. Partial coverage has been implemented in Nova Scotia, Newfoundland & Labrador, and Nunavut.
Assessing Potential Bias in Population Level Research With Aboriginal Children: Literature Review, Psychometric, and Administration Report
Directions Evidence and Policy Research Group, LLP 10
literature, psychometrics, and administrative procedures regarding the EDI with respect to Aboriginal
children. The literature review examines the available research on bias in the EDI with respect to
Aboriginal children, focusing on existing examinations of two potential sources of bias: the instrument
itself and the implementation of the instrument. These two sources of bias are more thoroughly
examined through an independent assessment of the psychometric properties of the instrument and
the administrative procedures. The psychometric analyses focus on examining the factor/measurement
structure of the EDI, and explore whether the EDI functions differently at an item- and scale-level for
Aboriginal and non-Aboriginal children. The review of the administrative guidelines for the EDI focuses
on whether there is sufficient information to alert teachers to the cultural subtleties affecting the
administration of the EDI to Aboriginal children.

Assessing Potential Bias in Population Level Research With Aboriginal Children: Literature Review, Psychometric, and Administration Report
Directions Evidence and Policy Research Group, LLP 11
Literature Review
The potential for bias against Aboriginal children within the EDI is a grave concern. Aboriginal students
struggle in the current school system. In BC, the Ministry of Education’s annual How Are We Doing
report clearly shows that, despite progress in recent years, Aboriginal students continue to lag behind
their non-Aboriginal peers. Aboriginal students achieve lower scores in the Foundation Skills Assessment
conducted in Grades 4 and 7; Aboriginal students achieve lower grades in provincial examinations; they
are less likely to enroll in the high school courses that are required for entry into post-secondary
programs; and they are less likely to complete high school (BC Ministry of Education, 2013). There are
many factors that contribute to the difficulties experienced by Aboriginal students (Congress of
Aboriginal Peoples, 2010), but many reports on Aboriginal learning have pointed to the racism and
discrimination experienced by Aboriginal students, and have concluded that the school system
systematically discriminates against Aboriginal students and is biased against their educational
achievement (e.g., Battiste & McLean, 2005; Canadian Council on Learning, 2007; Minister’s National
Working Group on Education, 2002; Royal Commission on Aboriginal Peoples, 1996). Low EDI scores may
represent an early indication that Aboriginal students are not well prepared for successful learning when
they start school. On the other hand, those low scores may represent a very early instance of the bias
that operates against Aboriginal students in a school system that is not well prepared to support their
learning and that will present barriers to their success throughout their academic careers.
Several potential sources of EDI bias against Aboriginal children have been discussed in the literature.
The EDI consists of a checklist that is completed by kindergarten teachers after they have observed and
interacted with their students for several weeks. Thus, if the EDI is biased, the bias may reside in
teachers’ subjective assessments of students or in the instrument itself—or both.
Potential sources of bias can be found in the assumptions about early childhood development and
school readiness that underlie the EDI but that are not universal. For example, in the Western cultural
context in which the EDI was developed, children are encouraged to be curious, to communicate openly,
and express their own needs. Their ability to do so is treated as a measure of their language and
communication skills and of their social competence. In other cultural contexts, children are expected to
show quiet respect in the presence of adults, to avoid asking too many questions, and to allow the
adults in their lives to clarify their needs for them (Li, D’Angiulli & Kendall, 2007). In the context of the
EDI, such behavior may be interpreted as demonstrating poor social and communication skills. Similarly,
the EDI was developed on the assumption that emerging literacy skills are valuable while opportunities
“to explore and connect with their natural environment in company of adult community members”
(Sam, 2011, p. 320) are not recognized as important. As well, the general knowledge that children are
expected to acquire by the time they start school can also vary from one context to another (Li et al.,
2007). Children who have acquired general knowledge that is not treated as valuable by the EDI and
who have not yet acquired knowledge that is treated as valuable will be scored as “vulnerable” in the
domain of general knowledge.
Assessing Potential Bias in Population Level Research With Aboriginal Children: Literature Review, Psychometric, and Administration Report
Directions Evidence and Policy Research Group, LLP 12
These cultural differences can introduce bias in two different ways. First, the items in the EDI may assess
skills or competencies that are valued and fostered in Western cultural contexts but not in other
contexts. As a result, some children may be thriving within their own contexts but could be assigned low
EDI scores in reference to skills or competencies that are not highly valued in those contexts.2 Second,
teachers implementing the EDI may fail to recognize skills and competencies when children manifest
them in culturally specific ways that do not match teachers’ expectations.
Teachers’ expectations present another potential source of bias. Riley and Ungerleider (2012) have
demonstrated (among a sample of teachers from BC) that teachers often have lower expectations for
Aboriginal students than for their non-Aboriginal peers—even when Aboriginal and non-Aboriginal
students have identical records of prior achievement. Low teacher expectations have been shown to
have a powerful effect on student outcomes—particularly for students from minority groups (Jussim &
Harber, 2005). The BC Auditor General’s 2015 report on the education of Aboriginal students in the BC
public school system noted that Aboriginal students are subject to “the racism of low expectations.”
Ministry staff, district staff, and members of Aboriginal communities reported that educators’ low
expectations for Aboriginal student success contribute to the persistent achievement gap between
Aboriginal and non-Aboriginal students. Data in the Ministry of Education’s annual How Are We Doing?
report on Aboriginal education reveals evidence of low expectations in the consistent
overrepresentation of Aboriginal students in non-academic courses and non-graduating pathways.
These trends are indicative of system-wide low expectations leading to persistent gaps between
Aboriginal and non-Aboriginal student outcomes. Similarly, lowered expectations can bias teachers’
appraisals of Aboriginal students and introduce bias into their EDI scoring practices.
These sources of bias may contribute to the finding that Aboriginal children often receive lower EDI
scores than their non-Aboriginal peers, but low Aboriginal EDI scores may also reflect other factors
relevant to school readiness. For example, socioeconomic status (SES) is a strong predictor of school
readiness (Beauvais & Jenson, 2003; Duncan & Magnuson, 2005). In Canada, Aboriginal children are
more likely than non-Aboriginal children to experience poverty: lower EDI scores would therefore be
expected among Aboriginal children even in the absence of bias.
A history of oppression and marginalization may also impede healthy child development and progress
toward school readiness. Marginalization may act as an obstacle for healthy child development among
Aboriginal children who must learn to balance two very different sets of cultural values, norms, and
strategies for communication and learning (Muhajarine et al., 2011). As well, in many Aboriginal
communities the legacy of residential schooling has left parents with negative attitudes toward
schooling—which may be passed on to their young children. Parents may also feel marginalized within
school settings, making it difficult for them to participate in or support their children’s learning and
preparation for school (Congress of Aboriginal Peoples, 2010).
2 It could be argued that this is not a bias but rather a true threat to the school readiness of children who will be
educated in a Western cultural context.

Assessing Potential Bias in Population Level Research With Aboriginal Children: Literature Review, Psychometric, and Administration Report
Directions Evidence and Policy Research Group, LLP 13
Very few studies have investigated the potential for bias against Aboriginal children in the EDI. Most of
these have searched for bias in the EDI by analyzing the structure and functioning of the instrument,
while a smaller number have searched for bias in the implementation of the EDI.
Bias in the Instrument
There are several different strategies for examining the structure and functioning of the EDI and the
potential for bias. One approach is to analyze the individual items that make up the EDI to determine if
any of them function differently for Aboriginal and non-Aboriginal children. If some of the items are
biased against Aboriginal children, then an item analysis should reveal that bias. Adopting this approach,
Guhn, Gadermannn and Zumbo (2007) examined whether the EDI measures school readiness in the
same way for both Aboriginal and non-Aboriginal children, using differential item functioning (DIF).
In a DIF analysis, items are shown to function differentially when children receive different scores on an
item even though they have similar levels of the underlying ability that the item is intended to measure
(i.e., children with similar overall scores differ systematically on particular items). If some of the EDI
items are biased against Aboriginal children then this bias should be revealed by a DIF analysis. The
analysis conducted by Guhn and colleagues did not reveal any evidence of bias. These findings suggest
that none of the individual items in the EDI were measurably biased against the Aboriginal children in
Guhn et al.’s sample.
Silburn, Brinkman, Ferguson-Hill, Styles, Walker and Shepherd (2009) examined the equivalence of the
Australian adaptation of the EDI for Indigenous and non-Indigenous children at the item level using a
differential item analysis. They found that most items functioned similarly for both groups, but for two
items (one in the communication & general knowledge domain and one in the emotional maturity
domain) non-Indigenous children scored higher than Indigenous children with similar domain scores.
Another approach is to examine EDI subdomains (groups of similar items) to determine whether
Aboriginal children receive low scores on different subdomains than do non-Aboriginal children.
Muhajarine, Puchala and Janus (2011) used this approach to examine the equivalence of the EDI for
Aboriginal and non-Aboriginal children at the subdomain level. The EDI is composed of five domains, and
these domains are subdivided into 16 subdomains (see for Table 1 details). Muhajarine and colleagues
hypothesized that bias against Aboriginal children could show up in the form of low scores on a specific
cluster of subdomains that differ from the subdomains in which non-Aboriginal children receive low
scores.
Assessing Potential Bias in Population Level Research With Aboriginal Children: Literature Review, Psychometric, and Administration Report
Directions Evidence and Policy Research Group, LLP 14
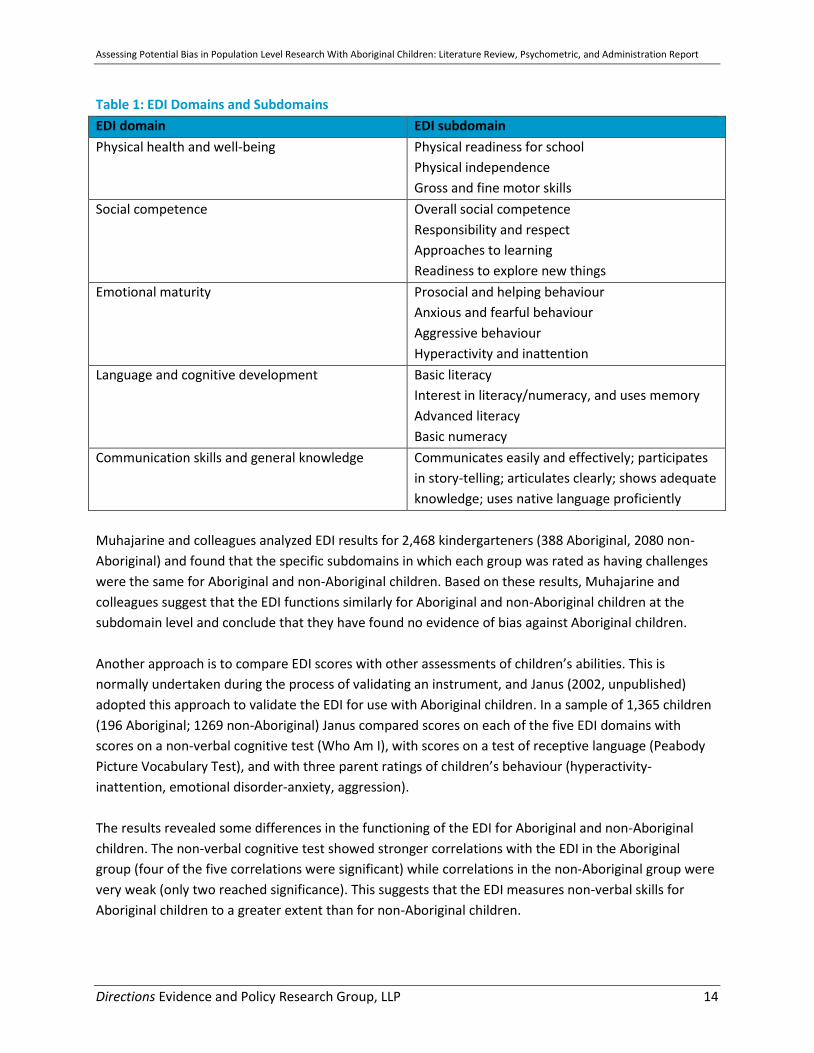
Table 1: EDI Domains and Subdomains
EDI domain EDI subdomain
Physical health and well-being Physical readiness for school
Physical independence
Gross and fine motor skills
Social competence Overall social competence
Responsibility and respect
Approaches to learning
Readiness to explore new things
Emotional maturity Prosocial and helping behaviour
Anxious and fearful behaviour
Aggressive behaviour
Hyperactivity and inattention
Language and cognitive development Basic literacy
Interest in literacy/numeracy, and uses memory
Advanced literacy
Basic numeracy
Communication skills and general knowledge Communicates easily and effectively; participates
in story-telling; articulates clearly; shows adequate
knowledge; uses native language proficiently
Muhajarine and colleagues analyzed EDI results for 2,468 kindergarteners (388 Aboriginal, 2080 non-
Aboriginal) and found that the specific subdomains in which each group was rated as having challenges
were the same for Aboriginal and non-Aboriginal children. Based on these results, Muhajarine and
colleagues suggest that the EDI functions similarly for Aboriginal and non-Aboriginal children at the
subdomain level and conclude that they have found no evidence of bias against Aboriginal children.
Another approach is to compare EDI scores with other assessments of children’s abilities. This is
normally undertaken during the process of validating an instrument, and Janus (2002, unpublished)
adopted this approach to validate the EDI for use with Aboriginal children. In a sample of 1,365 children
(196 Aboriginal; 1269 non-Aboriginal) Janus compared scores on each of the five EDI domains with
scores on a non-verbal cognitive test (Who Am I), with scores on a test of receptive language (Peabody
Picture Vocabulary Test), and with three parent ratings of children’s behaviour (hyperactivity-
inattention, emotional disorder-anxiety, aggression).
The results revealed some differences in the functioning of the EDI for Aboriginal and non-Aboriginal
children. The non-verbal cognitive test showed stronger correlations with the EDI in the Aboriginal
group (four of the five correlations were significant) while correlations in the non-Aboriginal group were
very weak (only two reached significance). This suggests that the EDI measures non-verbal skills for
Aboriginal children to a greater extent than for non-Aboriginal children.

Assessing Potential Bias in Population Level Research With Aboriginal Children: Literature Review, Psychometric, and Administration Report
Directions Evidence and Policy Research Group, LLP 15
Parent ratings of behaviour were generally not correlated with EDI scores for Aboriginal children (4 out
of 15 correlations reached significance), while parent ratings generally were correlated with EDI scores
for non-Aboriginal children (14 out of 15 correlations reached significance). This suggests that teachers
and parents perceive similar behaviours in non-Aboriginal children, while teachers and parents perceive
different behaviours in Aboriginal children. Overall, these results suggest that the EDI may not measure
children’s abilities in the same way for Aboriginal and non-Aboriginal children.
Bias in the Implementation of the Instrument
Only two studies on the implementation of the EDI are currently available. Hertzman (2008,
unpublished) looked at two groups of Aboriginal children: one group of children were known to be
Aboriginal by their kindergarten teachers; the second group were later identified as Aboriginal in their
Ministry of Education records but were not known to be Aboriginal by their kindergarten teachers.
Hertzman hypothesized that, if teachers are biased against Aboriginal children in their assignment of EDI
scores, then known Aboriginal children should receive lower EDI scores than unknown Aboriginal
children.
The results indicate that known Aboriginal children did, in fact, receive lower EDI scores than unknown
Aboriginal children. Hertzman conducted further analyses to determine whether the two groups of
Aboriginal children were equivalent—only if they were equivalent would the differences in EDI scores
represent clear evidence of bias. By comparing Foundation Skills Assessment (FSA) scores, Hertzman
determined that the two groups were not equivalent: unknown Aboriginal children achieved higher FSA
scores than known Aboriginal children. These findings indicate that the known and unknown Aboriginal
groups did not have equivalent skill levels by Grade 4 (when they completed the FSA), but it is unclear
whether they had equivalent skill levels in kindergarten and, therefore, remains unclear whether the
differences in EDI scores represent evidence of bias or of group differences.
Silburn et al. (2009) examined Australian EDI (AEDI) scores for Indigenous children under two different
testing conditions: with and without an Indigenous consultant assisting their teacher during AEDI
scoring. Silburn and colleagues hypothesized that, if teachers are biased against Indigenous children in
their AEDI scoring, then that bias should be attenuated when working with an Indigenous consultant and
Indigenous children should receive higher AEDI scores in the presence of an Indigenous consultant.
Overall, Silburn and colleagues found no differences in the AEDI scores of children with and without an
Indigenous consultant. A differential item analysis revealed that most items functioned similarly and
identified just two items (one in the social competence domain and one in the language and cognitive
development domain) on which children scored higher when their teacher worked with an Indigenous
consultant even though they had the same overall domain scores as children whose teacher did not
work with a consultant. These findings point to a very small effect and suggest either that teachers are
not biased in their scoring of Indigenous children or that the influence of an Indigenous consultant does
not attenuate any bias that exists.

Assessing Potential Bias in Population Level Research With Aboriginal Children: Literature Review, Psychometric, and Administration Report
Directions Evidence and Policy Research Group, LLP 16
Conclusions to be drawn from the Literature
The available evidence regarding bias toward Aboriginal children in the EDI is mixed. The psychometric
evidence indicates that the EDI items function similarly for Aboriginal and non-Aboriginal children, but
one unpublished study with a small sample (Janus, 2002) does suggest that the EDI may measure slightly
different constructs for Aboriginal and non-Aboriginal children. Similarly, the implementation research
suggests—on the basis of one unpublished study—that Aboriginal children may be assessed differently
than non-Aboriginal children. The evidence is not at all conclusive, but even suggestive evidence merits
concern and further investigations.
Test validation and bias
In the evaluation of the quality of a test or assessment instrument, measurement validity is fundamental
(AERA, APA, & NCME, 1999). Measurement validation is a process in which test developers,
measurement professionals, and practitioners work together to gather and evaluate the evidence to
support the appropriateness, meaningfulness, and usefulness of the decisions and inferences that can
be made from test and assessment scores (Zumbo, 2007; 2009; Zumbo & Chan, in press). The presence
of test bias is a threat to the measurement validity of an instrument.
Directions undertook an independent analysis of potential sources of bias in the instrument itself by
analyzing the results from a more extensive EDI dataset than had been previously analyzed (Guhn,
Gadermann & Zumbo, 2007 reviewed data up to 2007, while this analysis includes data up to 2013).
Directions conducted a series of psychometric analyses to examine whether the EDI functions differently
for Aboriginal and non-Aboriginal children. In other words, is the EDI performing in the same manner for
both Aboriginal and non-Aboriginal children? In psychometric terms, this is a measurement invariance
question. If the instrument does not function the same way for the two groups, this may constitute
evidence of test bias.
Method
The EDI
There are 103 items in the EDI instrument aimed at assessing children’s school readiness. In the
administration of the EDI, teachers are asked to rate their students on each of the 103 items, plus
additional items on the student demographics (e.g., Aboriginal status). The 103 items assess five
developmental domains (refer to Table 1), including Physical Health and Well-Being (13 items), Social
Competence (26 items), Emotional Maturity (30 items), Language and Cognitive Development (26
items), and Communication Skills and General Knowledge (8 items). The results obtained by the
individual students are aggregated and reported at the community or population level so that EDI score
inferences are made at a group level rather than the individual level.
Assessing Potential Bias in Population Level Research With Aboriginal Children: Literature Review, Psychometric, and Administration Report
Directions Evidence and Policy Research Group, LLP 17
A total score (ranging from 0 to 50) for the EDI instrument is generated by combining the five domain
scores. A separate score for each of the domains, ranging from 0 to 10, is also generated. In practice,
only the domain scores are reported and interpreted; the total score is only used in psychometric and
methodological research (Guhn, Gadermannn, & Zumbo, 2007).
Data source
The data were from Waves 2 to 5 of the EDI database provided by the Human Early Learning Partnership
(HELP) at the University of British Columbia (UBC). The four waves consisted of data from a total of
166,058 children in British Columbia. The age of the children ranged from 4.14 to 7.98 years, with a
mean age of 5.65 and a standard deviation of .30. About half of the children were girls (48.6%). Of the
166,058 children, 16,619 (10.01%) were identified Aboriginal.
Psychometric analyses
The psychometric analyses examined whether the EDI functioned differently for Aboriginal and non-
Aboriginal children (i.e., measurement invariance analyses) at both the scale- and item-level. We
examined both scale- and item-level bias. Multi-group exploratory factor analysis (MG-EFA) and Zumbo’s
(1999) ordinal logistic regression (OLR) approach to differential item functioning (DIF) analysis were used
to investigate scale-level and item-level measurement invariance of the EDI, respectively. We also
conducted exploratory factor analyses (EFA) to test the dimensionality (factor structure) of the EDI.
Dimensionality analysis
Before conducting the test bias analyses, we first established the factor or measurement structure of
the EDI. Dimensionality, or factor analysis, is a psychometric method of data reduction that summarizes
the data to make it easier to interpret. In a dimensionality analysis, items are analyzed to determine if
questions can be clustered together into coherent subgroups (i.e., do multiple questions group together
to measure a single underlying construct/concept or a few different constructs?), which forms the
measurement structure of a test (e.g., whether a test is a unidimensional or multidimensional test).
Understanding the measurement structure of an instrument is an important step before conducting bias
analysis such as DIF and multi-group factor analysis, and is an important component of evaluating the
validity of the scores based on an instrument (AERA, APA, & NCME, 1999; Zumbo & Chan, in press). In
addition, dimensionality analysis helps determine the appropriate way to interpret the total score of the
EDI. While the total score of the EDI is used in reporting, the EDI is intended to measure five
developmental domains, subdivided into sixteen subdomains. Thus, a dimensionality analysis would
indicate whether the questions in the instrument cohere into groups that reflect the intended domains
and subdomains of the instrument.
Exploratory factor analysis is a widely used statistical method for examining the dimensionality of a
scale. This method determines whether questions in an instrument can be grouped together, and
determines how many groups of questions the instrument contains. Exploratory factor analysis (EFA)

Assessing Potential Bias in Population Level Research With Aboriginal Children: Literature Review, Psychometric, and Administration Report
Directions Evidence and Policy Research Group, LLP 18
was used to examine the dimensionality of the EDI. Mplus software, a program specialized for
psychometric analyses, was used to perform the EFA.
Scale-Level Bias: Multi-Group Exploratory Factor Analysis (MG-EFA)
Multi-group factor analysis helps determine whether the EDI at a scale level functions differently for
different groups of test-takers (e.g., Aboriginal and non-Aboriginal children). Its purpose is to examine if
the factor structure is the same for Aboriginal and non-Aboriginal children and is a form of
measurement invariance analysis. For the present analysis, multi-group exploratory factor analysis (MG-
EFA) was used to test for differences in the factor structure between Aboriginal and non-Aboriginal
children. MG-EFA is a good statistical method for testing factor structure differences when the structure
of a test or assessment instrument is complex (Zumbo, Sireci, & Hambleton, 2003).
EFAs were conducted on all of the items combined as well as on each of the five domains separately for
both Aboriginal and non-Aboriginal children (i.e., MG-EFA), as recommend by Zumbo, Sireci, and
Hambleton (2003). Due to the ordinal and categorical nature of the response options of the EDI items,
we conducted our scale-level analyses on Mplus, as the factor analysis module of the Mplus software
allows for the modeling of ordinal and categorical data (Muthen & Asparouhov, 2002). We used the
unweighted least squares (ULS) to estimate the measurement parameters. A recent Monte Carlo
simulation study demonstrated that the ULS estimator produces more precise standard errors and
provides more stable and accurate estimates when the data are not continuous (Forero, Maydeu-
Olivares, & Gallardo-Pujol, 2009).
Item-Level Bias: Differential Item Functioning (DIF)
We conducted a differential item functioning (DIF) analysis to examine item-level bias of the EDI. DIF is a
psychometric analysis technique that determines whether test items function differently for different
groups of test-takers (e.g., Aboriginal and non-Aboriginal children). If an item functions differently for
certain groups, the item reduces the validity of the test and may threaten test fairness. In this study,
Zumbo’s (1999) logistic regression DIF approach was used. Zumbo’s approach allows one to examine
both uniform and non-uniform DIF. The OLR is a model-based approach that allows the examination of
uniform DIF (i.e., whether an item shows DIF depends on group membership) and non-uniform DIF (i.e.,
whether an item shows DIF depends on both group membership and total score). The DIF analyses were
conducted using SPSS, an analytical software package also used in psychometric analyses. Specifically,
the following steps were taken:
Step 1: The total score was entered into the logistic regression equation.
Step 2: The group variable was entered into the equation.
Step 3: The group by total score interaction term was entered into the equation.
The two-degree of freedom chi-square (χ2) test (i.e., the difference in the chi-square values between
Step 1 and Step 3) was computed for each of the 103 items to examine the presence of overall DIF

Assessing Potential Bias in Population Level Research With Aboriginal Children: Literature Review, Psychometric, and Administration Report
Directions Evidence and Policy Research Group, LLP 19
(uniform and non-uniform). Subsequent analyses were conducted to examine uniform (i.e., difference in
the chi-square values between Step 1 and Step 2) and non-uniform (i.e., difference in the chi-square
values between Step 2 and Step 3) DIF. Due to the multiple tests involved, a relatively conservative
alpha level / p-value of α=.01 was used to determine statistical significance levels in this study, as
recommended by Zumbo (1999). Because of the large sample size in this study, in addition to the chi-
square significance tests, effect sizes were used to detect any items that show DIF. Following Jodoin and
Gierl’s (2001) recommendations, R2 values below .035 represent a “negligible” effect size, between .035
and .070 represent a “moderate” effect size, and above .070 represent a “large” effect size.
Results
Dimensionality analysis
To test the factor structure of the EDI, an EFA was conducted using the entire dataset (Aboriginal and
non-Aboriginal children combined). We used the ratio of first-to-second eigenvalues higher than 3 rule
as the criterion for determining the dimensionality of the EDI, as recommended by Slocum-Gori and
Zumbo (2011). Our results revealed that the ratio of first-to-second eigenvalues was 4.51, suggesting
that the EDI is a unidimensional, one-factor measurement model. In other words, the EDI likely
measures a single underlying concept or construct, rather than the five domains or sixteen subdomains
into which questions are categorized. However, the unidimensional nature of the EDI indicates that the
use of the total score in reporting is justified.
Scale-Level Bias: Multi-Group Factor Analysis
To examine scale-level bias, MG-EFAs were conducted. Specifically, we conducted EFAs on all of the
items combined as well as on each of the five domains separately for both Aboriginal and non-Aboriginal
children. Our results revealed that a unidimensional (one-factor) model fits both the Aboriginal and the
non-Aboriginal groups, suggesting that the factor structure is the same for the two groups. When the
factor analyses were run using the five domains on which the EDI scoring is currently based, the results
were the same3. We found that a unidimensional (one-factor) model fits both the Aboriginal and the
non-Aboriginal groups for each of the five domains. In other words, there is no difference in the factor
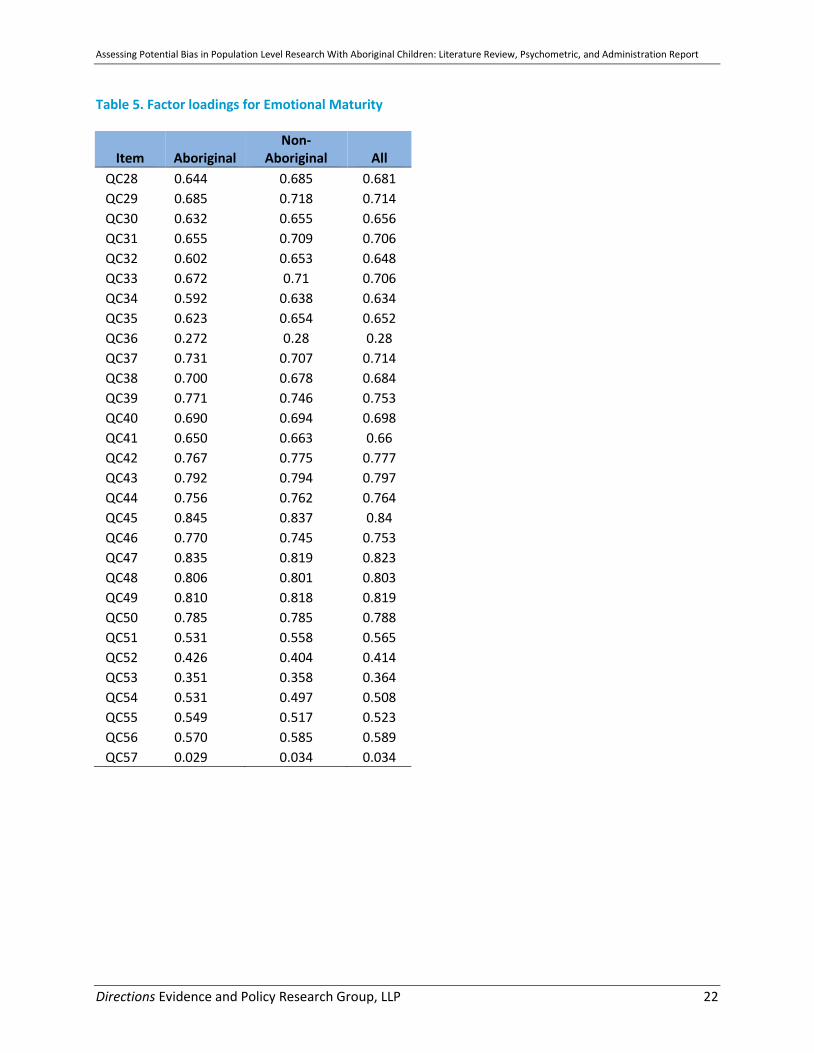
structure between the two groups across all five domains of the EDI. Table 2 presents the ratios of first-
to-second eigenvalues and Table 3 to Table 7 present the factor loadings and eigenvalues of the MG-
EFAs for each domain.
3 In the Physical Health and Well-Being domain, the ratio of first-to-second eigenvalues was slightly below 3.0 in
the Aboriginal children group. We tested a two-factor model and found that item QC58 loaded weakly on both factors across both Aboriginal and non-Aboriginal children groups. The two-factor model therefore did not appear to be as “clean” as the one-factor model. A one-factor, essentially unidimensional model appeared to be a better fit.

Assessing Potential Bias in Population Level Research With Aboriginal Children: Literature Review, Psychometric, and Administration Report
Directions Evidence and Policy Research Group, LLP 20
Table 2. Ratios of first-to-second eigenvalues across all five domains
Domain Group First
eigenvalue Second
eigenvalue
Ratios of first-to-second
eigenvalues
Physical Health & Well-Being Aboriginal 6.062 2.169 2.791
Physical Health & Well-Being Non-Aboriginal 6.293 2.032 3.10
Physical Health & Well-Being Combined 6.355 2.047 3.10
Social Competence Aboriginal 17.221 2.418 7.12
Social Competence Non-Aboriginal 17.264 2.363 7.31
Social Competence Combined 17.359 2.345 7.40
Emotional Maturity Aboriginal 13.56 4.212 3.22
Emotional Maturity Non-Aboriginal 13.808 4.297 3.21
Emotional Maturity Combined 13.886 4.242 3.27
Language & Cognitive Aboriginal 16.195 1.631 9.93
Language & Cognitive Non-Aboriginal 16.442 1.597 10.30
Language & Cognitive Combined 16.584 1.546 10.73
Communication & Knowledge Aboriginal 6.404 0.456 14.04
Communication & Knowledge Non-Aboriginal 6.582 0.416 15.82
Communication & Knowledge Combined 6.582 0.412 15.98
Table 3. Factor loadings for Physical Health and Well-Being
Item Aboriginal Non-
Aboriginal All
QA2 0.387 0.381 0.408
QA3 0.56 0.57 0.586
QA4 0.282 0.261 0.288
QA5 0.423 0.442 0.468
QA6 0.53 0.608 0.596
QA7 0.644 0.654 0.656
QA8 0.76 0.8 0.792
QA9 0.801 0.807 0.807
QA10 0.869 0.877 0.875
QA11 0.834 0.842 0.839
QA12 0.782 0.799 0.804
QA13 0.914 0.91 0.911
QC58 0.317 0.34 0.345

Assessing Potential Bias in Population Level Research With Aboriginal Children: Literature Review, Psychometric, and Administration Report
Directions Evidence and Policy Research Group, LLP 21
Table 4. Factor loadings for Social Competence
Item Aboriginal Non-
Aboriginal All
QC1 0.836 0.826 0.831
QC2 0.834 0.834 0.836
QC3 0.888 0.888 0.889
QC4 0.828 0.82 0.822
QC5 0.916 0.912 0.914
QC6 0.859 0.878 0.878
QC7 0.861 0.853 0.856
QC8 0.664 0.655 0.662
QC9 0.857 0.859 0.86
QC10 0.852 0.85 0.851
QC11 0.863 0.865 0.867
QC12 0.854 0.848 0.851
QC13 0.899 0.899 0.901
QC14 0.783 0.767 0.774
QC15 0.815 0.817 0.82
QC16 0.861 0.871 0.872
QC17 0.757 0.752 0.757
QC18 0.69 0.715 0.717
QC19 0.548 0.567 0.567
QC20 0.563 0.585 0.586
QC21 0.63 0.657 0.658
QC22 0.819 0.814 0.817
QC23 0.845 0.85 0.852
QC24 0.864 0.864 0.866
QC25 0.86 0.844 0.848
QC27 0.76 0.761 0.763
Assessing Potential Bias in Population Level Research With Aboriginal Children: Literature Review, Psychometric, and Administration Report
Directions Evidence and Policy Research Group, LLP 22
Table 5. Factor loadings for Emotional Maturity
Item Aboriginal Non-
Aboriginal All
QC28 0.644 0.685 0.681
QC29 0.685 0.718 0.714
QC30 0.632 0.655 0.656
QC31 0.655 0.709 0.706
QC32 0.602 0.653 0.648
QC33 0.672 0.71 0.706
QC34 0.592 0.638 0.634
QC35 0.623 0.654 0.652
QC36 0.272 0.28 0.28
QC37 0.731 0.707 0.714
QC38 0.700 0.678 0.684
QC39 0.771 0.746 0.753
QC40 0.690 0.694 0.698
QC41 0.650 0.663 0.66
QC42 0.767 0.775 0.777
QC43 0.792 0.794 0.797
QC44 0.756 0.762 0.764
QC45 0.845 0.837 0.84
QC46 0.770 0.745 0.753
QC47 0.835 0.819 0.823
QC48 0.806 0.801 0.803
QC49 0.810 0.818 0.819
QC50 0.785 0.785 0.788
QC51 0.531 0.558 0.565
QC52 0.426 0.404 0.414
QC53 0.351 0.358 0.364
QC54 0.531 0.497 0.508
QC55 0.549 0.517 0.523
QC56 0.570 0.585 0.589
QC57 0.029 0.034 0.034

Assessing Potential Bias in Population Level Research With Aboriginal Children: Literature Review, Psychometric, and Administration Report
Directions Evidence and Policy Research Group, LLP 23
Table 6. Factor loadings for Language and Cognitive Development
Item Aboriginal Non-
Aboriginal All
QB8 0.742 0.78 0.774
QB9 0.647 0.709 0.704
QB10 0.772 0.802 0.802
QB11 0.853 0.845 0.852
QB12 0.84 0.837 0.842
QB13 0.824 0.818 0.822
QB14 0.814 0.824 0.826
QB15 0.851 0.846 0.851
QB16 0.704 0.684 0.693
QB17 0.788 0.765 0.772
QB18 0.632 0.639 0.642
QB19 0.8 0.81 0.815
QB20 0.681 0.699 0.7
QB21 0.788 0.813 0.816
QB22 0.789 0.766 0.776
QB23 0.707 0.679 0.689
QB24 0.792 0.781 0.788
QB25 0.788 0.794 0.796
QB26 0.759 0.759 0.763
QB27 0.801 0.83 0.829
QB28 0.848 0.854 0.857
QB29 0.813 0.816 0.823
QB30 0.823 0.811 0.82
QB31 0.837 0.85 0.854
QB32 0.764 0.791 0.791
QB33 0.763 0.782 0.784

Assessing Potential Bias in Population Level Research With Aboriginal Children: Literature Review, Psychometric, and Administration Report
Directions Evidence and Policy Research Group, LLP 24
Table 7. Factor loadings for Communication Skills and General Knowledge
Item Aboriginal Non-
Aboriginal All
QB1 0.945 0.955 0.954
QB2 0.864 0.898 0.896
QB3 0.945 0.956 0.956
QB4 0.807 0.813 0.815
QB5 0.936 0.949 0.948
QB6 0.91 0.936 0.934
QB7 0.852 0.863 0.864
QC26 0.761 0.764 0.767
Our findings that there are no differences in the factor structures of the EDI between the two groups
suggest that configural invariance is achieved. It is suggested in the psychometric literature that, in the
ideal situation, to test for group differences at the scale level, four levels of measurement invariance
should be tested, including 1) configural (which is the factor structure), 2) weak (factor loadings), 3)
strong (intercepts), and 4) strict (residual variances). To make group-level comparisons on the EDI scores
between Aboriginal and non-Aboriginal children, the establishment of strict invariance is recommended
(see Wu, Li, & Zumbo, 2007 for discussion). We attempted to test for weak, strong, and strict invariance
but the statistical models failed to converge. This is likely due to the complexity of the structure of the
EDI. The 103 EDI items are binary and ordinal in nature (i.e., some of the item responses were “yes/no”
and some were on a three-point scale), and as such, estimating the parameters of 103 binary and
ordinal items across five domains of the EDI appears to be extremely complicated.
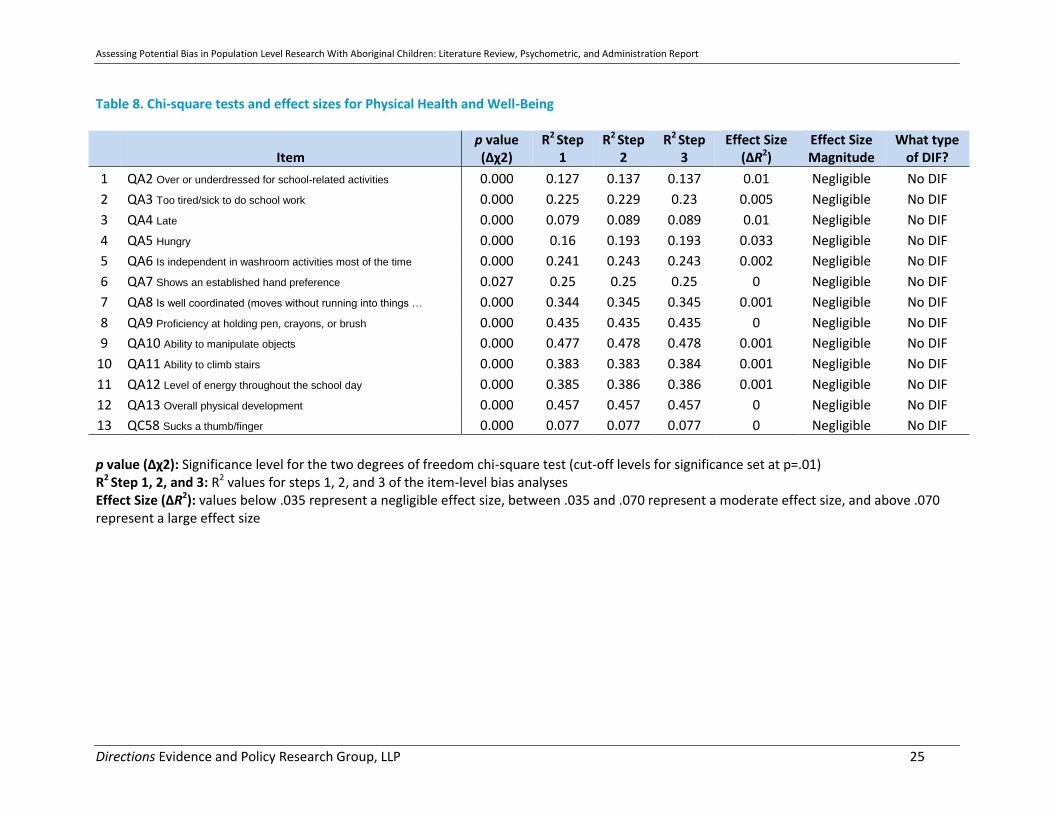
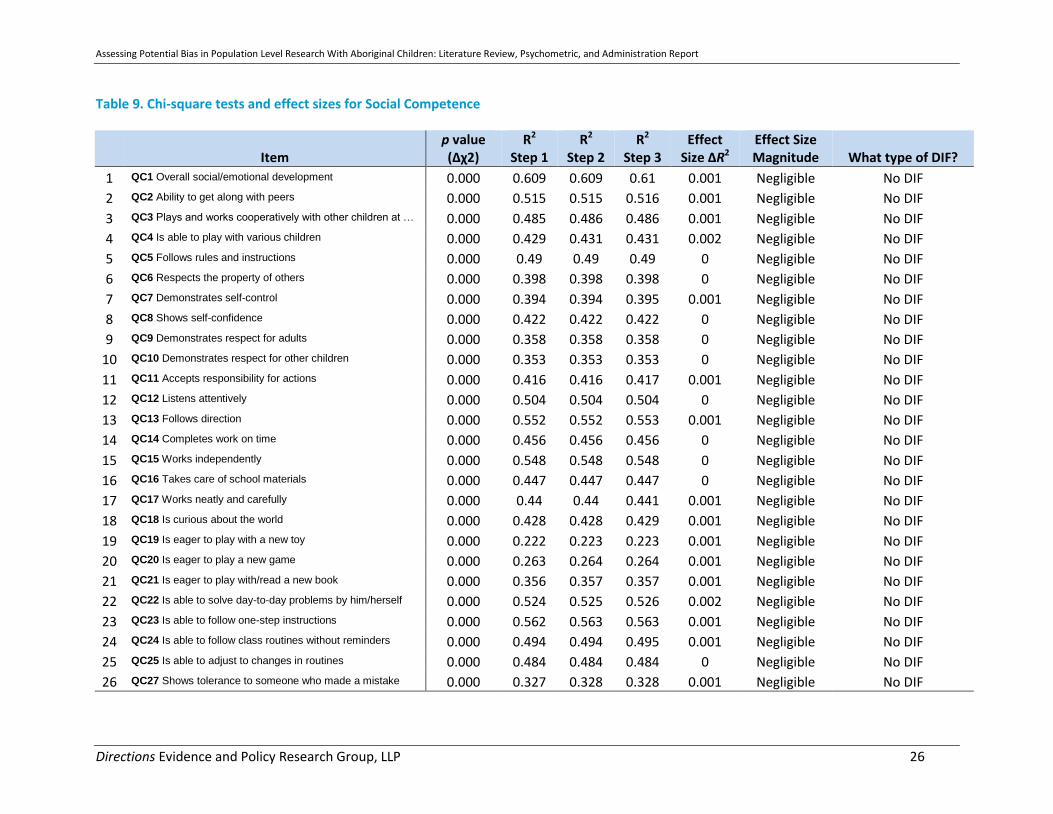
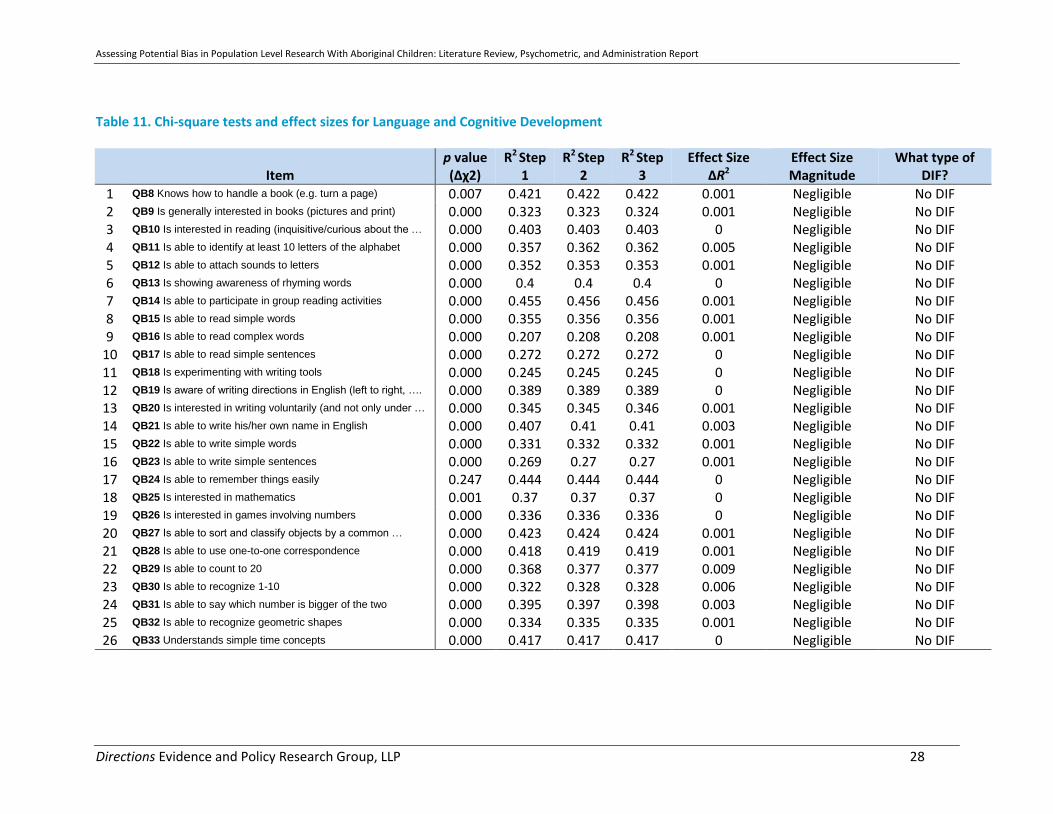
Item-Level Bias: Differential Item Functioning
With respect to the item-level bias, our comparison of Aboriginal and non-Aboriginal children revealed
that none of the 103 EDI items showed DIF. The two-degrees of freedom chi-square tests together with
the effect sizes computed for each of the 103 items indicated that the effect size magnitudes of all of
the items of the EDI were below .035, considered as “negligible” effect sizes based on Jodoin and Gierl’s
(2001) recommendations. Because none of the items showed DIF, no additional analyses were
conducted to determine if the items showed uniform or non-uniform DIF. The results of the chi-square
tests and effect sizes for the items included in each of the five domains (total = 103 items) are presented
in Table 8 to Table 12.
Assessing Potential Bias in Population Level Research With Aboriginal Children: Literature Review, Psychometric, and Administration Report
Directions Evidence and Policy Research Group, LLP 25
Table 8. Chi-square tests and effect sizes for Physical Health and Well-Being
p value (∆χ2): Significance level for the two degrees of freedom chi-square test (cut-off levels for significance set at p=.01) R2 Step 1, 2, and 3: R2 values for steps 1, 2, and 3 of the item-level bias analyses Effect Size (∆R2): values below .035 represent a negligible effect size, between .035 and .070 represent a moderate effect size, and above .070 represent a large effect size
Item p value (∆χ2)
R2 Step 1
R2 Step 2
R2 Step 3
Effect Size (∆R2)
Effect Size Magnitude
What type of DIF?
1 QA2 Over or underdressed for school-related activities 0.000 0.127 0.137 0.137 0.01 Negligible No DIF
2 QA3 Too tired/sick to do school work 0.000 0.225 0.229 0.23 0.005 Negligible No DIF
3 QA4 Late 0.000 0.079 0.089 0.089 0.01 Negligible No DIF
4 QA5 Hungry 0.000 0.16 0.193 0.193 0.033 Negligible No DIF
5 QA6 Is independent in washroom activities most of the time 0.000 0.241 0.243 0.243 0.002 Negligible No DIF
6 QA7 Shows an established hand preference 0.027 0.25 0.25 0.25 0 Negligible No DIF
7 QA8 Is well coordinated (moves without running into things … 0.000 0.344 0.345 0.345 0.001 Negligible No DIF
8 QA9 Proficiency at holding pen, crayons, or brush 0.000 0.435 0.435 0.435 0 Negligible No DIF
9 QA10 Ability to manipulate objects 0.000 0.477 0.478 0.478 0.001 Negligible No DIF
10 QA11 Ability to climb stairs 0.000 0.383 0.383 0.384 0.001 Negligible No DIF
11 QA12 Level of energy throughout the school day 0.000 0.385 0.386 0.386 0.001 Negligible No DIF
12 QA13 Overall physical development 0.000 0.457 0.457 0.457 0 Negligible No DIF
13 QC58 Sucks a thumb/finger 0.000 0.077 0.077 0.077 0 Negligible No DIF
Assessing Potential Bias in Population Level Research With Aboriginal Children: Literature Review, Psychometric, and Administration Report
Directions Evidence and Policy Research Group, LLP 26
Table 9. Chi-square tests and effect sizes for Social Competence
Item p value (∆χ2)
R2
Step 1 R2
Step 2 R2
Step 3 Effect
Size ∆R2 Effect Size Magnitude What type of DIF?
1 QC1 Overall social/emotional development 0.000 0.609 0.609 0.61 0.001 Negligible No DIF
2 QC2 Ability to get along with peers 0.000 0.515 0.515 0.516 0.001 Negligible No DIF
3 QC3 Plays and works cooperatively with other children at … 0.000 0.485 0.486 0.486 0.001 Negligible No DIF
4 QC4 Is able to play with various children 0.000 0.429 0.431 0.431 0.002 Negligible No DIF
5 QC5 Follows rules and instructions 0.000 0.49 0.49 0.49 0 Negligible No DIF
6 QC6 Respects the property of others 0.000 0.398 0.398 0.398 0 Negligible No DIF
7 QC7 Demonstrates self-control 0.000 0.394 0.394 0.395 0.001 Negligible No DIF
8 QC8 Shows self-confidence 0.000 0.422 0.422 0.422 0 Negligible No DIF
9 QC9 Demonstrates respect for adults 0.000 0.358 0.358 0.358 0 Negligible No DIF
10 QC10 Demonstrates respect for other children 0.000 0.353 0.353 0.353 0 Negligible No DIF
11 QC11 Accepts responsibility for actions 0.000 0.416 0.416 0.417 0.001 Negligible No DIF
12 QC12 Listens attentively 0.000 0.504 0.504 0.504 0 Negligible No DIF
13 QC13 Follows direction 0.000 0.552 0.552 0.553 0.001 Negligible No DIF
14 QC14 Completes work on time 0.000 0.456 0.456 0.456 0 Negligible No DIF
15 QC15 Works independently 0.000 0.548 0.548 0.548 0 Negligible No DIF
16 QC16 Takes care of school materials 0.000 0.447 0.447 0.447 0 Negligible No DIF
17 QC17 Works neatly and carefully 0.000 0.44 0.44 0.441 0.001 Negligible No DIF
18 QC18 Is curious about the world 0.000 0.428 0.428 0.429 0.001 Negligible No DIF
19 QC19 Is eager to play with a new toy 0.000 0.222 0.223 0.223 0.001 Negligible No DIF
20 QC20 Is eager to play a new game 0.000 0.263 0.264 0.264 0.001 Negligible No DIF
21 QC21 Is eager to play with/read a new book 0.000 0.356 0.357 0.357 0.001 Negligible No DIF
22 QC22 Is able to solve day-to-day problems by him/herself 0.000 0.524 0.525 0.526 0.002 Negligible No DIF
23 QC23 Is able to follow one-step instructions 0.000 0.562 0.563 0.563 0.001 Negligible No DIF
24 QC24 Is able to follow class routines without reminders 0.000 0.494 0.494 0.495 0.001 Negligible No DIF
25 QC25 Is able to adjust to changes in routines 0.000 0.484 0.484 0.484 0 Negligible No DIF
26 QC27 Shows tolerance to someone who made a mistake 0.000 0.327 0.328 0.328 0.001 Negligible No DIF

Assessing Potential Bias in Population Level Research With Aboriginal Children: Literature Review, Psychometric, and Administration Report
Directions Evidence and Policy Research Group, LLP 27
Table 10. Chi-square tests and effect sizes for Emotional Maturity
Item p value (∆χ2)
R2
Step 1 R2
Step 2 R2
Step 3 Effect Size
∆R2 Effect Size Magnitude
What type of DIF?
1 QC28 Will try to help someone who has been hurt 0.000 0.279 0.281 0.282 0.003 Negligible No DIF 2 QC29 Volunteers to help clear up a mess someone else 0.000 0.291 0.292 0.293 0.002 Negligible No DIF 3 QC30 If there is a quarrel or dispute will try to stop it 0.000 0.316 0.317 0.317 0.001 Negligible No DIF 4 QC31 Offers to help other children who have difficulty with … 0.000 0.402 0.404 0.405 0.003 Negligible No DIF 5 QC32 Comforts a child who is crying or upset 0.000 0.259 0.261 0.262 0.003 Negligible No DIF 6 QC33 Spontaneously helps to pick up objects which … 0.000 0.29 0.292 0.293 0.003 Negligible No DIF 7 QC34 Will invite bystanders to join in a game 0.000 0.303 0.305 0.306 0.003 Negligible No DIF 8 QC35 Helps other children who are feeling sick 0.000 0.278 0.28 0.281 0.003 Negligible No DIF 9 QC36 Is upset when left by parent/guardian 0.000 0.046 0.046 0.046 0 Negligible No DIF
10 QC37 Gets into physical fights 0.000 0.15 0.151 0.151 0.001 Negligible No DIF 11 QC38 Bullies or is mean to others 0.000 0.111 0.111 0.111 0 Negligible No DIF 12 QC39 Kicks, bites, hits other children or adults 0.000 0.19 0.19 0.191 0.001 Negligible No DIF 13 QC40 Takes things that do not belong to him/her 0.000 0.192 0.193 0.193 0.001 Negligible No DIF 14 QC41 Laughs at other children’s discomfort 0.000 0.113 0.114 0.115 0.002 Negligible No DIF 15 QC42 Can’t sit still, is restless 0.000 0.306 0.306 0.306 0 Negligible No DIF 16 QC43 Is distractible, has trouble sticking to any activity 0.000 0.401 0.401 0.401 0 Negligible No DIF 17 QC44 Fidgets 0.000 0.31 0.311 0.311 0.001 Negligible No DIF 18 QC45 Is disobedient 0.000 0.27 0.27 0.27 0 Negligible No DIF 19 QC46 Has temper tantrums 0.000 0.21 0.21 0.21 0 Negligible No DIF 20 QC47 Is impulsive, acts without thinking 0.000 0.292 0.292 0.292 0 Negligible No DIF 21 QC48 Has difficulty awaiting turn in games or groups 0.000 0.28 0.28 0.281 0.001 Negligible No DIF 22 QC49 Cannot settle to anything for more than a few 0.000 0.382 0.383 0.383 0.001 Negligible No DIF 23 QC50 Is inattentive 0.000 0.424 0.424 0.424 0 Negligible No DIF 24 QC51 Seems to be unhappy, sad or depressed 0.000 0.182 0.185 0.185 0.003 Negligible No DIF 25 QC52 Appears fearful or anxious 0.000 0.117 0.117 0.117 0 Negligible No DIF 26 QC53 Appears worried 0.000 0.094 0.094 0.094 0 Negligible No DIF 27 QC54 Cries a lot 0.000 0.118 0.118 0.118 0 Negligible No DIF 28 QC55 Is nervous, high-strung, or tense 0.000 0.107 0.108 0.108 0.001 Negligible No DIF 29 QC56 Is incapable of making decisions 0.000 0.31 0.31 0.31 0 Negligible No DIF 30 QC57 Is shy 0.000 0.037 0.037 0.037 0 Negligible No DIF
Assessing Potential Bias in Population Level Research With Aboriginal Children: Literature Review, Psychometric, and Administration Report
Directions Evidence and Policy Research Group, LLP 28
Table 11. Chi-square tests and effect sizes for Language and Cognitive Development
Item p value (∆χ2)
R2 Step 1
R2 Step 2
R2 Step 3
Effect Size ∆R2
Effect Size Magnitude
What type of DIF?
1 QB8 Knows how to handle a book (e.g. turn a page) 0.007 0.421 0.422 0.422 0.001 Negligible No DIF 2 QB9 Is generally interested in books (pictures and print) 0.000 0.323 0.323 0.324 0.001 Negligible No DIF 3 QB10 Is interested in reading (inquisitive/curious about the … 0.000 0.403 0.403 0.403 0 Negligible No DIF 4 QB11 Is able to identify at least 10 letters of the alphabet 0.000 0.357 0.362 0.362 0.005 Negligible No DIF 5 QB12 Is able to attach sounds to letters 0.000 0.352 0.353 0.353 0.001 Negligible No DIF 6 QB13 Is showing awareness of rhyming words 0.000 0.4 0.4 0.4 0 Negligible No DIF 7 QB14 Is able to participate in group reading activities 0.000 0.455 0.456 0.456 0.001 Negligible No DIF 8 QB15 Is able to read simple words 0.000 0.355 0.356 0.356 0.001 Negligible No DIF 9 QB16 Is able to read complex words 0.000 0.207 0.208 0.208 0.001 Negligible No DIF
10 QB17 Is able to read simple sentences 0.000 0.272 0.272 0.272 0 Negligible No DIF 11 QB18 Is experimenting with writing tools 0.000 0.245 0.245 0.245 0 Negligible No DIF 12 QB19 Is aware of writing directions in English (left to right, …. 0.000 0.389 0.389 0.389 0 Negligible No DIF 13 QB20 Is interested in writing voluntarily (and not only under … 0.000 0.345 0.345 0.346 0.001 Negligible No DIF 14 QB21 Is able to write his/her own name in English 0.000 0.407 0.41 0.41 0.003 Negligible No DIF 15 QB22 Is able to write simple words 0.000 0.331 0.332 0.332 0.001 Negligible No DIF 16 QB23 Is able to write simple sentences 0.000 0.269 0.27 0.27 0.001 Negligible No DIF 17 QB24 Is able to remember things easily 0.247 0.444 0.444 0.444 0 Negligible No DIF 18 QB25 Is interested in mathematics 0.001 0.37 0.37 0.37 0 Negligible No DIF 19 QB26 Is interested in games involving numbers 0.000 0.336 0.336 0.336 0 Negligible No DIF 20 QB27 Is able to sort and classify objects by a common … 0.000 0.423 0.424 0.424 0.001 Negligible No DIF 21 QB28 Is able to use one-to-one correspondence 0.000 0.418 0.419 0.419 0.001 Negligible No DIF 22 QB29 Is able to count to 20 0.000 0.368 0.377 0.377 0.009 Negligible No DIF 23 QB30 Is able to recognize 1-10 0.000 0.322 0.328 0.328 0.006 Negligible No DIF 24 QB31 Is able to say which number is bigger of the two 0.000 0.395 0.397 0.398 0.003 Negligible No DIF 25 QB32 Is able to recognize geometric shapes 0.000 0.334 0.335 0.335 0.001 Negligible No DIF 26 QB33 Understands simple time concepts 0.000 0.417 0.417 0.417 0 Negligible No DIF

Assessing Potential Bias in Population Level Research With Aboriginal Children: Literature Review, Psychometric, and Administration Report
Directions Evidence and Policy Research Group, LLP 29
Table 12. Chi-square tests and effect sizes for Communication Skills and General Knowledge
Item p value (∆χ2)
R2 Step 1
R2 Step 2
R2 Step 3
Effect Size ∆R2
Effect Size Magnitude
What type of DIF?
1 QB1 Ability to use language effectively in English 0.000 0.554 0.554 0.555 0.001 Negligible No DIF
2 QB2 Ability to listen in English 0.000 0.612 0.614 0.615 0.003 Negligible No DIF
3 QB3 Ability to tell a story 0.000 0.591 0.591 0.592 0.001 Negligible No DIF
4 QB4 Ability to take part in imaginative play … 0.000 0.484 0.484 0.485 0.001 Negligible No DIF
5 QB5 Ability to communicate own needs in a way understandable … 0.000 0.598 0.599 0.6 0.002 Negligible No DIF
6 QB6 Ability to understand on first try what is being said to … 0.000 0.639 0.64 0.642 0.003 Negligible No DIF
7 QB7 Ability to articulate clearly, without sound substitution 0.000 0.475 0.475 0.476 0.001 Negligible No DIF
8 QC26 Answers questions showing knowledge about the world 0.000 0.551 0.551 0.551 0 Negligible No DIF

Assessing Potential Bias in Population Level Research With Aboriginal Children: Literature Review, Psychometric, and Administration Report
Directions Evidence and Policy Research Group, LLP 30
Discussion
We conducted psychometric analyses to examine whether the EDI functions differently for Aboriginal
and non-Aboriginal children (i.e., measurement invariance analyses) at both the scale- and item-levels.
MG-EFAs and Zumbo’s (1999) ordinal logistic regression (OLR) approach to differential item functioning
(DIF) analysis were used.
The results of our dimensionality/factor analyses suggest that it is appropriate to use the total score of
the EDI as well as the total score for each of the five domains of the EDI for interpretation. Our factor
analyses showed an essentially unidimensional measurement model for both Aboriginal and non-
Aboriginal children on all of the items combined, suggesting that there is no difference in the factor
structure of the EDI for Aboriginal and non-Aboriginal children. When factor analyses were conducted
on each of the five domains separately, we also found no difference in the factor structure on any of the
five domains between Aboriginal and non-Aboriginal children.
With respect to the item-level bias of the EDI, our DIF analyses revealed that none of the items showed
DIF, suggesting that the EDI items are not biased against Aboriginal children. Our DIF findings are
consistent with the findings by Guhn and colleagues (2007).
To what extent can the EDI be used with Aboriginal children? From a psychometric perspective, there is
no bias at the item level, suggesting that the EDI items function equally well for Aboriginal children and
their non-Aboriginal counterparts for assessing school readiness. At the scale level, there is also no
difference in the factor structure of the EDI between Aboriginal and non-Aboriginal children. However,
we were not able to demonstrate strict invariance at the scale level, which is recommended if one
wishes to make group-level comparisons between Aboriginal and non-Aboriginal children. Our findings
do not suggest that the EDI cannot be used to assess Aboriginal children’s school readiness, as the
results obtained by the individual students are aggregated and reported at the community or population
level. Our results do suggest that group-level comparisons of Aboriginal and non-Aboriginal children
should not be made. Overall, the results of our factor analyses suggest that it is appropriate to use the
total score of the EDI as well as the total score for each of the five domains of the EDI for interpretation
for both Aboriginal and non-Aboriginal children.
It should be noted that although the sample size of the present study was large, all children in the
sample were from British Columbia. Thus, these results may not be generalizable to all Aboriginal
children in Canada.
Assessing Potential Bias in Population Level Research With Aboriginal Children: Literature Review, Psychometric, and Administration Report
Directions Evidence and Policy Research Group, LLP 31
Administration of the EDI in British Columbia
The results of the literature review on potential bias within the implementation of the EDI revealed very
limited information and did not clarify whether differences in EDI scores between Aboriginal and non-
Aboriginal children represent evidence of bias in implementation. A component of avoiding bias in
administration involves supporting the fair administration of the EDI for Aboriginal children. Directions
examined the efforts currently made to support Aboriginal children during the administration of the EDI
in British Columbia.
The examination is separated into four sections that describe four chronological phases of the
administration of the EDI:
Outreach to parents, teachers and principals
Assessor Training
Delivery of the Assessment
Reporting on the Results
The following information about the EDI and the administration process was obtained from information
on HELP’s website (both public and password-protected site), as well as through a series of phone
interviews with the HELP Core Projects Director (Gillian Corless), HELP Aboriginal Community Liaison
Coordinator (Elsie Kipp), FNESC Executive Director (Debbie Jeffrey), and FNESC Senior Policy Analyst
(Starleigh Grass). Combined, the multiple perspectives help provide a comprehensive and balanced
analysis regarding the administration of the EDI instrument.
It is important to note that, although the information below has not been validated through an on-site
inspection of the EDI administration, there is no reason to believe that the facts below are not accurate.
Outreach to parents, teachers and principals
This phase of any assessment is critical to the administration of the instrument as it communicates its
purpose and intent and seeks approval from the parent (and sometimes the educators) to participate.
Current support for Aboriginal students
In order to facilitate outreach and consultation with Aboriginal communities and organizations, HELP
has developed a dedicated web page for Aboriginal families:
http://earlylearning.ubc.ca/edi/aboriginal-EDI/
HELP has also created both an Aboriginal Steering Committee (ASC) and an Aboriginal Community
Liaison Coordinator position.
o The ASC was established in 2003 to provide guidance to HELP pertaining to its research that
applies to Aboriginal Peoples. The committee is made up of Aboriginal community members,
including one elder representative. One function of the ASC members is to ensure that the

Assessing Potential Bias in Population Level Research With Aboriginal Children: Literature Review, Psychometric, and Administration Report
Directions Evidence and Policy Research Group, LLP 32
EDI has meaning for Aboriginal communities. The ASC’s role is also to ensure that HELP’s
research activities pertaining to Aboriginal peoples are appropriately reflective of Aboriginal
cultures, languages, knowledge, and values.
o The Aboriginal Community Liaison Coordinator works closely with HELP’s ASC on the
reporting and dissemination of Aboriginal-specific EDI data. Furthermore, the coordinator
engage with Aboriginal communities on an ongoing basis and work closely with school
district Aboriginal Education Councils and with First Nation communities and organizations.
All Aboriginal-specific positions at HELP are held by Aboriginal individuals with strong ties to
community-based processes.
HELP has also created a ‘Parent/Guardian Information Letter’ that outlines the purpose,
methodology and benefits of the EDI that is sent out to parents early in the school year. The letter
provides information for parents who wish to voice their questions and/or concerns regarding the
EDI.
Recommendations to avoid potential bias
Given the concern among many First Nations organizations regarding the EDI, it may be beneficial to
do some targeted outreach to Aboriginal families. This could involve:
o A brief Q&A answering concerns specifically raised by Aboriginal organizations. This Q&A
could be developed in partnership with organizations like FNESC and in conjunction with the
ASC, and could be included with the ‘Parent/Guardian Letter’ as well as posted on the
website. This could help provide answers and alleviate any parental concerns, including
those about cultural bias.
Assessor Training
This phase of the assessment process is designed to provide the necessary skills and confidence for all
kindergarten teachers who will administer the EDI.
Current support for Aboriginal students
HELP ensures that each participating school district identifies a 3-member training team, including: 1)
Main contact person; 2) Kindergarten teacher; and 3) Community EDI trainer.
The Community EDI trainer is responsible for distributing results to the schools and communities and
responsible for addressing challenges that may arise regarding assessment of Aboriginal children.
Teachers are trained on the specific questions related to Aboriginal children, notably Questions #11a
and #11b identifying the child’s Aboriginal Identity and Language group, respectively. Teachers are
encouraged (through remuneration) to watch the series of training videos specific to particular EDI
questions, including the Aboriginal Identity question
(https://www.youtube.com/watch?feature=player_embedded&v=BFSdjVcTQas). The video provides
practical information for teachers about how to identify a child’s land-based language group.
Specifically, teachers have access to a list of Aboriginal language groups and a map of BC overlaying
Assessing Potential Bias in Population Level Research With Aboriginal Children: Literature Review, Psychometric, and Administration Report
Directions Evidence and Policy Research Group, LLP 33
both the Aboriginal language group and the school district boundaries. If the teacher is unsure, they
are trained not to guess but to consult with the child’s parents and/or the school’s Aboriginal
Education Committee.
Teachers are provided with a detailed EDI Guide that outlines specific instructions for completing the
EDI, including questions #11a and #11b specific to Aboriginal identity.
Identity question #11a is pre-populated based on provincial records. Teachers are trained on this
question and are asked not to change the answer unless they have heard a different response
directly from a child’s parent. A pop-up text box appears when a teacher tries to change the child’s
identification in question #11a, cautioning to not do this without parental confirmation. This way,
the decision to identify a child as Aboriginal or not is the parent’s decision. Any changes to the child’s
identity on the EDI are not reflected in provincial records, nor released in any way.
Teachers receive training on how to answer Aboriginal language groups question #11b.
At this time, it remains unclear how accurate the responses to questions #11a and #11b would be
given the vast diversity of First Nations and Aboriginal identities across BC.
Recommendations to avoid potential bias
Although teachers are trained to administer the EDI, including questions specific to Aboriginal
children, it has been noted that teachers are not provided with any Indigenous Cultural Competency
Training.
Such training would foster among teachers greater cultural competence relating to Aboriginal
students enrolled in their classrooms. It is important for teacher’s to be culturally competent for
initiatives like the EDI, so they can provide an accurate assessment for those Aboriginal children.
Other recommendations could include modifications to the EDI Guide to provide additional
information so that cultural considerations can be taken into account for certain questions. This
could be identified by the ASC and FNESC representatives.
Perhaps beyond the scope of EDI training, it would be valuable for the Ministry of Education to
support ongoing in-service and professional development related to Aboriginal education for all
teachers. For initiatives like the EDI, such training would support practicing teachers who did not
have the benefit of Aboriginal education content in their teacher certification programs.
Delivery of the Assessment
The main phase of the assessment process involves the completion of the EDI by the kindergarten
teacher for each child in his/her classroom.
Current support for Aboriginal students
Generally, at this phase there is little support from HELP to the assessors during the delivery of the
EDI to Aboriginal children.
Assessing Potential Bias in Population Level Research With Aboriginal Children: Literature Review, Psychometric, and Administration Report
Directions Evidence and Policy Research Group, LLP 34
Teachers have the option to call or email HELP to receive further guidance on completing the EDI, at
any time. Any questions specific to Aboriginal children are transferred to the Aboriginal Community
Liaison Coordinator.
Recommendations to avoid potential bias
The main focus for HELP regarding the cultural relevance of the EDI to Aboriginal children seems to
pertain to the ‘identity’ questions.
It is recommended that HELP focus on support for teachers who are assessing students from cultures
they are not familiar with and bias may impact their assessment of the child’s abilities.
It would be recommended to pilot the use of an Indigenous Cultural Consultant to co-deliver the EDI
with the kindergarten teacher when administering the assessment for self-identified Aboriginal
children.
o Specifically, most schools in BC have an Aboriginal representative identified within the school
and could act as this Indigenous Cultural Consultant.
o While observing the child, both the kindergarten teacher and the Indigenous Cultural
Consultant would separately complete the EDI, and then discuss their observations. Any
discrepancies between the two observations would be discussed and mutually agreed upon,
leading to one final assessment for each child.
o This would be similar to the approach developed in Australia for the Australian EDI (AEDI)
with Indigenous children where it was found that the “benefits of collaborative checklist
completion by teachers and Indigenous cultural consultants as a valuable professional and
personal development opportunity for both Indigenous and non-Indigenous school personnel.
The findings confirm that the adapted AEDI…provides a culturally equivalent community-level
measure of overall early child development.”4
Reporting on Results
This phase is critical to communicate the results of the assessment to parents, teachers and community
members to help influence local decision making in the schools, homes and communities.
Current support for Aboriginal students
The HELP team visits specific communities to explain the EDI results and how to interpret
information about their students. The HELP team uses specific “Community Reports” (which include
EDI maps) as a community engagement tool to demonstrate how EDI data provide important
information about how Aboriginal children are faring in their communities. Such visits help bring
clarity to the data being presented and help individuals interpret the information.
4 See Telethon Kids Institute http://telethonkids.org.au/our-research/projects-index/i/indigenous-australian-early-
development-index-(i-aedi)-project/

Assessing Potential Bias in Population Level Research With Aboriginal Children: Literature Review, Psychometric, and Administration Report
Directions Evidence and Policy Research Group, LLP 35
Furthermore, the community sessions bring parents and community members together to help
foster an appreciation for the importance of the early years.
The HELP team goes to school districts and community organizations to explain the results and to
identify how the EDI information can be used to plan and implement initiatives that address the
specific needs of Aboriginal children.
For organizations looking to request Aboriginal-specific data, HELP has a defined process in place to
ensure local data is respected and governed appropriately (See
http://blogs.ubc.ca/trainers/files/2012/09/How-to-Request-Aboriginal-Data_Sep2012.pdf).
Requests for Aboriginal-specific data generally are received by letter from Chief & Council and/or the
local Aboriginal Education Council for the school district. Where no land-based Nations exist within a
school district, a letter from the Chair of the Aboriginal Advisory is accepted.
Furthermore, HELP has a formal rule that Aboriginal-specific data is not provided to a Nation, school
or school district unless the proper permissions are received from the Nation, school or district
whose traditional territory is represented in the data. They have developed a template letter for
school districts and Nations to release the data.
HELP recognizes the unique nature of Aboriginal-specific information and all requests are monitored
by HELP’s Aboriginal Steering Committee. In particular:
“HELP recognizes and respects that Aboriginal families, communities and governance have
sovereignty and jurisdiction over their children and, therefore, are the owners of data collected
for their children. For this reason, HELP does not release Aboriginal specific EDI data for public
consumption. Instead, Aboriginal data is presented back to community through Aboriginal
Education Council meetings, local Nation gatherings and through invited reporting and briefing
presentations.”
Recommendations to avoid potential bias
The HELP team could offer working sessions with Aboriginal communities and school districts to
support the development of learning supports specific to Aboriginal children as they relate to their
EDI results across the domains. (i.e., discussions with Aboriginal communities and families about the
ways they want to support their children in improving learning outcomes).
The HELP team should work with FNESC to develop templates for presenting the EDI findings to
Aboriginal families using a variety of visual representations of data customised to local Aboriginal
cultures and languages. This could include photos showing practical examples of children's
behaviours and competencies to help increase the understanding among parents and community
members.
Most school districts have Aboriginal Education Enhancement Agreements, and the EDI data can
support these agreements by providing information about the experiences of Aboriginal children
before entering school.
Currently, the decision to release Aboriginal-specific information is at the discretion of HELP’s
Aboriginal Steering Committee. HELP should work with FNESC to clearly identify the rules for
releasing Aboriginal-specific data, including the requirement to receive permission from all First
Assessing Potential Bias in Population Level Research With Aboriginal Children: Literature Review, Psychometric, and Administration Report
Directions Evidence and Policy Research Group, LLP 36
Nations whose traditional territory is reflected in the data; and that school districts must have a
representative Aboriginal Education Council created.
Is there bias in the administration of the EDI?
To examine whether there is bias in the administration of the EDI, Directions conducted simulations of
the implementation of the EDI. Teachers watched videos of children and were asked to assess them
using the EDI. Critically, for some teachers, the children in the videos were labelled as Aboriginal, but for
other teachers, the same children in the same videos were not be labelled as Aboriginal. If children
receive similar EDI scores whether they are labelled as Aboriginal or not, then we would infer that there
is no discernible implementation bias. The results of the study, together with the analyses of the
literature, psychometric properties, and administrative guidelines on the EDI will be used to determine if
bias exists in population level research with Aboriginal children.
Experiment
To examine whether there is bias in the administration of the EDI, Directions conducted simulations of
the implementation of the EDI. Teachers watched four videos of children and were asked to assess each
child viewed using a version of the EDI adapted for the purpose of the study. The videos were created
from recordings of four different children interacting one-on-one with a trained teacher. The teacher
invited each child to sit at a table with her and engaged the children in tasks the allowed them to
demonstrate abilities that the EDI addresses. These tasks included: putting together a puzzle; naming
letters and identifying their sounds; naming colours, shapes and animals; counting objects; comparing
quantities and numbers; giving and following instructions (e.g., put the own in the basket); looking at
books and telling stories; printing the child’s name; playing a memory game.
The children in the videos were randomly identified as Aboriginal or Canadian on a demographic
information page that included the child’s gender, age, home language, and ethnicity and was presented
before each of the videos was viewed. Two of the children were, in fact, Aboriginal. For some teachers,
the child in the videos was labelled as Aboriginal, but for other teachers, the same child in the same
videos was not labelled as Aboriginal. If there is no implementation bias, then the same child randomly
designated as Aboriginal should receive the same score or a statistically similar EDI score when he/she is
not labelled Aboriginal. This experimental design involves some degree of deception: the teachers who
watched the videos were not informed until after they completed the study that the Aboriginal status of
the children in the videos was the variable of interest to the researchers.
Approval of the study and the deception involved was obtained from the Behavioural Research Ethics
Board at the University of British Columbia. Once approved, HELP assisted Directions in eliciting the
participation of teachers by sending an e-mail to the superintendents of schools of 15 school boards in
British Columbia encouraging their support for the study. All superintendents agreed to support the
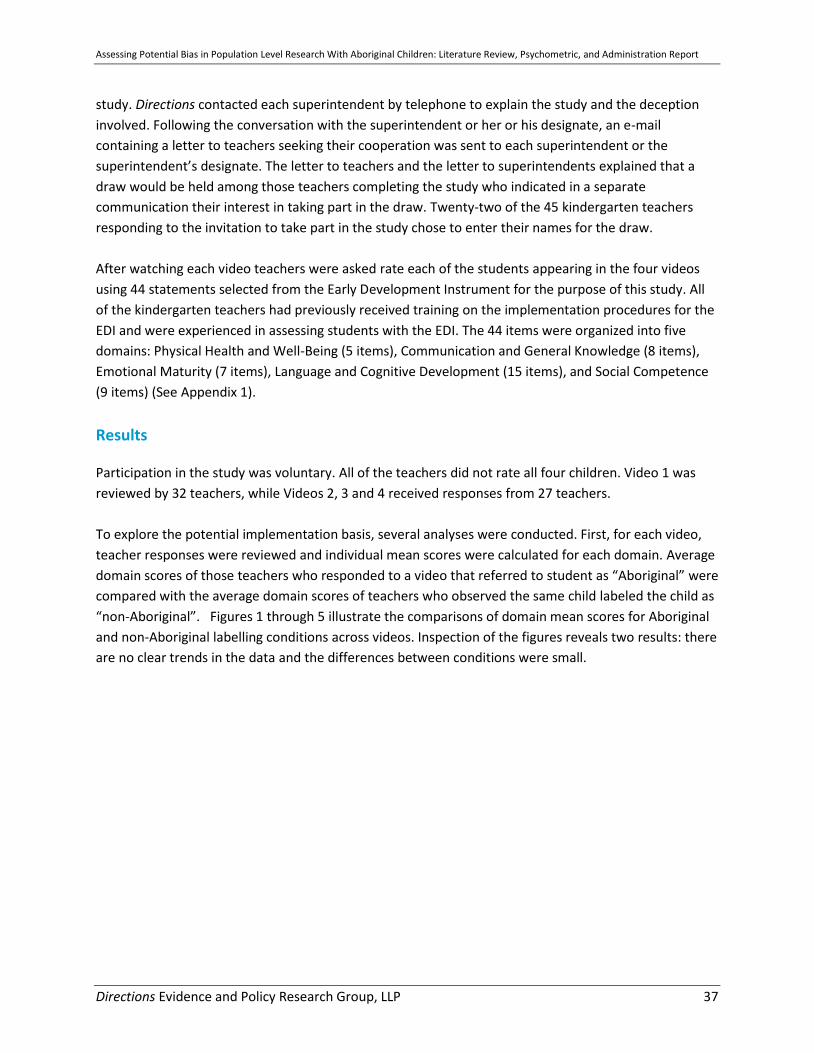
Assessing Potential Bias in Population Level Research With Aboriginal Children: Literature Review, Psychometric, and Administration Report
Directions Evidence and Policy Research Group, LLP 37
study. Directions contacted each superintendent by telephone to explain the study and the deception
involved. Following the conversation with the superintendent or her or his designate, an e-mail
containing a letter to teachers seeking their cooperation was sent to each superintendent or the
superintendent’s designate. The letter to teachers and the letter to superintendents explained that a
draw would be held among those teachers completing the study who indicated in a separate
communication their interest in taking part in the draw. Twenty-two of the 45 kindergarten teachers
responding to the invitation to take part in the study chose to enter their names for the draw.
After watching each video teachers were asked rate each of the students appearing in the four videos
using 44 statements selected from the Early Development Instrument for the purpose of this study. All
of the kindergarten teachers had previously received training on the implementation procedures for the
EDI and were experienced in assessing students with the EDI. The 44 items were organized into five
domains: Physical Health and Well-Being (5 items), Communication and General Knowledge (8 items),
Emotional Maturity (7 items), Language and Cognitive Development (15 items), and Social Competence
(9 items) (See Appendix 1).
Results
Participation in the study was voluntary. All of the teachers did not rate all four children. Video 1 was
reviewed by 32 teachers, while Videos 2, 3 and 4 received responses from 27 teachers.
To explore the potential implementation basis, several analyses were conducted. First, for each video,
teacher responses were reviewed and individual mean scores were calculated for each domain. Average
domain scores of those teachers who responded to a video that referred to student as “Aboriginal” were
compared with the average domain scores of teachers who observed the same child labeled the child as
“non-Aboriginal”. Figures 1 through 5 illustrate the comparisons of domain mean scores for Aboriginal
and non-Aboriginal labelling conditions across videos. Inspection of the figures reveals two results: there
are no clear trends in the data and the differences between conditions were small.
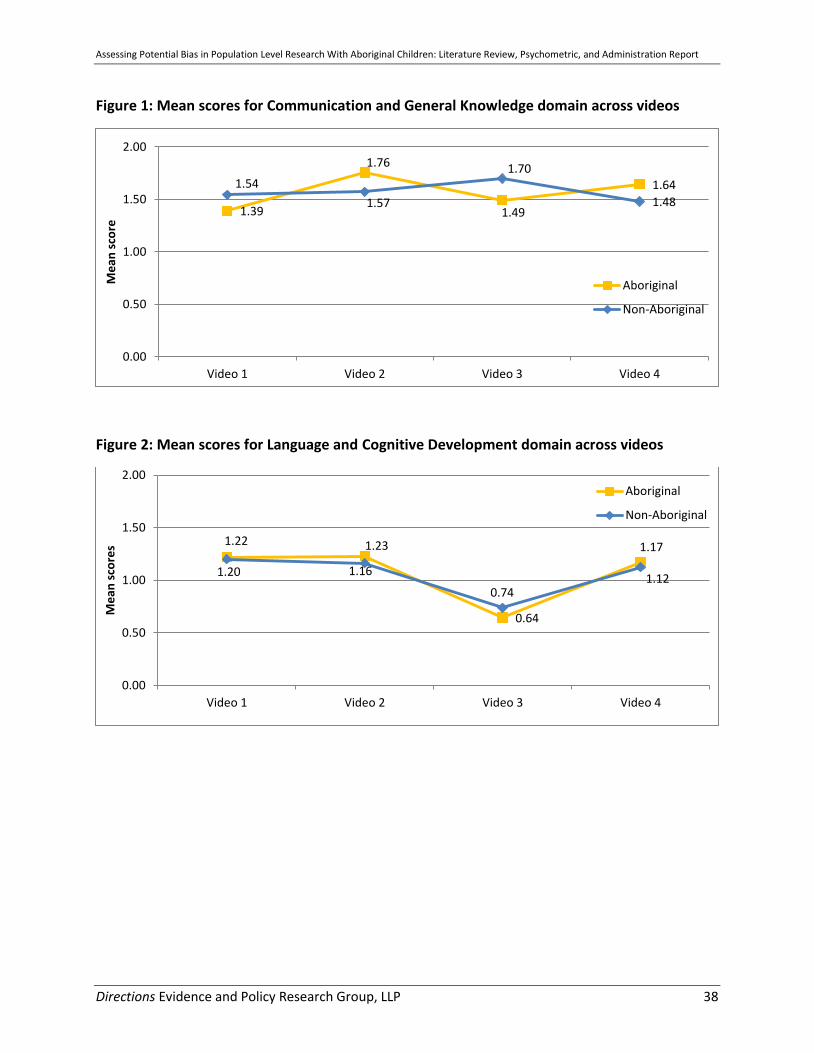
Assessing Potential Bias in Population Level Research With Aboriginal Children: Literature Review, Psychometric, and Administration Report
Directions Evidence and Policy Research Group, LLP 38
Figure 1: Mean scores for Communication and General Knowledge domain across videos
Figure 2: Mean scores for Language and Cognitive Development domain across videos
1.39
1.76
1.49
1.64 1.54
1.57
1.70
1.48
0.00
0.50
1.00
1.50
2.00
Video 1 Video 2 Video 3 Video 4
Me
an s
core
Aboriginal
Non-Aboriginal
1.22 1.23
0.64
1.17
1.20 1.16
0.74 1.12
0.00
0.50
1.00
1.50
2.00
Video 1 Video 2 Video 3 Video 4
Me
an s
core
s
Aboriginal
Non-Aboriginal

Assessing Potential Bias in Population Level Research With Aboriginal Children: Literature Review, Psychometric, and Administration Report
Directions Evidence and Policy Research Group, LLP 39
Figure 3: Mean scores for Social Competence domain across videos
Figure 4: Mean scores for Emotional Maturity domain across videos
1.92 1.89 1.78 1.79 1.92
1.79 1.70 1.63
0.00
0.50
1.00
1.50
2.00
Video 1 Video 2 Video 3 Video 4
Me
an s
core
s
Aboriginal
Non-Aboriginal
0.98
1.81 1.85
1.84
0.97
1.76 1.86 1.87
0.00
0.50
1.00
1.50
2.00
Video 1 Video 2 Video 3 Video 4
Me
an s
core
s
Aboriginal
Non-Aboriginal

Assessing Potential Bias in Population Level Research With Aboriginal Children: Literature Review, Psychometric, and Administration Report
Directions Evidence and Policy Research Group, LLP 40
Figure 5: Mean scores for Physical Health and Well-Being domain across videos
A series of two-way repeated measures ANOVAs were computed to compare the differences between
teachers who responded to the videos in which the same students were labeled as non-Aboriginal and
Aboriginal for each domain and to examine the interactions between and within the groups. The results
indicate that there were no differences between scores assigned to Aboriginal and non-Aboriginal
students for any of the videos. Table 1 presents the results of the repeated measures ANOVAs for each
video. As noted in the table, the p value for each of the test is well below the significance level of .0125
which was adjusted from conventional .05 level to account for the possibility of correlated error arising
from making multiple comparisons with the same population of teachers.
Table 1: Results of Repeated Measures ANOVA tests (tests of between-subjects effects)
Video Test of Between-Subjects Effects
Video 1 F(1, 29) = .454, p = .506; η2partial =.015
Video 2 F(1, 25) = .551, p = .465; η2partial =.022
Video 3 F(1, 25) = .279, p = .602; η2partial =.011
Video 4 F(1, 25) = .946, p = .340; η2partial =.036
Figures 6 through 9 illustrate the comparison of mean domain scores assigned by teachers for each
video when the child was labeled as “Aboriginal” or “non-Aboriginal”. As seen from the Figures, the
mean ratings are consistent across domains and the differences between the groups for each of the
domain were not statistically significant. For example, for Video 1, the ethnicity label assigned to the
child in the video did not influence teachers’ ratings, with the scores being almost identical for three of
the domains (Emotional Maturity, Social competence and Language). The differences for the
1.79
2.04
1.59 1.53
1.89 2.03
1.60
1.35
0.00
0.50
1.00
1.50
2.00
2.50
Video 1 Video 2 Video 3 Video 4
Me
an s
core
s
Aboriginal
Non-Aboriginal
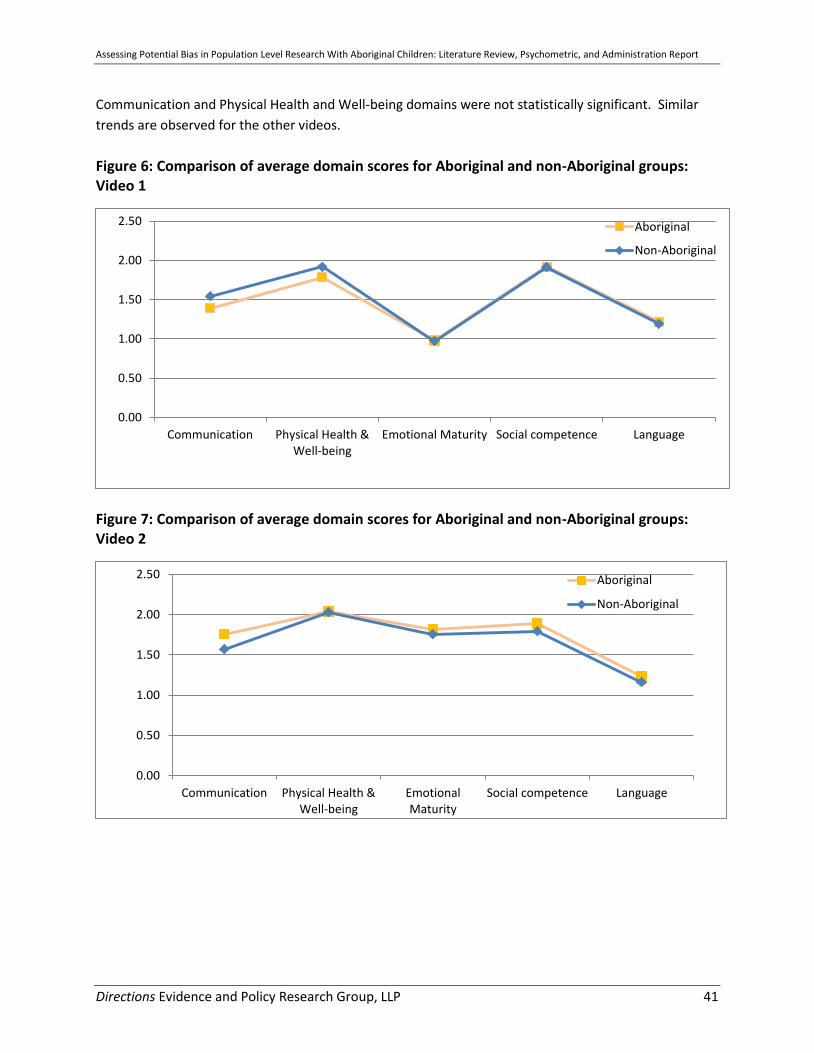
Assessing Potential Bias in Population Level Research With Aboriginal Children: Literature Review, Psychometric, and Administration Report
Directions Evidence and Policy Research Group, LLP 41
Communication and Physical Health and Well-being domains were not statistically significant. Similar
trends are observed for the other videos.
Figure 6: Comparison of average domain scores for Aboriginal and non-Aboriginal groups: Video 1
Figure 7: Comparison of average domain scores for Aboriginal and non-Aboriginal groups: Video 2
0.00
0.50
1.00
1.50
2.00
2.50
Communication Physical Health &Well-being
Emotional Maturity Social competence Language
Aboriginal
Non-Aboriginal
0.00
0.50
1.00
1.50
2.00
2.50
Communication Physical Health &Well-being
EmotionalMaturity
Social competence Language
Aboriginal
Non-Aboriginal
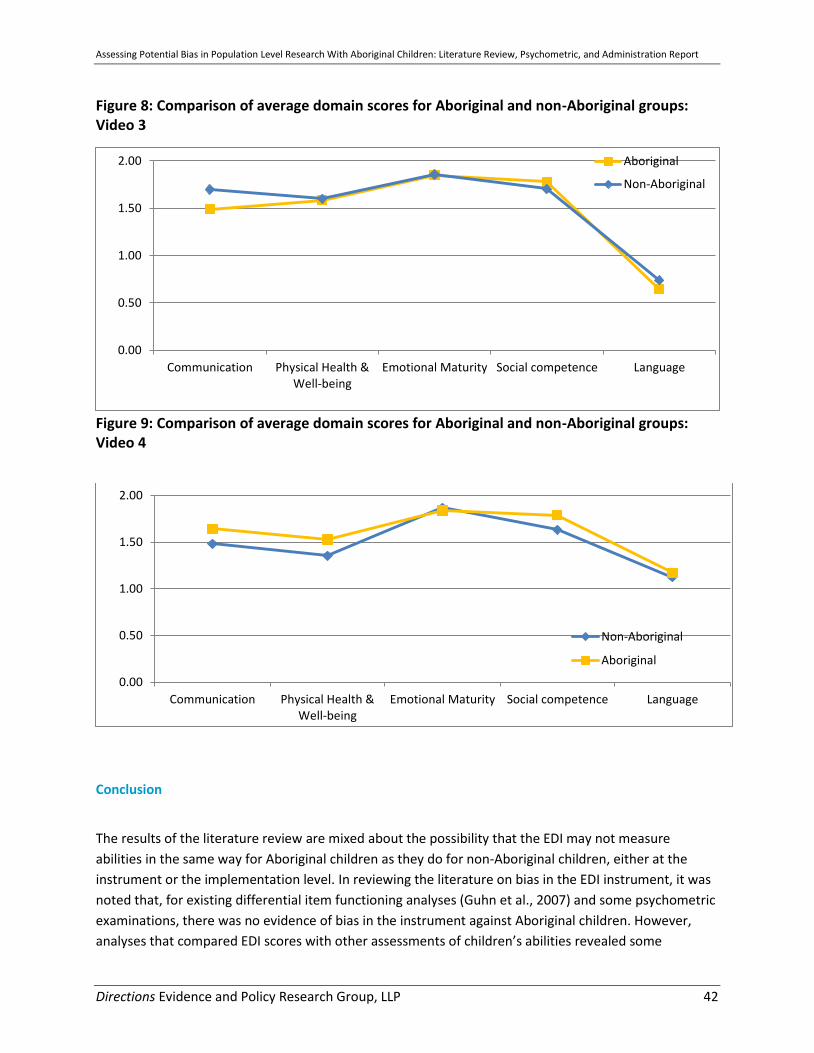
Assessing Potential Bias in Population Level Research With Aboriginal Children: Literature Review, Psychometric, and Administration Report
Directions Evidence and Policy Research Group, LLP 42
Figure 8: Comparison of average domain scores for Aboriginal and non-Aboriginal groups: Video 3
Figure 9: Comparison of average domain scores for Aboriginal and non-Aboriginal groups: Video 4
Conclusion
The results of the literature review are mixed about the possibility that the EDI may not measure
abilities in the same way for Aboriginal children as they do for non-Aboriginal children, either at the
instrument or the implementation level. In reviewing the literature on bias in the EDI instrument, it was
noted that, for existing differential item functioning analyses (Guhn et al., 2007) and some psychometric
examinations, there was no evidence of bias in the instrument against Aboriginal children. However,
analyses that compared EDI scores with other assessments of children’s abilities revealed some
0.00
0.50
1.00
1.50
2.00
Communication Physical Health &Well-being
Emotional Maturity Social competence Language
Aboriginal
Non-Aboriginal
0.00
0.50
1.00
1.50
2.00
Communication Physical Health &Well-being
Emotional Maturity Social competence Language
Non-Aboriginal
Aboriginal

Assessing Potential Bias in Population Level Research With Aboriginal Children: Literature Review, Psychometric, and Administration Report
Directions Evidence and Policy Research Group, LLP 43
evidence that the EDI may not measure Aboriginal and non-Aboriginal children’s abilities in the same
way. The results of an independent psychometric analysis conducted by Directions revealed that on a
scale- and an item-level, the instrument did not function differentially for Aboriginal and non-Aboriginal
children, in line with findings of other researchers who had also conducted differential item functioning
analyses with the EDI. While the existing psychometric analyses did not examine the EDI scores in
comparison with other assessments, the results of the present analyses on an extensive dataset of
children did not reveal evidence of scale- or item-level bias within the instrument itself. It should be
noted that this analysis was unable to establish strict invariance, which means that cross group
comparisons of Aboriginal versus non-Aboriginal children should not be made using EDI scores.
With respect to the implementation of the instrument, the literature review revealed one unpublished
study that suggested Aboriginal children may be assessed differently than non-Aboriginal children. The
results of an independent analysis of the administrative guidelines revealed that, while support is being
provided to administer the EDI to Aboriginal children, more could be done to support the different
stages of administration to Aboriginal children, particularly in delivery of the EDI.
There was no implementation bias revealed by the experiment conducted with teachers certificated in
British Columbia. While no bias was observed in this study of a small sample of teachers, it is important
to note that this does not constitute proof of the absence of bias among the wider population of
teachers. The potential for bias in the implementation of the instrument remains. For that reason, we
believe there is merit in considering the recommendations made earlier in this report concerning the
preparation that teachers receive regarding the implementation of the Early Development Instrument.

Assessing Potential Bias in Population Level Research With Aboriginal Children: Literature Review, Psychometric, and Administration Report
Directions Evidence and Policy Research Group, LLP 44
References
American Educational Research Association, American Psychological Association, and National Council
on Measurement in Education. (1999). Standards for educational and psychological testing.
Washington, DC: American Educational Research Association.
Battiste, M. & McLean, S. (2005). State of First Nations Learning. Report prepared for the Canadian
Council on Learning. Retrieved February 7, 2014 from http://www.ccl-cca.ca/pdfs/AbLKC/StateOfFirstNationsLearning.pdf
BC Ministry of Education, 2013 How Are We Doing? Aboriginal Report 2008/09-2012/2013. Retrieved
February 7, 2014 from http://www.bced.gov.bc.ca/reports/pdfs/ab_hawd/Public.pdf Beauvais, C. & Jenson, J. (2003). The Wellbeing of Children: Are there “Neighbourhood Effects”?
Canadian Policy Research Networks. Retrieved February 7, 2014 from http://www.cprn.org/documents/18052_en.pdf
Canadian Council on Learning (2007). The State of Learning in Canada: No Time for Complacency.
Retrieved February 7, 2014 from http://www.ccl-cca.ca/pdfs/SOLR/2007/NewSOLR_Report.pdf Congress of Aboriginal Peoples (2010). Staying in School: Engaging Aboriginal Students. Retrieved
February 7, 2014 from http://www.abo-peoples.org/wp-content/uploads/2012/10/Stay-In-School-LR.pdf
Doherty, G. (2007). Conception to age six: The foundation of school-readiness. Toronto, Ontario:
Learning Partnership. Retrieved November 25, 2013 from http://www.tlpresources.ca/policy_research/Early_Years_researchpaper-jan07.pdf
Duncan, G. J., & Magnuson, K. A. (2005). Can family socioeconomic resources account for racial and
ethnic test score gaps? Future of Children, 15(1), 35-54. Forero, C. G., Maydeu-Olivares, A., & Gallardo-Pujol, D. (2009). Factor analysis with ordinal indicators: A
monte carlo study comparing DWLS and ULS estimation. Structural Equation Modeling, 16, 625–
641.
Forget-Dubois, N., Lemelin, J.P., Boivin, M., Dionne, G., Seguin, J.R., Vitaro, F., et al. (2007). Predicting
early school achievement with the EDI: A longitudinal population-based study. Early Education and Development, 18(3), 405-426.
Gelin, M. N., & Zumbo, B. D. (2007). The operating characteristics of the DIF MIMIC approach using
Joreskog's covariance matrix with ML and WLS estimation for short scales. Journal of Modern
Applied Statistical Methods, 6, 573-588.
Guhn, M., Gadermann, A., & Zumbo, B.D. (2007). Does the EDI measure school readiness in the same way across different groups of children? Early Education and Development, 18, 453- 472.

Assessing Potential Bias in Population Level Research With Aboriginal Children: Literature Review, Psychometric, and Administration Report
Directions Evidence and Policy Research Group, LLP 45
Janus, M. (2002, unpublished paper). Validation of the Early Development Instrument in a Sample of First
Nations’ Children. Retrieved February 7, 2014 from http://www.offordcentre.com/readiness/files/PUB.3.2002_Janus.pdf
Janus, M., Brinkman. S., Duku, E., Hertzman, C., Santos, R., Sayers, M., et al. (2007). The Early
Development Instrument: A population-based measure for communities. A handbook on development, properties, and use. Hamilton, Ontario, Canada: Offord Centre for Child Studies.
Janus, M. & Duku, E. (2007). The school entry gap: Socioeconomic, family, and health factors associated with children's school readiness to learn. Early Education and Development, 18(3), 375-403.
Janus, M. & Offord, D. (2000). Reporting on readiness to learn at school in Canada. ISUMA: Canadian
Journal of Policy Research, 1(2), 71-75. Janus, M. & Offord, D. (2007). Development and psychometric properties of the Early Development
Instrument (EDI): A measure of children's school readiness. Canadian Journal of Behavioral Science, 39(1), 1-22.
Jodoin, M. G., & Gierl, M. J. (2001). Evaluating Type I error and power rates using an effect size measure
with logistic regression procedure for DIF detection. Applied Measurement in Education, 14,
329-349.
Jussim, L. & Harber, K.D. (2005). Teacher expectations and self-fulfilling prophecies: Knowns and unknowns, resolved and unresolved Controversies
Lapointe, V.R., Ford, L. & Zumbo, B.D. (2007). Examining the relationship between neighborhood
environment and school readiness for kindergarten children. Early Education and Development,
18(3), 473-496.
Li, J., D’Angiulli , A., Kendall G. (2007). The Early Development Index and children from culturally and linguistically diverse backgrounds. Early Years, 27 (3, October), 221-235.
McTurk, N., Carapetis, J., Lea, T., Robinson, G. and Nutton, G. (2008). The School Readiness of Australian
Indigenous Children: A Review of the Literature. Menzies School of Health Research and School for Social Policy Research, Charles Darwin University.
Minister’s National Working Group on Education (2002). Our Children – Keepers of the Sacred
Knowledge. Final Report of the Ministers’ National Working Group on Education. Retrieved February 7, 2014 from http://www.afn.ca/uploads/files/education/23._2002_dec_jeffrey_and_jette_final_report_to_min_national_working_group_ourchildrenkeepersofthesacredknowledge.pdf
Mort J.N., Hughes N., Dockendorf M., Quigg P. & Hertzman, C. (2008). The Early Development
Instrument (EDI) in British Columbia: Documenting Impact and Action in Schools, Community and
Assessing Potential Bias in Population Level Research With Aboriginal Children: Literature Review, Psychometric, and Administration Report
Directions Evidence and Policy Research Group, LLP 46
Early Child Development. Retrieved February 7, 2014 from http://earlylearning.ubc.ca/media/publications/edi_documenting_impact_and_action.pdf
Muhajarine N, Puchala C, Janus M. (2011). Does the EDI equivalently measure facets of school readiness for Aboriginal and Non-Aboriginal children? Social Indicators Research, 103, 299-314.
Muthen, B., & Asparouhov, T. (2002). Latent variable analysis with categorical outcomes: Multiple-group
and growth modeling in Mplus. Mplus webnotes number 4 version 5. Muthen & Muthen.
Pulkkinen, L. & Tremblay, R.E. (1992). Patterns of boy’s social adjustment in two cultures and at different ages: A longitudinal perspective. International Journal of Behavioral Development, 15, 527-553.
Riley, T. & Ungerleider, C. (2012). Self-fulfilling prophecy: How teachers’ attributions, expectations, and
stereotypes influence the learning opportunities afforded Aboriginal students. Canadian Journal of Education, 35(2), 303-333.
Royal Commission on Aboriginal Peoples (1996). Final Report. Retrieved February 7, 2014 from
http://www.collectionscanada.gc.ca/webarchives/20071115053257/http://www.ainc-inac.gc.ca/ch/rcap/sg/sgmm_e.html
Sam, M.A. (2011). An Indigenous knowledges perspective on valid meaning making: A commentary on
research with the EDI and Aboriginal communities. Social Indicators Research, 103, 315-325. Sandford, M., Offord, D., McLeod, K., Boyle, M., Byrne, C. & Hall, B. (1994). Pathways into the workforce:
Antecedents of school and workforce status. Journal of the American Academy of Child and Adolescent Psychiatry, 33(7), 1036-1046.
Silburn, S., Brinkman, S., Ferguson-Hill, S., Styles, I., Walker, R, & Shepherd, C. (2009) The Australian
Early Development Index (AEDI) Indigenous Adaptation Study. Perth: Curtin University of Technology and Telethon Institute for Child Health Research. Retrieved February 7, 2014 from http://ww2.rch.org.au/emplibrary/australianedi/AEDI_Indigenous_Adaptation_Study_Report_Nov_2009.pdf
Slocum-Gori, S. L., & Zumbo, B. D. (2011). Assessing the unidimensionality of psychological scales: Using
multiple criteria from factor analysis. Social Indicators Research, 102, 443–461.
Walton, P. (2007). The Use of the Early Development Instrument (EDI) with Aboriginal Children. Paper prepared for the Aboriginal Education Steering Committee.
Wu, A. D., Li, Z., & Zumbo, B. D. (2007). Decoding the meaning of factorial invariance and updating the
practice of multi-group confirmatory factor analysis: a demonstration with TIMSS data. Practical
Assessment, Research & Evaluation, 12(3), 1-26.
Zumbo, B. D. (1999). A handbook on the theory and methods of differential item functioning (DIF):
Logistic regression modeling as a unitary framework for binary and Likert-type (ordinal) item
Assessing Potential Bias in Population Level Research With Aboriginal Children: Literature Review, Psychometric, and Administration Report
Directions Evidence and Policy Research Group, LLP 47
scores. Ottawa, ON: Directorate of Human Resources Research and Evaluation, Department of
National Defense.
Zumbo, B.D. (2007). Validity: foundational issues and statistical methodology. In C.R. Rao and S. Sinharay
(Eds.), Handbook of Statistics, Vol. 26: Psychometrics, (pp. 45-79). Elsevier Science B.V.: The
Netherlands.
Zumbo, B.D. (2009). Validity as contextualized and pragmatic explanation, and its implications for
validation practice. In R.W. Lissitz (Ed.) The concept of validity: Revisions, new directions and
applications, (pp. 65-82). Charlotte, NC: IAP – Information Age Publishing, Inc.
Zumbo, B. D., & Chan, E. K. H. (in press). Validity and validation in social, behavioral, and health
sciences. New York: Springer.
Zumbo, B. D., Sireci, S. G., Hambleton, R. K. (2003, April). Re-visiting exploratory methods for construct
comparability: Is there something to be gained from the ways of old? Paper presented at the
National Council on Measurement in Education (NCME) meeting, Chicago, IL.

Assessing Potential Bias in Population Level Research With Aboriginal Children: Literature Review, Psychometric, and Administration Report
Directions Evidence and Policy Research Group, LLP 48
Appendix 1: Items by Domains
Dimension Statement
Communication and General Knowledge (8)
Ability to use language effectively in English
Ability to listen in English
Ability to tell a story
Ability to take part in imaginative play
Ability to communicate own needs in a way understandable to adults and peers
Ability to understand on first try what is being said to him/her
Ability to articulate clearly, without sound substitutions
Answers questions showing knowledge about the world (e.g., leaves in the autumn, apple is a fruit, dogs bark)
Emotional Maturity (7) Can't sit still, is restless
Is distractable, has trouble sticking to an activity
Fidgets
Is inattentive
Seems to be unhappy, sad or depressed
Appears fearful or anxious
Appears worried
Language and Cognitive Development (15)
Knows how to handle a book (e.g. turn a page)
Is generally interested in books (pictures and print)
Is able to identify at least 10 letters of the alphabet
Is able to attach sounds to letters
Is showing awareness of rhyming words
Is able to read simple words
Is aware of writing directions in English (left to right, top to bottom)
Is able to write his/her own name in English
Is able to write simple words
Is able to sort and classify objects by a common characteristic (e.g. shape, colour, size)
Is able to use one-to-one correspondence
Is able to count to 20
Is able to recognize numbers 1 - 10
Is able to say which number is bigger of the two
Is able to recognize shapes (e.g. triangle, circle, square)
Physical Health and Well-Being (5)
Proficiency at holding a pen, crayons, or a brush
Ability to manipulate objects
Overall physical development
Shows an established hand preference (right vs. left or vice versa)
Is well coordinated (i.e. moves without running or tripping over things)
Social Competence (9) Overall social/emotional development
Follows rules and instructions
Demonstrates self-control

Assessing Potential Bias in Population Level Research With Aboriginal Children: Literature Review, Psychometric, and Administration Report
Directions Evidence and Policy Research Group, LLP 49
Dimension Statement
Shows self-confidence
Demonstrates respect for adults
Listens attentively
Follows directions
Works neatly and carefully
Is able to follow one-step instructions