assessing sleepiness in the rat: a multiple sleep latencies test
TRANSCRIPT
Journal List > NIHPA Author Manuscripts
J Sleep Res. Author manuscript; available in PMC 2009 June 1.Published in final edited form as:J Sleep Res. 2008 December; 17(4): 365–375. Published online 2008 September 13. doi: 10.1111/j.1365-2869.2008.00686.x
PMCID: PMC2673573NIHMSID: NIHMS88355
Copyright notice and Disclaimer
Assessing sleepiness in the rat: a multiple sleep latencies test compared to polysomnographic measures of sleepiness
JAMES T. MCKENNA,1 JOSHUA W. CORDEIRA,1,2 MICHAEL A. CHRISTIE,1 JAIME L. TARTAR,1,3 JOHN G. MCCOY,1,4 EUNHO LEE,1,5 ROBERT W. MCCARLEY,1 and ROBERT E. STRECKER1
1 Department of Psychiatry, VA Boston Healthcare System and Harvard Medical School, Brockton2 Department of Neuroscience, Tufts University School of Medicine, Boston, MA, USA3 Department of Social and Behavioral Sciences, Nova Southeastern University, Fort Lauderdale, FL, USA4 Department of Psychology, University of Southern Mississippi, Hattiesburg, MS, USA5 SK Holdings, Discovery Laboratory, Yuseong-gu, Daejeon, KoreaCorrespondence: James T. McKenna, PhD, Harvard Medical School and Boston VA Healthcare System, VAMC Research 151-C, 940 Belmont Street, Bldg. 44, Rm. 111, Brockton, MA 02301, USA. Tel.: 774-826-1881; fax: 508-895-0153; e-mail: [email protected]
The publisher's final edited version of this article is available free at J Sleep Res
SUMMARY
Sleepiness following 6 h of sleep deprivation (SD) was evaluated with a rat multiple sleep latencies test (rMSLT), and the findings were compared to conventional polysomnographic measures of sleepiness. The 6 h of SD was produced by automated activity wheels, and was terminated at either the end of the light period or at the beginning of the dark period. The rMSLT consisted of 5 min wakefulness induced by sensory stimulation followed by 25 min of freedom to sleep. This procedure was repeated every 30 min for 3 h and was designed to minimize the amount of sleep lost due to the testing procedure. In separate rats, 6 h SD was followed by undisturbed recovery, allowing evaluation of conventional polysomnographic measures of sleepiness. Sleep onset latencies were reduced following SD, with recovery in the light (baseline = 8 min, 3 s versus post-SD = 1 min, 17 s) and dark period (baseline = 14 min, 17 s versus 7 min, 7 s). Sleep onset latencies were not altered by varying the duration criterion for the first sleep bout (i.e., sleep bout length criteria of 10, 20, 30, or 60 s were compared). Polysomnographic variables (non-rapid eye movement sleep episode duration, delta power, and number of awakenings) also provided reliable indirect measures of sleepiness, regardless of whether the recovery sleep occurred in the light or dark period. Evaluation of effect size indicated that the rMSLT was a strong measure of sleepiness, and was influenced by homeostatic, circadian, and illumination factors. The rMSLT provided a simple, objective, robust and direct measure of sleepiness that was as effective as conventional polysomnographic measures of sleepiness.
Keywords: electroencephalogram, non-rapid eye movement, rat, sleep, sleep latency
INTRODUCTION
Page 1 of 14Assessing sleepiness in the rat: a multiple sleep latencies test compared to polysomnograp...
11/8/2011http://www.ncbi.nlm.nih.gov/pmc/articles/PMC2673573/?tool=pubmed
Variations in sleepiness are considered to reflect the duration of prior wakefulness (homeostatic sleep drive), the circadian time of day (Borbely and Neuhaus, 1979; Borbely et al., 1989; Franken et al., 1991), and may be influenced by environmental cues such as illumination (e.g., Alfoldi et al., 1990; Borbely and Neuhaus, 1979; Borbely et al., 1975; Friedman et al., 1979). Sleepiness can be defined operationally as the propensity to fall asleep. Human clinical studies have measured sleepiness by means of the multiple sleep latency test (MSLT), which is a series of 4–5 nap opportunities, taken at 2 h intervals during the day (Carskadon and Dement, 1979; Carskadon et al., 1986; Reynolds et al., 1982; Roehrs and Roth, 1992). Essentially, if the latency to sleep in these nap periods is significantly shorter than that observed in the general population, the patient is determined to be sleepy. Thus, sleepiness is frequently measured in humans, but less often in the rat due to the lack of a simple and validated technique.
To obtain direct behavioral data on the sleepiness of experimental rats, a unique rat MSLT (rMSLT) was developed and validated by comparison to conventional polysomnographic indirect measures of sleepiness. The protocol required only 3 h of testing and a minimal amount of forced wakefulness (5 min per 30 min trial), thereby minimizing the sleep loss associated with the testing procedure. Following 6 h of sleep deprivation (SD), the rMSLT values were assessed at the end of the light period (4–7 PM) or at the beginning of the dark period (7–10 PM). Different duration criteria for the sleep bouts that indicated the onset of sleep were examined (10, 20, 30, or 60 s), in order to determine if variation of this criteria would lead to differences in the sleep latency data obtained.
Identical SD exposures were repeated in a separate group of rats that were undisturbed during the post-SD recovery period, allowing the comparison of the rMSLT with established conventional polysomnographic criteria thought to indirectly indicate sleepiness. Such indicators, evaluated in the recovery period, include increases in non-rapid eye movement (NREM) sleep episode duration; NREM sleep delta power; and NREM, rapid eye movement (REM), and total sleep amounts (Borbely and Neuhaus, 1979; Franken et al., 1991; Lancel and Kerkhof, 1989; Lancel et al., 1992; Trachsel et al., 1986). The number of awakenings following SD was also examined, as a decrease in the number of awakenings has been proposed to indicate sleepiness (Borbely and Neuhaus, 1979; Franken et al., 1991, 1993; Schwierin et al., 1999).
The rMSLT was a direct and easy to perform test of sleepiness, analogous to the human MSLT. Comparison of the rMSLT findings to undisturbed recovery polysomnographic analysis allowed validation of the rMSLT as an effective measure of sleepiness. rMSLT and undisturbed recovery sleep values were collected in the light versus dark period, in order to examine and compare the impact of circadian time of day, illumination cues, and homeostatic sleep drive on the measures obtained.
METHODS
Adult male Sprague–Dawley rats (n = 28; Charles River Laboratories, Wilmington, MA, USA), weighing between 280 and 350 g, were housed under constant temperature (23 ± 1°C) and 12 : 12 light/dark cycle (lights-on period from 7 AM to 7 PM) with food and water available ad libitum. All animals were treated in accordance with Association for Assessment and Accreditation of Laboratory Animal Care’s policy on care and use of laboratory animals. All experiments conformed to US Department of Veterans Affairs, Harvard University, and US National Institutes of Health guidelines on the ethical use of animals.
Polysomnographic methodsSurgery
Page 2 of 14Assessing sleepiness in the rat: a multiple sleep latencies test compared to polysomnograp...
11/8/2011http://www.ncbi.nlm.nih.gov/pmc/articles/PMC2673573/?tool=pubmed
Electroencephalograph (EEG) and electromyograph (EMG) surgery was performed with isoflurane anesthesia. Two screw electrodes (Product#E363/20; Plastics One Inc., Roanoke, VA, USA) were fixed onto the skull above the temporal cortex (AP −2 mm, ML ±4 mm) for recording EEG. EMG electrodes (Product#E363/76; Plastics One Inc.), which consisted of flexible stainless steel wires insulated with nylon, were placed in the nuchal muscles.
Habituation Following at least 1 week of post-surgical recovery, rats were tethered for EEG/EMG recording, and were placed in motorized activity wheels made for tethered rats (Product# 80860; l × w × h = 50.8 cm × 16.51 cm × 30.48 cm; Lafayette Instruments, Lafayette, IN, USA) for the entirety of the experiment, including SD protocols. The tether cable (Product#363-363 6T (CS) tether cable, Plastics One Inc.), connected to the rat’s implant, was pulled through the slit in the door of the activity wheel, and then connected to the six channel commutator (Product#SL6C; Plastics One Inc.), custom mounted on the activity wheel by means of a swivel mount system (Product#SMCLA; Instech, Plymouth Meeting, MA, USA). Rats were habituated for 2 days in the activity wheels before actual experiments.
EEG/EMG recording Output from the six channel commutator was connected by means of a cable (Product#363-441/6 6T (CS); Plastics One Inc.) to the Grass systems input cable (Product#15IC1-G165; Grass Technologies, Astro-Med, Inc., West Warwick, RI, USA). A Grass model amplifier system polygraph (15LT Bipolar; Grass Technologies) with four amplifiers (Product# 15A54 Quad AC Amplifiers; Grass Technologies) was used for all EEG and EMG data collection (Gamma/Sys Acquisition software; Grass Technologies). EEG filter settings were set at 0.1 and 100 Hz.
EEG/EMG sleep scoring/analysis Behavior was classified into three different states by means of EEG and EMG analysis: wakefulness, NREM sleep, and REM sleep. Recordings were visually scored in 10 s epochs using the Grass Rodent Sleep Stager program (V4.2; Grass Technologies). Raw data were carefully inspected to reject data where electrical artifacts were evident. Spectral analysis of the EEG, employing Fast Fourier transform, was performed to evaluate average delta power (1–4 Hz) in NREM sleep. Vigilance state amounts and delta power were compared to the baseline day amounts in the same rats; i.e., each animal was used as its own control. NREM, REM, and total sleep amounts per hour were measured as absolute amounts and as the percentage of total time spent in each state within the hour (for mixed effects model ANOVA analysis). NREM sleep delta power was represented as average power per hour. That is, the absolute total NREM sleep delta power amount in 1 h was divided by the amount of NREM sleep time in that hour. Average NREM sleep delta power amounts were analyzed as raw data, as well as normalized to the average of the baseline values for the same rat.
Experimental proceduresHabituation Before baseline recordings, rats in the activity wheels were exposed to 1 h of activity wheel motion (5 min on: 5 min off) for 2 days, in order to habituate the rat to the movement of the activity wheel. Also, each rat was exposed to a gentle sensory stimulation SD protocol (also referred to as gentle handling, which involved primarily auditory stimulation, such as tapping on the side of the activity wheel, without explicit handling) for 10 min on each of these 2 days.
Page 3 of 14Assessing sleepiness in the rat: a multiple sleep latencies test compared to polysomnograp...
11/8/2011http://www.ncbi.nlm.nih.gov/pmc/articles/PMC2673573/?tool=pubmed
rMSLT measurement of sleepiness Following the habituation to the activity wheel and gentle handling protocol, the baseline EEG/EMG was recorded for 6 h in the two groups of rats (n = 8; 10 AM–4 PM for light period recovery assessment; or n = 8; 1–7 PM for dark period recovery assessment). A baseline rMSLT was then performed: (i) at the end of the rat’s light/inactive period (4–7 PM) or (ii) at the beginning of the rat’s dark/active period (7–10 PM). The rMSLT included six separate sleep latency trials conducted within 3 h. For each of these six trials, the rat was initially kept awake for 5 min by means of gentle handling. Rats were then left undisturbed for 25 min while polysomnographic data were collected. The trial was then repeated five more times at 30 min intervals. A 10–15 s delay occurred between the end of the gentle handling of each trial, and the beginning of EEG/EMG recording. EEG/EMG data were acquired, and sleep latency values were assessed offline, comparing the average of the six trials (the time to fall asleep within the undisturbed 25 min period) between groups. Sleep onset latency was defined as the time span between the end of the 5 min of gentle handling and the first instance of a NREM sleep bout with a specified duration. For the rMSLT data analysis, the duration criteria of the first NREM sleep bout was varied to determine if this criteria influenced the sleep latencies (NREM bout lengths of, at least 10, 20, 30, or 60 s were compared).
Five days later, the animal was exposed to 6 h SD by means of the automated activity wheels in the two groups of rats (10 AM–4 PM for light period recovery assessment; or 1–7 PM for dark period recovery assessment). Six hours SD was produced by the rotational movement of the activity wheel programmed on a schedule of 3 s on and 12 s off for 6 h, at a speed of 3 m/min. Actual wheel movement ranged from 3 to 5 s, and the wheel was motionless for 11–14 s. Similar parameters have been previously shown to produce greater than 93% wakefulness (Gong et al., 2004; Guzman-Marin et al., 2003). The rMSLT was then performed: (i) at the end of the rat’s light/inactive period (4–7 PM); or (ii) at the beginning of the rat’s dark/active period (7–10 PM). The order of baseline and SD were counterbalanced.
Conventional polysomnographic measures of sleepiness A separate group of rats experienced the same habituation and SD procedures, except instead of the rMSLT, rats were left undisturbed in the same 3 h baseline and recovery periods following SD while EEG/EMG data were recorded. Again, the order of baseline and SD treatment was counterbalanced.
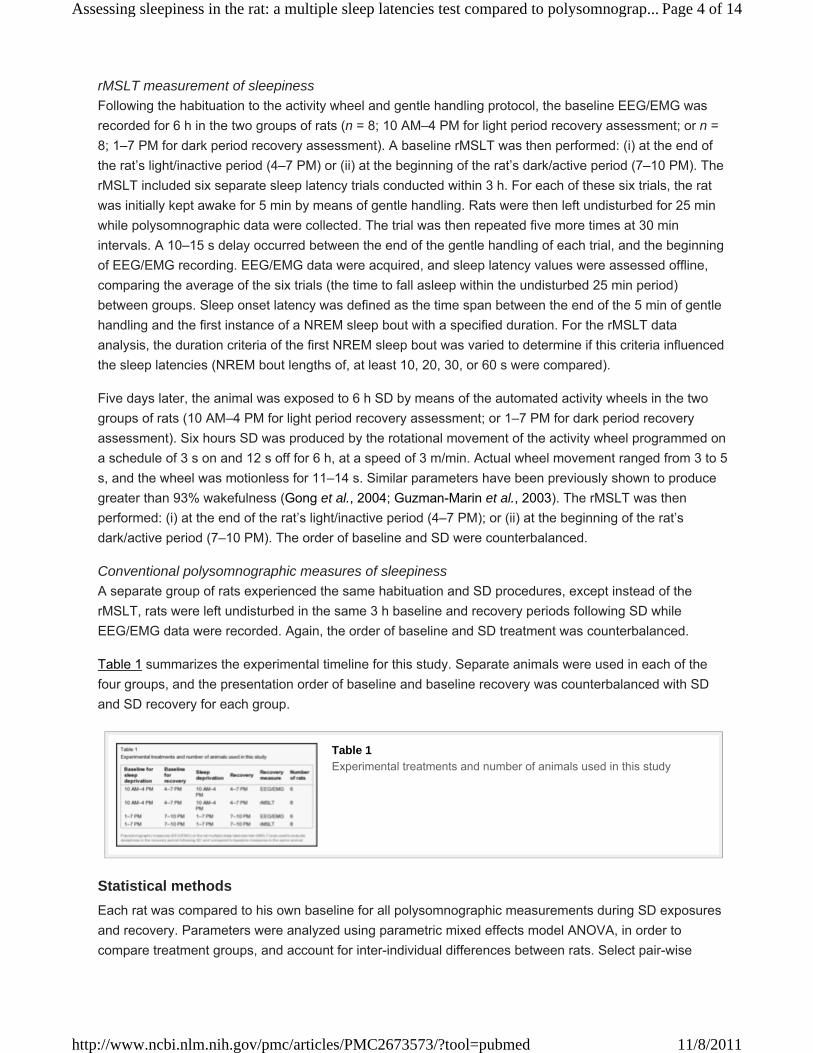
Table 1 summarizes the experimental timeline for this study. Separate animals were used in each of the four groups, and the presentation order of baseline and baseline recovery was counterbalanced with SD and SD recovery for each group.
Table 1Experimental treatments and number of animals used in this study
Statistical methodsEach rat was compared to his own baseline for all polysomnographic measurements during SD exposures and recovery. Parameters were analyzed using parametric mixed effects model ANOVA, in order to compare treatment groups, and account for inter-individual differences between rats. Select pair-wise
Page 4 of 14Assessing sleepiness in the rat: a multiple sleep latencies test compared to polysomnograp...
11/8/2011http://www.ncbi.nlm.nih.gov/pmc/articles/PMC2673573/?tool=pubmed
comparisons of the data were performed using the independent or paired t-test (with Bonferroni correction).
Partial eta squared ( , Cohen, 1973; Pierce et al., 2004) was used to evaluate the effect size of
treatment (SD). These analyses methods are similar to those previously published (e.g., Abrantes-Pais et al., 2007; Cherrier et al., 2007; Cochrane et al., 2007; Flint and Marino, 2007; Goghari et al., 2007), where effect size values between 0.15 and 0.25 roughly indicated small/moderate effect size, and values larger than 0.25 indicate robust effect size. Statistical analysis utilized SPSS software (release 11.5), and differences were determined to be significant when P < 0.05.
RESULTS
Effects of 6 h SD on the distribution of sleep and wakefulnessThe automated activity wheels produced levels of SD comparable to that of other methods such as gentle handling (Franken et al., 1991, 1993). Sleep amounts were evaluated to determine if treatment by automated wheels successfully sleep deprived rats. Six hours of SD increased the percentage of time spent in wakefulness in the 10 AM–4 PM SD time period (mixed effects model ANOVA; 10 AM–4 PM; n =
6, from 37.3% baseline to 92.5% SD exposure; F1,77 = 429.05, P < 0.001, ). Total NREM (from
49.1% to 7.5%; F1,77 = 296.56, P < 0.001, ) and REM (from 13.7% to 0.0%; F1,77 = 325.32, P <
0.001, ) sleep percentages decreased. Similar changes in wakefulness and sleep were observed
when the SD period occurred from 1 to 7 PM (1–7 PM; n = 6, wakefulness increased from 43.3% baseline
to 93.1% SD exposure; F1,77 = 373.98, P < 0.001, ). In turn, NREM sleep percentage was
decreased (from 44.0% to 6.8%; F1,77 = 296.79, P < 0.001, ), as was REM sleep (from 12.5% to
0.0%; F1,77 = 255.76, P < 0.001, ).
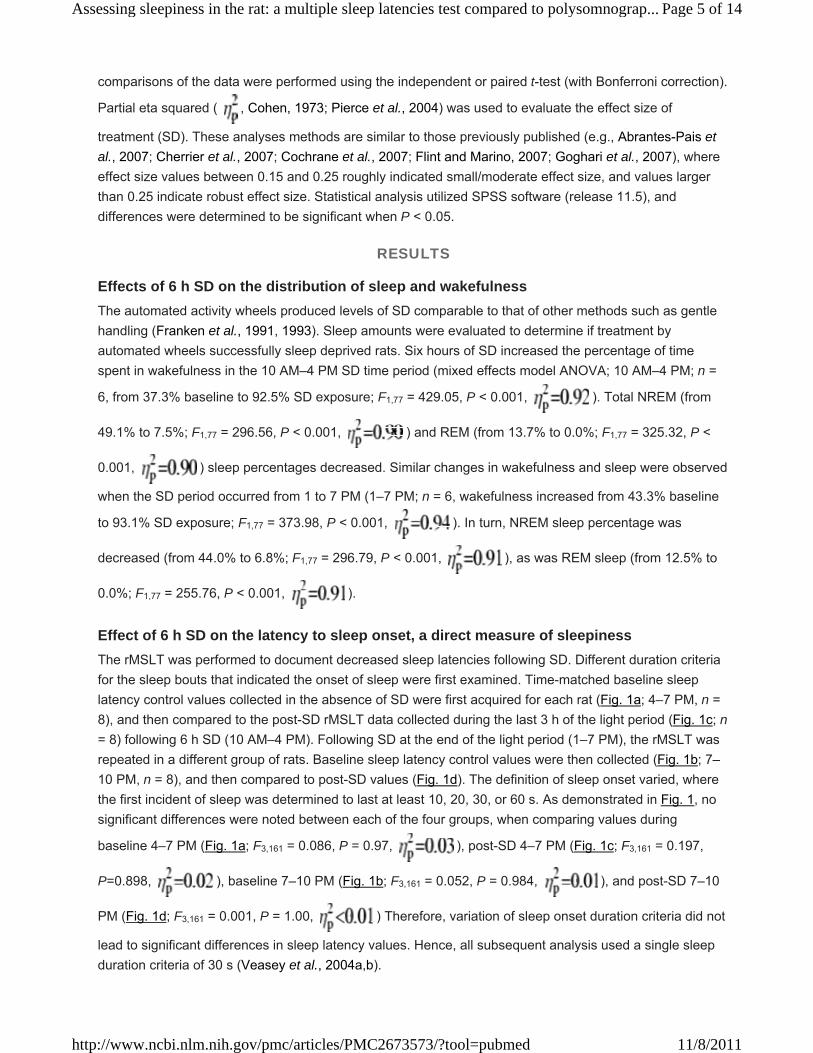
Effect of 6 h SD on the latency to sleep onset, a direct measure of sleepinessThe rMSLT was performed to document decreased sleep latencies following SD. Different duration criteria for the sleep bouts that indicated the onset of sleep were first examined. Time-matched baseline sleep latency control values collected in the absence of SD were first acquired for each rat (Fig. 1a; 4–7 PM, n = 8), and then compared to the post-SD rMSLT data collected during the last 3 h of the light period (Fig. 1c; n = 8) following 6 h SD (10 AM–4 PM). Following SD at the end of the light period (1–7 PM), the rMSLT was repeated in a different group of rats. Baseline sleep latency control values were then collected (Fig. 1b; 7–10 PM, n = 8), and then compared to post-SD values (Fig. 1d). The definition of sleep onset varied, where the first incident of sleep was determined to last at least 10, 20, 30, or 60 s. As demonstrated in Fig. 1, no significant differences were noted between each of the four groups, when comparing values during
baseline 4–7 PM (Fig. 1a; F3,161 = 0.086, P = 0.97, ), post-SD 4–7 PM (Fig. 1c; F3,161 = 0.197,
P=0.898, ), baseline 7–10 PM (Fig. 1b; F3,161 = 0.052, P = 0.984, ), and post-SD 7–10
PM (Fig. 1d; F3,161 = 0.001, P = 1.00, ) Therefore, variation of sleep onset duration criteria did not
lead to significant differences in sleep latency values. Hence, all subsequent analysis used a single sleep duration criteria of 30 s (Veasey et al., 2004a,b).
Page 5 of 14Assessing sleepiness in the rat: a multiple sleep latencies test compared to polysomnograp...
11/8/2011http://www.ncbi.nlm.nih.gov/pmc/articles/PMC2673573/?tool=pubmed
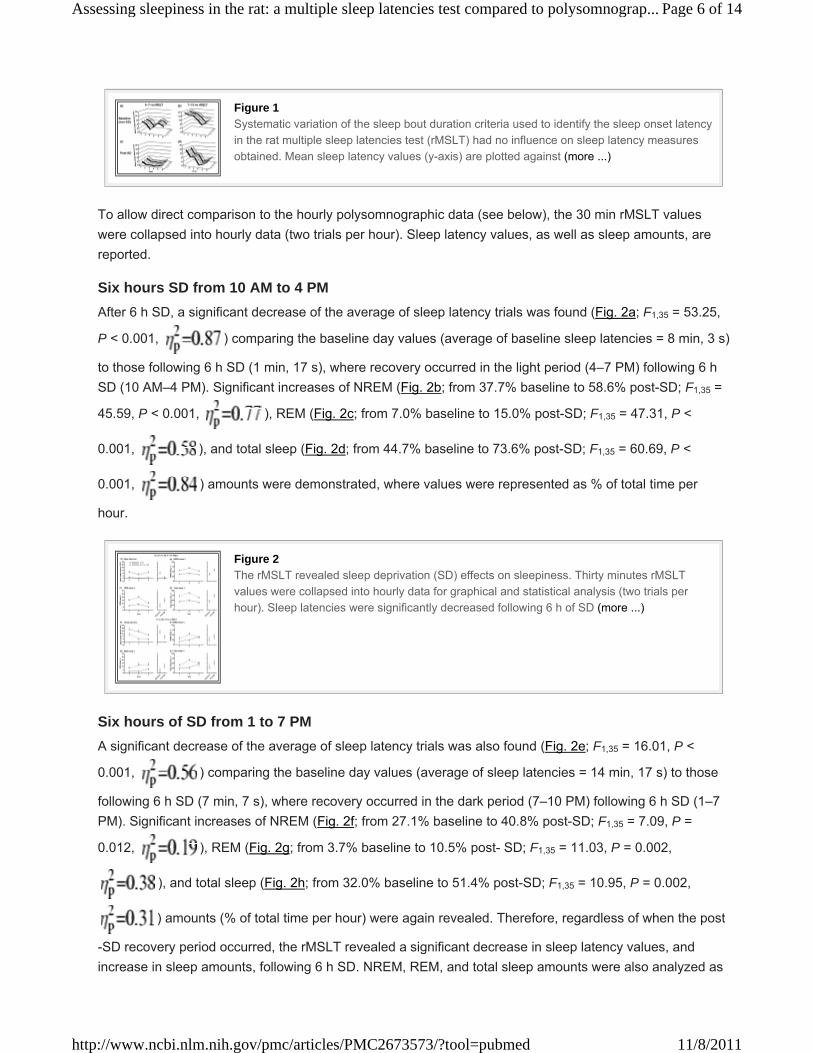
Figure 1Systematic variation of the sleep bout duration criteria used to identify the sleep onset latency in the rat multiple sleep latencies test (rMSLT) had no influence on sleep latency measures obtained. Mean sleep latency values (y-axis) are plotted against (more ...)
To allow direct comparison to the hourly polysomnographic data (see below), the 30 min rMSLT values were collapsed into hourly data (two trials per hour). Sleep latency values, as well as sleep amounts, are reported.
Six hours SD from 10 AM to 4 PMAfter 6 h SD, a significant decrease of the average of sleep latency trials was found (Fig. 2a; F1,35 = 53.25,
P < 0.001, ) comparing the baseline day values (average of baseline sleep latencies = 8 min, 3 s)
to those following 6 h SD (1 min, 17 s), where recovery occurred in the light period (4–7 PM) following 6 h SD (10 AM–4 PM). Significant increases of NREM (Fig. 2b; from 37.7% baseline to 58.6% post-SD; F1,35 =
45.59, P < 0.001, ), REM (Fig. 2c; from 7.0% baseline to 15.0% post-SD; F1,35 = 47.31, P <
0.001, ), and total sleep (Fig. 2d; from 44.7% baseline to 73.6% post-SD; F1,35 = 60.69, P <
0.001, ) amounts were demonstrated, where values were represented as % of total time per
hour.
Figure 2The rMSLT revealed sleep deprivation (SD) effects on sleepiness. Thirty minutes rMSLT values were collapsed into hourly data for graphical and statistical analysis (two trials per hour). Sleep latencies were significantly decreased following 6 h of SD (more ...)
Six hours of SD from 1 to 7 PMA significant decrease of the average of sleep latency trials was also found (Fig. 2e; F1,35 = 16.01, P <
0.001, ) comparing the baseline day values (average of sleep latencies = 14 min, 17 s) to those
following 6 h SD (7 min, 7 s), where recovery occurred in the dark period (7–10 PM) following 6 h SD (1–7 PM). Significant increases of NREM (Fig. 2f; from 27.1% baseline to 40.8% post-SD; F1,35 = 7.09, P =
0.012, ), REM (Fig. 2g; from 3.7% baseline to 10.5% post- SD; F1,35 = 11.03, P = 0.002,
), and total sleep (Fig. 2h; from 32.0% baseline to 51.4% post-SD; F1,35 = 10.95, P = 0.002,
) amounts (% of total time per hour) were again revealed. Therefore, regardless of when the post
-SD recovery period occurred, the rMSLT revealed a significant decrease in sleep latency values, and increase in sleep amounts, following 6 h SD. NREM, REM, and total sleep amounts were also analyzed as
Page 6 of 14Assessing sleepiness in the rat: a multiple sleep latencies test compared to polysomnograp...
11/8/2011http://www.ncbi.nlm.nih.gov/pmc/articles/PMC2673573/?tool=pubmed
raw data, but the effect size values due to SD were identical to those derived from analysis of sleep amount percentages. Therefore, only sleep amount percentages are described and shown.
Of particular importance, measures of sleep loss did not increase as the rMSLT trials progressed. rMSLT hourly values during the baseline rMSLT in the light period were analyzed, for this is one condition when homeostatic, circadian, and illumination influences were minimal. Pair-wise comparisons of the first versus third hour for sleep latencies (Student’s paired samples t-test, Bonferroni corrected; 9 min, 28 s first hour versus 8 min, 52 s third hour; t7 = 0.26, P = 0.803), NREM (37.0% versus 35.2%; t7 = 0.26, P = 0.805), REM (7.1% versus 5.1% post-SD; t7 = 0.96 P = 0.371), and total sleep (44.1% baseline versus 40.3%; t7 = 0.43, P = 0.677) amounts did not significantly differ. As well, sleep amount percentages during the undisturbed period of the rMSLT in the third hour were compared to sleep amount percentage values in the third hour of undisturbed recovery. No significant differences were evident for NREM sleep (independent samples t-test; 47.4% rMSLT versus 41.0% undisturbed recovery; t7 = 0.69, P = 0.505), REM sleep (9.5% versus 10.4%; t7 = −0.26, P = 0.802), and total sleep amounts (56.9% versus 51.4%; t7 = 0.47, P = 0.646).
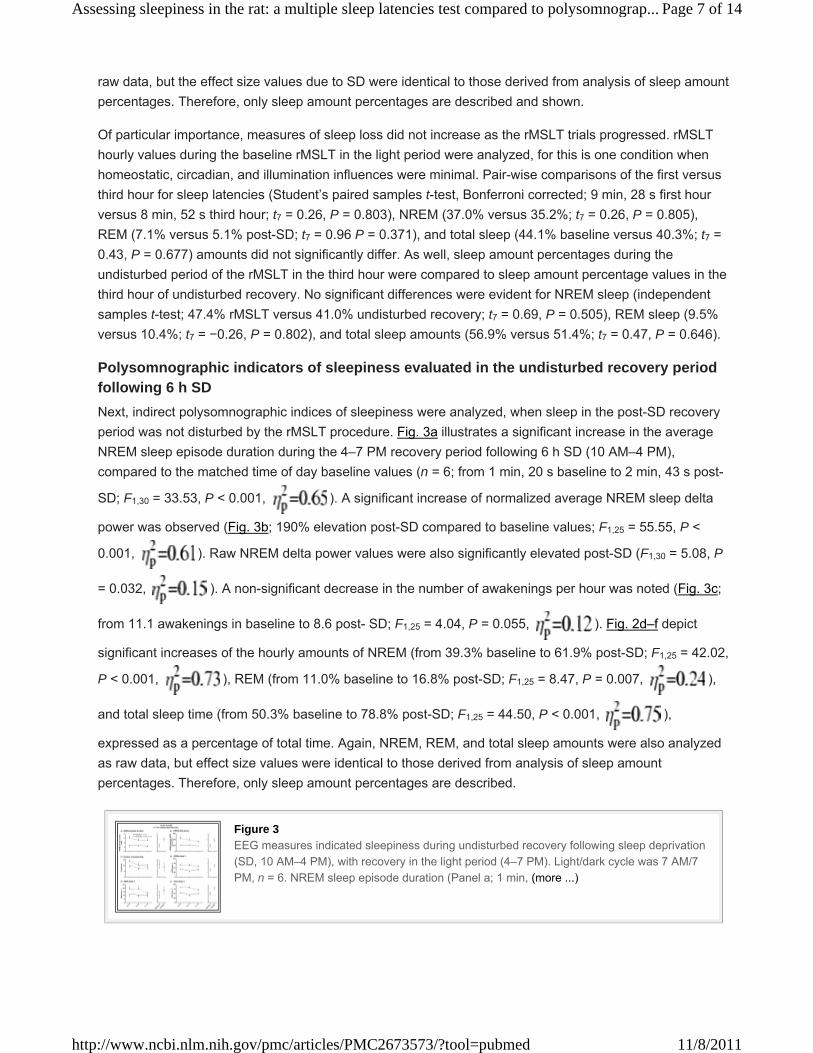
Polysomnographic indicators of sleepiness evaluated in the undisturbed recovery period following 6 h SDNext, indirect polysomnographic indices of sleepiness were analyzed, when sleep in the post-SD recovery period was not disturbed by the rMSLT procedure. Fig. 3a illustrates a significant increase in the average NREM sleep episode duration during the 4–7 PM recovery period following 6 h SD (10 AM–4 PM), compared to the matched time of day baseline values (n = 6; from 1 min, 20 s baseline to 2 min, 43 s post-
SD; F1,30 = 33.53, P < 0.001, ). A significant increase of normalized average NREM sleep delta
power was observed (Fig. 3b; 190% elevation post-SD compared to baseline values; F1,25 = 55.55, P <
0.001, ). Raw NREM delta power values were also significantly elevated post-SD (F1,30 = 5.08, P
= 0.032, ). A non-significant decrease in the number of awakenings per hour was noted (Fig. 3c;
from 11.1 awakenings in baseline to 8.6 post- SD; F1,25 = 4.04, P = 0.055, ). Fig. 2d–f depict
significant increases of the hourly amounts of NREM (from 39.3% baseline to 61.9% post-SD; F1,25 = 42.02,
P < 0.001, ), REM (from 11.0% baseline to 16.8% post-SD; F1,25 = 8.47, P = 0.007, ),
and total sleep time (from 50.3% baseline to 78.8% post-SD; F1,25 = 44.50, P < 0.001, ),
expressed as a percentage of total time. Again, NREM, REM, and total sleep amounts were also analyzed as raw data, but effect size values were identical to those derived from analysis of sleep amount percentages. Therefore, only sleep amount percentages are described.
Figure 3EEG measures indicated sleepiness during undisturbed recovery following sleep deprivation (SD, 10 AM–4 PM), with recovery in the light period (4–7 PM). Light/dark cycle was 7 AM/7 PM, n = 6. NREM sleep episode duration (Panel a; 1 min, (more ...)
Page 7 of 14Assessing sleepiness in the rat: a multiple sleep latencies test compared to polysomnograp...
11/8/2011http://www.ncbi.nlm.nih.gov/pmc/articles/PMC2673573/?tool=pubmed
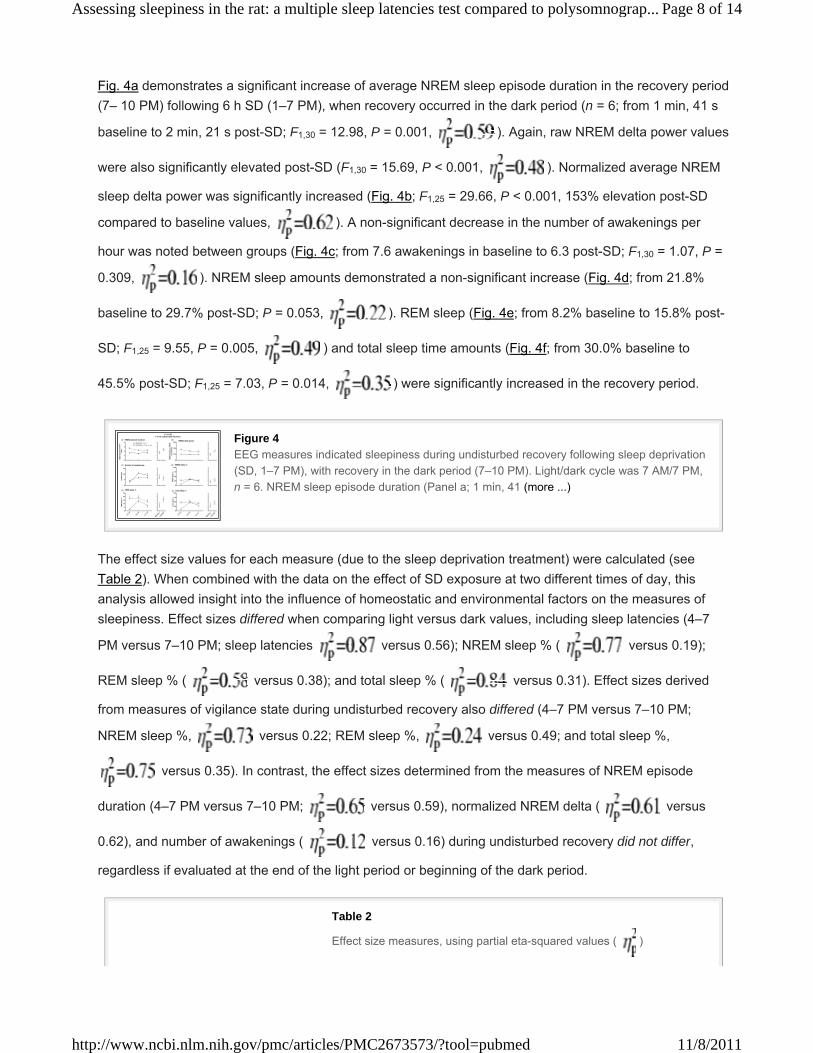
Fig. 4a demonstrates a significant increase of average NREM sleep episode duration in the recovery period (7– 10 PM) following 6 h SD (1–7 PM), when recovery occurred in the dark period (n = 6; from 1 min, 41 s
baseline to 2 min, 21 s post-SD; F1,30 = 12.98, P = 0.001, ). Again, raw NREM delta power values
were also significantly elevated post-SD (F1,30 = 15.69, P < 0.001, ). Normalized average NREM
sleep delta power was significantly increased (Fig. 4b; F1,25 = 29.66, P < 0.001, 153% elevation post-SD
compared to baseline values, ). A non-significant decrease in the number of awakenings per
hour was noted between groups (Fig. 4c; from 7.6 awakenings in baseline to 6.3 post-SD; F1,30 = 1.07, P =
0.309, ). NREM sleep amounts demonstrated a non-significant increase (Fig. 4d; from 21.8%
baseline to 29.7% post-SD; P = 0.053, ). REM sleep (Fig. 4e; from 8.2% baseline to 15.8% post-
SD; F1,25 = 9.55, P = 0.005, ) and total sleep time amounts (Fig. 4f; from 30.0% baseline to
45.5% post-SD; F1,25 = 7.03, P = 0.014, ) were significantly increased in the recovery period.
Figure 4EEG measures indicated sleepiness during undisturbed recovery following sleep deprivation (SD, 1–7 PM), with recovery in the dark period (7–10 PM). Light/dark cycle was 7 AM/7 PM, n = 6. NREM sleep episode duration (Panel a; 1 min, 41 (more ...)
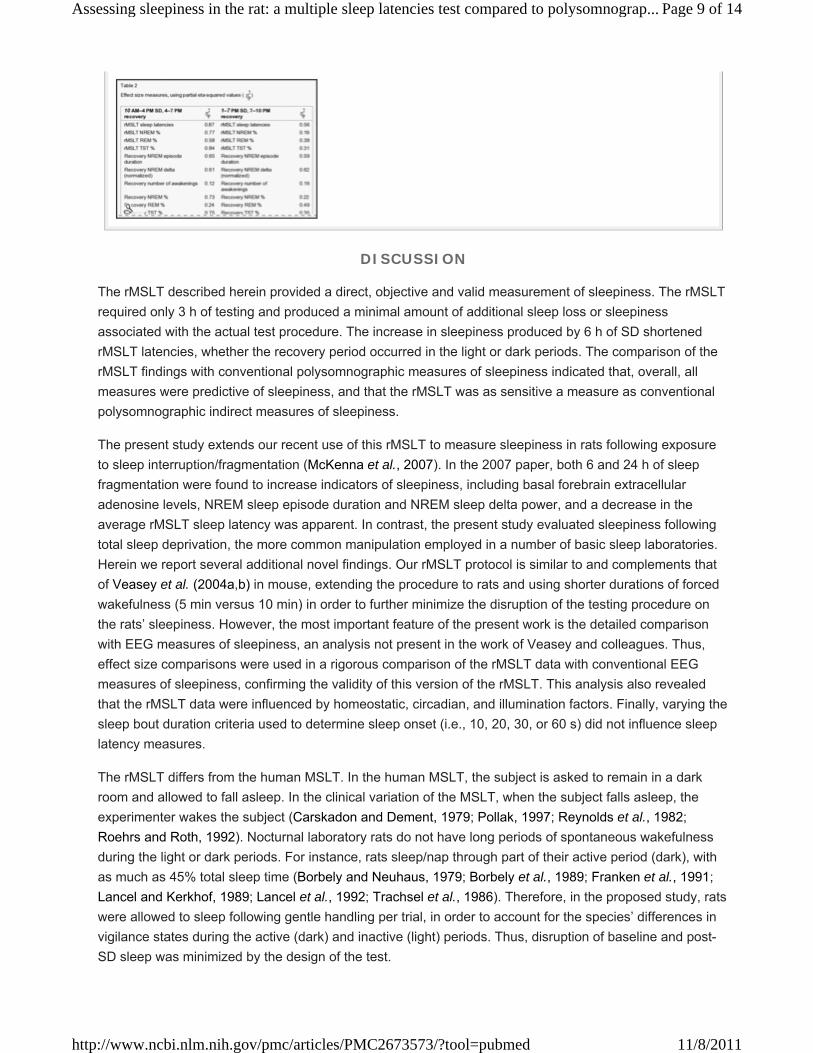
The effect size values for each measure (due to the sleep deprivation treatment) were calculated (see Table 2). When combined with the data on the effect of SD exposure at two different times of day, this analysis allowed insight into the influence of homeostatic and environmental factors on the measures of sleepiness. Effect sizes differed when comparing light versus dark values, including sleep latencies (4–7
PM versus 7–10 PM; sleep latencies versus 0.56); NREM sleep % ( versus 0.19);
REM sleep % ( versus 0.38); and total sleep % ( versus 0.31). Effect sizes derived
from measures of vigilance state during undisturbed recovery also differed (4–7 PM versus 7–10 PM;
NREM sleep %, versus 0.22; REM sleep %, versus 0.49; and total sleep %,
versus 0.35). In contrast, the effect sizes determined from the measures of NREM episode
duration (4–7 PM versus 7–10 PM; versus 0.59), normalized NREM delta ( versus
0.62), and number of awakenings ( versus 0.16) during undisturbed recovery did not differ,
regardless if evaluated at the end of the light period or beginning of the dark period.
Table 2
Effect size measures, using partial eta-squared values ( )
Page 8 of 14Assessing sleepiness in the rat: a multiple sleep latencies test compared to polysomnograp...
11/8/2011http://www.ncbi.nlm.nih.gov/pmc/articles/PMC2673573/?tool=pubmed
DISCUSSION
The rMSLT described herein provided a direct, objective and valid measurement of sleepiness. The rMSLT required only 3 h of testing and produced a minimal amount of additional sleep loss or sleepiness associated with the actual test procedure. The increase in sleepiness produced by 6 h of SD shortened rMSLT latencies, whether the recovery period occurred in the light or dark periods. The comparison of the rMSLT findings with conventional polysomnographic measures of sleepiness indicated that, overall, all measures were predictive of sleepiness, and that the rMSLT was as sensitive a measure as conventional polysomnographic indirect measures of sleepiness.
The present study extends our recent use of this rMSLT to measure sleepiness in rats following exposure to sleep interruption/fragmentation (McKenna et al., 2007). In the 2007 paper, both 6 and 24 h of sleep fragmentation were found to increase indicators of sleepiness, including basal forebrain extracellular adenosine levels, NREM sleep episode duration and NREM sleep delta power, and a decrease in the average rMSLT sleep latency was apparent. In contrast, the present study evaluated sleepiness following total sleep deprivation, the more common manipulation employed in a number of basic sleep laboratories. Herein we report several additional novel findings. Our rMSLT protocol is similar to and complements that of Veasey et al. (2004a,b) in mouse, extending the procedure to rats and using shorter durations of forced wakefulness (5 min versus 10 min) in order to further minimize the disruption of the testing procedure on the rats’ sleepiness. However, the most important feature of the present work is the detailed comparison with EEG measures of sleepiness, an analysis not present in the work of Veasey and colleagues. Thus, effect size comparisons were used in a rigorous comparison of the rMSLT data with conventional EEG measures of sleepiness, confirming the validity of this version of the rMSLT. This analysis also revealed that the rMSLT data were influenced by homeostatic, circadian, and illumination factors. Finally, varying the sleep bout duration criteria used to determine sleep onset (i.e., 10, 20, 30, or 60 s) did not influence sleep latency measures.
The rMSLT differs from the human MSLT. In the human MSLT, the subject is asked to remain in a dark room and allowed to fall asleep. In the clinical variation of the MSLT, when the subject falls asleep, the experimenter wakes the subject (Carskadon and Dement, 1979; Pollak, 1997; Reynolds et al., 1982; Roehrs and Roth, 1992). Nocturnal laboratory rats do not have long periods of spontaneous wakefulness during the light or dark periods. For instance, rats sleep/nap through part of their active period (dark), with as much as 45% total sleep time (Borbely and Neuhaus, 1979; Borbely et al., 1989; Franken et al., 1991; Lancel and Kerkhof, 1989; Lancel et al., 1992; Trachsel et al., 1986). Therefore, in the proposed study, rats were allowed to sleep following gentle handling per trial, in order to account for the species’ differences in vigilance states during the active (dark) and inactive (light) periods. Thus, disruption of baseline and post-SD sleep was minimized by the design of the test.
Page 9 of 14Assessing sleepiness in the rat: a multiple sleep latencies test compared to polysomnograp...
11/8/2011http://www.ncbi.nlm.nih.gov/pmc/articles/PMC2673573/?tool=pubmed
We wished to develop an easy-to-employ method which demanded a minimal amount of time of data acquisition (3 h), and produced minimal sleep loss. Previous rodent MSLT procedures involved extensive forced wakefulness of the animal. For example, one rat protocol employed 20 min of forced wakefulness, followed by 20 min of undisturbed time, repeated for 8–12 h (Blanco-Centurion et al., 2006; Shiromani et al., 1991), which may result in additional sleep loss. Rats here were exposed to gentle handling for 5 min per half hour, and repeated for only six trials. Analysis of baseline rMSLT values during the light period provided an opportunity to quantitatively determine the amount of sleep lost due to the rMSLT testing procedure (homeostatic, circadian, and illumination influences were minimal during this time period). Comparison of sleep onset latencies and sleep amounts (first versus third hour) did not reveal significant differences. Comparison of sleep amount percentages between the third hour of the light period baseline rMSLT (undisturbed periods) and the third hour of light period baseline undisturbed recovery also revealed no significant differences, further indicating that this rMSLT procedure did not cause substantial additional sleep loss.
By ending deprivation at the beginning of the dark period, homeostatic sleep pressure was opposed by circadian and illumination cues of arousal. Nonetheless, a difference between baseline versus post-SD rMSLT values was found in the dark period (7–10 PM), reflecting elevated sleepiness. This experimental design has been previously called a ‘conflict experiment’ (e.g., Alfoldi et al., 1990; Borbely and Neuhaus, 1979; Borbely et al., 1975; Friedman et al., 1979). Illumination cues at the beginning of the dark period significantly influence the behavior of the rat, resulting in arousal and changes in EEG (e.g., Alfoldi et al., 1991; Borbely et al., 1975; Laakso et al., 1995; Nasello et al., 1998; Trachsel et al., 1986; Yasuda et al., 2005). As predicted, the illumination cue of the lights being turned off led to increased arousal, reflected in the elevated rMSLT trial values (seen most clearly in the 7–8 PM period). In summary, homeostatic sleep pressure, as well as circadian and illumination factors, influence sleep latency measures, particularly at the onset of the dark period.
In contrast to the dark period, during the light period a single trial of the rMSLT is sufficient to detect the sleepiness produced by 6 h of SD. Sleep latencies of the first trial (4–4:30 PM) following 6 h of SD were significantly decreased (Paired sample t-test, Bonferroni corrected: 18 min, 30 s baseline versus 15 min, 12 s post-SD; t7 = 2.588, P = 0.036). In contrast, sleep latencies did not differ significantly from baseline day (18 min, 30 s baseline versus 15 min, 12 s post-SD; t7 = 0.627, P = 0.550) when the first trial of the rMSLT occurred at the beginning of the dark period (7– 7:30). Arousal at lights off probably obscured the initial trial’s ability to detect underlying sleepiness. Therefore, multiple trials within the design of the rMSLT were helpful, but not always necessary to detect sleepiness.
Sleep latency values evaluated during the light period, post- SD, demonstrated a ‘floor’ effect. That is, variability/variance was compressed, as some latency values neared zero. Nonetheless, a robust effect
size was reported via the partial eta squared ( ). Evaluating the rMSLT during the dark period
provided an indication where the ‘floor’ effect was minimized. The effect size was moderate/strong (
), again indicating that the rMSLT provided a good direct behavioral measurement of sleepiness.
One limitation of this rMSLT may be that variation in the amount of sleepiness may not be differentially detected. The rMSLT will detect sleepiness, but analysis of sleep latency values following longer SD protocols may not distinguish between levels of sleepiness due to such factors as this ‘floor’ effect.
Page 10 of 14Assessing sleepiness in the rat: a multiple sleep latencies test compared to polysomnogr...
11/8/2011http://www.ncbi.nlm.nih.gov/pmc/articles/PMC2673573/?tool=pubmed

Previous studies, including modified human MSLTs (Pollak, 1997) and the murine MSLT Veasey et al. (2004a, 2004b), have documented a ‘ceiling’ effect, where subjects remain awake for the maximum amount of time allowed during sleep latency measurement, distorting the distribution of sleep latency data. To minimize this ‘ceiling’ effect, this rMSLT allowed the rat a relatively long amount of time to fall asleep (25 min) following 5 min gentle handling. Here, approximately 10% of the baseline sleep latencies values (5 of 48) was at the maximum value (25 min awake), but none of the post-SD sleep latencies reached this maximum. In the dark period, approximately 31% (15 of 48) of baseline sleep latency values reached the maximum level, and approximately 10% (5 of 48) post-SD latencies reached this maximum. The ‘ceiling’ effect was most evident in evaluation of the baseline values in the dark period due to heightened arousal at lights out. Allowing 25 min of undisturbed time in this version of the rMSLT further minimized the influence this ceiling effect had on sleep latency values.
Some measures were influenced by the homeostatic sleep drive, as well as circadian and illumination factors. Effect sizes differed when comparing light versus dark values, including sleep latencies and sleep amounts. Effect sizes derived from measures of sleep amounts during undisturbed recovery also differed. In contrast, the effect sizes determined from the measures of NREM episode duration, normalized NREM
delta, and number of awakenings ( versus 0.16) during undisturbed recovery did not differ.
Previous reports have proposed that measures such as NREM delta power reflect the homeostatic sleep drive (e.g., Alfoldi et al., 1990; Tobler and Borbely, 1986, 1990). These measures that did not differ when comparing light versus dark period values largely reflected the homeostatic sleep drive, and less so other influences such as circadian and illumination factors. Other measures, including the rMSLT, were affected by homeostatic, circadian, and illumination influences.
Multiple indices for sleep measurement allow more complete documentation of the compensatory response to sleep disruption. Six hours of SD leads to acute sleep loss, and the compensatory response documented here was similar to previous studies (Borbely and Neuhaus, 1979; Franken et al., 1991; Lancel and Kerkhof, 1989; Lancel et al., 1992; Trachsel et al., 1986), for NREM delta power values were increased, and a sleep rebound was evident. Rechtschaffen et al. (1999), though, found that the compensatory response following a more chronic (48–96 h) SD was quite different. REM sleep rebound occurred, but NREM delta power was not significantly elevated in the recovery period, and NREM sleep amounts were decreased compared to baseline values. Kim et al. (2007) examined a chronic sleep restriction protocol, in which 20 h of SD occurred each day for 5 days. After the first day of sleep restriction (equivalent to 20 h of SD), the sleep pattern resembled that following acute SD. However, after the daily 20 h of sleep restriction on days 2–5 NREM delta power and sleep amounts were no longer elevated in the recovery period. Unlike polysomnographic measures which adapt to chronic sleep loss, we predict that sleepiness as measured by the rMSLT will continue to be elevated during longer periods of sleep loss or sleep restriction. Thus, it would be of great interest to perform the rMSLT during the daily undisturbed recovery period in the chronic sleep restriction protocol.
The rMSLT was able to reveal sleepiness following an acute 6 h SD protocol, regardless of the circadian and illumination influences. The rMSLT was robust, easy to apply, and led to a minimal amount of additional sleep loss due to the procedure. Effect size evaluation indicated that the rMSLT was a strong measure of sleepiness, and was influenced by homeostatic, circadian, and illumination factors. The protocol may be employed to evaluate sleepiness in animal models of sleep pathology, as well as following more chronic sleep disruption protocols.
Page 11 of 14Assessing sleepiness in the rat: a multiple sleep latencies test compared to polysomnogr...
11/8/2011http://www.ncbi.nlm.nih.gov/pmc/articles/PMC2673573/?tool=pubmed
Acknowledgments
We thank Y. Bolortuya and B. Jeffrey for technical assistance, Margaret Niznikiewicz for statistical advice, and Ritchie Brown for editorial review. This research was supported by US Department of Veterans Affairs Medical Research Awards to RWM and RES, NIH HL060292, NIH MH039683, NIH HL07901 to JLT and JTM, and NIH MH070156 to JTM.
References
Abrantes-Pais F, Friedman JK, Lovallo WR, Ross ED. Psychological or physiological: why are tetraplegic patients content? Neurology. 2007;69:261–267. [PubMed]
1.
Alfoldi P, Tobler I, Borbely AA. The effect of light on sleep and the EEG of young rats. Pflugers Arch. 1990;417:398–403. [PubMed]
2.
Alfoldi P, Franken P, Tobler I, Borbely AA. Short light–dark cycles influence sleep stages and EEG power spectra in the rat. Behav Brain Res. 1991;43:125–131. [PubMed]
3.
Blanco-Centurion C, Xu M, Murillo-Rodriguez E, Gerashchenko D, Shiromani AM, Salin-Pascual RJ, Hof PR, Shiromani PJ. Adenosine and sleep homeostasis in the basal forebrain. J Neurosci. 2006;26:8092–8100. [PubMed]
4.
Borbely AA, Neuhaus HU. Sleep-deprivation: effects on sleep and EEG in the rat. J Comp Physiol. 1979;133:71–87.5.
Borbely AA, Huston JP, Waser PG. Control of sleep states in the rat by short light–dark cycles. Brain Res. 1975;95:89–101. [PubMed]
6.
Borbely AA, Achermann P, Trachsel L, Tobler I. Sleep initiation and initial sleep intensity: interactions of homeostatic and circadian mechanisms. J Biol Rhythm. 1989;4:149–160.
7.
Carskadon MA, Dement WC. Effects of total sleep loss on sleep tendency. Percept Mot Skills. 1979;48:495–506. [PubMed]8.
Carskadon MA, Dement WC, Mitler MM, Roth T, Westbrook PR, Keenan S. Guidelines for the multiple sleep latency test (MSLT): a standard measure of sleepiness. Sleep. 1986;9:519–524. [PubMed]
9.
Cherrier MM, Matsumoto AM, Amory JK, Johnson M, Craft S, Peskind ER, Raskind MA. Characterization of verbal and spatial memory changes from moderate to supraphysiological increases in serum testosterone in healthy older men. Psychoneuroendocrinology. 2007;32:72–79. [PMC free article] [PubMed]
10.
Cochrane A, Barnes-Holmesa D, Barnes-Holmesa Y, Stewart I, Luciano C. Experiential avoidance and aversive visual images: response delays and event-related potentials on a simple matching task. Behav Res Ther. 2007;45:1379–1388. [PubMed]
11.
Cohen J. Eta-squared and partial eta-squared in fixed factor ANOVA designs. Educ Psychol Meas. 1973;33:107–112.12.
Flint RW, Marino CL. Cycloheximide impairs reconsolidation of a contextually reactivated memory in a conditioned taste aversion paradigm. Behav Neurosci. 2007;121:433–438. [PubMed]
13.
Franken P, Dijk DJ, Tobler I, Borbely AA. Sleep deprivation in rats: effects on EEG power spectra, vigilance states, and cortical temperature. Am J Physiol. 1991;261:198–208.
14.
Franken P, Tobler I, Borbely AA. Effects of 12-h sleep deprivation and of 12-h cold exposure on sleep regulation and cortical temperature in the rat. Physiol Behav. 1993;54:885–894. [PubMed]
15.
Friedman L, Bergmann BM, Rechtschaffen A. Effects of sleep deprivation on sleepiness, sleep intensity, and subsequent sleep in the rat. Sleep. 1979;1:369–391. [PubMed]
16.
Goghari VM, Rehm K, Carter CS, MacDonald AW. Regionally specific cortical thinning gray matter abnormalities in the healthy relatives of schizophrenia patients. Cereb Cortex. 2007;17:415–424. [PubMed]
17.
Page 12 of 14Assessing sleepiness in the rat: a multiple sleep latencies test compared to polysomnogr...
11/8/2011http://www.ncbi.nlm.nih.gov/pmc/articles/PMC2673573/?tool=pubmed
Gong H, McGinty D, Guzman-Marin R, Chew KT, Stewart D, Szymusiak R. Activation of c-fos in GABAergic neurons in the preoptic area during sleep and in response to sleep deprivation. J Physiol. 2004;556:935–946. [PMC free article] [PubMed]
18.
Guzman-Marin R, Sunstova N, Stewart DR, Gong H, Szymusiak R, McGinty D. Sleep deprivation reduces proliferation of cells in the dentate gyrus of the hippocampus in rats. J Physiol. 2003;549:563–571. [PMC free article] [PubMed]
19.
Kim Y, Laposky AD, Bergmann BM, Turek FW. Repeated sleep restriction in rats leads to homeostatic and allostatic responses during recovery sleep. Proc Natl Acad Sci U S A. 2007;104:10697–10702. [PMC free article] [PubMed]
20.
Laakso ML, Leinonen L, Joutsiniemi SL, Porkka-Heiskanen T, Alila A. Locomotor activity and melatonin rhythms in rats under non-24-h lighting cycles. Physiol Behav. 1995;57:849–856. [PubMed]
21.
Lancel M, Kerkhof GA. Effects of repeated sleep deprivation in the dark- or light-period on sleep in rats. Physiol Behav. 1989;45:289–297. [PubMed]
22.
Lancel M, van Riezen H, Glatt A. Enhanced slow-wave activity within NREM sleep in the cortical and subcortical EEG of the cat after sleep deprivation. Sleep. 1992;15:102–118. [PubMed]
23.
McKenna JT, Tartar JL, Ward CP, Thakkar MM, Cordeira JW, McCarley RW, Strecker RE. Sleep fragmentation elevates behavioral, electrographic and neurochemical measures of sleepiness. Neuroscience. 2007;146:1462–1473. [PMC free article] [PubMed]
24.
Nasello AG, Machado C, Bastos JF, Felicio LF. Sudden darkness induces a high activity-low anxiety state in male and female rats. Physiol Behav. 1998;63:451–454. [PubMed]
25.
Pierce CA, Richard A, Block RA, Aguinis H. Cautionary note on reporting eta-squared values from multifactor ANOVA designs. Educ Psychol Meas. 2004;64:916–924.
26.
Pollak CP. How should the multiple sleep latency test be analyzed? Sleep. 1997;20:34–39. [PubMed]27.
Rechtschaffen A, Bergmann BM, Gilliland MA, Bauer K. Effects of method, duration, and sleep stage on rebounds from sleep deprivation in the rat. Sleep. 1999;22:11–31. [PubMed]
28.
Reynolds CF, III, Coble PA, Kupfer DJ, Holzer BC. Application of the multiple sleep latency test in disorders of excessive sleepiness. Electroencephalogr Clin Neurophysiol. 1982;53:443–452. [PubMed]
29.
Roehrs T, Roth T. Multiple sleep latency test: technical aspects and normal values. J Clin Neurophysiol. 1992;9:63–67. [PubMed]
30.
Schwierin B, Borbély AA, Tobler I. Prolonged effects of 24-h total sleep deprivation on sleep and sleep EEG in the rat. Neurosci Lett. 1999;261:61–64. [PubMed]
31.
Shiromani PJ, Velazquez-Moctezuma J, Overstreet D, Shalauta M, Lucero S, Floyd C. Effects of sleep deprivation on sleepiness and increased REM sleep in rats selectively bred for cholinergic hyperactivity. Sleep. 1991;14:116–120. [PubMed]
32.
Tobler I, Borbely AA. Sleep EEG in the rat as a function of prior waking. Electroencephalogr Clin Neurophysiol. 1986;64:7–76.33.
Tobler I, Borbely AA. The effect of 3-h and 6-h sleep deprivation on sleep and EEG spectra of the rat. Behav Brain Res. 1990;36:73–78. [PubMed]
34.
Trachsel L, Tobler I, Borbely AA. Sleep regulation in rats: effects of sleep deprivation, light and circadian phase. Am J Physiol. 1986;252:R1037–R1044. [PubMed]
35.
Veasey SC, Davis CW, Fenik P, Zhan G, Hsu YJ, Pratico D, Gow A. Long-term intermittent hypoxia in mice: protracted hypersomnolence with oxidative injury to sleep–wake brain regions. Sleep. 2004a;27:194–201. [PubMed]
36.
Veasey SC, Yeou-Jey H, Thayer P, Fenik P. Murine multiple sleep latency test: phenotyping sleep propensity in mice. Sleep. 2004b;27:388–393. [PubMed]
37.
Page 13 of 14Assessing sleepiness in the rat: a multiple sleep latencies test compared to polysomnogr...
11/8/2011http://www.ncbi.nlm.nih.gov/pmc/articles/PMC2673573/?tool=pubmed
Yasuda T, Yasuda K, Brown RA, Krueger JM. State-dependent effects of light–dark cycle on somatosensory and visual cortex EEG in rats. Am J Physiol Regul Integr Comp Physiol. 2005;289:1083–1089.
38.
Page 14 of 14Assessing sleepiness in the rat: a multiple sleep latencies test compared to polysomnogr...
11/8/2011http://www.ncbi.nlm.nih.gov/pmc/articles/PMC2673573/?tool=pubmed