assessing the effectiveness of self-tests and other ... · other monitoring means in protective...
TRANSCRIPT
Assessing the Effectiveness of Self-Tests and Other Monitoring Means in Protective Relays
John J. Kumm, Edmund O. Schweitzer, III, and Daqing Hou Schweitzer Engineering Laboratories, Inc.
Presented at the 1995 Pennsylvania Electric Association Relay Committee Spring Meeting
Matamoras, Pennsylvania May 25–26, 1995
Previously presented at the Electric Council of New England Spring Meeting, Protective Relaying Committee
Meeting No. 67, May 1995, 48th Annual Conference for Protective Relay Engineers, April 1995,
and 21st Annual Western Protective Relay Conference, October 1994
Previous revised edition released March 1995
Originally presented at the 30th Annual Minnesota Power Systems Conference, October 1994

INTRODUCTION
Microprocessor-based protective relays perfonn self-tests to determine that the relay subsystems arefunctioning properly. An earlier paper by these authors [I] showed that reliance on relay self-testingfeatures safely allows the utility to increase the traditional routine maintenance interval for those
relays.
This paper further defmes digital relay self-test effectiveness. Digital relay monitoring methods arepresented which extend the relay self-test capabilities. Statistical models quantify the benefits ofrelay self-tests and illustrate the usefulness of the additional monitoring features. The results suggesta new model for routine digital protective relay monitoring and maintenance:
.
.
.
.
.
Monitor digital relay self-test alam1 contacts.Monitor digital relay loss-of-signal alanns, when available.Analyze event reports as soon as possible following each event.Use relay output control functions to verify output contacts, iffaults are infrequent.Compare relay meter readings to other meters to verify calibration of both devices.
WHY TEST PROTECTIVE RELA YS?
The goal of protective relay testing is to maximize the availability of protection and minimize risk ofrelay misoperation. With this in mind, we must defme adequate testing and monitoring practices for
digital protective relays.
DIGIT AL RELA y SELF- TESTS
Digital relays use a microprocessor, an ac signal data acquisition system, memory components
containing the relay algorithms, contact inputs to control the relay, and contact outputs to control
other equipment. The algorithms and settings contained in the relay memory define the protection
characteristics.
Digital relays usually include automatic self-test functions. These self-tests verify correct operationof critical relay components. If a self-test detects an abnormal condition, the relay can close anoutput contact, send a message, or provide some other indication of the failure. The relay disablestrip and control functions on detection of certain self-test failures.
Since self-tests are executed often in the digital relay, they detect component failures soon after theyoccur. As a minimum, digital relay self-tests include tests of memory chips, aId converter, powersupply, and microprocessor.
It is convenient to consider digital relays in three sections:
I)
2)
3)
Analog Input SectionContact Input/Output CircuitryProcessing Section
1

The analog input section consists of the signal connections, isolation transfonners, low-pass filters,one or more multiplexers, and an analog-digital converter. Automatic self-tests partially monitor theanalog input section. Since the analog input portion is not fully self-tested, maintenance practicesshould verify the analog input components.
The contact input/output circuitty is another part of the digital relay that allows only partial auto-matic testing. It is possible to design output hardware that is fully redundant and verifiable throughself-tests. However, the existing hardware is reliable, so the additional cost of more complex hard-ware is not justified. Routine verification of the output contacts and optoisolator inputs is appropri-ate when the equipment does not operate regularly in response to faults.
The digital processing section, typically a microprocessor, is the interface between the analog inputsection and the contact input/output section. Self-tests monitor the processor and associated memorycomponents. Since the analog and contact input/output sections cannot function without theprocessing section, normal use also verifies the relay processing section.
Self-test effectiveness defines the portion of all relay failures that can be detected by the relay self-test functions. Field data shows that a practical value of self-test effectiveness is 80%. While itwould be possible to devise relay hardware and software that could detect nearly all relay failures, itis likely that such a relay would be too expensive to use. Therefore, it is important for relay vendorsto devise reliable hardware, and incorporate simple tests that detect as many failures as possible. Inorder to benefit from relay self-test operation, the utility should monitor the self-test alarm contactoutputs of all digital relays.
ADDITIONAL RELA y MONITORING FEA TURES
Utilities should use these additional monitoring functions to detect failures in the analog input sectionand contact output section, augmenting the relay self-testing capabilities.
Many relay maintenance features are executable by remote command and often could replace routinemaintenance altogether. Relays that do not regularly operate for faults may require more thoroughroutine checks.
Loss of Relavin2 Volta2e or Current Features Act as Self- Tests
Many digital distance relays include features that detect the removal of ac voltage or ac current. Theloss of voltage (LOV) element and the loss of current (LOI) element are two such features. Mostrelays use the presence of certain phase or sequence currents and voltages to differentiate genuinefault conditions from blown fuse or open current transformer secondary conditions. In addition toverifying the security of the signal wiring, these monitoring features also detect certain types ofanalog input failures that could occur inside the relay.
For instance, if an instrument voltage transfonner in a relay fails, the relay can detect and indicate anLOV condition. The utility can monitor the LOV signal, compare it to similar signals from otherrelays connected to the signal source, determine the point of failure, and repair it before a rnis-operation occurs. The LOV feature is a self-test applied to the relay and to some equipment outsidethe relay.
2

Meterin2
Digital relay metering features give the user a convenient means of verifying the presence andaccuracy of the relay analog inputs. When relay signal sources and input channels are operatingcorrectly, the relay meter quantities should match the outputs of other meters measuring those
signals.
The advantage of a meter test is that the relay remains in service and capable of clearing faults whilethe test is in progress. A meter test could be executed on a nearly continuous basis without reducing
relay availability .
The meter test practice is sound if the digital relay uses the same measuring circuitry for bothmetering and relaying. If the relay uses separate circuitry for its metering functions, the meteringdata checks only those components common to both the metering and relaying circuitry .In thisinstance, some additional check must be made to verify the relay element measurements.
Relav Event Data Analvsis Detects Problems
Event reports generated by the digital relay in response to a fault often contain:
.
.
.
Prefault and fault current and voltage measurements.Indication of the relay contact input and output states through the event.Relay setting and element operation information.
Event report analysis is a valuable maintenance tool. The event report concisely shows that the relayis measuring ac signals and receiving dc contact input signals. When the relay closes outputcontacts, it is shown in the event report.
Analysis of digital relay fault data is preferable to routine relay maintenance because an actual faultis a true test of the instrument rather than a simulated test. Power system responses to the relaycontrol signals should be discernable from information in the event report. A brief review of theevent report can indicate failures in the external connections or internal components of the analoginput section or contact input/output section. Many times, improvements in the protection schemecan be discovered by reviewing the contents of event reports [2]. The ability of the relay to store anddeliver the event report further verifies the relay processing section.
Exercisin!! Output Contacts
Many digital relays provide a feature that allows the user to control the relay output contacts. Thischeck verifies the output contact and the integrity of the external wiring. A trip command featureprovides a convenient means of tripping the circuit breaker without requiring a test set.
If the relay routinely operates correctly for faults, the actual contact operations are adequate verifica-tion of the relay input/output functions.
3

DIGIT AL RELA y MAINTENANCE PRACTICES
Routine testing was the primary method of detecting protective relay failures. The only other way ofdetermining that a relay failed was to observe a misoperation. Routine testing was scheduled basedon utility experience with the devices in question and the resources available to perfonn the tests.Tests tended to be thorough, but complex and time consuming.
Digital relay routine testing practices should verify relay functions that cannot be fully verified by therelay self-testing. Figure I shows how all relay failures can be detected using a regime consisting of:
.
.
.
.
.
Self-test alann monitoringLoss of signal (LOV, LOI) monitoringReview of relay event reportsPeriodic checks of relay inputs and outputsPeriodic calibration check by comparison
-Routine Tests .
Figure 1: Digital Relay Self- Testing and Monitoring Functions Entirely Replace Traditional
Routine Tests
Relay self-testing and event data analysis detect the majority of relay failures. Monitoring LOV andLOI functions, executing meter tests and Input/Output checks verify the balance of relay functions.Taken together, this reginle replaces complex routine tests. These simple tests can be performedquickly, minimizing the need for complex test equipment.
PROBABILITY APPLIED TO RELA Y TESTING METHODS
Having defmed the necessary tests and monitoring methods, it is now necessary to optimize thetesting interval. Several papers [1,3,4] describe probabilistic methods of deternlining the optimumtest interval for protective relays. Two probability measurements of interest are Abnormal Unavail-ability and Protection Unavailability.
4
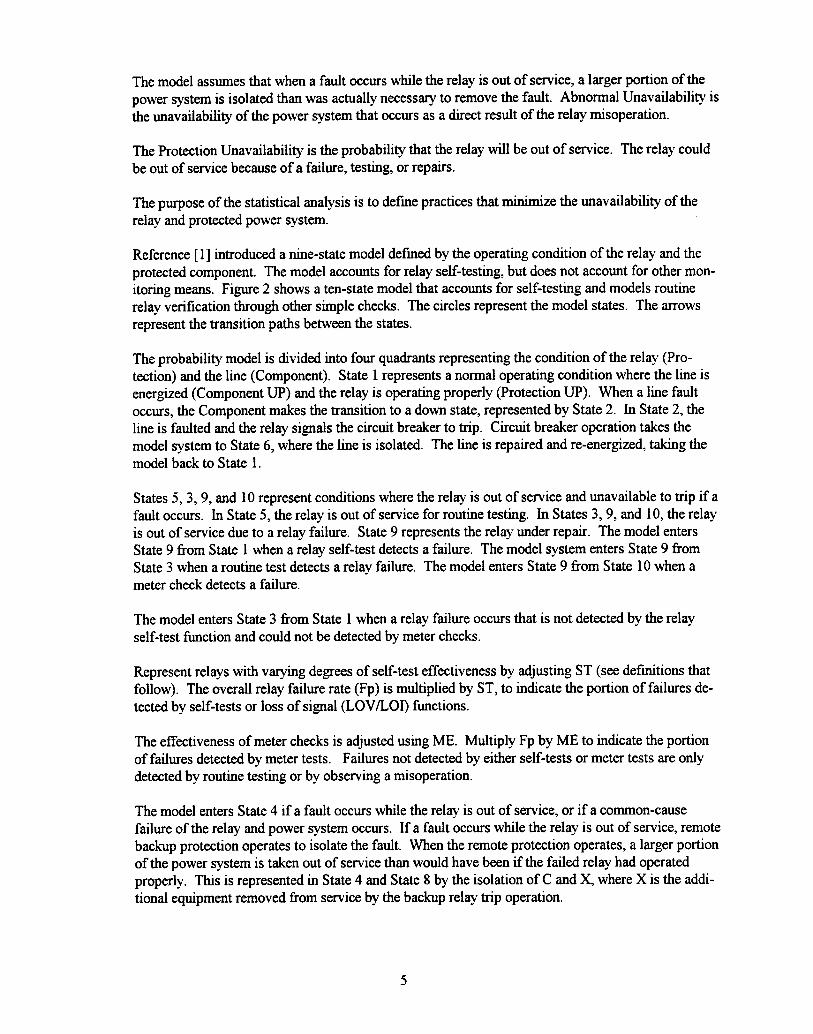
The model assumes that when a fault occurs while the relay is out of service, a larger portion of thepower system is isolated than was actually necessary to remove the fault. Abnorn1al Unavailability isthe unavailability of the power system that occurs as a direct result of the relay misoperation.
The Protection Unavailability is the probability that the relay will be out of service. The relay couldbe out of service because of a failure, testing, or repairs.
The purpose of the statistical analysis is to defme practices that minimize the unavailability of therelay and protected power system.
Reference [ 1] introduced a nine-state model defmed by the operating condition of the relay and theprotected component. The model accounts for relay self-testing, but does not account for other mon-itoring means. Figure 2 shows a ten-state model that accounts for self-testing and models routinerelay verification through other simple checks. The circles represent the model states. The arrowsrepresent the transition paths between the states.
The probability model is divided into four quadrants representing the condition of the relay (Pro-tection) and the line (Component). State 1 represents a normal operating condition where the line isenergized (Component UP) and the relay is operating properly (Protection UP). When a line faultoccurs, the Component makes the transition to a down state, represented by State 2. In State 2, theline is faulted and the relay signals the circuit breaker to trip. Circuit breaker operation takes themodel system to State 6, where the line is isolated. The line is repaired and re-energized, taking themodel back to State 1.
States 5,3,9, and 10 represent conditions where the relay is out of service and unavailable to trip if a
fault occurs. In State 5, the relay is out of service for routine testing. In States 3,9, and 10, the relayis out of service due to a relay failure. State 9 represents the relay under repair. The model entersState 9 from State 1 when a relay self-test detects a failure. The model system enters State 9 from
State 3 when a routine test detects a relay failure. The model enters State 9 from State 10 when a
meter check detects a failure.
The model enters State 3 from State 1 when a relay failure occurs that is not detected by the relayself-test function and could not be detected by meter checks.
Represent relays with valying degrees of self-test effectiveness by adjusting ST (see defmitions thatfollow). The overall relay failure rate (Fp) is multiplied by ST, to indicate the portion of failures de-tected by self-tests or loss of signal (LOV/LOI) functions.
The effectiveness of meter checks is adjusted using ME. Multiply Fp by ME to indicate the portionof failures detected by meter tests. Failures not detected by either self-tests or meter tests are onlydetected by routine testing or by observing a misoperation.
The model enters State 4 if a fault occurs while the relay is out of service, or if a common-causefailure of the relay and power system occurs. If a fault occurs while the relay is out of service, remotebackup protection operates to isolate the fault. When the remote protection operates, a larger portionof the power system is taken out of service than would have been if the failed relay had operatedproperly. This is represented in State 4 and State 8 by the isolation ofC and X, where X is the addi-tional equipment removed from service by the backup relay trip operation.
5
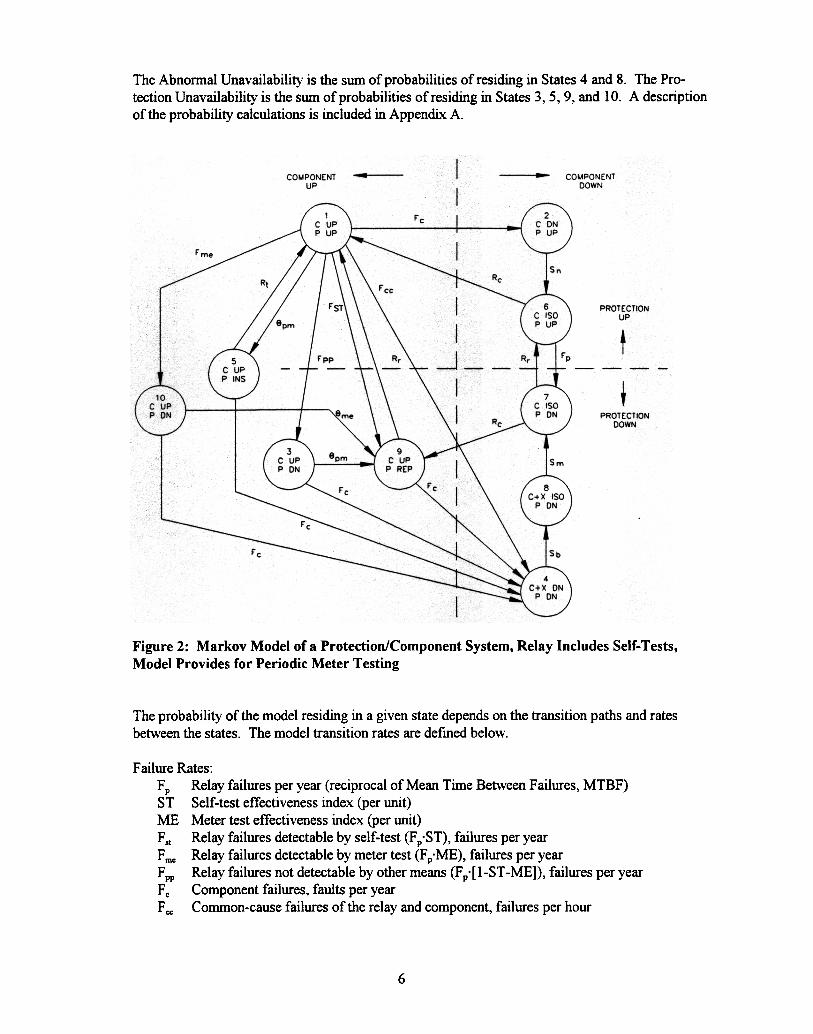
The Abnomtal Unavailability is the sum of probabilities of residing in States 4 and 8. The Pro-tection Unavailability is the sum of probabilities ofresiding in States 3,5,9, and 10. A descriptionof the probability calculations is included in Appendix A.
Figure 2: Markov Model of a Protection/Component System, Relay Includes Self- Tests,Model Provides for Periodic Meter Testing
The probability of the model residing in a given state depends on the transition paths and ratesbetween the states. The model transition rates are defmed below.
Failure Rates:Fp Relay failures per year (reciprocal of Mean Time Between Failures, MTBF)SI Self-test effectiveness index (per unit)ME Meter test effectiveness index (per unit)F .1 Relay failures detectable by self-test (F p'ST), failures per yearF me Relay failures detectable by meter test (F pO ME), failures per yearF pp Relay failures not detectable by other means (F p'[I-ST -ME]), failures per yearF c Component failures, faults per yearF cc Common-cause failures of the relay and component, failures per hour
6
Repair Rates:~ Protected component repairs per hour~ Relay routine inspections per hourR. Relay repairs per hour
Switching Rates:Sn N onnal tripping operations per hour (reciprocal of nonnal fault clearing time)Sb Backup tripping operations per hour (reciprocal ofbackup fault clearing time)Sm Manual isolation operations per hour
Inspection Rates:~ Protection routine inspection interval, hoursepm Protection routine inspection rate (l~~e Protection meter inspection interval, hourseme Protection meter inspection rate (l~e)
Unless otherwise noted, the model uses the following transition rates:
F =
p
R. =~ =
~ =Fcc =
Sn =Sb =
Sm =
0.01 relay failures per year (MTBF = loo years)
0.5 relay repairs per hour2.0 relay routine tests per hour0.5 component repairs per hour1.0 common-cause failure per million hours43200 operations per hour (reciprocal of 5-cycle fault clearing time)10800 operations per hour (reciprocal of 20-cycle backup fault clearing time)0.5 operations per hour (2 hours to isolate component after backup operation)
RESUL TS CALCULA TED USING THE NEW ST A TISTICAL MODEL
From the model, we can calculate the Abnormal Unavailability and Protection Unavailability ofrelays with or without self-tests and with or without meter tests, simply by adjusting the transitionrates that define the model.
Figure 3 shows the Abnormal Unavailability versus routine test interval for a system using a relaythat does not have self-testing, signal monitoring, or metering features. The plot is for a relayprotecting a line that is faulted twice per year. The optimum routine test interval is the point whereAbnormal Unavailability is lowest: approximately 700 hours or 1 month. When the test interval isshorter, the relay is often out of service due to testing. In this area, the relay is being tested too muchand is likely to miss any fault that occurs. When the test interval is longer, the relay becomes morelikely to be out of service because of an undetected problem: the relay is being tested too little.
The model results indicate, to achieve the highest reliability, the relay test interval should be muchshorter than the interval between faults. They also suggest that, if possible, the relay should be left inservice while the tests are performed. This is precisely what automatic self -tests and meter checks dofor digital relays.
7

Figure 3: Optimum Test Interval for a Relay Without Self- Tests
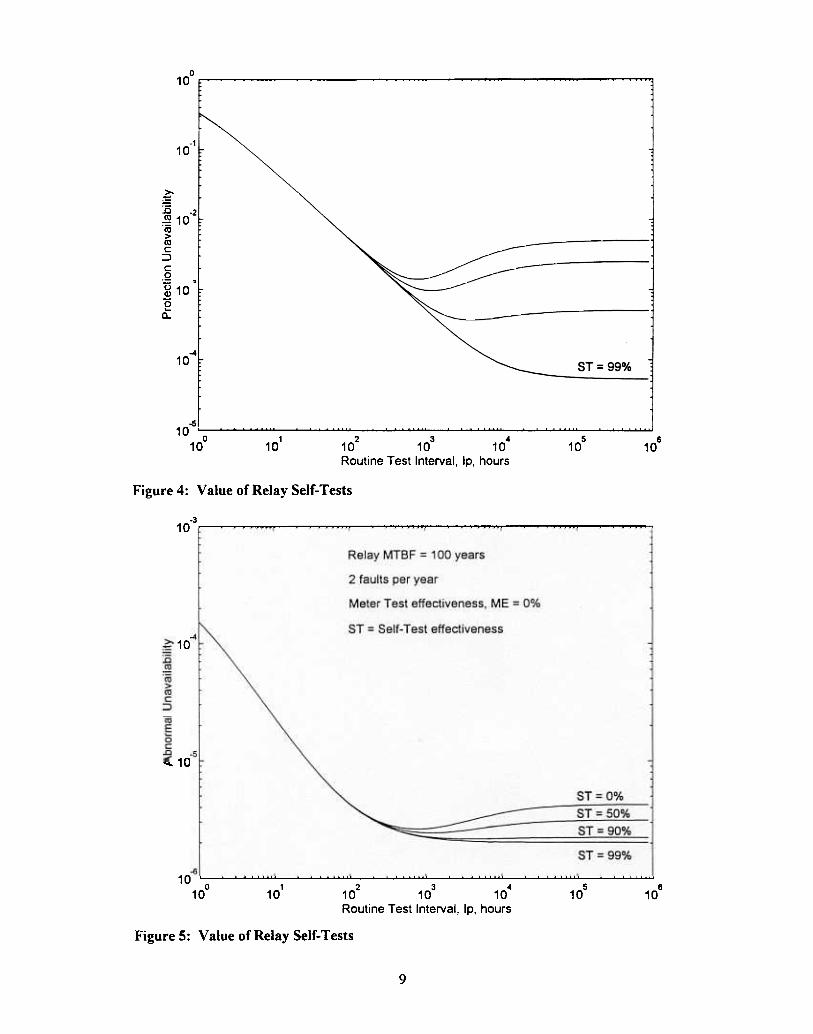
Figure 4 compares relays with and without self-tests on the basis of Protection Unavailability.Figure 4 shows traces representing four types of relay self-tests. When ST = 0%, the relay is notequipped with self-testing. When ST = 50%, the relay self-tests detect half of all relay failuresimmediately. When ST = 90% and 99%, the relay self-tests detect 90% and 99% of relay failures,respectively. In this example, meter tests are not used, therefore failures not detected by self -tests areonly detected when the relay is routine tested or when a misoperation occurs.
Figure 4 shows that a relay without self-tests (ST = 0%) is ten times as likely as a digital relay with
90% self -tests to be out of service due to a relay failure when the routine test interval is 105 hours(approximately II years). The non-self-testing relay is loo times as likely as the relay with 99%self-tests to be out of service. In addition, the relay featuring 99% self-tests shows a decreasingProtection Unavailability as the test interval increases. This relay is less likely to miss a fault if thetest interval is longer. This yields a surprising result: to improve availability, test such a relay lessfrequently. Figure 5 shows the Abnormal Unavailability of the same four systems.
Figures 4 and 5 illusb"ate one further important point: as relay self-test effectiveness increases,
reliance on other testing types can be safely reduced.
8
O , ', ..,'
10
Relay MTBF = 100 years
2 faults per year
Meter Test effectiveness, ME = 0%
ST = Self- Test effectiveness
10
~:0.59..ffi>mc:
::>c:
.2uQ)a'-0..
10ST = 0%
10-..ST = 90%
10 ST = 99%
10.0 11 '2 '3 14 '5 '610 10 10 10 10 10 10
Routine Test Interval, Ip, hours
Figure 4: Value of Relay Self-Tests
.3 I. I , , , ...:
10
Relay MTBF = 100 years
2 faults per year
Meter Test effectiveness, ME = 0%
ST = Self- Test effectiveness
'10
10
ST = 0%
ST = 99%
10 ' 1 , 1 1 1 O 1 2 3 4 5 6
10 10 10 10 10 10 10Routine Test Interval, Ip. hours
Figure 5: Value of Relay Self-Tests
9
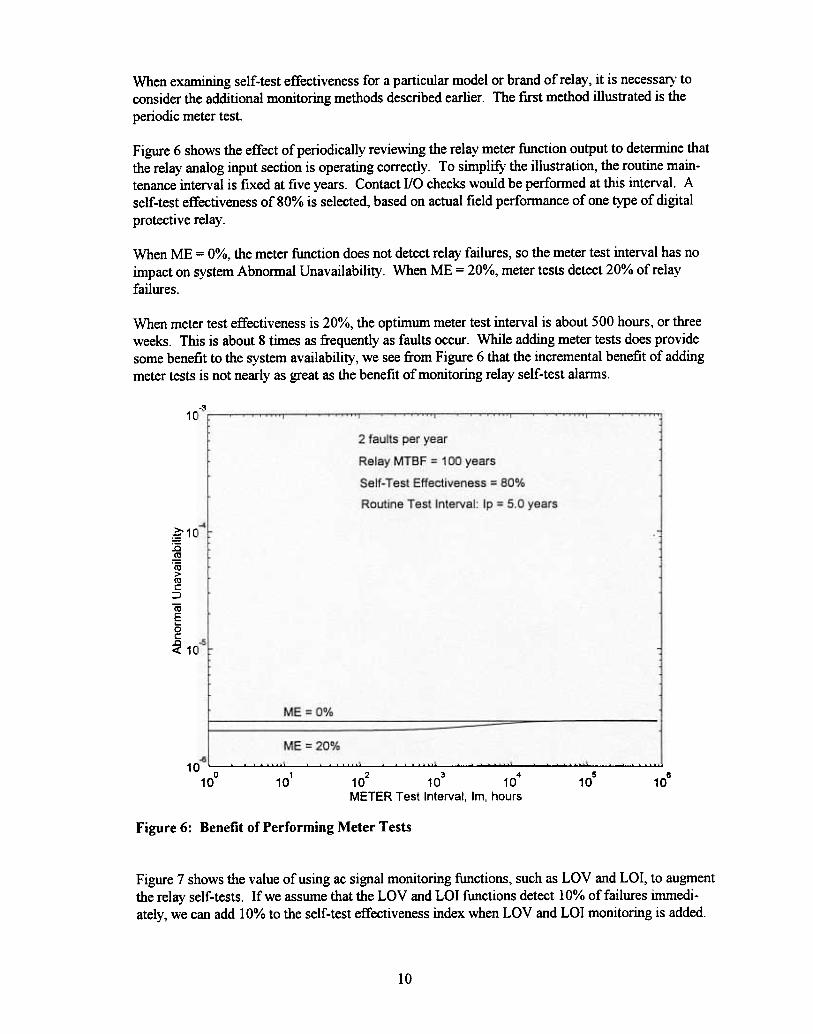
When examining self-test effectiveness for a particular model or brand of relay, it is necessa1)' toconsider the additional monitoring methods described earlier, The fIrst method illustrated is the
periodic meter test,
Figure 6 shows the effect of periodically reviewing the relay meter function output to determine that
the relay analog input section is operating correctly. T o simplify the illustration, the routine main-tenance interval is fiXed at five years. Contact 1/0 checks would be performed at this interval. A
self-test effectiveness of 80% is selected, based on actual field performance of one type of digital
protective relay.
When ME = 0%, the meter function does not detect relay failures, so the meter test interval has noimpact on system Abnormal Unavailability. When ME = 20%, meter tests detect 20% of relay
failures.
When meter test effectiveness is 20%, the optimum meter test interval is about 500 hours, or threeweeks. This is about 8 times as frequently as faults occur. While adding meter tests does providesome benefit to the system availability , we see from Figure 6 that the incremental benefit of addingmeter tests is not nearly as great as the benefit of monitoring relay self -test alarms.
-310
~
~10:0~.ro>roc:;)
-roE...oc
~ 10
~
ME = 20%
10.0 '1 '2 '3 '4 '5 610 10 10 10 10 10 10
METER Test Interval, Im, hours
Figure 6: Benefit of Performing Meter Tests
Figure 7 shows the value of using ac signal monitoring functions, such as LOV and LOI, to augmentthe relay self-tests. If we assume that the LOV and LOI functions detect 10% of failures immedi-ately, we can add 10% to the self-test effectiveness index when LOV and LOI monitoring is added.
10

This is legitimate because the ac signal monitoring functions detect certain types of failures as
quickly as the relay self-tests.
In Figure 7, the trace marked "No Monitoring" asswnes that the utility monitors the relay alarmcontact, but does not monitor the condition of the ac signals using LOV or LOI functions. The self-test effectiveness is 80% and 18% of failures are detected by periodic execution of the meterfunction. The trace marked "Monitoring" asswnes that the utility monitors the self-test alarm anduses available ac signal monitoring functions to detect a total of 90% ofrelay failures immediately.Meter tests detect 8% of failures. In both cases, the remaining 2% of failures are detected by contactinput/output tests performed on a five-year interval.
Figure 7 shows that meter tests decrease the Abnormal Unavailability when executed frequently.However, the value of adding the meter tests is small.
-310
~
~1015~"ro>roc:
::>
roEOc:
~ 10
~
Monitoring: ST = 90%, ME = 8% I
10 1 .1' 1 ..1 Io 1 2 3 4 5 6
10 10 10 10 10 10 10
METER Test Interval, Im, hours
Figure 7: Using AC Signal Monitoring as a Self-Test
Figure 8 shows a plot Protection Unavailability versus routine test interval for three relays. Relay 1has no self-testing. Relay 2 has self-tests with 80% effectiveness. Relay 3 has self-tests with 80%self-test effectiveness, augmented by monitoring of available LOV /LOI functions that detect another18% of relay failures.
11

0
Figure 8: Compare the Benefits of Adding Self- Tests and Loss-of-Signal Monitoring
CONCLUSIONS
The features of digital relays reduce routine tests to a vel)' short list: meter checks and input/outputtests. Relay characteristic and timing checks are not a necessary part of routine maintenance tests for
digital relays.
Monitor the relay self-test alann contact. Even if self-test effectiveness is low, there is significantimprovement in the relay and power system availability when relay failures are detected and quickly
repaired, as shown in Figure 8.
Monitor AC signal functions that detect the loss of relaying voltage and current, if available. Whenused, these functions extend the capabilities of the relay self-tests.
Perform meter checks on an infrequent basis. The value of meter checks is to verify relay calibration.
Verify contact input/output operation by reviewing relay event reports, or through tests executedwhen the line is out of service for other reasons. This minimizes the impact of the test on the relay
availability.
12
Use the digital relay reporting functions as maintenance tools. Event report analysis should supple-ment or replace routine maintenance checks of relays with self -tests. Event report analysis increasesa tester's understanding of the digital relay and of the power system.
REFERENCES
I. "Philosophies for Testing Protective Relays," by E. 0. Schweitzer, III, J. J. Kumm, M. S.Weber, and D. Hou, Schweitzer Engineering Laboratories, Inc., lOth Western Protective RelayConference, Spokane, Washington, October, 1993.
2. "Analysis of Event Reports," by J. B. Roberts and E. 0. Schweitzer, III, Schweitzer EngineeringLaboratories, Inc., 16th Western Protective Relay Conference, Spokane, Washington, October,1989.
3, "An Improved Model for Protective-System Reliability," by P. M. Anderson and S. K. Agarwal,
Power Math Associates, Inc., IEEE Transactions on Reliability Volume 41, No.3, 1992
September.
4. "Graph Theory Concepts in Frequency and Availability Analysis," by Sudhir Kumar and RoyBillinton, University of Saskatchewan, IEEE Transactions on Reliability Volume R-34, No.4,1985 October.
BIOGRAPHIES
Edrnund 0. Schweitzer. III is President of Schweitzer Engineering Laboratories, Inc., Pullman,Washington, U.S.A., a company that designs and manufactures microprocessor-based protectiverelays for electric power systems. He is also an Adjunct Professor at Washington State University.He received his BSEE at Purdue University in 1968 and MSEE at Purdue University in 1971. Heearned his PhD at Washington State University in 1977. He has authored or co-authored over 3 Otechnical papers. He is a member of Eta Kappa Nu and Tau Beta Pi.
Daging Hou received BS and MS degrees in Electrical Engineering at the Northeast University,China, 1981 and 1984, respectively. He received his PhD in Electrical and Computer Engineering atWashington State University in 1991. Since 1990, he has been with Schweitzer Engineering Labora-tories, Inc., Pullman, Washington, U.S.A., where he is currently a research engineer. His workincludes system modeling, simulation, and signal processing for power system digital protectiverelays. His research interests include multivariable linear systems, system identification, and signalprocessing. Hou is a member of the IEEE and has authored or co-authored several technical papers.
John J. Kumm received his BSEE degree at the University of Idaho in 1989. Since 1989, he has beenwith Schweitzer Engineering Laboratories, Inc., Pullman, Washington, U.S.A., where he is cun-entlyan application engineer. His work includes product support and specification. He is a member ofIEEE Power Engineering Society .
13

~
APPENDIX A
Calculate the probability that the model will reside in a given state using a Markov Transition Matrixor using the flow graph method [4]. We used a PC-based matrix calculation software, MatLabTM, toperform the matrix calculations. All the transition rates must fIrst be converted to operations perhour. The Markov Transition Matrix is assembled from the transition rates and manipulated asshown in the equations below. The resulting vector, P, includes the probability of the systemresiding in any of the ten states.
Markov Transition Matrix for the ten-state system sho\\1l in Figure 2 is:
epm
o
o
o
O
Sn
O
0
O
o
o
o
o
0
Fp
o
0
0
Sb
0
0
0
F st
O
epm
o
o
0
Rc
O
FIne
0
0
0
0
0
0
0
O
F pp
0
F cc
O
Fca))
O
0
0
0
0
0
O
a44
Fc
O
0
O
Fc
Fc
T =ass
O
0
0
0
O
a66
Rr
O
0
O
a77
Sm
O
0
ass
O
O
a99
eme a 00
+ F st + F pp + epm + F me)all = 1 -(F c + F cc
a22 = 1 Sn
a33 = 1 (epm + Fc)
a44 = 1 Sb
a55 = 1 (Rt + Fc)
a66 = 1 (Rc + Fp)
a77 = 1 (Rr + Rc)
a88 = 1 Sm
a99 = 1 (Rr + Fc)
aoo = 1 (eme + Fc)
pT = [Pl P2 PJ P4 Ps P6 P7 P8 Pg P1O]
P T .I = P T or P T .[1 -I] = 0
where I = Identity Matrix
and ~ Pi = 1
1
Abnormal Unavailability, AbUn = P4 + Pa'
Protection Unavailability, ProtUn = PJ + Ps + Pg + PIO
14
Fc
a22
O
0
0
0
0
0
0
0