assessing the - sustainable sanitation alliance
TRANSCRIPT

G U I D E L I N E S F O R
Assessing the Risk to Groundwater
from On-SiteSanitation

BRITISH GEOLOGICAL SURVEY
COMMISSIONED REPORT CR/01/142
Guidelines for Assessing the Risk to Groundwater from On-Site Sanitation
A R Lawrence, D M J Macdonald
British Geological Survey, UK
A G Howard1, M H Barrett, S Pedley
Robens Centre for Public and Environmental Health, UK (1 presently with Water, Engineering and Development Centre, UK)
K M Ahmed
University of Dhaka, Bangladesh
M Nalubega
Key words
Groundwater, water supply, sanitation, boreholes, wells, springs, risk assessment, monitoring, guidelines
Bibliographical reference
ARGOSS 2001. Guidelines for assessing the risk to groundwater from on-site sanitation. British
Geological Survey
Commissioned Report, CR/01/142. 97pp.
© NERC 2001 British Geological Survey 2001
Makerere University, Uganda


The full range of Survey publications is available from the BGS Sales Desks at Nottingham and Edinburgh; see contact details below or shop online at www.thebgs.co.uk The London Information Office maintains a reference collection of BGS publications including maps for consultation. The Survey publishes an annual catalogue of its maps and other publications; this catalogue is available from any of the BGS Sales Desks. The British Geological Survey carries out the geological survey of Great Britain and Northern Ireland (the latter as an
agency service for the government of Northern Ireland), and of the surrounding continental shelf, as well as its basic
research projects. It also undertakes programmes of British technical aid in geology in developing countries as arranged by
the Department for International Development and other agencies.
The British Geological Survey is a component body of the Natural Environment Research Council.
Keyworth, Nottingham NG12 5GG
� +44 115-936 3241 Fax +44 115-936 3488 e-mail: [email protected] www.bgs.ac.uk Shop online at: www.thebgs.co.uk
Murchison House, West Mains Road, Edinburgh EH9 3LA
� +44 131-667 1000 Fax +44 131-668 2683 e-mail: [email protected]
London Information Office at the Natural History Museum (Earth Galleries), Exhibition Road, South Kensington,
London SW7 2DE
� +44 20-7589 4090 Fax +44 20-7584 8270 � +44 20-7942 5344/45 email: [email protected]
Forde House, Park Five Business Centre, Harrier Way, Sowton, Exeter, Devon EX2 7HU
� +44 1392-445271 Fax +44 1392-445371
Geological Survey of Northern Ireland, 20 College Gardens, Belfast BT9 6BS
� +44 28-9066 6595 Fax +44 28-9066 2835
Maclean Building, Crowmarsh Gifford, Wallingford, Oxfordshire OX10 8BB
� +44 1491-838800 Fax +44 1491-692345
Parent Body
Natural Environment Research Council, Polaris House,
North Star Avenue, Swindon, Wiltshire SN2 1EU
� +44 1793-411500 Fax +44 1793-411501 www.nerc.ac.uk
BRITISH GEOLOGICAL SURVEY

Foreword 4
Acknowledgements 5
1. Overview 6
PART 1: BACKGROUND AND RATIONALE
2. Water supply and sanitation choices 14
2.1 Health implications 14
2.2 Water quality problems and contamination indicators 15
2.3 Types of sanitation and their potential impacts 17
2.4 Groundwater supplies 19
2.5 Risk: source-pathway-receptor 20
3. Technical background 23
3.1 Importance of groundwater 23
3.2 Aquifer vulnerability to pollution and risks to groundwater supplies 24
3.3 Hydrogeological environments 25
3.3.1 Unconsolidated aquifers 25
3.3.2 Consolidated sedimentary aquifers 27
3.3.3 Weathered basement aquifers 27
3.4 Sources of contamination 28
3.4.1 Sanitation 28
3.4.2 Other sources of faecal contamination 28
3.5 Contaminants associated with on-site sanitation 30
3.5.1 Microbiological 30
3.5.2 Chemical 32
3.6 Attenuation of contaminants in the subsurface 33
3.6.1 Attenuation of microbiological contaminants 33
3.6.2 Definition of risk categories for microbiological contamination via aquifer pathways 34
3.6.3 Attenuation of chemical contaminants 36
3.7 Pathways for localised contaminantion 36
3.7.1 Design and construction of groundwater supplies 37
3.7.2 Sanitary protection measures at headworks 39
Contents

PART 2: THE GUIDELINES
4. First-step risk assessment 44
4.1 Introduction 44
4.2 Assessing the risk of microbiological contamination of groundwater supplies via
aquifer pathways 45
4.2.1 Installation of groundwater supplies where on-site sanitation already exists, or in combination
with the installation of on-site sanitation 45
4.2.2 Installing on-site sanitation alone, where groundwater supplies already exist 51
4.3 Assessing the risk of nitrate contamination of groundwater supplies as a result of
widespread aquifer contamination 51
4.4 Assessing the risk of microbiological contamination due to pathways created by
construction of the groundwater supply 56
5. Ongoing assessment of risk through monitoring 61
5.1 Introduction 61
5.2 Why monitor? 61
5.2.1 Monitoring to provide confidence in design 61
5.2.2 Monitoring to establish cause of contamination 63
5.2.3 Health-based surveillance 63
5.2.4 Monitoring to evaluate trends in water quality and risks 64
5.3 How to monitor 65
5.4 When and where to monitor? 68
5.5 Data analysis and interpretation 70
5.5.1 Localised versus widespread contamination 70
5.5.2 Widespread microbiological contamination 70
5.5.3 Widespread chemical contamination 71
5.5.4 Localised microbiological contamination 72
5.6 Follow-up action 74
5.7 Community participation in monitoring 75
References and further reading 78
Glossary 80
Appendix A - Worked examples 84
Appendix B - Full page versions of selected graphs 90
Appendix C - Sanitary inspection forms 94

Figures2.1. Principal elements of faecal–oral disease transmission
2.2. Examples of on-site sanitation design
2.3. Typical groundwater supply designs
2.4. The source—pathway—receptor concept
2.5. Natural and man-made pollution pathways to groundwater supplies
3.1. The groundwater flow system
3.2. Illustration of types of voids within rocks
3.3. Thick sediments associated with rivers and coastal regions
3.4. Mountain valley sediments
3.5. Minor sediments associated with rivers
3.6. Weathered bedrock aquifers
3.7. Sources of faecal pollution within urban and rural settings
3.8. Attenuation processes within the unsaturated and saturated zones
3.9. Pathogen diameters compared with aquifer matrix apertures
3.10. Pathways for contamination into groundwater supplies
3.11. Sanitary protection measures for springs and boreholes
4.1. Flowchart for assessing the risk of microbiological contamination of groundwater supplies via
aquifer pathways
4.2. Attenuation mechanisms within unsaturated zone
4.3. Grain sizes of a range of sediment types
4.4. Attenuation with depth below water-table
4.5. Travel time for the flow to a borehole screen from the water-table for a range of pumping rates and
screen depths, and a series of aquifer porosities and Kh:Kv ratios
4.6. Increased lateral separation between pollution source and groundwater supply reduces risk
4.7. Flow chart for assessing the risk of microbiological contamination of groundwater supplies via
aquifer pathways where groundwater supplies exist and only on-site sanitation is being installed
4.8. Flow chart for assessing the risk of nitrate contamination of groundwater supplies as a result of
widespread aquifer contamination
4.9. Simplified relationship between average annual rainfall and groundwater recharge
4.10. Estimated nitrate concentration in groundwater recharge based on population density and average
annual recharge
4.11. Where boreholes are deep, the onset of high nitrate concentrations will be significantly delayed due
to the time taken for the front of high nitrate waters to reach the borehole inlet
4.12. Flow chart for assessing the risk of microbiological contamination due to pathways created by
construction of the groundwater supply
5.1. Flow chart for monitoring of groundwater supplies
5.2. Correlation of nitrate and chloride concentrations in groundwater beneath Santa Cruz, Bolivia
5.3. Flow chart for identifying the appropriate response to localised contamination of groundwater
supplies
GUIDEL INES FOR ASSESS ING THE R ISK TO GROUNDWATER FROM ON-S I TE SANITAT ION2
Index of figures and tables

Tables2.1. Advantages and disadvantages of different sanitation systems
3.1. Typical permeability values for various rock types
3.2. Aquifer vulnerability subdivided into four broad classes
3.3. Principal hydrogeological environments and their associated pollution vulnerability
3.4. Illnesses acquired by ingestion of faecally contaminated water
3.5. Sanitary protection measures required for different sources
3.6. Pathways and indirect factors influencing contamination of groundwater sources
4.1. Characteristics of hydrogeological environments relevant to risk assessment
4.2. Hydraulic loading associated with on-site sanitation types
4.3. Assessment of risk following attenuation of micro-organisms within the unsaturated zone
4.4. Typical aquifer properties for a range of rock types and feasibility of using horizontal separation
4.5. Percentage of potential nitrate in groundwater recharge likely to leach from a pit latrine to the water-
table in a range of hydrogeological environments
4.6. Potential for time-delay in the onset of nitrate problems
4.7. Key criteria for headworks design
5.1. Parameters to monitor, equipment needed and requirements for sampling
5.2. A comparison of field and laboratory analysis of samples
5.3. Broad guidance on the frequency of monitoring
5.4. Elements to check when re-evaluating the ‘first-step risk assessment’
5.5. Approximate travel times in various aquifer systems to indicate likely times before onset of chemical
contamination
5.6. Percent frequency of reporting from an assessment of springs in a town in south-west Uganda
5.7. Percent frequency of reporting of sanitary risk factors against water quality categories from boreholes
in two towns in Uganda
GUIDEL INES FOR ASSESS ING THE R ISK TO GROUNDWATER FROM ON-S I TE SANITAT ION 3

GUIDEL INES FOR ASSESS ING THE R ISK TO GROUNDWATER FROM ON-S I TE SANITAT ION4
Foreword
There has been encouraging progress with access to safe drinking water and sanitation in both rural and
urban areas since the United Nations Water Decade of the 1980s. However, more than 1 billion people
around the world still lack access to safe water supplies and more than 2.4 billion are without adequate
sanitation. A substantial majority of these people live in Asia where the lack of sanitation provision is
particularly acute. In Africa, over one third of the population still remains without access to safe water and
sanitation, and many of these can only be served by groundwater. The need for renewed efforts to
improve the situation is recognised in DFID’s recently published water strategy paper – "Addressing the
Water Crisis - Healthier and More Productive Lives for Poor People".
The health benefits of safe water supply are only properly realised when programmes combine safe water
supply with sanitation and the promotion of safe hygiene practice. With increasing population, the
pressure on land in all cities is becoming intense. High levels of pollution are increasing the risk to
groundwater from sanitation and drainage facilities.
These guidelines are an important contribution to risk assessment and the avoidance of the contamination
of groundwater supplies from on-site sanitation. They have been developed as part of a project funded by
DFID through the water component of the Infrastructure and Urban Development Division’s Knowledge
and Research Programme.
Ian Curtis
Senior Water Resources Adviser
Department for International Development, UK

Acknow ledgement s 5
Acknowledgements
The authors would like to thank those who have contributed both directly and indirectly to the
production of this manual:
The staff of the following organisations who have been involved with the field-testing of the manual
Bangladesh: Department of Public Health Engineering of the Government of Bangladesh,
Terre Des Hommes, WaterAid, the World Health Organisation and UNICEF
Uganda: Action Contre Faim, Ruwasa, WaterAid
Those individuals who provided detailed reviews of the document including Stephen Foster (BGS), Jeremy
Ockelford (Consultant Engineering Advisor to DFID) and Simon Trace and colleagues (WaterAid).
Those who attended project workshops in Dhaka and Kampala and provided valuable feedback on the
manual.
The staff of the British Geological Survey, the Robens Centre for Public and Environmental Health, the
Geology Department of the University of Dhaka and the Civil Engineering Department of Makerere
University, Kampala who have been involved in the ARGOSS Project.
The World Health Organisation for providing additional funding for the ARGOSS Project.
This manual has been produced for the Department of International Development (DFID) under the
Knowledge and Research Programme as part of the UK provision of technical assistance to developing
countries. The manual is an output of project R6869, ‘Assessing Risk to Groundwater from On-Site
Sanitation – ARGOSS’. The views expressed are not necessarily those of DFID.

GUIDEL INES FOR ASSESS ING THE R ISK TO GROUNDWATER FROM ON-S I TE SANITAT ION6
Overview1PurposeMany people in developing countries rely upon
untreated groundwater supplies for their drinking
water. These supplies are obtained from drilled
boreholes or tubewells, dugwells and springs.
Such sources are usually of good quality and
much better than some traditional sources of
supply, for example ponds and streams. However,
groundwater can become contaminated and there
is special concern that the introduction of on-site
sanitation systems may in certain circumstances
contribute to contamination of drinking water
supplies.
The purpose of this manual is to provide
guidance on how to assess and reduce the risk of
contamination of groundwater supplies from on-
site sanitation systems and is aimed at those
responsible for planning low cost water supply
and sanitation schemes. Specific objectives
include providing:
● guidance where water supply and/or sanitation
systems are planned;
● confidence that existing groundwater supplies
are properly constructed (pollution risk is
assessed as low and monitoring confirms good
quality water);
● help to identify the likely source(s) and
pathway(s) of pollution where pollution is
observed;
● guidance on the planning of monitoring
programmes.
The need for such a manual is apparent given
the importance of groundwater for water supply
and the lack of any existing decision making
guidelines. The manual does not seek to provide a
set of prescriptive rules but instead to provide the
framework for arriving at a decision based on an
evaluation of the risks posed by on-site sanitation
systems to groundwater drinking water supplies
in different settings or environments. However,
the risk needs to be balanced by the requirements
of the user community, the cost of design, and the
quality of supply. Decisions on what risks are
acceptable will vary with location and situation.
The guidelines developed needed to meet
certain criteria:
● only easily available or known data are required
when making a risk-based evaluation;
● the tables and figures provided to aid the
decision-making process are easy to use and
require only basic understanding of
geology/hydrogeology;
● the approach is rational and transparent.
It is anticipated that the readership for this
manual will include both those with good technical
knowledge of the problem (e.g. water and
sanitation engineers) and those who are less
familiar with the scientific and technical arguments.
This manual aims to be accessible to everyone with
a role in the planning of water supply and
sanitation at programme level.
An overview of the manualThe manual can be conveniently subdivided into
two parts:
Part 1: the background to the problem which
provides the rationale for the guidelines in Part 2
Chapter 2: Water supply and sanitation choices.
Water supply and sanitation is set within the
context of other measures that can be taken to
reduce the incidence and prevalence of infectious
disease caused by pathogenic micro-organisms. In
relation to water quality, the role and value of
indicator bacteria is discussed (it is not feasible to
test for all pathogens in water so water quality
monitoring is based on the occurrence of bacteria
that indicate the presence of faecal contamination).
The advantages and disadvantages of a range of
sanitation types are presented, including both off-
site and on-site sanitation. The main groundwater

Ove r v i ew 7
supply types are described.
Chapter 3: Technical background
The role of groundwater and basic
hydrogeological terms used in the manual are
defined. Contamination from on-site sanitation
can reach groundwater supplies by a range of
pathways. In the manual these are grouped into
pathways through the main body of the aquifer
and pathways created by the design and
construction of the groundwater supply (localised
pathways). In relation to the aquifer pathway, the
concept of aquifer pollution vulnerability is
presented. This represents the intrinsic
characteristics of the aquifer, which determine
whether it is likely to be affected by a contaminant
load. The vulnerability is assessed based on travel
time for water to move from the ground surface to
the water-table. The greater the travel time the
greater the opportunity for contaminant
attenuation.
The broad range of hydrogeological environments
are described in terms of this vulnerability.
A brief overview of sources of faecal
contamination is given. The contaminants
associated with on-site sanitation are discussed,
i.e. microbiological and chemical, primarily
nitrate. Their persistence, mobility and effect on
health are described. The attenuation processes
that control the numbers or concentration of the
contaminants is key to understanding the risks
from on-site sanitation. The discussion of
microbiological contaminant attenuation leads on
to a definition of categories of risk, significant,
low and very low. These are defined in terms of
travel time in the subsurface from the
contaminant source to the groundwater supply.
They relate to levels in confidence that abstracted
groundwater for drinking will meet the WHO
guidelines for indicator bacteria. It is emphasized
that the lack of indicator bacteria does not
necessarily mean that more persistent pathogens
will have been removed from water entering the
supply.
As well as following a pathway through the
aquifer from source to supply, contamination of
groundwater supplies can also occur via pathways
introduced by the design and construction of the
borehole, dugwell or spring. Key issues are
highlighted both for the design and construction
of groundwater installations and for sanitary
protection measures at the headworks.
Maintenance of the headworks and the
surrounding area over time is also of prime
importance if the measures that have been put in
place are not to deteriorate. This issue is
addressed here and in Chapter 5 of the guidelines.
Part 2: the guidelines with explanatory notes
Chapter 4: First-step risk assessments
Three risk assessments are presented based on
combinations of contaminant type and pathway.
Assessing the risk of microbiological
contamination of groundwater supplies via
aquifer pathways.
The assessment is made in 4 steps.
● Background data are collected on the basic
geology, the depth to water-table and the
sanitation system used or planned to be used;
● likely attenuation in the unsaturated zone
is assessed;
● if this is not considered sufficient for the risk
to be acceptable, an assessment is made for
boreholes as to whether it is possible to place
the screen section of the borehole at sufficient
depth such that the travel time is increased to
the point where the risk is acceptable;

GUIDEL INES FOR ASSESS ING THE R ISK TO GROUNDWATER FROM ON-S I TE SANITAT ION8
● for dugwells and springs, and boreholes where
vertical separation is not appropriate,
assessment is made as to whether it is feasible
to laterally separate the potential pollution
sources and supply so that the risk is
acceptable.
Where there is a residual risk, options are
suggested.
Assessing the risk of nitrate contamination of
groundwater supplies as a result of widespread
aquifer contamination.
Estimating nitrate leaching is at best approximate.
This risk assessment seeks to indicate only
whether or not a potential risk is likely. A critical
element in assessing risk of widespread nitrate
contamination of an aquifer is to consider the
short and long-term water supply and sanitation
plan. Generally nitrate does not degrade in
shallow aquifers. In some cases the use of shallow
groundwater may be viewed as a short-term
intervention, the long-term aim being to develop a
piped distribution network based on surface water
or distant groundwater sources. In this situation
concerns over nitrate in groundwater may be
relatively limited and the potential benefits of
improved sanitation may outweigh the risks. In
other situations, however, long-term water supply
may be based on continued use of groundwater.
The risk assessment provides simple tools for
estimating nitrate leachate concentrations and
discusses the sustainability of groundwater usage
within a range of environments.
Assessing the risk of microbiological
contamination due to pathways created by
construction of the groundwater supply
Reducing the risk of contamination via localised
pathways is achieved firstly by keeping potential
pollution sources away from the immediate
vicinity of the water supply and secondly by
minimising the pathways created by the design or
construction of the supply. The assessment is
divided into two steps, the first assessing the
sanitary conditions of the headworks and the
second the sanitary provisions below ground
surface.
Chapter 5: Ongoing assessment of risk through
monitoring
Risk assessment does not end with the
construction of the groundwater supply and/or
the sanitation facility. Monitoring is a key element
of any water supply and sanitation programme.
Why monitor
This section reviews the objectives of water
quality monitoring covering four different types of
monitoring:
● providing confidence in the design of water
and sanitation programmes as a means of
verifying the decisions made on the basis of
the first-step risk assessment;
● establishing the cause of contamination when
this has been found, as a means of
determining a remedial action;
● health-based surveillance to ensure that water
quality meet health-based standards and
guidelines;
● evaluating trends in water quality and risk
over time so that changes can be identified
and actions taken.
How to monitor
This section discusses the ways in which
monitoring programmes can be designed and how
data can be collected. It provides information
concerning:
● the selection of water quality parameters and
the facilities and equipment that are required.
● the advantages and disadvantages of field and
laboratory approaches and the cost
implications of each approach.

Ove r v i ew 9
● how to perform a sanitary inspection and the
use of sanitary inspections in monitoring.
When and where to monitor
This section discusses the numbers, frequency and
location of sampling points. These decisions are
influenced by a number of factors:
● the objectives of the monitoring and the
resources available;
● it is often not possible to test all water supplies
and a sample of water supplies is selected for
the monitoring programme. These should be
representative of the different environments
and water supplies in the country;
● water quality often deteriorates during the wet
seasons and this should be taken into account
when planning sampling programmes;
● chemical quality often varies less significantly
than microbiological quality and so need less
frequent testing.
Data analysis and interpretation
This section provides guidance on how data can
be analysed, interpreted and used:
● whether contamination is localised or
widespread and the indicators that help
interpreting the scale of the contamination;
● how to investigate the causes of widespread
contamination in aquifers and to interpret
water quality data in relation to flow rates;
● how to investigate the cause of localised
contamination and how to carry out analysis
of water quality and sanitary inspection data
in order to identify which factors are most
likely to be influencing water quality;
● how to use the data and initiate follow-up
actions to improve water quality;
● how communities can be involved in
monitoring, what roles they can play and how
they may use the data.
The manual as a tool for planning water supply
and sanitation programmes
The manual is designed to help those people who
are involved in the planning and design of water
and sanitation programmes. This may include
technical staff such as engineers and
hydrogeologists, but will also include programme
managers and others making management
decisions.
Reading the manual
The structure of the manual allows readers with
different levels of understanding of hydrogeology
and water and sanitation to use the manual in
different ways. For those readers who have very
little knowledge about groundwater, it is useful to
read Part 1 (Chapters 2 and 3) before using the
guidelines in Part 2. Part 1 of the manual provides
some useful background information. All readers
should make sure that they understand the health
impacts of poor water supply, sanitation and
hygiene contained in Chapters 2 and 3 as this is
critical to making decisions about planning water
and sanitation facilities. It is also important that all
readers understand the different severity of risk
posed by different types of contaminant and the
potential for reducing these risks through
separating on-site sanitation and water supplies.
Readers who already have a good understanding
of the health, groundwater and water supply and
sanitation options may not need to read Chapters
2 and 3 in detail and may wish to go straight to
the guidelines contained in Part 2 (Chapters 4 and
5). When using the guidelines, two approaches
are presented: first-step risk assessments using
simple hydrogeological and engineering
information to make decisions about locating on-
site sanitation and water supplies; and, ongoing
risk assessment through monitoring. These
approaches are complementary and even where

GUIDEL INES FOR ASSESS ING THE R ISK TO GROUNDWATER FROM ON-S I TE SANITAT ION10
the first-step risk assessment has been
undertaken, ongoing risk assessment through
monitoring is recommended to ensure that
changes over time can be identified and remedial
actions taken. Where the first-step risk assessment
is difficult to perform, perhaps because of limited
data, then planning can be based on the outputs
of monitoring. However, it is recommended that
even in such cases, the data needed for the first-
step risk assessment is collected and the risk
assessment procedure followed.
Using the guidelines in planning
It is important that when planning water supply
and sanitation programmes that an integrated
approach is taken to the design, construction and
location of the two elements. Planning of water
supply and sanitation facilities often requires
sound technical competence. However, it is now
widely accepted that communities and users of
facilities must be actively involved in water and
sanitation programmes from the design stage, as in
many cases, communities will undertake
management of the water and sanitation facilities.
These guidelines are supportive of such a process
as they use a flexible approach to managing risk
that allows compromises to be made between the
level of risk accepted in drinking water and the
health consequences of poor sanitation. Therefore,
it is expected that these guidelines should help
water and sanitation programmes to provide more
information to communities to help them make
better informed decisions about technologies and
risks to their health.
The principal components of the major water
supply and sanitation technologies are described
in the guidelines, however, readers are
encouraged to consult other documents on the
design of different technologies and the
implementation of water and sanitation
programmes, to help make decisions about how
risks can be managed. Some suggested texts are
provided in the Reference section at the end of the
document. It may be necessary when addressing
elements of the decision-making process within
the guidelines to refer to organisations with
expertise in the relevant topic.
These guidelines are based on the best available
scientific evidence. However, research on the
movement and attenuation of pathogens in the
subsurface is not at all extensive, in particular
there have been few well-documented studies
from developing countries. Nevertheless, this
manual fulfils an important role given the pressing
need for guidelines that address the design,
construction and relative siting of groundwater
supplies and sanitation. These guidelines should
be seen as a first step only and as more data and
research become available the manual will need to
be updated and revised.
Using the guidelines at a national level
These guidelines provide a clear and easy to
follow approach to assessing risks to groundwater,
however, it has been prepared as a document with
broad application in developing countries and
therefore cannot provide detailed information on
every hydrogeological environment. Furthermore
the guidelines present a process of risk
assessment. By following this process, specific
guidance in terms of lateral separation distances,
technologies used and design criteria may be
developed in each country and for different
hydrogeological regimes within each country.
At a national level, it is likely to be useful for the
guidelines to be used to define a set of design and
planning criteria for water and sanitation
programmes that are specific to local conditions.
The guidelines provide the basis for this approach

Ove r v i ew 11
and allow the user to define more precise limits
acceptable to local populations.
Links to other documents on groundwater
This manual is designed as a document to help
decision-making in programmes. The approach
presented is underpinned by proven scientific
evidence and fieldwork. However, as a document
designed for use in planning, the manual does not
present all the scientific arguments and evidence
as this would make the document much larger
and would be less user-friendly for routine
consultation.
Much fuller and complete discussion of the
scientific principles and evidence drawn on in the
manual is available in two other related
documents. There is a scientific review/case study
report that is a companion to this manual and is
available from the ARGOSS project. This
document provides the key arguments for the
approach presented and provides detailed
descriptions of case studies undertaken by the
ARGOSS project in Uganda and Bangladesh, as
well as related case studies from other countries. It
is recommended that readers consult these case
studies for more information about data analysis.
In addition, there is also a WHO monograph in
preparation (Protecting groundwater for health: a
guide to managing drinking water sources) that
also contains useful material on the health impacts
of contamination of groundwater. As members of
the ARGOSS team have been actively involved in
the preparation of this document, it provides a
useful background to many of the principles used
within the ARGOSS project.

12 GUIDEL INES FOR ASSESS ING THE R ISK TO GROUNDWATER FROM ON-S I TE SANITAT ION

13
Part 1:
Background and rationale

GUIDEL INES FOR ASSESS ING THE R ISK TO GROUNDWATER FROM ON-S I TE SANITAT ION14
The provision of water and sanitation facilities are
important public health measures that contribute
significantly to the reduction in the disease
burden of populations. The provision of such
facilities is also critical to socio-economic
development and has important equity
implications as increasing numbers of
international protocols and national policies
emphasise the ‘rights-based’ approach to
development.
Whilst the absence of water and sanitation
facilities is associated with high rates of disease
incidence and prevalence and high infant
mortality rates, it is important that the
improvement of water and sanitation should be
integrated and properly planned. One of the
outcomes of poorly planned water and sanitation
programmes may be the contamination of
drinking water by faecal matter derived from on-
site sanitation.
This chapter provides an overview of the water
supply and sanitation choices available, discusses
the possible contamination of groundwater
supplies in the context of infectious disease
transmission and assesses the value of present
methods for indicating faecal contamination of
groundwater.
2.1 Health implicationsThe improvement of water and sanitation in
developing countries is largely driven by the need
to reduce the incidence and prevalence of
infectious disease caused by pathogenic micro-
organisms. The majority of pathogens that affect
humans are derived from faeces and transmitted
by the faecal-oral route. Pathogen transmission
may occur through a variety of routes including
food, water, poor personal hygiene and flies, see
Figure 2.1. Thus in order to reduce the health
burden caused by infectious disease,
interventions are required in excreta disposal (to
remove faeces from the environment), water
supply (to prevent consumption of water
containing pathogens) and hygiene education (to
prevent transmission from contaminated hands
into food or water).
2 Water supply and sanitation choices
Excreta
Flies
Food
Mouth
HandsWater
These guidelines are designed to protect
public health by ensuring that the quality of water
from groundwater supplies is adequate. However,
it should be understood from the outset that risks
can be reduced or managed, but not eliminated –
some risk, however small, will always remain.
When planning and developing a water and
sanitation programme a balance must be
maintained between several different competing
risks to health. Decisions designed to reduce one
health risk, for instance by reducing
contamination of drinking water, should not
increase health risks due to a lack of sanitation.
The control of risks to groundwater from on-site
Figure 2.1. Principal elements of faecal–oral disease
transmission

Wate r supp l y and s an i t a t i on cho i c e s 15
sanitation only addresses one set of pathways in
Figure 2.1. It is essential that all routes of disease
transmission are addressed to improve public
health.
It may be necessary to accept water of lower
quality if it means that sanitation can be provided
that is acceptable and affordable to the
community. Low levels of contamination may
represent a very limited risk to health in situations
when there is no excreta disposal or hygiene is
very poor. In addition to the presence of
pathogens, disease may be influenced by a range
of factors in different individuals such as immune
status, nutritional status and concurrent disease
burden. When setting a level of risk to health that
is acceptable, it may not be possible to reduce the
risks to the whole population. To produce water
supplies of little risk to very vulnerable groups
may be very costly and it might be more cost
effective to promote household water treatment
for these groups.
Various epidemiological studies have been
undertaken to review the importance of different
components of water and sanitation in order to
establish where improvements may give the
greatest benefits. The impact of different aspects of
water and sanitation appears to be largely
dependent on the conditions within a particular
community and existing access to other
components of water and sanitation as well as other
factors. However, there is significant evidence that
integrated approaches yield the greatest benefits.
There may be a number of reasons why source
water quality improvements have only a limited
impact. Whilst source water quality may be good,
evidence from many countries indicates that
subsequent re-contamination during transport
and storage is common. This affects both people
utilising communal sources and those utilising
piped water subject to frequent, unpredictable or
extended periods of interruption. Thus, great
attention is often paid to the promotion of safe
handling practices and treatment of water within
the home.
However, there is evidence that the
improvement of source water quality may be more
important than is sometimes considered for two
reasons:
● source water quality may be critical to prevent
the introduction of an exotic pathogen into
the community, which may lead to an
unexpected explosive outbreak. Water quality
has been consistently shown to be important
in epidemic control;
● if source water quality is poor, then treatment
of water within the home will be necessary.
This is generally expensive and represents an
additional burden on the rural and urban
poor. Where source water quality is good,
health education can focus on lower-cost
interventions such as safe handling and
storage practices that require little additional
household expenditure.
However, the need for improvements in sanitation
is well recognised world-wide and current rates of
access to improved sanitation lag far behind those
for drinking-water supply.
2.2 Water quality problems andcontamination indicatorsThere is a wide range of pathogens that may be
found in drinking water including bacteria,
viruses, protozoa and helminths. Infective doses
vary enormously but may be as little as a single
virion or cyst. Different people may be more
susceptible to disease depending on their immune
status, prior exposure and nutritional status.
Therefore the basis of most guidelines and
standards for drinking water is an absence of
pathogens within drinking water.
In many cases analytical methods for

pathogens do not exist or are expensive and time
consuming. As a result current approaches to
water quality control are usually based on the
absence of bacteria that indicate the presence of
faecal contamination within samples taken from
the water supply (principally E.coli or
thermotolerant (faecal) coliforms). Absence of
such indicator bacteria within samples is often
then taken to define the water supply as ‘safe’.
It is increasingly recognised that the current
indicators have significant limitations and there is
evidence world-wide of pathogen presence in
water which meets current guidelines and
standards, resulting in disease outbreaks. In
particular, indicator bacteria are of limited use in
predicting the presence of protozoa and viruses
both of which may be significantly more resistant
to disinfection and may survive longer in the
environment. In the case of protozoa, sanitary
completion measures usually provide sufficient
security for groundwater supplies. In the case of
viruses, control is more problematic as viruses
may survive for substantially longer in water than
faecal coliform bacteria and may undergo only
temporary retardation. This can result in later
release of viruses into the water in an infective
state. Furthermore, there is increasing evidence
from research that many pathogens undergo rapid
changes in virulence due to genetic mutation
outside the human body, thus making
identification of pathogens more difficult. Further
problems result from the ability of some
indicators to multiply within contaminated water
in warmer climates.
However, despite these well-recognised
limitations, the limited number and scale of
outbreaks of infectious water-related diseases,
where water supplies have in general met the
standards set for indicator bacteria, implies that
they provide a reliable estimate of health risk.
However, the meaning of the presence or absence
of indicators should be clearly understood and
the analysis of indicator bacteria should be
supported by risk assessment and source
protection. The presence of indicator bacteria
indicates that there has been recent gross
contamination, largely derived from sources of
faeces within the environment. An absence of
indicators does not mean a total absence of
pathogens, however, the absence of faecal
indicators can be taken as an indication that
water is relatively low risk.
In addition to microbiological contamination,
chemical contaminants may also cause ill health,
although in most cases this is related to chronic as
opposed to acute effects. There are exceptions to
this and nitrate, fluoride and arsenic are all
substances that can lead to a short-term health
impact. In the context of the impact of on-site
sanitation, the principal contaminant of concern is
nitrate, which has been linked to
methaemaglobinamenia or infantile cyanosis.
Nitrate is the most stable form of nitrogen in
environments where abundant oxygen is available.
This is the usual condition of shallow
groundwater where hand pumps and protected
springs are most often used. Generally nitrate does
not degrade in shallow groundwater and dilution
is the principal mechanism for reducing
concentrations. Nitrate contamination problems
may not become obvious immediately. However,
the potential long-term impact of nitrate
contamination should be borne in mind when
planning sanitation programmes as remedial
action is difficult and blending with low nitrate
waters may be the only viable option. As nitrate
may be derived from other sources, it is important
to evaluate both the relative contribution of
different sources and the total nitrate load. Nitrate
concentration is relatively cheap and simple to
determine and does not require an indicator.
GUIDEL INES FOR ASSESS ING THE R ISK TO GROUNDWATER FROM ON-S I TE SANITAT ION16

Wate r supp l y and s an i t a t i on cho i c e s 17
2.3 Types of sanitation and their potential impactsSanitation facilities may be water-borne or dry.
There are many different forms of sanitation
ranging from conventional and modified
sewerage, to water-borne on-site systems such as
septic tanks, aquaprivies and pour-flush latrines
to dry systems which are generally different forms
of pit latrines, some of which may include urine
separation (Figure 2.2). The choice of sanitation
system is based partly on availability of water, but
also on cultural reasons and anal cleansing
methods. Sanitation systems can be divided into
two principal categories:
1. Off-site methods—these are different forms of
sewerage where faecal and household wastes
are carried away from the household. No
treatment occurs at the household and the
waste must be taken to a treatment plant
before discharge into the environment.
2. On-site methods—including septic tanks and
all forms of pit latrines. In these systems the
wastes are stored at the point of disposal and
usually undergo some degree of
decomposition on site. On-site systems either
require periodic emptying or construction of
new facilities once they fill up.
Off-site methods
Off-site methods are often found in urban areas
where space constraints limit the potential for on-
site facilities. They often, but not always, provide
a greater degree of convenience than on-site
methods and ultimate responsibility for the
treatment and disposal of waste usually lies with a
utility or local authority. Conventional sewerage is
very expensive and requires an in-house level of
water supply to function properly. However, cost
analyses have shown that modified sewerage
becomes cheaper than on-site methods at higher
population densities.
Whilst sewerage is often viewed as the most
desirable form of sanitation, it has several
drawbacks. There is evidence from Europe that
leaking sewers may significantly contribute to
microbiological and nitrate contamination of
groundwater and therefore may represent a
significant risk where groundwater is exploited for
domestic supply. Furthermore, sewage requires
treatment and this is often poorly operated and
managed leading to the discharge of inadequately
treated wastes into the environment. In most cases
this will be into surface water bodies although
groundwater may become contaminated
subsequently where it is in hydraulic connection
doorurine diversionpedestal
ventilation andlighting
space for dry soil storage
urine outlet pipeto soakpit orcollection container
faeces
Figure 2.2. Examples of
on-site sanitation design
fly screen
fly screen
shelter
pit
POUR-FLUSH LATRINE VIP LATRINE
DRY-BOX URINE DIVERSION TOILET
vent pipe

GUIDEL INES FOR ASSESS ING THE R ISK TO GROUNDWATER FROM ON-S I TE SANITAT ION18
Sanitation Watersystem requirements Advantages Disadvantages
On-site
Simple pit dry Cheap significant fly and odour problemslatrines builds on existing experience concerns by users over safety& sanplat limited expertise needed for construction
VIP latrine dry fly and odour problem is reduced cost significantly higher than simple latrineslower-cost than water-borne systems siting requires careful considerationlimited construction expertise required semi-dark interior may be disliked by users
Pour-flush wet with low Low-volume water use costs increasedlatrines volume appropriate in cultures where water used reliable supply of water must be assured
water use for anal cleansing cannot be used where bulky materials fly and odour problem controlled used for anal cleansingconvenience for userseasily upgraded
Composting dry useful humus produced as fertiliser/ requires careful operationlatrine soil conditioner sludge needs careful handling
some systems require urine separationash and vegetable matter must be added regularly
Soak dry cheap significant fly and odour problemsTrenches limited expertise needed for construction difficult to protect
shallower than pits, greater thickness covers large area, difficult to find space in urban of unsaturated zone areas
Urine dry with urine provides useful humus for fertiliser desludging requires careful handlingseparation collected urine can be used as fertiliser pathogens may not be inactivated in sludge pile
separately low-cost systems available user education on use of system requiredreduces hydraulic load significant time spent in O&M
Septic tanks wet with convenience same as conventional high costhigh volume sewerage in-house piped water generally requiredwater use limited fly or odour problems large space requirement
wastes removed rapidly regular desludging requiredpermeable soil required
Aqua privies wet with in-house piped water not required reliable supply of water required close to the homemedium less expensive than septic tank more expensive than pour-flushvolume fly and odour problems may still existwater use regular desludging required
permeable soil needed for effluent disposal
Off-site
Modified wet with convenience to user similar to small-bore systems require solids tank and sewerage low volume conventional sewerage periodic emptying—not appropriate in (small-bore water use can be maintained by communities areas with space constraintsand shallow) costs reduce at higher population densities shallow systems needs relatively large number
shallow sewers have very limited space of users to ensure stagnation does not occurrequirements wastes require treatment
Conventional wet with user convenience needs large volumes of water piped into the homesewerage high volume limited fly or odour problems very expensive
water use wastes removed rapidly treatment requiredleakage common
Table 2.1. Advantages and disadvantages of different sanitation systems (adapted from Franceys et al, 1992)

Wate r supp l y and s an i t a t i on cho i c e s 19
with surface water. Some forms of treatment
plant, such as waste stabilisation ponds, may be
prone to leaching of both microbiological and
chemical contaminants. Thus when considering
the use of sewerage, attention must be paid to the
potential for groundwater contamination,
ensuring that systems are operated and designed
with groundwater protection needs in mind.
On-site methods
On-site methods include both expensive systems
such as septic tanks that provide the same degree
of convenience as a sewer, and cheaper pit
latrines. On-site systems often represent a
significant hazard to groundwater because faecal
matter accumulates in one place and leaching of
contaminants into the subsurface environment
may occur. Septic tanks typically hold the solid
component of wastes in a sealed tank where the
matter decomposes anaerobically. Liquid effluent
is usually discharged into a soakaway pit. In
well-designed septic tanks, the solid matter does
not represent a significant hazard, but the
soakaway pits may cause both microbiological
and chemical contamination. The liquid part of
the waste in a pit latrine that infiltrates into the
soil is called the hydraulic load. Where
hydraulic loads are high and exceed natural
attenuation potential in the sub-surface this may
lead to direct contamination of groundwater
supplies.
Pit latrines are usually not sealed, although
sealed pits may be used in urban areas or in areas
of high water-table. In general pit latrines are
only appropriate where the level of water supply
is low (communal or yard) and are not
appropriate when large volumes of wastewater
are generated. In most pit latrine designs, the
liquid part of the waste is allowed to infiltrate
into the soil, although some pour-flush latrine
designs provide a soakaway. This infiltration of
wastes (often containing micro-organisms and
nitrogen, the latter may be oxidised to nitrate)
represents an additional hazard to groundwater,
particularly as this frequently occurs at some
depth in the subsurface and thus by-passes the
soil. The soil is the most biologically active layer
and is where contaminant attenuation is greatest.
However, biological communities also typically
develop around the active parts of the pit and
contain predatory micro-organisms capable of
removing pathogens. This may help limit the
risk of contaminant movement to deeper layers
to some degree.
The choice of sanitation technology depends
on many economic, technical and social issues
and each type of technology has advantages and
disadvantages as noted in Table 2.1.
Pit latrines are in general the cheapest form
of sanitation and can be easily constructed at a
household level. In rural areas, they often
represent the only viable sanitation option given
the low-level of water supply service. In many
peri-urban areas pit latrines may also be
commonly used and may represent a greater
hazard as the numbers and densities of pit
latrines increase the potential for groundwater
pollution. Pit latrine designs can be improved to
reduce such risks.
2.4 Groundwater suppliesIn its natural state, groundwater is usually of
good microbiological quality and as a result is
often the preferred source of drinking water
supply as treatment is limited to disinfection. In
the case of rural and peri-urban supplies,
groundwater supplies are usually untreated.
However, the construction of groundwater
supplies may provide a direct route for
contamination of groundwater and therefore
need to be properly designed and constructed.

The principal forms of groundwater supply used
for drinking water are shown in Figure 2.3 and
are briefly discussed below:
Boreholes (also known as tube wells)—These
are narrow-diameter, drilled holes that can be
shallow or deep, and use a handpump or
motorised or electric submersible pump to
abstract water. A variety of methods may be used
to construct boreholes, including simple hand-
drilling methods and some of these may increase
the risks of contamination. Boreholes are often
easier to protect from pollution than other
groundwater supplies.
Dug wells—these are usually dug by hand
and are typically of large diameter and of relatively
shallow depth. These may be fitted with a hand
pump or some other form of improved water
collection or buckets and ropes utilised. Dug wells
are susceptible to contamination, especially where
shallow and/or uncovered.
Springs—these may occur where
groundwater discharges at the surface. They are
generally protected by constructing a spring box
around the eye of the spring and may feed piped
systems by gravity. Springs can be susceptible to
contamination and great care needs to be taken to
protect the supply. Where groundwater forms a
seep line, an infiltration gallery may be used.
2.5 Risk: source-pathway-receptorThe risk of contamination of groundwater
supplies by on-site sanitation uses the concept of
source-pathway-receptor, as shown in Figure 2.4.
For a risk to a receptor (in this case a groundwater
supply) to exist both a source of contamination
and a pathway must be present (the pathway
provides the means or route for contamination to
reach the receptor).
GUIDEL INES FOR ASSESS ING THE R ISK TO GROUNDWATER FROM ON-S I TE SANITAT ION20
protected spring
protected dugwell
borehole or tubewell
Figure 2.3. Typical
groundwater supply designs
Wate r supp l y and s an i t a t i on cho i c e s 21
localisedpathways
annulus betweencasing and borehole
wall not sealedaquifierpathway
water table
source =pit latrine
pathway =groundwater flow receptor =
water quality in tubewell
borehole
water table
Figure 2.4. The source—
pathway—receptor concept.
An example using the aquifer
pathway for contamination
from pit latrine to borehole
Figure 2.5. Natural and
man-made pollution
pathways to groundwater
supplies
In the natural environment, sources of
contamination are always present and usually
widespread, including on-site sanitation. Pathways
that allow water to move from these sources to the
receptor can be subdivided into (Figure 2.5):
● pathways that occur naturally in the
subsurface due to openings and cracks in the
soil and rock (aquifer pathway)
● man-made pathways that occur as a
consequence of the design and construction of
the receptor (localised pathway)
Fortunately, many contaminants, especially
micro-organisms, can be rendered harmless or
reduced to low numbers/concentrations by natural
processes provided there is sufficient time.
Chapter 3 discusses these processes as well as the
sources of contamination and the pathways.
Reducing the risk (to the receptor) can be
achieved by:
● removing the source of contamination or
reducing the levels of contaminants that are
produced;
● increasing the time for water to travel from the
source to the receptor; and
● minimising man-made pathways
The assessment of risk and identification of
options to reduce it are discussed in detail in
Chapters 4 and 5.

GUIDEL INES FOR ASSESS ING THE R ISK TO GROUNDWATER FROM ON-S I TE SANITAT ION22
Summary of key points from Chapter 2
● The majority of pathogens that affect humans are derived from faeces and transmitted by the
faecal-oral route through a variety of ways including food, water, poor personal hygiene and flies.
Therefore to reduce the health burden caused by infectious disease, interventions are required in
excreta disposal, water supply and hygiene education.
● The quality of water supplied is of crucial importance; firstly to prevent the introduction of an
exotic pathogen into the community, which may lead to an unexpected explosive outbreak and
secondly, because treatment (which may be necessary if water quality is poor) is often expensive
and represents an additional burden on the rural and urban poor. Where the quality of the water
supplied is good, hygiene education can focus on safe handling and storage practices.
● On-site systems often represent a significant hazard to groundwater because faecal matter
accumulates in one place and leaching of associated microbiological and chemical contaminants
into the sub-surface environment may occur.
● Infective doses of microbiological contaminants vary enormously but may be as little as a single
virion or cyst.
● Although it is increasingly recognised that current faecal indicator bacteria have significant
limitations, they still provide a reasonable estimate of risk of pathogen presence.
● The principal chemical contaminant of concern is nitrate, the potential long-term impact of this
contamination should be borne in mind when planning sanitation programmes as remedial action
is difficult.
● The construction of groundwater supplies may provide a direct route for contamination of
groundwater and therefore need to be properly designed and constructed.
3.1 Importance of groundwater Groundwater constitutes some 97% of all
freshwater that is potentially available for human
use. Groundwater is therefore of fundamental
importance to human life.
When rain falls, a part infiltrates the soil. While
a proportion of this moisture will be taken up by
plants or evaporate back into the atmosphere, some
will infiltrate more deeply, eventually accumulating
as an underground water body or reservoir. Where
this underground reservoir permits significant
quantities of water to be abstracted it is known as
an aquifer. The ground above the aquifer through
which the infiltration percolated is referred to as
the unsaturated zone. The level to which the
ground is fully saturated is known as the water-
table (Figure 3.1).
An aquifer’s productivity depends on the
fundamental characteristics of being able to both
store and transmit water. But all aquifers are not
the same. Unconsolidated granular sediments
such as sands contain pore spaces between the
grains. The proportion of pore spaces to the total
volume of sediments is known as the porosity, for
example, the porosity of a sand can exceed 30%.
However, where these sediments become buried,
they are transformed, over millions of years, to
harder more compact consolidated rocks such as
sandstones and limestones. One consequence is
that the porosity is reduced. In consolidated
rocks, cracks or fractures may form; these
fractures also store and transmit groundwater
although the percentage of the rock taken-up by
fractures (that is the fracture porosity) rarely
exceeds 1%. However, these fractures can play an
important role in groundwater flow as is discussed
below. Other rocks which can be useful aquifers,
where they are fractured or weathered, include
volcanic lavas and crystalline basement.
Aquifers need to transmit water, as well as
store water. The water-transmitting characteristic
of an aquifer is known as its permeability. This is a
measure of the ease with which water can flow
through the rock. Permeability will be greater in
rocks with larger pores that are well connected
with each other or in rocks with wider and
connected fractures. Therefore sands and gravels,
which have large, well-connected pore spaces
between the grains, make good aquifers. Clays,
however, which have high porosity but very little
connection between the pores, transmit water only
very poorly. Fractures in rocks are able to transmit
water very easily and rapidly, indeed fractured
aquifers (e.g. limestones) can produce the most
permeable aquifers. The unit of measurement of
permeability is the same as that for velocity (e.g.
m/day). Typical permeability values for various
rock types are given in Table 3.1.
All aquifers have a source of recharge water.
This is normally rainfall but can be seepage from
rivers, lakes or canals. The water-table rises in
response to recharge and declines due to outflow
from the system. Water leaves the aquifer where
the water-table reaches the land surface, for
example as a spring or seepage or as flow into a
stream, or river (Figure 3.1). Groundwater
systems are therefore dynamic with groundwater
continuously in slow motion from zones of
recharge to areas of discharge. Since flow rates do
not normally exceed a few metres per day and can
be as low as 1 metre per year, the passage of water
Technical background
Techn i ca l ba ckg round 23
3aquifer recharge area
water table
yearsdecades
centuries
river/stream
discharge to river
Figure 3.1. The
groundwater flow system

through this subterranean part of the hydrological
cycle may take tens, hundreds or even thousands
of years.
3.2 Aquifer vulnerability to pollution andrisks to groundwater suppliesAs water moves through the ground, natural
processes reduce (or attenuate) the concentration
of many contaminants including harmful
microorganisms. These processes will be
discussed in more detail later in Section 3.6. The
degree to which attenuation occurs is dependent
on the type of soil and rock, the types of
contaminant and the associated activity.
The term aquifer pollution vulnerability is
used to represent the intrinsic characteristics of
the aquifer which determine whether it is likely to
be affected by an imposed contaminant load.
Vulnerability assessment is based on the likely
travel time for water to move from the ground
surface to the water-table – the greater the travel
time the greater the opportunity for contaminant
attenuation. Aquifer vulnerability can be
subdivided into four broad classes which are
defined in Table 3.2; extreme vulnerabilities are
associated with highly fractured aquifers of
shallow water-table which offer little chance for
contaminant attenuation.
Significance of unsaturated zone
The unsaturated zone is of special importance
since it represents the first line of natural defence
against groundwater pollution. It is, therefore,
essential that the unsaturated zone be fully
considered in the evaluation of risks to
groundwater supplies. Should it be ignored,
evaluations will be excessively conservative.
However, the role of the unsaturated zone can be
complex and its ability to attenuate contaminants
difficult to predict.
While natural flow rates in the unsaturated
zone of almost all formations do not generally
exceed 0.2 m/d in the short term, and less when
averaged over longer periods, water flow and
pollutant penetration rates in fractured formations
may be more than an order-of-magnitude higher,
given high rates of infiltration (for example from
septic tanks). Thus rock type, and especially the
grade of consolidation and whether there are
fractures, will be key factors in the assessment of
aquifer pollution vulnerability (Figure 3.2),
especially in relation to microbial pathogens.
GUIDEL INES FOR ASSESS ING THE R ISK TO GROUNDWATER FROM ON-S I TE SANITAT ION24
Lithology Range of likely permeability (m/d)
Silt 0.01–0.1
Fine silty sand 0.1–10
Weathered basement (not fractured) 0.01–10
Medium sand 10–100
Gravel 100–1000
Fractured rocks difficult to generalise, velocities of tens or hundreds of m/d possible
Vulnerability class Definition
extreme vulnerable to most water pollutants with relatively rapid impact in many pollution scenarios
high vulnerable to many pollutants except those highly absorbed and/or readily transformed
low only vulnerable to most persistent pollutants in the very long-term
negligible confining beds present with no significant groundwater flow
Table 3.1. Typical
permeability values for various
rock types.
Table 3.2. Aquifer
vulnerability subdivided into
four broad classes

Significance of saturated zone
Contaminant removal processes will, in the main,
continue below in the saturated zone of the
aquifer but generally at much lower rates because
groundwater moves more rapidly. Within the
saturated zone, dispersion and dilution (spreading
out of the contaminant plume) will play an
important role in reducing contaminant
concentrations although it is not a reliable
reduction mechanism for highly toxic
contaminants.
Nevertheless, for low yielding boreholes (e.g.
those fitted with a handpump) in porous aquifers
the travel time for water to move downward from
the water-table to the intake of the borehole can
be considerable even for quite small vertical
distances. Such travel times, whilst they would
only delay the arrival of persistent contaminants,
will substantially reduce the risk of less persistent
contaminants including many microorganisms.
3.3 Hydrogeological environmentsThe previous section shows that the vulnerability
of groundwater to pollution is dependent on the
nature of the subsurface and depth to the water-
table. Although there are many types of rocks,
these can be summarised into a number of broad
groups (described below) that takes into account
not only the rock type but also the environment in
which the rocks were formed. The likely
vulnerability of aquifers in each of these
environments is suggested. Those hydrogeological
environments where the aquifers are consolidated
(and therefore potentially fractured) are indicated
because they are likely to be especially vulnerable
to pollution. The broad classification of aquifer
vulnerabilities for the major hydrogeological
environments is summarised in Table 3.3.
3.3.1 Unconsolidated aquifers
Thick sediments associated with rivers and
coastal regions
These unconsolidated sediments form the most
important aquifers of the world in terms of volumes
of water pumped. Many of the world’s largest cities
are supplied by groundwater from these rocks,
including Bangkok, Calcutta and Dhaka.
These aquifers are rarely simple systems, they
are typically layered, with permeable layers of
sands and gravel separated by less permeable
layers of clay or silt, producing complex
groundwater flow patterns (Figure 3.3). The
porosity of these rocks are typically high (in the
range 15–35%) which means greater potential for
dilution of contaminants. Groundwater flow
velocities are low, so that deeper groundwaters
may be derived from recharge that occurred
several thousand years ago.
Groundwaters in these aquifers are naturally
of excellent microbiological quality; natural
filtration produces clear, colourless water, free
from microbial contamination and thus requiring
minimal treatment. However, this may not be the
case at shallow depths and especially where the
Techn i ca l ba ckg round 25
Figure 3.2. Illustration of
types of voids within rocks:
pores - spaces between
sediment grains;
fractures - cracks in hard
rock;
karst - enlargement of
fractures in calcareous rocks
due to dissoluton by
infiltrating water that is
slightly acidic
pores fractures karst

surface body water
1
2
2
3
3
3
Local groundwater subsystem (months—decades)1Subregional groundwater subsystem (10s—100s years)2Regional groundwater subsystem (100s—1000s years)3
High hydraulic conductivity aquiferLow hydraulic-conductivity aquiferDirection of groundwater flow
aquifer underlies urban areas where the
contaminant load is high.
A consequence of the slow travel times and
the long contact time with the sediment, is that
groundwater in deeper aquifers often contains
significant quantities of minerals in solution
(solutes), some of which may be harmful to
health. The solute content of groundwater is very
variable and depends on the residence time of
water in the aquifer and the mineral composition
of the aquifer itself.
Mountain valley sediments and volcanic systems
Aquifers in this environment result from the rapid
infilling of basins within mountain regions which
produce thick accumulations of sediment
(Figure 3.4). Inter-layering of volcanic lavas may
also occur. Aquifer permeabilities and porosities
are generally high although variable, producing a
complex groundwater system similar to the
previous hydrogeological environment. When
combined with high rainfall, typical of this
environment, this results in valuable aquifers
capable of substantial well yields. Examples
include the aquifers present beneath Mexico city
and Kathmandu.
Minor sediments associated with rivers
Groundwater can occur in thin river sands and
gravels that may be of limited lateral extent and
depth (Figure 3.5). These permeable sands and
gravels may rest on relatively impermeable hard rock
and therefore may represent the only significant
groundwater resource available. Whilst the rivers
may flow for only quite short periods of the year,
sufficient water usually remains stored within the
GUIDEL INES FOR ASSESS ING THE R ISK TO GROUNDWATER FROM ON-S I TE SANITAT ION26
Table 3.3. Principal
hydrogeological environments
and their associated pollution
vulnerability.
Figure 3.3. Thick sediments
associated with rivers and
coastal regions
Hydrogeological natural travel attenuation pollution environment time to potential vulnerability
saturated zone
Thick sediments associated shallow layers weeks-months low-high highwith rivers and coastal regions deep layers years-decades high low
Mountain valley sediments shallow layers months-years low-high low-highdeep layers years-decades low-high low-high
Minor sediments days-weeks low-high extremeassociated with rivers
Windblown deposits shallow layers weeks-months low-high high deep layers years-decades high low
Consolidated sedimentary sandstones months-years low-high low-highaquifers karstic limestones days-weeks low extreme
Weathered basement thick weathered layer weeks-months high low(>20 m)thin weathered layer days-weeks low-high high(<20 m)

deposits during the dry season to meet the demands
for village water supply. Traditional means of
obtaining water are usually through shallow
excavations; these are highly susceptible to pollution.
Windblown deposits
Fine windblown deposits, called loess, form an
important aquifer in China and South America.
The deposits are generally extensive but of low
permeability and the presence of ancient soils may
produce a layered aquifer. Groundwater in loess
deposits can represent a key source of domestic
water.
3.3.2 Consolidated sedimentary aquifers
Consolidated sediments
Younger sandstones usually retain a primary
porosity (the porosity between grains) and are
typically of low-moderate permeability. In older,
more-cemented formations, the primary porosity
is virtually absent and it is the secondary
(fracture) porosity which provides the aquifer
permeability and storage.
The vulnerability to pollution of consolidated
sedimentary aquifers is greatly increased by the
development of secondary permeability, especially
in the karst limestones where particularly rapid
water movement along fractures is possible.
Recent coastal limestones
These formations can form important aquifers.
Their permeability is often dominated by
fracturing and is, as a consequence, high,
producing rapid groundwater movement with
velocities frequently in excess of 100m/d. The
high infiltration capacity of these rocks often
eliminates surface runoff and very often
groundwater is the only available source of water
supply in these environments.
These characteristics have important
implications for groundwater quality. Water
movement from the soil to the water-table is often
via fractures and is so rapid that even filtration and
removal of micro-organisms within the unsaturated
zone is not effective. Consequently these formations
are extremely vulnerable to widespread pollution. In
addition, as these coastal aquifers are usually
underlain by seawater often at shallow depths,
excessive abstraction, may induce seawater
upconing and contamination of fresh water.
3.3.3 Weathered basement aquifers
Over large areas of Africa and parts of Asia,
groundwater occurs in basement rock aquifers.
These aquifers are often ancient crystalline rocks
with little or no primary porosity e.g. granite.
Groundwater is present within the weathered and
fractured layers (Figure 3.6). In some cases the
basement rock is covered by an extensive and
relatively deep weathered clayey layer of low
permeability. Below this the rock becomes
progressively harder until fresh fractured
basement rock is reached. Where the deeply
weathered low permeability layer is both extensive
and deep, the aquifer can be considered to have
relatively low pollution vulnerability. Such
Techn i ca l ba ckg round 27
infillsediments
playa
bedrock
river
sand silty sand
bedrock
sand and gravel
silt and clay
Figure 3.4.
Mountain valley sediments
Figure 3.5.
Minor sediments associated
with rivers
environments are characterised by low relief and
absence of rock outcrops.
However, there are other areas where the
weathered layer is of variable thickness and
basement rock can occur at the ground surface.
Such aquifer environments are more vulnerable to
pollution because of the likelihood of fractures
extending close to ground surface. These areas can
be recognised by the presence of more variable
relief and by records from drilling boreholes or
digging wells which confirm a thin or variable
weathered layer.
3.4 Sources of contaminationIn most developing countries, faecal matter is
widespread in the environment and poses a risk to
untreated groundwater supplies. In addition to
on-site sanitation, sources of faecal matter include
other forms of sanitation, solid waste dumps and
refuse pits, household sullage and stormwater
drains as well as animals. Which sources occur
will depend on the type of settlement, population
density, sanitation arrangements and sanitation
behaviour.
3.4.1 Sanitation
As discussed in Chapter 2, all forms of
sanitation represent a potential source of faecal
pollution (Figure 3.7). In urban areas, leaking
sewers may contribute significant
microbiological and nitrate loads to shallow
aquifers that may affect groundwater supplies
used for drinking water supply.
In rural areas and low-income urban
settlements, on-site sanitation facilities may be a
significant source of contamination. As all these
systems accumulate and retain faecal matter in
one place, they represent a major potential source
of faecal pollution. The contamination derived
from on-site sanitation in most rural areas will
only impact groundwater supplies in the
immediate area but in larger villages and within
urban settlements, where there may be many
installations within a small area, there may be
widespread contamination of the aquifer.
Other hazards relating specifically to excreta
disposal facilities will include treatment works
such as waste stabilisation ponds. These may
cause either localised or widespread
contamination depending on the degree to
which leaching occurs and the location of works
in relation to the water-table and groundwater
flow regimes.
3.4.2 Other sources of faecal contamination
Whilst this manual is written specifically to
consider the hazard posed to groundwater by on-
site sanitation, it is important to be aware that
GUIDEL INES FOR ASSESS ING THE R ISK TO GROUNDWATER FROM ON-S I TE SANITAT ION28
borehole
water table
dugwell
Figure 3.6. Weathered
bedrock aquifers. Basement
aquifer with thin weathered
layer (left)—the travel time
from contamination source
to the inlet of the
groundwater supply may be
fast due to the shorter
distances to travel within the
low permeability weathered
material and the potential
for fractures to extend to
close to the surface.
Basement aquifer with thick
weathered layer (right)—the
travel time from
contamination source to the
inlet of the groundwater
supply will be greater due to
the greater distances to
travel within the low
permeability weathered
material.
water table
borehole
fractured basement
weathered layer

there are other hazards within the environment
that may contain faecal material (Figure 3.7).
These include solid waste dumps, household
sullage, stagnant surface water, and animal
enclosures and free range animals. These sources
are discussed below to make the reader aware that
on-site sanitation is not the only source of
contamination. These sources may in some settings
represent a significantly greater hazard than on-site
sanitation.
Solid waste
Where excreta disposal facilities are absent or
insufficient to meet the needs of the population,
faeces are often disposed of into the general
environment and commonly end up on solid waste
dumps, refuse pits and drainage channels. This is
likely to be more common in high-density urban
settlements than rural areas. Where this form of
excreta disposal occurs, the risks to general health
will be high, but the risk to groundwater sources
will depend on whether the faeces are located up-
gradient of the water supply and whether under
rainfall events they can enter the supply directly
due to poor sanitary completion. It should be
noted that even where sanitation facilities are
available, the disposal of children’s faeces in
particular may remain unhygienic given cultural
beliefs about the nature of their faeces.
The impact of solid waste sources of faecal
contamination on the microbiological quality of
groundwater is likely to be more localised than
widespread, unless an entire urban area lacks any
form of improved sanitation. Poorly managed solid
waste may, however, represent a significant source
of nitrate as in many developing countries much of
the solid waste generated is organic. The control of
unrestricted dumping of solid waste may help to
reduce nitrate contamination.
Sullage and surface water
Domestic waste derived from washing, cooking
etc, is often discharged into open ditches or
channels. This sullage is known to often contain
large numbers of faecal indicator bacteria and may
also contain pathogens. Whilst of lower risk in
terms of concentration of microbiological
contamination, the amount of sullage produced
Techn i ca l ba ckg round 29
leakingsewers
solid wastedumps
stock rearing/animal pens
septictank
borehole
borehole
dug well
urbana)
b)
sullage ponds
rural
pit latrinesoil
opendefecating
water table
water table
Figure 3.7. Sources of
faecal pollution within urban
and rural settings from:
a) sanitation (top); and
b) other sources (bottom)
(over 90% of all domestic water) may represent a
significant source of microbiological
contamination if it is not disposed of properly. No
significant nitrate load would be expected to
derive from sullage.
Stagnant surface water may also represent a
significant contamination risk, particularly if
excreta disposal facilities are inadequate, sullage is
disposed of indiscriminately and free-range
animals are in the area. Stagnant water pools may
end up collecting much of the faecal matter and
may directly contaminate groundwater though
infiltration or inundation of the source when
rainfall occurs.
Animals
A further hazard is likely to be animal faeces within
the environment, whether as a result of organised
husbandry or where animals are allowed to roam
in the environment. However, in general, animal
faeces represent a lower infectious disease risk than
human faeces, although some pathogens (for
instance protozoa and E.coli O157:H7) have an
animal host.
Animal enclosures represent a significant
source of faecal contamination as a relatively large
volume of faeces may be produced and manure
may be allowed to build up over a long period of
time. Where animals are free-range, their faeces
will be likely to be found throughout the
environment and may collect in stagnant surface
water or be washed directly into a poorly
maintained water supply.
Organised animal husbandry may have a
significant impact on nitrate contamination. Where
significant numbers of animal enclosures are
found, this may contribute significantly to a more
widespread aquifer contamination. In Botswana,
high nitrate concentrations in some drinking water
wells have been linked to the proximity to large
numbers of cattle at nearby stock watering points.
3.5 Contaminants associated with on-site sanitation3.5.1 Microbiological
Many types of pathogens transmit infectious
diseases. These have differing impacts on health
and transmission routes may vary. These should be
understood in order to predict the health
consequences of different pathogen types and
levels of contamination.
The pathogens that cause infectious diarrhoeal
diseases that can be transmitted through
contaminated water are grouped into three
principal types of organisms: bacteria, viruses and
protozoa (or cysts). All these pathogens may be
transmitted by other routes, including via
contaminated hands, flies and animals. Helminths
(or worms) are not included as their size makes
them unlikely to be present in groundwater
supplies unless there is a direct entry for surface
water, in which case pathogens of other types will
also be present and are likely to represent a
greater risk to health. Table 3.4 lists the major
viral, bacterial and protozoan pathogens, the
source of these pathogens and the associated
diseases.
Bacterial pathogens cause some of the best known
and most feared infectious diseases, such as
cholera, typhoid and dysentery, which still cause
massive outbreaks (or epidemics) of diarrhoeal
disease and contribute to ongoing infections.
Bacterial pathogens tend to have high infectious
doses – i.e. a large number must be consumed in
order to cause an infection. However, the
symptoms tend to be severe and the control of
such pathogens was the original target of the
pioneers in sanitary improvements. Their control
in drinking water remains critical in all countries
worldwide.
Bacteria tend to be very susceptible to the
natural processes which reduce their numbers
(attenuation), which are described in Section
GUIDEL INES FOR ASSESS ING THE R ISK TO GROUNDWATER FROM ON-S I TE SANITAT ION30

3.6.1. Therefore, reducing bacterial pathogens
loads through simple protection measures is
relatively simple and should be a major target of
the planners of water and sanitation programmes.
Viruses are much smaller organisms and cause
a range of diarrhoeal diseases. Some viral diseases,
for instance polio, are most effectively controlled
through vaccination rather than measures to
safeguard water quality. Epidemics of viral
diseases have been recorded, although in general
viral infections tend to lead to milder and self-
limiting infections. Viruses are often spread
Techn i ca l ba ckg round 31
Pathogen Source Disease
Viruses
Hepatitis A virus Human faeces Infectious hepatitis
Polioviruses Human faeces Poliomyelitis (best controlled
through vaccination)
Astrovirus, Calcivirus, Human faeces Diarrhoeal diseases
Rotaviruses, Norwalk-type
viruses
Coxsackieviruses Human faeces Diarrhoeal diseases
and Echoviruses
Bacteria
Campylobacter jejuni Human and animal faeces Diarrhoeal diseases
Enterohaemorrhagic Human and animal faeces Hemorrhagic colitis
E. coli O157
Enteroinvasive E. coli Human faeces Diarrhoeal diseases
Enteropathogenic E. coli Human faeces Diarrhoeal diseases
Enterotoxigenic E. coli Human faeces Diarrhoeal diseases
Salmonella typhi Human faeces and urine Typhoid fever
Shigellae spp. Human faeces Dysentery
Vibrio cholerae O1 Human faeces Cholera
Protozoan parasites
Cryptosporidium spp. Human and animal faeces Diarrhoea
Giardia lamblia Human and animal faeces Diarrhoea
Table 3.4. Illnesses
acquired by ingestion of
faecally contaminated water.
through poor hygiene and drinking water is often
not the principal route of transmission.
The severity of viral infections also depends
significantly on when first exposure to the
pathogen occurs. When first exposure occurs in
childhood, the symptoms are often relatively mild
and a degree of lifelong immunity is acquired.
When first exposure is in adulthood, the effects
tend to be more severe. In most developing
countries, exposure to viruses through water and
other routes during childhood is likely to be
significant and therefore it can be expected that
the overall risk of severe symptoms is relatively
low.
Infectious doses of viruses tend to be very low
and viruses are often less likely to be attenuated.
Therefore, reducing the risks from viruses in
drinking water is difficult without disinfection of
the water supply. Protection measures may greatly
reduce the numbers of pathogens in the water and
therefore reduce the risks of infection, but
controlling sources of viruses (for instance on-site
sanitation) alone is unlikely to reduce the risk to
an acceptable level.
Protozoa are relatively large organisms and
include Cryptosporidium and Giardia. Protozoan
pathogens cause diarrhoea, although in most cases
this is relatively mild and self-limiting. In most
developing countries, exposure to protozoan
pathogens occurs through direct contact with
animals, poor hygiene and contaminated food.
Drinking water is unlikely to be the major route of
transmission. Although infectious doses of many
protozoa are very low, attenuation is often easy
given the large size of the organisms. Therefore,
control of protozoan pathogens in groundwater is
relatively easy because of the size of the cysts and
should be an easily achievable target, even though
the actual health risk is relatively limited.
3.5.2 Chemical
The chemical contaminants of principal
importance that are derived from on-site sanitation
are nitrate and chloride. Each person excretes in
the region of 4kg of nitrogen per year and under
aerobic conditions it can be expected that a
significant percentage of this nitrogen will be
oxidised to form nitrate. The nitrogen loading
from on-site sanitation in densely populated areas
can be very large indeed. In one urban slum area
of Dhaka as much as 1500 kg of nitrogen per
hectare is deposited each year through on-site
sanitation systems. Chloride is also abundant in
human wastes (the ratio of chloride to nitrogen in
human waste is approximately 1:2). Each person
on averages loses approximately 4g of chloride per
day through urine (90–95%), faeces (4–8%) and
sweat (2%). However, the chloride content can be
very variable and depends in part on its
concentration in drinking water.
Nitrate is a health concern and WHO have set
a Guideline Value of 50mg/l as the safe level of
nitrate where the likelihood of
methaemaglobinamenia will be low. Chloride is of
less concern for health, but affects the acceptability
of the water and thus may result in use of
alternative more microbiologically contaminated
water. In both cases, environmental protection
concerns also need to be addressed, as remediation
of contamination is difficult. Nitrate and chloride
are generally stable, especially in aerobic
environments and therefore contamination is likely
to build-up and persist in the longer term. In
anaerobic environments ammonium is the stable
form of nitrogen and it may represent a health
hazard. Remediation of the aquifer or treatment of
the water supply are expensive and difficult to
achieve. Conversely, where groundwater is
anaerobic any nitrate will be reduced to nitrogen
gas. For example, in some peri-urban areas of
Dhaka, Bangladesh, it has been noted that
groundwater nitrate concentrations are low despite
heavy nitrogen loadings from on-site sanitation.
GUIDEL INES FOR ASSESS ING THE R ISK TO GROUNDWATER FROM ON-S I TE SANITAT ION32

When assessing the potential risk of
widespread contamination of groundwater by
nitrate or chloride from on-site sanitation, the
other possible sources should also be considered.
Whilst quantifying the relative contribution from
each source is likely to prove difficult, where
potentially high nitrogen loadings are indicated, it
would probably be worthwhile monitoring for
nitrate in groundwater.
Both nitrate and chloride may show significant
seasonal fluctuations in shallow groundwater,
although concentrations are expected to be more
stable in deeper groundwater. Therefore, when
assessing the risk of widespread nitrate or chloride
contamination, it is important to recognise the
possibility of seasonal peaks. Where such
information is not available, it may be necessary to
set-up a monitoring network (see Chapter 5).
In general the likely level of nitrate
contamination of groundwater will depend on the:
● quantity of recharge, which controls the degree
of dilution (the higher the rainfall, the lower
the nitrate content for a given population
density);
● population density, which relates to the
contaminant load;
● type of on-site sanitation system, which
determines the proportion of nitrogen
leaching;
● other sources of nitrate in the environment, for
example large concentrations of livestock
animals may contribute a significant nitrate
load;
● the nature of the sub-surface and the
hydrogeological environment including the
potential for denitrification.
3.6 Attenuation of contaminants in the subsurfacePathways will nearly always exist in the subsurface
that provide a link between the sources of
contamination and the receptor (groundwater
supply). The pathways are a result of the normal
porosity and the permeability of the rocks.
However, natural (attenuation) processes in the
subsurface can remove or significantly reduce
contaminant concentrations. A brief description of
these processes is given here.
Attenuation is generally most effective in the
unsaturated zone and in particular in the upper
soil layers where biological activity is greatest. The
soil layer represents the greatest opportunity for
attenuation as both microbiological, and to a
lesser extent key chemical contaminants, are
removed, retarded or transformed as a result of
biological activity. At deeper layers in the
unsaturated zone, attenuation still occurs,
although the processes tend to be less effective as
biological activity decreases. Once the saturated
zone is reached, attenuation usually becomes far
more limited and natural die-off and dilution
predominate (Figure 3.8).
3.6.1 Attenuation of microbiological
contaminants
The key processes in the attenuation of
microbiological contaminants are:
● die-off and predation ● filtration
● dilution/dispersion ● adsorption
Micro-organisms, like all life forms, have a
limited life span. Die-off rates vary enormously
from a few hours up to several months. In
groundwater, some viruses are known to survive
for up to 150 days. In the case of indicator
bacteria, an estimated half-life (i.e. the time taken
for a 50% reduction in numbers) in temperate
groundwater has been noted as being as high as
10–12 days, with survival of high numbers up to
32 days. Some pathogenic bacteria (for instance
Salmonella species) have been shown to persist for
up to 42 days.
Techn i ca l ba ckg round 33

The removal of micro-organisms through
predation by other micro-organisms may occur
readily in biologically active layers that develop
around the filled sections of pit latrines and these
may represent the most effective barrier to
breakthrough. It is difficult to predict how rapidly
this layer will take to develop, as this depends in
part on the soil type and the hydraulic and
pollutant load applied, but the establishment of
such communities is likely to take several weeks to
reach maturity. However, the benefits of a
biologically-active layer may be limited in time as
the layer becomes more developed, pores may
become clogged and greatly reduce effluent
infiltration lower in the pit, encouraging greater
infiltration at higher layers.
Other key processes in microbiological
attenuation are adsorption and filtration. In the first
case, micro-organisms become attached to particles
in the sub-surface, thus effectively removing them
from water infiltrating into the soil. The ability of
micro-organisms to be adsorbed depends on the
nature of the organism, the pH of the water and the
type of unsaturated zone material. Some micro-
organisms, particularly viruses, carry an electrical
charge and thus may be easily adsorbed in the
unsaturated zone, particularly when reactive clay
minerals are present. However, the charge that a
virus carries can change with pH, thus the
adsorption potential will also be dependent on the
pH of water and the charge on the minerals within
the soil. Viruses can be de-sorbed (or eluted) when
flow rates change and pH alters, especially during
recharge periods.
Mechanical filtration is more effective for larger
organisms such as protozoan cysts and helminths
but will also help to attenuate bacteria and is
dependent on the pore size of the rock (Figure 3.9).
Filtration can be effective in removing larger micro-
organisms, but it should be noted that this does not
inactivate these organisms, but merely retards
them. Filtration may be especially important close
to the base of the pit latrine where clogging may
reduce the effective pore openings in the aquifer.
Dispersion, caused by the tortuous route taken
by water flowing through the rock material, has the
effect of spreading contaminant plumes and in
effect diluting the ‘concentration’ at any point and
increasing the range of time that contaminants take
to flow from source to groundwater supply. The
effect of dispersion/dilution on micro-organisms is
less easy to quantify than for chemicals, given the
discrete nature of microbes in water and the
observed phenomenon that micro-organisms are
often found to clump together.
3.6.2 Definition of risk categories for
microbiological contamination via aquifer pathways
The mechanisms controlling the attenuation of
micro-organisms are clearly complex and what
evidence there is suggests survival and
breakthrough is variable, being dependent on local
conditions. This variability is also season-
dependent with increased breakthrough following
rainfall widely recorded. Such variability makes it
difficult to have complete confidence in any
realistic separation between contaminant source
and groundwater supply.
The guidelines presented in Part 2 of this
GUIDEL INES FOR ASSESS ING THE R ISK TO GROUNDWATER FROM ON-S I TE SANITAT ION34
main processesdie-offadsorptionfiltration
unsaturated zone
saturated zone
contaminantplume
main processesdie-offadsorptiondilution
pit latrine
water table
Figure 3.8. Attenuation
processes within the
unsaturated and saturated
zones

manual, rather than being prescriptive, promote a
risk-based approach, acknowledging that in some
circumstances it may be necessary to accept some
level of risk. The risk of microbiological
contamination relates to the potential for
pathogens to reach the groundwater supply. The
risk is defined in terms of the travel time of
contaminated water from source to the supply.
Empirical evidence is used in making the
definition. Although there are significant
uncertanties in identifying travel times, the
authors believe that such an approach is the most
practical option.
Empirical evidence from a limited number of
field studies has shown that a separation between
the pollution source and the water supply
equivalent to 25 days travel time is usually
sufficient to reduce concentrations of faecal
indicator bacteria to levels where detection within
most samples is unlikely. However, the studies
did not analyse for other pathogens such as
viruses that are expected to survive for longer
travel times in the subsurface. The generally
accepted minimum separation for contaminant
source and groundwater supply in western
Europe, which aims to bring water quality within
WHO guidelines or national standards, is that
equivalent to 50 days travel time. This 50 day
travel time is based on survival times of viruses
from laboratory and field experiments. However,
this travel time is likely to result in prohibitive
distances of separation in the developing world
context under certain circumstances. Therefore,
within the ARGOSS guidelines three levels of risk
are defined:
● significant risk - less than 25 day travel time
● low risk - between 25 and 50 day travel time
● very low risk - greater than 50 day travel time
The ‘low risk’ category provides confidence, but
no guarantee, that the travel time between
contaminant source and groundwater supply
would result in levels of micro-organisms which
are unlikely to represent a major risk to health.
The ‘very low risk’ category provides a further
margin of safety and therefore greater confidence
that the water will meet WHO guidelines and that
more persistent pathogens will be removed from
water entering the supply. However, since routine
monitoring rarely analyses for individual
pathogens, it is not normally possible to confirm
this.
It is important to differentiate between the
Techn i ca l ba ckg round 35
Figure 3.9. Pathogen
diameters compared with
aquifer matrix aperturesProtozoa
PATHOGENDIAMETER
APERTURE /PORE SIZES
Fissuresapertures
Sandssandstones
Viruses
Bacteria
Limestones
Silt
1 nm1 mm

‘survival time’ for micro-organisms, which can be
many days, months or even years, and is a
measure of the rate of die-off, and the travel time
within the groundwater system necessary to
reduce the numbers of micro-organisms to levels
unlikely to represent a risk to health. The latter
incorporates all the attenuation processes
discussed above.
In this manual we suggest that a water
supply is ‘acceptable’ where the risk
assessment is considered low or very low and
the monitored water quality meets the
guideline value.
3.6.3 Attenuation of chemical contaminants
Biological uptake of nitrate occurs within the soil
(through plants etc). However, this may be easily
overwhelmed during recharge periods, when rapid
leaching of nitrate held in the soil may occur. In
the case of nitrate sources such as on-site
sanitation and solid waste dumps, leaching is
expected, partly because there is limited ability for
uptake of nitrate either because plants are not
present or their roots do not normally extend to
the base of the latrine. Once in the deeper
unsaturated zone, there is normally little
attenuation of nitrate as it is largely unreactive and
not retarded. Under aerobic conditions nitrate is
mobile and not retarded. In the saturated zone and
where groundwater conditions are anaerobic,
denitrification can occur. Denitrification is a
microbiological process in which bacteria consume
nitrate (in the absence of oxygen) for their
metabolic needs, producing nitrogen gas. This
process is thought to be responsible for the low
nitrate concentrations found in groundwater
beneath Dhaka. In the saturated zone, dilution is
the other attenuation process that that can reduce
nitrate concentration. However, this will not be
particularly effective where the nitrate load is high
and derived from a large number of point sources
over an extensive area (equivalent to widespread
diffuse leaching of nitrate). In many cases, a nitrate
front is developed that slowly migrates downwards
from the surface through the groundwater. Once
high levels of nitrate are present in
groundwater, concentrations will not decrease
rapidly, even if the load is reduced or removed.
3.7 Pathways for localised contaminationContamination of groundwater supplies may result
either from contaminants moving through the
body of the aquifer or via pathways resulting from
the design and construction of the supply or its
deterioration with time (localised contamination).
The former was addressed in Section 3.2. Localised
contamination is a very common means for the
decline in the quality of groundwater supplies. In
this section we identify the local pathways for
contamination to get into groundwater supplies
(Figure 3.10) and provide general advice on
programme-wide measures.
Localised contamination can occur either
● where contaminated water is in direct contact
with the headworks of boreholes, wells and
springs and where pathways exist that allow
this to mix with the water supplied; or
● where contaminated water that has infiltrated
into the sub-surface in the close vicinity of a
borehole, well or spring moves along fast
horizontal pathways to the supply.
Localised contamination will result where:
1. potential contaminating activities are not
excluded from the vicinity of the headworks;
2. sanitary protection measures employed in the
headworks are insufficient; or
3. the design and construction of a groundwater
supply is inadequate.
The general measures required to avoid
localised contamination of groundwater supplies
are summarised here.
GUIDEL INES FOR ASSESS ING THE R ISK TO GROUNDWATER FROM ON-S I TE SANITAT ION36

3.7.1 Design and construction of groundwater
supplies
The good design and construction of groundwater
supplies is critical to the prevention of
contamination. In addition to the actual designs
utilised and construction practices followed, the
ongoing maintenance of the infrastructure and
protection measures is critical to ensure that the
risk of contamination remains low. It is not the
purpose of this manual to review in detail design
and construction methods for groundwater
sources.
The brief sections below describe the basic or
essential components for design and construction
that are required to limit the risk of
contamination.
Boreholes
To avoid localised contamination of groundwater
supplies it is preferable in all cases to include a
sound cement seal (at least 5cm thick) around the
casing to the top of the intake screen. The cement
seal is especially important where the formation is
stable and thus does not collapse around the
casing, as this will produce a pathway capable of
transmitting contaminated water very rapidly to
the screen, either from the wellhead or through
fast pathways in the sub-surface. Even where the
formation is likely to collapse, this does not
guarantee that a pathway will not exist and so the
seal should still be constructed.
However, it is accepted that this is not always
practical. Where this is not achievable the seal
should be as deep as possible and at least 2-3m
below the ground surface.
It is acknowledged that in some countries
hand-drilling methods that are cheap and widely
available are the only practical solutions to
constructing water supply wells. The method
makes the inclusion of a cement seal problematic
and other measures need to be accepted to reduce
risk. These include:
● the use of good quality casing materials;
● screw thread joints in preference to glued
joints;
● the provision of a cement seal to beyond the
first joint where wear and tear will be greatest;
● placing the screen as deep as possible,
increasing the likelihood that the formation
Techn i ca l ba ckg round 37
Figure 3.10. Pathways for
contamination into
groundwater supplies

will collapse around sufficient length of the
casing;
● ensuring there is a non-return valve at the
base of the rising ain of the pump to avoid
contamination from water used in priming.
Recommendations for the design of boreholes in
terms of the depth of screen may result from the
widespread microbiological assessment guidelines
in Section 4.2.
Protected springs
Springs should be protected against direct
contamination. Usually a spring box or retaining
wall is built with an outlet pipe some distance
from the ‘eye’ of the spring. The area between is
filled with gravel, sand and overlain with grass
(Figure 3.11). This backfilled area is often at
greatest risk of contamination as this area has
been excavated and unless well designed and
maintained may allow contaminated surface water
to enter the spring.
The filter media is laid from the base of the
excavation to the expected highest level of wet
season water-table rise. The filter media laid
should be sufficiently fine to provide reasonable
filtration and attenuation, whilst not unduly
retarding the flow. This will help remove any
contaminants that have already entered the
groundwater. However, further protection is
needed to prevent direct contamination from
surface water that inundates the backfill area
during rainfall or from sullage. The filter should
be overlain by a clay layer to reduce infiltration by
surface water, with above this a sand layer to
remove cysts and finally a soil layer. The backfill
should have a full grass cover and be protected by
a fence and diversion ditch to ensure that
contaminated surface water cannot flood the
spring during wet periods.
The maintenance requirements for springs are
often low, but it is essential that the ditches, grass
cover on the backfill area and fencing are all kept
in good condition and are not allowed to fall into
disrepair. The concrete and other construction
work should also be maintained in good condition
to prevent direct entry of contaminated surface
water.
Dug wells
Hand dug wells are one of the lower-cost forms of
water supply and as a result are popular
technologies. Hand-dug wells in particular offer
great potential for participation of communities in
the planning and construction phases and unlike
boreholes still provide water when a handpump
has broken down.
However, dug wells are particularly vulnerable
to contamination as it is often difficult to ensure
that the lining of the top layers is impermeable
and so it may be easy for contamination to enter
the well. A cement seal between the top one or
two rings and the dug ground helps prevent
contamination through the joints between well
rings. Ensuring that a strong or medium cement
mix is used for the lining (1:2:4 or 1:3:6) will help
to provide structural stability and it is advisable to
provide a plaster seal on the lining wall to prevent
ingress of water in the lining column. The lining
should extend at least 0.3m above the level of the
ground as a headwall and preferrably a cover slab
should be fitted with a handpump or windlass
used to withdraw the water. As with boreholes, it
is essential that the handpump has a non-return
valve to prevent contamination from priming
water.
One method of constructing a dug well below
the water-table is to sink a column of ‘caissons’.
These are concrete rings of smaller diameter than
the lining and are designed to provide water
security during dry periods. Usually the base of
the caisson has a ‘cutting edge’ of greater diameter
than the caissons. The annulus between the
GUIDEL INES FOR ASSESS ING THE R ISK TO GROUNDWATER FROM ON-S I TE SANITAT ION38

outside edge of the caisson and the cutting edge
should be filled with gravel and sand to provide a
filter pack and the base of the well should include
either a 0.2–0.3m filter pack of sand and gravel or
a permeable concrete slab. Further protection can
be provided by constructing an intake box at the
base of the well which can be filled with sand and
gravel.
3.7.2 Sanitary protection measures at headworks
Sanitary protection measures at the headworks of
a groundwater supply aim to prevent both sources
and pathways of contamination occurring. The
critical measures required are summarised in
Table 3.5 and illustrated in Figure 3.11.
By maintaining the critical sanitary protection
works noted above, the potential for direct
contamination by surface water can be greatly
reduced. However, whilst these may prevent the
most direct forms of contamination, other controls
may be required in the vicinity of the source to
reduce the potential for contamination.
The failure in key sanitary protection measures
often results from the poor maintenance of basic
infrastructure that allows pollutant pathways to
develop. For instance, the absence of a fence
around a spring allows animals and people greater
access to the immediate backfill area and this may
lead to erosion of the catchment. Equally, the
failure of diversion ditches often increases the
potential for erosion around protection works and
thus often allows direct pathways for pollutants to
develop. Table 3.6 summarises the interaction
between pollutant pathways and indirect factors.
In many cases, contamination may occur
when a surface hazard exists uphill combined
with poor sanitary protection measures and
development of a direct pathway into the supply.
It should be noted that these factors are highly
inter-related and direct ingress is unlikely to occur
Techn i ca l ba ckg round 39
��inspection
coversoil and grass
cover
fencediversion
ditch
gravel
sand
aquifer
splashplate
drain
clay
Figure 3.11. Sanitary
protection measures for
a) springs and
b) boreholes
cement sealto screen
concrete plinth(sloping away from pump)
concrete-lined drain
1.5 m
5 m
diversionditch
splashplate
soakaway
water table
borehole screen
gravel pack
pump
protectivefence
a)
b)
when one element is not present.
In order to assess the risks of contamination of
groundwater, it is important to evaluate all the
potential hazards, pathways and indirect factors
that may influence the potential for
contamination. The role of each factor in causing
localised contamination is investigated through
the use of sanitary inspection. A range of risk
factors are evaluated at a groundwater supply and
the likelihood of each factor contributing to
contamination assessed. This is used within the
assessment procedure presented in Chapter 5 and
is discussed further there.
In addition to maintenance of key sanitary
protection measures, is the control of other
activities in the immediate area of the
groundwater supply. These include:
● Abandoned wells—these should be properly
capped or backfilled;
● Shallow pits which provide means for
contaminated water to by-pass surface sanitary
measures and reach the supply via shallow
pathways that allow rapid movement of the
contaminated water. Good design and
GUIDEL INES FOR ASSESS ING THE R ISK TO GROUNDWATER FROM ON-S I TE SANITAT ION40
Source General sanitary type completion measures Specific sanitary completion measures
Borehole Wellhead protection apron extends at least 1.5m from casing/liningto prevent direct no cracks in aproncontamination no ponding of water on the apron
the join between apron and the casing/lining is sound the floor is sloped away from the wellheaddrainage for wastewater away from the well head
Immediate area fencing excludes animals from the wellheadmanaged properly diversion ditches direct run-off away from the wellhead
ponding of surface water close to borehole does not occur
Protected Local protection backfill area behind a spring box or retaining wall isspring works to prevent protected and retains grass cover
direct contamination retaining wall and other protection works kept in good order
Immediate area fencing excludes animals from the backfill areamanaged properly diversion ditches direct run-off away from the backfill area
good drainage of wastewater from spring ponding of surface water uphill and close to spring does not occur
Dug well Wellhead protection apron around wellhead extends at least 1.5mto prevent direct wellhead raised by at least 0.3m and covered by slabcontamination no cracks in apron
no ponding of water on the apronjoin between apron and the casing/lining is sound floor is sloped away from the wellheadhandpump or windlass used to withdraw water
Immediate area fencing excludes animals from the wellheadmanaged properly diversion ditches direct run-off away from the wellhead
ponding of surface water close to well does not occurdrainage for wastewater away from the well head
Table 3.5. Sanitary
protection measures required
for different sources

Techn i ca l ba ckg round 41
Source type Pathway factor Contributing factors to contamination
Protected Eroded backfill or Lack of uphill diversion ditchspring loss of vegetation cover Lack of fence
Animal access close to the spring
Faulty masonry Lack of uphill diversion ditchLack of fenceAnimal access close to the spring
Borehole Gap between riser Lack of diversion ditchpipe and apron Lack of wastewater drain
Animal access to borehole
Damaged apron Lack of diversion ditchLack of wastewater drainAnimal access to borehole
Dug well Lack of headwall Lack of diversion ditchLack of wastewater drainAnimal access to dugwell
Lack of cover Animal access to dugwellUncontrolled use
Use of bucket and rope
Gap between apron and Lack of diversion ditchwell lining Lack of wastewater drain
Animal access to dugwell
Damaged apron Lack of diversion ditchLack of wastewater drainAnimal access to dugwell
Table 3.6. Pathways and
indirect factors influencing
contamination of
groundwater sources
construction may reduce the likelihood of this
occurring, for instance by ensuring there is a
satisfactory cement seal at the upper levels in a
borehole;
● Flooding of the water supply - In low-lying
areas this may be largely unavoidable. Where
the flooding is a result of rising groundwater
levels, entry into the groundwater supply will
be limited as the water levels in the supply are
likely to be equal to those outside. In areas
where flooding from surface waters is a
problem, sanitary completion measures should
be designed to address this. Raising the ground
at the wellhead is an option although attention
must be given to ensuring that this does not
introduce additional pathways for the entry of
contaminants into the supply.
The aim in all water and sanitation
programmes should be to limit all risks, rather
than concentrate on simply the potential for
contamination from one hazard. There is little
benefit in reducing the risk of contamination from
on-site sanitation if other hazards and pathways
result in microbiological or chemical
contamination. Mitigating measures will involve
good siting of latrines and groundwater supplies,
but should also address construction and design of
supplies and sanitation facilities and sustained
maintenance of sanitary protection measures. This
is likely to require training of community
operators.
The methodologies for assessing risks of

GUIDEL INES FOR ASSESS ING THE R ISK TO GROUNDWATER FROM ON-S I TE SANITAT ION42
Summary of key points from Chapter 3
● The degree to which contaminant attenuation occurs in the sub-surface is dependent on the type of soil
and rock, the types of contaminant and the associated activity. The term aquifer pollution vulnerability
is used to represent the intrinsic characteristics of the aquifer which determines whether it will be
adversely affected by an imposed contaminant load
● Attenuation of contaminants is generally most effective in the unsaturated zone and in particular in the
upper soil layers where biological activity is greatest. Microbiological, and to a lesser extent key
chemical contaminants, are removed, retarded or transformed as a result of this biological activity. At
deeper layers in the unsaturated zone, attenuation still occurs although the processes tend to be less
effective as biological activity decreases. Once the saturated zone is reached, attenuation usually
becomes far more limited and natural die-off and dilution predominate
● Three levels of risk of microbiological contamination are defined in this manual:
– significant risk: less than 25 day travel time
– low risk: between 25 and 50 day travel time
– very low risk: greater than 50 day travel time
The ‘low risk’ category provides confidence, but no guarantee, that the wet season travel time between
contaminant source and groundwater supply would result in water meeting WHO guidelines. The ‘very
low risk’ category provides a further margin of safety and therefore greater confidence that the water
will meet WHO guidelines and that more persistent pathogens will be removed from water entering the
supply.
● Once high concerntrations of nitrate are present in groundwater, they will not decrease rapidly even if
the load is reduced or removed
● Contamination of groundwater supplies may result either from contaminants moving through the body
of the aquifer or via pathways resulting from the design and construction of the supply or it’s
deterioration in time (localised contamination).
● The aim in all water and sanitation programmes should be to limit all risks rather than concentrate on
simply the potential for contamination from one hazard. There is little benefit in reducing the risk of
contamination from on-site sanitation if other hazards and pathways result in microbiological or
chemical contamination. Mitigating measures will involve good siting of latrines and groundwater
supplies but should also address construction and design of supplies and sanitation facilities and
sustained maintenance of sanitary protection measures. This is likely to require training of community
operators.
widespread and localised contamination, and the
mitigating measures that may be put in place, are
covered in Part 2 of this manual. It should also be
stressed that there are no hard and fast rules in
contamination prevention and conditions at each
site should be assessed whenever planning new
water and sanitation programmes or investigating
contamination risks of existing facilities.
Part 2:
The guidelines
OverviewThe guidelines of this manual are designed to help
those planning water supply and sanitation
schemes to select design options that will
minimise the risk of contamination of the water
supply. These guidelines also stress the
importance of follow-up monitoring as an integral
part of the design for water supply and sanitation
schemes. In this manual a water supply is
considered acceptable when the initial risk
assessment is low or very low and the monitored
water quality meets the national standards or
guidelines. However, it is recognised that it may
not always be possible to have a low or very low
risk design; under these circumstances it may be
appropriate to accept a higher risk but instigate a
programme of enhanced monitoring to confirm
that water quality is still acceptable.
Chapter 4 of the manual takes the reader
through the initial risk assessment.The initial risk
assessment covers three aspects (or components):-
● microbiological contamination of the water
supply via aquifer pathways
● nitrate contamination of the water supply via
aquifer pathways
● microbiological contamination of the water
supply via pathways created by the
construction of the water supply
A flow chart, for each of these risk
components, helps the reader through the
decision-making process and allows appropriate
design options to be identified. Chapter 5
discusses monitoring and helps the reader to
select the most appropriate types of monitoring,
the key parameters and frequency. Chapter 5 also
provides advice on data analysis and
interpretation.
43

4.1 IntroductionThere are two principal routes by which boreholes,
wells and springs may become contaminated by
on-site sanitation systems:
● the first relates to the natural vulnerability of
the aquifer to pollution. This pathway exists
naturally because the subsurface is permeable
and water and contaminants can percolate
from on-site sanitation systems to the water-
table and from there migrate into the
groundwater supply. This route can potentially
produce widespread contamination of the
shallow groundwater;
● the second route is where a pathway is created
by the poor design or construction of the
groundwater supply. This will produce only
localised contamination of the supply (where a
large number of groundwater supplies are
installed as part of a water supply and
sanitation programme, many may be
contaminated because of a repeated fault in the
design or the construction).
It is important to assess the risk of
contamination of the groundwater supply via both
pathways. The main concern is microbiological
contamination, however nitrate contamination can
also be a problem, especially where the population
density is high and/or rainfall recharge is low. This
is discussed in Section 4.3.
Thus when assessing the risk posed by on-site
sanitation to a water supply it is necessary to
consider three aspects:-
(1) microbiological contamination of the
groundwater supply via aquifer pathways;
(2) nitrate contamination of groundwater supplies
via aquifer pathways;
(3) microbiological contamination via pathways
created by construction of the groundwater
supply.
A staged approach is adopted for each of these
assessments, summarised by a flow chart. These
three assessments are described in sections 4.2,
4.3 and 4.4. This manual will, for each
assessment, provide one or more options for the
design of the water supply (or on-site sanitation
system). A number of worked examples are
provided in Appendix A that apply the assessment
procedures presented in this section.
In this manual a water supply is considered as
acceptable when all three risk assessments are
judged to be low or very low risk and monitored
GUIDEL INES FOR ASSESS ING THE R ISK TO GROUNDWATER FROM ON-S I TE SANITAT ION44
First-step risk assessment4The risk assessment methodology presented
here uses three categories to describe the level
of risk. These are defined as follows:
Significant risk: water quality is highly
unlikely to meet WHO guidelines because the
travel time for water to move from
contaminant source to groundwater supply
either via aquifer pathways or localised
pathways which exist due to the
design/construction of supply is less than 25
days.
Low risk: confidence, but no guarantee,
water will meet WHO guidelines because
travel time exceeds 25 days.
Very low risk: greater confidence that the
water will meet WHO guidelines and that
more persistent pathogens will be removed
from water entering the supply because the
travel time is greater than 50 days, providing a
further margin of safety.
Note, this definition of risk applies to
microbiological contaminants only. See
Section 4.3 for a discussion of the risks
associated with nitrate contamination.

water quality meets the guideline value. Whilst
wherever possible the design should meet these
criteria, it is recognised that this may not always
be feasible. Thus under some circumstances, it
may be necessary to accept an option that carries a
significant risk (but one minimised as far as is
practical) provided that an increased level of
monitoring is also instigated. Guidance on
monitoring is given in Chapter 5.
Whilst these guidelines focus on
contamination caused by on-site sanitation, it is
important to recognise that there are other sources
of contamination, especially in urban areas.
4.2 Assessing the risk of microbiologicalcontamination of groundwater supplies viaaquifer pathwaysTwo circumstances may arise when undertaking
this assessment:
1. groundwater supplies are being installed,
either in combination with the construction of
on-site sanitation systems or where on-site
sanitation already exists. In this circumstance
there is some control over the design and
construction of the groundwater supply;
2. on-site sanitation is being installed where
groundwater supplies already exist. Here there
is no control over the design or construction of
the groundwater supply (although the design
of on-site sanitation and its location can be
altered).
These two circumstances will be addressed
separately in this section although there is some
overlap.
4.2.1 Installation of groundwater supplies where
on-site sanitation already exists, or in
combination with the installation of on-site
sanitation
Figure 4.1 (p 46) is a flow chart summarising the
steps within the assessment.
STEP 1: collect background information
first identifying the hydrogeological environment
(Table 4.1 p 47)
● determine a typical minimum depth to water-
table (by measuring water-levels in open wells,
using local knowledge or from water level
records held by the government agency).
● collect information on the types of sanitation
system used, or likely to be used, and their
hydraulic loading (Table 4.2 p 48).
If necessary, seek specialist advice at a local
university, national geological survey or other
agency.
STEP 2: assess attenuation in the unsaturated
zone
In this step we need to assess whether attenuation
within the unsaturated zone (Figure 4.2 p 47) is
likely to stop pathogens reaching the water-table or
reduces numbers to acceptable concentrations.
Hydraulic loading
A conservative approach is to assume that where
the hydraulic loading is high (greater than
50 mm/day) the risk of pathogens reaching the
water-table is considered significant. This is
because the unsaturated zone beneath the on-site
sanitation will be sufficiently wetted that travel
time will be low and the attenuation capacity
reduced. Table 4.2 uses a simple approach to
estimating the hydraulic loading based on
sanitation design.
Nature of unsaturated zone
Even if the hydraulic loading is less than 50
mm/day there still may be significant risk that
pathogens will reach the water-table. Whilst
previous studies have suggested that as little as 2 m
of fine unsaturated sand can provide sufficient
attenuation of faecal indicator bacteria, this may
not be true for all pathogens. Table 4.3 (p49)
F i r s t - s t ep r i s k a s s e s sment 45

GUIDEL INES FOR ASSESS ING THE R ISK TO GROUNDWATER FROM ON-S I TE SANITAT ION46
Figure 4.1. Flowchart for
assessing the risk of
microbiological
contamination of
groundwater supplies via
aquifer pathways.
Installation of groundwater
supplies where on-site
sanitation already exists, or
where this is done in
combination with the
installation of on-site
sanitation
Step 1: Collect background information
Step 2: Assess attenuation within unsaturated zone
Step 3: Assess attenuation with depth below water-table
Step 4: Assess attenuation with lateral separation in aquifer
Is the hydraulicloading less
than 50 mm/d?(Table 4.2)
Is it a densely
populated
urban area?
(eg>10/ha)
Options
Shallow boreholes ordugwell would besuitable.Need to considersanitary completionand maintainnominal separationbetween latrine andwater supply(see Section 4.4)
Will the unsaturated zoneprovide sufficient
attenuation of microbes?(Table 4.3)
N
N
N Y
NY
Y
Are distances required forremoval of microbes to
acceptable concentrations(Table 4.4) compatible withavailable space/community?
Options where residual risk remains
1. accept the risk but instigate anincreased level of monitoring
2. investigate sanitation design optionsthat reduce the level of contaminationleaching
3. treat the water supply
4. invest in off-site water supply or wastetreatment
Y
Y
N
Options
Borehole - select verticalseparation using Fig 4.5(see also Section 4.4)
Options
Borehole or dugwell.Select horizontalseparation usingTable 4.4
Are sediments unlikely to befractured and does Figure 4.5
suggest completing the boreholeat a feasible depth will allow
sufficient attenuation?
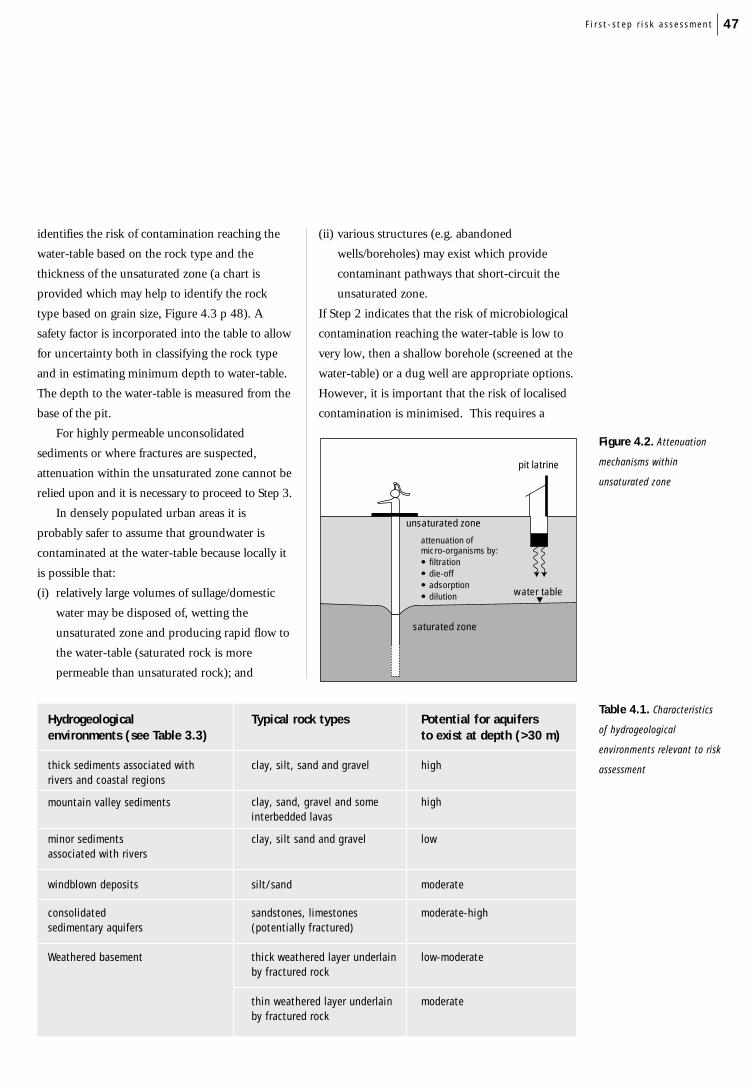
identifies the risk of contamination reaching the
water-table based on the rock type and the
thickness of the unsaturated zone (a chart is
provided which may help to identify the rock
type based on grain size, Figure 4.3 p 48). A
safety factor is incorporated into the table to allow
for uncertainty both in classifying the rock type
and in estimating minimum depth to water-table.
The depth to the water-table is measured from the
base of the pit.
For highly permeable unconsolidated
sediments or where fractures are suspected,
attenuation within the unsaturated zone cannot be
relied upon and it is necessary to proceed to Step 3.
In densely populated urban areas it is
probably safer to assume that groundwater is
contaminated at the water-table because locally it
is possible that:
(i) relatively large volumes of sullage/domestic
water may be disposed of, wetting the
unsaturated zone and producing rapid flow to
the water-table (saturated rock is more
permeable than unsaturated rock); and
(ii) various structures (e.g. abandoned
wells/boreholes) may exist which provide
contaminant pathways that short-circuit the
unsaturated zone.
If Step 2 indicates that the risk of microbiological
contamination reaching the water-table is low to
very low, then a shallow borehole (screened at the
water-table) or a dug well are appropriate options.
However, it is important that the risk of localised
contamination is minimised. This requires a
F i r s t - s t ep r i s k a s s e s sment 47
Figure 4.2. Attenuation
mechanisms within
unsaturated zone
attenuation of micro-organisms by:
filtrationdie-offadsorptiondilution
unsaturated zone
saturated zone
pit latrine
water table
Hydrogeological Typical rock types Potential for aquifers environments (see Table 3.3) to exist at depth (>30 m)
thick sediments associated with clay, silt, sand and gravel highrivers and coastal regions
mountain valley sediments clay, sand, gravel and some highinterbedded lavas
minor sediments clay, silt sand and gravel lowassociated with rivers
windblown deposits silt/sand moderate
consolidated sandstones, limestones moderate-highsedimentary aquifers (potentially fractured)
Weathered basement thick weathered layer underlain low-moderateby fractured rock
thin weathered layer underlain moderateby fractured rock
Table 4.1. Characteristics
of hydrogeological
environments relevant to risk
assessment

nominal or minimum separation between the water
supply and the sanitation system (see Section 4.4).
STEP 3: assess attenuation with depth below
the water-table
Putting the screen section of the borehole at greater
depth will increase the travel time for
contaminated water from the pit latrine. This may
be sufficient to reduce the risk of contamination to
low or very low (Figure 4.4). Even quite small
increases in the depth of the screen can increase
the travel time by many tens or even hundreds of
days. This is applicable to unconsolidated
sediments only, since in consolidated rocks,
near-vertical fractures may be present which could
provide a rapid pathway from the water-table to
deeper aquifer zones.
The vertical separation necessary for the
required travel time can be calculated from Figure
4.5 (p 50) using appropriate graphs for the rock
type in question (Table 4.4, p 54 may help).
(Larger versions of the graphs in Figure 4.5 can be
found in Appendix B). The likely pumping rate of
the borehole is important as the greater the rate,
the faster water, and any associated contaminants,
will move towards the borehole. A typical
pumping rate for a handpump is 0.2 l/s (averaged
over a day).
The option of increasing the depth to the
borehole screen is attractive because:
● the incremental cost of constructing deeper
boreholes is often relatively small;
● many aquifers are layered or stratified so that
travel times for groundwater to penetrate to
depth are likely to be long, providing an
additional safety factor;
● using vertical separation allows the horizontal
separation between borehole and pollution
source to be reduced to a nominal value. As a
consequence the borehole can be conveniently
located close to users which may be especially
valuable in urban areas where space is limited.
However, reducing the separation between the
borehole and the pit latrine may increase the
risk of localised contamination that short
circuits the natural subsurface profile (see
Section 4.4).
However for aquifers which are not sufficiently
thick, vertical separation may not be a feasible
option; in this case it is necessary to proceed to
Step 4.
GUIDEL INES FOR ASSESS ING THE R ISK TO GROUNDWATER FROM ON-S I TE SANITAT ION48
Sanitation typedry on-site sanitation wet on-site sanitation
low hydraulic loading simple pour-flush (low usage
(< 50 mm/d) VIP <10 people)
composting
urine separation
high hydraulic loading septic tanks
(> 50 mm/d) aqua privies
Table 4.2. Hydraulic loading
associated with on-site
sanitation types
Figure 4.3. Grain sizes of a
range of sediment types.
Silt Fine Medium Coarse Graveland Clay Sand Sand Sand<0.06mm 0.06-0.2mm 0.2-0.6mm 0.6mm-2mm >2mm

STEP 4: assess attenuation due to lateral
groundwater movement
In Step 4, an assessment is made as to whether it is
feasible to provide sufficient lateral separation
between the pollution source and the groundwater
supply so that the risk can be considered low or
very low (Figure 4.6 p 51).
The horizontal separation required is the
distance that groundwater would travel
(horizontally) in a time interval of 25 or 50 days.
Although each rock type will have a large range of
permeabilities covering several orders of
magnitude, permeabilities will fall within a
narrower band of more likely values (Table 4.4,
p 54). Whilst this narrower band of values will
provide the basis for more realistic groundwater
velocities, higher velocities are of course possible.
A horizontal separation based on Table 4.4 (p 54) is
therefore subject to some uncertainty and careful
monitoring is required to provide confidence in the
design criteria.
F i r s t - s t ep r i s k a s s e s sment 49
Figure 4.4.
Attenuation with depth
below water-tablepit latrine
water table
attenuation of micro-organisms by:
filtrationadsorptiondie-offdilution
increased vertical distance increases travel time
unsaturated zone
saturated zone
Table 4.3. Assessment of
risk following attenuation of
micro-organisms within the
unsaturated zone
1 where the weathered material is soft and easily dug. Where weathered rock is competent and therefore potentially fracturedit should be considered as fracured rock
significant risk that micro-organisms may reach water-table at unacceptable levels
low to very low risk that micro-organisms may reach water-table at unacceptable levelsi.e. travel time through the unsaturated zone greater than 25 days
Rock types in Depth to water-table (minimum depth)unsaturated zone (metres below base of pit)
<5 5–10 >10
fine sand, silt and clay
weathered basement1
medium sand
coarse sand and gravels
sandstones/limestonesfractured rock

The horizontal separation is calculated by the
following simple equation:
separation = velocity x time
(t = 25 or 50 days)
where velocity = Kiϕ
K = hydraulic conductivity (permeability) m/d
i = hydraulic gradient (assume 1/100)
ϕ = porosity
Values for the parameters can be obtained from
Table 4.4. Use the maximum permeability and the
minimum porosity suggested to give the most
conservative estimate of lateral separation.
There are two major areas of concern when
relying on horizontal separation between the
contaminant source and groundwater supply to
provide sufficient attenuation:
● thin highly permeable normally horizontal layers
may occur within the aquifer that
provide a more rapid pathway than would be
anticipated by the broad-scale lithology of the
aquifer and an assumed average permeability
(Figure 4.6). For this reason, especially in
layered aquifers and where permeable sand
layers are suspected, great care needs to be taken
in choosing appropriate lateral separation; and
● the horizontal separation required may be
incompatible with available space.
Where it is feasible to install a water supply at a
sufficient lateral separation to provide a low or very
low risk, then options could include a shallow
borehole, dug well or spring.
Options where residual risk remains
Where providing a sufficient horizontal separation
between contaminant source and groundwater
supply is not a feasible option because of a) lack of
space, b) the aquifer is fractured or c) the aquifer is
thin and highly permeable, then there will be a
significant residual risk of contaminated
groundwater entering the supply. Options at this
stage include:
● accept the risk but instigate an increased level of
monitoring (see Chapter 5). This is likely to be
most acceptable where attenuation in the
unsaturated and saturated zones, although
individually not sufficient, may together provide
significant attenuation;
GUIDEL INES FOR ASSESS ING THE R ISK TO GROUNDWATER FROM ON-S I TE SANITAT ION50
Figure 4.5. Travel time forthe flow to a borehole screenfor the water-table for arange of pumping rates andscreen depths, and a series ofaquifer porosities and Kh:Kvratios. Kh:Kv ratio is the ratioof hydraulic conductivity inthe horizontal and verticaldirections. (Full page versionsavailable in Appendix B).

● where appropriate, investigate sanitation
design options that reduce the level of
contamination leaching;
● treat the water supply – probably most
appropriate for fractured aquifers;
● invest in off-site water supply or waste
treatment.
4.2.2 Installing on-site sanitation alone, where
groundwater supplies already exist
Figure 4.7 (p 52) is a flow chart summarising the
steps within the assessment.
STEP 1: collect background information
Collect information as in Step 1 of Section 4.2.1.
In addition collect information on the design and
construction of groundwater supplies in the area
in which sanitation is to be installed.
STEP 2: assess attenuation in the unsaturated
zone
If the existing water supplies are obtained from
dug wells or boreholes screened at the water-table
it is necessary to assess whether the unsaturated
zone can provide sufficient attenuation of
pathogens using Table 4.3 (p 49). If the risk is
low or very low the option is for any dry-type
latrine. However, one will need to consider
latrine separation to avoid localised
contamination. This is discussed in Section 4.4.
STEP 3: assess attenuation with depth below
water-table
This assessment is similar to that in Step 3 of
Section 4.2.1 but approaches the question from
the opposite direction. Given the details that are
available on the design of the groundwater supply,
are the screened sections of the borehole
sufficiently deep to allow the required attenuation
of microbiological contaminants? If uncertain of
design go to Step 4. Dug wells will not allow
51F i r s t - s t ep r i s k a s s e s sment
lateral separation
pit latrine
water table
fast layer
fast layer
Figure 4.6. Increased lateral
separation between pollution
source and groundwater supply
reduces risk. Thin, relatively
permeable layers may
significantly increase the
travel time of some of the
pollutant
sufficient attenuation as water will always be able
to enter at shallow depths. Use Figure 4.5 as in
Section 4.2.1.
STEP 4: assess attenuation due to lateral
groundwater movement
Undertake this assessment as in Step 4 of Section
4.2.1. If risk is low (Table 4.4 p 54) any latrine type
can be installed. However, it is important to
consider a minimum separation between latrine
and the water supply to reduce the risk of localised
contamination. This is discussed in Section 4.4.
Where a residual risk remains, various options can
be considered. These include: (1) investigate
special sanitation design options that reduce risk;
(2) examine appropriateness of installing new
(deeper) water supply; (3) treat water supply;
(4) invest in off-site waste treatment; (5) accept
risk but instigate an increased level of monitoring.
4.3 Assessing the risk of nitratecontamination of groundwater supplies asa result of widespread aquifercontaminationA critical element in assessing the risk of
widespread nitrate contamination of an aquifer is
to consider the short and long-term water supply

GUIDEL INES FOR ASSESS ING THE R ISK TO GROUNDWATER FROM ON-S I TE SANITAT ION52
Figure 4.7. Flow chart for
assessing the risk of
microbiological
contamination of
groundwater supplies via
aquifer pathways where
groundwater supplies exist
and only on-site sanitation
is being installed.
Step 1: Collect background information
Step 2: Assess attenuation within unsaturated zone
Step 3: Assess attenuation with depth below water-table
Step 4: Assess attenuation due lateral groundwater flow
Are existing watersupplies obtainedfrom dugwells or
boreholes screenedat the water-table?
Will the unsaturated zoneprovide sufficient
attenuation?(see Table 4.3)
N
N
N
Y
Y
Is it possible to providesufficient horizontal separation
between water supply andlatrine to attenuate pathogens
(see Table 4.4)
Options
Install latrine, any type (seeSection 4.4 for minimumseparation to reduce localisedcontamination)
Options where residual risk remains
1. investigate special sanitation design options thatreduce risk
2. examine appropriateness of installing new (deeper)water supplies
3. treat water supplies
4. invest in off-site treatment
5. accept risk but investigate an increased level ofmonitoring
Y
Y
N
Options
Install dry type latrineonly (see Section 4.4 forminimum separationbetween latrine and watersupply to reduce localisedcontamination)
Is screen on existing boreholessufficiently deep to attenuatepathogens within saturated
zone (use Fig 4.5)
Options
Can install any type ofsanitation system (seeSection 4.4 for minimumseparation betweenlatrine and water supplyto reduce localisedcontamination)
(or uncertain)
Go to Step 4
and sanitation plans, i.e. the type of groundwater
supplies available and the long-term need to
protect groundwater. In some cases, the use of
shallow groundwater, which is more susceptible
to nitrate contamination, may be viewed as a
short-term intervention, the long-term aim being
to develop a piped distribution network based on
surface water or more distant deep groundwater
sources. In this situation, concerns over nitrate in
groundwater may be relatively limited and
restricted to the immediate health concerns. The
potential benefits of improved sanitation are likely
to significantly outweigh these risks.
In other situations, however, long-term water
supply strategies will be based on the continued
use of groundwater for domestic supply. Even
when such plans indicate abstraction of deeper
groundwater in the future, the control of nitrate
contamination will become critical, as in many
situations there is hydraulic continuity between
shallow and deep groundwater. As a consequence,
fronts of high nitrate water may migrate from
shallow to deep groundwater and this potentially
places the resource at long-term risk.
A staged approach is adopted and is summarised
by a flow chart in Figure 4.8 (p 55). It must be
emphasised that estimating nitrate leaching is at
best approximate. This risk assessment therefore
seeks to indicate only whether or not a potential
risk is likely due to on-site sanitation alone. It
should be noted that other sources of nitrate may
exist which, on their own or in combination with
nitrate from on-site sanitation, cause nitrate
concentrations in groundwater to be
unacceptable.
STEP 1: Collect background information
Background information is collected which is
required to estimate the likely nitrate
concentration in groundwater recharge derived
from on-site sanitation systems. The following
data/information is required;
● a typical minimum depth to water-table;
● an estimate of the average annual recharge
(mm). If necessary this can be based on a
knowledge of average annual rainfall using
Figure 4.9;
● population density;
● identification of the hydrogeological
environment.
STEP 2: Estimate nitrate concentration in
recharge
Using the information collected in Step 1 and
Figure 4.10 (p 57), the potential nitrate
concentration in the recharge can be estimated.
This assumes that all organic nitrogen deposited
in the pit latrine is oxidised and leached to
groundwater. However, in many cases the
percentage oxidised and leached will be less than
100% (Table 4.5, p 58). Multiplying the potential
nitrate concentration leached by the fraction
corresponding to the hydrogeological
environment gives an estimate of the nitrate
concentration in the recharge. These figures for
fractions of total nitrate leached are uncertain and
are used to indicate only the approximate
magnitude of the nitrate concentration that can be
anticipated. For groundwaters with low dissolved
oxygen, denitrification can occur producing very
low nitrate concentrations within the aquifer.
If the estimated nitrate concentration is low,
then on-site sanitation is likely to be acceptable.
However, it is still advisable to monitor because
other sources of nitrate may be present which
alone, or in combination with the nitrate from on-
site sanitation, result in the total nitrate
concentration exceeding the guideline value.
Where the estimated nitrate concentration exceeds
F i r s t - s t ep r i s k a s s e s sment 53

GUIDEL INES FOR ASSESS ING THE R ISK TO GROUNDWATER FROM ON-S I TE SANITAT ION54
the drinking water guideline value then it is useful
to consider the time delay and dilution in Step 3.
STEP 3: Consider time-delay and whether
short term option
So far the nitrate concentration in recharge from a
settlement has been estimated. However, the
nitrate concentration in the groundwater should
be lower because of mixing and dilution within
the aquifer (Table 4.6, p 58). If all the recharge to
groundwater is derived from the settled area, then
this dilution within the aquifer will only delay the
onset of predicted nitrate concentrations.
Nevertheless this delay may be important and
allow other measures (different source of water or
sewered sanitation) to be installed in the longer
term.
In smaller settlements (rural areas), recharge
to the deeper groundwaters may be derived in
part from outside the settled area (see Figure 4.11
p 57) and the recharge will accordingly be of
lower nitrate concentration. In this case nitrate
concentrations may remain low in the longer term
and on-site sanitation is likely to be an acceptable
option. However, it is important even in rural
areas that groundwater nitrate concentrations are
monitored.
In urban areas, recharge for deeper aquifers is
likely to be derived from an urban/settled
environment and therefore nitrate concentrations
are likely to be high. Significant delay can be
anticipated where the screened interval of the
borehole is deep (>30 m) and the aquifer
possesses considerable porosity (e.g.
unconsolidated). Thus on-site sanitation may be
acceptable as a short term measure but may be
problematic in the longer term. It is essential to
monitor nitrate.
Where on-site sanitation may cause nitrate
contamination even in the short term (e.g. aquifer
Table 4.4. Typical aquifer
properties for a range of rock
types and feasibility of using
horizontal separation
# this is the ratio of horizontal permeability and vertical permeability – greater in fine-grained sedimentary rocks* need to select a minimum separation to avoid localised contamination (see Section 4.4)
Rock types Typical porosity Typical Range of likely Feasibility of using Lateral separation to reduceKh:Kv ratio# permeability (m/d) horizontal separation pathogen arrival at water
supply to low risk
Silt 0.1–0.2 10 0.01–0.1 Yes up to several metres*
Fine silty sand 0.1–0.2 10 0.1–10 Yes, should be generally up to several metres*acceptable*
Weathered 0.05–0.2 1-10 0.01–10 Yes up to several metres*basement (not fractured)
Medium sand 0.2–0.3 1 10–100 uncertain, will need site Tens–hundreds of metresspecific testing and monitoring
Gravel 0.2–0.3 1 100–1000 not feasible up to hundreds of metres
Fractured rocks 0.01 1 difficult to not feasible up to hundreds of metres generalise,velocitiesof tens or hundreds
of m/d possible

F i r s t - s t ep r i s k a s s e s sment 55
Figure 4.8. Flow chart for
assessing the risk of nitrate
contamination of
groundwater supplies
as a result of widespread
aquifer contamination
Step 1: Collect background information
Step 2: Estimate nitrate concentration in recharge
Step 3: Consider time-delay and whether short term option
Is the potential for delaywithin the aquifersignificant? (Table 4.6)
Is area rural?
Options
OSS may cause nitratecontamination. Optionsinclude:● accept risk and monitor● consider new design for
on-site sanitation (egurine diversion)
Options
● OSS probablyacceptable as short term measure but longer term may have problem
● monitor
Options
● OSS probably
acceptable inshort term andpossibly in longerterm givendilution fromoutside thevillage area
● monitor
N N
● collect background information
● geology, depth to water-table,rainfall, population density
● estimate infiltration (Figure 4.9)
Y Y
● calculate nitrate loading usingFigures 4.10 and Table 4.5
Options
● On-site sanitation is acceptable
● monitor
Y
N
Is estimated NO3 concentration ofinfiltration likely to exceed 50 mg/l?
(n.b. figure will be higher ifsignificant other sources of nitrateexist)

GUIDEL INES FOR ASSESS ING THE R ISK TO GROUNDWATER FROM ON-S I TE SANITAT ION56
Figure 4.9. Simplified
relationship between average
annual rainfall and
groundwater recharge. Used
in Step 2 of risk assessment
due to nitrate.
provides limited potential for delay - see Table 4.6,
p 58). Two options are possible:
i) accept risk and monitor; actual nitrate
concentration may be less than estimate. May
need to consider alternative water supplies if
nitrate concentrations are excessive;
ii) consider changes in on-site sanitation design
(e.g. urine diversion – see Section 3.4).
This process has restricted the analysis of
nitrate loading to that originating from on-site
sanitation. If it is thought that other sources of
nitrogen loading are significant in comparison
with that from on-site sanitation (see Section 3.4),
expert advice should be sought to quantify this.
Monitoring data will be important in this
circumstance and in general when assessing the
risk to groundwater supplies from nitrate
contamination.
4.4 Assessing the risk of microbiologicalcontamination due to pathways created byconstruction of the groundwater supplyReducing the risk of contamination of the water
supply via localised pathways is achieved by firstly
keeping potential pollution sources away from the
immediate vicinity of the water supply and
secondly, by minimising pathways created by the
design or construction of the supply. This
assessment is sub-divided into two steps, the first
assessing the sanitary conditions of the headworks
and the second, the sanitary provisions below
ground surface. The assessment is summarised in
Figure 4.12 (p60).
STEP 1: Assessment of sanitary condition of
the headworks
The measures required to ensure adequate sanitary
protection at the headworks when constructing a
groundwater supply were discussed briefly in
Section 3.7. Table 4.7 (p59) lists key criteria for
headworks design. Those listed in Table 4.7a are
relatively cheap and easy to implement and should
be complied with, without exception. The criteria
listed in Table 4.7b should, where possible, be
included in the design although it is accepted that
this may not always be possible. Thus it may be
necessary to accept the limitations and the
corresponding residual risk.
Some example sanitary inspection forms are
provided in Appendix C. Further, detailed advice
on ‘best-practice’ approaches to sanitary
completion measures are presented in the WHO
Guidelines for Drinking-Water Quality Volume 3
and in a range of manuals on urban water supply
surveillance (see the WEDC web page
http://www.lboro.ac.uk/watermark for
information). Where a groundwater supply is
already in existence, sanitary survey forms provide
a means to assess the risk to the supply from
inadequate headworks and inappropriate activities
in the vicinity. Efforts or measures to address
problems highlighted in the survey will reduce the
risk to the supply. This is discussed further in the
next chapter.

STEP 2: Assessment of sanitary provisions
below ground surface within the supply design
Boreholes
If a sanitary seal exists and has been properly
installed then the borehole/well is acceptable for
the purposes of this assessment. If no sanitary seal
is present or cannot be installed as a result of the
drilling method, an alternative drilling method
should be sought which allows insertion of a
cement seal. If this is not possible (because costs
are prohibitive) a borehole design without a
sanitary seal may be considered under some
circumstances, accepting that the residual risk is
significant and that more frequent monitoring is
essential. These circumstances would include
where:
● aquifer is unconsolidated and not coarse-
grained; and
● depth to screen exceeds 30 m.
However, the risk of contamination will be
increased where (i) environment is urban, (ii) the
water-table is shallow and (iii) the separation
between the on-site sanitation and the water
supply is less than the nominal 10 m.
The risk of contamination can be decreased by
reducing the likelihood of leakage through the
casing by:
● using screw-threaded casing joints rather than
glued-joint casing
● avoid using suction-lift pumps that create a
pressure differential between inside and
outside of casing at the water-table. Such a
pressure differential would increase the risk of
contaminated water at the water-table being
F i r s t - s t ep r i s k a s s e s sment 57
Figure 4.10. Estimated
nitrate concentration in
groundwater recharge based
on population density and
average annual recharge
(full page version available
in Appendix B).
Figure 4.11. Where
boreholes are deep, the onset
of high nitrate
concentrations will be
significantly delayed due to
the time taken for the front
of high nitrate waters to
reach the borehole inlet. In
smaller ‘rural’ settlements
deep boreholes may tap
lower nitrate waters derived
from outside the settled
area, which is less likely in
an urban environment.

GUIDEL INES FOR ASSESS ING THE R ISK TO GROUNDWATER FROM ON-S I TE SANITAT ION58
Hydrogeological Fraction of nitrate environment likely to be leached
(1) Unconsolidated sedimentary aquifer
a) Clay, silt, fine sand Up to 0.3 could be very low especially where water-table is shallow and sediments clayey
b) Fine-medium sand c. 0.3
c) Medium sands and gravels 0.3–0.5
(2) Weathered basement aquifer
a) Thick weathered layer Up to 0.3 but could be very low especially where water-table is shallow and weatheredmaterial clayey
b) Thin and/or highly 0.3–0.5permeable weathered layer
(3) Fractured consolidated sedimentary aquifer Up to 1.0
Table 4.5. Percentage of
potential nitrate in
groundwater recharge likely
to leach from a pit latrine to
the water-table in a range of
hydrogeological environments
Hydrogeological Delay environment potential Urban (limited dilution) Rural (significant dilution)
Likely to be: Likely to be:
(1) Unconsolidated sedimentary aquifer
(a) <30 m depth low-moderate Problematic in short term Problematic in short Unsustainable in long term* and long term
(b) >30 m depth high Sustainable in short term, Sustainable in short termproblematic in long term and probably in long term
(2) Weathered basement aquifer
(a) thick weathered layer low-moderate Problematic in short term Problematic in short and Unsustainable in long term* long term
(b) thin weathered layer low Problematic in short term Problematic in short andUnsustainable in long term long term
(3) Fractured consolidated sedimentary aquiferlow Problematic in short term Problematic in short and
Unsustainable in long term long term
Table 4.6. Potential for
time-delay in the onset of
nitrate problems
*Unless fraction of nitrate leached is low due to denitrification

a) Factors that should be included in design
Boreholes and wells:- apron extends more than 1.5 m from well- cement floor is sound with no cracks and slopes away from borehole or well- drainage channel in good working order (not cracked, broken or blocked)- handpump firmly attached to apron- protective fence is in sound condition
Springs:- protection of the spring- backfill area behind a spring box or retaining wall protected and has grass cover- backfill media used is fine gravel or sand- retaining wall and other protection works in good condition and without cracks- fencing excludes animals from the backfill area- diversion ditches direct run-off away from the backfill area- drainage of wastewater from spring
b) General: factors that should be included in design, where possible
- sources of pollution such as surface water sources kept as far away as possible (at least 30m)- solid waste is removed from immediate area- animals should be kept at least 10m away from the supply
sucked in through a defective casing joint.
Where the formation is not unconsolidated or the
depth does not exceed 30 m, it is necessary to
seek specialist advice. For consolidated
formations a sanitary seal is essential.
Springs
If the design of the protected spring has included
a backfill media of pea gravel and sand which is
F i r s t - s t ep r i s k a s s e s sment 59
Table 4.7. Key criteria for
headworks design
overlain by protective sand, clay and grass layers
with adequate diversion ditches and fences, then
design problems are unlikely to be a significant
cause of failure in water quality. However, what is
crucial is for these protective measures to be
maintained properly to ensure ongoing
protection. As already discussed, if these measures
are allowed to deteriorate, then contamination
may well result.
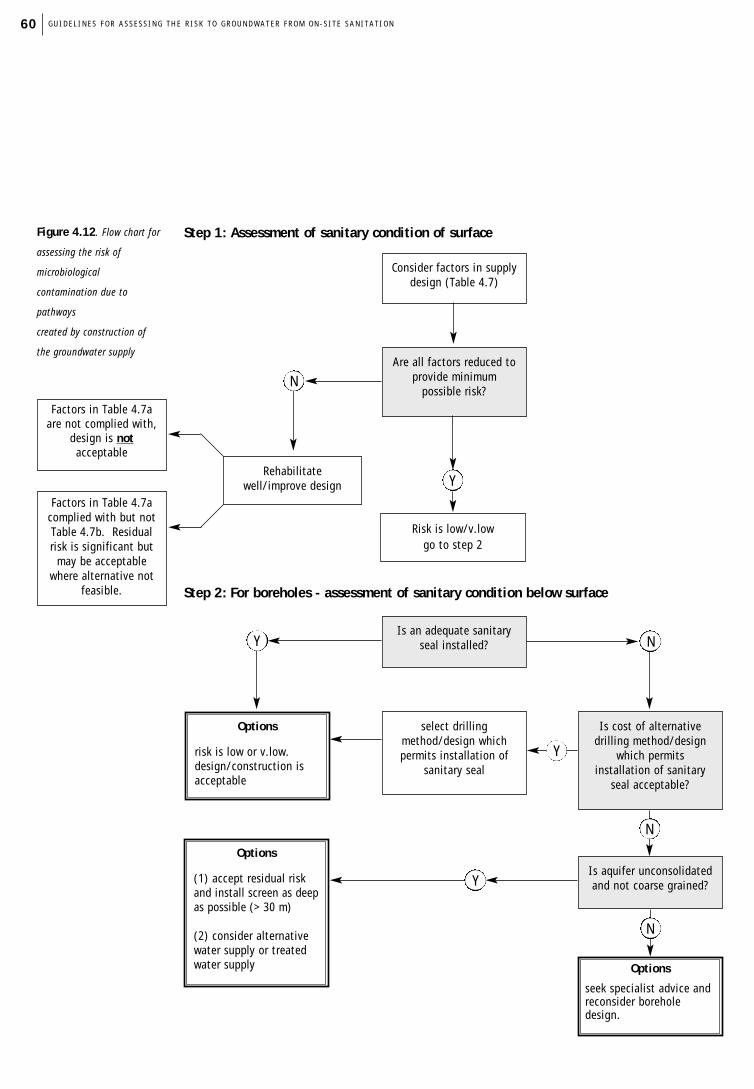
GUIDEL INES FOR ASSESS ING THE R ISK TO GROUNDWATER FROM ON-S I TE SANITAT ION60
Figure 4.12. Flow chart for
assessing the risk of
microbiological
contamination due to
pathways
created by construction of
the groundwater supply
Step 1: Assessment of sanitary condition of surface
Step 2: For boreholes - assessment of sanitary condition below surface
Consider factors in supplydesign (Table 4.7)
Are all factors reduced toprovide minimum
possible risk?
Is an adequate sanitaryseal installed?
select drillingmethod/design whichpermits installation of
sanitary seal
Is aquifer unconsolidatedand not coarse grained?
Is cost of alternativedrilling method/design
which permitsinstallation of sanitary
seal acceptable?
Rehabilitatewell/improve design
Options
risk is low or v.low.design/construction isacceptable
Options
(1) accept residual riskand install screen as deepas possible (> 30 m)
(2) consider alternativewater supply or treatedwater supply Options
seek specialist advice andreconsider boreholedesign.
Y
N
N
N
Y
N
Y
Y
Factors in Table 4.7aare not complied with,
design is notacceptable
Factors in Table 4.7acomplied with but notTable 4.7b. Residualrisk is significant butmay be acceptable
where alternative notfeasible.
Risk is low/v.lowgo to step 2

Ongo ing a s s e s sment o f r i s k s th rough mon i to r i ng 61
5.1 IntroductionMonitoring is an integral part of the design,
construction and maintenance of water supply
and sanitation schemes. Monitoring serves several
objectives, to:
● provide confidence/confirmation that the
design of the water supply scheme is
adequate, in particular where a significant
residual risk is identified during the
design/planning stage;
● help to identify the cause of contamination,
where it exists, so that follow-up remedial
work can be undertaken as appropriate;
● evaluate changes in both water quality and
near well-head environment over time, and
identify remedial maintenance required;
● check that water quality is fit for consumption
(health-based surveillance).
Monitoring involves both the determination of
chemical and microbiological quality of the water
and a survey of the sanitary conditions of the
water supply and its immediate environs. This
data needs to be analysed and interpreted to
address the objectives above.
However, collecting and analysing the data is
not an end in itself. The benefits of monitoring
can only be gained if the interpretation is fed back
to those planning the schemes and carrying out
operation and maintenance and that any
recommendations are acted upon.
Recommendations might include that the design
of the water supply is modified or that
maintenance of a water supply needs to be carried
out.
This chapter will provide answers to the
following:
● why monitor?
● how to monitor – how are samples collected,
which parameters should be analysed and how
are sanitary inspections carried out?
● when and where to monitor (e.g. numbers of
samples, numbers of water supplies, frequency
of sampling, influence of seasons)?
● how to analyse the data and how it can be fed
back to the water supply and sanitation
programme?
5.2 Why monitor?There are several reasons why it is important to
monitor water supplies, these are discussed in
detail below. Monitoring should be seen as an
essential part of the water supply and sanitation
programme providing valuable data on the
reliability, security and sustainability of the
schemes. Monitoring can also help by recognising
problems at an early stage and may help avoid
costly failures. A flow chart that maps the
decision-making process for monitoring is
presented in Figure 5.1.
5.2.1 Monitoring to provide confidence in design
Monitoring can be used to help confirm that the
design and construction methods for groundwater
supplies and/or selection of sanitation system type
is adequate to prevent contamination. This
information can be fed back to those planning the
water supply and sanitation programme. Where
the results confirm water quality is acceptable
then this provides confidence to programme
managers, regulators and to the users of the water
supplies. This is essential to ensure that effective
measures to protect water quality are highlighted
and replicated.
Assessments of existing water supply designs
may be used to select designs and planning for
water and sanitation projects in other areas and
this is often a sensible way of assessing risks when
data for the first-step risk assessment outlined in
Chapter 4 is not available. However, if this
approach is followed, it is essential that the area
used in the assessment is similar to the area where
the water and sanitation programme is to be
Ongoing assessment of riskthrough monitoring5

GUIDEL INES FOR ASSESS ING THE R ISK TO GROUNDWATER FROM ON-S I TE SANITAT ION62
Figure 5.1. Flow chart for
monitoring of groundwater
supplies
Monitor water qualityand undertake sanitary
inspection
Can watersupply/sanitation system
design be improved?
Improve design
Is water qualityacceptable?
Is water qualityacceptable?
Is contaminationwidespread and thereforean aquifer problem and
not due to localisedpathways?
Identify specific factorscausing problem from
sanitary survey
Is it possible to improveconstruction/rehabilitate
well?
Is water qualityacceptable?
Continue low frequencymonitoring and feedback
to design team
Treat water supply or select offsite treatment of effluent
rehabilitate
Y
Y
Y
Y
N
N
N
N
Y
NYN
initiated. For example, it may not be possible to
project the results of assessments of water quality
of shallow groundwater sources in small towns or
rural areas to large urban areas with high-density
populations.
Monitoring is very important in circumstances
where a significant residual risk was identified in
the planning stage (Chapter 4) or where an
assessment of existing water supplies suggests the
residual risk is high. For example, where hand-
drilling methods are used to construct boreholes
that preclude the use of a sanitary cement seal
around the casing, a significant residual risk can
be anticipated which is difficult to quantify. The
difference in borehole construction costs between
conventional drilling methods and hand-operated
techniques is very considerable and therefore
before abandoning the cheaper hand-drilled
technique, it is important to assess whether the
residual risk is acceptable. This could be tested
by monitoring the water supplies constructed
using hand-drilling methods to see whether
contamination has occurred at concentrations
exceeding those that are acceptable.
Even when risks identified during planning
are low, it is always valuable to undertake at least
some monitoring (perhaps of a small number of
water supplies constructed) in order to verify
whether water quality is acceptable. Should
contamination be found, the causes need to be
investigated further as these may relate to a
number of different factors, of which on-site
sanitation is only one problem. This is discussed
further in Section 5.5.
5.2.2 Monitoring to establish cause of
contamination
Monitoring can be used to identify the causes of
contamination and to establish whether the
problem is general (aquifer wide) or restricted to
individual water supplies (localised problem).
Understanding the extent and nature of pollution
is critical to be able to plan and implement
remedial actions. Where the problem is aquifer
wide, then consideration should be given to
whether it is possible to change the design of the
water supply. This could involve using a deeper
tubewell with the contaminated shallow aquifer
sealed-off, or by adding treatment to the source,
for instance through chlorination of a shallow
well. Alternatively, the sanitation system could be
changed with a design that is less prone to
leaching contaminants into the groundwater or by
ensuring that latrine pits are never dug into the
water-table. Where a change in design or
construction is not possible, an alternative means
of water supply (for instance through piped water)
could be considered or a household water
treatment system promoted.
Where the problem is ‘localised’ it is necessary
to identify the factor(s) causing the
contamination, which will help identify how the
problem might be rectified. This relies on using
both sanitary inspection and water quality data
and, unless both are available, it will be difficult to
do this analysis. In many cases, the problem may
be relatively easy to overcome through improved
operation and maintenance and limited
investment in repair works. If it is not possible to
improve the construction or rehabilitate the
supply, then consideration should be given to
either treating the water supply or by promoting
the use of household water treatment
technologies.
5.2.3 Health-based surveillance
One reason for monitoring is to ensure that the
water supplied meets the appropriate drinking
water guideline or standard. Priority is always
given to microbiological water quality. In the
context of on-site sanitation, the key parameters
will include faecal coliforms and nitrate.
Ongo ing a s s e s sment o f r i s k s th rough mon i to r i ng 63

However, other quality parameters that affect
health or cause consumers to reject the water, for
example turbidity, fluoride, arsenic and iron,
should be considered under this type of
monitoring. For further information please consult
the WHO Guidelines for Drinking-water quality
Volume 1 (Recommendations) and Volume 3
(Surveillance and control of community water
supplies) and the manuals on water supply
surveillance in urban areas of low-income countries
(available at www.lboro.ac.uk/watermark).
Where the design and the construction method
for the supply are considered to present a low risk
(see Chapter 4) it is probable that the water quality
will meet the relevant guideline or standard, but
this should be verified for at least some of the water
supplies. Where water quality does not meet the
guideline or standard, monitoring should be used
to establish the cause of contamination (see
Sections 5.2.2 and 5.5). It is also useful to try to
link the water quality data to health surveillance
data (if this exists) to see if the contamination of
the water supply is leading to definite adverse
health effects. If health data show an impact and
the water quality cannot be improved at the
source, it is important that hygiene education
programmes are undertaken in the affected
communities and household water treatment is
promoted.
5.2.4 Monitoring to evaluate trends in water
quality and risks
Whilst the good design and planning of water and
sanitation systems often greatly reduces the risk of
GUIDEL INES FOR ASSESS ING THE R ISK TO GROUNDWATER FROM ON-S I TE SANITAT ION64
Determinand Purpose Field analysis Laboratory analysis Sampling requirementsMicrobiological Thermotolerant indicate a faecal source of pollution field kits available for not all laboratories have sterilise sampling equipment, coliform and increased risk of pathogen faecal coliforms and facilities for carrying-out bottles and spout. Keep cool, E.coli presence faecal streptococci. microbiological analyses but dark and analyse within 6 Faecal streptococci where they do, faecal hours
coliforms and E.coli arestandard parameters; faecalstreptococci analysis maynot be available.
ChemicalNitrate major chemical contaminant spectrophotometer spectrophotometer keep cool prior to analysis –Ammonium associated with sanitation pollution undertake analysis within a few
(see Section 3.5) photometer standard method days
meter and ion specificelectrodes possible
Chloride major chemical contaminant spectrophotometer standard method keep cool prior to analysisassociated with sanitation pollution (see Section 3.5) photometer
meter and ion specificelectrodes or titration
Dissolved oxygen availability of oxygen to oxidise meter and electrode not applicable use flow cell to avoid water nitrogen into nitrate contact with air
Electrical conductivity measures total dissolved solids meter and electrode standard method best measured in fieldwhich can be an indicator of pollution standard parameter
Table 5.1. Parameters to
monitor, equipment needed
and requirements for
sampling

groundwater contamination from on-site sanitation,
it should be recognised that this is unlikely to
ensure that there is no increase in risks with time.
As communities develop, there is increasing
pressure for land and thus encroachment into areas
where sanitation is controlled may occur over time,
unless the community and support agencies have
plans to counter-act this. In addition, risks of
contamination will increase when basic protective
measures are not well-maintained.
In order to keep the risks of contamination to
an acceptable level, it is important that there is
ongoing monitoring of groundwater supplies to
assess whether conditions at the supplies are
changing and whether these are leading to
increasing risks. This helps to determine whether
major changes are needed in design, construction
or planning of water and sanitation programmes.
5.3 How to monitorThis section discusses the means by which
monitoring data are collected, for discussion of
when and where data are collected please see the
next section. When planning a monitoring
programme a number of issues are of importance:
● parameters to measure and sampling methods;
● facilities required to analyse samples;
● costs incurred; and
● conducting sanitary inspections.
Table 5.1 lists the standard parameters that a
monitoring programme should include when
addressing contamination from sanitation sources.
Some basic information on sampling is provided
that relates to the type of equipment necessary and
sampling methods.
A key issue to address in the planning of a
monitoring programme are the analytical facilities.
Analysis can be undertaken in the field or in
laboratories although commonly a combination of
both are used. The choice will depend principally
on:
● number of samples to be routinely analysed;
● availability of a laboratory that can analyse for
the required parameters;
● availability and reliability of field equipment
that can analyse for the required parameters;
● distance of field sites from the laboratory;
● availability of personnel to collect samples and
availability of equipment for analysis in the
field;
Ongo ing a s s e s sment o f r i s k s th rough mon i to r i ng 65
Field analysis
Advantages
● cheap equipment
● easy to measure
● immediate results can be obtained and checked
● can be analysed within short distance/time of field site
● essential for dissolved oxygen and often for microbiological parameters
● greater participation of communities in surveillance and improvement of water supply
Disadvantages
● large number of samples take long time
● limited range of analyses
● diverts investment from laboratories
● poor quality control
Laboratory analysisAdvantages
● able to handle large numbers of samples more efficiently and cost-effectively
● wider range of analyses
● more complex analyses
● better quality control possible
Disadvantages
● expensive for small numbers of samples
● may require long time in transit if laboratory far from field area
● analyst does not ‘see’ sites
Table 5.2. A comparison of
field and laboratory analysis
of samples
● the degree of community participation
desired.
Field equipment may be used for the analysis
of microbiological and chemical parameters where
the number of samples is relatively small and
community involvement in surveillance and
improvement of water supply is desired.
Alternatively, samples can be analysed in a
laboratory, which will allow a greater range of
tests to be carried out and greater number of
samples to be analysed. Consumables costs for
both laboratory and field equipment can be
relatively high.
Field analysis is essential for some parameters,
for instance electrical conductivity or dissolved
oxygen, where transport back to a laboratory may
cause deterioration of the sample and potentially
inaccurate results. Field analysis for such
parameters normally relies on meters and
chemical analysis may use ion-selective electrodes.
These generally provide sufficiently accurate
results but are time-consuming when large
numbers of analyses are required. Field
photometers and spectrophotomers can also be
used to analyse nitrate and other chemicals,
although it may be easier to perform these
analyses in an office or laboratory.
Laboratories are able to handle large numbers
of samples more easily and will be able to perform
a wider range of analysis and undertake more
complex analysis. However, the main
disadvantage is the distance of the laboratory from
the field and the potential for the condition of the
sample to change during transport from the field
site. Samples for bacteriological analysis must be
kept below 4oC and analysed within 4-6 hours of
taking the sample in order for the results to be
reliable.
The comparison of field and laboratory
analyses is made in Table 5.2.
It is difficult to generalise about costs. However,
the main components are likely to be:
● staff time involved and field expenses;
● purchase, running costs (including
maintenance) of transportation;
● capital and running costs of field equipment;
and
● laboratory costs.
As monitoring is essential when undertaking a
water and sanitation programme, the costs and
the logistics of taking and analysing samples
should be incorporated at an early stage. Further
information on establishing field and laboratory
based programmes is provided in ‘Water quality
monitoring’ by Bartram and Ballance, which is
listed in the References.
Sanitary inspection
Whenever a sample is taken, a sanitary
inspection should be carried out. This is an
assessment of the potential sources of faeces
(hazards) that may affect the water supply and the
state of the infrastructure and protection works.
These relate to the pathways and indirect factors
that can lead to contamination as discussed in
Section 3. WHO and other organisations
recommend that a systematic approach is taken to
sanitary inspection, using standardised formats.
Examples of sanitary inspection forms are
included in Appendix C. However, these should
only act as a guide as the different risks may be
relevant in different areas.
In this type of sanitary inspection, there are a
limited number of questions. Each question has a
yes/no answer. When the answer to a question is
‘yes’ this means a sanitary risk is presented and
when the answer is ‘no’ it means that the risk is
not present. Where the answer is yes, then one
point is awarded and where the answer is no, zero
points are awarded. The total score can then be
GUIDEL INES FOR ASSESS ING THE R ISK TO GROUNDWATER FROM ON-S I TE SANITAT ION66
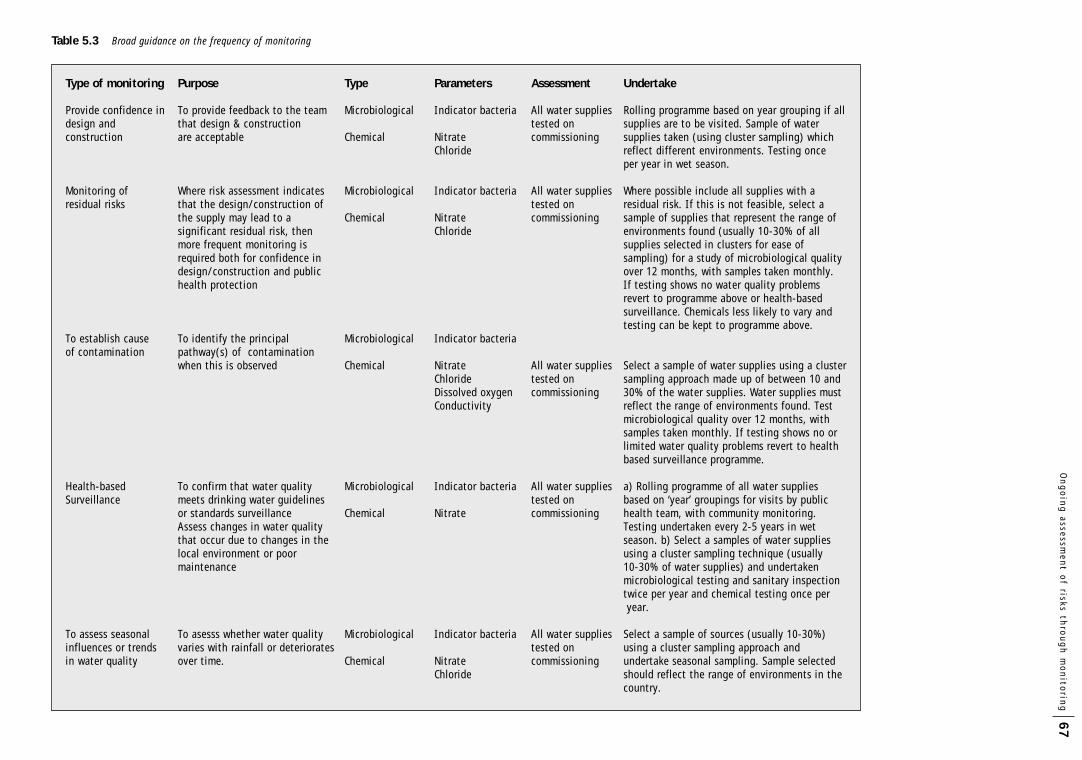
On
go
ing
asse
ssme
nt o
f risks thro
ug
h m
on
itorin
g67
Type of monitoring Purpose Type Parameters Assessment Undertake
Provide confidence in To provide feedback to the team Microbiological Indicator bacteria All water supplies Rolling programme based on year grouping if alldesign and that design & construction tested on supplies are to be visited. Sample of waterconstruction are acceptable Chemical Nitrate commissioning supplies taken (using cluster sampling) which
Chloride reflect different environments. Testing onceper year in wet season.
Monitoring of Where risk assessment indicates Microbiological Indicator bacteria All water supplies Where possible include all supplies with aresidual risks that the design/construction of tested on residual risk. If this is not feasible, select a
the supply may lead to a Chemical Nitrate commissioning sample of supplies that represent the range of significant residual risk, then Chloride environments found (usually 10-30% of all more frequent monitoring is supplies selected in clusters for ease of required both for confidence in sampling) for a study of microbiological quality design/construction and public over 12 months, with samples taken monthly. health protection If testing shows no water quality problems
revert to programme above or health-based surveillance. Chemicals less likely to vary and testing can be kept to programme above.
To establish cause To identify the principal Microbiological Indicator bacteriaof contamination pathway(s) of contamination
when this is observed Chemical Nitrate All water supplies Select a sample of water supplies using a clusterChloride tested on sampling approach made up of between 10 andDissolved oxygen commissioning 30% of the water supplies. Water supplies must Conductivity reflect the range of environments found. Test
microbiological quality over 12 months, withsamples taken monthly. If testing shows no or limited water quality problems revert to health based surveillance programme.
Health-based To confirm that water quality Microbiological Indicator bacteria All water supplies a) Rolling programme of all water supplies Surveillance meets drinking water guidelines tested on based on ‘year’ groupings for visits by public
or standards surveillance Chemical Nitrate commissioning health team, with community monitoring.Assess changes in water quality Testing undertaken every 2-5 years in wet that occur due to changes in the season. b) Select a samples of water supplieslocal environment or poor using a cluster sampling technique (usuallymaintenance 10-30% of water supplies) and undertaken
microbiological testing and sanitary inspectiontwice per year and chemical testing once peryear.
To assess seasonal To asesss whether water quality Microbiological Indicator bacteria All water supplies Select a sample of sources (usually 10-30%)influences or trends varies with rainfall or deteriorates tested on using a cluster sampling approach andin water quality over time. Chemical Nitrate commissioning undertake seasonal sampling. Sample selected
Chloride should reflect the range of environments in the country.
Table 5.3 Broad guidance on the frequency of monitoring

calculated to provide a measure of overall
vulnerability to contamination and of operation
and maintenance performance. However, it may
also be useful to analyse each factor in relation to
contamination to identify which are the most
important factors that influence contamination.
5.4 When and where to monitorIt is not possible to be too prescriptive about
when or how frequently to sample as this will
depend on the situation, the objectives of the
monitoring and the resources available. Often,
the monitoring of small water supplies varies
between no monitoring at all (or only on
commissioning) to attempting to visit all supplies
every year. It is desirable to develop an ongoing
routine programme of health-based surveillance
of water quality for public health reasons, but this
may not be feasible in all cases and alternative
strategies may need to be developed.
One approach which has been successfully
implemented in Latin America and Africa is to
develop a ‘rolling’ programme of visits to water
supplies to collect information for management
needs. In this situation all the water supplies are
assigned to a ‘year group’ which means that they
will only be visited during that year. Different
‘year group’ supplies are visited each year. A
sample of water supplies is selected from each
‘year group’ which may be as low as 100 water
supplies. This approach is designed for collecting
general management information, but can also be
used to determine the major causes of
contamination when this is found. This approach
will provide information that may be of use in
evaluating overall design and construction quality
or operation and maintenance performance.
However, it is most effective when communities
also regularly inspect their water supply and act
on the findings.
In order to undertake a specific assessment of
the problems related to on-site sanitation or to
evaluate a range of risk factors on water quality,
monitoring can be restricted to a small number of
water supplies. These should be selected to
ensure that they are representative of the supplies
found in the area of interest or in the country as a
whole. This selection can be done by first
selecting an area and undertaking a rapid
assessment of all or at least the majority of water
supplies. This should usually be done under
‘worst case’ conditions when contamination is
GUIDEL INES FOR ASSESS ING THE R ISK TO GROUNDWATER FROM ON-S I TE SANITAT ION68
Attenuation Mechanism Check1
Unsaturated zone is hydraulic loading from sanitation systemshigher than originally suspected?
is depth to minimum water-table estimate correct?
is permeability of shallow sediments more than assumed in original risk assessment?
is unsaturated zone potentially fractured?
Vertical separation (between water- are figures used for aquifer type, pumping rate etc correct?table and screen) within saturated zone is aquifer potentially fractured?
Horizontal separation between pit latrine are permeable layers potentially present which were not and borehole taken into account in the initial risk assessment?
is aquifer potentially fractured?
Table 5.4. Elements to
check when re-evaluating the
‘first-step risk assessment’
1 expert advice may be necessary

most likely to occur (for instance during the wet
season).
When the assessment has been completed,
look at the data and see whether you can group
the data into categories – e.g. <10 FC/100ml, 10-
50FC/1ml, 50-100FC/ml, 100-150 FC/100ml,
150-200 FC/100ml, >200FC/100ml. Then look
at how many water supplies fall into each
category and select a sample from each category
for inclusion in a monitoring programme. The
monitoring programme would then focus on a
small number of water supplies that are visited on
a regular basis. In rural areas this may only need
to be once per season as the major influence on
quality is likely to be recharge through rainfall. In
urban or peri-urban areas, visits may be needed
on a monthly basis, as there are many more
potential sources of recharge that could cause
contamination.
It is difficult to be prescriptive about the
numbers of sources that should be included as
this should by preference be based on a statistical
analysis of the assessment data. Where there are
very large numbers of supplies (e.g. several
hundred or thousand) a relatively low proportion
of the supplies can be included in the sample
provided this ensures that differences in
hydrogeological regime are taken into account. In
most cases, a sample of 10 to 20% of supplies
will be adequate and for very large numbers of
supplies (e.g. several tens of thousands) the
sample size may be reduced further to say 5%.
With a smaller total number of supplies (e.g.
below 50), a larger proportion should be taken,
for instance 20–30%. Where a specific study is
being undertaken related to residual risks or
research into the causes of contamination, a
larger sample may be advisable to provide an
adequate database. Some broad guidance on
monitoring is provided in Table 5.3 and further
Ongo ing a s s e s sment o f r i s k s th rough mon i to r i ng 69
Hydrogeological environment Depth to water-table Arrival time for chemical contaminants1
at water-table at borehole screen2
Thick unconsolidated sediments shallow < 10 m weeks – years months – decadesassociated with rivers and deep > 10 m years – decades years – decadescoastal regions
Unconsolidated mountain valley shallow < 10 m weeks – years months – decadessediments deep > 10 m years – decades years – decades
Minor unconsolidated sediments shallow < 10 m weeks – years months – decadesassociated with rivers deep > 10 m years – decades years – decades
Windblown deposits shallow < 10 m weeks – years months – decadesdeep > 10 m years – decades years – decades
Consolidated sedimentary aquifers shallow < 10 m days – years weeks – decadesdeep > 10 m weeks – decades months – decades
Weathered basementthick weathered layer shallow < 10 m weeks – years months – decades
deep > 10 m years – decades years – decadesWeathered basement
thin weathered layer shallow < 10 m days – years weeks – yearsdeep > 10 m weeks – years months – years
Table 5.5. Approximate
travel times in various
aquifer systems to indicate
likely times before onset of
chemical contamination
1 This is the broad range of time that is aniticpated for the bulk of recharge to arrive, some rapid by-pass flow may arrive earlier but is unlikely
to significantly modify chemical water quality. The actual time will depend on porosity/permeability of the aquifer and the climate type.
2 Depends on depth of screen

general principles include:
● where distinct wet and dry seasons occur it is
advisable to collect samples in each season;
● where residual risk is high or where water
quality shows that some microbiological
contamination occurs albeit within acceptable
limits, then the sampling frequency needs to
be high;
● as chemical quality of water generally changes
in a more subdued manner than
microbiological quality, the frequency of
monitoring for chemical parameters may be
lower;
● where chemical quality is good, the frequency
of monitoring may be reduced but it is useful
to check for trends in quality with time;
● where residual risk is low and where
monitoring data show water quality is within
national standards or guidelines, then the
frequency of sampling can be reduced.
5.5 Data analysis and interpretation5.5.1 Localised versus widespread contamination
Once contamination of groundwater supplies has
been detected the first priority is to make a
decision as to whether short-term action is needed
in respect of those water supplies that do not meet
the drinking water guidelines. This might involve
the closure of the supply or treatment of the
abstracted water. Alternatively it may involve
using household water treatment units to protect
public health.
The next priority is to establish whether the
source of contamination is likely to be localised
(due to poor design or construction of the water
supply) or more widespread (leaching from pit
latrines to the water-table and then into the water
supply). There are a number of indicators that
provide evidence to help establish whether the
source of contamination is localised or
widespread:
Localised indicators
● patchy (or isolated) distribution of poor
quality water;
● assessment (Chapter 4) indicates risk of
widespread contamination is low;
● localised risk judged to be significant (from
initial assessment, Chapter 4);
● water quality is associated with occurrence of
localised risk factors;
● in an outbreak, disease cases cluster in certain
areas close to particular sources.
Widespread indicators
● assessment (Chapter 4) indicates risk of
widespread, contamination is significant;
● poor association between water quality
observed and localised risk factors;
● poor quality water is associated with areas
where risk factors for widespread
contamination are considered more significant
(e.g. shallow depth to water-table or near
surface rocks are more permeable);
● in a disease outbreak, cases do not cluster
around particular sources but can be linked to
water.
5.5.2 Widespread microbiological contamination
Where widespread contamination by aquifer
pathways is suspected, it is necessary to re-
evaluate the risk assessment (Chapter 4) to
identify possible specific causes (see Table 5.4).
In general, the vertical separation is likely to
be the most reliable mechanism for attenuating
microbial contaminants because pathways that
provide rapid vertical transport are less likely to
be present in most areas. Horizontal separation is
less reliable because thin highly permeable layers
may be present, which could provide a rapid
pathway for water (and microbial) transport.
These may be difficult to identify when making
the initial risk assessment.
GUIDEL INES FOR ASSESS ING THE R ISK TO GROUNDWATER FROM ON-S I TE SANITAT ION70
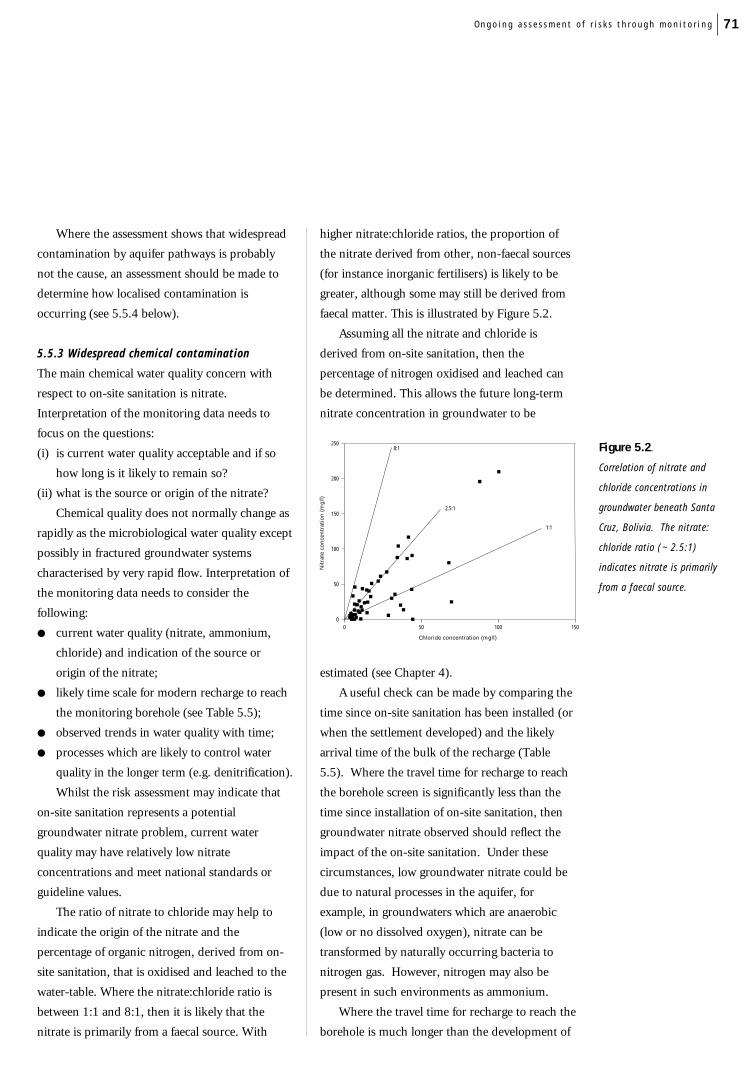
Where the assessment shows that widespread
contamination by aquifer pathways is probably
not the cause, an assessment should be made to
determine how localised contamination is
occurring (see 5.5.4 below).
5.5.3 Widespread chemical contamination
The main chemical water quality concern with
respect to on-site sanitation is nitrate.
Interpretation of the monitoring data needs to
focus on the questions:
(i) is current water quality acceptable and if so
how long is it likely to remain so?
(ii) what is the source or origin of the nitrate?
Chemical quality does not normally change as
rapidly as the microbiological water quality except
possibly in fractured groundwater systems
characterised by very rapid flow. Interpretation of
the monitoring data needs to consider the
following:
● current water quality (nitrate, ammonium,
chloride) and indication of the source or
origin of the nitrate;
● likely time scale for modern recharge to reach
the monitoring borehole (see Table 5.5);
● observed trends in water quality with time;
● processes which are likely to control water
quality in the longer term (e.g. denitrification).
Whilst the risk assessment may indicate that
on-site sanitation represents a potential
groundwater nitrate problem, current water
quality may have relatively low nitrate
concentrations and meet national standards or
guideline values.
The ratio of nitrate to chloride may help to
indicate the origin of the nitrate and the
percentage of organic nitrogen, derived from on-
site sanitation, that is oxidised and leached to the
water-table. Where the nitrate:chloride ratio is
between 1:1 and 8:1, then it is likely that the
nitrate is primarily from a faecal source. With
higher nitrate:chloride ratios, the proportion of
the nitrate derived from other, non-faecal sources
(for instance inorganic fertilisers) is likely to be
greater, although some may still be derived from
faecal matter. This is illustrated by Figure 5.2.
Assuming all the nitrate and chloride is
derived from on-site sanitation, then the
percentage of nitrogen oxidised and leached can
be determined. This allows the future long-term
nitrate concentration in groundwater to be
estimated (see Chapter 4).
A useful check can be made by comparing the
time since on-site sanitation has been installed (or
when the settlement developed) and the likely
arrival time of the bulk of the recharge (Table
5.5). Where the travel time for recharge to reach
the borehole screen is significantly less than the
time since installation of on-site sanitation, then
groundwater nitrate observed should reflect the
impact of the on-site sanitation. Under these
circumstances, low groundwater nitrate could be
due to natural processes in the aquifer, for
example, in groundwaters which are anaerobic
(low or no dissolved oxygen), nitrate can be
transformed by naturally occurring bacteria to
nitrogen gas. However, nitrogen may also be
present in such environments as ammonium.
Where the travel time for recharge to reach the
borehole is much longer than the development of
Ongo ing a s s e s sment o f r i s k s th rough mon i to r i ng 71
8:1
C h l o r i d e c o n c e n t r a t i o n ( m g / l )
Nit
rate
co
nce
ntr
atio
n (
mg
/l)
1:1
2.5:1
250
200
0 50 100 150
150
100
50
0
Figure 5.2.
Correlation of nitrate and
chloride concentrations in
groundwater beneath Santa
Cruz, Bolivia. The nitrate:
chloride ratio (~ 2.5:1)
indicates nitrate is primarily
from a faecal source.

the settlement and/or installation of on-site
sanitation then groundwater nitrate
concentrations may be low because the ‘front’ of
the high nitrate groundwaters has not yet reached
the borehole screen. In these cases, continued
background monitoring is important to check
whether there is an increasing trend in nitrate
concentrations.
5.5.4 Localised microbiological contamination
When microbiological contamination is
believed to be primarily due to localised problems
related to poor sanitary completion of the water
supply or sources of contaminants close to the
supply, then it is useful to assess the importance
of different factors in causing the contamination.
This will aid in selecting and planning appropriate
remedial or preventative actions. In order to do
this, the results of sanitary inspections and water
quality results are analysed together.
The first step in making an assessment of the
risk of localised microbiological contamination is
to review the frequency of reporting of different
risks with varying degrees of recorded
microbiological quality (usually expressed in
faecal coliforms per 100ml). This will provide an
indication of the relative importance of different
factors. In this case, it is essential to be clear what
exactly you are attempting to evaluate – the
prevalence of any contamination in the supply or
the severity of contamination. Where records
suggest that a significant number of a supply type
do not show contamination and when
contamination is found, it is generally low, the
first approach may be used. However, where the
data suggest that contamination is common and a
wide range of actual values of contamination are
noted, it may be important to also look at
influences on severity of contamination.
In order to analyse the data, simple frequency
analysis of sanitary inspection risk data often
provides sufficient information to inform action.
Statistical analysis can be performed to measure
the strengths of identified associations and in
many cases carrying out such analysis is
recommended.
As the interaction between risk factors and
water quality is the principal purpose of this
assessment, it will be necessary to define key
water quality objectives. Examples of water
quality objectives could include:
GUIDEL INES FOR ASSESS ING THE R ISK TO GROUNDWATER FROM ON-S I TE SANITAT ION72
Risk factor Frequency % (of samples in each category) Difference %
≤10 FC/100ml >10FC/100ml
Masonry defective 8 17 +9
Backfill eroded 29 67 +38
Collection area flooded 79 83 +4
Fence faulty 83 100 +17
Animal access <10 m 79 100 +21
Latrine less than 30 m uphill 4 0 -4
Surface water uphill 46 100 +54
Diversion ditch faulty 79 100 +21
Other pollution uphill 46 83 +37
Table 5.6. Percent frequency
of reporting from an
assessment of springs in a
town in south-west Uganda

● <1FC/100ml – often used as a national
standard and indicating very low
contamination;
● ≤10FC/100ml – a relaxation suggested by
WHO in 1993 as being acceptable in
untreated supplies.
To assess the importance of each risk, use the
data collected from a number of samples and then
categorise them into those that meet the water
quality objective and those that failed the water
quality objective. Record the total number of
samples in each category. Count the number of
times each individual risk factor was reported
from sample sites where the water quality met the
objective and then the number of times each risk
factor was reported at samples sites where the
water quality exceeded the objective target. Using
the total number of samples in the category,
calculate the percent of samples in each category
when the risk factor was reported to be present.
If the frequency of reporting of a particular
risk is higher for samples that exceed the water
quality objective than for those that meet the
objective, this is evidence of a positive association
between the risk factor and water quality. This
indicates that water quality is likely to be worse
when the risk factor is present. The size of the
difference between the two groups of samples is
likely to reflect the strength of the association.
If the frequency of reporting for the risk is the
same between the two groups, or lower for the
group which exceeds the water quality objective,
it is unlikely that there is a strong positive
association between the risk factor and water
quality. However, the factor may contribute to
overall poor management or be associated with
the formation of other risk factors.
Table 5.6 illustrates the results of analysis of
sanitary risk and microbiological data from a town
in Uganda where the primary interest is to identify
the factors that appear to be most associated with
increasing contamination of protected springs. In
this case, a water quality objective of 10 FC/100ml
was selected as being a reasonable target to meet,
based on wet season assessment data.
The data were based on a wet season sampling
round of the springs. Contamination here appears
to be most associated with increasing presence of
surface water uphill of the spring (+54%), eroded
backfill area (+38%) and other pollution uphill
(+37%). Several other factors also show a marked
increase in reporting, such as faulty diversion
ditch (+21%) and animal access (+21%). The
Ongo ing a s s e s sment o f r i s k s th rough mon i to r i ng 73
Risk factor Town A – frequency Town B - frequency≤1FC/100ml >1FC/100ml Diff % ≤1 FC/100ml >1FC/100ml Diff%
Latrine <10m 40 56 +16 12 41 +29Latrine uphill 0 59 +59 18 45 +27
Other pollution <10m 40 41 +1 13 41 +28
Ponding <2m 20 26 +6 19 23 +4
Drainage cracked/blocked/dirty 20 6 -14 68 0 -68
Fence missing/faulty 80 88 +8 93 86 -7
Apron <1m 0 0 0 2 0 -2
Water collects on apron 20 21 +1 14 18 +4
Apron cracked/damaged 20 12 -8 19 9 -10
Handpump loose 0 6 +6 1 0 -1
Table 5.7. Percent frequency
of reporting of sanitary risk
factors against water quality
categories from boreholes in
two towns in Uganda
other factors seem less strongly associated with
increasing contamination and latrines presence
appears to have no impact on contamination as
the relationship is negative (-4%).
We can conclude that when there is
contamination of springs in this town, the
principal problems relate to the presence of the
factors that show the greatest increase in
reporting. Therefore to prevent contamination in
this case, it would be important to ensure that the
environment uphill of the spring is kept clean,
that surface water is drained away from the spring
and that the erosion of backfill is prevented and
diversion ditches are maintained.
A second example from Uganda that identifies
latrines as a likely cause of contamination, is given
in Table 5.7. Here the water quality objective is 1
FC/100 ml based on long-term monitoring as part
of a routine surveillance programme.
These data show that latrines appear to exert
the most important influence on water quality
failure in boreholes in both towns. In the case of
Town A, this is clearly due to the presence of a
latrine uphill. In Town B, there are three factors
that seem to have a similar influence: the influence
of a latrine within 10m (+29%), the presence of
latrine uphill (+27%) and the presence of other
pollution within 10m (+28%). The other factors
appear to have much weaker associations with
contamination and we would probably not carry
out further statistical analysis on this data as firm
conclusions about the importance of latrine
hazards is obvious.
The above methods of assessing the risks of
localised contamination provide a simple
framework for assessment. Where possible, some
statistical analysis is usually advisable in order to
test the associations between risks and
contamination and between different risk factors.
This could include tests of association such as chi-
squared tests; or more sophisticated techniques
such as logistic regression.
In general, in environments with a greater
number of contaminated supplies and where there
may be a greater degree of interaction between
different risks, the use of statistical analysis is
strongly recommended. This would be likely to be
more important in urban as opposed to rural
environments. However, where this is not
possible, simple evaluation of frequencies may
provide all the information required. The flow-
chart in Figure 5.3 summarises the decision-
making process and is an aid to identifying the
appropriate response.
5.6 Follow-up actionFor monitoring to be of any use, some follow-
up action is necessary once the data has been
analysed. Where the monitoring results are
favourable, this should be forwarded to those
planning water supply and sanitation schemes to
provide confidence/assurance on the design and
construction. Clearly, if evidence emerges of
contamination and risks, action should be taken.
This may require action in areas with existing
facilities and in the planning of new water and
sanitation programmes.
The specific cause of the contamination needs
to be identified and recommendations for
modification of the design or construction of the
water supply (or of the on-site sanitation system)
made. Where widespread contamination has been
identified and it is clear that modifications to the
design and construction are necessary, then
follow-up monitoring is required to confirm an
improvement in water quality. The results of this
‘follow-up’ monitoring data will also need to be
fed back to those planning water supply schemes.
Attention must still be paid to ensuring that the
sanitary protection measures around water
supplies are maintained.
Where monitoring has identified that
GUIDEL INES FOR ASSESS ING THE R ISK TO GROUNDWATER FROM ON-S I TE SANITAT ION74

Ongo ing a s s e s sment o f r i s k s th rough mon i to r i ng 75
contamination is localised it is necessary to assess
which factors are most important in causing the
contamination and recommendations made
regarding improvements required. Where latrine
proximity or siting is a major risk then attempts
must be made to either improve designs to reduce
the potential for contamination (for instance
drilling to greater depths) or to improve latrine
design. The addition of treatment at the supply or
in the home may also be required. Where the
impact of latrines is likely to be highly significant
and no alternative to sanitation arrangements is
feasible, then an alternative water supply should be
considered. Where the localised contamination can
be linked with the maintenance of the wellhead or
activities allowed within the vicinity of the
wellhead, this information should be reported to
the users of the supply and to those responsible for
operation and maintenance (if appropriate). This
information may also provide useful feedback into
the design of the headworks and sanitary
protection measures.
5.7 Community participation in monitoringIt is now widely accepted that communities
must be actively involved in the planning, design
and management of water supplies and sanitation.
In order to sustain water and sanitation systems,
community participation and management is
essential. In addition to the role in managing water
and sanitation, communities can be actively
involved in monitoring of their water supply. In
many ways, ensuring that communities can
operate and maintain their water supply is in part
dependent upon their ability to monitor their
supply.
Most communities already informally monitor
their water supply through observations about
colour, taste and odour. This information can be
very useful when water supplies are being
monitored by local Government, NGOs or other
organisations. Very often, major problems (for
instance colour changes after heavy rainfall) are
only detected by the regular users of the supply
unless sampling is undertaken immediately after
such a rainfall event.
It is unlikely that in many cases communities
will be able to undertake water quality analysis.
The equipment required is in most cases too
expensive for communities to sustain and it may
be difficult to find adequately trained people
within a community. Some projects have
developed ‘community water testing kits’.
However, in most cases, these kits test for total
coliforms and therefore they have limited value in
water supplies that are not chlorinated. As
discussed in Chapter 2, the majority of the total
coliform bacteria are derived from environmental
sources and do not represent a risk of faecal
contamination.
Although communities may not be able to
undertake water quality testing themselves, they
still have an important role. Community members,
as the users of the water supply, have a right to
know the quality of their water and should be
supported in demanding that water supplies are
periodically tested and that they are informed of
the results. The results of the testing should be
provided to communities in a format that is
understandable and which provides them with
information on actions they can take to improve
their water supply and water quality. This may be
achieved through community meetings or by
providing reports to community leaders. For more
information, please consult the manuals on water
surveillance at: www.lboro.ac.uk/watermark.
Communities can undertake sanitary
inspections and they should be encouraged to
perform these on a regular basis. The sanitary
inspection forms shown in Appendix C can also
be provided in a pictorial form. Inspection forms
have been developed that are more closely linked

GUIDEL INES FOR ASSESS ING THE R ISK TO GROUNDWATER FROM ON-S I TE SANITAT ION76
to actions required and these may be found at the
web site noted above. It is important that
community sanitary inspections are always closely
linked to actions to be taken, to ensure the water
supply remains at low risk, as otherwise they
become less useful and relevant to communities.
However, community members will require
training in the use of sanitary inspection forms,
how the information should be interpreted and
how actions can be identified from the form. Such
training should focus on identifying factors that
both the community and the monitoring agency
recognise as being important. There is little point
in trying to force communities to monitor risks
unless they understand and accept that they are a
problem. It is important for instance that the
community understands the need to ensure that
when lateral separation distances have been
defined for a water supply that these are
maintained and encroachment is not allowed. The
trainer therefore should ensure that they allocate
enough time to ensure that these issues can be
fully discussed and explained.
Whenever communities undertake monitoring
they should have access to field staff who
undertake monitoring of water supplies so that
they can seek clarifications or explanations when
problems arise. This may form part of a larger
community development or hygiene education
programme.
Summary of key points from Chapter 5● Monitoring is an important and integral part of any water supply and sanitation programme and is an
essential component of the risk assessment process.
● Monitoring is required to:
- provide confidence in design;
- establish cause of contamination, wherever contamination is observed;
- ensure supply meets drinking water standards;
- observe water quality trends with time.
● Monitoring includes not only the determination of microbiological and chemical quality of the water
(principally faecal indicators and nitrate) but also inspection of the sanitary condition of the water supply and
the associated headworks.
● Monitoring is not just about collecting data but also interpreting the data and acting upon the results.
Follow-up actions may include:
- send results to design team to confirm acceptability of design criteria;
- modify/improve design/maintenance;
- install new water supplies or install domestic treatment.
● For the long-term sustainability of water supply and sanitation schemes, community participation in
monitoring is important. This participation may include: the community undertaking sanitary inspections of
the water supply headworks and immediate area; and informing the community of the results and
interpretation of water quality monitoring data. Provision of information allows the community to make
informed decisions on the future design and siting of water supplies and sanitation.

Ongo ing a s s e s sment o f r i s k s th rough mon i to r i ng 77
Figure 5.3. Flow chart for
identifying the appropriate
response to localised
contamination of
groundwater supplies
Does assessment indicatelocalised risk of contamination?
Does latrine proximity and sitingimpact appear to be significant?
Does latrine influence result fromdistance between supply and
latrine?
Does latrine influence result fromlocation (e.g. uphill of the
supply)?
Base decisions on potential forwidespread aquifer contamination
and ensure sanitary protectionmeasures properly maintained
Focus on ensuring that sanitaryprotection measures are well
maintained or designs improved
New areas:
– ensure minimum distancemaintained
– improve latrine design toreduce microbiologicalcontamination
Existing facilities:
– change water supply
– upgrade water supply toimprove protection
– add treatment step (either atsupply or in home)
New areas:
– try and locate latrines downhillof supply
– improve latrine design
– improve source design toreduce contamination
– select alternative water supply
Existing areas:
– select alternative water supply
– upgrade/rehabilitate supply toreduce contamination
– add treatment at supply or athome
Y
Y
N
N
N
Y
Y
Y
Y

A guide to the development of on-site sanitationFranceys R, Pickford J and Reed R, 1992. World Health Organization, Geneva.
Assessing risk to groundwater from on-site sanitation: scientific review and case studies.ARGOSS in preparation.
Better sanitation programming: a UNICEF handbookUNICEF, 1997. EHP Applied Study No 5. Joint publication of UNICEF’s Water, Environment and Sanitation Clusterand USAID’s Environmental Health Project.
Ecological alternatives in sanitationDrangert J-O, Bew J and Winblad U (Eds), 1997. Proceedings from Sida Sanitation Workshop, Balingsholm, Sweden 6-9August. Publications on water resources No 9, Department for Natural Resources and the Environment, SwedishInternational Development Cooperation Agency.
Effect of effluent quality and temperature on the persistence of viruses in soil.Blanc, R and Nasser, A, 1996. Water Science and Technology, 33 (10-11): 237-242.
Effects of improved water supply and sanitation on ascariasis, diarrhoea, dracunculiasis, hookworm infection,schistosomiasis, and trachomaEsrey, S A, Potash, J B, Roberts, L and Shiff, C, 1991. Bulletin of the World Health Organization, 69(5): 609-621.
Effective monitoring of small drinking water supplies.Bartram J 1999. IN: Cotruvo JA, Craun GF and Hearne N. Providing safe drinking water in small systems: technology,operations and economics. Lewis Publishers, Washington DC, USA.
Environmental health engineering in the tropics: an introductory text (2nd edition).Cairncross S and Feachem F, 1993. John Wiley, Chichester, England.
Field HydrogeologyBrassington R, 1988. John Wiley, London, England.
Groundwater: a threatened resource.UNEP, 1996. United Nations Environment Programme Environment Library No 15, Nairobi, UNEP.
Guidelines for drinking-water quality, Volume 1 RecommendationsWHO, 1993. WHO, Geneva (2nd edition).
Guidelines for drinking water quality, Volume 3: Surveillance and control of community suppliesWHO, 1997. WHO, Geneva (2nd edition).
Hepatitis viruses in water: Update on risk and controlGrabow WOK, 1997. Water SA, 23 (4): 379-38
Introducing GroundwaterPrice M, 1985. George Allen & Unwin (publishers) Ltd., London, England.
Land-surface zoning for groundwater protection.Adams, B and Foster SSD, 1992. Journal of the Institution of Water and Environmental Management. 6: 312-320.
Low-cost urban sanitationMara D, 1996. John Wiley, Chichester, England.
GUIDEL INES FOR ASSESS ING THE R ISK TO GROUNDWATER FROM ON-S I TE SANITAT ION78
References and further reading

MS-2 and poliovirus transport in porous media: hydrophobic effects and chemical perturbations.Bales, RC, Li, S, Maguire, KM, Yahya, MT and Gerba, CP, 1993. Water Resources Research, 29 (4): 957-963.
Microbial pollutants: their survival and transport pattern to groundwaterGerba CP and Bitton G, 1984. In Britton, B and Gerba, CP Groundwater pollution microbiology, John Wiley, New York,pp 65-88.
Microbiological asepcts of groundwater pollution due to septic tanksHagedon C, 1984. In Britton, B and Gerba, CP Groundwater pollution microbiology, John Wiley, New York, pp 181-196.
Microbiological safety of drinking water: United States and global perspectivesFord T E, 1999. Environmental Health Perspectives, 107 (S1): 191-206.
Modeling the risk from Giardia and viruses in drinking waterRegli S, Rose JB, Haas CN and Gerba CP, 1991. Journal of the American Water Works Association, 83 (11): 76-84.
On-site sanitation and groundwater qualityWaterlines, 1999. Vol 17, No 4, April.
Pit latrine effluent infiltration into groundwater: the Epworth studyChidavaenzi M, Bradley M, Jere M and Nhandara C, 2000. In Chorus et al, Water, sanitation and health, IWA, London,pp 171-177.
Protecting groundwater for health: a guide to managing drinking water sourcesWHO in preparation.
Risk of groundwater pollution by on-site sanitation in developing countries: a literature reviewLewis W J, Foster SSD and Drasar BS, 1980. IRCWD Report No 01/82.
Small community water suppliesHofkes (Ed), 1983. John Wiley, Chichester, England.
The seasonality of bacterial quality of water in a tropical developing country (Sierra Leone)Wright RC. 1986. Journal of Hygiene, Cambridge, 96(1):75-82.
Transport behaviour of groundwater protozoa and protozoan-sized microspheres in sandy aquifer systemsHarvey RW, Kinner NE, Bunn A, McDonald D and Metge D, 1995.. Applied Environmental Microbiology, 61 (1):2090217.
Tropical source waterHazen TC and Toranzos GA, 1990. In Drinking water microbiology: Progress and recent developments, Springer-Verlag,New York.
Virus interactions and survival in soilsSobsey, MD, Dean, CH, Knuckles, ME and Wagner, RA, 1980. Applied Environmental Microbiology, 40: 92-101.
Water quality monitoring: a practical guide to the design and implementation of freshwater quality studies andmonitoring programmes.Bartram J and Ballance R (eds) 1996. E&F Spon, London, UK.
Waterborne diseases – update on water-quality assessment and controlGrabow, W O K. 1996. Water SA, 22(2): 193-202.
Re fe r ence s and f u r the r r e ad ing 79

a process whereby micro-organisms or chemicals become attached toparticles in the sub-surface and are thus effectively removed from waterin the soil. The process is dependent on the charge on the organism orchemical and on the minerals, and the pH of the water
an environment that is deficient in oxygen; bacteria then utilize otherchemicals such as nitrates for their metabolic needs
a saturated permeable geological unit that can yield economic quantitiesof water to wells and springs
the potential for an aquifer to be affected by an imposed contaminantload. The greater the travel time for water to move from the groundsurface to the aquifer, the greater the opportunity for attenuation and thelower the risk to the aquifer
processes in the subsurface such as adsorption, filtration which removeor reduce contaminant concentrations
material used to build-up and protect the area between the eye of aspring and the spring-box
ancient crystalline rocks with little or no primary porosity, that havesubsequently undergone weathering and fracturing which render themcapable of storing and transmitting groundwater
widely accepted as the best method or approach
wastewater containing faeces
concrete rings sunk below the water-table in dug wells designed toprovide water security while digging
cement placed between the casing of a well or borehole and thesurrounding ground from the surface down to a pre-determined depth,to secure the casing in place and prevent localised contamination of theborehole
a very fine-grained material (less than 0.002mm in diameter) which isplastic when wet. It has high porosity (~40%) but as the pores are notwell-connected has low permeability
sediment that has undergone burial and has become compact and hardover time
the movement of contaminants through the subsurface
natural processes or man’s activities that, lead to degradation of naturalwater quality
the risk of a source of contamination causing a groundwater supply tobecome contaminated by movement from source to supply along anatural or man-made pathway
ancient non-sedimentary rock underlying younger sedimentary rock
membrane enclosing an organism in a resting stage
release of adsorbed contaminants from adsorption sites and re-introduction into the groundwater
ditch dug at the headworks of a groundwater supply to divert run-off
GUIDEL INES FOR ASSESS ING THE R ISK TO GROUNDWATER FROM ON-S I TE SANITAT ION80
Glossary
adsorption
anaerobic
aquifer
aquifer pollution vulnerability
attenuation
backfill
bedrock aquifers
best-practice
black water
caissons
cement seal
clay
onsolidated sediment
contaminant migration
contamination
contamination risk
crystalline basement
cyst
desorption
diversion ditch

widely used faecal indicator bacteria
studies of disease patterns in communities
bacteria found in large numbers in the faeces of humans and other warm-blooded animals, including E.Coli
animal (including human) excrement
route that permits faecal material to pass into the mouth, e.g. eating faecallycontaminated food, drinking faecal matter in water
narrow cracks in hard rock
geological material that has undergone deformation to produce cracks in therock which store and transmit water
a class of sediment the particles of which are between 2 and 60 mm indiameter
domestic wastewater not containing excreta, for instance bath and laundrywater. Also called sullage
the extension of the lining of dug wells above the ground surface
surface protection system constructed above groundwater supplies to preventcontamination while providing access by means of a handpump (wells andboreholes) or supply pipe (springs)
worms existing in man as free-living or parasitic forms
human faeces and urine
the amount of liquid contaminant entering the subsurface from a sanitationsystem over a given period of time
the process by which groundwater containing a contaminant mixes with andis diluted by uncontaminated groundwater as it moves through the aquifer
aquifer type and environment within which it was formed
the study of water within the earth’s crust, including its physics, chemistryand environmental relationships
the continuous circulation of water from the atmosphere to land and oceansby rainfall or snow and back to the atmosphere by evaporation and bytranspiration by plants
bacteria that normally live in the intestinal tract of man and other warm-blooded animals without necessarily causing disease. They are always andnaturally present in faeces in large necessarily numbers, and their presence indrinking water indicates faecal contamination
carbonate sedimentary rocks that have undergone dissolution due to flowing groundwater producing enlarged fractures
movement of soil particles, chemicals and micro-organisms as waterpercolates through a permeable medium
rock classification based on macroscopic features such as grain size andtexture
G lo s sa r y 81
E.coli (Escherichia coli)
epidemiological studies
faecal coliforms
faecal matter
faecal-oral route
fissures
fractured aquifer
gravel
grey water
headwall
headworks
helminths
human wastes
hydraulic load
hydrodynamic dispersion
hydrogeological environment
hydrogeology
hydrological cycle
indicator bacteria (faecal)
karst limestones
Leaching
lithology

GUIDEL INES FOR ASSESS ING THE R ISK TO GROUNDWATER FROM ON-S I TE SANITAT ION82
Glossary cont...
contamination that occurs via pathways resulting from the design orconstruction of a groundwater supply, or its deterioration with time
a disease in young infants associated with the consumption of water withhigh nitrate concentrations. Nitrate in the saliva and stomach is reduced tonitrite, which then binds with haemoglobin, preventing the latter frombinding with oxygen as it should
microscopic organisms
the periodic sampling and determination of chemical and microbiologicalquality of a water supply, and survey of the sanitary conditions of thesupply and its immediate environs. It aims to ensure that water quality is fitfor consumption and to identify any sources of contamination
systems in which the wastes produced within sanitation facilities are storedat the point of disposal where they undergo some degree of decomposition.They require periodic emptying or the construction of new facilities oncethey fill up
the use and care of a facility in a way that ensures it provides continued andsatisfactory service. This includes having procedures in place for its correctuse, and carrying out breakdown and preventative maintenance
microscopic organisms that cause disease
routes by which contaminants reach a receptor (e.g. a groundwater supply)from a source (e.g. a pit latrine)
the ability of a rock, sediment or soil to permit fluid to flow through it
a measure of the acidity or alkalinity of a solution. It is numerically equal to7 for neutral solutions, increasing with increasing alkalinity and decreasingwith increasing acidity
the simplest sanitation system in which excreta fall into a hole in the ground
pollution originating from a point (or small area), resulting in localisedimpact on the aquifer
the introduction of chemical and microbiological substances into thesubsurface at concentration levels that restrict the potential use ofgroundwater
the total of all pore spaces in a rock. The proportion of the rock thatconsists of pores that are interconnected and can thus transmit fluids is theeffective porosity
micro-organisms that feed on others
the porosity that represents the original pore openings present when a rockor sediment formed
the lowest and simplest of animals, existing as single cell forms or colonies.Many live in the intestinal tract of man and other animals and faecalprotozoa may infect humans causing diseases such as diarrhoea anddysentry
the water that moves downward from the soil to the water-table in a givenperiod of time
localised contamination
methaemoglobinaemia/infantile cyanosis
microbes
monitoring
on-site sanitation systems
operation and maintenance
pathogenic micro-organisms
pathways
permeability
pH
pit latrine
point source pollution
pollution
porosity
predatory micro-organisms
primary porosity
protozoa
recharge
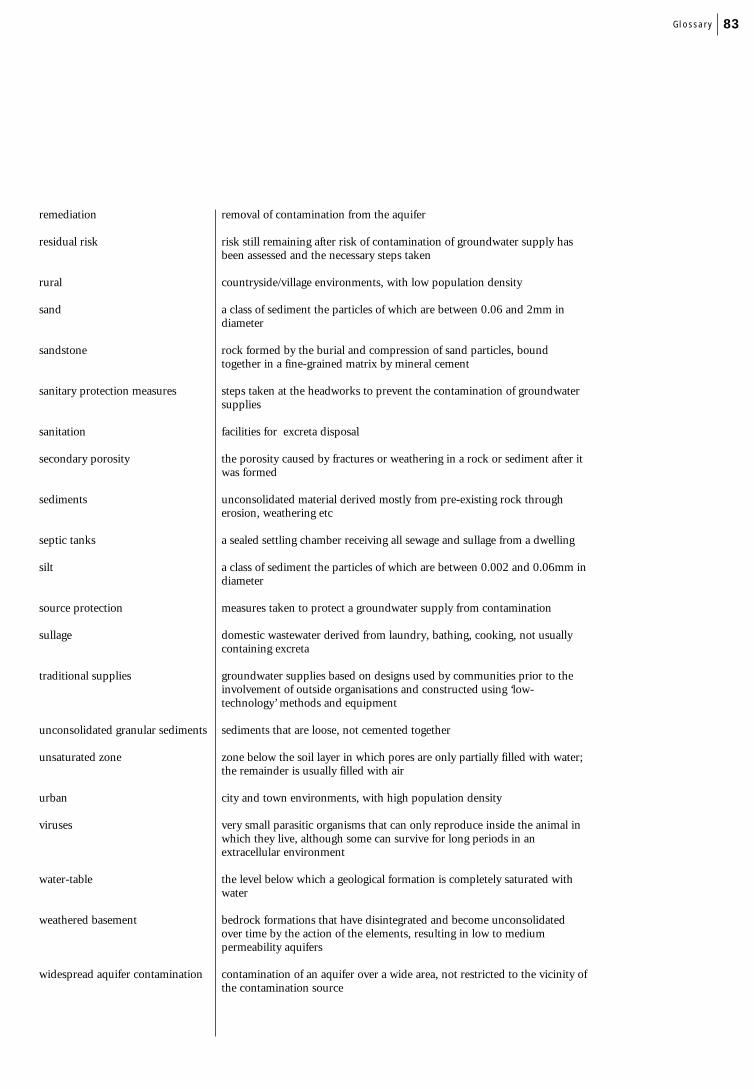
G lo s sa r y 83
removal of contamination from the aquifer
risk still remaining after risk of contamination of groundwater supply hasbeen assessed and the necessary steps taken
countryside/village environments, with low population density
a class of sediment the particles of which are between 0.06 and 2mm indiameter
rock formed by the burial and compression of sand particles, boundtogether in a fine-grained matrix by mineral cement
steps taken at the headworks to prevent the contamination of groundwatersupplies
facilities for excreta disposal
the porosity caused by fractures or weathering in a rock or sediment after itwas formed
unconsolidated material derived mostly from pre-existing rock througherosion, weathering etc
a sealed settling chamber receiving all sewage and sullage from a dwelling
a class of sediment the particles of which are between 0.002 and 0.06mm indiameter
measures taken to protect a groundwater supply from contamination
domestic wastewater derived from laundry, bathing, cooking, not usuallycontaining excreta
groundwater supplies based on designs used by communities prior to theinvolvement of outside organisations and constructed using ‘low-technology’ methods and equipment
sediments that are loose, not cemented together
zone below the soil layer in which pores are only partially filled with water;the remainder is usually filled with air
city and town environments, with high population density
very small parasitic organisms that can only reproduce inside the animal inwhich they live, although some can survive for long periods in anextracellular environment
the level below which a geological formation is completely saturated withwater
bedrock formations that have disintegrated and become unconsolidatedover time by the action of the elements, resulting in low to mediumpermeability aquifers
contamination of an aquifer over a wide area, not restricted to the vicinity ofthe contamination source
remediation
residual risk
rural
sand
sandstone
sanitary protection measures
sanitation
secondary porosity
sediments
septic tanks
silt
source protection
sullage
traditional supplies
unconsolidated granular sediments
unsaturated zone
urban
viruses
water-table
weathered basement
widespread aquifer contamination
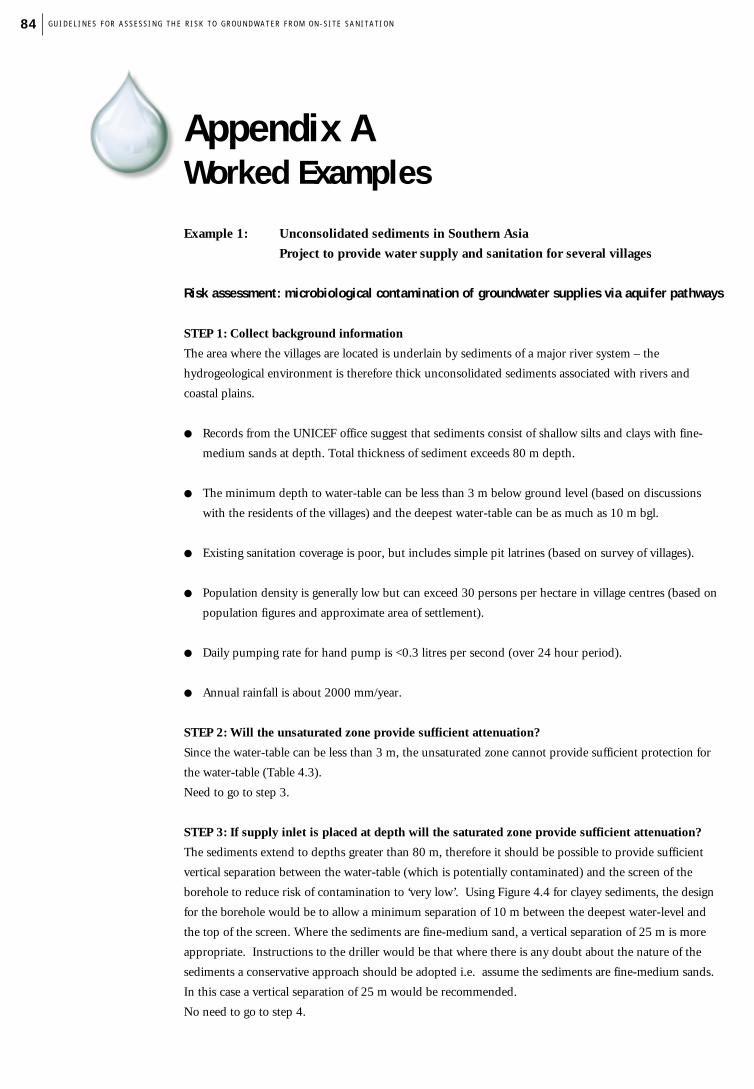
Example 1: Unconsolidated sediments in Southern Asia
Project to provide water supply and sanitation for several villages
Risk assessment: microbiological contamination of groundwater supplies via aquifer pathways
STEP 1: Collect background information
The area where the villages are located is underlain by sediments of a major river system – the
hydrogeological environment is therefore thick unconsolidated sediments associated with rivers and
coastal plains.
● Records from the UNICEF office suggest that sediments consist of shallow silts and clays with fine-
medium sands at depth. Total thickness of sediment exceeds 80 m depth.
● The minimum depth to water-table can be less than 3 m below ground level (based on discussions
with the residents of the villages) and the deepest water-table can be as much as 10 m bgl.
● Existing sanitation coverage is poor, but includes simple pit latrines (based on survey of villages).
● Population density is generally low but can exceed 30 persons per hectare in village centres (based on
population figures and approximate area of settlement).
● Daily pumping rate for hand pump is <0.3 litres per second (over 24 hour period).
● Annual rainfall is about 2000 mm/year.
STEP 2: Will the unsaturated zone provide sufficient attenuation?
Since the water-table can be less than 3 m, the unsaturated zone cannot provide sufficient protection for
the water-table (Table 4.3).
Need to go to step 3.
STEP 3: If supply inlet is placed at depth will the saturated zone provide sufficient attenuation?
The sediments extend to depths greater than 80 m, therefore it should be possible to provide sufficient
vertical separation between the water-table (which is potentially contaminated) and the screen of the
borehole to reduce risk of contamination to ‘very low’. Using Figure 4.4 for clayey sediments, the design
for the borehole would be to allow a minimum separation of 10 m between the deepest water-level and
the top of the screen. Where the sediments are fine-medium sand, a vertical separation of 25 m is more
appropriate. Instructions to the driller would be that where there is any doubt about the nature of the
sediments a conservative approach should be adopted i.e. assume the sediments are fine-medium sands.
In this case a vertical separation of 25 m would be recommended.
No need to go to step 4.
GUIDEL INES FOR ASSESS ING THE R ISK TO GROUNDWATER FROM ON-S I TE SANITAT ION84
Appendix AWorked Examples
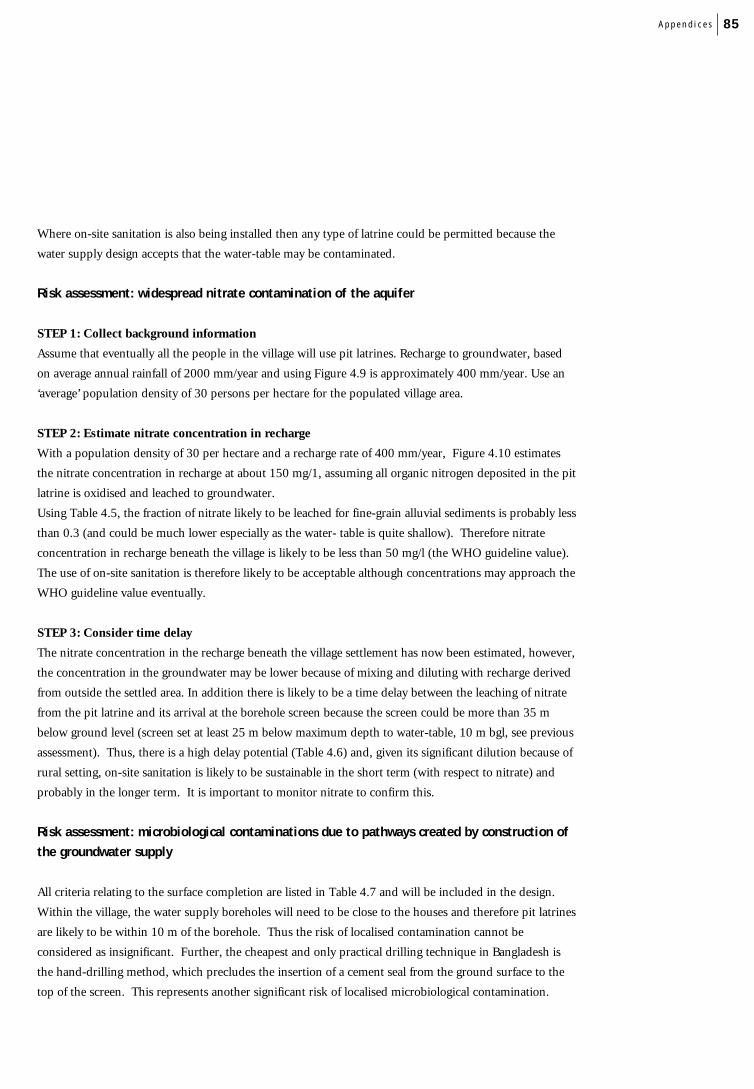
Where on-site sanitation is also being installed then any type of latrine could be permitted because the
water supply design accepts that the water-table may be contaminated.
Risk assessment: widespread nitrate contamination of the aquifer
STEP 1: Collect background information
Assume that eventually all the people in the village will use pit latrines. Recharge to groundwater, based
on average annual rainfall of 2000 mm/year and using Figure 4.9 is approximately 400 mm/year. Use an
‘average’ population density of 30 persons per hectare for the populated village area.
STEP 2: Estimate nitrate concentration in recharge
With a population density of 30 per hectare and a recharge rate of 400 mm/year, Figure 4.10 estimates
the nitrate concentration in recharge at about 150 mg/1, assuming all organic nitrogen deposited in the pit
latrine is oxidised and leached to groundwater.
Using Table 4.5, the fraction of nitrate likely to be leached for fine-grain alluvial sediments is probably less
than 0.3 (and could be much lower especially as the water- table is quite shallow). Therefore nitrate
concentration in recharge beneath the village is likely to be less than 50 mg/l (the WHO guideline value).
The use of on-site sanitation is therefore likely to be acceptable although concentrations may approach the
WHO guideline value eventually.
STEP 3: Consider time delay
The nitrate concentration in the recharge beneath the village settlement has now been estimated, however,
the concentration in the groundwater may be lower because of mixing and diluting with recharge derived
from outside the settled area. In addition there is likely to be a time delay between the leaching of nitrate
from the pit latrine and its arrival at the borehole screen because the screen could be more than 35 m
below ground level (screen set at least 25 m below maximum depth to water-table, 10 m bgl, see previous
assessment). Thus, there is a high delay potential (Table 4.6) and, given its significant dilution because of
rural setting, on-site sanitation is likely to be sustainable in the short term (with respect to nitrate) and
probably in the longer term. It is important to monitor nitrate to confirm this.
Risk assessment: microbiological contaminations due to pathways created by construction ofthe groundwater supply
All criteria relating to the surface completion are listed in Table 4.7 and will be included in the design.
Within the village, the water supply boreholes will need to be close to the houses and therefore pit latrines
are likely to be within 10 m of the borehole. Thus the risk of localised contamination cannot be
considered as insignificant. Further, the cheapest and only practical drilling technique in Bangladesh is
the hand-drilling method, which precludes the insertion of a cement seal from the ground surface to the
top of the screen. This represents another significant risk of localised microbiological contamination.
85Append i ce s
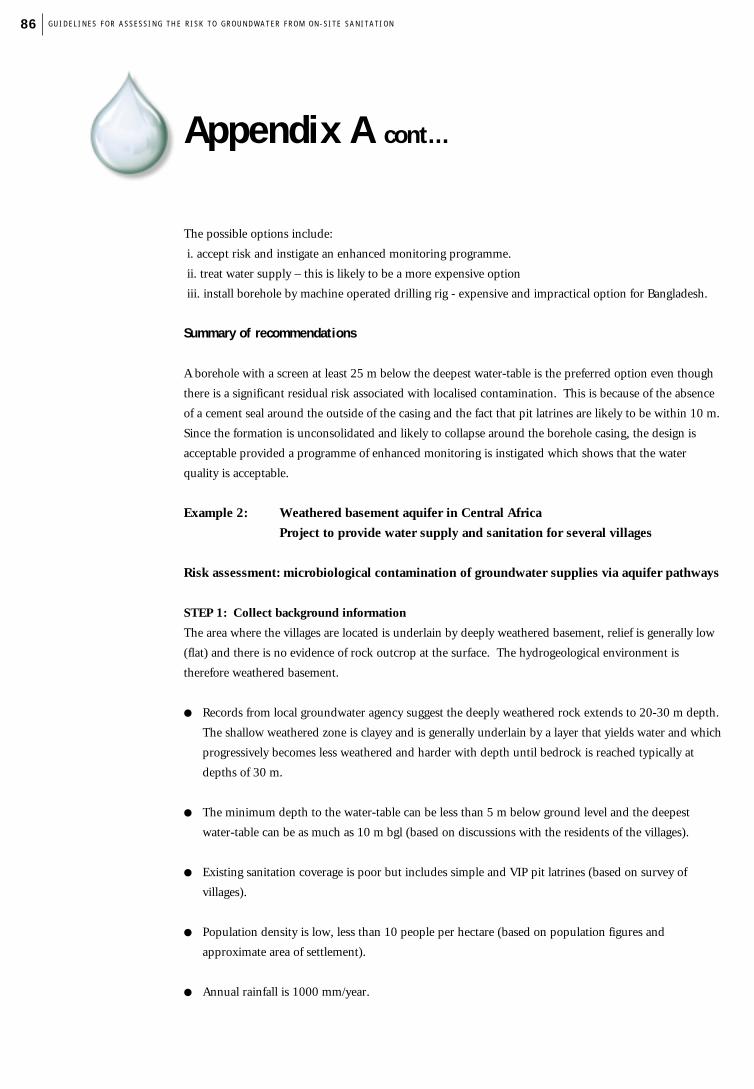
GUIDEL INES FOR ASSESS ING THE R ISK TO GROUNDWATER FROM ON-S I TE SANITAT ION86
The possible options include:
i. accept risk and instigate an enhanced monitoring programme.
ii. treat water supply – this is likely to be a more expensive option
iii. install borehole by machine operated drilling rig - expensive and impractical option for Bangladesh.
Summary of recommendations
A borehole with a screen at least 25 m below the deepest water-table is the preferred option even though
there is a significant residual risk associated with localised contamination. This is because of the absence
of a cement seal around the outside of the casing and the fact that pit latrines are likely to be within 10 m.
Since the formation is unconsolidated and likely to collapse around the borehole casing, the design is
acceptable provided a programme of enhanced monitoring is instigated which shows that the water
quality is acceptable.
Example 2: Weathered basement aquifer in Central Africa
Project to provide water supply and sanitation for several villages
Risk assessment: microbiological contamination of groundwater supplies via aquifer pathways
STEP 1: Collect background information
The area where the villages are located is underlain by deeply weathered basement, relief is generally low
(flat) and there is no evidence of rock outcrop at the surface. The hydrogeological environment is
therefore weathered basement.
● Records from local groundwater agency suggest the deeply weathered rock extends to 20-30 m depth.
The shallow weathered zone is clayey and is generally underlain by a layer that yields water and which
progressively becomes less weathered and harder with depth until bedrock is reached typically at
depths of 30 m.
● The minimum depth to the water-table can be less than 5 m below ground level and the deepest
water-table can be as much as 10 m bgl (based on discussions with the residents of the villages).
● Existing sanitation coverage is poor but includes simple and VIP pit latrines (based on survey of
villages).
● Population density is low, less than 10 people per hectare (based on population figures and
approximate area of settlement).
● Annual rainfall is 1000 mm/year.
Appendix A cont...

Append i ce s 87
STEP 2: Will the unsaturated zone provide sufficient attenuation?
Since the water-table can be less than 5 m the unsaturated zone cannot provide protection for the water-
table (Table 4.3)
Need to go to Step 3.
STEP 3: If supply inlet is placed at depth will the saturated zone provide sufficient attenuation?
It is not possible to say with certainty that the lining of a dug well is sufficient to avoid the ingress of
contaminants at the water-table. Therefore if the supply type is dug well go to Step 4.
The deeply weathered layer extends to depths greater than 20 m therefore it should be possible to provide
sufficient vertical separation between the water-table (which is potentially contaminated) and the screen of
the borehole to reduce risk of contamination to ‘very low’. Using Figure 4.5, for ‘basement with clayey
weathered layer’, the borehole design should allow a minimum separation of 10 m between the deepest
water-level and the top of the less weathered, and more permeable, layer. If there is less than 10 m of the
saturated deeply weathered clayey layer then it is necessary to go to Step 4.
STEP 4: What is the lateral separation such that the saturated zone will provide sufficient
attenuation?
Where the deeply weathered clayey layer is insufficiently thick to reduce the risk that pathogens maymigrate downwards to the borehole screen to ‘low’ or ‘very low’, then it will be necessary to consider
whether it is possible to provide sufficient horizontal separation between the water supply and the pit
latrine. (The water supply may be either a borehole or a dug well.)
Using Table 4.4 and based on a rock type of ‘weathered basement (not fractured)’ the required separation
is several metres. However, to reduce the likelihood of localised contamination (see later) a nominal
horizontal separation of 10 m is recommended.
(Note: if the well or borehole was dug or drilled into the more permeable layer then the 10 m separation
may not be sufficient to attenuate all pathogens. However, some attenuation of pathogens will occur
between the base of the pit latrine and the water-table and further attenuation occurs during migration
through the saturated weathered zone to the more permeable layer. Thus in all likelihood the 10 m lateral
separation should provide sufficient additional attenuation, even so, monitoring of water quality would be
recommended. Of course, if the deeply weathered layer had been much thinner, for example less than 10
m, then the risk would be significant.)
Where on-site sanitation is also being installed then any type of latrine could be permitted because the
water supply design accepts that the water-table may be contaminated. However, where the deeply
weathered clayey layer is insufficient to provide sufficient attenuation with depth in the saturated zone
then it is probably advisable to select dry-type sanitation systems. This is because this will provide greater
attenuation in the unsaturated zone.

GUIDEL INES FOR ASSESS ING THE R ISK TO GROUNDWATER FROM ON-S I TE SANITAT ION88
Risk assessment: widespread nitrate contamination of the aquifer
STEP 1: Collect background information
Assume that eventually all the people in the village will use pit latrines. Recharge to groundwater, based
on average annual rainfall of 1000 mm/a and using Figure 4.9 is approximately 150 mm/year. Use an
average population density of 10 persons per hectare for the village area.
STEP 2: Estimate nitrate concentration in recharge
With a population density of 10 per hectare and a recharge rate of 150 mm/year, Figure 4.10 estimates
that nitrate concentration in recharge at about 120 mg/l, assuming all organic nitrogen deposited in the pit
latrine is oxidised and leached to groundwater.
Using Table 4.5, the fraction of nitrate likely to be leached in thick weathered basement is probably less
than 0.3 (and could be much lower). Therefore nitrate concentrations in recharge beneath the village is
likely to be less than 40 mg/l (and thus lower than the WHO guideline value of 50 mg/l). The use of on-
site sanitation is therefore likely to be acceptable.
STEP 3: Consider time delay
Given that the nitrate concentration in recharge is less than the WHO guideline value there is no real need
to consider either the time delay or the dilution with low nitrate from outside of the village. However
(from Table 4.6), moderate delay potential and significant dilution is anticipated.
Risk assessment: microbiological contamination due to pathways created by construction ofthe groundwater supply
All criteria relating to the surface completion are listed in Table 4.7 and will be included in the design.
Given the relatively low density of the village, water supply boreholes can be located to ensure that pit
latrines are located at least 10 m away from the water supply. Further, where boreholes are being
constructed using powered drilling rigs, then a sanitary cement seal behind the casing can be installed.
Likewise, hand dug wells can be constructed so that the upper part of the well lining, from the surface to
the deepest water-table is made impermeable.
In addition to those features included in the design of the borehole and headworks, there is also the need
for regular inspection and effective operation and maintenance.
Appendix A cont...

Append i ce s 89
Summary of recommendations
Where the deeply weathered clayey layer is sufficiently deep that the depth from the top of the intake (or
screen) to the water-table is more than 10 m, then a drilled borehole is recommended. Pit latrines should
be located at least 10 m away to avoid localised contamination problems.
Where the deeply weathered layer is not sufficiently thick to provide more than 10 m saturated thickness,
or where a dug well is the preferred choice of the community, then the water supply will need to be
located at a sufficient horizontal distance from the pit latrine to reduce the risk of pathogens reaching the
water supply. This lateral separation would need to be at least 10 m which is the same separation
required to avoid localised contamination problems.
No special measures to reduce nitrate leaching are required.
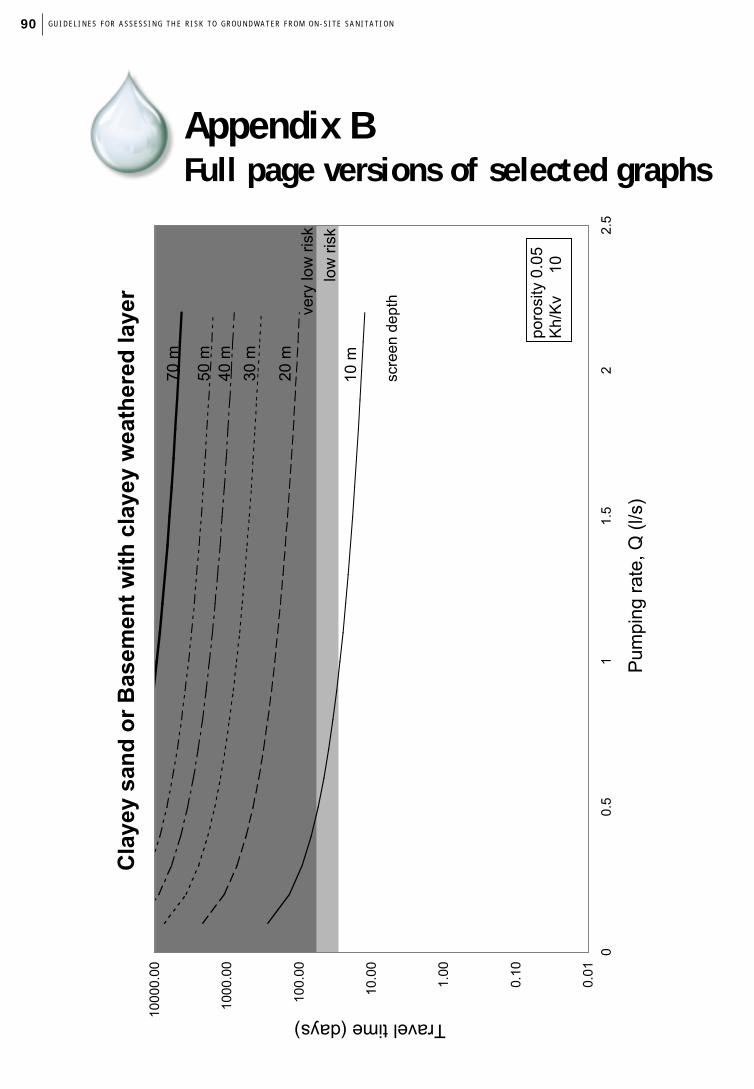
GUIDEL INES FOR ASSESS ING THE R ISK TO GROUNDWATER FROM ON-S I TE SANITAT ION90
Appendix B Full page versions of selected graphs

Append i ce s 91
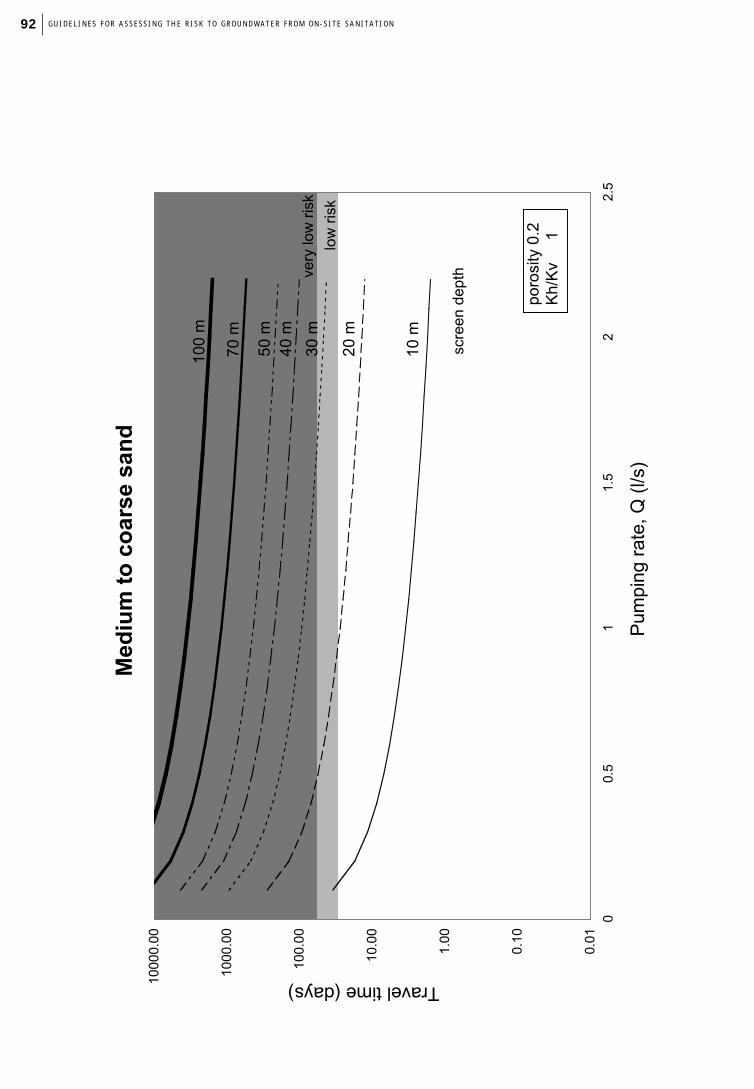
GUIDEL INES FOR ASSESS ING THE R ISK TO GROUNDWATER FROM ON-S I TE SANITAT ION92

Append i ce s 93

I Type of facility BOREHOLE WITH HANDPUMP
1. General Information District:
Parish
Organisation
2. Village/zone:
3. Date of Visit
4. Water sample taken? ……. Sample No. ……… FC/100ml ………..
II Specific diagnostic information for assessment Risk
1. Is there a latrine within ……m of the borehole Y/N(please put in distance calculated from the manual)
2. Is there a latrine uphill of the borehole? Y/N
3. Are there any other sources of pollution within 10m of borehole? Y/N(e.g. animal breeding, cultivation, roads, industry etc)
4 Is the drainage faulty allowing ponding within 2m of the borehole? Y/N
5. Is the drainage channel cracked, broken or need cleaning? Y/N
6. Is the fence missing or faulty Y/N
7. Is the apron less than 1m in radius? Y/N
8. Does spilt water collect in the apron area? Y/N
9. Is the apron cracked or damaged? Y/N
10. Is the handpump loose at the point of attachment to apron? Y/N
Total Score of Risks …./10Risk score: 9-10 = Very high; 6-8 = High; 3-5 = Medium; 0-3 = Low
III Results and recommendations:
The following important points of risk were noted: (list nos. 1-10)
Signature of Inspector:
Comments:
GUIDEL INES FOR ASSESS ING THE R ISK TO GROUNDWATER FROM ON-S I TE SANITAT ION94
Appendix C Sanitary inspection forms

Append i ce s 95
I Type of facility PROTECTED SPRING
1. General Information District:
Parish
Organisation
2. Village/zone:
3. Date of Visit
4. Water sample taken? ……. Sample No. ……… FC/100ml ………..
II Specific diagnostic information for assessment Risk
1. Is the spring unprotected? Y/N
2. Is the masonry protecting the spring faulty? Y/N
3. Is the backfill area behind the retaining wall eroded? Y/N
4. Does spilt water flood the collection area? Y/N
5. Is the fence absent or faulty? Y/N
6. Can animals have access within 10m of the spring? Y/N
7. Is there a latrine uphill and/or within ….m of the spring? Y/N(please put in distance calculated from the manual)
8 Does surface water collect uphill of the spring? Y/N
9. Is the diversion ditch above the spring absent or non-functional? Y/N
10. Are there any other sources of pollution uphill of the spring? Y/N(e.g. solid waste)
Total Score of Risks …./10Risk score: 9-10 = Very high; 6-8 = High; 3-5 = Medium; 0-3 = Low
III Results and recommendations:
The following important points of risk were noted: (list nos. 1-10)
Signature of Inspector:
Comments:

GUIDEL INES FOR ASSESS ING THE R ISK TO GROUNDWATER FROM ON-S I TE SANITAT ION96
I Type of facility DUG WELL WITH HANDPUMP/WINDLASS
1. General Information District:
Parish
Organisation
2. Village/zone:
3. Date of Visit
4. Water sample taken? ……. Sample No. ……… FC/100ml ………..
II Specific diagnostic information for assessment Risk
1. Is there a latrine within ….m of the well? Y/N(please put in distance calculated from the manual)
2. Is the nearest latrine uphill of the well? Y/N
3. Is there any other source of pollution within 10m of well? Y/N(e.g. animal breeding, cultivation, roads, industry etc)
4. Is the drainage faulty allowing ponding within 2m of the well? Y/N
5. Is the drainage channel cracked, broken or need cleaning? Y/N
6. Is the fence missing or faulty? Y/N
7. Is the cement less than 1m in radius around the top of the well? Y/N
8. Does spilt water collect in the apron area? Y/N
9. Are there cracks in the concrete apron? Y/N
10. Is the handpump loose at the point of attachment to well head? Y/N
11. Is the well-cover insanitary? Y/N
Total Score of Risks …./11Risk score: 9-11 = Very high; 6-8 = High; 3-5 = Medium; 0-3 = Low
III Results and recommendations:
The following important points of risk were noted: (list nos. 1-11)
Signature of Inspector:
Comments:

97Append i ce s
I Type of facility DEEP BOREHOLE WITH MECHANICAL PUMPING
1. General Information District:
Parish
Organisation
2. Village/zone:
3. Date of Visit
4. Is water sample taken? ……. Sample No. ……… FC/100ml ………..
II Specific diagnostic information for assessment Risk
1. Is there a latrine or sewer within ……m of the pumphouse? Y/N(please put in distance calculated from the manual)
2. Is the nearest latrine unsewered? Y/N(a pit latrine that percolates to soil)
3. If there any other source of pollution within 10m of the borehole? Y/N(e.g. animal excreta, rubbish, surface water)
4. Is there an uncapped well within 15-20m of the borehole? Y/N
5. Does the apron at the wellhead extend for less than 2m radius? Y/N
6. If the drainage area around the pumphouse faulty? Y/N(is it broken, permitting ponding and/or leakage to ground)
7. If the fencing around the installation damaged in any way which Y/Nwould allow animals access or any unauthorised entry?
8. Is the floor of the pumphouse permeable to water? Y/N
9. Is the well seal insanitary? Y/N
10. Is the top 3m of the borehole sealed with an impermeable lining? Y/N
Total Score of Risks …./10Risk score: 9-10 = Very high; 6-8 = High; 3-5 = Medium; 0-3 = Low
III Results and recommendations:
The following important points of risk were noted: (list nos. 1-10)
Signature of Inspector:
Comments: