assessing wastewater and sanitation conditions and
TRANSCRIPT

HAL Id: dumas-01668380https://dumas.ccsd.cnrs.fr/dumas-01668380
Submitted on 12 May 2020
HAL is a multi-disciplinary open accessarchive for the deposit and dissemination of sci-entific research documents, whether they are pub-lished or not. The documents may come fromteaching and research institutions in France orabroad, or from public or private research centers.
L’archive ouverte pluridisciplinaire HAL, estdestinée au dépôt et à la diffusion de documentsscientifiques de niveau recherche, publiés ou non,émanant des établissements d’enseignement et derecherche français ou étrangers, des laboratoirespublics ou privés.
Assessing wastewater and sanitation conditions andmanagement in the Ramotswa transboundary aquifer
area between South Africa and BotswanaNatacha Martin
To cite this version:Natacha Martin. Assessing wastewater and sanitation conditions and management in the Ramotswatransboundary aquifer area between South Africa and Botswana. Engineering Sciences [physics]. 2017.�dumas-01668380�

Assessing wastewater and sanitation conditions and
management in the Ramotswa Transboundary Aquifer Area
between South Africa and Botswana
MARTIN Natacha
Promotion PARIS
Partenaires:
MEMOIRE DE FIN D’ETUDES
Mémoire présenté pour l’obtention du
Diplôme d’Ingénieur de l’ENGEES
Stage réalisé du 16 Janvier au 14 Juillet 2017

Natacha Martin – Mémoire de fin d’études
Promotion Paris 2014-2017
2

Natacha Martin – Mémoire de fin d’études
Promotion Paris 2014-2017
3
Acknowledgement
This study would not have been possible without the financial support from the United States Agency
for International Development. This study is conducted as part of CGIAR Research Program on Wa-
ter, Land and Ecosystem and the International Water Management Institute in South Africa.
My sincere gratitude goes to Karen Villholth, my supervisor, for allowing me to be part of the project
Ramotswa at the International Water Management Institute, and in turn allowing me to be of service to
the community and to learn about Southern Africa. I would also like to thank Yvan Altchenko, Bonnie
McGill, Manuel Magombeyi, Jonathan Otene and Girma Ebrahim for providing resources to see this
project through. This study would not be realized without the support of the Department of Water Af-
fairs of Botswana and the Department of Water and Sanitation of South Africa for sharing information
and allowing me to visit sanitation sites.
My thanks also go to the ENGEES (Ecole Nationale du Génie de l’Eau et de l’Environnement de
Strasbourg), its professors and participants, for their teaching quality. I thank particularly Sylvain
Weill, my school supervisor during this internship, which gives a big attention on my work and which
always took time to support me.
My family has been truly supportive of me in my pursuit of my studies. I would like to thank my par-
ents for the emotional support, guidance and words of encouragement along the way.

Natacha Martin – Mémoire de fin d’études
Promotion Paris 2014-2017
4
Abstract
Since the eighties, the sanitation system has developed a lot in the Ramotswa Transboundary Aquifer
Area between South Africa and Botswana. It was essential to protect the groundwater from sanitation
in a region of water scarcity. At first, pit latrines were promoted in rural and urban areas. The efficien-
cy of pit latrines depends on the construction quality and the soil characteristics. In the RTBAA, pit
latrines can be considered as a direct source of nitrate pollution in groundwater by wastewater infiltra-
tion because of the fractured rock soil and the high groundwater table of the Ramotswa Aquifer [1][2].
Then, between 1985 and 2000, wastewater treatment plants were introduced in urban areas such as
Gaborone, Lobatse, Ramostwa and Zeerust. But, with population increase and industrial development
[3][4][5], wastewater treatment plants such as oxidation ponds are not efficient to treat wastewater.
Discharge of wastewater treatment plant and losses from the sewerage network are indirectly affecting
the groundwater quality. A vulnerability map of the aquifer to sanitation from the DRASTIC method
delimits a priority area where sanitation facilities have to be improved. In fact, more than 50% of the
Ramotswa aquifer is highly vulnerable to sanitation pollution during the wet season compare to 2.5%
during the dry season. Climate conditions have an impact on sanitation pollution. Moreover, potential
challenges of sanitation were assessed such as industrial wastewater pollutants, water balances and
transboundary water pollution issues. To improve the current situation, some recommendations are
given for on-site sanitation system, wastewater treatment plant management and the development of a
sustainable sanitation system.
Depuis les années 1980, le système d’assainissement s’est beaucoup développé dans la région de
l’aquifère transfrontalier de Ramotswa, situé entre le Botswana et l’Afrique du Sud. Il était primordial
de protéger les eaux souterraines des potentiels contaminants provenant de l’assainissement dans une
région où l’eau est si rare. Tout d’abord, les latrines à fosses ont été implémentées dans les zones ru-
rales et urbaines. Or, l’efficacité des latrines à fosses dépend essentiellement des caractéristiques du
sol et de leur qualité de construction. Dans la zone d’étude, les latrines a fosses peuvent être considé-
rées comme une source de pollution directe de l’aquifère par les nitrates. En effet, ces structures ne
sont pas adaptées pour un sol rocheux fissuré et avec un niveau élevé des eaux souterraines [1][2].
Puis, entre 1985 et 2000, les stations d’épuration ont été introduites en zone urbaine, comme par
exemple à Gaborone, Lobatse, Ramotswa et Zeerust. Cependant, en considérant l’augmentation de la
population et le développement industriel de la région [3][4][5], les stations d’épuration telles que les
bassins de lagunage ne sont pas efficaces en termes de traitement des eaux usées. Ainsi, les eaux usées
traitées et rejetées en milieu naturel et les pertes sur le réseau d’assainissement sont impliquées indi-
rectement dans la dégradation de la qualité des eaux souterraines. Une carte de vulnérabilité de
l’aquifère par rapport à l’assainissement a été réalisée selon la méthode DRASTIC et permet de déli-
miter une zone prioritaire en termes d’amélioration de l’assainissement. Selon cette étude, plus de 50%
de l’aquifère Ramotswa est hautement vulnérable à la pollution issue des eaux usées pendant l’été,
contrairement à 2.5% durant l’hiver. Les conditions climatiques ont donc également une influence sur
cette pollution. De plus, d’autres potentiels enjeux en matière d’assainissement sont étudiés tels que la
pollution des eaux usées industrielles, le bilan hydrique ou encore les enjeux de pollution d’eau trans-
frontalière. Afin d’améliorer la situation actuelle, des suggestions en termes d’assainissement sont
données, et tout particulièrement pour développer un système d’assainissement durable.

Natacha Martin – Mémoire de fin d’études
Promotion Paris 2014-2017
5
Contents
List of Figures ......................................................................................................................................... 7
List of Tables ........................................................................................................................................... 8
Acronyms ................................................................................................................................................ 9
I. Introduction ................................................................................................................................... 10
1. Study area .................................................................................................................................. 10
2. IWMI and Ramotswa project .................................................................................................... 11
3. Methods ..................................................................................................................................... 12
II. Sanitation trends in the RTBAA.................................................................................................... 13
1. Sanitation development in Botswana side ................................................................................. 14
1.1. Gaborone sanitation facilities ............................................................................................ 16
1.2. Kanye sanitation facilities ................................................................................................. 18
1.3. Ramotswa sanitation facilities ........................................................................................... 20
1.4. Otse sanitation facilities .................................................................................................... 22
1.5. Lobatse sanitation facilities ............................................................................................... 23
2. Sanitation development in South African side .......................................................................... 26
2.1. Motswedi sanitation facilities ............................................................................................ 27
2.2. Lehurutshe sanitation facilities .......................................................................................... 28
2.3. Zeerust sanitation facilities ................................................................................................ 30
2.4. Wastewater treatment plants of the Department of Public Works .................................... 32
3. Conclusion ................................................................................................................................. 33
III. Challenges ..................................................................................................................................... 34
1. Vulnerability to pollution of the aquifer and priority areas ....................................................... 35
2. Industrial pollution .................................................................................................................... 42
3. Surface and groundwater transboundary pollution .................................................................... 43
3.1. Surface water pollution ...................................................................................................... 44
3.2. Groundwater pollution....................................................................................................... 45
4. Water balances .......................................................................................................................... 47
5. Climate change .......................................................................................................................... 50
IV. Recommendations and opportunities ............................................................................................ 53
1. On-site sanitation improvement ................................................................................................ 53
1.1. Recommendations for on-site sanitation ........................................................................... 53
1.2. Grey water management .................................................................................................... 55
2. Wastewater treatment efficiency ............................................................................................... 56
2.1. Improvement of wastewater treatment efficiency ............................................................. 56

Natacha Martin – Mémoire de fin d’études
Promotion Paris 2014-2017
6
2.2. Sludge treatment and reuse ................................................................................................ 58
3. Reuse of wastewater .................................................................................................................. 60
3.1. Quality issue ...................................................................................................................... 61
3.2. Quantity issue .................................................................................................................... 62
4. Social involvement .................................................................................................................... 64
V. Conclusion ........................................................................................................................................ 66
Bibliography .......................................................................................................................................... 67
Appendix 1: Pictures of Glen Valley WWTP, Gaborone ...................................................................... 75
1.1. Glen Valley inlet works ......................................................................................................... 75
1.2. Comparison of the two phases in Glen Valley WWTP: A) Clarifier in the second phase, B)
Clarifier in the first phase .................................................................................................................. 75
Appendix 2: Interview of Mr. Lekgaba, manager of Glen Valley WWTP on 2nd
February 2017 ........ 76
Appendix 3: Report of the interview of Mr. Mareme, manager of Ramotswa WWTP on January 2017
from Bonnie McGill .............................................................................................................................. 77
Appendix 4: Interview of Mr. Mareme, manager of Ramotswa WWTP on 30th January 2017 ............ 78
Appendix 5: Ramotswa WWTP samples analysis ................................................................................ 79
Appendix 6: Interview of Mr. Khan, manager of Lobatse WWTP on 1st February 2017 ..................... 80
Appendix 7: Lobatse WWTP samples analysis ..................................................................................... 81
Appendix 8A: Treated wastewater discharge standards ........................................................................ 82
Appendix 8B: Drinking water standards ............................................................................................... 83
Appendix 8C: Irrigation standards for unrestricted irrigation ............................................................... 84
Appendix 9: WWTP in the RTBAA ..................................................................................................... 85
Appendix 10: Mass balances between water supply and wastewater treated ........................................ 88
Appendix 11: Conversion method of evaporation to evapotranspiration .............................................. 90
Appendix 12: Conceptual model of a karst aquifer [105] ..................................................................... 90
Appendix 13: Spatial distribution of sum of nitrate and nitrite in the RTBAA [59] ............................. 91
Appendix 14: Monthly and annual average calculation of natural recharge ......................................... 92
Appendix 15: Rainfall and evaporation trends ...................................................................................... 92
Appendix 16: Introduction translated in french ..................................................................................... 98
1. Présentation de la zone d’étude ................................................................................................. 98
2. Présentation de la structure d’accueil: l’International Water Management Institute ............... 100
3. Méthodes employées ............................................................................................................... 100
Appendix 17 : Conclusion translated in french ................................................................................... 102

Natacha Martin – Mémoire de fin d’études
Promotion Paris 2014-2017
7
List of Figures Figure 1: Map of the Ramotswa Transboundary Aquifer Area. ............................................................ 11
Figure 2 : Localization map of WWTW in the RTBAA. ...................................................................... 14
Figure 3: Schematic of the water supply area in Botswana [2]. ............................................................ 15
Figure 4: Map of WWTW in Gaborone. ............................................................................................... 16
Figure 5: Glen Valley WWTP map. ...................................................................................................... 17
Figure 6: WWTW in Kanye, Southern District, Botswana. .................................................................. 19
Figure 7: Sanitation system and pollution in Ramotswa. ...................................................................... 20
Figure 8: Sewage flow in Ramotswa WWTP. ....................................................................................... 21
Figure 9: Map of Otse sanitation facilities. ........................................................................................... 22
Figure 10: A) Map of Lobatse; B) Zoom on Lobatse WWTP; C) Zoom on BMC pre-treatment. ........ 24
Figure 11: Map of the place where samples were collected in Lobatse WWTP. .................................. 25
Figure 12: Map of Lehurutshe. .............................................................................................................. 28
Figure 13: Map of the Lehurutshe Wastewater Treatment Plant. .......................................................... 29
Figure 14: Location map of Zeerust WWTP. ........................................................................................ 30
Figure 15: Design of Zeerust WWTP. ................................................................................................... 31
Figure 16: A) Zeerust WWTP compliance in 2012 - 2013 [23], B) E. Coli analysis in Zeerust WWTP
discharge [26], C) COD analysis in Zeerust WWTP discharge [26], D) Ammonia analysis in Zeerust
WWTP discharge [26], E) Nitrate analysis in Zeerust WWTP discharge [26], F) Suspended Solids
analysis in Zeerust WWTP discharge [26]. ........................................................................................... 32
Figure 17: Map of the area with comprehensive knowledge of sanitation conditions. ......................... 33
Figure 18 : Flow direction in the Ramotswa Transboundary Aquifer. .................................................. 37
Figure 19: Location map of rainfall and evaporation stations. .............................................................. 38
Figure 20 : Vulnerability map for groundwater pollution: A. during the rainy season from October to
March; B. during the dry season from April to September. .................................................................. 41
Figure 21: Map of biggest industrial activities in the RTBAA. ............................................................ 42
Figure 22: Simplified scheme of transboundary pollution in the RTBAA. Not to scale. ...................... 44
Figure 23: A. Identification of surface water pollution in Lobatse area; B. Picture of the stream from
Lobatse WWTP discharge; C. Picture of Peleng River. ........................................................................ 45
Figure 24: Spatial distribution of the total dissolved solids in the TBA [59]. ....................................... 46
Figure 25: The fate of nitrate from sanitation in the environment. ....................................................... 46
Figure 26: Spatial distributions of E.Coli and total coliforms, respectively on the left and on the right
[59]. ....................................................................................................................................................... 47
Figure 27: Scheme of water balances in the RTBAA. .......................................................................... 48
Figure 28: Scheme of the water consumption and wastewater according to their sanitation facilities in
the RTBAA. .......................................................................................................................................... 48
Figure 29: Range of losses on the sewage network in the RTBAA. ..................................................... 49
Figure 30: Unmanaged grey water and wastewater infiltrating from on-site sanitation in the RTBAA.
............................................................................................................................................................... 50
Figure 31: Annual average natural recharge. ........................................................................................ 51
Figure 32: Rainfall trends from 1988 to 2016 in the RTBAA. .............................................................. 52
Figure 33: Evaporation trends from 1988 to 2016 in the RTBAA. ....................................................... 52
Figure 34: Scheme of greywater management column [74].................................................................. 55
Figure 35: Drying bed scheme [76]. ...................................................................................................... 59
Figure 36: Map of wastewater treatment plant and irrigated areas. ...................................................... 63
Figure 37: Summary scheme of a sustainable sanitation system in the RTBAA. ................................. 65
Figure 38: Carte de la région de l’aquifère transfrontalier de Ramotswa.............................................. 99

Natacha Martin – Mémoire de fin d’études
Promotion Paris 2014-2017
8
List of Tables Table 1: Sanitation facilities in the Botswana side of the RTBAA in 2001 and 2011 [3]. .................... 15
Table 2: Sanitation facilities in Ramotshere Moiloa Local Municipality in the last past 20 years [5, 10,
11, 12]. ................................................................................................................................................... 27
Table 3 : Sanitation facilities in Motswedi, 2011 [5]. ........................................................................... 27
Table 4: Sanitation facilities in Lehurutshe [5]. .................................................................................... 29
Table 5: Statement of sanitation in the RTBAA. .................................................................................. 34
Table 6: Weight of parameters for the DRASTIC method. ................................................................... 36
Table 7: DRASTIC classification of the water table depth. .................................................................. 36
Table 8: DRASTIC classification of the recharge. ................................................................................ 38
Table 9 : DRASTIC classification of thickness. ................................................................................... 39
Table 10: DRASTIC classification of slope. ......................................................................................... 40
Table 11 : DRASTIC classification of the permeability rocks in the vadose zone [38]. ....................... 41
Table 12: DRASTIC classification of hydraulic conductivity. ............................................................. 41
Table 13: Wastewater pollutants from industrial activities. .................................................................. 43
Table 14: Details of on-site sanitation improvement [63; 68; 69; 70]. .................................................. 54
Table 15: Recommendations for WWTP with high risk of polluting the environment [25; 26; 76;
77][Appendixes 3; 4; 6; 9]. .................................................................................................................... 57
Table 16: Hydraulic retention time and removal in function of type of pond [76]. .............................. 57
Table 17: Quantity of sludge produced in WWTP per day [83]. .......................................................... 58
Table 18: Technical and design details for drying beds [86]. ............................................................... 60
Table 19: Design details for Ramotswa faecal sludge management. .................................................... 60
Table 20: Recommendations from the World Health Organization for irrigation with wastewater [93].
............................................................................................................................................................... 61
Table 21: Impacts of pollutants on the irrigation scheme [94]. ............................................................. 62
Table 22: Potential for reuse and recharge. ........................................................................................... 64

Natacha Martin – Mémoire de fin d’études
Promotion Paris 2014-2017
9
Acronyms
BMC Botswana Meat Commission
BOD Biochemical Oxygen Demand, unit : mg/L
BOBS Botswana Bureau of Standards
CBD Central Business District
COD Chemical Oxygen Demand, unit : mg/L
DO Dissolved Oxygen
DWA Department of Water Affairs, Botswana
DWAF Department of Water Affairs and Forestry, South Africa
E1 Natural estrogen estrone
E2 Natural estrogen estradiol
E3 Natural estrogen estriol
EC Electrical Conductivity
E. Coli Escherichia Coli
EE2 Synthetic estrogen ethinylestradiol
EFR Environmental Flow Requirement
mamsl Metres Above Mean Sea Level, unit
NAFTEC National Food Technology Research Centre, Kanye, Botswana
NDP National Development Plan
NTU Nephelometric Turbidity Unit
RBC Rotating Biological Contractor
RMLM Ramotshere Moiloa Local Municipality, North West Province, South Af-
rica
RTBAA Ramotswa Transboundary Aquifer Area
SAT Soil Aquifer Treatment
SBR Sequential Batch Reactor
SHHA Self Help Housing Agency
SS Suspended Solids, unit : mg/L
TBA Transboundary Aquifer
TCU True Color Unit
TDS Total Dissolved Solids
TOC Total Organic Carbon
TON Threshold Odor Number
US EPA United States Environmental Protection Agency
WAS Waste Activated Sludge
WHO World Health Organization
WUC Water Utilities Corporation, Botswana
WWTP Waste Water Treatment Plant
WWTW Waste Water Treatment Works

Natacha Martin – Mémoire de fin d’études
Promotion Paris 2014-2017
10
I. Introduction
Scarce and seasonal surface water supplies have rendered the population heavily reliant on groundwa-
ter resources in the area of the Ramotswa aquifer in the Upper Limpopo. Given the reliance on
groundwater, it is critical that the quality of such water be ensured to avoid adverse health impacts.
However, evidences sources suggests that conditions in Botswana and South Africa have driven in-
creased adoption of on-site sanitation, conditions which have elsewhere led to pollution [6;7]. It is
therefore critical to assess current water quality and pollution risks in the Ramotswa Transboundary
Aquifer Area.
Despite some investigations into water quality and pollution in the region, an aquifer-oriented assess-
ment has not been undertaken. Some hydrogeological investigations have been undertaken in the Ra-
motswa and Lobatse wellfields, respectively by Beger [8] and Staudt [9]. These reports give an identi-
fication of the Ramotswa Transboundary Aquifer on the Botswana side and assess the groundwater as
polluted by nitrate. Studies were limited on the Botswana side compare to this study which is address-
ing by giving attention to both sides. Ranganai et al. [1] also reported the extremely vulnerability of
groundwater in the Ramotswa wellfield to pollution due to various anthropogenic activities as septic
tanks, pit latrines, wastewater discharge and dumpsites. These reports indicate that sources of pollution
coexist at practically the same depth as the groundwater table. The characteristic of the aquifer and the
soil, such as the depth of the water table and nature of the soil matrix, are the key parameters affecting
groundwater pollution.
The present study assesses the impacts of sanitation systems on groundwater quality in the Ramotswa
Transboundary Aquifer Area between South Africa and Botswana. Sanitation information is collected
by document analysis, interviews and wastewater sampling. A GIS map is established to determine
vulnerability areas and sources of pollution. Results from this assessment are used to propose achieva-
ble recommendations taking into account of social, climate and economy conditions of the two coun-
tries. Wastewater is the “new water” for water scarcity areas, some alternatives for the reuse are pro-
posed for agriculture, groundwater recharge and domestic reuse.
1. Study area
The study is undertaken in the Ramotswa Transboundary Aquifer Area (RTBAA) between Botswana
and South Africa. The RTBAA straddles the border between both countries. The delineation of the
RTBAA is the Gaborone dam catchment but this study is focused on the Gaborone dam catchment
extended on the district’s boundaries for both sides. The Botswana side is formed of South East Dis-
trict, south east part of Southern District. This area of Botswana is the most densely populated. The
capital Gaborone and Lobatse lie in this district. This part of the study is dominated by urban devel-
opment with high economic growth. Ramotshere Moiloa Local Municipality in the North West Prov-
ince composes the South African side of the study area. This local municipality occupies an area of
7193 km² and has a stalling economic growth and a low population density. The main urban area is
Zeerust.

Natacha Martin – Mémoire de fin d’études
Promotion Paris 2014-2017
11
Figure 1: Map of the Ramotswa Transboundary Aquifer Area.
The RTBAA has a semi-arid climate. There are two seasons in the year. Winter is characterized as the
dry season with high evaporation level and lasts from April to September. In contrast, from October to
March is the wet season which is called summer. Rainfall happens during this season. Average annual
temperatures range between 18 and 20°C.
The Ramotswa aquifer is located in the Ngotwane sub-catchment in the Upper Limpopo River Basin.
Geologically, the study area is within the western part of the Transvaal Supergroup in Kraapvaal Cra-
ton. The main water-bearing unit of the RTBAA is dolomitic. The Ramotswa Dolomite is intruded by
three vertical dikes which create compartments. The Ramotswa Dolomite aquifer is fractured and has
karst areas with high transmissivity and storativity. Rainfall recharges the aquifer. The median depth
to the groundwater table is 9 meters and there are 0 to 12 meters of surface unconsolidated sediment
[2]. The quality of groundwater is critical in the Ramotswa Transboundary Aquifer given its use for
agriculture (69%), industry (1%) and especially drinking water purposes (30%) [2].
The RTBAA extends on 10533 km² and has a population of 534788 in 2011. Actually, 50% of the
population in the RTBAA is connected to a sewage network. But, more than 50% of the population
has on-site sanitation because of the climate conditions. During a drought, people are not able to flush
toilets, they use on-site sanitation. In urban areas, on-site sanitation is more or less well maintained
and dislodged in the inlet of wastewater treatment plant. In rural areas, on-site sanitation is maintained
according to funding of households. Human activities are mostly agricultural in this area. Groundwater
is also used for irrigating crops or watering cattle.
2. IWMI and Ramotswa project
The International Water Management Institute leads the Ramotswa Transboundary Aquifer Area pro-
ject in partnership with the Department of Water and Sanitation in South Africa, the Department of
Water Affairs of Botswana, Limpopo Watercourse Commission, Southern African Development
Community, and the universities of the area. The International Water Management Institute is a non-
profit and scientific research organization focusing on the sustainable use of water and land resources

Natacha Martin – Mémoire de fin d’études
Promotion Paris 2014-2017
12
in developing countries of Africa and Asia. The Ramotswa project was developed in 2015 to support
management and cooperation on the shared groundwater resources of the upper Limpopo region in
order to reduce poverty, inequality and insecurity. Main objectives of the project are to understand the
socio-economic importance of the aquifer area, assess the feasibility for managed aquifer recharge,
establish cooperation between both countries, and improve management and monitoring of the re-
source. A stakeholder platform, a strategic action plan for the development and management of the
aquifer, a transboundary diagnostic analysis, training material on transboundary diagnostic and an
information management system (RIMS – IGRAC) are expected as key outputs by the end of the Ra-
motswa project.
3. Methods
This research is led by five steps: document analysis, statistics on water balances and population, in-
terviews and visits, modelling map and identification of challenges.
i) Document analysis
Most of the documents analyzed are policy documents and environmental reports from Department of
Water Affairs in Botswana, Department of Water and Sanitation in South Africa, institutions in the
transboundary area and previous work in the area such as hydrogeology reports from Michael Staudt
[9] and Katharina Beger [8]. Document analysis is realized in a chronological order and by categories
to update and complete information on each sanitation system. Documents are classified at first by
country and then in five subcategories such as wastewater treatment plants, on-site sanitation condi-
tions, hydrogeology assessment, settlement activities and development plan for the environment.
ii) Statistics on water balances and population
Census of South East district [3] and Southern district [4] of Botswana of 2001 and 2011 and census of
North West province of 1996 [10], 2001 [11], 2011 [5] and 2016 [12] were collected. They are used to
assess population growth rate, consumption of water per household and development of sanitation
system over time.
iii) Interviews and visits
Visits in the field permit to collect interviews of workers in wastewater treatment plants of Lobatse,
Ramotswa and Gaborone [Appendixes 2, 3, 4, 6] and wastewater samples [Appendixes 5, 7]. Inter-
views are undertaken to assess the capacity and the treatment of wastewater facilities, to assess the
potential impact of wastewater discharge on the environment and to know the trends for on-site sanita-
tion. Interviews correct or confirm information contained in documents contents. No interview is
available from the South African side.
iv) Modelling map
Visits and document analysis help to create a GIS map of the area. The aim of this map is to locate the
most vulnerable part of the RTBAA for pollution. A DRASTIC (Depth to groundwater, Recharge,
Aquifer media, Soil media, Topography, Impact of the vadose zone, Conductivity) method is used for
modelling.
v) Identification of challenges
After these four primary steps were achieved, an assessment of sanitation in Botswana and in South
Africa is realized. This assessment compiles every information in a chronological order. Five chal-
lenges are identified by combining and comparing information from the different steps:

Natacha Martin – Mémoire de fin d’études
Promotion Paris 2014-2017
13
- Priority areas: the modelling map points out priority areas to work on sanitation improvement.
These areas are selected according to their vulnerability to pollution depending on climate
conditions, settlements, activities and soil characteristics.
- Industrial wastewater: document analysis and visits allow to assess the river quality and the
wastewater quality from wastewater treatment plants. High concentration rate of some pollu-
tants (heavy metals, oil and grease, and chemical oxygen demand) does not just come from
domestic wastewater. Industrial activities are involved in deteriorated wastewater quality.
Biggest industrial activities in the study area and their major pollutants are identified.
- Transboundary pollution: quality assessment and modelling map lead to focus on the trans-
boundary pollution. Surface water and groundwater pollution are linked based on document
analysis.
- Water balances: statistics on water balances and population show water consumption and
number of sanitation system increasing which mean leakage and losses increasing. Water bal-
ances are quantified based on statistics.
- Climate change: interviews and documents report some variation of quality and quantity of
wastewater with seasons. Climate change impact on sanitation is studied based on rainfall and
evaporation record from the Department of Water and Sanitation of South Africa and the De-
partment of Water Affairs of Botswana.
Once the challenges established, recommendations and opportunities for sanitation improvement are
given. Sanitation systems improve with better treatment efficiency or on-site sanitation adapted to the
area. Treated wastewater can benefit water bodies by recharge or reuse.
II. Sanitation trends in the RTBAA
Sanitation trends in the RTBAA are studied in the Botswana side and then, in the South African side.
In fact, Botswana and South Africa have not developed water acts and development plans at the same
time. The installation of sanitation in the last past years is different between the two countries. How-
ever, the main challenge is the same for both: protect groundwater from sanitation pollution. The study
area has twenty one wastewater treatment works in operation and 91000 on-site sanitation facilities,
presented below in Figure 2.

Natacha Martin – Mémoire de fin d’études
Promotion Paris 2014-2017
14
Figure 2 : Localization map of WWTW in the RTBAA.
1. Sanitation development in Botswana side
In Botswana, the Urban Sanitation Research Project promoted the use of pit latrines in urban areas in
1976. This project was extended for rural areas in the eighties with the Environmental Sanitation and
Protection Pilot Project. But, the lack of skills in latrine construction and the affordability where, in
some cases, the households were not prepared to play their part and complete top structures, caused
groundwater pollution in the area.
In fact, in Botswana the construction of pit latrines is controlled as explained below:
- a household wanting to participate in the project would enroll and pay a deposit of P30,
- the household would then excavate a pit to dimensions provided. The project team would as-
sist with a jackhammer if the ground was unpickable,
- the council would then construct the substructure together with the concrete slabs at ground
level,
- the householder would then build the superstructure with advice from the project team if nec-
essary,
- the project team then installs the vent pipe, fly screen and seat.
In 1986, major urban centres of Gaborone and Lobatse reported a sewerage coverage of 38% and on-
site sanitation coverage of 55%. In the major rural villages sanitation coverage was around 30-40%
and minor villages and locations virtually zero coverage. In 1991, a study was commissioned to assist
the government in designing a National Rural Sanitation Programme. In 2001, 77% of the households
in Botswana had access to adequate sanitation [13]. In the Botswana side of the RTBAA in 2011, 95%
of the households had access to adequate sanitation.

Natacha Martin – Mémoire de fin d’études
Promotion Paris 2014-2017
15
2001 2011
Population 390023 474860
Household 84154 139641
Flush toilet 42776 69892
Pit latrine 29014 56481
VIP 25705 5448
Enviro-loo toilet 454 -
Dry compost - 444
None 8243 7375
Unknown 50 -
Table 1: Sanitation facilities in the Botswana side of the RTBAA in 2001 and 2011 [3].
In the RTBAA, after 1996, most of the water supply came from water surface, such as Gaborone, Mo-
latedi and Nnywane Dams. Ramotswa wellfield was closed because of the high amount of nitrate con-
centration which came from pit latrines and caused some cases of blue baby syndrome. But, Botswana
knows dry seasons and water usage is increasing for livestock watering and irrigation. Moreover, the
distribution network is old and experiences frequent pipe failure, which increases the water losses.
Dams are not enough to provide water. In 2014, Ramotswa wellfield was re-opened for pumping as an
emergency measure. Nowadays, Ramotswa, Otse, Lobatse, Ranaka, Lekgolobotlo, Magotlhwane, and
Molapowabojang receive water from Gaborone waterworks blended with water from the wellfields in
the area, such as presented in Figure 3. Because of the groundwater pollution, the wellfield water has
to be diluted with water from Gaborone, Molatedi and Nnywane Dams. When there is no water from
the dam, the water is restricted in the villages. This phenomenon explains why people have pit latrines
even if they use toilets connected to the sewage.
Figure 3: Schematic of the water supply area in Botswana [2].

Natacha Martin – Mémoire de fin d’études
Promotion Paris 2014-2017
16
Between 2008 and 2013, the government of Botswana launched a program Water Sector Reforms.
This program was to redefine and change the roles of institution and major stakeholders. From 2011,
WUC takes over the operation of wastewater networks in Botswana. Then, from 2013, the operation of
the WUC includes vacuum tanker services to pit latrine and septic tanks.
1.1. Gaborone sanitation facilities
Gaborone is the capital of Botswana with a population of 231 592 in 2011 [3] which represents around
10% of the population of Botswana. The sanitation system is quite impressive in Gaborone compare to
the other towns in the country. WWTW are located in the Figure 4.
Figure 4: Map of WWTW in Gaborone.
Seven primary trunk mains allow collection of wastewater from all of the defined Gaborone city area,
Tlokweng and Mogoditshane, with all the recently low cost areas connected. Unsewered areas are the
SHHA areas in Old Naledi, Bontlend and Broadhurst. They were planned to be sewered in NDP 9,
between 2003 and 2009. Problems such as blockages and pipe failures are encountered in the older
areas of the city, especially in the Central Gaborone Area [13]. The older areas of the city are still us-
ing latrines and tank system.
Glen Valley WWTP treats all wastewater generated in Gaborone and adjacent connected areas. It em-
ploys an activated sludge process with polishing of the effluent in the Broadhurst and Phakalane
ponds, which are called “Gaborone Ponds” in Figure 5. Effluent discharges into the Ngotwane River

Natacha Martin – Mémoire de fin d’études
Promotion Paris 2014-2017
17
from either these pond systems or are reused for irrigation, it depends on the effluent quantity and the
needing for irrigation. Most of the effluent is used for irrigation.
Figure 5: Glen Valley WWTP map.
Influent is largely domestic with industrial component. The WWTP is composed of an inlet work with
mechanically raked screens, flow measurement and grit chambers, presented in Appendix 1.1.; a pri-
mary settlement; an activated sludge reactor with surface aerators and secondary settling tanks; sludge
handling with sludge thickening, anaerobic digestion and drying beds; maturation ponds for polishing
and disinfection.
The first phase was built in 1996 and designed to treat an average dry weather flow of 40 000 m3.d
-1,
with current inflow of 34 000 m3.d
-1. In 2003, inflow represented 52 % of water supplied to the area.
The first phase was designed for influent of 1000 mg.L-1
COD, 500 mg.L-1
BOD, 400 mg.L-1
SS. But
the raw sewage exceeded the design and impacted on downstream performance. The possible reason
of the impact is coming from higher industrial load or malfunctioning of thickeners. The plant is
equipped with a laboratory for monitoring COD, BOD, SS, NH3, PO4.
The second phase in 2001 was designed for a total of 90 000 m3.d
-1 of inflow. As it can be seen in
Appendix 1.2., the second phase is not fully used but the current inflow has improved because of the
immigration to the capital. Septic tanks and pit latrines are also dislodged in the current inflow of the
WWTP before the screens. The current inflow is around 65 000 m3.d
-1.
Preliminary daily solid balance of waste activated sludge handling system is maintained by sludge
from WAS & digested primary applied to drying beds. The stabilized sludge has in the past been re-

Natacha Martin – Mémoire de fin d’études
Promotion Paris 2014-2017
18
moved to the local sanitary landfill but since the commissioning of the new plant in 2001, sludge has
accumulated around the drying beds.
Final polishing provides for die off of bacteria to levels far lower. No bacteriological and limited PO4
analyses are available for this part of process.
Reuse of treated effluent is for irrigation of golf courses and cultivation of crops. 203 hectares of land
are irrigated. The water is pumped by the Department of Agriculture of Botswana. Wastewater are
used to irrigate tomatoes, butternut and spinach crops. The discharge has a good compliance for irriga-
tion [Appendix 2]. Glen Valley WWTP is used in this report as an example of reuse.
Gaborone has two other WWTW located off-center which are in Mokolodi Nature Reserve and in
Saint Joseph’s College. In Mokolodi Nature Reserve, wastewater is treated in a wetland. Wastewater
comes from the lodges in the area and treats 10 m3.d
-1 with good efficiency. In Saint Joseph’s College,
the sanitation treatment system is ponds and treats wastewater of 1260 students and 140 teaching staff
since 1996. 100 m3.d
-1 of wastewater are treated in septic tank, facultative pond and aerobic ponds. 40
m3.d
-1 of effluent is discharged into Gaborone dam with good compliance.
Tlokweng is a village adjacent to Gaborone in the South East District of Botswana. The population
was 37 340 in 2011 [3]. It is considered as a part of Gaborone for the sanitation system because almost
all of Tlokweng is sewered and treated in Glen Valley WWTW. Just Tlokweng Technical Training
Centre has its own WWTP which is a wetland system with a nitrification tower built in 2002.
Wastewater treated is reused for watering sport fields.
1.2. Kanye sanitation facilities
Kanye is a town located 83 kilometres south west of the capital Gaborone. It is the administrative cen-
tre of the Southern District with a population of 52 323 inhabitants [3]. Kanye water supply boreholes
are located in Kgwakgwe wellfield lying to the south west of the village. Majority of households have
access to water through a yard and standpipe. But, no sewerage facility is available. CBD and Rural
Administration Centre are connected to septic tank and soak away systems. Kanye Development Plan
envisaged VIP and pit latrines remained as the most appropriate system for sanitation village but there
are polluting the groundwater. Six WWTW exist in the town for industrial and education settlements
as shown on the map Figure 6.

Natacha Martin – Mémoire de fin d’études
Promotion Paris 2014-2017
19
Figure 6: WWTW in Kanye, Southern District, Botswana.
The Seventh – Day Adventist Hospital WWTW are rotating biological contactors treatment. It serves
the hospital which hosts 120 patients and 300 staff members. In the plant, there are an inlet structure
with bar screen, septic tank, biodiscs in series, humus tank and disinfection. The plant capacity is 20
m3.d
-1 and the system is well managed. All effluent is reused for gardens.
Kanye prison and Sejelo police station WWTP is a wetland system with anaerobic rock filter built in
1997. The wetland was designed for 25 m3.d
-1, but the current inflow is about 30 m
3.d
-1. Effluent is
used for irrigation of vegetables garden with a good quality.
Kanye Education Centre Ponds were constructed and completed in September 2001. Eight pump sta-
tions transfer the sewage. No effluent is produced because of the operation. System is composed of
screens, grit chambers, anaerobic ponds, facultative ponds, aerobic ponds. The plant was oversized
because the full capacity is 106 m3.d
-1, but the current inflow is 50 m
3.d
-1.
Ramatea Vocational School WWTP was built in 1998 as a wetland system. The current outflow pro-
duced is 14 m3.d
-1 and presents a good quality.
No quality data was provided from the NAFTEC. Wetlands were built in 2000 and the current inflow
is equivalent to the design capacity such as 10 m3.d
-1.
Seepapitso Senior Secondary School WWTW are oxidation ponds designed for 400 students. But, the
present number of students is around 1500, plus 200 staff members and around 60 staff houses. Sew-
age overflows into natural water course because the ponds capacity is not enough. The plant is com-
posed of septic tanks, facultative ponds and aerobic ponds. Ponds are cement lined, and there is no
maintenance. Raw sewage is spilled from last manhole before entering primary septic tank and flowed
Natacha Martin – Mémoire de fin d’études
Promotion Paris 2014-2017
20
into facultative pond. Spillage results in short circuiting the facultative pond and emanates in very
green algae in facultative pond with no flow condition. The treatment is excellent. There is no measure
data available, and changes as septic tank being dislodged on a regular basis should be done. Effluent
flows eventually into the river when there is not enough evaporation [13].
Kanye pollution is coming from the lack of sewage network in the town. Most of the population is
using VIP and pit latrines which are infiltrating the aquifer because of the lack of management and
skills in constructing on-site sanitation.
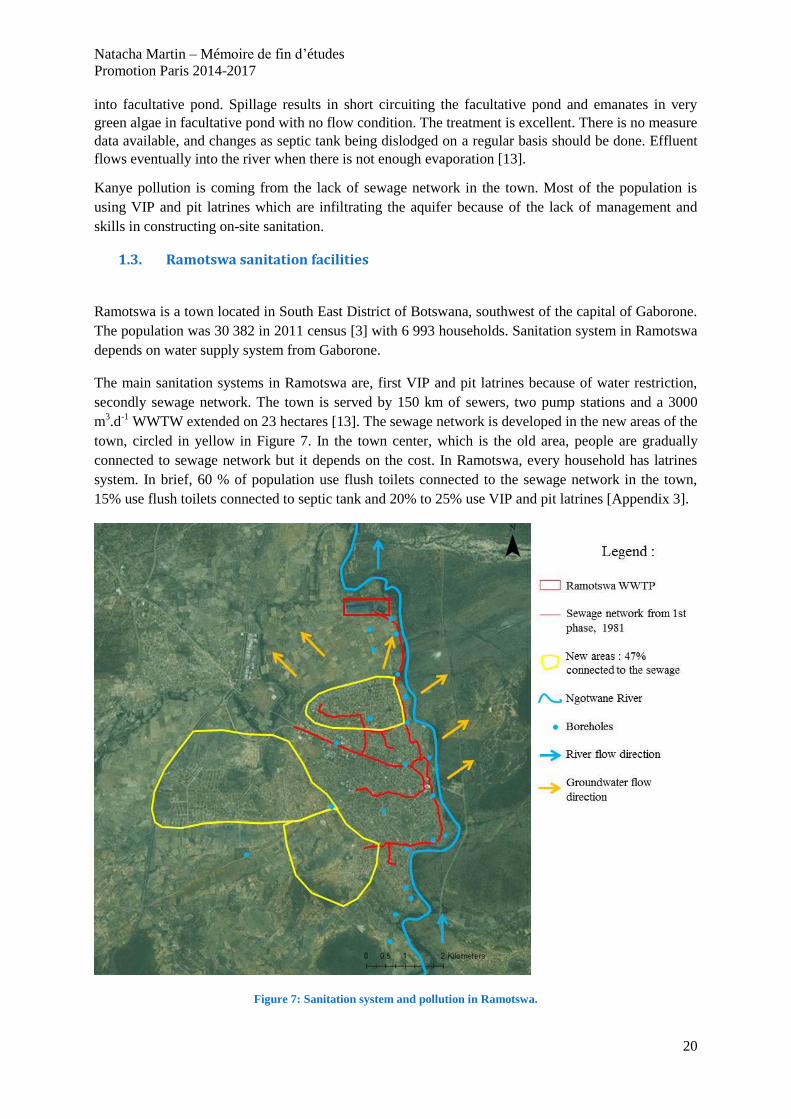
1.3. Ramotswa sanitation facilities
Ramotswa is a town located in South East District of Botswana, southwest of the capital of Gaborone.
The population was 30 382 in 2011 census [3] with 6 993 households. Sanitation system in Ramotswa
depends on water supply system from Gaborone.
The main sanitation systems in Ramotswa are, first VIP and pit latrines because of water restriction,
secondly sewage network. The town is served by 150 km of sewers, two pump stations and a 3000
m3.d
-1 WWTW extended on 23 hectares [13]. The sewage network is developed in the new areas of the
town, circled in yellow in Figure 7. In the town center, which is the old area, people are gradually
connected to sewage network but it depends on the cost. In Ramotswa, every household has latrines
system. In brief, 60 % of population use flush toilets connected to the sewage network in the town,
15% use flush toilets connected to septic tank and 20% to 25% use VIP and pit latrines [Appendix 3].
Figure 7: Sanitation system and pollution in Ramotswa.

Natacha Martin – Mémoire de fin d’études
Promotion Paris 2014-2017
21
Figure 7 shows that most of the boreholes are near the sewage network in the east side of the town.
Pollution of the groundwater might come from losses in the sewage network which are infiltrating the
aquifer and the concentration level of latrines in the area. The groundwater flows to the north-east, so
pollution can be detected in the water from the boreholes of Ramotswa.
Ramotswa WWTP was built in 1981; then, it was upgraded in 2001 because of population increasing.
The second phase is used when the first phase is full. The capacity design is 3000 m3.d
-1, but the cur-
rent inflow is around 1500 m3.d
-1. It is increasing during the rainy season. There is no effluent current-
ly produced during the dry season. The outflow is estimated around 600 m3.d
-1. Vacuum tanker dis-
charge bay, manually-raked screens, grit chambers, flume with no flow measurement and ponds form
the plant. Flow splits towards the old system from 1981 which is compounded of one anaerobic, two
facultative and four maturation ponds, and the new system composed of two primary anaerobic ponds,
two secondary anaerobic ponds, one facultative and three maturation ponds. All the ponds are plastic
lined. Overflow from final pond is supposed to flow into a woodlot planted with eucalyptus when
there is excess, such as presented in Figure 8 [13]. Otherwise, during winter, ponds system is working
as an evaporation system [Appendix 4].Wastewater treated runs off to the Ngotwane River and/or
infiltrates the aquifer. Because of this, the quality of the wastewater treated has to be monitored. The
quality of wastewater is presented in Appendix 5.
Figure 8: Sewage flow in Ramotswa WWTP.
The inflow of Ramotswa WWTP was tested twice. The inflow from 31st January was grey with an
important flow, contrary to the inflow of 2nd
February which was dark and sandy with a low flow.
Moreover, the second inflow is really concentrated in suspended solids, oil and grease and ammonia.
This quantity of oil and grease does not come from domestic wastewater. Fat contributes between 3%

Natacha Martin – Mémoire de fin d’études
Promotion Paris 2014-2017
22
and 8% of the wet weight of feces [14]. The concentration of oil and grease in an untreated domestic
wastewater is not higher than a range between 50 to 100 mg.L-1
compare to Ramotswa wastewater
which is more than 1000 mg.L-1
[15]. This high amount of concentration comes from industrial
wastewater such as Bolux Milling, Higro feeds, and Ramotswa Glass Works. High amount of oil and
grease includes physical blockages in sewers, pumps and screens. It reduces oxygen transfer rate, so
the degradation of suspended solids and BOD is not totally efficient in facultative ponds. This phe-
nomenon might explain the non-compliance of the outflow to the standards BOBS 93:2012 for COD,
BOD and ammonia. Nitrogen is still present under the form of ammonia in the discharge, but with
good conditions ammonia is oxidized in nitrate and nitrite, which can contaminate the river and the
aquifer. Lastly, these samples were collected during the rainy season when the wastewater is diluted.
The quality is considered worst during the dry season.
The main problem of the plant is the evaporation. In fact, the plant was not designed for evaporation
but in reality, there is no effluent produced during most of the dry season. The residence time in the
ponds is not respected, it is one of the reasons of the poor wastewater quality. Secondly, maintenance
is the key to improve the quality such as flow measurement or sludge care mentioned in Appendix 4.
Finally, treatment by ponds is not efficient for industrial wastewater. A pre-treatment of the
wastewater should be done by the industry.
1.4. Otse sanitation facilities
Otse is located 60 km south of Gaborone in the South East District. The population was 7976 in 2011
census [3]. The main sanitation system in the area is on-site sanitation. But, two wastewater treatment
plants in the village are used for the Police College and Moeding College. The sanitation system of the
area is presented in Figure 9.
Figure 9: Map of Otse sanitation facilities.

Natacha Martin – Mémoire de fin d’études
Promotion Paris 2014-2017
23
Otse Police College WWTP was commissioned in 2001. It is the biggest WWTP using rotating biolog-
ical contactors in Botswana and is operating under design capacity, such as 200 m3.d
-1 instead of 260
m3.d
-1. The primary treatment sewage is achieved by means of septic tank and followed by biological
treatment in rotating biodiscs units. Humus tanks downstream of the biodiscs are provided for effluent
clarification. The effluent is disinfected before storage in a holding pond. 200 m3.d
-1 of effluent pro-
duced are reused for college gardens and sport complex. The excess of effluent overflows to an infil-
tration field [13].
Moeding College WWTP is similar to the police college WWTP and was built in 1998. Differences
between the two WWTW are biodiscs: there are smaller in Moeding College WWTW. This plant
serves 1800 students and staffs members, which represents a full inflow capacity of 50 m3.d
-1. The pre-
treatment operates in septic tank, followed by organic removal in rotating discs. Effluent is clarified in
humus tanks followed by disinfection. The excess overflows from the pond to nearby environment
where cattle drink from [13].
Lastly, the first concern of the area is the use of on-site sanitation because of the population density
and the proximity of tributaries of Ngotwane River. In fact, the poor design of latrines and septic tank,
and the lack of maintenance, impact on the water quality. Raw sewage infiltrates the aquifer or is
spilled to the tributaries.
1.5. Lobatse sanitation facilities
Lobatse is an administrative town in South East District of Botswana, 70 kilometres south of the capi-
tal Gaborone. According to the 2011 census [3], the population of Lobatse is around 29 007 inhabit-
ants. Few industries are located in this town such as BMC, Lobatse Tiles, Lobatse Clay Works, sugar
packaging industries, brewery and milling.
62% of Lobatse are sewered inclusive of all institutions, government facilities and the town centre. In
Peleng, Tsopeng and Woodhall areas, presented in Figure 10A, on-site sanitation technologies are
being used. These pits and septic tanks have been sealed to prevent contamination of the aquifers and
are emptied by vacuum tanker. All new development is connected to the sewer system, including low
cost housing areas. In March 2017, 3642 households connected to the sewage network, 1700 pit la-
trines, and 800 septic tanks were identified. To summarize pit latrines are used by 25% of population;
flush toilets are used by 75%, but 25% are evacuated in septic tanks and 50% are evacuated in the
sewage network.

Natacha Martin – Mémoire de fin d’études
Promotion Paris 2014-2017
24
Figure 10: A) Map of Lobatse; B) Zoom on Lobatse WWTP; C) Zoom on BMC pre-treatment.
The plant, presented in Figure 10B, was built in 1989, upgrading in 1995 because of the population
increasing. There will be no need to increase the capacity because Lobatse has a slow population de-
creasing with the emigration to other economic centres. The plant is composed of 14 ponds which are
divided in 3 primary anaerobic ponds, 2 secondary anaerobic ponds, 6 facultative ponds and 3 matura-
tion ponds [Appendix 6].The plant was designed for treating 6200 m3.d
-1 domestic and industrial
wastewater with provision for future flows allowed 9500 m3.d
-1. Effluent from ponds were reused on
40 ha Lucerne production by private contractor.
The efficiency of the treatment was tested. Samples of the inflow and outflow of Lobatse WWTW
have been collected, as well as samples of upstream and downstream of the river. The place where
each sample was collected is presented in Figure 11. Wastewater quality is available in Appendix 7.

Natacha Martin – Mémoire de fin d’études
Promotion Paris 2014-2017
25
Figure 11: Map of the place where samples were collected in Lobatse WWTP.
The inflow is high in BOD, COD, SS and ammonia. The treatment removed most of the pollutants but
the outflow is not compliant to BOBS 93:2012 for ammonia and COD. Nitrogen is present in the form
of organic nitrogen and ammonia because the wastewater is freshly polluted. But, natural biochemical
process converts ammonia into nitrite then nitrate, which are flowing to Ngotwane Dam. Moreover,
the concentration level of coliforms is quite high (1280/100 mL) even if it is compliant to the stand-
ards of BOBS 93:2012. Stricter rules were applied in the standards BOBS 93:2004. It has to be noticed
that these samples have been collected during the rainy season. The quality is normally better during
this season because the effluent is diluted. Discharge, upstream and downstream river can be also
compared to prove if cattle may have an impact on the water quality. In fact, COD, SS and coliforms
are increasing downstream, so cattle defecating and the cemetery near the river are involved in the
pollution of Ngotwane Dam, such as mentioned during the interview with the manager of Lobatse
WWTP [Appendix 6].
In any case, effluent water quality is in accordance with application criteria BOBS 463:2011 as stipu-
lated by DWA for irrigation purposes on fodder crops, nuts and citrus fruit trees [Appendix 8C].
Pollution might come from the BMC pre-treatment, presented in Figure 10C, established in 1978. The
BMC plant capacity is 170000 cattles per year, including water used to wash down equipment and 2.3
m3 of water per head of cattle per day. The design capacity is 1700 m
3.d
-1. The main waste from an
abattoir is blood, fats and rumen contents. The BMC WWTP is a wastewater pre-treatment system
with anaerobic ponds followed by trickling filter but it is not enough to treat the raw wastewater. After
the pre-treatment, wastewater is flowing to Lobatse WWTP. Pollution occurred in Peleng River due to
three reasons:
- Pumping of wastewater, sludge and disposal of fats, oil and grease into the sludge pits which
are unlined pits in river alluvium,

Natacha Martin – Mémoire de fin d’études
Promotion Paris 2014-2017
26
- Spillage from BMC WWTP,
- Surface wash and percolation of rainfall though the screening waste materials [16].
Moreover, the BMC Tanning has an evaporation pond system consists of three ponds totalling an area
of 56 740 m2. A stench is emitted from the ponds. Wastewater seepage is going into the ground. An
agreement in the end of 2016 has been signed between BMC and WUC, it will be effective by the end
of 2017. The BMC will have its own WWTP.
The main problem in this area is the pollution from industrial activities which is polluting Ngotwane
River and Ngotwane dam in the North of South Africa. This pollution leads to a transboundary impact
between South Africa and Botswana.
2. Sanitation development in South African side
In South Africa, three distinct periods exist to describe the establishment of sanitation facilities.
In pre – 1994, South Africa was built in ten homelands managed by tribal authorities. There was no
cohesive strategy, guidelines or support structure between homelands. At first, the sanitation service
provision was focused on toilet building, sewer system and maintenance. People who had inadequate
sanitation were using the bucket system, rudimentary pit toilets or veld. The major concern for the
government was the groundwater pollution associated with on-site sanitation.
Between 1994 and 2001, the Department of Water Affairs and Forestry was created and the Communi-
ty Water Supply and Sanitation was formed. The objective was to extend the access of basic water
supply and sanitation services to all people resident in South Africa. In 1996, the Constitution of Re-
public of South Africa has indicated the government has the responsibility of providing water and
sanitation services access to all. At first, people were provided with 25 liters of water per day per peo-
ple within 200 meters of their home. Moreover, each household was provided with basic sanitation in
the form of at least VIP.
In 2001, South Africa census estimated that up 26 % of urban household and 76 % of rural household
had inadequate sanitation. Compare to this national estimation, in the Ramotshere Moiloa Local Mu-
nicipality, 8.5 % of household had no sanitation facilities. Moreover, in 2001, a cholera outbreak hap-
pened in South Africa which showed how important sanitation is. Then, the Department of Water Af-
fairs and Forestry launched the National Sanitation Program. The progress of sanitation implementa-
tion was monitored and evaluated with performance indicators, such as:
- Programs to clear the backlog,
- Promotion of health and hygiene education,
- Impact of sanitation improvement programs on the health of communities,
- Allocation application and management of funds,
- Involvement of communities,
- Development of common norms, standards guideline, and other tool [17].
Nowadays, the Department of Water Affairs and Sanitation is in charge of sanitation. The main chal-
lenge in the North West Province is to replace unimproved pit latrines with VIP [18].
Three policies have been launched recently about sanitation in South Africa:
- 2009: Free Basic Sanitation Implementation Strategy [19], which gives the specific steps that
can be taken at a local level to implement the free basic water policy.

Natacha Martin – Mémoire de fin d’études
Promotion Paris 2014-2017
27
- 2013: National Water Resource Strategy.
- 2016: National Sanitation Policy [20], which is a review of any previous draft sanitation poli-
cy. The entire sanitation value chain such as collection, removal, disposal or treatment of hu-
man excreta, domestic and industrial wastewater, is considered in this policy.
In the Ramotshere Moiloa Local Municipality, the sanitation facilities are improved since 1996. The
sanitation facilities of the RMLM are presented in the Table 2.
1996 2001 2011 2016
Population 15176 137443 150315 157691
Household 3290 31977 16634 47235
Flush toilet to
sewerage system
2967
6052 9310 12428
Flush toilet to
septic tank
1124 1730 1673
Chemical toilet 332 218 2404
VIP 45
6360 2637 5002
Pit latrine 15415 24261 22536
Bucket latrine 290 335 92 202
Ecological toilet - - - 1115
None - 2740 2387 -
Table 2: Sanitation facilities in Ramotshere Moiloa Local Municipality in the last past 20 years [5, 10, 11, 12].
It can be noticed that the number of flush toilet connected to septic tanks is stable. Every five years,
household connected to sewage network is increasing. Moreover, the number of pit latrines is decreas-
ing contrary to the number of VIP. It means on-site sanitation is followed and improved. In the South
African side of the study area, the majority of sanitation facilities used is VIP and pit latrines. But,
four wastewater treatment works are operating in Zeerust, Lehurutshe and in the border posts of Skil-
padshek and Swartkopfontein.
2.1. Motswedi sanitation facilities
The Motswedi WWTP is located approximately 2 km from the village of Motswedi, around 71 km
north east of Mafikeng. The plant in Motswedi is currently not in operation. The inflow has been cut
off for many years. But, the facilities which the plant serves, such as a school, a police station and a
number of private houses, are still functioning. Because of this, the wastewater from these buildings is
going into the environment. The sanitation facilities of the town are presented in Table 3. It has to be
noticed that Motswedi is far from 4.5 km of the Ngotwane river which is flowing in the Ngotwane
Dam.
Population Household
Flush
toilet to
sewerage
network
Flush
toilet
to
septic
tank
Chemical
toilet VIP
Pit
latrine
Bucket
latrine None
Motswedi
Consensus
2011
2794 558 80 27 4 66 701 0 15
Table 3 : Sanitation facilities in Motswedi, 2011 [5].
In South Africa, a typical household, with three children and two parents, uses about 250 litres of wa-
ter a day [21]. Considering that households with flush toilet connected to the sewerage network are

Natacha Martin – Mémoire de fin d’études
Promotion Paris 2014-2017
28
discharging their wastewater in the sewerage system, at least 20 m3 of wastewater per day are dis-
charged into the environment in Motswedi.
The only way to know the impact of the lack of sanitation in Motswedi is to assess the quality of water
supply in Motswedi. The quality of the boreholes in Motswedi was assessed in the Blue Drop Report
[22]. In average, 50 L.person-1
.d-1
are consumed from Motswedi water supply. The microbiological
compliance is 74.4% and the chemical compliance is 93.7%. So, groundwater is not compliant for
nitrate, nitrogen and faecal coliforms. Lack of sanitation in Motswedi has an impact on the aquifer.
2.2. Lehurutshe sanitation facilities
The Lehurutshe WWTP is located approximately 6.4 km north west of Lehurutshe as mentioned in
Figure 12, around 54 km north east of Mafikeng. This plant has been built in 1980 and is operated and
maintained by the Ramotshere Moiloa Local Municipality.
Figure 12: Map of Lehurutshe.
Lehurutshe is divided in three units for the census of sanitation facilities. The three units of the town
are entirely connected to the sewerage system, as presented in Table 4 for the consensus of 2011.
There still are septic tanks and latrines for old houses.

Natacha Martin – Mémoire de fin d’études
Promotion Paris 2014-2017
29
Lehurutshe Population Household
Flush
toilet to
sewerage
network
Flush
toilet
to
septic
tank
Chemical
toilet VIP
Pit
latrine
Bucket
latrine None
Unit 1 4559 626 1495 39 0 18 14 0 34
Unit 2 1809 190 641 2 0 2 33 0 2
Unit 3 105 1 28 0 0 0 0 0 0
Table 4: Sanitation facilities in Lehurutshe [5].
The WWTP is designed to receive 1 500 m3.d
-1 of wastewater but it is actually operating for 900 m
3.d
-1
from 5993 inhabitants, which means about 60% of its full capacity. The plant comprises an inlet work,
three anaerobic and one aerobic oxidation ponds, three maturation ponds, and a set of recycle pumps
from the maturation ponds to the anaerobic ponds. The system is presented in Figure 13. The recycle
pumps are unserviceable. A chlorination tank was removed. Some maintenance should be done for
anaerobic and aerobic oxidation ponds which are overgrown.
Figure 13: Map of the Lehurutshe Wastewater Treatment Plant.
Wastewater treated is discharged in a tributary of the Ngotwane river, flowing until the Ngotwane
Dam. The average evaporation for wastewater treatment ponds is around 60%. At least, the WWTP
discharges 360 m3.d
-1 in the river. According to the Green Drop Report of 2014 [23], the discharge is
not compliant to the South African standards. The microbiological determinands, which are Escherich-
ia Coli and Faecal Coliforms, are 16.7% compliant to the standards. Moreover, chemical determinands
as COD, Ammonia and Nitrate, Nitrogen, Ortho – Phosphate, are 5.6% compliant. At last, physical
determinands such as pH, Suspended Solids, Electrical Conductivity are 10.4% compliant. The dis-

Natacha Martin – Mémoire de fin d’études
Promotion Paris 2014-2017
30
charge represents a real risk for the environment and contaminates irrigation water of the Ngotwane
Dam.
The compliance of the WWTW could be improved by cleaning the ponds and installing a new chlorin-
ation plant. The pollution is discharged in the Ngotwane river which infiltrates the aquifer and flows to
the Ngotwane Dam [24].
2.3. Zeerust sanitation facilities
Zeerust WWTP is located approximately 1.5 km east of Zeerust, around 58 km east and north of Maf-
ikeng. This plant has been built in the sixties and was upgrated in 1993. Zeerust WWTP serves the
town of Zeerust, Ikageleng township, an abattoir and a few other light industries, presented in Figure
14. It has been designed for a capacity of 3500 m3.d
-1 but the WWTP operates for 4000 m
3.d
-1 of in-
flow from 17 708 inhabitants. In this area, wastewater pollution does not come from on-site sanitation.
All the population is connected to the sewage network.
Figure 14: Location map of Zeerust WWTP.
The composition of the plant is described in Figure 15. Evaporation losses can be estimated around
45% in an activated sludge treatment. Indeed, around 2200 m3.d
-1 of wastewater treated are produced.
Moreover, Zeerust plant produces 3.7 dry tons.d-1
of sludge.

Natacha Martin – Mémoire de fin d’études
Promotion Paris 2014-2017
31
Figure 15: Design of Zeerust WWTP.
In 2013, an investigation was led on the quality of the Groot Marico River and Kareespruit River due
to the mismanagement of the wastewater plants in Groot Marico and Zeerust [25]. Rivers of the area
of Zeerust are higly polluted by E. Coli (1000 unit/100 mL) because of the wastewater management.
The pollution comes from Zeerust and Marico WWTW. In fact, Marico is populated by townships
with no proper sewage. The major threat of pollution is during rainy days. There is no more operation
because the municipality feared excessive spillages into the river. But, Zeerust WWTP is identified as
one of the priority project and is allocated the highest funding in the North West Province, around 2.8
million of rand. The latest upgrading was in 2012 for materials and maintenance [26], as:
- Replacement of horizontal brush aerators and mixers (4 mixers, 18 aerators),
- Replacement of return sludge pump,
- Replacement of waste sludge pump,
- Installation of flow meters in inlet and outlet work,
- New mechanical step screen,
- Upgrading bulk electricity supply system.
Because of the upgrading, the discharge quality is improving. There are two reasons of possible pollu-
tion from the WWTW. The first one is the fair state of the waste sludge lagoons. In fact, the settled
sludge and the debris floating on the lagoon surface have to be removed. The second reason is the
discharge from the abattoir. Abattoir’s sewage is composed of high blood content and has an impact
on poor effluent quality. The poor quality of WWTP discharge in Figure 16 was presented in the
Green Drop Report of 2014.

Natacha Martin – Mémoire de fin d’études
Promotion Paris 2014-2017
32
Figure 16: A) Zeerust WWTP compliance in 2012 - 2013 [23], B) E. Coli analysis in Zeerust WWTP discharge [26], C)
COD analysis in Zeerust WWTP discharge [26], D) Ammonia analysis in Zeerust WWTP discharge [26], E) Nitrate
analysis in Zeerust WWTP discharge [26], F) Suspended Solids analysis in Zeerust WWTP discharge [26].
Figure 16 shows that the discharge of Zeerust WWTP is not compliant to the standards. But, the quali-
ty is improving during the rainy season because the raw sewage is diluted. Zeerust WWTP pollutes
Kareespruit River which is flowing to Klein-Maricopoort Dam. The priority for improving the dis-
charge quality is the management and the maintenance. Moreover, industries should have their own
pre-treatment for sewage.
2.4. Wastewater treatment plants of the Department of Public Works
Two wastewater treatment plants of border posts are located in the RTBAA. These treatment plants
depend on the Department of Public Works of South Africa and treat small quantity of wastewater
[27].
In Skilpadshek Border Post, the treatment is realized in reed beds. The wastewater treatment plant is
effective since 2008 and presents good compliance from the Green Drop Report [27]. Domestic
wastewater treated comes from the border post and the military base.
There is also a wastewater treatment plant in Swartkopfontein Border Post. It was designed for domes-
tic wastewater coming from the border post and the military base. The treatment process is oxidation
ponds and the outflow is compliant between 95 and 100% of the standards [28].

Natacha Martin – Mémoire de fin d’études
Promotion Paris 2014-2017
33
3. Conclusion
The settlements not mentioned in the RTBAA are villages with a small population which is using es-
sentially pit latrines or VIP. The impact they have on the aquifer pollution is not significant compare
to the major settlements. A summary table of the different types of sanitation facilities in the RTBAA
and their efficiency can be found in Appendix 9 for further information.
Figure 17 shows a map with the delineation of the area where data on sanitation is reliable. In green is
the area with a comprehensive knowledge of sanitation conditions. Wastewater treatment plants are
categorised according to their impact on the environment.
Figure 17: Map of the area with comprehensive knowledge of sanitation conditions.
Sanitation facilities are grouped by indicators of pollution in Table 5: place of discharge, wastewater
quality, percentage of on-site sanitation and climate impact. It gives an overview of the sanitation chal-
lenges in the area extracted from the current status of sanitation.
Settlements WWTP facilities Discharge Wastewater quality Percent of on-
site sanitation Climate impact
Gaborone
Glen valley and
Gaborone ponds Ngotwane river High in heavy metal
35%
Tlokweng Technical Sportsfield

Natacha Martin – Mémoire de fin d’études
Promotion Paris 2014-2017
34
Training Centre
Saint Joseph’s Col-
lege Gaborone Dam
Mokolodi Game
Reserve Wetland
Kanye
Adventist Hospital Gardens
80%
Kanye Prison Vegetable garden
Kanye Education
Centre Infiltration High in COD
No outflow during dry
season
Ramatea College Wetland
NAFTEC Wetland No data
Seepapitso School Kanye river Overflow of raw
sewage
Ramotswa
Ramotswa
Ngotwane river
High in COD, SS,
nitrate 40%
No outflow during dry
season &
high groundwater table
during wet season Swartkopfontein
Border
Otse
Otse Police College Gardens Overflow of raw
sewage 80%
High groundwater table
during wet season Otse Moeding Col-
lege Sportsfield
Lobatse
BMC Spillage in Peleng
river
Overflow of raw
sewage
38% High groundwater table
during wet season Lobatse Ngotwane dam High in COD, SS,
nitrate
Skilpadshek Border No outflow
Lehurutshe Lehurutshe Ngotwane dam High in E.Coli,
COD, nitrate
94% (compare
to South Afri-
can population
of the RTBAA)
Evaporation of
wastewater treated during
dry season
Zeerust Zeerust Klein Maricopoort
dam
High in E.Coli,
COD, SS, nitrate 5%
Table 5: Statement of sanitation in the RTBAA.
III. Challenges
In the sanitation assessment, some challenges are identified. Sanitation pollution depends on the place
of discharge and population density, priority areas have to be defined. Moreover, many wastewater
treatment plants treat domestic and industrial wastewater. Some are not adapted for industrial
wastewater treatment. Then, wastewater treated is not compliant to the standards and pollutes the envi-
ronment, particularly the Ngotwane river. In fact, Ngotwane river is mostly supplied by wastewater
discharge of Lobatse, Lehurutshe, Ramotswa and Gaborone. This river is a transboundary river and a
triggering factor for transboundary pollution.

Natacha Martin – Mémoire de fin d’études
Promotion Paris 2014-2017
35
On-site sanitation facilities are also involved in sanitation pollution by infiltration process. The aquifer
is recharged by rainfall, wastewater discharge and infiltration from pit latrines. Water balances and
climate conditions play a part in sanitation pollution. During wet season, the recharge is higher than
during dry season and increases the level of the water table. So, the aquifer is more vulnerable during
the wet season.
1. Vulnerability to pollution of the aquifer and priority areas
The potential vulnerability of an aquifer to pollution depends to its characteristics and human activi-
ties. Ramotswa Transboundary Aquifer is an unconfined aquifer which does not have a cover of im-
permeable material and is susceptible to contamination. The primary protection against groundwater
pollution is the soil overlying the water table. Staudt [29] and Alemaw et al. [30] had already studied
some parts of the study area by a GIS approach. In this case, to estimate the possible pollution of
groundwater, modelling the study area was realized. Saturated zone permeability, aquifer characteris-
tics, climate change, topography, human activities and wastewater facilities were included in model-
ling [31]. The chosen method is the DRASTIC method with ArcGIS [32].
1.1. DRASTIC Method
The DRASTIC method was developed by US EPA. It provides a basis for evaluating the vulnerability
pollution of groundwater resources based on hydrogeological parameters. Moreover, the DRASTIC
method can be considered as an approach to evaluate an area based on known conditions without the
need for extensive site specific pollution data. By this modelling, an inexpensive method to identify
areas that need more investigation was provided.
For using the DRASTIC method, some conditions have to be respected, such as:
- Contamination occurs at the ground surface,
- The contaminant enters the water table when rain falls on the surface and percolates into the
saturated zone,
- The contaminant travels with water, at the same rate as water,
- The method will be applied to no greater than 40 hectares,
- The aquifer is unconfined.
The DRASTIC method can be defined by the parameters used in the index [33]. The parameters are
presented below:
- Depth to groundwater: the depth from the ground surface to the water table in unconfined aq-
uifer.
- Recharge: the total quantity of water which is applied to the ground surface and infiltrates to
reach the aquifer. It is calculated from the rain and evaporation data in the study area.
- Aquifer media: the thickness of consolidated or unconsolidated rock which characterizes the
top of the aquifer.
- Soil media: the uppermost portion of the vadose zone characterized by significant biological
activity.
- Topography: the slope of the land surface.
- Impact of the vadose zone: the zone above the water table which is unsaturated or discontinu-
ously saturated.

Natacha Martin – Mémoire de fin d’études
Promotion Paris 2014-2017
36
- Conductivity: the ability of the aquifer materials to transmit water.
Each parameter is assigned a rate and a weight. The method to calculate the DRASTIC index is de-
scribed below:
𝐷𝑅𝐴𝑆𝑇𝐼𝐶 𝐼𝑛𝑑𝑒𝑥 = 𝐷𝑟 × 𝐷𝑤 + 𝑅𝑟 × 𝑅𝑤 + 𝐴𝑟 × 𝐴𝑤 + 𝑆𝑟 × 𝑆𝑤 + 𝑇𝑟 × 𝑇𝑤 + 𝐼𝑟 × 𝐼𝑤 + 𝐶𝑟 × 𝐶𝑤
In this equation, r is the rating for the parameter which ranges between 1 to 10, and w is an assigned
weight for the parameter varying between 1 to 5 [32; 34].
DRASTIC Parameters Weight of parameters
Depth to groundwater 5
Recharge 4
Aquifer media 3
Soil media 2
Topography 1
Impact of the vadose zone 5
Conductivity 3 Table 6: Weight of parameters for the DRASTIC method.
Each of the parameters in the model is grouped into ranges of values or broad categories that are as-
signed a rate from 1 to 10. There are presented below.
1.2. Depth to groundwater: groundwater head elevation
The raster was given in the Ramotswa database, led by IGRAC International Groundwater Resources
Assessment. The piezometric map has been produced following the water level collected during the
fieldwork campaign conducted from the 25th – 29
th of August 2016 and from the 1
st – 5
th September
2016 in both South African and Botswana sides on 33 boreholes. Water level is between 998 mamsl
and 1403 mamsl which mean that the depth of the water table varies between 7 and 67 m from the
surface. These results can change because the fieldwork campaign was realized twice at the end of the
dry season when the water table is lower. A classification is attributed for the depth of the water table
in Table 7.
Depth of the water table m Classification Depth of the water table m Classification
100 m and more 1 15 to 20 6
50 to 100 2 10 to 15 7
40 to 50 3 5 to 10 8
30 to 40 4 2.5 to 5 9
20 to 30 5 0 to 2.5 10 Table 7: DRASTIC classification of the water table depth.
Groundwater level helps to calculate the flow direction. The flow direction is presented in Figure 18.

Natacha Martin – Mémoire de fin d’études
Promotion Paris 2014-2017
37
Figure 18 : Flow direction in the Ramotswa Transboundary Aquifer.
This map represents groundwater flow within the aquifer to be initially in north and later in north –
easterly direction.
1.3. Recharge: rainfall and evaporation
The recharge capacity has been calculated with the rainfall and evaporation data from 1988 to 2016.
Records from six stations were used. There are three stations in Botswana and three stations in South
Africa, such as presented below in Figure 19.

Natacha Martin – Mémoire de fin d’études
Promotion Paris 2014-2017
38
Figure 19: Location map of rainfall and evaporation stations.
Rainfall and evaporation have been interpolated in the study area [35]. The recharge has been calculat-
ed by subtracting the evapotranspiration to the rainfall per pixel for the dry season and the rainy sea-
son, according to the following equation:
𝑅𝑒𝑐ℎ𝑎𝑟𝑔𝑒 = 𝑅𝑎𝑖𝑛𝑓𝑎𝑙𝑙 − 𝐸𝑣𝑎𝑝𝑜𝑡𝑟𝑎𝑛𝑠𝑝𝑖𝑟𝑎𝑡𝑖𝑜𝑛 − 𝑅𝑢𝑛𝑜𝑓𝑓
Runoff is overlooked for the recharge. Evapotranspiration has been calculated by using evaporation
and pan coefficient from the DWA in Appendix 11 [36]. The dry season is from April to September.
Contrary to the dry season, the rainy season is from October to March. The recharge, calculated for
both season, is sometimes negative. These results are scientifically impossible because it cannot evap-
orate more water than it is present. This is explained by the simplicity of the recharge calculation in
which effective rainfall is not included. Recharge results have been classified for the DRASTIC meth-
od from 0 mm to 190 mm. Negative data has been changed in null data. The classification is presented
in Table 8. Higher is the category number, more the infiltration and pollution is possible.
Recharge mm Classification Recharge mm Classification
0 to 19 1 95 to 114 6
19 to 38 2 114 to 133 7
19 to 57 3 133 to 152 8
57 to 76 4 152 to 171 9
76 to 95 5 171 to 190 10 Table 8: DRASTIC classification of the recharge.
It sounds logical to predict that the aquifer is more vulnerable to wastewater during the wet season
because infiltration is more important and the water table is higher. But, it is interesting to assess how
much the aquifer is more vulnerable during the wet season than during the dry season.

Natacha Martin – Mémoire de fin d’études
Promotion Paris 2014-2017
39
1.4. Aquifer media: thickness between the top of the aquifer and the surface
To create the thickness map, files from the RIMS database were used. For a better understanding of
the aquifer, top, bottom, depth, thickness and groundwater head elevation files were studied. Records
from these files were selected to create the thickness between the top of the aquifer and the surface. It
was obtained by subtracting the top of the aquifer to surface elevation. Values are classified on a scale
from 0 to 10 for a thickness between 0 and 450 m in Table 9.
Thickness m Classification Thickness m Classification
100 m and more 1 15 to 20 6
50 to 100 2 10 to 15 7
40 to 50 3 5 to 10 8
30 to 40 4 2.5 to 5 9
20 to 30 5 0 to 2.5 10 Table 9 : DRASTIC classification of thickness.
1.5. Soil media: Land cover map
Landcover maps of Botswana and South Africa have been issued by the EarthEnv project
(http://earthenv.org). The datasets integrate multiple global remote sensing-derived land-cover prod-
ucts and provide consensus information on the prevalence of 12 land-cover classes at 1 km resolution
[37].
The reduced version of the consensus land-cover datasets was used. It is the dataset integrating three
products, such as:
- GlobCover, 2005-6; v2.2,
- MODIS land-cover product, MCD12Q1; v051,
- GLC2000, global product; v1.1.
Each dataset contains twelve data layers, each provides consensus information on the prevalence of
one land-cover class. All data layers contain unsigned 8-bit values and the valid values range from 0-
100, representing the consensus prevalence in percentage. All data layers have a spatial extent from 90
N – 56 S and from 180 W – 180 E, and have a resolution of 30 arc-second per pixel.
The twelve data layers downloaded are:
- Evergreen/Deciduous Needle leaf Trees,
- Evergreen Broadleaf Trees,
- Deciduous Broadleaf Trees,
- Mixed/Other Trees,
- Shrubs,
- Herbaceous Vegetation,
- Cultivated and Managed Vegetation,
- Regularly Flooded Vegetation,
- Urban/Built-up,
- Snow/Ice,
- Barren,
- Open Water.

Natacha Martin – Mémoire de fin d’études
Promotion Paris 2014-2017
40
In the Ramotswa Transboundary Aquifer Area, the land covers such as evergreen/deciduous needle
leaf trees, evergreen broadleaf trees and snow/ice are not found. Wastewater treatment facilities have
been added to the land cover map.
A scale of pollution was attributed for the different land covers between 1 and 10. 10 is the land cover
with the most human impact pollution and 1 the less polluted. Sanitation activities are the indicator
chosen because it is more representative for possible pollution of the aquifer.
The scale is presented below:
- 2 : barren,
- 4 : vegetation such as broadleaf trees, mixed trees, shrubs, herbaceous vegetation and regular-
ly flooded vegetation,
- 6 : open water,
- 7 : evaporation ponds and wastewater treatment facilities,
- 8 : cultivated and managed vegetation,
- 10 : urban built-up.
Every land cover raster was combined to have one final land cover map. But in some pixels, it is pos-
sible to find different types of land cover. For these ones, the kept value of the pixel is the highest one.
Wastewater treatment facilities have a lower indicator compare to cultivated vegetation because agri-
cultural activities are also a factor of nitrate pollution. Moreover, urban built-up has the highest indica-
tor because it represents areas with pit latrines unmanaged.
1.6. Topography: slope
The slope map was created because it is one of the key factor for infiltration in the aquifer. In fact,
lower is the slope, higher is the infiltration rate. The slope was extracted from the Digital Elevation
Model provided by the IGRAC. Its classification is available in Table 10.
Slope % Classification Slope % Classification
80 – 100 % 1 30 – 40 % 6
70 – 80 % 2 20 – 30 % 7
60 – 70 % 3 10 – 20 % 8
50 – 60 % 4 5 – 10 % 9
40 – 50 % 5 0 – 5 % 10 Table 10: DRASTIC classification of slope.
1.7. Impact of the vadose zone: permeability of the unsaturated zone
The vadose zone has been studied with the geological maps available from the Department of Geolog-
ical Survey Botswana and Council for Geoscience of South Africa. The different type of rocks has
been classified according to their permeability capacity. Higher is the class, higher is the scale perme-
ability chosen.
Type of soil Comments Permeability scale – Clas-
sification
Alluvium Sand 10
Banded Ironstone Composed of shales and chert 2
Breccia Sandstone and conglomerate 8
Chert-free dolomites Type of limestone 10

Natacha Martin – Mémoire de fin d’études
Promotion Paris 2014-2017
41
Chert-rich dolomites Type of limestone 10
Dolerite Volcanics 4
Dolomite Similar to limestone 10
Granite 6
Gneiss 4
Limestone 10
Marl Mudstone 2
Quartzites Sandstone 8
Sandstone 8
Shales Mudstone 2
Siltstone Silt 8
Volcanics 4 Table 11 : DRASTIC classification of the permeability rocks in the vadose zone [38].
1.8. Conductivity: hydraulic conductivity
The hydraulic conductivity map was extracted from the results of airbone geophysical survey, led by
the company XRI – blue in August 2016. Some of these data are still uncertain. Classification is avail-
able in Table 12.
Hydraulic conductivity m.s-1
Classification Hydraulic conductivity m.s-1
Classification
0 – 2.5 2 7.5 – 10 8
2.5 – 5 4 10 – 12.5 10
5 – 7.5 6 Table 12: DRASTIC classification of hydraulic conductivity.
1.9. Results
Two vulnerability maps were obtained: one during the dry season from April to September, and one
during the rainy season from October to March. They are presented in Figure 20.
Figure 20 : Vulnerability map for groundwater pollution: A. during the rainy season from October to March; B.
during the dry season from April to September.

Natacha Martin – Mémoire de fin d’études
Promotion Paris 2014-2017
42
In Figure 20A, from October to March the groundwater vulnerability map indicates that 0% of the area
has very low vulnerability, 4 % has low vulnerability, 44.1 % is moderately vulnerable, 48.8 % is
highly vulnerable and 3.1 % is very highly vulnerable. In contrast, from April to September, the Figure
20B shows that 16.1% of the area has very low vulnerability, 45.1 % has low vulnerability, 36.3 % is
moderately vulnerable and 2.5 % is highly vulnerable.
The most vulnerable area for groundwater pollution is located on the border area from Lobatse to Ra-
motswa, ten kilometers from the border on both sides. In conjunction with the aquifer flow direction
map in Figure 18, pollution coming from south is flowing to north and contaminates dams and well-
fields.
To conclude, Ramotswa Transboundary Aquifer Area is highly vulnerable to pollution if it is not
properly managed for wastewater. However, the interpretation of the results has to be cautious due to
the sparse and uncertain nature of the basic data used for this interpretation and the availability of the
aquifers parameters.
2. Industrial pollution
Most of the wastewater treatment plants in the RTBAA treat domestic and industrial wastewater. For
example, the sewage treatment plant in Gaborone treats industrial discharge from breweries, food in-
dustries, abattoirs, pharmaceutical companies, and soap manufacturing companies [39; 40; 41]. In
some cases, industrial wastewater increases significantly COD, BOD and suspended solids. Higher
concentration of heavy metal in sludge is also a consequence of industrial discharge. Figure 21 is a
map of biggest industrial activities in the RTBAA.
Figure 21: Map of biggest industrial activities in the RTBAA.

Natacha Martin – Mémoire de fin d’études
Promotion Paris 2014-2017
43
Gaborone has the biggest industrial activities. Lobatse is known for the national abattoir, Botswana
Meat Commission. Other industries are located in Lobatse such as tannery, clay works, sugar industry,
and hospitals. The sewage network in Ramotswa treats industrial wastewater from hospital, food in-
dustries (Bolux Milling and Higro Feeds), glass works, and steel and iron industry. In Zeerust, the
industrial activity is composed of an abattoir, tannery and a hospital. At last, Kanye has a food indus-
try. Table 13 informs the pollutants which are present in different types of industrial wastewater.
Food Industry Abattoir Tannery Hospital Heavy metal
industry
Pharmaceutical
industry Sugar industry
Po
llu
tan
ts
COD, BOD, oil
and grease,
nitrogen, phos-
phorus, deter-
gent/cleaning
products [47,
48]
Phosphorus,
nitrogen, TOC,
COD, SS, BOD,
heavy metal,
disinfectant,
pharmaceuti-
cals [55, 56, 57]
Sulphide, chro-
mium, volatile
organic com-
pounds, solid
waste, SS,
COD, BOD [52,
54]
Antibiotics, io-
dinated contrast
media, estrogens
(E1, E2, E3,
EE2), cytostatic
agents, COD [45,
46]
Heavy metal
(iron, lead,
zinc), acid, oil
and grease,
COD [50]
Endocrine dis-
rupting substanc-
es: natural estro-
gens, synthetic
estrogens, bi-
sphenol A or F
[44]
TDS, COD,
BOD, chloride,
sulphate, oil and
grease [42, 43]
Rec
om
men
dat
ion
s
Adsorption,
coagulation [47,
49]
Coagulation
/flocculation,
electrocoagu-
lation, advanced
oxidation pro-
cesses [55],
UV/H2O2 [56]
Primary sedi-
mentation and
aerobic biologi-
cal treatment or
coagulation,
safe disposal
sludge [53, 54]
Ozonation, ad-
sorption, activated
sludge, membrane
bioreactors, inte-
grated anaerobic-
aerobic fixed film
bioreactor system
[45, 46]
Electroprocess
(electro-
coagulation),
precipitation,
ion exchange
[50]. Possibility
to recycle water
for the industry.
[51]
For non-
biodegradable
compounds:
membrane filtra-
tion, adsorption,
ozonation
For biodegradable
compounds:
activated sludge
(RBC) [44]
Aerobic SBR
treatment pro-
cess [43]
Table 13: Wastewater pollutants from industrial activities.
Recommendations given in Table 13 are different types of treatment which remove specifically pollu-
tants from wastewater with on-site wastewater treatment plant.
3. Surface and groundwater transboundary pollution
As mentioned above, the most vulnerable area for groundwater pollution is located on the border area.
In this part, the aim is to determine if pollution from sanitation in Botswana has an impact on South
Africa water or vice versa.
In the border area, there are different cases of pollution from sanitation facilities which are directly or
indirectly contaminating Ramotswa Transboundary Aquifer, shown in Figure 22. In fact, transbounda-
ry pollution exacerbates by interaction between water surface and groundwater. Surface water and
groundwater systems are connected by three basic ways. First, streams gain water from inflow of
groundwater though the streambed. Then, streams lose water by outflow through the streambed. They
do both depending upon the location along the stream.

Natacha Martin – Mémoire de fin d’études
Promotion Paris 2014-2017
44
Figure 22: Simplified scheme of transboundary pollution in the RTBAA. Not to scale.
Transboundary pollution means that an environmental agreement should be developed between the
two countries affected, such as Botswana and South Africa.
3.1. Surface water pollution
Ngotwane River is a transboundary river. Some wastewater treatment plants are discharging in it and
its tributaries. Lehurutshe, Lobatse and Ramotswa ponds and rainfall constitute the base flow of the
Ngotwane River in the south of the RTBAA. In the north, Gaborone Dam cuts off the flow of water to
the Ngotwane River. When the dam overflows in monsoon period, water re-enters the Ngotwane Riv-
er. The wastewater effluent from Glen Valley ponds feeds the river.
Surface water pollution exists in Lobatse area. Two sources of pollution are identified in Figure 23:
one from the Lobatse WWTP discharge and another one from spillage in the BMC pre-treatment.

Natacha Martin – Mémoire de fin d’études
Promotion Paris 2014-2017
45
Figure 23: A. Identification of surface water pollution in Lobatse area; B. Picture of the stream from Lobatse WWTP
discharge; C. Picture of Peleng River.
Figure 23B is Ngotwane dam tributary with wastewater flowing from Lobatse Wastewater Treatment
Plant, Botswana. The stream flow is about 89 m3.h
-1 with high load of chemical oxygen demand, sus-
pended solids (57 kg.d-1
), free saline ammonia (10 kg.d-1
) and tendency for eutrophication process.
The stream is discharging in the Ngotwane dam where water is used for agriculture and drinking water
for cattle. Figure 23C is Peleng River with overflow and seepage of raw wastewater from Botswana
Meat Commission (BMC) pre-treatment in Lobatse. The stream flow is about 86 m3.h
-1 with high con-
tent of fats and suspended solids. Ten kilometers downstream from Lobatse, the river turns to the east
and flows towards the Ngotwane River, downstream Ngotwane dam.
In the north part of the RTBAA, Mladenov et al. [58] worked on a DO model with different scenarios
to assess the wastewater impacts on the Ngotwane River and to provide an evaluation of the suitability
of the Ngotwane river water for reuse. Glen valley ponds discharge and the artificial wetland in Gabo-
rone Game Reserve are the only sources of water for the river after the Gaborone Dam. Downstream
Glen Valley WWTP in the Ngotwane River, eutrophic conditions were encountered. Some perennial
stream standards of the DWA were not respected for DO, COD, dissolved P and faecal coliforms.
Quality varies with seasons. Scenarios suggest a better quality during winter than summer because of
the low average temperatures of approximately 17°C which produce high DO concentration. In any
case, the Ngotwane river is polluted by wastewater treated.
3.2. Groundwater pollution
Ramotswa Transboundary Aquifer is a karstic aquifer with a shallow water table. Pollutants enter the
karst aquifer easily by layer and sinkhole and spread quickly by covering the area of the karst aquifer
[Appendix 12]. There is no natural attenuation process which makes the karst aquifer more vulnerable
to pollution. Moreover, the groundwater table is high. It was reported water levels vary between 5 and
40 m of depth in the transboundary aquifer [8; 9]. The pit’s depth of on-site sanitation is approximate-

Natacha Martin – Mémoire de fin d’études
Promotion Paris 2014-2017
46
ly 5 m which means pit latrines and the aquifer are in contact. On-site sanitation facilities contaminate
directly the aquifer by percolation. Latrines are not recommended in areas with high water table.
Groundwater flow is to the north, from the South African side in the south of the study, then moves in
a north-easterly direction towards the village of Ramotswa in Botswana. Wellfield monitoring was
undertaken by some studies. Spatial distributions of TDS, E. Coli and total coliforms in groundwater
are presented respectively in Figure 24, 25 and 26.
Figure 24: Spatial distribution of the total dissolved solids in the TBA [59].
Sum of nitrate and nitrite was also sampled in the RTBAA, available in Appendix 13 [59]. Two sites
were identified with high concentration of the sum of nitrate and nitrite. In Supingstad, the concentra-
tion is 45 mg.L-1
, which is higher than the South African guideline limit of 6 mg.L-1
. The second site is
in Ramotswa with a concentration of 99.9 mg.L-1
. Both sites are located in the north-easterly region
where groundwater table is shallow. This pollution comes from on-site sanitation infiltration. Biologi-
cal decomposition of nitrate in the soil from sanitation is shown
in Figure 25.
Figure 25: The fate of nitrate from sanitation in the environment.

Natacha Martin – Mémoire de fin d’études
Promotion Paris 2014-2017
47
Figure 26: Spatial distributions of E.Coli and total coliforms,
respectively on the left and on the right [59].
Spatial distributions of E.coli and total coliforms show high concentration rate in Ramotswa and
Ngotwane. High concentration in Ramotswa is logical because of the high population density, use of
pit latrines and north-easterly groundwater flow. Near Ngotwane dam, density population using pit
latrines is lower than in Ramotswa. On-site sanitation is not the only source of pollution. Infiltration
from the river bed is considered. In fact, fairly regular groundwater recharge takes place from Ngot-
wane River and its tributaries. Von Hoyer et al. [60] specify the main valley of Lobatse with high po-
tential but variable groundwater recharge. Recharge depends on the degree of karstification and trans-
missivities [8]. For the dolomite aquifer, transmissivity range varies from 10 m2.d
-1 to up to 400 m
2.d
-1
[61]. Outflow from wastewater treatment plant is a source of pollution for the Ramotswa Transbound-
ary Aquifer.
4. Water balances
Water balance is one of the tools to understand the impact of sanitation on the Ramotswa Transbound-
ary Aquifer. Figure 27 shows inflow and outflow.

Natacha Martin – Mémoire de fin d’études
Promotion Paris 2014-2017
48
Figure 27: Scheme of water balances in the RTBAA.
Infiltration from on-site sanitation, grey water unmanaged, leakages on sewage network and non-
compliant discharge from wastewater treatment plant are pollutants for the aquifer. Their quantity
relies on the water supply and their quality depends on the facilities efficiency.
From the water supply, wastewater treated in WWTP and wastewater flowing to on-site sanitation are
estimated. The quantity is based on the water consumption per capita in major villages between 1998
and 2008, extracted from Botswana Water Statistics [62]. Percentage of household connected to sew-
age network is used to determine the quantity of wastewater treated in WWTP [3; 5]. The consump-
tion of water in township and rural areas includes a range between 5L.d-1
.person-1
and 60L.d-1
.person-1
.
Details are available in Appendix 10.
Figure 28: Scheme of the water consumption and wastewater according to their sanitation facilities in the RTBAA.
Compare to the design capacity of plants, wastewater treated in WWTP corresponds to these results.
Figure 29 presents a range of possible losses on sewage networks.

Natacha Martin – Mémoire de fin d’études
Promotion Paris 2014-2017
49
Figure 29: Range of losses on the sewage network in the RTBAA.
Sewage network has a life time of thirty years. Some pipes have fails but there is no maintenance on
leakage. Maintenance on sewage network is a challenge because it prevents direct infiltration of raw
wastewater in the aquifer.
Wastewater from on-site sanitation facilities percolates to the aquifer with a rate of 10 L.m-2
.d-1
[63].
A range of wastewater infiltrating from on-site sanitation and grey water unmanaged is presented in
Figure 30. It was calculating by using the sludge accumulation rate in latrines in wet conditions, a
range of water consumption [64] and the quantity of wastewater going to areas which sanitation facili-
ties are mainly on-site sanitation.

Natacha Martin – Mémoire de fin d’études
Promotion Paris 2014-2017
50
Figure 30: Unmanaged grey water and wastewater infiltrating from on-site sanitation in the RTBAA.
For household relying on on-site sanitation, the water consumption is lower than for household con-
nected to sewage network because of the way of living and the economy. Range of wastewater infil-
trating involves domestic wastewater, which means grey water and black water. For pit latrines and
VIP, pits contain just black water. In this case, grey water is disposed of into the environment. If the
household is connected to a septic tank, grey water and black water are stored in the tank. Moreover,
the rate of sludge accumulation used is the same for every area. No information on cleansing materials
was found, so the basic rate of sludge accumulation has been chosen (0.05 m3/person/year). A lower
rate of sludge accumulation increases the quantity of wastewater infiltrating the soil.
For the towns of Kanye, Ramotswa and the rural areas, most of on-site sanitation facilities are not
maintained. In fact, no data is available on the maintenance of on-site sanitation. When the pit is full, it
is covered and a new pit latrine is built. Some people use chemicals to decompose the sludge.
5. Climate change
Climate change is studied to determine how it is affecting the wastewater quality and the environmen-
tal pollution. In the RTBAA, climate is divided in two seasons: the wet season from October to March
and the dry season from April to September. The region knows a drought period which can be attribut-
able to climate change. Botswana Department of Meteorological Services and the Hydrological Ser-
vice of the Department of Water and Sanitation of South Africa provided long term rainfall and evapo-
ration records which demonstrate drought trends in the area.
Average monthly rainfall is calculated from 1988 to 2016 with the Thiessen method on 6 stations. In
contrast, because evaporation data is not available in the Botswana side, average monthly evaporation

Natacha Martin – Mémoire de fin d’études
Promotion Paris 2014-2017
51
is calculated on the same period as rainfall with the Thiessen method on 3 stations located in South
Africa.
Long term rainfall and evaporation records are in Figure 31. If the calculation of recharge explained
above in III.1.3. is closed to zero, it means the RTBAA is in a drought area. But from August to De-
cember, recharge is lower than during the rest of the year, the climate is drier. The driest month is
October [Appendix 14]. The average calculation of natural recharge during 29 years is 4 mm. In the
nineties, the calculation is very lower than this value, it was an important drought period. However,
this small value shows that even the wet season is not enough important to recharge the groundwater
resource.
Figure 31: Annual average natural recharge.
Trends of the both seasons change over the last 30 years, particularly for the minimums and the maxi-
mums. Rainfall and evaporation total are grouped by season and percentiles, respectively in Figure 32
and Figure 33. By a regression analysis, the trends of the seasons are determined. The model p is be-
low 0.001 and the adjusted R² is 90% [Appendix 15]. In fact, the wet season’s upper 10th percentile of
rainfall and evaporation are stable. The dry season’s upper 10th percentile of evaporation is getting
drier over time. But both seasons’ lower 10th percentiles are getting drier which means more drought.
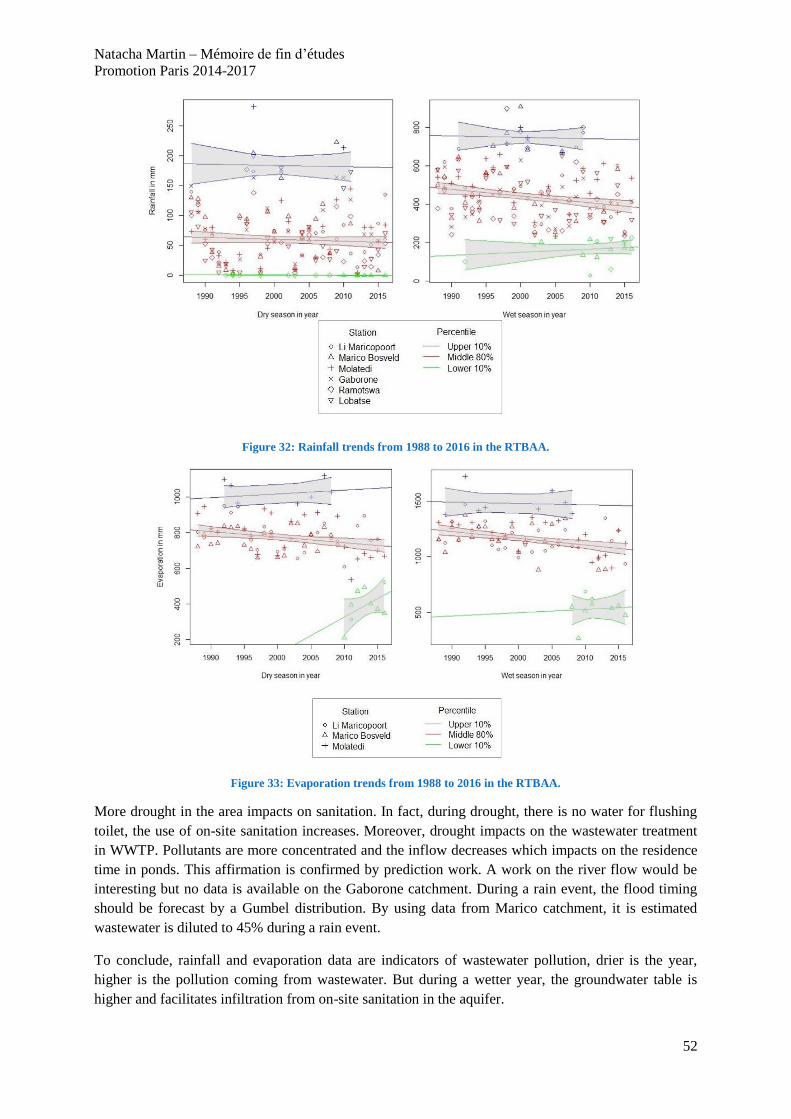
Natacha Martin – Mémoire de fin d’études
Promotion Paris 2014-2017
52
Figure 32: Rainfall trends from 1988 to 2016 in the RTBAA.
Figure 33: Evaporation trends from 1988 to 2016 in the RTBAA.
More drought in the area impacts on sanitation. In fact, during drought, there is no water for flushing
toilet, the use of on-site sanitation increases. Moreover, drought impacts on the wastewater treatment
in WWTP. Pollutants are more concentrated and the inflow decreases which impacts on the residence
time in ponds. This affirmation is confirmed by prediction work. A work on the river flow would be
interesting but no data is available on the Gaborone catchment. During a rain event, the flood timing
should be forecast by a Gumbel distribution. By using data from Marico catchment, it is estimated
wastewater is diluted to 45% during a rain event.
To conclude, rainfall and evaporation data are indicators of wastewater pollution, drier is the year,
higher is the pollution coming from wastewater. But during a wetter year, the groundwater table is
higher and facilitates infiltration from on-site sanitation in the aquifer.

Natacha Martin – Mémoire de fin d’études
Promotion Paris 2014-2017
53
IV. Recommendations and opportunities
1. On-site sanitation improvement
1.1. Recommendations for on-site sanitation
Pit latrines are one of the most common human excreta disposal systems in low-income regions. Their
use is on the rise as countries aim to meet the sanitation-related target of the Millennium Development
Goals, as Botswana and South Africa. But, pit latrines are a concern with the discharge of microbial
and chemical contaminants to groundwater which may negatively affect human health.
Pit latrines, VIP and septic tanks function by infiltrating liquid waste into the surrounding soil. Pollu-
tion from latrines takes two forms: bacterial and chemical. Bacterial pollution is usually quickly ren-
dered harmless by natural processes in the soil. Provided the bottom of the pit is more than 2 metres
above the water-table, bacterial pollution of the groundwater is highly unlikely. But the RTBAA is
characterized by a shallow water table and fractured hard rock aquifer [65], as a study site in India
where high concentrations of faecal coliforms were found in domestic wells located near pit latrines
and septic tanks [66]. During the wet season, water table can reach pits. In this case, an alternative has
to be found. Moreover, a safe distance of 75 metres between on-site sanitation and groundwater ab-
straction points has to be respected [67].
Chemical pollution is predominately nitrogenous and can increase the level of nitrates in the ground-
water. Consumption of high concentrations of nitrate in drinking water is known to cause methemo-
globinemia syndrome in humans. Chemical pollution is more potentially harmful than bacterial pollu-
tion because it lasts longer, travels further and is more difficult to remove.
The potential pollution from pit latrines is also affected by social factors, as latrine use, latrine densi-
ties, maintenance and groundwater pumping. Contamination can be influenced by latrine type, design,
materials and construction quality.
Different recommendations can be given for minimizing latrine effects on groundwater quality. Re-
views suggest to discourage installing pit latrines in rocky areas with shallow water table but latrines
are the cheapest and easiest way of sanitation. Parameters such as the depth of the water table, soil
characteristics and rock strata should be considered prior to install pit latrines. Some alternatives are
proposed and presented in Table 14 as:
- Upgrading latrines in rural areas as raised VIP latrines,
- Upgrading latrines in urban areas as alternative twin-pits VIP latrines,
- Maintaining septic tanks in areas where a maintenance service exists.
Raised VIP Latrines Alternative twin-pits VIP latrines
Area Rural Urban
Design
Raised portion of the pit sur-
rounded by a mound of soil
Small free space at the top of
the pit: 0.5 m
2 Rectangular pits lined
Reinforced cover slab (80 mm
thick) in 8 sections: 2 central with
apertures for vent pipes and 6 re-

Natacha Martin – Mémoire de fin d’études
Promotion Paris 2014-2017
54
Rectangular concrete ring
beam, the top of the ring beam
reinforced by single central 8
mm diameter mild steer bar
Vent pipe
Round spiral structure
moval for emptying
Vent pipe for each pit
One superstructure
Calculation
of the effec-
tive volume
𝑉(𝑚3) = 𝑟𝑎𝑡𝑒 𝑠𝑙𝑢𝑑𝑔𝑒 𝑎𝑐𝑐𝑢𝑚𝑢𝑙𝑎𝑡𝑖𝑜𝑛 ×𝑝𝑒𝑜𝑝𝑙𝑒
ℎ𝑜𝑢𝑠𝑒ℎ𝑜𝑙𝑑× 𝑛𝑢𝑚𝑏𝑒𝑟 𝑜𝑓 𝑦𝑒𝑎𝑟 𝑏𝑒𝑓𝑜𝑟𝑒 𝑒𝑚𝑝𝑡𝑦𝑖𝑛𝑔
Rate sludge accumulation used for dry conditions: 0.06 m3/people/year
Dislodge
During dry season, every year by the
maintenance service with vacuum tank-
er
During dry season, every 2 years for each
pit by the maintenance service with vacu-
um tanker
Pit life ± 15 years ± 10 years
Costs
Investment: 70 $ with skilled
labor for building
Maintenance: 31 $/year
Total cost: 36 $/year
Investment: 100 $ with skilled la-
bor for building
Maintenance: 63 $/year
Total cost: 73 $/year
Advantage
Deal with shallow water table:
Pit excavated as deep as possi-
ble
Artificial unsaturated zone (use
fine sand) to a depth of at least
800 mm
For urban areas with > 300 peo-
ple.ha-1
2 separate pits for alterning when
one is full
Pit less than 1m depth
Disadvantage
Dry pit: biodegradation process slower
in dry conditions, rate of sludge accu-
mulation = 0.06 m3/people/year
Dry pit: biodegradation process
slower in dry conditions, rate of
sludge accumulation = 0.06
m3/people/year
Price higher than for simple pit Table 14: Details of on-site sanitation improvement [63; 68; 69; 70].
The volume of the pit increases of 50% if population uses cleansing materials. Moreover, some details
might be added to these two types of latrines, such as:
- painting latrine ventilation tubes black to increase daytime ventilation rates,
- increasing the pH of latrine contents to increase ammonia volatilization,
- sealing pits to prevent nitrate leaching and promote denitrification,
- diverting urine for use as a fertilizer for deep-rooted crops.
Some septic tanks are still used in the RTBAA. For example, Kanye administration quarter relies on a
septic tank. Because of the poor ground conditions, these are to be reinforced. Septic tank can be kept
where there are maintenance services. This system has to be checked and the design done by an engi-
neer, it is quite important for the efficiency. It needs to be used in an area where there is water re-
striction to flush.
Emptying has to be done by vacuum tankers and not manually because of pathogens. One of the in-
convenient of vacuum tankers is the maintenance: it must be kept running all day. For this, manage-
ment and supervision of emptying services have to be developed. The solution proposed needs the
investment in 10 vacuum tankers for South Africa and 40 vacuum tankers for Botswana. A tanker life
is around three years and the maintenance costs 30000 $ per tank per year [63]. The investment in
maintenance services has been included in the cost of the solution proposed.

Natacha Martin – Mémoire de fin d’études
Promotion Paris 2014-2017
55
To install on-site sanitation improvement, awareness session for population has to be organized. Spe-
cifically for women who are responsible of sanitation facilities because they clean and maintain it.
They are also responsible for the security aspects for their children. Inappropriate design precludes
young children from the use of the facility. Women’s opinion in the choice of technology is essential
to a successful upgrading of sanitation facilities. Without their approval, all systems will fail to reach
the stated objectives of the programme [71].
1.2. Grey water management
Greywater is the wastewater collected from household activities except toilet wastewater. Household
using pit latrines or VIP discharges its greywater untreated into the environment. Greywater corre-
sponds to kitchen, laundry, and bathroom wastewater and represents 70% of domestic wastewater.
They are concentrated in BOD, COD, phosphorous, oil and grease, surfactants and coliforms [72; 73].
Their discharge without adequate treatment contributes to surface and groundwater pollution. After
treatment, greywater can be used for agricultural and gardening application.
To reuse greywater, the system design must consider public health risk, greywater chemical properties,
prevention of pollution of soil and water and reuse purpose. Household with no greywater manage-
ment and using on-site sanitation have low income. An easy and cheap way of domestic greywater
treatment is recommended. The greywater tower garden was already applied in the Gauteng Province,
South Africa. A primary treatment with a grease and grit trap can be installed. The structure of the
greywater management system consists of poles and shading material surrounding soil and a central
stone-packed drain, presented in Figure 34. The water flow thoughout the column is spread because of
the stones. Into the slits, leafy vegetables such as spinach are planted. On top of the column, tomatoes
and onions may be planted. Two to three buckets of greywater are needed per day to prevent the soil
from drying out. A puddle on the top of the column means an excess of water. This kind of greywater
management is adapted for bath, shower, laundry and kitchen wastewater. The tower should be fenced
in if free animals share the same space. It is not recommended to consume raw harvested vegetables.
Figure 34: Scheme of greywater management column [74].

Natacha Martin – Mémoire de fin d’études
Promotion Paris 2014-2017
56
For greywater just coming from bath and shower, the greywater may be stored in drum dugs and di-
rectly reused for gardening crops. This method was applied in a vegetable gardening area of 150 m at a
clinic in Lobatse. The garden was only irrigated with water from sink and hand washing for a period
of one year. Water used for washing drug containers and equipment for medical tests was not reused.
This method shows successful results on plants [75].
2. Wastewater treatment efficiency
2.1. Improvement of wastewater treatment efficiency
Wastewater treatment processes available are not adapted to treat specifically industrial wastewater. A
pre-treatment system should be established for every industrial activity. Moreover, the incompliance to
the standards for treated wastewater comes from the lack of knowledge, maintenance and monitoring.
Recommendations are given for the maintenance of the wastewater treatment plants and for the moni-
toring of sanitation.
2.1.1. Maintenance of wastewater treatment plants
Only wastewater treatment plants which have highly risk of pollution for the environment, mentioned
in Figure 17, are approached in this part. These recommendations can be also applied for all the
wastewater treatment plants in the region. Recommendations are given in Table 15.
Sanitation facili-
ty Issue Recommendation Cost
Ramotswa
WWTP (Waste
Stabilization
ponds)
Not enough inflow, WWTP work-
ing as evaporation ponds and no
respect of the residence time
Upgrade the wastewater lifting
station for the village 2000 USD
Debris floating in the ponds Upgrade the screen with a
smaller space between bars 200 USD
Green maturation pond and bad
treatment efficiency
Site clearing and algae remov-
al of the ponds to maximize
photosynthesis
2500 USD
No record of dislodging and bad
treatment efficiency
Remove sludge:
- Anaerobic pond: every
1 to 2 years
- Facultative pond: eve-
ry 10 years,
- Maturation pond: eve-
ry 15 years
30000
USD
Lobatse WWTP (Waste Stabiliza-
tion ponds)
Debris floating in the ponds Upgrade the mechanical screen 40000
USD
Green maturation pond and bad
treatment efficiency
Site clearing and algae remov-
al of the ponds to maximize
photosynthesis
2000 USD
No records of dislodging and bad
treatment efficiency
Remove sludge:
- Anaerobic pond: every
1 to 2 years
- Facultative pond: eve-
ry 10 years,
30 000
USD

Natacha Martin – Mémoire de fin d’études
Promotion Paris 2014-2017
57
- Maturation pond: eve-
ry 15 years
No fence Secure the perimeter with
fences 4500 USD
Lehurutshe
WWTP (Waste
Stabilization
ponds)
Green maturation pond and bad
treatment efficiency
Site clearing and algae remov-
al of the ponds to maximize
photosynthesis
500 USD
No records of dislodging and bad
treatment efficiency
Remove sludge:
- Anaerobic pond: every
1 to 2 years
- Facultative pond: eve-
ry 10 years,
- Maturation pond: eve-
ry 15 years
35000
USD
No fence Secure the perimeter with
fences 1500 USD
Zeerust WWTP (Activated
Sludge)
Low dissolved oxygen rate and
degradation of the treatment
Maintenance of aerators, mate-
rial needed such as spanners 200 USD
No proper laboratory for monitor-
ing in the area Upgrade on-site laboratory
200 000
USD
Spillage of raw sewage in the
environment before the inlet
works
Change the raw sewage inlet
pipe 1000 USD
Just one channel for the inlet
works is working
Change the channel sluice gate
valves for inlet works 1000 USD
No disinfection system Upgrade chlorination tank 50 000
USD
No records about waste sludge
lagoon
Remove waste and sludge in
waste sludge lagoon
15000
USD
Deteriorated admin building Upgrade admin building 50 000
USD
No fence Secure the perimeter with
fences 600 USD
Table 15: Recommendations for WWTP with high risk of polluting the environment [25; 26; 76; 77][Appendixes 3; 4;
6; 9].
For waste stabilization ponds, anaerobic and facultative ponds remove BOD and COD compare to the
maturation pond which removes pathogens and nutrients [78]. A good treatment efficiency relies on
the hydraulic retention time into the ponds, presented in Table 16.
Pond BOD removal Pathogen removal Hydraulic retention time
Anaerobic pond 50 to 85% - 1 to 7 days
Facultative pond 80 to 95% - 5 to 30 days
Maturation pond 60 to 80% 90% 15 to 20 days Table 16: Hydraulic retention time and removal in function of type of pond [76].
Anaerobic ponds need a higher pH. Currently, wastewater treated in the ponds in the RTBAA are do-
mestic and industrial wastewater. Industrial wastewater participated to an acidic pH which disrupts
BOD removal [79].
During the wet season, quality of treated wastewater is better than during the dry season. In fact, path-
ogens and organic matters removal depends on the sunlight exposure and temperature which are lower
during the dry season. Moreover, the wastewater is diluted during the wet season because of the rain-
fall which participates to a better wastewater quality [80].

Natacha Martin – Mémoire de fin d’études
Promotion Paris 2014-2017
58
2.1.2. Monitoring Plan
In the RTBAA, Water Utilities Corporation is sampling the outflow of Gaborone, Ramotswa and Lo-
batse WWTPs for pH, temperature, dissolved oxygen, total coliforms, faecal coliforms, Escherichia
Coli and faecal streptococci. These ones are the only quality data available in the area for wastewater.
No quantity data is available. Monitoring services should be developed to improve the sanitation sys-
tems and to follow the proper operation of plants. Measurement and records are parts of this monitor-
ing plan [81; 82]:
- Measurement of inflow and outflow every month during a week day at different time such as
7:00 AM, 10:00AM, 01:00PM, 4:00PM and 7:00PM,
- Quality measurement of the outflow every month for pH, temperature, BOD, COD, phospho-
rus, nitrogen, total coliforms, faecal coliforms and E.Coli,
- Development of a record system with quantity and quality data for sharing information,
- Measurement of the groundwater level every month to assess the risk of contact between pits
of on-site sanitation and the groundwater,
- Development of a record system with the dislodging of pit latrines and VIP per household,
- Development of a record system with the frequency of sludge removal in WWTP,
- Harmonize wastewater treated standards in Botswana and South Africa.
2.2. Sludge treatment and reuse
In the RTBAA, the faecal sludge management is not really developed and monitored. Two types of
faecal sludge exist, one from the on-site sanitation and the second one from wastewater treatment
plants. In Zeerust, Gaborone and Lobatse, sludge from pit latrines and VIP are transferred to the
wastewater treatment plants. In the rest of the area, faecal sludge from on-site sanitation are disposed
in a dumping site, or burnt, or destroyed by chemicals. Moreover, only Gaborone WWTP and Zeerust
WWTP have sludge treatment system. The quantity of sludge produced per day in WWTP is presented
in Table 17. In the study area, on-site sanitation produces around 75 m3.d
-1 of sludge containing
cleansing materials biodegradable. Sludge is high in solids concentration, BOD, COD, nutrients, path-
ogens and metals.
WWTP Faecal sludge not dewatering
m3.d
-1
Gaborone 770
Lobatse 5
Ramotswa 5
Kanye 3
Lehurutshe 11
Zeerust 38 Table 17: Quantity of sludge produced in WWTP per day [83].
A bad sludge management has an impact on the environment. In fact, in Lobatse, sludge from the
WWTP is discharged in the landfill. Areola et al. reported the landfill of Lobatse contaminates surface
water in BOD, sulphate, nitrate and chloride [84]. Areola et al. just dealt with surface water pollution
but bad sludge management is also a threat for the groundwater resources. In this part, recommenda-
tions given are for developing sludge management services. Waste development plan already exists for

Natacha Martin – Mémoire de fin d’études
Promotion Paris 2014-2017
59
the town of Gaborone and Tlokweng where faecal sludge is treated by filter press. The objectives are
to reduce, reuse and recycle waste. Moreover, benefits are included in this development plan such as
job creation, poverty reduction and reduce waste collection costs [85].
Developing a treatment process for faecal sludge in this area has different objectives such as dewater-
ing, pathogens removal, nutrients removal and stabilisation. In this faecal sludge treatment facility,
sludge from the WWTP which contains pit humus and faecal sludge from the sewage network are
treated. Drying beds are recommended because of the cost-effectiveness and the high rate of evapora-
tion in the area. Drying beds process is based on two principles shown in Figure 35. The first one is
evaporation which removes the bound water fraction and this process takes place over a period of days
to week. The second principle is percolation of the leachate through sand and gravel which is returning
to the wastewater treatment process, particularly in the facultative pond for waste stabilisation ponds.
Drying beds have to be built near the wastewater treatment plant to limit the cost for the sludge trans-
fer. The wet season can be accommodated by not using the beds in that period. Ponds must be dis-
lodged during dry season to transfer and to dry the sludge during the dry season.
Figure 35: Drying bed scheme [76].
Recommendations for the design of drying beds are presented in Table 18. For example, Ramotswa
WWTP produced 5 m3.d
-1 of faecal sludge and pit humus is estimated around 730 m
3.y
-1. The follow-
ing design for Ramotswa faecal sludge management is determined in Table 19.
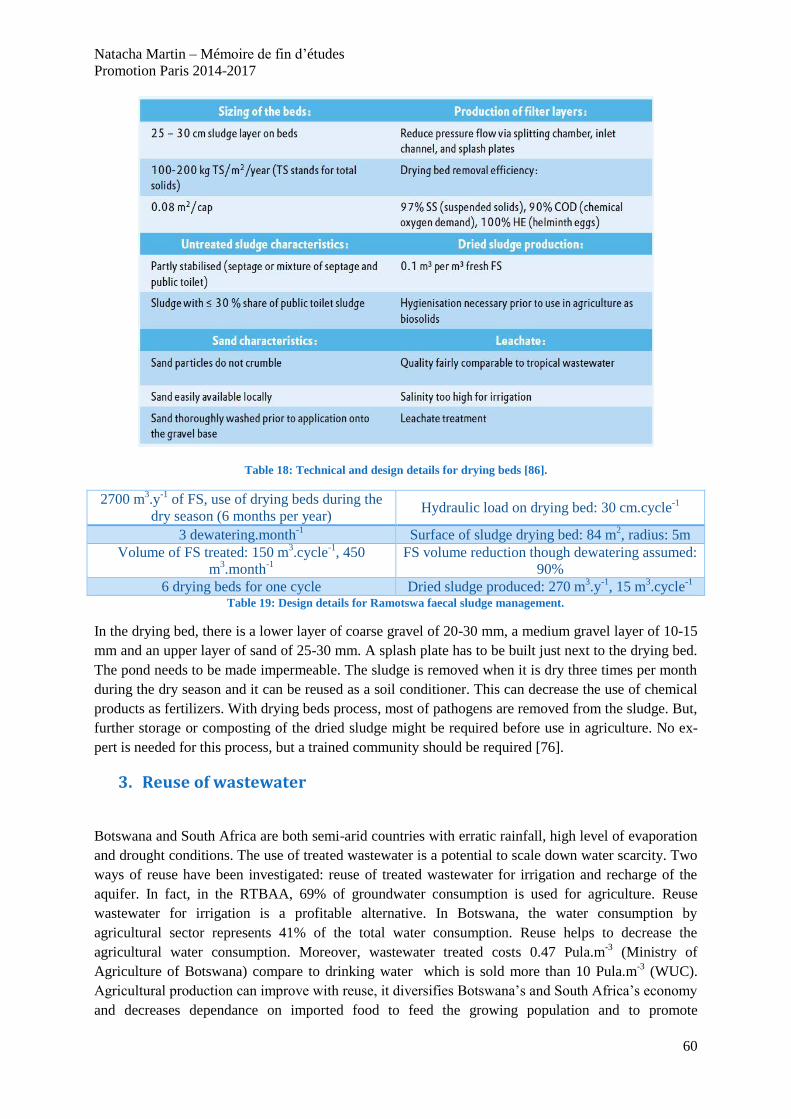
Natacha Martin – Mémoire de fin d’études
Promotion Paris 2014-2017
60
Table 18: Technical and design details for drying beds [86].
2700 m3.y
-1 of FS, use of drying beds during the
dry season (6 months per year) Hydraulic load on drying bed: 30 cm.cycle
-1
3 dewatering.month-1
Surface of sludge drying bed: 84 m2, radius: 5m
Volume of FS treated: 150 m3.cycle
-1, 450
m3.month
-1
FS volume reduction though dewatering assumed:
90%
6 drying beds for one cycle Dried sludge produced: 270 m3.y
-1, 15 m
3.cycle
-1
Table 19: Design details for Ramotswa faecal sludge management.
In the drying bed, there is a lower layer of coarse gravel of 20-30 mm, a medium gravel layer of 10-15
mm and an upper layer of sand of 25-30 mm. A splash plate has to be built just next to the drying bed.
The pond needs to be made impermeable. The sludge is removed when it is dry three times per month
during the dry season and it can be reused as a soil conditioner. This can decrease the use of chemical
products as fertilizers. With drying beds process, most of pathogens are removed from the sludge. But,
further storage or composting of the dried sludge might be required before use in agriculture. No ex-
pert is needed for this process, but a trained community should be required [76].
3. Reuse of wastewater
Botswana and South Africa are both semi-arid countries with erratic rainfall, high level of evaporation
and drought conditions. The use of treated wastewater is a potential to scale down water scarcity. Two
ways of reuse have been investigated: reuse of treated wastewater for irrigation and recharge of the
aquifer. In fact, in the RTBAA, 69% of groundwater consumption is used for agriculture. Reuse
wastewater for irrigation is a profitable alternative. In Botswana, the water consumption by
agricultural sector represents 41% of the total water consumption. Reuse helps to decrease the
agricultural water consumption. Moreover, wastewater treated costs 0.47 Pula.m-3
(Ministry of
Agriculture of Botswana) compare to drinking water which is sold more than 10 Pula.m-3
(WUC).
Agricultural production can improve with reuse, it diversifies Botswana’s and South Africa’s economy
and decreases dependance on imported food to feed the growing population and to promote

Natacha Martin – Mémoire de fin d’études
Promotion Paris 2014-2017
61
environmental sustainability. It seems logical to prioritize the reuse of wastewater treated for agricul-
ture and then to recharge the aquifer with the excess. But, all the outflow of wastewater treated cannot
be used because of the environmental flows.
3.1. Quality issue
3.1.1. Reuse of treated wastewater for irrigation
The major problem to agriculture development is the competitive demand for water. Using treated
wastewater for irrigations improves agricultural productivity and enhances the livelihood of the small-
holder farmers in the production system. An example of irrigation application by treated wastewater
exists in Glen Valley WWTW, located in the study area.
In Gaborone, wastewater treated is reused for vegetable production in Glen Valley using secondary
treated wastewater from Glen Valley WWTW (activated sludge) and disinfection ponds. The crops
irrigated are tomato, spinach, olive, green pepper, okra, maize, Lucerne, butternut squash, water mel-
on, cabbage and lettuce [87]. The irrigation division at the Ministry of Agriculture pumps the effluent
from Gaborone WWTP to ponds near Phakalane and then pumps back to Glen Valley for private
farmers. Farmers use drip irrigation. The effluent is not compliant to BOBS standards for temperature,
SS, and COD. Some traces of heavy metal and E.Coli have been found in treated sewage water soils
and plants [88; 89; 90; 91]. These traces come from industrial wastewater. Phosphorus and potassium
levels in treated wastewater also increase soil salinity [92]. Some functioning problems have been
encountered by the private farmers for treated wastewater supply because of poor design of the sys-
tem, losses and lack of maintenance.
Two guidelines for wastewater reuse in irrigation are available. These guidelines correspond to unre-
stricted irrigation with a standard for faecal coliform and restricted irrigation without faecal coliform.
Recommendations from the World Health Organization guidelines are presented in Table 20.
Category of
irrigation Reuse conditions Wastewater treatment expected
A Unrestricted irrigation: vegetable and salad
crops eaten uncooked, sports fields, public parks
Well designed waste stabilization
ponds
B Restricted irrigation: cereal crops, industrial
crop, fodder crops, pasture and trees
Waste stabilization ponds includ-
ing maturation ponds
C Localized irrigation of crops in category B
Pre-treatment as required by the
irrigation technology, not less
than primary sedimentation Table 20: Recommendations from the World Health Organization for irrigation with wastewater [93].
In the RTBAA, most of the wastewater is treated by waste stabilization ponds or activated sludge. The
outflow does not always comply with the standards of both countries in Appendix 8C for organic mat-
ter, nutrients (nitrogen) and heavy metal.
Pollutants Impacts on the environment
Organic matter - Development of sludge deposits causing anaerobic conditions
- Plugging of irrigation equipment
Nutrients such
as nitrogen
- Potential to cause nitrogen injury, excessive growth, delayed growing sea-
son and maturity
- Groundwater pollution with health and environmental impacts
Heavy metal - Toxic to plants and animals

Natacha Martin – Mémoire de fin d’études
Promotion Paris 2014-2017
62
- Cause salinity and associated adverse impacts
- Affect permeability and soil structure Table 21: Impacts of pollutants on the irrigation scheme [94].
If recommendations presented above in IV.2.1. are followed, wastewater treatment is enough efficient
to comply with the standards.
Potential impacts of wastewater reuse are interesting to be monitored:
- Health impact: heavy metal and nitrogen participate to a poorer health if it is ingested in a suf-
ficient concentration. To assess health impact, the actual risk that makes people fall ill has to
be monitored.
- Crops development: growth rate of the crops is increased by nutrients but a high level in nutri-
ents impacts on the soil fertility and causes economic loss to farmers.
- Soil impact: salinity erodes soil structure which decreases the soil productivity. Salinity has to
be monitored in the wastewater treated for irrigation and can be resolved by application of
natural or artificial soil amendment [95; 96].
3.1.2. Excess of treated wastewater for recharge
Recharge can be realized via direct well injection or with infiltration of secondary treated wastewater.
The system soil aquifer treatment is the issue to infiltrate secondary treated wastewater and to recharge
the aquifer. This treatment uses the soil of the vadose zone as natural filter with infiltration basins. The
characteristics of the soil are important because it has to provide good filtration and quality improve-
ment of the effluent as it passes through. But, according to the Food and Agriculture Organization of
the United Nations, fractured rock aquifers are not recommended for the SAT or should be protected
by a soil mantle of adequate texture and thickness. Well injection is not directly practicable because
the wastewater quality is not compliant to the standards of drinking water. Treating the groundwater
for drinking water has an expensive cost which cannot be ignored in this case. To use well injection,
wastewater treatment has to be reinforced or completed [97; 98].
The injected wastewater treated has to be potable and meets the standards enforced in Botswana and
South Africa or contained in the WHO Guidelines for Drinking-water Quality (WHO, 1996), present-
ed in Appendix 8B [99]. To reach this quality, activated sludge and rotating biological contractors are
more adapted to treat wastewater for recharge aquifer with a direct potable use. Oxidation ponds do
not provide an acceptable quality to recharge the aquifer [76]. But, the estimated cost for trickling
filters and activated sludge processes is estimated about 0.1 USD.m-3
treated compare to oxidation
ponds which is 0.02 USD.m-3
treated [100]. At least, before being injected, wastewater should finish
its treatment in a disinfection tank with chlorine or UV or ozonation to remove pathogens. Residual
chlorine has negative impacts on the environment such as carcinogenic effects, but chlorine disinfec-
tion is the most cost effective process [101].
In the RTBAA, the water table is not sufficiently deep to prevent excessive rises of the groundwater
table due to infiltration. Injection in the aquifer of wastewater treated increases the water table which
is in contact with pit latrines 5 meters below the soil. Wastewater quantity injected has to be con-
trolled.
3.2. Quantity issue

Natacha Martin – Mémoire de fin d’études
Promotion Paris 2014-2017
63
Four sites are chosen for their potential in wastewater reuse according to their proximity to the aquifer
and agricultural activities presented in Figure 36, and the availability of wastewater treated. These
sites are Lobatse WWTP, Ramotswa WWTP, Lehurutshe WWTP and Glen Valley WWTP. The quan-
tity of wastewater treated for reuse is divided in three parts, the environmental flow requirement, the
potential need for agriculture and the excess for recharge. The environmental flow maintains river
channel, natural recharge of the aquifer and ecology. Estimated environmental flow requirement for
the Ngotwane sub-catchment of the Limpopo Basin is 24% [102]. The potential need for agriculture is
based on the wastewater consumption of Gaborone which is around 10 to 11 m3.ha
-1.d
-1. In fact, Gabo-
rone WWTP discharges 35 000 m3.d
-1 of treated wastewater, which is 55% of the inflow. Wastewater
reuse is around 3.5 % of inflow and 6.5 % of outflow, which represents 2275 m3.d
-1. The quantity of
treated wastewater covers 203 ha of 47 farms of different sizes (1 – 10 ha) [103]. Table 22 shows the
quantity of wastewater for each potential reuse.
Figure 36: Map of wastewater treatment plant and irrigated areas.
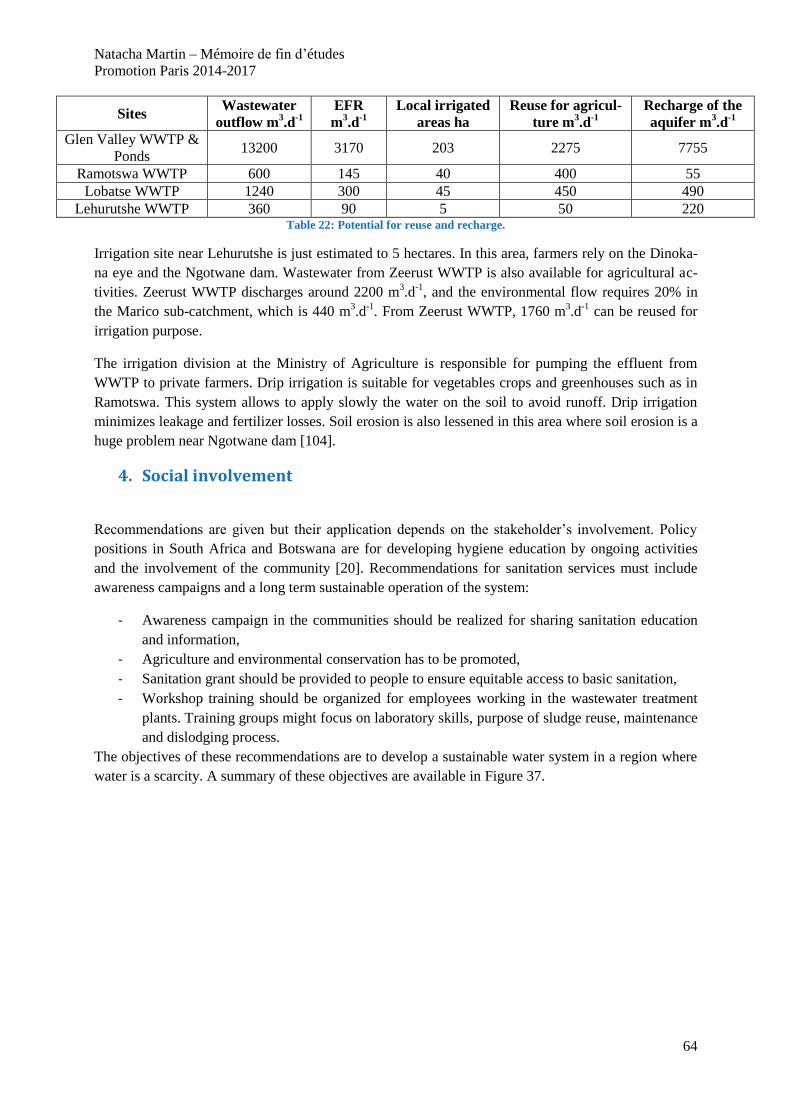
Natacha Martin – Mémoire de fin d’études
Promotion Paris 2014-2017
64
Sites Wastewater
outflow m3.d
-1
EFR
m3.d
-1
Local irrigated
areas ha
Reuse for agricul-
ture m3.d
-1
Recharge of the
aquifer m3.d
-1
Glen Valley WWTP &
Ponds 13200 3170 203 2275 7755
Ramotswa WWTP 600 145 40 400 55
Lobatse WWTP 1240 300 45 450 490
Lehurutshe WWTP 360 90 5 50 220 Table 22: Potential for reuse and recharge.
Irrigation site near Lehurutshe is just estimated to 5 hectares. In this area, farmers rely on the Dinoka-
na eye and the Ngotwane dam. Wastewater from Zeerust WWTP is also available for agricultural ac-
tivities. Zeerust WWTP discharges around 2200 m3.d
-1, and the environmental flow requires 20% in
the Marico sub-catchment, which is 440 m3.d
-1. From Zeerust WWTP, 1760 m
3.d
-1 can be reused for
irrigation purpose.
The irrigation division at the Ministry of Agriculture is responsible for pumping the effluent from
WWTP to private farmers. Drip irrigation is suitable for vegetables crops and greenhouses such as in
Ramotswa. This system allows to apply slowly the water on the soil to avoid runoff. Drip irrigation
minimizes leakage and fertilizer losses. Soil erosion is also lessened in this area where soil erosion is a
huge problem near Ngotwane dam [104].
4. Social involvement
Recommendations are given but their application depends on the stakeholder’s involvement. Policy
positions in South Africa and Botswana are for developing hygiene education by ongoing activities
and the involvement of the community [20]. Recommendations for sanitation services must include
awareness campaigns and a long term sustainable operation of the system:
- Awareness campaign in the communities should be realized for sharing sanitation education
and information,
- Agriculture and environmental conservation has to be promoted,
- Sanitation grant should be provided to people to ensure equitable access to basic sanitation,
- Workshop training should be organized for employees working in the wastewater treatment
plants. Training groups might focus on laboratory skills, purpose of sludge reuse, maintenance
and dislodging process.
The objectives of these recommendations are to develop a sustainable water system in a region where
water is a scarcity. A summary of these objectives are available in Figure 37.
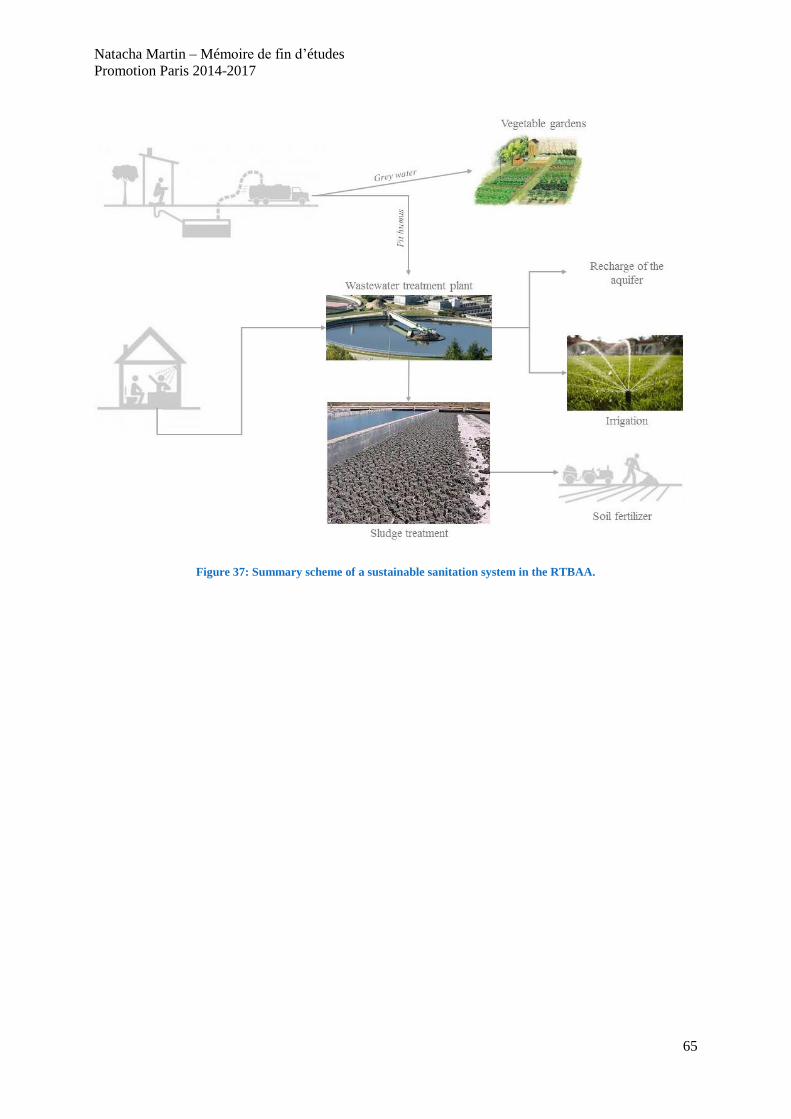
Natacha Martin – Mémoire de fin d’études
Promotion Paris 2014-2017
65
Figure 37: Summary scheme of a sustainable sanitation system in the RTBAA.

Natacha Martin – Mémoire de fin d’études
Promotion Paris 2014-2017
66
V. Conclusion
In the Ramotswa Transboundary Aquifer Area, two types of pollution occur caused by the sanitation
system. The first one comes from on-site sanitation. On-site sanitation such as VIP, pit latrines and
septic tank pollute the aquifer because of the lack of maintenance and knowledge. Moreover, on-site
sanitation has to be improved because they are not adapted to the soil which is a rock-fractured soil
with a high groundwater table, particularly during wet season. The second cause of pollution is the
wastewater treatment plant. Treated wastewater quality does not comply with the standards because of
the bad treatment efficiency. In fact, inflow contains industrial wastewater and the treatment is not
specifically adapted for industrial wastewater. Moreover, a lack of maintenance and monitoring lead to
deteriorate the treatment efficiency. These cases of pollution depends also on climate conditions. In
fact, the aquifer is more vulnerable to on-site sanitation pollution during the wet season because of a
higher water table. Compare to the wet season, the aquifer is more vulnerable to treated wastewater
during the dry season which deteriorates the treatment efficiency because of lower temperature and
sunlight exposure. In any case, on-site sanitation pollution is the most important because of the pit
latrines density. A priority area is delimited according to the sanitation assessment. From ten kilome-
tres to each side of the border and from Radikhudu to Ramotswa, this aquifer area is more exposed to
sanitation pollution.
Some recommendations are given to decrease the risk of aquifer pollution. These recommendations
can be applied but need a community involvement for the long term. At first, sanitation improvement
can be done on households which are not connected to the sewer system. The most important is to deal
with the high water table, pits of on-site sanitation should be decreased or raised. Moreover, grey wa-
ter management plan should be introduced. Then, a maintenance plan for wastewater treatment plant is
proposed, followed by a monitoring plan. At last, by establishing a sustainable sanitation plan, benefits
can be done for the community and stakeholder. Improving the sludge treatment leads to the possibil-
ity of reuse it as soil fertilizer. By a better treatment efficiency of wastewater, discharge becomes a
source of water for irrigation and recharge of the aquifer.
Many projects are following this sanitation assessment. One of them is focused on irrigation scheme in
the RTBAA. It consists in improving irrigation management of smallholder farmers by using monitor-
ing sensors to assess the quantity and quality needed for water in terms of agricultural activities larger
than two hectares. This project will help to estimate wastewater needed for irrigation purposes. The
second project is the hydrogeological model of the Ramotswa Transboundary Aquifer to understand
the resource and assess the recharge possibilities from the river and treated wastewater. The model
will focus on one transboundary compartment of the aquifer which is located in Ramotswa.

Natacha Martin – Mémoire de fin d’études
Promotion Paris 2014-2017
67
Bibliography
[1] RANGANAI, GOTLOP-BOGARSU, MAPHANYANE. Hydrochemical and geophysical evalu-
ation of groundwater pollution in the Ramotswa wellfield, SE Botswana. Botswana Institute of
Engineers, 2001. pp.193-200.
[2] ALTCHENKO, LEFORE, VILLHOLTH. Resilience in the Limpopo Basin : the potential role
of the transboundary Ramotswa aquifer. Baseline Report. International Water Management Insti-
tute, 2015. 113 pages.
[3] SOUTH EAST SUB DISTRICT. Population and housing census 2011: selected indicators for
villages and localities. Statistics Botswana, 2015. 15 pages. ISBN 978-99968-463-4-5.
[4] NGWAKETSE SUB DISTRICT. Population and housing census 2011: selected indicators for
villages and localities. Statistics Botswana, 2015. 23 pages. ISBN 978-99968-463-7-3.
[5] STATISTICS SOUTH AFRICA. Census 2011 Municipal report – North West. Pretoria, Statis-
tics South Africa, 2012.
[6] P.R. PUJARI, C. PADMAKAR, P.K. LABAHSETWAR, P. MAHORE, A.K. GANGULY. As-
sessment of the impact of on-site sanitation systems on groundwater pollution in two diverse
geological settings – a case study from India. Environment Monitoring and Assessment, Vol. 184,
2011. pp. 251 – 253.
[7] Y. LU, C. TANG, J. CHEN, Y. SAKURA. Impact of septic tank systems on local groundwater
quality and water supply in the Pearl River Delta, China: Case study. Hydrological Processes,
Vol. 22, 2008. pp. 443–450.
[8] K. BEGER. Environmental hydrogeology of Lobatse, South East District, Republic of Bot-
swana. Environmental Geology Division, 2001. 49 pages.
[9] M. STAUDT. Environmental hydrogeology of Ramotswa, South East District, Republic of
Botswana. Environmental Geology Division,2003. 65 pages.
[10] STATISTICS SOUTH AFRICA. Census 1996 Municipal report – North West. Pretoria, Statis-
tics South Africa, 1997.
[11] STATISTICS SOUTH AFRICA. Census 2001 Municipal report – North West. Pretoria, Statis-
tics South Africa, 2002.
[12] STATISTICS SOUTH AFRICA. Census 2016 Municipal report – North West. Pretoria, Statis-
tics South Africa, 2017.
[13] MINISTRY OF BOTSWANA. Wastewater: State of the Nation. Botswana National Master
Plan for Wastewater and Sanitation, Vol. 6, 2003.148 pages.
[14] ROSE, PARKER, JEFFERSON, CARTMELL. The characterization of feces and urine: a re-
view of the literature to inform advances treatment technology. Critical Reviews in Environmental
Science and Technology, Vol. 45, 2015. pp. 1827 – 1879.

Natacha Martin – Mémoire de fin d’études
Promotion Paris 2014-2017
68
[15] ALADE, JAMEEL, MUYUBI, ABDUL KARIM, ALAM. Removal of oil and grease as emerg-
ing pollutants of concern (EPC) in wastewater stream. IIUM Engineering Journal, Vol. 12, No. 4,
Special issue on Biotechnology, 2011. 9 pages.
[16] SAIEA. Impact assessment case studies from Southern Africa. Retrospective EIA of the
Lobatse Abattoir, Botswana. Botswana Meat Commission, 2009. 10 pages.
[17] DEPARTMENT OF WATER AFFAIRS AND FORESTRY. The development of a sanitation
policy and practice in South Africa. Preliminary Draft Paper, 2002. 16 pages.
[18] DEPARTMENT OF WATER AFFAIRS AND FORESTRY. Key water and sanitation chal-
lenges. Extract from DWAF Water Services Planning Reference Framework, 2006. 20 pages.
[19] DEPARTMENT OF WATER AFFAIRS AND FORESTRY. Free Basic Water Implementation
Strategy. Republic of South Africa, 2009. 49 pages.
[20] DEPARTMENT OF WATER AND SANITATION. National Sanitation Policy 2016. Republic
of South Africa, 2016. 72 pages.
[21] SAVING WATER AQUARISTA. Typical household water consumption. Cape Water Solu-
tions, 2010.
[22] DEPARTMENT OF WATER AFFAIRS. Blue Drop Report. North West Province, Chapter 11.
Wastewater Service Regulation, 2014.
[23] DEPARTMENT OF WATER AFFAIRS. Green Drop Report. North West Province, Chapter
11. Wastewater Service Regulation, 2014.
[24] STEPHENSON, SHEMANG, CHAOKA. Water Resources of Arid Areas. Taylor & Francis
Group, London, 2004. ISBN:04-1535-913-9.
[25] PUBLIC PROTECTOR SOUTH AFRICA. “Waste and Water”. Report of the Public Protector
in terms of section 182(1)(b) of the Constitution of the Republic of South Africa, 1996 and section
8(1) of the Public Protector Act. Report 15, 2013-2014. 108 pages. ISBN:978-1-920692-05-6.
[26] C. COETZER, H. HONEY. An innovative approach for the operation and maintenance of
Zeerust wastewater treatment works. 2014. 8 pages.
[27] DEPARTMENT OF PUBLIC WORKS. Small waste water treatment works: Department of
Public Works design guidelines. 2012.
[28] DEPARTMENT OF WATER AFFAIRS. Green Drop Report, Volume 2: Department of Pub-
lic Works Wastewater Systems. Wastewater Service Regulation, 2013.
[29] M. STAUDT. Production of Environmental Hydrology maps using GIS for the Ramotswa
project area, South East District. International Postgraduate Masters Course “Tropical Hydrogeolo-
gy”, 2002. 86 pages.
[30] B.F. ALEMAW, E. M. SHEMANG, T.R. CHAOKA. Assessment of groundwater pollution
vulnerability and modelling of the Kanye Wellfield in SE Bottswana – a GIS approach. Physics
and Chemistry of the Earth Parts, 2004. 5 pages.

Natacha Martin – Mémoire de fin d’études
Promotion Paris 2014-2017
69
[31] A. HAOUCHINE, B. ABDERRAHMANE, F. Z. HAOUCHINE, R. NEDJAI. Cartographie de
la recharge potentielle des aquifères en zone aride: Cas de la plaine d’El Outaya, Biskra, Algé-
rie. EUROJOURNALS, Vol. 45, Issue 4, 2010. pp. 1-13.
[32] L. ALLER, T. BENNETT, J. LEHR, R. PETTY, G. HACKETT. DRASTIC: A standardized
system for evaluating groundwater pollution potentialising hydrogeologic settings. National Wa-
ter Well Association, Dublin, Ohio and Environmental Protection Agency, Ada, OK, 1987. EPA-
600/2-87-035.
[33] D. R. SOLLER, R. C. BERG. A model for the assessment of aquifer contamination potential
based on regional geologic framework. Environmental Geology and Water Sciences, Volume 19,
Number 3, 1992. pp 205 – 213.
[34] S. A. OKE, F. FOURIE. Guidelines to groundwater vulnerability mapping for sub-saharan
Africa. Groundwater for Sustainable Development, Vol. 5, 2017. pp. 168 – 177.
[35] Y. HU. Mapping monthly precipitation in Sweden by using GIS. Department of Earth Sci-
ence, University of Gothenburg Sweden, 2010. 59 pages.
[36] R.G. ALLEN, L.S. PEREIRA, D. RAES, M. SMITH. Crop evapotranspiration – Guidelines
for computing crop water requirements 6 – FAO Irrigation and drainage paper 56. Food and
Agriculture Organization of the United Nations, Rome, 1998. ISBN: 92-5-104219-5.
[37] M. TUANMU, W. JETZ. A global 1km consensus land-cover product for biodiversity and
ecosystem modelling. Global Ecology and Biogeography, 2014. 15 pages.
[38] BRITISH GEOLOGICAL SURVEY. Guide to permeability indices. Natural Environment Re-
search Council, Keyworth, Nottingham, 2006. 29 pages.
[39] V. EMONGOR, E. NKEGBE, B. KEALOTSWE, I. KOORAPETSE, S. SANKWASA, S. KEI-
KANETSWE. Pollution Indicators in Gaborone Industrial Effluent. Journal of Applied Sciences,
Vol. 5, Issue 1, 2005. pp. 147 – 150.
[40] E. NKEGBE, I. KOORAPETSE. Heavy Metal Compositions in Gaborone Industrial Effluent.
Journal of Applied Sciences, Vol. 5, Issue 8, 2005. pp. 1418 – 1419.
[41] J. NORUP, E. ABERG. Quality assessment of sludge from Glen Valley wastewater treatment
plant and its potential as fertilizer. Master Thesis in Water and Environmental Engineering, De-
partment of Chemical Engineering, Lund University, Sweden, 2005. 101 pages.
[42] P. K. PODDAR, O. SAHU. Quality and management of wastewater in sugar industry. Water
Sciences, Vol. 7, 2017. pp. 461 – 468.
[43] J. P. KUSHWAHA. A review on sugar industry wastewater: sources, treatment technologies
and reuse. Desalination and Water Treatment, Vol. 53, Issue 2, 2013. pp. 309-318.
[44] M. MARTZ. Effective wastewater treatment in the pharmaceutical industry. Pharmaceutical
engineering, the official technical magazine of ISPE, Vol. 32, No. 6, 2012. 12 pages.
[45] B. PAUWELS, W. VERSTRAETE. The treatment of hospital wastewater: an appraisal. Jour-
nal of Water and Health, 2006. 12 pages.

Natacha Martin – Mémoire de fin d’études
Promotion Paris 2014-2017
70
[46] A. REZAEE, M. ANSARI, A. KHAVANIN, A. SABZALI, M.M. ARYAN. Hospital
wastewater treatment using an integrated anaerobic aerobic fixed film bioreactor. American
Journal of Environmental Sciences, Vol. 1, Issue 4, 2005. pp. 259 – 263.
[47] W. QASIM, A.V. MANE. Characterization and treatment of selected food industrial efflu-
ents by coagulation and adsorption techniques. Water Resources and Industry, Vol. 4, 2013. pp. 1 –
12.
[48] A.P. VANERKAR, S. SATYANARAYA SHANTA. Treatment of food processing industry
wastewater by a coagulation/flocculation process. International Journal of Chemical and Physical
Sciences, Vol. 2, 2013. 10 pages.
[49] K. DEREYKO, M. MALOVANYY, V. DYACHOK, Y. SAKHNEVYCH, S. MARA-
CHOVSKA. Food industry wastewater treatment. Department of Ecology and Environment Protec-
tion, Lviv National Polytechnic University, Ukraine, 2017. 7 pages.
[50] STUDIES IN ENVIRONMENTAL SCIENCE. Waste water from the iron and steel industry
and mining. Industrial waste water management, Vol. 5, Chapter 14, 1979. pp. 217 – 227.
[51] V. CAGIN, U. YETIS. Water reuse strategies: iron and steel industry case study. Security of
industrial water supply and management, Chapter 10, 2011. pp. 141 – 158.
[52] H. DARGO, A. AYALEW. Tannery waste water treatment: a review. International Journal of
Emerging trends in Science and Technology, Vol. 1, Issue 9, 2014. pp. 1488 – 1494.
[53] J. BULJAN, I. KRAL. Introduction to treatment of tannery effluents. United Nations Industri-
al Development Organization, 2011. 69 pages.
[54] Z. SONG, C.J. WILLIAMS, R.G.J. EDYVEAN. Treatment of tannery wastewater by chemi-
cal coagulation. Desalination, Vol. 164, 2004. pp. 249 – 259.
[55] C. F. BUSTILLO-LECOMPTE, M. MEHRVAR. Slaughterhouse wastewater characteristics,
treatment, and management in the meat processing industry: a review on trends and advances.
Journal of Environmental Management, Vol. 161, 2015. pp. 287 – 302.
[56] C. BUSTILLO-LECOMPTE, M. MEHRVAR, E. QUINONES-BOLANOS. Slaughterhouse
wastewater characterization and treatment: an economic and public health necessity of the meat
processing industry in Ontario, Canada. Journal of Geoscience and Environment Protection, Vol. 4,
2016. pp. 175 – 186.
[57] DEPARTMENT OF AGRICULTURE AND RURAL DEVELOPMENT. Guideline manual for
the management of abattoirs and other waste of animal origin. Gauteng Provincial Government,
South Africa, 2009. 214 pages.
[58] N. MLADENOV, K. STRZEPEK, O. M. SERUMOLA. Water quality assessment and model-
ing of an effluent-dominated stream, the Notwane River, Botswana. Environmental Monitoring
and Assessment 109, 2005. pp.97 – 121.
[59] R. C. O. MODISHA. Investigation of the Ramotswa Transboundary Aquifer Area, ground-
water flow and pollution. Master thesis, University of Witwatersrand, 2017. 80 pages.

Natacha Martin – Mémoire de fin d’études
Promotion Paris 2014-2017
71
[60] M. VON HOYER, W. STRUCKMEIER. A new groundwater resources map for the Republic
of Botswana at the scale of 1:1000000. Botswana Notes and Records, Vol. 20, 1989. pp. 101 – 107.
[61] BUSCH, MABUA, MOKOKWE, VON HOYER. Groundwater pollution vulnerability map of
Botswana 1:1000000. Botswana Notes and Records, Vol. 27, Issue 1, 1995. pp.227 – 237.
[62] ENVIRONMEMT STATISTICS. Botswana Water Statistics. Central Statistics Office, 2009.
102 pages.
[63] WORLD HEALTH ORGANIZATION. A guide to the Development of on-Site Sanitation.
WHO, 1992. 184 pages. ISBN:92-4-1544430.
[64] E. ROTTIER, M.E. INCE. Controlling and preventing disease: the role of water and envi-
ronmental sanitation interventions. WEDC, Loughborough University, UK. 2003. ISBN:0-906055-
90-3.
[65] KHOLOMA. A survey of Water Losses – The case of the Ramotswa Village in Botswana.
TRITA LWR Degree Project, Vol. 11, Issue 37, 2011. 52 pages.
[66] SHIVENDRA, RAMARAJU. Impact of onsite sanitation system on groundwater in different
geological setting of peri urban areas. Aquatic Procedia, Vol. 4, 2015. pp. 1162-1172.
[67] STILL, NASH. Groundwater contamination due to pit latrines located in a sandy aquifer: a
case study from Maputaland. Water Institute of Southern Africa Biennal Conference, Durban, South
Africa, 2002.
[68] DILLON. Groundwater pollution by sanitation on tropical islands. IHP-V Project 6-1. Paris:
UNESCO (United Nations Educational, Scientific and Cultural Organization), 1997. Available:
http://unesdoc.unesco.org/images/0010/001065/106522eo.pdf [accessed 9 August 2017].
[69] DZWAIRO, HOKO, LOVE, GUZHA. Assessment of the impacts of pit latrines on groundwa-
ter quality in rural areas: a case study from Marondera district, Zimbabwe. Physics and Chemis-
try of the Earth, Vol. 31, Issue15 – 16, 2006. pp. 779 – 788.
[70] NICHOLS, PRETTYMAN, GROSS. Movement of bacteria and nutrients from pit latrines in
the Boundary Waters Canoe Area Wilderness. Water, Air & Soil Pollution, Vol. 20, Issue 2, 1983.
pp. 171 – 180.
[71] MINISTRY OF BOTSWANA. On-site sanitation: state of the nation. Botswana National Mas-
ter Plan for Wastewater and Sanitation, Volume 3, 2003.197 pages.
[72] E. ERIKSSON, K. AUFFARTH, M. HENZE, A. LEDIN. Characteristics of grey water. Urban
Water, Vol. 4, 2002. pp. 85 – 104.
[73] WORLD HEALTH ORGANIZATION. WHO guidelines for the safe use of wastewater, excre-
ta and greywater. Volume 4, Excreta and greywater use in agriculture, 2006. 204 pages. ISBN: 92-4-
154685-9.
[74] EAWAG AQUATIC RESEARCH. Greywater management in Low and Middle Income
Countries. SANDEC: Department of Water and Sanitation in Developing Countries, 2006. 107 pages.
ISBN:3-906484-37-8.

Natacha Martin – Mémoire de fin d’études
Promotion Paris 2014-2017
72
[75] B. HAZELTINE, C. BULL. Field guide to appropriate technology. Elsevier Science, Chapter
8, Water supply, 2003. 889 pages. ISBN:0-12-335185-5.
[76] E. TILLEY, C. LUTHI, A. MOREL, C. ZURBRUGG, R. SCHERTENLEIB. Compendium of
Sanitation Systems and Technologies. Swiss Federal Institute of Aquatic and Technology (EAWAG)
and WSSCC. Dübendorf, Switzerland, 2nd
revised edition, 2014.
[77] L.R.J. VAN VUUREN, F.A. VAN DUUREND. Removal of algae from wastewater matura-
tion pond effluent. Journal of Water Pollution Control Federation, Vol. 37, No. 9, 1965. pp. 1256-
1262.
[78] S.C. REED. Nitrogen ramoval in wastewater stabilization ponds. Journal of Water Pollution
Control Federation, Vol. 57, No. 1, 1985. pp. 39-45.
[79] F.J. QUIROGA. Waste stabilization ponds for waste water treatment, anaerobic pond. 2011.
[80] M. VERBYLA, M. VON SPERLING, Y. MAIGA. Waste Stabilization Ponds. In: J.B ROSE,
B. JIMENEZ-CISNEROS. Global Water Pathogens Project. Part 4, Michigan State University, E.
Lansing, MI, UNESCO, 2017.
[81] WORLD HEALTH ORGANIZATION. WHO Guidelines for the safe use of wastewater, ex-
creta and greywater. Policy and regulatory aspects, Volume1. United Nations Environment Pro-
gramme, 2006. 114 pages. ISBN:92-4-154686-7.
[82] J. LAUTZE et al. Ramotswa 2 inception report. International Water Management Institute,
2017.
[83] C.V. ANDREOLI, M. VON SPERLING, F. FERNANDES. Biological Wastewater Treatment
Series. Volume 6, Sludge Treatment and Disposal. IWA Publishing, 2007. 256 pages. ISBN:
9781843391661.
[84] O. AREOLA, E. SEGOSEBE, R.D. GWISAI. Assessing-physico-chemical pollutants and
heavy metals in water sources around Lobatse sanitary landfill in Botswana. Open Journal of
Applied & Theoretical Environmental Sciences, Vol. 1, No. 1, 2015. pp. 31 – 55.
[85] CENTRE FOR APPLIED GOVERNMENT. Scoping report for the state of waste manage-
ment in and around Gaborone. March 2013. 53 pages. https://www.car.org.bw/wp-
content/uploads/2016/06/Waste-situation-analysis-greater-Gaborone.pdf. Accessed 9 August 2017.
[86] L. STRANDE, M. RONTELTAP, D. BRDJANOVIC. Faecal Sludge Management: Systems
Approach for Implementation and Operation. Swiss Federal Institute of Aquatic and Technology
(EAWAG) and IWA Publishing, 2014. 427 pages. ISBN:9781780404721.
[87] J. OTENE. The Use of Secondary Treated Wastewater for Irrigation in Gaborone Botswa-
na: An Overview of the Potentials, Health and Environmental Factors, 2017. Manuscript forth-
coming.
[88] A.A. DEKANMI. An Investigation of Chromium and Nickel Uptake in Tomato Plants Irri-
gated with Treated Waste Water at The Glen Valley Farm, Gaborone, Botswana. MSc. Thesis in
the Faculty of Engineering, Built Environment and Information Technology, University of Pretoria,
(unpublished), 2010. 120 pages.

Natacha Martin – Mémoire de fin d’études
Promotion Paris 2014-2017
73
[89] A.A. AGANGA, S. MACHACHA, B. SEBOLAI, T. THEMA, B.B. MAROTSI. Minerals in
Soils and Forages Irrigated with Secondary Sewage Water in Sebele, Botswana. Journal of Ap-
plied Sciences, Vol. 5, Issue 1, 2005. pp. 155- 161.
[90] A.S. LIKUKU, G. OBUSENG. Health Risk Assessment of Heavy Metals via Dietary Intake
of Vegetables Irrigated With Treated Wastewater around Gaborone, Botswana. International
Conference on Plant, Marine and Environmental Sciences (PMES- 2015) Jan. 1-2, 2015 Kuala
Lumpur (Malaysia), 2015. pp. 32-37.
[91] O. AREOLA, O. DIKINYA, L. MOSIME. Comparative effects of secondary treated
wastewater irrigation on soil quality parameters under different crop types. The African Journal
of Plant Science and Biotechnology, Vol. 5 (Special Issue), 2011. pp. 41-55.
[92] V.E. EMONGOR, G.M. RAMOLEMAN. Treated Sewage Effluent (water) Potential to be
used for Horticultural Production in Botswana. 4th Water Net/Warfsa Symposium: Water, Science,
Technology & Policy Convergence and Action by All, 2003. pp. 15-17.
[93] WORLD HEALTH ORGANIZATION. Guidelines for the safe use of wastewater, excreta and
greywater. Volume 2: Wastewater use in agriculture. United Nations Environment Programme, 2006.
222 pages. ISBN:92-4-154683-2.
[94] I. HUSSAIN, L. RASCHID, M. A. HANJRA, F. MARIKAR, W. VAN DER HOEK.
Wastewater use in agriculture: review of impacts and methodological issues in valuing impacts.
International Water Management Institute, Sri Lanka, Working Paper 37, 2002. 62 pages. ISBN:92-
9090-472-0.
[95] M. KALLEL, N. BELAID, T. AYOUB, A. AYADI, M. KSIBI. Effects of treated wastewater
irrigation on soil salinity and sodicity at El Hajeb Region (Sfax-Tunisia). Journal of Arid Land
Studies, Vol. 22, Issue 1, 2012. pp. 65-68.
[96] Z. MUYEN, G.A. MOORE, R.J. WRIGLEY. Soil salinity and sodicity effects of wastewater
irrigation in South East Australia. Agricultural Water Management, Vol. 99, Issue 1, 2011. pp. 33-
41.
[97] P. DILLON. Future management of aquifer recharge. Hydrogeology Journal, Vol. 13, Issue 1,
2005. pp.313 – 316.
[98] P. DILLON. Strategies for Managed Aquifer Recharge in semi-arid areas. Unesco Interna-
tional Hydrological Programme, 2005. 33 pages.
[99] F. BRISSAUD. Groundwater recharge: criteria for health related guidelines. Chapter 2,
Groundwater recharge with recycled municipal wastewater: criteria for health related guidelines.
World Health Organization, 2003. 222 pages.
[100] T.M. MISSIMER, R.G. MALIVA, N. GHAFFOUR, T. LEIKNES, G.L. AMY. Managed Aqui-
fer Recharge (MAR) Economics for wastewater reuse in low population Wadi Communities,
Kingdom of Saudi Arabia. Water, Volume 6, 2014. pp. 2322 – 2338.
[101] EPA. Wastewater technology fact sheet – Chlorine Disinfection. United States Environmen-
tal Protection Agency, 1999. 7 pages.

Natacha Martin – Mémoire de fin d’études
Promotion Paris 2014-2017
74
[102] LIMPOPO BASIN PERMANENT TECHNICAL COMMITTEE. Joint Limpopo River Basin
study scoping phase. Republic of Mozambique, 2010. 91 pages.
[103] J. ARNTZEN, K. MOLOSIWA, T. KAISARA. Mainstreaming wastewater through water
accounting: the example of Botswana. Centre for Applied Research (CAR), 2006. 89 pages.
[104] FOOD AND AGRICULTURE ORGANIZATION OF THE UNITED STATES. Irrigation Wa-
ter Management: Irrigation Methods, Training manual number 5. Chapter 6, Drip Irrigation. Nat-
ural Resources Management and Environment Department, 2001. 140 pages.
[105] GOLDSCHEIDER, ANDRE. Methods in Karst Hydrogeology: IAH: International Contribu-
tions to Hydrogeology, 26. CRC Press, 2007.

Natacha Martin – Mémoire de fin d’études
Promotion Paris 2014-2017
75
Appendix 1: Pictures of Glen Valley WWTP, Gaborone
1.1. Glen Valley inlet works
1.2. Comparison of the two phases in Glen Valley WWTP: A) Clarifier
in the second phase, B) Clarifier in the first phase

Natacha Martin – Mémoire de fin d’études
Promotion Paris 2014-2017
76
Appendix 2: Interview of Mr. Lekgaba, manager of Glen Valley WWTP
on 2nd February 2017
Persons present: I. Lekgaba, N. Martin
Date: February 2nd
, 2017
Place: Wastewater treatment plant of Water Utilities Corporation in Glen Valley, Gaborone, Botswana
When was the wastewater treatment plant built? What type of treatment do you use?
The plant is based on activated sludge. The outflow is discharged in disinfection ponds. The
wastewater treatment plant was built in 1996. A second phase happened in 2001 because of the
population increasing and to improve the treatment efficiency. The discharge respects the standards of
BOBS 93:2012. The old plant can treat 40 000 m3.d
-1. Both plants can treat 90 000 m
3.d
-1. The plants
are composed of screens, grit chambers, primary and secondary treatments, discharge and disinfection
ponds. The septic tanks and pit latrines are dislodged in the inflow of the WWTP before the screens.
You reuse the wastewater for irrigation, could you tell me more?
Treated wastewater is used for irrigation in twenty farms, which are about 10 to 12 hectars. The
wastewater treatment plant takes care of the treatment quality for reuse. Then, the water is pumped by
the Minister of Agriculture. The types of crops irrigated are tomato, butternut and spinach.
What type of wastewater do you treat?
Domestic and industrial wastewater are treated in Glen Valley. The industrial wastewater comes from
textile industry, soft drink industry and cannery.
How often and what type of maintenance are you doing?
The work team is composed of 40 persons. The maintenance is often done for:
- Fixing information,
- Dislodging,
- Preventive maintenance.
What are you doing with the sludge?
There are two types of sludge: the one from the anaerobic tank and the other one from the aerobic
tank. The sludge is dried with a filter press then it is sold to farmers. A part of the sludge is used for
methanisation. Gas is used for heating the tanks.
What would you want to improve?
To improve the water quality, it will be interesting to improve the quality of the maintenance and to
record everything.

Natacha Martin – Mémoire de fin d’études
Promotion Paris 2014-2017
77
Appendix 3: Report of the interview of Mr. Mareme, manager of
Ramotswa WWTP on January 2017 from Bonnie McGill
Persons present: M. Mareme, B. McGill
Date: January, 2017
Place: Water Utilities Corporation in Ramotswa, Botswana
Mr. Mareme estimates the number of people who use pit latrines in Ramotswa to be about 20%,
compare to the 2011 census which said 15% in Ramotswa. He blames the water shortages and
inability to use flush toilets for keeping that number high. He estimates that 75% of people have
access to a flush toilet. And he said roughly 15% of people use septic tanks.
During water rationing / restrictions Ramotswa would have water one or two days a week, this went
on for at least a year. Last year here was a diarrhea out break, it was during a water restriction time,
when people were stealing water directly from one of the production borehole’s valves used for
sampling. They suspect the people who had diarrhea were the ones who stole water. They have since
removed the sampling valve.
If there is no water coming from the north / Gaborone dam to blend the Ramotswa wellfield water
with, they have to turn the borehole pumps off. They cannot supply it directly to the people because of
its quality. So water supply in Ramotswa is reliant on Gaborone water supply.
The reverse osmosis facility is stalled due to payment issues with the contractor. But in theory it
would allow them to no longer rely on blending water with the north in order to supply water to the
village.
The sludge from the treatment ponds gets dredged, dried and either sold to farmers as manure or sent
to the South East Gaborone Landfill on the Lobatse road.
Wastewater from the final treatment pond is disposed into the Ngotwane river. Also sometimes they
have "internal over spillage", which also contaminates the Ngotwane river, which flows into the
Gaborone Dam. He used the word "contaminates".
WUC is not responsible for developing new systems / improving old ones; they only run the
infrastructure provided by the government. DWA, he said, is in charge of improving systems.
He said people are aware that their water comes from the ground and that it is contaminated by pit
latrines, because when the borehole pumps were stopped in 1996 it was a big deal. And they knew it
was because of the pit latrines. However that is 20 years ago, so it is not possible to know how many
people still remember that or teach the kids. Before the borehole pumps were stopped there were
cases of blue baby syndrome from the high nitrates, so people were also aware of the water quality
problems because of that.
Before 2010, each town works on its own WWTP. In 2010, WUC centralized and nationalized all the
WWTP.

Natacha Martin – Mémoire de fin d’études
Promotion Paris 2014-2017
78
Appendix 4: Interview of Mr. Mareme, manager of Ramotswa WWTP
on 30th January 2017
Persons present: M. Mareme, N. Martin
Date: January 30th, 2017
Place: Wastewater treatment plant of Water Utilities Corporation in Ramotswa, Botswana
When was Ramotswa wastewater treatment plant built?
The wastewater treatment plant was built in 1981 for the people who have flush toilets. In 2001, a
second phase of building appears because of the population increasing and the network sewage. A
third phase should happen around 2025 because of the population increasing. The lift pump is not
working because the pump building is too low compare to the ground level. A little pump was put for
the inflow. A secondary channel is bringing inflow by gravity.
How is the wastewater treatment plant working?
The plant has three types of ponds: anaerobic, facultative, and maturation. There are three facultative
ponds. The design data was lost. But, the depth of the ponds is not more than two meters. Two phases
of building happened. When the first phase is full of wastewater, the second phase is opened.
What do you think about the efficiency of the treatment?
The water quality does not respect anymore the discharge limit from the standards of BOBS 93:2012.
How often and what maintenance are you doing?
Water Utilities Corporation is doing the maintenance. An independent team is doing the minima to
save money. Moreover, the screen is not adequate, waste can pass though the screen. For dislodging,
there is no data available. Mr. Mareme took the manager’s job nine months ago. There is no data
available before this date. Since he is the manager, the sludge of the ponds was not evacuated. To have
a better maintenance, they should invest around 1 000 000 Pula (100 000 USD).
What could you tell me about the dry season and the rainy season?
During the dry season, the wastewater treatment plant is working as evaporation ponds. But, it is not
designed to work like that. Moreover, during the rainy season, the treated wastewater is diluted, and
the outflow quality is better. The residence time in the ponds has an impact on the treatment efficiency
but it changes with the seasons. For example, the residence time for an anaerobic pond is 4 to 5 days.
But, during the dry season, it can be 30 days.
What types of wastewater do you treat?
The inflow is composed of two types of wastewater: domestic and industrial. The industrial
wastewater comes from a milling industry, Bolux Milling.
What would you want to improve?

Natacha Martin – Mémoire de fin d’études
Promotion Paris 2014-2017
79
To improve the treatment, the most important is to respect the residence time in the ponds. The second
phase increases the capacity of the plant. Moreover, it should be interesting to invest flow meters for
the inflow and the outflow. The problem about the evaporation system during the dry season should be
fixed too.
What do you think about REUSE?
They have lots of crops in the town near the wastewater treatment plant. But, the treated wastewater is
not used for irrigation because of lands conflict between the Town Council and Water Utilities
Corporation. It should be interesting to reuse the wastewater for irrigation and gardens because people
use drinking water right now.
Where do you discharge?
There is no discharge in the river to protect the environment. The outflow is going in the land. No
water can be seen in the land. In fact, a channel is going underground. It can be supposed the water is
flowing in the aquifer. Moreover, some wetland can be seen in the plant, they might be losses or
discharge from the ponds.
Appendix 5: Ramotswa WWTP samples analysis
Sample
Identification Unit
Inflow Ramotswa
1st day
Inflow
Ramotswa 2nd
day
Outflow
Ramotswa
BOBS
93:2012
Date - 31-Jan 02-Feb 02-Feb -
Time - 10:00 AM 11:20 AM 11:30 AM -
BOD mg.L-1
- - 26 20
COD mg.L-1
- 23900 59 30
Total Coliforms /100
mL - - 960 20000
Faecal Coliforms /100
mL - - 300 1000
Suspended Solids mg.L-1
165 19322 111 -
Chloride mg.L-1
59 1608 102 600
Sulphate mg.L-1
13 <2 58 400
Nitrate mg.L-1
<0.1 <0.1 <0.1 2
Nitrite mg.L-1
<0.05 <0.05 <0.05 -
Total Phosphate mg.L-1
7.5 930 1.7 -
Organic
Nitrogen mg.L
-1 1.6 953 5.3 -
Oil and grease mg.L-1
4 1238 <1 -
Kjeldahl
Nitrogen mg.L
-1 51.6 2488 6.4 -
Free and saline
ammonia mg.L
-1 50 1535 1.1 1
Comments - Grey and diluted,
important inflow
Almost no
inflow,
black/grey,
sandy
Open the tap on
31/1 to have an
outflow
-

Natacha Martin – Mémoire de fin d’études
Promotion Paris 2014-2017
80
Appendix 6: Interview of Mr. Khan, manager of Lobatse WWTP on 1st
February 2017
Persons present: K. Khan, N. Martin
Date: February 1st, 2017
Lieu: Wastewater treatment plant of Water Utilities Corporation in Lobatse, Botswana
How many people are using flush toilets and pit latrines?
Pit latrines are used by 25% of the population. Flush toilets are used by 75%, but 25% are evacuated in
septic tanks and 50% are evacuated in the sewage network.
When was the wastewater treatment plant built?
The wastewater treatment plant was built in 1989, then increased in 1995 because of the population
increasing. There is no third phase planned for the next years coming. Lobatse has a slow population
increasing. The wastewater system is based on ponds. There are 14 ponds: 3 primary anaerobic ponds,
2 secondary anaerobic ponds, 6 facultative ponds and 3 maturation ponds.
What type of wastewater do you treat?
They treat industrial and domestic wastewater. The major industrial wastewater comes from the
Botswana Meat Commission. An agreement in the end of 2016 has been signed, it will be effective by
the end of 2017. Botswana Meat Commission will be disconnected from the sewage network and will
have its own wastewater treatment plant. Some industries discharge their wastewater in the sewage
network: tannery, cannery, milling industry and local shops.
What are you doing with the sludge?
The sludge is disposing in a dumping site or they take it to the landfield. The ponds have never been
completely dislodged.
How often and what maintenance are you doing?
The maintenance is the biggest challenge for the wastewater treatment plant. In fact, because of a lack
of money, the ponds have never been completely dislodged. Moreover, the inflow has two channels
with two screens: one manual and the other one mechanical. The mechanical screen is not working.
There is no screening during the night because they use the manual screen from 7:00 AM to 4:00 PM.
What do you think about the treatment efficiency?
The discharge limits are following the standards of BOBS 93 :2012. The treatment is quite efficient.
Some parameters as COD and BOD5 respect the limits.

Natacha Martin – Mémoire de fin d’études
Promotion Paris 2014-2017
81
Wastewater is discharged into the Ngotwane river. Some South African people complained the
pollution came from your plant. What do you think?
The downstream pollution is not coming from the plant. There is cattle near the river. They are
defecating in the land, this is why the COD is increasing downstream.
Could you tell me the benefits and the disadvantages of the WWTP?
About the treatment, the anaerobic digestion is a benefit. It is cheaper because it does not need oxygen.
But, there is algae synthesis in the maturation ponds, which explains the greener colour of the pond.
To improve the treatment, it will need around 10 million of Pula (1 million of USD) to:
- Dislodge the ponds,
- Create dry beds for the sludge,
- Put irrigation pumps,
- Fix the mechanical screen,
- Construct safety around the ponds.
What could you tell me about the dry season and the rainy season?
During the dry season, there is always discharge into the river. But, the discharge quality is not as
good as during the rainy season. In fact, the wastewater is diluted during the rainy season.
What would you want to add?
The pollution in the Ngotwane River has an impact on the dam in the north part of South Africa.
10 000 m3 of wastewater cost 35 Pula (3.5 USD).
Some funds should be approved by the beginning of April 2017.
Appendix 7: Lobatse WWTP samples analysis
Sample
Identification Unit
Inflow
Lobatse
Outflow
Lobatse
Upstream
Lobatse
Downstream
Lobatse
BOBS
93:2012
Date - 01-Feb 01-Feb 01-Feb 01-Feb -
Time - 10:30 AM 10:00 AM 09:30 AM 09:12 AM -
BOD mg.L-1
170 15 15 10 20
COD mg.L-1
420 167 111 122 30
Total
Coliforms /100 mL - 1280 3400 5530 20000
Faecal
Coliforms /100 mL - 100 460 620 1000
Suspended
Solids mg.L
-1 164 46 50 110 -
Chloride mg.L-1
45 67 67 62 600
Sulphate mg.L-1
23 33 34 32 400
Nitrate mg.L-1
<0.1 0.8 0.9 0.9 2
Nitrite mg.L-1
<0.05 0.4 0.5 0.7 -

Natacha Martin – Mémoire de fin d’études
Promotion Paris 2014-2017
82
Total
Phosphate mg.L
-1 6.8 6.9 6.8 7.5 -
Organic
Nitrogen- mg.L
-1 4.4 4.8 2.6 3.2 -
Oil and grease mg.L-1
13 <1 1 <1 -
Kjeldahl
Nitrogen mg.L
-1 36.4 13.4 10.6 10.6 -
Free and
saline
ammonia
mg.L-1
32 8.6 8 7.3 1
Appendix 8A: Treated wastewater discharge standards
Determinands Unit Botswana BOBS
93:2012 South Africa 1999
pH - 6.5 - 9 5.5 - 9.5
Temperature C 35 -
BOD mg.L-1
20 -
COD mg.L-1
30 75
Colour TCU 30 -
Fat, Oil and Grease mg.L-1
- 2.5
Total Coliforms /100 mL 20000 -
Faecal Coliforms /100 mL 1000 1000
Total Dissolved Solids mg.L-1
1000 -
Suspended solids mg.L-1
- 25
Free and saline
Ammonia N mg.L
-1 1 3
Nitrate N mg.L-1
2 15
Ortho Phosphorus P mg.L-1
1.5 10
Conductivity mS.cm-1
- 70
Arsenic mg.L-1
0.1 0.02
Boron mg.L-1
0.5 1
Zinc mg.L-1
5 0.1
Copper mg.L-1
1 0.01
Phenols mg.L-1
0.005 0.1
Lead mg.L-1
0.05 0.01
Cyanide mg.L-1
0.1 0.02
Total Chromium mg.L-1
0.05 0.05
Cadmium mg.L-1
0.005 0.005
Mercury mg.L-1
0.001 0.02
Selenium mg.L-1
0.01 0.02
Iron mg.L-1
1 0.3
Manganese mg.L-1
0.1 0.1
Sodium mg.L-1
400 -

Natacha Martin – Mémoire de fin d’études
Promotion Paris 2014-2017
83
Sulphate mg.L-1
400 -
Chlorides mg.L-1
600 -
Fluorides mg.L-1
1.5 1
Appendix 8B: Drinking water standards
Determinands Unit Botswana BOBS
32:2009
South Africa
1999 WHO 2006
Colour TCU 15 15 Pt-Co -
Conductivity at
25̊C S.cm
-1 1500 - -
Dissolved Solids mg.L-1
1000 450 600
Odour TON - 1 -
pH at 25̊C pH 5.5 - 9.5 6 – 9 -
Turbidity NTU 1 1 -
Ammonia mg.L-1
1 1 -
Calcium mg.L-1
150 80 -
Chloride
Residual mg.L
-1 200 100 -
Fluoride mg.L-1
1 1 1.5
Magnesium mg.L-1
70 30 -
Nitrate NO3 mg.L-1
50 6 50
Nitrate NO2 mg.L-1
3 6 3
Potassium mg.L-1
50 50 -
Sodium mg.L-1
200 100 -
Sulphate mg.L-1
250 200 -
Zinc mg.L-1
5 3 -
Aluminium μg.L-1
200 150 -
Antimony μg.L-1
20 - 20
Arsenic μg.L-1
10 10 10
Cadmium μg.L-1
3 5 3
Chromium μg.L-1
50 50 50
Cobalt μg.L-1
500 - -
Copper μg.L-1
2000 1000 2000
Cyanide free μg.L-1
70 - -
Cyanide
recoverable μg.L
-1 70 - -
Iron μg.L-1
30 100 -
Lead μg.L-1
10 10 10
Manganese μg.L-1
100 50 400
Mercury μg.L-1
6 1 6
Nickel μg.L-1
70 - 70
Selenium μg.L-1
10 20 10

Natacha Martin – Mémoire de fin d’études
Promotion Paris 2014-2017
84
Appendix 8C: Irrigation standards for unrestricted irrigation
Determinands Unit Botswana BOBS
463:2011
South Africa
1999 WHO 2006
Dissolved
Oxygen mg.L
-1 - - -
pH
6.5 - 8.4 6.5 - 8.4 -
EC μS.cm-1
3000 4000 -
Turbidity NTU - - -
TDS mg.L-1
2000 50 -
Calcium mg.L-1
- - -
Magnesium mg.L-1
- 0.02 -
Sodium mg.L-1
230 70 -
Nitrate mg.L-1
30 5 -
Phosphate mg.L-1
- - -
Potassium mg.L-1
- - -
Chloride mg.L-1
350 - -
Sulphate mg.L-1
200 - -
Iron mg.L-1
5 5 -
Manganese mg.L-1
0.2 0.02 -
Copper mg.L-1
0.1 0.2 -
Lead mg.L-1
- 0.2 -
Intestinal
Enterococci /100mL - - -
Faecal coliform /100mL <1000 <10000 <1000

Natacha Martin – Mémoire de fin d’études
Promotion Paris 2014-2017
85
Appendix 9: WWTP in the RTBAA
WWTP
Facilities
Date
construction
Second
phase date Design type
Design
inflow m3.d
-1
Current
inflow m3.d
-1
Outflow
m3.d
-1
Compliance Sludge
Treatment Reuse
Glen valley
and
Gaborone
ponds
1996 2001 Activated
sludge 90000 65000 33000 Yes Filter Press Agriculture
Tlokweng
Technical
Training
Centre
2002 No Wetland 20 20 19 Yes No Sportsfield
Saint
Joseph’s
College
1996 No Ponds 100 100 40 Yes - No
Mokolodi
Game
Reserve
2002 No Wetland 10 10 10 Yes No No
Adventist
Hospital No data No
Rotating
Biological
Contractors
20 20 20 Yes - Gardens
Kanye
Prison 1997 No Wetland 25 30 29 Yes No
Vegetable
gardens
Kanye
Education
Centre
2001 No Ponds 106 50 0 - No -
Ramatea
College 1998 No Wetland 15 15 14 Yes No No
NAFTEC 2000 No Wetland 10 10 10 - No No

Natacha Martin – Mémoire de fin d’études
Promotion Paris 2014-2017
86
WWTP
Facilities
Date
construction
Second
phase date Design type
Design
inflow
m3.d
-1
Current
inflow m3.d
-1
Outflow
m3.d
-1
Compliance Sludge
Treatment Reuse
Seepapitso
School 1996 No Ponds 100 425 170
No,
overloaded No No
Ramotswa 1981 2001 Ponds 3000 1500
600,
No outflow
during dry
season
No No No
Swartkopfontein
Border Post - -
Oxidation
Ponds >200 - - Yes - -
Otse Police
College 2000 No
Rotating
Biological
Contractors
260 200 200 Yes - Gardens
Otse Moeding
College 1998 No
Rotating
Biological
Contractors
50 50 50 Yes - Sportsfield
BMC 1978 No Ponds 1700 1000 400 No Dumping
site No
Lobatse 1989 1995 Ponds 6200 3100 1240 No Dumping
site Irrigation
Skilpadshek
Border Post 2008 - Reed beds >200 - - Yes - -
Motswedi 1980 No
Bioreactor,
Chlorination
tank
80 Not in operation
Lehurutshe 1980 No Oxidation
Ponds 1500 900 360 No No No
Zeerust 1960 1993 Activated
sludge 3500 4000 2200 No
Sludge
lagoons` No

Natacha Martin – Mémoire de fin d’études
Promotion Paris 2014-2017
87

Natacha Martin – Mémoire de fin d’études
Promotion Paris 2014-2017
88
Appendix 10: Mass balances between water supply and wastewater treated
Population
2011
Water
consumption
m3/d/person
Total water
consumption
m3/d
Percent
connected
to sewage
%
Wastewater
treated in
WWTP
m3/d
WWTP
current
inflow
m3/d
Wastewater
stored in
on-site
sanitation
m3/day
Comments
Gaborone
–
Tlokweng
268932 0.22 58324 65 55191 65130 3133 Wastewater from on-site
sanitation dislodged in WWTP
Kanye 45196 0.11 4824 20 3644 540 1180 On-site sanitation
contaminating aquifer
Lobatse 29007 0.19 5548 62 5189 3100 360 Wastewater from on-site
sanitation dislodged in WWTP
Zeerust 9093 0.19 1739 95 1724 4000 15 Contamination from WWTP
discharge
Ramotswa 30382 0.06 1787 60 1390 1500 397 On-site sanitation and WWTP
contaminating aquifer
Others
areas in
Botswana
10956 0.04 427 40 213 250 215 On-site sanitation
contaminating aquifer.
Others
areas in
South
Africa
141222 0.03 4590 26 1179 900 3411 On-site sanitation
contaminating aquifer

Natacha Martin – Mémoire de fin d’études
Promotion Paris 2014-2017
89
Area
Minimum water
consumption
m3/d/person on
census
Maximum water
consumption
m3/d/person on
census
Minimum
wastewater treated
in WWTP m3/d
Maximum
wastewater treated
in WWTP m3/d
Minimum
wastewater
infiltrating from on-
site sanitation
m3/day
Maximum
wastewater
infiltrating from on-
site sanitation
m3/day
Gaborone 0.175 0.386 29494 65056
467 5293
Tlokweng 0.078 0.171 2272 4982
Kanye 0.075 0.131 1377 3644 176 1994
Lobatse 0.148 0.252 2591 5189 54 608
Zeerust 0.148 0.252 1341 2284 2 25
Ramotswa 0.022 0.074 522 1754 59 670
Others areas in
Botswana 0.018 0.06 178 394 32 362
Others areas in
South Africa 0.015 0.05 578 1926 508 5762

Natacha Martin – Mémoire de fin d’études
Promotion Paris 2014-2017
90
Appendix 11: Conversion method of evaporation to
evapotranspiration
In this part, the conversion method of evaporation to evapotranspiration given by the Department of
Water and Sanitation of South Africa is explained. Two types of evaporation readings are given, one is
for class A evaporation (station: Molatedi) and the second one is data from Symons tank (stations: Li-
Maricopoort and Marico-Bosveld).
To convert evaporation readings to reservoir data:
- For Symons tank to reservoir:
𝐸𝑣𝑎𝑝𝑜𝑡𝑟𝑎𝑛𝑠𝑝𝑖𝑟𝑎𝑡𝑖𝑜𝑛𝑆𝑦𝑚𝑜𝑛𝑠 𝑡𝑎𝑛𝑘 = 𝑚𝑜𝑛𝑡ℎ𝑙𝑦 𝑓𝑎𝑐𝑡𝑜𝑟 × 𝑒𝑣𝑎𝑝𝑜𝑟𝑎𝑡𝑖𝑜𝑛
Monthly factor
January 0.84 July 0.83
February 0.88 August 0.81
March 0.88 September 0.81
April 0.88 October 0.81
May 0.87 November 0.82
June 0.85 December 0.83
- For Class A: same method as Symons tank, then divided by 1.3,
𝐸𝑣𝑎𝑝𝑜𝑡𝑟𝑎𝑛𝑠𝑝𝑖𝑟𝑎𝑡𝑖𝑜𝑛𝐶𝑙𝑎𝑠𝑠 𝐴 =𝑚𝑜𝑛𝑡ℎ𝑙𝑦 𝑓𝑎𝑐𝑡𝑜𝑟 × 𝑒𝑣𝑎𝑝𝑜𝑟𝑎𝑡𝑖𝑜𝑛
1.13
Appendix 12: Conceptual model of a karst aquifer [105]

Natacha Martin – Mémoire de fin d’études
Promotion Paris 2014-2017
91
Appendix 13: Spatial distribution of sum of nitrate and nitrite in the
RTBAA [59]

Natacha Martin – Mémoire de fin d’études
Promotion Paris 2014-2017
92
Appendix 14: Monthly and annual average calculation of natural
recharge
Appendix 15: Rainfall and evaporation trends
Rainfall and evaporation totals are grouped by season, stations and percentile, respectively in Figure
33 and Figure 34. The regression analysis is realized by the software R (the R project for statistical
computing) with the following equation:
𝑠𝑒𝑎𝑠𝑜𝑛𝑎𝑙 𝑡𝑜𝑡𝑎𝑙 𝑟𝑎𝑖𝑛𝑓𝑎𝑙𝑙 𝑜𝑟 𝑒𝑣𝑎𝑝𝑜𝑟𝑎𝑡𝑖𝑜𝑛 ~ 𝑦𝑒𝑎𝑟 ∗ 𝑝𝑒𝑟𝑐𝑒𝑛𝑡𝑖𝑙𝑒 𝑔𝑟𝑜𝑢𝑝 ∗ 𝑠𝑒𝑎𝑠𝑜𝑛
An example of code is presented below. This code matches the analysis of rainfall during the wet
season.
#Data loading
setwd(dir="H:/stat/Rainfall_DATA")
dataw<-read.table(file="rain_wet_sea.txt",dec=".",sep="",header=TRUE)
#Percentile wet season
quantile(dataw[,3], probs = seq(0, 1, 0.1), na.rm = FALSE,names = TRUE, type = 5)
#result percentile wet season
#0% 10% 20% 30% 40% 50% 60% 70% 80% 90% 100%

Natacha Martin – Mémoire de fin d’études
Promotion Paris 2014-2017
93
#29.7 235.21 307.23 347.41 387.89 438 480.72
539.75 582.91 666.63 907
#Data loading with percentile
setwd(dir="H:/stat/Rainfall_DATA")
datawt<-read.table(file="rain_wet_sea_trier.txt",dec=".",sep="",header=TRUE)
#creation table wett10
wett10<-datawt[datawt[,4]!="0.5",]
wett10<-wett10[wett10[,4]!="0.9",]
#creation table wett90
wett90<-datawt[datawt[,4]!="0.5",]
wett90<-wett90[wett90[,4]!="0.1",]
#creation table wett50
wett50<-datawt[datawt[,4]!="0.1",]
wett50<-wett50[wett50[,4]!="0.9",]
#creation table wli10, wli50, wli90
wli10<-wett10[wett10[,1]!="Maric",]
wli10<-wli10[wli10[,1]!="Molat",]
wli10<-wli10[wli10[,1]!="Gabor",]
wli10<-wli10[wli10[,1]!="Ramot",]
wli10<-wli10[wli10[,1]!="Lobat",]
wli50<-wett50[wett50[,1]!="Maric",]
wli50<-wli50[wli50[,1]!="Molat",]
wli50<-wli50[wli50[,1]!="Gabor",]
wli50<-wli50[wli50[,1]!="Ramot",]
wli50<-wli50[wli50[,1]!="Lobat",]
wli90<-wett90[wett90[,1]!="Maric",]
wli90<-wli90[wli90[,1]!="Molat",]
wli90<-wli90[wli90[,1]!="Gabor",]
wli90<-wli90[wli90[,1]!="Ramot",]
wli90<-wli90[wli90[,1]!="Lobat",]

Natacha Martin – Mémoire de fin d’études
Promotion Paris 2014-2017
94
#creation table wma10, wma50, wma90
wma10<-wett10[wett10[,1]!="LiMar",]
wma10<-wma10[wma10[,1]!="Molat",]
wma10<-wma10[wma10[,1]!="Gabor",]
wma10<-wma10[wma10[,1]!="Ramot",]
wma10<-wma10[wma10[,1]!="Lobat",]
wma50<-wett50[wett50[,1]!="LiMar",]
wma50<-wma50[wma50[,1]!="Molat",]
wma50<-wma50[wma50[,1]!="Gabor",]
wma50<-wma50[wma50[,1]!="Ramot",]
wma50<-wma50[wma50[,1]!="Lobat",]
wma90<-wett90[wett90[,1]!="LiMar",]
wma90<-wma90[wma90[,1]!="Molat",]
wma90<-wma90[wma90[,1]!="Gabor",]
wma90<-wma90[wma90[,1]!="Ramot",]
wma90<-wma90[wma90[,1]!="Lobat",]
#creation table wmo10, wmo50, wmo90
wmo10<-wett10[wett10[,1]!="LiMar",]
wmo10<-wmo10[wmo10[,1]!="Maric",]
wmo10<-wmo10[wmo10[,1]!="Gabor",]
wmo10<-wmo10[wmo10[,1]!="Ramot",]
wmo10<-wmo10[wmo10[,1]!="Lobat",]
wmo50<-wett50[wett50[,1]!="LiMar",]
wmo50<-wmo50[wmo50[,1]!="Maric",]
wmo50<-wmo50[wmo50[,1]!="Gabor",]
wmo50<-wmo50[wmo50[,1]!="Ramot",]
wmo50<-wmo50[wmo50[,1]!="Lobat",]
wmo90<-wett90[wett90[,1]!="LiMar",]
wmo90<-wmo90[wmo90[,1]!="Maric",]
wmo90<-wmo90[wmo90[,1]!="Gabor",]
wmo90<-wmo90[wmo90[,1]!="Ramot",]
wmo90<-wmo90[wmo90[,1]!="Lobat",]

Natacha Martin – Mémoire de fin d’études
Promotion Paris 2014-2017
95
#creation table wga10, wga50, wga90
wga10<-wett10[wett10[,1]!="LiMar",]
wga10<-wga10[wga10[,1]!="Maric",]
wga10<-wga10[wga10[,1]!="Molat",]
wga10<-wga10[wga10[,1]!="Ramot",]
wga10<-wga10[wga10[,1]!="Lobat",]
wga50<-wett50[wett50[,1]!="LiMar",]
wga50<-wga50[wga50[,1]!="Maric",]
wga50<-wga50[wga50[,1]!="Molat",]
wga50<-wga50[wga50[,1]!="Ramot",]
wga50<-wga50[wga50[,1]!="Lobat",]
wga90<-wett90[wett90[,1]!="LiMar",]
wga90<-wga90[wga90[,1]!="Maric",]
wga90<-wga90[wga90[,1]!="Molat",]
wga90<-wga90[wga90[,1]!="Ramot",]
wga90<-wga90[wga90[,1]!="Lobat",]
#creation table wra10, wra50, wra90
wra10<-wett10[wett10[,1]!="LiMar",]
wra10<-wra10[wra10[,1]!="Maric",]
wra10<-wra10[wra10[,1]!="Molat",]
wra10<-wra10[wra10[,1]!="Gabor",]
wra10<-wra10[wra10[,1]!="Lobat",]
wra50<-wett50[wett50[,1]!="LiMar",]
wra50<-wra50[wra50[,1]!="Maric",]
wra50<-wra50[wra50[,1]!="Molat",]
wra50<-wra50[wra50[,1]!="Gabor",]
wra50<-wra50[wra50[,1]!="Lobat",]
wra90<-wett90[wett90[,1]!="LiMar",]
wra90<-wra90[wra90[,1]!="Maric",]
wra90<-wra90[wra90[,1]!="Molat",]
wra90<-wra90[wra90[,1]!="Gabor",]
wra90<-wra90[wra90[,1]!="Lobat",]
#creation table wlo10, wlo50, wlo90

Natacha Martin – Mémoire de fin d’études
Promotion Paris 2014-2017
96
wlo10<-wett10[wett10[,1]!="LiMar",]
wlo10<-wlo10[wlo10[,1]!="Maric",]
wlo10<-wlo10[wlo10[,1]!="Molat",]
wlo10<-wlo10[wlo10[,1]!="Gabor",]
wlo10<-wlo10[wlo10[,1]!="Ramot",]
wlo50<-wett50[wett50[,1]!="LiMar",]
wlo50<-wlo50[wlo50[,1]!="Maric",]
wlo50<-wlo50[wlo50[,1]!="Molat",]
wlo50<-wlo50[wlo50[,1]!="Gabor",]
wlo50<-wlo50[wlo50[,1]!="Ramot",]
wlo90<-wett90[wett90[,1]!="LiMar",]
wlo90<-wlo90[wlo90[,1]!="Maric",]
wlo90<-wlo90[wlo90[,1]!="Molat",]
wlo90<-wlo90[wlo90[,1]!="Gabor",]
wlo90<-wlo90[wlo90[,1]!="Ramot",]
plot(datawt$year,datawt$mm,col="white",xlab="Wet season in year",ylab="Rainfall
in mm")
points(wli10$year,wli10$mm,pch=1,col="green")
points(wli50$year,wli50$mm,pch=1,col="red")
points(wli90$year,wli90$mm,pch=1,col="blue")
points(wma10$year,wma10$mm,pch=2,col="green")
points(wma50$year,wma50$mm,pch=2,col="red")
points(wma90$year,wma90$mm,pch=2,col="blue")
points(wmo10$year,wmo10$mm,pch=3,col="green")
points(wmo50$year,wmo50$mm,pch=3,col="red")
points(wmo90$year,wmo90$mm,pch=3,col="blue")
points(wga10$year,wga10$mm,pch=4,col="green")
points(wga50$year,wga50$mm,pch=4,col="red")
points(wga90$year,wga90$mm,pch=4,col="blue")
points(wra10$year,wra10$mm,pch=5,col="green")
points(wra50$year,wra50$mm,pch=5,col="red")
points(wra90$year,wra90$mm,pch=5,col="blue")
points(wlo10$year,wlo10$mm,pch=6,col="green")

Natacha Martin – Mémoire de fin d’études
Promotion Paris 2014-2017
97
points(wlo50$year,wlo50$mm,pch=6,col="red")
points(wlo90$year,wlo90$mm,pch=6,col="blue")
w10<-lm(wett10$mm~wett10$year)
summary(w10)
anova(w10)
w10
abline(w10,col="green")
pred.frame<-data.frame(wett10$year)
pred10 <- predict(w10, interval="confidence",level=.9,newdata=pred.frame)
lines(smooth.spline(wett10$year,pred10[,2]),col="green")
lines(smooth.spline(wett10$year,pred10[,3]),col="green")
w50<-lm(wett50$mm~wett50$year)
summary(w50)
anova(w50)
w50
abline(w50,col="red")
pred.frame<-data.frame(wett50$year)
pred50 <- predict(w50, interval="confidence",level=.9,newdata=pred.frame)
lines(smooth.spline(wett50$year,pred50[,2]),col="red")
lines(smooth.spline(wett50$year,pred50[,3]),col="red")
w90<-lm(wett90$mm~wett90$year)
summary(w90)
anova(w90)
w90
abline(w90,col="blue")
pred.frame<-data.frame(wett90$year)
pred90 <- predict(w90, interval="confidence",level=.9,newdata=pred.frame)
lines(smooth.spline(wett90$year,pred90[,2]),col="blue")
lines(smooth.spline(wett90$year,pred90[,3]),col="blue")

Natacha Martin – Mémoire de fin d’études
Promotion Paris 2014-2017
98
Appendix 16: Introduction translated in french
Dans la région de l’aquifère transfrontalier de Ramotswa, située au nord du Limpopo entre le Botswa-
na et l’Afrique du Sud, les étendues d’eau de surface sont devenues rares et dépendent des saisons.
Ainsi, la population est devenue lourdement dépendante de la ressource en eau souterraine. Etant don-
né cette dépendance, il est important que la qualité d’une telle eau soit assurée afin d’éviter des im-
pacts sur la santé des consommateurs. Cependant, les conditions sociales et économiques ont mené le
Botswana et l’Afrique du Sud à développer un système d’assainissement autonome reposant principa-
lement sur l’emploi de latrines, dont l’utilisation est en lien avec la pollution des ressources en eau
dans d’autres régions [6 ; 7]. C’est pourquoi il est essentiel d’évaluer la qualité et la quantité actuelle
de la ressource en eau, ainsi que les risques de pollution dans la région de l’aquifère transfrontalier de
Ramotswa.
Malgré quelques études sur la qualité de l’eau et la pollution dans la région, aucune étude axée sur la
totalité de l’aquifère n’a été entreprise. Quelques études hydrogéologiques ont été réalisées à Ramots-
wa et Lobatse, respectivement par Beger [8] et Staudt [9]. Ces rapports exposent les différentes carac-
téristiques de l’aquifère transfrontalier de Ramotswa du côté du Botswana et dénoncent la forte con-
centration en nitrate, source de pollution de l’eau. Contrairement à cette étude qui prête attention aux
deux pays chevauchés par l’aquifère, les précédentes investigations n’ont étudié l’aquifère que du côté
du Botswana. En effet, Ranganai [1] a lié l’extrême vulnérabilité de la ressource en eau souterraine à
la pollution anthropique due au développement de l’assainissement. En effet, de nombreux ouvrages
tels que des fosses septiques, des latrines, des rejets de station d’épuration et des décharges sont situés
à proximité du champ de captage d’eau potable de Ramotswa. Ces études montrent également que les
sources de pollution se trouvent à même profondeur que le niveau d’eau souterrain. Les caractéris-
tiques de l’aquifère et du sol telles que la profondeur du niveau d’eau, ou encore la nature de la ma-
trice du sol, sont des paramètres clés impliqués dans le développement du processus de pollution de
l’aquifère.
La présente étude évalue les impacts du système d’assainissement sur la qualité et la quantité de l’eau
souterraine dans la région de l’aquifère transfrontalier de Ramotswa à cheval sur le Botswana et
l’Afrique du Sud. Les informations nécessaires à cette étude ont été collectées à l’aide d’une analyse
de documents, d’entretiens avec les locaux, et d’échantillonnage d’eaux usées. Une carte GIS a été
établie afin de déterminer les zones les plus vulnérables de l’aquifère et les sources de pollution. Les
résultats de cette évaluation des risques ont été utilisés afin de conseiller une amélioration du système
d’assainissement tout en tenant compte du contexte social, du climat et des conditions économiques
des deux pays affectés. Les eaux usées sont considérées comme la « nouvelle eau » dans les pays où
l’eau est une denrée rare. Certaines alternatives, comme la réutilisation des eaux usées, sont proposées
pour l’agriculture, la recharge d’aquifère, et la réutilisation domestique.
1. Présentation de la zone d’étude
La zone d’étude est la région de l’aquifère transfrontalier de Ramotswa (RTBAA) situé entre le Bots-
wana et l’Afrique du Sud. La RTBAA chevauche la frontière entre les deux pays. La délimitation de la
RTBAA est le bassin versant de Gaborone. Cependant, cette étude cible ce bassin versant et s’étend
sur les districts administratifs du Sud-Est du Botswana et du Nord-Ouest de l’Afrique du Sud. Du côté

Natacha Martin – Mémoire de fin d’études
Promotion Paris 2014-2017
99
du Botswana, l’étude porte sur la région Sud-Est et une partie de la région sud. La population y est très
densifiée et se concentre sur les deux capitales juridique et économique, Lobatse et Gaborone. Cette
régions est majoritairement urbaine avec une forte croissance économique. A contrario, la municipalité
locale de Ramotshere Moiloa de la province Nord-Ouest d’Afrique du Sud compose la partie sud-
africaine de l’étude. Cette municipalité locale s’étend sur 7193 km² et dispose d’une croissance éco-
nomique stagnante avec une densité de population faible. La zone urbaine principale se nomme Zee-
rust.
Figure 38: Carte de la région de l’aquifère transfrontalier de Ramotswa.
La RTBAA dispose d’un climat semi-aride. L’année est divisée en deux saisons. L’hiver se caractérise
par une saison sèche avec un fort taux d’évaporation et a lieu d’avril à septembre. Au contraire,
d’octobre à mars a lieu l’été connu sous le nom de la saison des pluies. Les pluies apparaissent lors de
cette période. Les températures moyennes annuelles varient entre 18 et 20°C.
L’aquifère de Ramotswa se situe précisément dans le sous-bassin versant de Ngotwane, présent dans
la partie haute du bassin fluvial du Limpopo. Géologiquement, la zone d’étude est dans la partie ouest
du Transvaal Supergroup dans le Kraapvaal Craton. L’unité principale de l’aquifère est la dolomie. La
dolomie de Ramotswa est introduite par trois failles verticales créant des compartiments. L’aquifère de
dolomie à Ramotswa est fracturé et possède des zones karstiques avec une forte transmissivité et un
fort coefficient d’emmagasinement. L’aquifère se recharge naturellement par les pluies. Le niveau
moyen d’eau souterraine est de 9 mètres sous le sol. Il existe entre 0 et 12 mètres d’épaisseur de sur-
face sédimentaire non consolidée [2]. La qualité de l’eau souterraine est essentielle dans la RTBAA
étant donné son utilisation pour l’agriculture (69%), l’industrie (1%), et particulièrement l’eau potable
(30%) [2].
La RTBAA s’étend sur 10533 km² et recensait une population de 534 788 en 2011. Actuellement, 50%
de la population est connecté à un réseau d’assainissement communal tandis que plus de 50% de la
population dispose d’un système d’assainissement autonome tel que des latrines. Les latrines doivent
leur importance aux variations climatiques, plus particulièrement la sécheresse qui limite la consom-
mation d’eau. En zone urbaine, les latrines sont plus ou moins bien maintenues et sont vidangées puis

Natacha Martin – Mémoire de fin d’études
Promotion Paris 2014-2017
100
transférées en entrée de station d’épuration. En zone rurale, les latrines sont entretenues selon les
moyens des habitants. L’activité principale de la région est l’agriculture. Les eaux souterraines sont
aussi utilisées afin d’irriguer les champs et abreuver les animaux.
2. Présentation de la structure d’accueil: l’International Water Manage-
ment Institute
L’International Water Management Institute dirige le projet de l’aquifère transfrontalier de Ramotswa
en partenariat avec le Ministère de l’Eau et de l’Assainissement d’Afrique du Sud, le Ministère des
Eaux du Botswana, Limpopo Watercourse Commission, Southern African Development Community,
et les universités des environs. L’International Water Management Institute est une organisation de
recherche scientifique sans but lucratif s’intéressant au développement durable des ressources dans les
pays en voie de développement en Afrique et en Asie. Le projet Ramotswa a été développé en 2015
pour soutenir la gestion et la coopération des ressources en eau souterraine partagées dans la région
supérieure du Limpopo afin de réduire la pauvreté, l’inégalité et l’insécurité. Les objectifs principaux
du projet Ramotswa sont de comprendre l’importance socio-économique de l’aquifère dans la région,
évaluer la faisabilité de la recharge artificielle de l’aquifère, établir la coopération entre les deux pays
et améliorer la gestion et le contrôle de la ressource. Les attentes de ce projet sont la mise en place
d’échanges entre les différents parties, un plan d’action stratégique pour le développement et la gestion
de l’aquifère, une analyse diagnostique transfrontalière, un outil pédagogique pour développer la maî-
trise du système et un système de gestion de l’information dénommé RIMS et géré par l’IGRAC.
3. Méthodes employées
Cette étude a été menée en cinq étapes : une analyse de documents, une étude statistique du bilan hy-
drique et de la population, des entrevues et visites, une modélisation de carte de vulnérabilité, et la
détermination des différents enjeux.
i) Analyse de documents
La plupart des documents analysés sont des documents de lois et des rapports environnementaux issus
du Ministère des Eaux du Botswana, du Ministère de l’Eau et de l’Assainissement d’Afrique du Sud,
des organisations présentes dans la zone transfrontalière et les études précédentes réalisées dans la
zone d’étude, telles que les rapports d’hydrogéologie de Michael Staudt [9] et Katharine Beger [8].
L’analyse de documents a été réalisée dans un ordre chronologique et par catégories afin de compléter
et actualiser les données. Les documents ont été classifiés tout d’abord par pays puis en cinq catégo-
ries qui sont les stations d’épuration, les systèmes d’assainissement autonomes, les études hydrogéolo-
giques, les activités développées et les plans de développement pour l’environnement.
ii) Etude statistique du bilan hydrique et de la population
Les rapports de recensement des régions Sud-Est [3] et Sud [4] du Botswana de 2001 et 2011 ont été
collectés. De même, les rapports de recensement de la province Nord-Ouest en Afrique du Sud de
1996 [10], 2001 [11], 2011 [5] et 2016 [12] ont été étudiés. Ces rapports sont utilisés pour évaluer le
taux de croissance de la population, la consommation d’eau par foyer et le développement du système
d’assainissement au cours du temps.

Natacha Martin – Mémoire de fin d’études
Promotion Paris 2014-2017
101
iii) Entrevues et visites
Les visites de terrains ont permis de réaliser des entrevues avec les employés des stations d’épuration
de Lobatse, Ramotswa, et Gaborone [Annexes 2, 3, 4, 6] et de collecter des échantillons d’eaux usées
[Annexe 5, 7]. Les entrevues ont eu lieu afin de préciser la capacité de traitement et le type de traite-
ment des eaux usées. Elles ont également permis d’évaluer l’impact potentiel des rejets d’eaux usées
dans l’environnement et de comprendre les mœurs en termes d’assainissement dans la région. De plus,
les entrevues ont permis de corriger ou confirmer les informations contenues dans les documents con-
cernés. Aucune interview n’a été possible du côté sud-africain.
iv) Modélisation de carte
Les visites et l’analyse de documents ont aidés à créer la carte GIS de la zone d’étude. Le but de cette
carte est de localiser les zones les plus vulnérables en termes de pollution des ressources. Pour cela, la
méthode DRASTIC a été employée pour modéliser la vulnérabilité de l’aquifère, en utilisant la pro-
fondeur du niveau d’eau souterraine, la recharge, les caractéristiques du milieu poreux, les caractéris-
tiques du sol, la topographie, l’impact de la zone non saturée et la conductivité.
v) Détermination des différents enjeux
Après avoir réalisé ces quatre premières étapes, une évaluation du système d’assainissement du Bots-
wana et d’Afrique du Sud a été réalisée. Cette étude compile chaque information dans un ordre chro-
nologique. Cinq enjeux ont été principalement identifiés en combinant les informations de chaque
étape :
- Les zones prioritaires : la carte GIS modélise les différentes zones prioritaires sur lesquelles le
système d’assainissement doit être revu ou amélioré. Ces zones sont sélectionnées selon leur
vulnérabilité en termes de pollution.
- Les eaux industrielles : l’analyse de documents et les visites ont permis d’évaluer la qualité
des rivières et des eaux usées traitées. De fortes concentrations en polluants (métaux lourds,
huile et graisse, et demande chimique en oxygène) ne viennent pas seulement des eaux domes-
tiques traitées. Les activités industrielles sont impliquées dans la détérioration de la qualité des
eaux usées traitées. Dans cette étude, les plus grosses activités industrielles et leurs polluants
ont été déterminés.
- Pollution transfrontalière : l’estimation de la qualité des eaux et la modélisation ont permis de
se concentrer sur la pollution transfrontalière, plus précisément la rivière Ngotwane qui sert de
frontière naturelle. Les eaux de surface et les eaux souterraines sont liées selon l’analyse de
documents.
- Bilan hydrique : une étude statistique du bilan hydrique et de la population montre la con-
sommation d’eau et le nombre d’installation sanitaire en augmentation qui ont un impact sur
l’accroissement des pertes d’eaux contaminées. Le bilan hydrique est quantifié en se basant
sur les statistiques.
- Le changement climatique : les entrevues et les documents montrent que les observations sont
différentes en été et en hiver. De plus, cette région a connu des périodes prolongées de séche-
resse. Le changement climatique a un impact sur les pluies et les taux d’évaporation qui in-
fluent à leur tour sur l’assainissement. Ces données ont été fournies par le Ministère de l’Eau
et de l’Assainissement d’Afrique du Sud et le Ministère des Eaux du Botswana.
Une fois les enjeux établis, des recommandations sont présentées afin d’améliorer le système
d’assainissement. Une meilleure qualité de traitement ainsi que des systèmes d’assainissement mieux
adaptés à la région peuvent aider à diminuer la pollution. Les eaux usées traitées peuvent être au-
jourd’hui un réel bénéfice pour la ressource en eau et les populations.

Natacha Martin – Mémoire de fin d’études
Promotion Paris 2014-2017
102
Appendix 17 : Conclusion translated in french
Dans la région de l’aquifère transfrontalier de Ramotswa, le système d’assainissement est à l’origine
de deux types de pollution. L’une provient des systèmes d’assainissement autonomes. En effet, les
latrines et les fosses septiques polluent l’aquifère à cause du manque d’entretien et de connaissances
de ces ouvrages. De plus, les systèmes d’assainissement autonomes ont besoin d’être améliorés car ils
ne sont pas adaptés aux conditions du sol qui est un sol fracturé avec un niveau d’eau de la nappe éle-
vé, particulièrement durant la saison des pluies. La seconde cause de pollution est le système de station
d’épuration. La qualité des eaux usées traitées ne correspond pas aux limites de rejet imposées par le
gouvernement. Cela vient d’un problème d’efficacité de traitement. En effet, les entrées de station
d’épuration contiennent des eaux domestiques et des eaux industrielles. Or, le traitement implanté
n’est pas adapté au traitement des eaux industrielles. De plus, le manque d’entretien et de surveillance
conduisent à la détérioration du système de traitement. Ces cas de pollution dépendent aussi des condi-
tions climatiques. En effet, l’aquifère est plus vulnérable à l’infiltration provenant des latrines durant
la saison des pluies à cause du niveau d’eau de la nappe élevé. Au contraire, en hiver, l’aquifère est
plus vulnérable aux eaux usées traitées sortant de station d’épuration. Cette période de l’année a un
impact sur l’efficacité de traitement à cause des températures plus basses et de l’exposition solaire
amoindrie. De manière générale, la pollution venant des latrines est la pollution la plus problématique
en se référant au nombre important de latrines dans la région. Une zone de priorité a été délimitée se-
lon les conditions sanitaires. Cette zone s’étend sur 10 km de chaque côté de la frontière allant de Ra-
dikhudu à Ramotswa.
Certaines recommandations ont été proposées afin de diminuer le risque de pollution de l’aquifère.
Ces recommandations peuvent être facilement mises en place mais demandent l’implication de la
communauté sur le long terme. Tout d’abord, il est important de connecter les foyers sans système
d’assainissement au réseau. Puis, le plus important est de réagir face au niveau élevé de la nappe
phréatique. Pour cela, les fosses des latrines doivent être diminuées en taille ou surélevées. De plus,
des plans de développement de la ressource en eau devraient être mis en place. La maintenance et
l’entretien des systèmes sont proposés et peuvent être complétés par l’auto-surveillance. Enfin, en
établissant un plan d’assainissement durable, certains bénéfices peuvent être faits pour la municipalité.
L’amélioration du traitement des boues peut mener à la réutilisation dans le domaine agricole. De
même, une meilleure qualité des eaux usées traitées permettrait de les réutiliser pour l’agriculture et/ou
la recharge d’aquifère.
Différents projets suivent cette étude. L’un d’eux est le développement d’un schéma d’irrigation dans
la RTBAA. Celui-ci consiste en l’amélioration de la gestion de l’irrigation pour les fermes locales en
utilisant des capteurs de surveillance afin d’évaluer la quantité et la qualité d’eau nécessaire en
fonction du type d’agriculture sur des fermes de plus de deux hectars. Ce projet permettrait d’estimer
les besoins en eau pour l’agriculture. Le second projet est la modélisation hydrogéologique de
l’aquifère transfrontalier de Ramotswa. Ce projet a pour but de mieux comprendre le fonctionnement
de la ressource et d’estimer les possibilités de recharge artificielle de l’aquifère à partir de point
d’injection au niveau de la rivière de Ngotwane. La modélisation de l’aquifère est spécifique à un
compartiment transfrontalier de l’aquifère situé à Ramotswa.