assessment of fuel wood supply and demand in displacement ... · 2 problem analysis ... 4.4.1 tree...
TRANSCRIPT

Assessment of fuel wood supply and demand in displacement settings and
surrounding areas in Cox’s Bazaar District
June 2017 Revised November 2017
Dhaka, Bangladesh

2
Since 1992, increasing numbers of Undocumented Myanmar Nationals (UMN) have populated makeshift camps in
Bangladesh’s southern district of Cox’s Bazar; an area of the Chittagong peninsula bordering Myanmar to the east and
the Bay of Bengal to the west.
Livelihood options for UMNs are limited as their status does not allow them to seek employment or own land. Their
subsistence is highly dependent on the surrounding forest resources to supplement limited income generating
potential. Tensions between refugees and host communities most often come in proximity to the makeshift camps
where firewood collection and access to water are the catalysts of conflicts. Without solution, likely in the short term,
there is a consensus to improve safe access to energy and environmental conditions within the region surrounding
makeshift camps.
In this context, the International Organization for Migration (IOM) and the Food and Agriculture Organization (FAO),
with support from the Bangladesh Forestry Department (BFD), seek to assess the fuel wood supply and demand
dynamics of populations in proximity of the Makeshift Settlements of Kutupalong, Leda and of the Shamlapur mixed
Settlement in the Cox’s Bazaar District.
Understanding the relationships between the energy requirements and the rate of local fuel wood resources
degradation assists in determining the stocking rates required to achieve successful reforestation/afforestation
programs. The outcomes provide the information required to generate intervention strategies that promote
sustainable natural resource management and efficient energy consumption within the surrounding communities.
CONTACTS:
Matieu Henry
Chief Technical Advisor
Food & Agriculture Organization of The United
Nations
Email: [email protected]
Irine Loria
Protection Officer
International Organization for Migration of the
United Nations
Email: [email protected]
Citation: IOM & FAO (2017). Assessment of fuel wood supply and demand in displacement settings and surrounding
areas in Cox’s Bazaar District, Dhaka, Bangladesh.
Disclaimer
This report does not reflect the official position of the supporting international agencies including IOM and FAO or the
Forestry Department of Bangladesh and should not be used for official purposes. Should readers find any errors in the
document or would like to provide comments for improving its quality they are encouraged to contact one of above
contacts.

3
TABLE OF CONTENTS
ACKNOWLEDGMENTS ............................................................................................................................................ 6
ABBREVIATIONS ..................................................................................................................................................... 7
GLOSSARY ............................................................................................................................................................. 8
LIST OF FIGURES ..................................................................................................................................................... 9
LIST OF TABLES .................................................................................................................................................... 11
EXECUTIVE SUMMARY ......................................................................................................................................... 13
1 INTRODUCTION ............................................................................................................................................ 15
1.1 General context ................................................................................................................................................. 15
1.2 Undocumented Myanmar Nationals in Bangladesh ......................................................................................... 15
1.3 Objectives .......................................................................................................................................................... 16
1.4 Broad methodology .......................................................................................................................................... 16
1.5 Area of interest ................................................................................................................................................. 17
1.6 Population ......................................................................................................................................................... 18
2 PROBLEM ANALYSIS...................................................................................................................................... 20
3 ASSESSING DEMAND .................................................................................................................................... 21
3.1 Methodology ..................................................................................................................................................... 21
3.1.1 Research design......................................................................................................................................... 21
3.1.2 Sampling strategy ..................................................................................................................................... 21
3.1.3 Tools development .................................................................................................................................... 21
3.1.4 Data collection .......................................................................................................................................... 22
3.1.5 Data collection strategy ............................................................................................................................ 22
3.1.6 Assessment quality .................................................................................................................................... 23
3.1.7 Data analysis ............................................................................................................................................. 23
3.1.8 Language of assessment ........................................................................................................................... 23
3.1.9 Assessment team ...................................................................................................................................... 23
3.2 Findings on population and social units ............................................................................................................ 23
3.2.1 Assessment sites, population, households, other social units ................................................................... 24
3.2.2 Household survey respondents ................................................................................................................. 25
3.2.3 Survey population, ratio and age group ................................................................................................... 26
3.2.4 Education Status ....................................................................................................................................... 26
3.2.5 Household Economic Activities .................................................................................................................. 27
3.2.6 Role of Women in Household Income ....................................................................................................... 30
3.2.7 Labor Seasonal Influence and Coping ....................................................................................................... 31
3.3 Assessment of energy consumption ................................................................................................................. 32
3.3.1 Consumption of wood fuel ........................................................................................................................ 32
3.3.2 Wood fuel collection dynamics ................................................................................................................. 33
3.3.3 Energy Consumption for Cooking .............................................................................................................. 36
3.3.4 Expenditure on Cooking Energy ................................................................................................................ 38
3.4 Screening technologies and local practices for cooking ................................................................................... 39

4
3.4.1 Cooking System and Energy ...................................................................................................................... 39
3.4.2 Cooking practices and food types related to wood fuel consumption ...................................................... 41
3.4.3 Opinions towards Alternative Cooking Energy .......................................................................................... 42
3.4.4 Energy Sources in Local Market ................................................................................................................ 42
3.5 Multi-Sectoral Challenges ................................................................................................................................. 43
3.5.1 Health Implications due to use of wood fuel ............................................................................................. 43
3.5.2 Challenges of Wood fuel Collection ........................................................................................................... 44
3.5.3 Displaced Women in Difficulties ................................................................................................................ 45
3.5.4 Vulnerable Groups ..................................................................................................................................... 46
3.5.5 Causes of conflict....................................................................................................................................... 46
3.5.6 Access to Services and Resources .............................................................................................................. 47
3.5.7 Relations with Host Community ................................................................................................................ 47
3.5.8 Perceived environmental degradation ...................................................................................................... 48
4 ASSESSING SUPPLY ....................................................................................................................................... 49
4.1 Objective ........................................................................................................................................................... 49
4.2 Sampling design ................................................................................................................................................ 49
4.3 Field procedure ................................................................................................................................................. 51
4.3.1 Field team .................................................................................................................................................. 51
4.3.2 Plot location identification and plot establishment .................................................................................. 51
4.3.3 Field measurement .................................................................................................................................... 51
4.3.4 Bio-physical attributes measurement ....................................................................................................... 51
4.3.5 Equipment used ......................................................................................................................................... 52
4.4 Biomass estimation ........................................................................................................................................... 53
4.4.1 Tree biomass ............................................................................................................................................. 53
4.4.2 Stump biomass .......................................................................................................................................... 53
4.4.3 Basal area .................................................................................................................................................. 53
4.4.4 Tree species diversity and recruitment status ........................................................................................... 53
4.4.5 Social Forestry intervention ....................................................................................................................... 54
4.5 Results ............................................................................................................................................................... 54
4.5.1 Fuel wood stock results ............................................................................................................................. 54
4.5.2 Biophysical results ..................................................................................................................................... 55
4.5.3 Species diversity ........................................................................................................................................ 56
4.5.4 Social forestry plantation in different forest ranges ................................................................................. 56
4.6 Remote sensing ................................................................................................................................................. 58
4.6.1 Available input data .................................................................................................................................. 58
4.6.2 Satellite data characteristics and pre-processing ..................................................................................... 59
4.6.3 Processing chain ........................................................................................................................................ 60
4.6.4 Tools for remote sensing data processing................................................................................................. 62
4.6.5 Results of land cover change analysis ....................................................................................................... 63
4.6.6 Limitations of the remote sensing analysis ............................................................................................... 72
5 INTEGRATION OF DEMAND AND SUPPLY ....................................................................................................... 73
5.1 Summary of demand and supply findings......................................................................................................... 73
5.2 Combined stepwise approach ........................................................................................................................... 74

5
5.2.1 Short term action: improve technology .................................................................................................... 75
5.2.2 Middle term actions: stabilize land ........................................................................................................... 76
5.2.3 Long term actions: afforestation plan ....................................................................................................... 76
6 CONCLUSION ................................................................................................................................................ 79
7 REFERENCES ................................................................................................................................................. 81
8 ANNEXES ...................................................................................................................................................... 84
8.1 Annex 1: Social maps prepared during the analysis ......................................................................................... 84
8.2 Annex 2 ............................................................................................................................................................. 88
8.3.1. Vulnerability of women and childcare ...................................................................................................... 89
8.3.2. Gender based livelihoods activity .............................................................................................................. 89
8.3.3. Gender based homestead activities .......................................................................................................... 89
8.3.4. Seasonal calendar of activities .................................................................................................................. 90
8.3.5. Gender based mobility map. ..................................................................................................................... 90
8.3.6. Gender in household’s decisions ............................................................................................................... 90

6
ACKNOWLEDGMENTS
This report was written by Rémi d’Annunzio, Ikbal Faruk, Rajib Mahamud and Liam Costello.
The authors wish to thank Matieu Henry, Mariam Akhter, Laskar Rahman, Michael Hewitt, Irine Loria andPravina
Gurung for guidance and useful comments on the structure of the report and findings.
This work was financially supported by IOM with the technical support from FAO and the Bangladesh Forest Inventory
team.
The following people are thanked for their precious contribution during field data collection,
- for the demand part: N Haider, Zia Uddin Ahmed, SM Rashida Khatun, Noman Pervej Shah, Shekh Ahmed, Shewli
Zaman Rifa, Shahriar Ahmed, Nazma Akhter, Taslima Akhter, Malaking Chakma, Rifat Hasan, Rasedul Alam, Bibi
Mariam
- for the supply part: Golam Kibria, Ziaur Rahman, Mr. Mamun Mia, Mr. Sohel Al Mamun, Sona Mia, Bijoy
Tanchyanga, Habibur Rahman, Belal Hosen. Special thanks go to Mr Fazlay Arafat for his dedication during above-
ground biomass data collection.

7
ABBREVIATIONS
AGB Above-ground biomass
AOI Area of interest
BA Basal Area
BFD Bangladesh Forest Department
BFI Bangladesh Forest Inventory
BGB Border Guard Bangladesh
BMC Block management committee
CMC Camp management committee
DBH Diameter at Breast Height
FAO Food and Agriculture organization of the United Nations
FGD Focus Group Discussions
FSC Food consumption ratio
HCR High committee on Refugees
HDD Household Dietary Diversity
HH Households
IGA Income generating activities
IOM International Office on Migration
PRA Participatory Rural Appraisal
RR Registered refugee
RS Remote sensing
SF Social Forestry
SSI Semi structured interviews
UMN Undocumented Myanmar’s Nationals
UPC Union Parisad Chairperson

8
GLOSSARY
Bondhu Chula Literally "friendly stove". A cooking stove made of concrete and cement by IDCOL and distributed among the UMNs at Leda Makeshift Camp.
Chittagonian Language The local dialect/language spoken by the people of coastal districts adjacent to Bay of Bengal. It is estimated that 13 million Bangladeshi speak Chittagonian.
Displaced Households The displaced households considered under this assessment are the overall Myanmar nationals who are registered and un-registered.
Fuelwood Unprocessed wood, sticks or logs used as a source of energy.
Makeshift Settlement Makeshift settlement are characterized as settlements where displaced people are forced to live in temporary construction shelters, aside from the host community village.
Mixed Settlement Mixed settlements are settlements where the displaced people live in the same location along with the host community.
Rohingya From late 1991 to till November 2016 the people from the North Rakhine State (NRS) of Myanmar migrated to Cox’s Bazar Bangladesh, commonly referred to as the Rohingya.
Rohingya Language Certain type of language which has a mix of Rakhine and Chittagonian local dialects and spoken by the Rohingya people.
Satellite imagery Very high-resolution imagery Satellite (usually optical) imagery with resolution higher than 5m on the ground.
Union Parisad The Union Parisad is located under the sub-district. Usually more than one Union Parisads are located under each sub-district.
Ward Each Union Parisad is divided into nine wards. Under each ward can one or more villages be located. The displaced people in the makeshift settlement are living in settlements next to the villages of the host community but under the same ward. In the mixed settlement, the displaced people and host community are living in the same village under the same ward.
Wood fuel Wood fuel is a fuel, such as firewood, charcoal, chips, sheets, pellets, and sawdust.

9
LIST OF FIGURES
Figure 1: Administrative map of Bangladesh, location and extent of the area of intervention, location of the
settlements, National Forest Inventory (1997 and 2017) and field points measured on the ground for biomass. ......... 18
Figure 2: Problem analysis. The main problem, the underlying causes and the resulting effects are clearly identified. 20
Figure 3: Age and gender distribution of the interviewed households in the displaced settlements (number of
individuals). ....................................................................................................................................................................... 26
Figure 4: Percentage of population engaged in principal economic activities. ................................................................ 27
Figure 5: Average duration of economic activities (months/year). .................................................................................. 28
Figure 6: Economic activity of the households in the displacement settings. .................................................................. 28
Figure 7: Average monthly income per activity. ............................................................................................................... 29
Figure 8: Engagement of women in economic activities (% of interviewed). .................................................................. 31
Figure 9: Drying of wood on the roof and on the ground (left) and leaves (right) outside a displaced house. ............... 33
Figure 10: Wood fuel collection patterns (% of HH wood fuel collection). ...................................................................... 34
Figure 11: Double bundle transportation of wood fuel. .......................................................................................................
Figure 12: Child carrying a wood bundle in Kutupalong. ......................................................................................................
Figure 13 Average weekly expenditure per household (left) and other social units (right) in the different settlements
for cooking energy (all energies combined, in taka/week)............................................................................................... 38
Figure 14: Picture of a bondu chula (improved stove). ........................................................................................................
Figure 15: Traditional mud stoves used in majority in the displacement settings of the area of interest. ..............
Figure 16: Restaurant using liquified propane gas burner to prepare food. ........................................................................
Figure 17: Cooking practices in the households. .............................................................................................................. 41
Figure 18: Percentage of households who consider the use of alternative energy for cooking together with alternative
cooking stoves. .................................................................................................................................................................. 42
Figure 19: Percentage of other social units (offices and administrative centers) who consider the use of alternative
energy for cooking and cooking stoves.................................................................................................................................
Figure 20: Percentage households with health problems due to the use of wood fuel for cooking. .............................. 44
Figure 21: Source of threats faced by individuals during wood fuel collection. ............................................................... 44
Figure 22: Status of households reported threats faced by women. ...................................................................................
Figure 23: Accessibility to (top) and need for (bottom) resources and services as perceived by the population (% of
interviewed HHs). ............................................................................................................................................................. 47
Figure 24: Perceived measures that could mitigate environment degradation (% of the interviewed HHs). ................. 48
Figure 25: Area of each land cover class found in area of interest (ha). .......................................................................... 49
Figure 26: Land cover 2015 classification over the area of interest, location of the field plots and settlements. .......... 50
Figure 27: Surveyed plot design. ...........................................................................................................................................
Figure 28: Structure of each subplot and further breakdown in stratified zones for measuring biomass. ..................... 52
Figure 29: Recruitment status at different land classes (number of stem/ha). ............................................................... 55
Figure 30: Social forest stands about to be harvested in the Uhkia beat. Trees (mostly acacia) have reached maturity
and are marked for felling. ............................................................................................................................................... 57
Figure 31: Spot satellite imagery in 1994, 2003 and 2016................................................................................................ 59
Figure 32: Illustration of the processing chain flow. ......................................................................................................... 61
Figure 33: Overview of the back of Naypara settlement. Vegetation on the hills is highly degraded and paddy fields
can be observed in the low land. ...................................................................................................................................... 64

10
Figure 34: Areas of each change category in 2016 (ha). ................................................................................................... 65
Figure 35: Change categories for the 1994-2003-2016 period over the area of interest. ............................................... 66
Figure 36: Example of degradation in the shrub dominated area around Shamlapur. Only a few trees stand out in the
hilly landscape, two bundles of wood are visible. ............................................................................................................ 68
Figure 37: Biomass over the area of interest in 2016 and 1994 for each land cover category (tons). .................................
Figure 38: Biomass map of the area on interest in 1994 (estimated) and 2016 (measured) (t/ha). ................................ 72
Figure 39: Solution analysis for proposed interventions. ................................................................................................. 73
Figure 40: Overview of the proposed approach. .............................................................................................................. 78
Figure 41: Social map of Kutupalong. ...................................................................................................................................
Figure 42: Social map Leda. ..................................................................................................................................................
Figure 43: Social map of Shamlapur. ................................................................................................................................ 86
Figure 44: Social map Balukhali ........................................................................................................................................ 87
Figure 45: SPOT 2 and 3 Pan+XS for 1994/1996 (Band combination NIR, RED, GREEN). ................................................. 92
Figure 46: Spot 5 data for 2003 (Band combination NIR, RED, GREEN). .......................................................................... 93
Figure 47: Spot 6 and 7 composite for 2016 (Band combination NIR, RED, GREEN). ....................................................... 94

11
LIST OF TABLES
Table 1: Estimated walking distance from each camp to collect fuel wood. This buffer was intersected with the
country boundaries to determine the area of interest..................................................................................................... 17
Table 2: Status of data collection. ..................................................................................................................................... 22
Table 3: Status of assessment team.................................................................................................................................. 23
Table 4: Status of households included in the area of interest. ....................................................................................... 25
Table 5 Status of the other social units included in the area of interest. ......................................................................... 25
Table 6 Status (%) of household survey respondents. ...................................................................................................... 25
Table 7: Annual expenditures by categories and duration of activity. ............................................................................. 30
Table 8: Current yearly wood fuel consumption/demand by the household. The average value of 4.285 kg/day/HH was
used to estimate overall consumption in the area of interest. ........................................................................................ 32
Table 9: The Current wood fuel consumption/demand by other social units under the high poverty line scenario. ..... 33
Table 10: Status of HH wood fuel collection in four sites. ................................................................................................ 34
Table 11: Wood fuel collection from forest. ..................................................................................................................... 35
Table 12: Household energy consumption for cooking. ................................................................................................... 36
Table 13: Status of office/admin center energy consumption for cooking. ..................................................................... 37
Table 14: Restaurant, tea shop, bakery, brickfield cooking Energy consumption. .......................................................... 37
Table 15: Status of cooking technologies used by households. ....................................................................................... 39
Table 16 Status of cooking technologies used by restaurant, tea shop, bakery and brickfield........................................ 41
Table 17: Status of energy sources in local market. ......................................................................................................... 43
Table 18: Type of threats caused to women by sources. Column HH indicates how many households are concerned
and the experienced threats are underlined in X. ............................................................................................................ 45
Table 19 : Status of difficulties faced by women. ............................................................................................................. 45
Table 20: Households conflict and causes and recommendations. .................................................................................. 46
Table 21: Plots, area, biomass and basal area distribution in the different land classes. ................................................ 54
Table 22: Biophysical information of different land class. ................................................................................................ 55
Table 23: Species Diversity and Species richness.............................................................................................................. 56
Table 24 : List of species mostly used in short rotation plantation. ................................................................................. 57
Table 25: Plantation status of different range areas of Cox’s Bazaar south forest division. ............................................ 58
Table 26: Characteristics of the satellite imagery acquired. ............................................................................................. 59
Table 27: Tools and software used during the remote sensing analysis. ......................................................................... 63
Table 28: Change map legend. .......................................................................................................................................... 63
Table 29: Cross table with the area of each land cover combined with each change category (ha). .............................. 65
Table 30: Number of subplots measured in each land cover and change category. ........................................................ 67
Table 31: Average dry biomass content (kg/ha) for each land cover and land cover change category (in green are the
values measured in the field and in yellow are the attributed values). ........................................................................... 67
Table 32: Biomass contained in each land cover and land cover change category in December 2016 (tons). ................ 69
Table 33: Maximum basal area in each land cover and land cover change category (m2/ha). ...................................... 70
Table 34: Estimated biomass contained in each land cover and land cover change category circa 1994 (tons). ............ 70
Table 35: Comparative cooking energy consumption and costs. ..................................................................................... 75
Table 36: Risks and feasibility of the envisioned activities. .............................................................................................. 77
Table 37: Calendar of livelihood activities and disasters in the Cox’s Bazaar District. ..................................................... 88
Table 38: Women engagement in daily homestead activities. ......................................................................................... 89

12
Table 39: Compiled status of seasonal calendar activities. .............................................................................................. 90
Table 40: Status of gender based households’ decision-making analysis. ...................................................................... 90
Table 41: List of tree species and their scientific name. ................................................................................................... 91

13
EXECUTIVE SUMMARY
In Bangladesh, over 19 million people directly rely on tree and forest resources to support their daily livelihoods. With
one of the highest population densities in the world, coupled with such a high proportional reliance on wood as an
energy source, sustainable forest management is a difficult task.
This is particularly evident in the district of Cox’s Bazar, where an already high population density is exacerbated by
the fluctuating but persistent arrivals of Undocumented Myanmar Nationals (UMN), also called Rohingya, fleeing
persecution from neighboring Myanmar, who have taken up residence in registered refugee camps as well as
unregistered makeshift settlements among host populations. The resulting fuel wood scarcity is therefore
contextualized by increasing demand in the face of a dwindling supply.
Livelihood options for the Rohingya are limited as their status does not allow them to seek employment. Returning to
their original homeland is not seen as an option. Local resentment of the Rohyinga communities living in Bangladeshi
communities has increased since their arrival, born form a perception of increased competition for resources that are
generally in poor supply.
In this context, the International Organization for Migration (IOM), in collaboration with the Food and Agriculture
Organization of the United Nations (FAO) and the Bangladesh Forestry Department (BFD) seeks to assess the fuel
wood supply and demand dynamics of populations in proximity of the Makeshift Settlements of Kutupalong and Leda
and Shamlapur.
The methodology for the assessment is drawn from a joint work between FAO and the United Nations High
Commissioner for Refugees (UNHCR) publication(D’Annunzio, et al. 2016)aiming at providing easy to implement
methods for assessing wood fuel supply and demand in displacement settings.
The methodology includes three programmatic phases: (1) to assess the standing woody biomass available for use as
fuel (fuel wood supply) and the changes they have undergone over a given period of time to be determined (and
which could be since the establishment of the camp), (2) to assess the consumption over the same time period
(assuming wood fuel consumption is equal to wood fuel demand), and (3) assess the interrelationships and gaps
between demand and supply. Through this method, it can be determined whether the rate of wood extraction is
faster than the natural rate of accumulation (forest growth) and options for improving energy use within surrounding
areas can be developed.
Field survey included an assessment of the energy consumption from fuel wood of the varying social units inhabiting
the area and an assessment of the biophysical forest parameters of the surrounding. The supply assessment was
carried out by a team of five in the field, measuring biomass at 15 plots distributed in the AOI, in conjunction with
analysis of time series of high resolution satellite image. A team of 14, carried out interviews of 306 households, and
conducted Participatory Rural Appraisals (PRA), and Focused Group Discussions (FGD), to realize the fuel wood
demand assessment. Image analysis was performed by combining semi-automatic classification of the land with
change detection processes, using Free and Open Source (FOS) software solutions. The objectives of the analysis were
the following:
Objective 1: Assess current fuel wood demand in settlements and the host community and estimate the total
demand over the period of interest.
Objective 2: Assess fuel wood supply and resources change over the period of interest for the entire Area Of
Interest (AOI).

14
Objective 3: Develop strategies for sustainable management of natural resources and efficient energy use.
The outcomes provided the information required to generate strategies for intervention that can promote sustainable
natural resource management and efficient energy consumption within the surrounding communities.
The total area of the AOI is 37,420 ha, distributed between 19 different land cover and land use features as defined in
the land cover atlas. The population in the AOI is estimated at 360,000 national living together with 125,000 to
200,000 Rohingya (registered and UMN).
Key findings from the fuel wood demand assessment:
- Almost all households were entirely dependent on wood fuel and traditional mud stoves for their cooking.
- The cost of cooking fuel accounted for just 4.6% of monthly household expenditures, a relatively low number
that suggests wood fuel was collected rather than purchased. Furthermore, total monthly expenditures were
slightly more than total monthly income, suggesting financial limitations to purchasing alternative fuels.
- To collect wood fuel, households traveled an average distance of 8.75 km and did this 3 days per week,
collecting 28.65 kg per trip. During wood collection trips, households experienced a variety of threats. In
particular, three women were attacked by elephants and 25% of women reported being threatened by mainly
the host community.
- The average household consumption rate for cooking fuel was 4.285 kg/HH/day. For the displaced population
this amounted to 54,452 tons biomass per year.
Key findings from the fuel wood supply assessment:
- Observations from field plots revealed highly degraded forests, specifically low plant diversity and low
regeneration rates, likely due to persistent wood fuel collection by both host and displaced communities.
- Satellite imagery analysis showed that since 1994 wood biomass decreased by 40%.
- Most of the degradation occurred in the shrub-dominated hills in the center of the area of interest.
- Additionally, one third of the area was almost depleted from standing trees, and biomass was concentrated in
a few patches of plantations and homesteads.
- Importantly, most of the land use conversions from forest to agricultural land were the establishment of
paddy fields in a reserved area that was not impacted by wood fuel collection.
We emphasize that the land has lost 40% of its standing biomass over the period of interest (22 years) while
population increased by 32% and the highly degraded land is now in a critical state that requires alleviation measures.
In the last part of our study, we propose measures to provide for the 10,000 tons of standing biomass that are in
deficit every year through the following stepwise approach:
- Reduce demand in the short term by increasing energy efficiency and improving consumption habits;
- Focus on stabilization of the land in the middle term by introducing deep rooting systems woody vegetation;
- Allow afforestation programs to thrive in the long run, replicating the model of social forestry successfully
implemented in the area.
The degraded environment situation in Cox’s Bazaar results from complex interacting pressure on natural resources
and socio-economic, political and cultural constraints. These issues and constraints need to be addressed in a holistic
manner, engaging the different stakeholders together on a common agreed framework before any actions (reduction
of pressure by reducing demand, increasing the supply with afforestation programs) can be implemented with
success.

15
1 INTRODUCTION
1.1 General context
Over 19 million people in Bangladesh directly rely on tree and forest resources to support their daily livelihoods
(Rahman and Ahmed 2016). With one of the highest population densities in the world, coupled with such a high
proportional reliance of wood as an energy source, sustainable forest management is a challenging task. In the first
national forest resource assessment completed in 2007(Bangladesh Forest Department 2007), the BFD reported
forest area accounted for 9.8% of total land which is likely to have declined further. The long-term decline in the
overall extent and quality of the country’s forest stock is leading to a reduction in access to wood energy, essential for
vulnerable populations around the country. This is particularly evident in the district of Cox’s Bazar, where an already
high population density is exacerbated by the fluctuating but persistent arrivals of UMN, fleeing persecution from
neighboring Myanmar, who have taken up residence in registered camps as well as makeshift settlements among
host populations. The resulting fuel wood scarcity is therefore contextualized by increasing demand in the face of a
dwindling supply. And while the various social demographics are affected differently, the issue remains a problem for
all people within the areas who are living in poverty which, in addition to the burgeoning population of UMNs,
includes on average 17 and 35 percent of the host population within the lower and upper poverty line respectively
(GoB 2010). Addressing the myriad drivers of the area’s deforestation and forest degradation must therefore consider
both long-term causes that may have existed prior to 1992, whilst also looking at the more recent influences
associated with population pressure.
1.2 Undocumented Myanmar Nationals in Bangladesh
Since 1992, increasing numbers of UMN have populated makeshift camps along the Chittagong peninsula bordering
Myanmar to the east and the Bay of Bengal to the west. Two registered refugee camps and four makeshift
settlements exist as of today.
According to UNHCR, 33,000 Rohingya refugees live in two refugee camps in Kutupalong and Nayapara established in
1992. The refugee camps are under the supervision of UNHCR and controlled by GoB. In these two official camps,
UNHCR provides basic food, medical aid, and primary education for refugee children; but there is no access to higher
education for refugees.
However, the majority of arrivals from Myanmar live interspersed in Bengali villages that surround the camps in Cox’s
Bazar (UNHCR 2017). These Undocumented Myanmar Nationals (UMN) do not receive the formal support services
provided by the government and UNHCR. Approximately 70,000 UMN have arrived in the recent wave that occurred
between October 2016 and February 2017. The total number of registered and unregistered Myanmar nationals in
Bangladeshare estimated to be between 200,000 and 500,000and the main makeshift settlements are located at Leda
and Kutupalong.
Since 1992, no additional Rohingya have been registered by UNHCR. As a result, most of these unregistered refugees
lack support received from registered refugees, such as basic food, medical care and safety.
Livelihood options for the Rohingya are limited as their status does not allow them to seek employment. Returning to
their original homeland is not seen as an option for many who fear ongoing persecution in their native Myanmar
where they referred to as Bengalis because their language and Islamic faith and are excluded from citizenship and
their human rights are violated (Azad & Jasmin, 2013).

16
Local resentment for the Rohyinga communities living in Bangladeshi communities has increased since their arrival,
born form a perception of increased competition for resources that are generally in poor supply. These tensions most
often come ahead in proximity to the makeshift settlements where firewood collection and access to water are the
catalyst of conflicts leading to persistent assaults on UMN women and children collecting fire wood (Kiragu, Rosi et
al., 2011). With no solution, likely in the short term, there is a consensus to improve safe access to energy,
environmental conditions and conflict within the region.
1.3 Objectives
In this context, the International Organization for Migration (IOM), in collaboration with the Food and Agriculture
Organization (FAO) and the Bangladesh Forest Department, identified the need to assess the fuel wood supply and
demand dynamics of populations living in proximity of the Kutupalong, Leda and Shamlapur makeshift settlements
and registered refugee camp.
Understanding the relationship between the energy requirement and the rate of local deforestation will assist in
determining the stocking rates required to achieve successful reforestation/afforestation programs. The outcomes
provide information required to generate intervention strategies that promote sustainable natural resource
management and efficient energy consumption within the surrounding communities. To achieve this, it is necessary
to fulfill certain steps that can be divided into three main objectives:
Objective 1: Assess current fuel wood demand in settlements and the host community and estimate the total
demand over the period of interest.
Objective 2: Assess fuel wood supply and resources change over the period of interest for the entire AOI.
Objective 3: Develop strategies for sustainable management of natural resources and efficient energy use.
Under these objectives, an understanding of the relationship between the energy requirement and rate of local
deforestation can assist in determining the stocking rates required to achieve successful reforestation/afforestation
programs. The outcome will provide the information required to generate strategies for intervention that can
promote sustainable natural resource management and efficient energy consumption within the surrounding
communities.
1.4 Broad methodology
The study’s methodology is drawn from the joint FAO – UNHCR publication: Assessing wood fuel supply and demand
in displacement settings (D’Annunzio et al., 2016). The methodology includes three programmatic phases: (1) to
assess the standing woody biomass available for use as fuel (fuel wood supply) and the changes they have undergone
over a given period to be determined (and which could be since the establishment of the camp), (2) to assess the
consumption over the same period (assuming wood fuel consumption is equal to wood fuel demand), and (3) assess
the interrelationships and gaps between demand and supply. Through this method, it can be determined whether the
rate of wood extraction is faster than the natural rate of accumulation (forest growth) and options for improving
energy use within surrounding areas can be developed.
Data is obtained through a combination of field survey and very high-resolution satellite image analysis of land cover
change. Field survey includes an assessment of both the biophysical forest parameters of the surrounding area and an
assessment of the energy consumption from fuel wood of the varying social units inhabiting the area. Image analysis
is performed combining semi-automatic classification of the land with change detection processes, using Free and
Open Source software solutions.

17
This study was co-implemented under the administrative leadership of IOM and the technical support from FAO, in
collaboration with the Bangladesh Forest Department. The activity compliments BFD’s current National Forest
Inventory activity being supported by FAO. Under this activity, 11 plots are located within the area of interest. Using
the same plot design and intensifying plot frequency in the areas surrounding the camps has ensured efficiency in the
field data collection process. Integrating the various methodologies and data sources has assisted in providing a
comprehensive dataset to assess stocking rates and fuel wood supply over the area and period of interest.
1.5 Area of interest
The AOI is delimited by a specific buffer around each of the main four settlements, and the country boundaries. This
buffer was determined prior to the study based on communication with IOM field officers regarding the walking
distance expected to be traveled by foot for wood fuel collection. Because of the intricate distribution of displaced
population and host community, the AOI comprises both populations and the anthropic effects observed in this study
on the environment can’t be separated between displaced and host community and for this reason, we address the
issue of environmental degradation in a holistic manner, seeing the AOI as a whole. The characteristics of the buffer
are given in Table 1.
Table 1: Estimated walking distance from each camp to collect fuel wood. This buffer was intersected with the country boundaries to determine the area of interest.
Sites Buffer (m) Longitude Latitude
Kutupalong 4000 92.16 21.21
Leda 6000 92.24 20.97
Shamlapur 14000 92.14 21.08
Balukhali 4000 92.16 21.19
The total area of the AOI is 37,420 ha, distributed between 19 different land cover and land use features as defined
in the land cover atlas for the year 2015 (Gob, 2017). The AOI is mostly located in the Cox’s Bazaar district, but a small
portion of Bandarban is also included. The following 8 land use categories account for 96% of the extent of the AOI:
Shrubs, Crops (single and multiple), Rural settlements, Rivers, Salt pans, Mixed hilly forests, and Forest Plantations.
In terms of topography, the AOI can be divided into two main zones:
- low slope hills of low altitude (<50m) in the north - high slope ridge in the south culminating at an altitude of 240 m The extent of the AOI, location of settlements and biomass field plots measured on the ground are shown in Figure 1.

18
Figure 1: Administrative map of Bangladesh, location and extent of the area of intervention, location of the settlements, National Forest Inventory (1997 and 2017) and field points measured on the ground for biomass.
1.6 Population
The area of interest overlapsTeknaf and Ukhiya upazillas. The national census in 2011 gave a population density in
Cox’s Bazar of 913 inhabitant / km2, with a population growth of 1.3% / year.
We could then approximate the population of the AOI to circa 360,000 Bangladeshi nationals, as of today. In addition,
it is estimated that between 125,000 and 200,000 Rohingya live in the mixed and makeshift settlements of Cox’s
Bazar.

19
The influx of individuals in late 2016 early 2017 has increased the population pressure in the area. The newly arrived
UMNs are now sharing shelters at the makeshift settlements of Kutupalong, Leda and Shamlapur. They are also
settling in a new site at Balukhali (Palongkhali union, Ukhiya upazilla).

20
2 PROBLEM ANALYSIS
The resulting framework can be synthesized as in Figure 2Error! Reference source not found. where the problem can
be expressed as “Landscape degradation and household demand for wood fuel energy sources in the AOI are
increasing”.
Figure 2: Problem analysis. The main problem, the underlying causes and the resulting effects are clearly identified.
The main problem, the underlying causes and the resulting effects are clearly identified. The next steps of this study
focus on quantifying the different sub-causes underlying with the problem, in order to provide practical solutions to
solve them.

21
3 ASSESSING DEMAND
3.1 Methodology
3.1.1 Research design
The methodology of the wood fuel demand assessment was designed based on the objectives, scope of work, and
deliverables of the assignment adopted from the FAO-UNHCR handbook providing guidelines for assessing wood fuel
supply and demand in displacement settings (d’Annunzio et al., 2016). The research design and methodology was
finalized based on the guidance from IOM and FAO and also learning from review of project documents and relevant
literatures. The assessment was carried out at the makeshift camps of Kutupalong and Leda, UMN and host
community at Shamlapur and the new UMNs site in Balukhali. The assessment was conducted following both
qualitative and quantitative approaches with a variety of primary and secondary data sources including participatory
methods using the mix-matrix for data collections. The following stepwise approach was used for the wood fuel
demand assessment.
The Steps of wood fuel demand Assessment.
- Step 1: Determine the population and social units;
- Step 2: Assess energy consumption;
- Step 3: Screen technologies and assess local practices for cooking;
- Step 4: Assess the multi-sectoral challenges to access and use of wood fuel.
3.1.2 Sampling strategy
Under the assumption that the population is infinite (above 50,000), we have followed a conservative estimate based
on the 95 percent confidence level to estimate the total sample size. Equation 1provides a sample size (n) calculated
to 300.
Equation 1𝒏 =𝒛𝟐�̂�(𝟏−�̂�)
𝑴𝟐 × 𝟏𝟎𝟎
where M is the margin of error, p the population proportion and z the percentile points of the normal distribution.
The population is unknown due to frequent movement and influx of UMNs. Therefore, to calculate the sample size,
we have considered 0.15 as conservative proportion of population. To construct a 95 percent confidence interval for
the Sample Size (n) with a margin of error: M = 0.4 per cent and a proportion p= 0.15 for a conservative estimate, Z =
1.96 we obtain n~ 306.
A total of 306 randomly selected HHs were surveyed for the wood fuel demand assessment. The total sample size was
further allocated to the four data collection sites. Afterwards, the selection of HHs for data collection was narrowed
down from Ward to camp and adjacent settlement of host community. Finally, respondents were selected at blocks of
camps and host community randomly chosen every 50 HHs.
3.1.3 Tools development
Tools were developed for both quantitative and qualitative data collection. Basically, the wood fuel demand
assessment tools were developed following the structure of the SAFE toolbox (Gianvenuti et al., 2016). After
reviewing the SAFE toolbox, the quantitative data collection tools like as: household survey questionnaire, restaurant
survey questionnaire, institution survey questionnaire, market survey questionnaire developed. We also included

22
questions and parameters to capture current context of women and children’s protection and potential income
generating activities (IGA) options in the household survey questionnaire.
For qualitative data collection: participatory rural appraisal (PRA), focus group discussion (FGD), semi structured
interview (SSI) checklists and templates developed in consultation with SAFE tool box. For livelihoods and gender
aspects, we added tools to conduct FGDs with men, women, and mixed groups. The draft quantitative and qualitative
tools were shared to IOM and FAO for finalization, before data collection. After finalization of tools in paper form, the
data collection mobile application developed by FAO Open Foris Collect and Collect Mobile were designed (FAO,
2015). The data collection apps development work was conducted at FAO Dhaka office with the key assistance from
FAO experts.
3.1.4 Data collection
The first step of the data collection process involved conducting field tests of the questionnaire for 12 displaced HHs.
After field testing, the team reviewed the findings and adjusted the tools in both paper form and electronic data
collection application. The last version of the applicationwas installed into 07 tablets (Lenovo and Samsung). Next, the
field enumerators were trained on the use of the application, which included entering data from the Bangla paper
form version of the questionnaire. Finally, the HHs were visited and the data collected handed over to the IOM Cox’s
Bazar Office. Overall 306 HHs were interviewed (Table 2).
Table 2: Status of data collection.
Surveys Conducted Kutupalong Leda Shamlapur Balukhali Total
Households 168 66 48 24 306
Govt. office and NGOs 7 1 1 0 9
Local Market/Bazar 1 2 1 1 5
Restaurant and Tea Shop 23 13 5 5 46
Bakery 0 0 2 0 2
Brick field 0 2 0 0 2
Schools 7 2 1 1 11
Clinics 1 1 1 0 3
Session Conducted Kutupalong Leda Shamlapur Balukhali Total
FGDs (Male, male + femalegroups) 3 3 3 2 11
FGD Female groups (five tools) 1 1 1 1 4
SSI (Key Informants) 6 3 2 3 14
PRA (Mapping, Seasonality Analysis) 2 2 2 2 8
3.1.5 Data collection strategy
At the inception of data collection, social mapping was conducted at each site to delineate the areas, settlements,
number of households and forest locations. During this process, the assessment team conducted discussion meetings
with the camp management committee (CMC) and respective ward members and collected the block-wise number of
HHs at each site. At each site, the HHs were selected for data collection based on random sampling methods (Remi et
al. 2016). For example, in Kutupalong, there is a registered refugee (RR) camp, other UMNs living in 15 blocks, and
host community people located in the village at Raza Palong, Union Ward 09. The random sampling process covered
the RR, UMN and host community HHs following a “50 steps approach”: after every 50 houses, the 51st HHs data was
collected for a representative sampling from each block and village.

23
3.1.6 Assessment quality
To ensure the quality of data collection, all the field team members were given an orientation on data collection tools
and participated in field testing sessions. Also, the data collection specialist visited the sites every day during data
collection to conduct field checks on 10% of the HHs. The Consultant also performed the FGDs with male and mixed
(male and female) groups and carried out the SSIs. To ensure consistency, the social maps and findings were
presented and shared with the community participants. To further assist with data quality, the Consultant was also
responsible for processing and interpreting the data.
3.1.7 Data analysis
The collected data was imported from the tablets and cleaned, processed, and exported as . csv files for data analysis.
The data were filtered and grouped by categories for generating the recommended tables of the SAFE tool box for
wood fuel demand. The findings of data were entered into the SAFE tool box to combine with the wood fuel supply
(see part V).
3.1.8 Language of assessment
To ensure the collection of accurate information, the assessment team comprised registered and unregistered
Myanmar nationals, Bangladesh local host community and Bangladeshi nationals. The key objective was to ensure
that the first line team members who have directly interacted with the respondents knew the same language and
collected similar information into the data collection structures. Rohingya and Chittagonian languages have been
interpreted during the assessment.
3.1.9 Assessment team
A 14 members assessment team was formed, out of which, 12 members were the residents from the assessment
sites. The Consultant and IT Officer travelled from Dhaka. To ensure the similar linguistic conversation and
appropriate data collection, the team was formed involving registered and unregistered Myanmar nationals, and
Bangladeshi nationals from local host community. The team structure is presented in Table 3.
Table 3: Status of assessment team.
Team Status # Education Gender Residents
Field Assistant 3 12 Class Female-1 Male-2 Kutupalong Registered Camp, Leda Camp, Shamlapur Camp
Field Enumerator 7 Honors-Masters Female-4 Kutupalong, Leda, Shamlapur, Balukhali
Male-3
IT Officer 1 Masters Male-1 Dhaka
Gender Expert 1 Masters Female-1 Kutupalong
Program Assistant 1 Masters Male-1 Leda
Consultant 1 Masters Male-1 Dhaka
3.2 Findings on population and social units
The area of intervention considers mainly forest areas from which the displaced HHs along with the host community
are collecting wood fuel. To determine the wood fuel demand, we considered the assessment setting, social units,
and socioeconomic condition of HH, age groups, and number of social units.

24
3.2.1 Assessment sites, population, households, other social units
To capture wood fuel demand, the assessment was conducted to represent the diverse nature and status of HHs at the selected settlement sites. Before the assessment started, the estimated number of UMN HHs was 10,245
according to secondary data sources (
Table 4). However, after reaching at the assessment sites, it was observed that the number of UMN HHs had
significantly increased with the influx of 9,477 newly arrived UMN HHs at the three sites in Kutupalong, Leda and
Shamlapur and a newly developed shelter at Balukhali. The influx was due to an outbreak of violence on 09 October
2016 in the Rakhine State of Myanmar, resulting in UMN’s fleeing to Bangladesh until around last week of February
2017. In total, 306 HHs were interviewed during the survey covering the registered Myanmar refugees, old and newly
arrived UMNs and local host community people at the assessment sites.
The assessments of wood fuel demand were conducted at the ward level. Multiple villages or settlements may belong
to a single ward. Furthermore, the selected wards belong to a group of nine wards (identified by numbers 1 to 9)
which make up a single Union Parisads. A total of four of the most densely populated wards with displaced HHs were
selected for the assessment - Kutupalong, Leda, Shamlapur and Balukhali.
The social unit categories included HHs, administrative centers (e.g. government and non-government offices),
schools, clinics, restaurants and tea shops, bakeries, and brickfields. The key consideration in the selection of social
units was to identify and capture the number of units that consumed wood fuel for cooking and income. To
determine the number of social units of the host population, the key informant is the Union Parisad Chairperson
(UPC) (elected local government representative, in-charge of Union) and Ward Member (elected local government
representative, in charge of ward) for the respective ward. The number of social units in each ward reflect the status
of the area up to the first week of March 2017. We note, however, that the number changed even during the
assessment as more UMN’s continued to arrive. Similarly, the number of other social units (e.g. restaurants and tea
shops) captured in this assessment reflect the status in March 2017.
At the beginning of the assessment, the Gender Expert along with Field Assistants visited the RR, UMN and host
community and developed social maps of the settlements. In these social maps, they delineated the settlement
areas, number of HHs and forest locations. A total number of eight PRA sessions were conducted to complete four
social maps of four assessment sites. The social maps of the assessment sites are enclosed in Annex 1. In addition to
the maps, further information was gathered from relevant community people during discussion meetings with CMC
and Block Management Committee (BMC). The information and maps were finalized after consulting the respective
Union Parisad Chairperson and Ward Members.
According to the poverty map of Government of Bangladesh (GoB, 2010), 39.0 per cent of the host population is in
the upper poverty level and 20.7 per cent in lower poverty level. As the lower poverty level corresponds to HHs that
are totally dependent on wood fuel for cooking, we included those 20.7 percent in our assessment. In contrast, all the
registered, unregistered old and newly arrived displaced HHs are dependent on wood fuel for cooking. The status of
wood fuel dependent HHs and other social units is presented in Table 5. In addition to HHs, other social units that
depend on the wood fuel for consumption and income were surveyed near forest areas (

25
Table 4).
Table 4: Status of households included in the area of interest.
Union
Households
Settlement Registered UMN Old *(2016)
UMN New (late 2016 and 2011)
Total
Displaced + lower poverty line hosts**
Displaced + higher poverty line hosts**
Baharchora Shamlapur 0 1700 300 2000 3147 4217
Hnila Leda 0 2092 1121 3213 5285 7218
Nayapara 3052 0 0 3052 3052 3052
Teknaf Sadar - 0 0 0 0 1027 1985
Whykong - 0 0 0 0 2338 4519
Jalia palong - 0 0 0 0 825 1548
Palong Khali Balukhali 0 0 2401 2401 3274 4038
Raza Palong Kutupalong 2803 6453 5655 14911 15653 16303
Ghumdum - 0 0 0 0 214 375
Total HH 5855 10245 9477 25577 34815 43255
*Needs and Population Monitoring report of IOM, Block management committee, Local government.
** Population census 2011, Bangladesh bureau of statistics, Poverty map 2010
Table 5: Status of the other social units included in the area of interest.
District Upazila Union Office of Govt., NGOs
Restaurant, Bakery, Tea Shops
Brick field
Schools Clinics
Cox's Bazar
Teknaf
Baharchora 3 33 0 1 1
Hnila 8 48 4 2 1
TeknafSadar 11 23 4 3 4
Whykong 4 25 1 3 2
Ukhiya
Jaliapalong 2 7 0 1 1
Palong Khali 0 15 0 1 0
RazaPalong 12 143 0 7 1
Bandarban Naikhongchhari Ghumdum 2 4 0 1 0

26
Total 42 298 9 19 10
3.2.2 Household survey respondents
Old UMN’s, particularly in Kutupalong made up the largest respondent group. New UMN’s made up 12% of the total
number of respondents and most of these resided in Balukhali (Table 6).
Table 6: Status (%) of household survey respondents.
Sites Registered % Old UMN % New UMN % Host % Total
Kutupalong 3.59 33.66 2.29 15.36 54.9
Leda 0 16.67 0.98 3.92 21.57
Shamlapur 0 6.54 0.65 8.5 15.69
Balukhali 0 0 7.84 0 7.84
Total 3.59 56.86 11.76 27.78 100
3.2.3 Survey population, ratio and age group
Among the 306 interviewed HHs selected from a population of 1692, there were 860 male members and 832 female
members. The male-female ratio observed was 1.03. Overall, the number of children (<11 years old) was higher in
numbers for both male and female groups than adolescents (11 to 19) across all sites. Similarly, the number of
working adults (19 to 60) was higher than elderly people (60+). This may indicate that greater responsibility is
shouldered byadult working groups to provide for the growing population. Additionally, the low proportion of elderly
people may indicate a lower level of responsibility to this age group but greater responsibility for taking care of the
children and adolescents. The distribution of age groups was generally similar for all the sites, except perhaps in the
recently established Balukhali camp where the working group and elderly people were fewer compared to the
number of children and adolescents (Figure 3). The average HH size observed was 5.5025 individuals/HH compared to
the national standard of 4.5 (BBS, 2011).

27
Figure 3: Age and gender distribution of the interviewed households in the displaced settlements (number of individuals).
3.2.4 Education Status
Overall, the educational status in all the sites was very low. Assessment data revealed that 66.51 per cent male and
70.91 per cent female remained without education. Most of the displaced HHs complete their education in Arabic.
For example, in the Kutupalong makeshift camp, UMNs have organized their own Arabic educational institutions
(Madrasa) to educate their children. In the registered camps, there are schools operated by humanitarian agencies to
educate the children of displaced HHs in Myanmar, Bangla and English languages. However, outside registered camps,
education remains a challenge as the displaced population is not entitled to enroll in national mainstream education.
The general Bangladeshi education system is not open for the displaced HHs due to policy compliance.
On average 63 per cent of school children were without education in the current survey. Reasons for remaining
without education included that parents didn’t send their children to school and engaged them in household work,
taking care of younger children and economic activities (Sayed, et. al. 2012). Also, HHs often send their children for
long distance wood fuel collection during the daytime, leaving them less time for education. At night time, a lack of
adequate lighting may limit education (Vianello, 2016a).
3.2.5 Household Economic Activities
The surveyed HHs participated in 22 types of economic activities for their income (Figure 4). The economic activities
of HHs vary widely in terms of income opportunity, duration, and monthly income. Importantly, many of the
economic activities are considered subsistence level and do not require legal permission (e.g. work permit or trade
license for wood fuel). Typical examples of wage labor include paddy cultivation, salt cultivation or work in the
brickfields, while salaried job imply a contract with a local NGO or international organization, hotel, restaurant or a
department store.
0 50 100 150 200 250
Male
Female
Male
Female
Male
Female
Male
Female
Ch
ildre
n (
0-
be
low
11
)A
do
lesc
en
ts (
11
-1
9)
Ad
ult
(ab
ove
19
to t
ill 6
0)
Eld
erl
y (6
0+
Balukhali
Shamlapur
Leda
Kutupalong

28
Figure 4: Percentage of population engaged in principal economic activities.
Most HHs are engaged in more than one economic activity due to a lack of income opportunities, or seasonality of
work. For example, wage labor was the most common activity, lasting for six to eight months a year. Therefore, for
the rest of the months, HHs of wage laborers will engage in salt cultivation or other types of economic activities to
maintain income and livelihoods. The wages of displaced HHs are often lower than the host community or, due to
competition and scarcity of employment opportunity, they often remain unemployed.
Commonly, women from displaced HHs are employed as domestic workers or they sell breakfast. In addition, some
are employed as salaried field workers in their camps by NGOs. In Balukhali, some displaced HHs are surviving by
selling assets like gold (1.31%), taking donations, and receiving support from others (2.61%) (Figure 4).
Among all the economic activities, HHs gave priority to those opportunities which yield the highest income and are
the most available. They also consider the duration of employment, security, and confirmation of payments. For all
four sites, the highest priority was given to wage labor (131 HHs), followed by small business (36 HHs), and salaried
jobs (34 HHs). Selling forest products was considered a secondary priority (44 HHs).
The duration of economic activities of the displaced HHs greatly varied due to competition with the host community
and seasonality. Due to land scarcity and access to land, displaced HHs were mostly dependent on unstable and
sporadic economic activities. In contrast, the economic activity of host community is more stable and continuous.
The longest duration of any activity was 11 months for both selling breakfast and Imam. Salaried jobs, begging,
mechanics, fishing, handicrafts, domestic work, wage labor, and small business lasted 8 to 10 months. Small
businesses included tea, grocery, and vegetable shops inside the camps. Both displaced and host HHs participated in
poultry rearing, which lasts four months. However, only host HHs participated in rearing cows (which also lasts for
four months) and farming such rice paddy cultivation (5 months) (Figure 5). The displaced HHs at Shamlapur were
engaged in the farming homestead vegetables for five months of the year. Selling fuel wood was commonly observed
inside the settlement in Kutupalong, and inside the camp bazar in Leda for six months.
0 10 20 30 40 50 60
Working with FD
Mehanics
Forign Income
Selling of vegetables
Sale of assets (gold)
Selling of breakfast
Begging
Cow rearing
Imam/Priset/house tutuor
Donation and Support from relatives
Domestic Worker
Poultry
Mason/Carpenter
Rickshaw/Auto Driver
Shrimp/Fry Collector
Handicrafts/Tailoring/ Weaver/handloom
Farmer/Cultivator
Small Business
Salaried job
Selling of woodfuel
Wage Labour

29
Figure 5: Average duration of economic activities (months/year).
3.2.5.1 Household average monthly income
The most common economic activity of displaced HHs at camp settlements was wage labor work at BDT 5638
Figure 7). The displaced HHs engaged more than host HHs with fishing in the sea (BDT 6397) and small business
activities (BDT 6124). By driving rickshaws or auto rickshaws, displaced HHs could earn BDT 5942 monthly. Other
earnings were possible through salaried jobs (BDT 4271), working for Imam for mosque/Madrasa (BDT 3089), and
selling wood fuel (3010). The lowest incomes were derived from begging (BDT 2600), handicrafts/tailoring (BDT 2473),
domestic work (BDT 2458), selling breakfast (BDT 2433), mechanics (BDT 2000), and poultry rearing (BDT 1708).
For the host HHs, the highest average monthly income was for cow rearing (BDT 22250) and foreign income (BDT
8333). Host HHs practicing farming earned BDT 6561 per month on average. One host HH worked for the Bangladesh
Forest Department, earning BDT 6000 per month. Host HHs were conducting economic activities as a
mason/carpenter and earning BDT 4694 monthly.
Donations and support from donor agencies and NGO’s (BDT 6757) ranked third for displaced HHs at Balukhali and
host HHs at Leda and Shamlapur. One example of atypical income were host HHs at each site and a few displaced HHs
at Shamlapur earning BDT 5500 a month by selling vegetables.
The average yearly income per capita in fiscal year 2016 was USD 1466 for Bangladeshi national (BBS, 2016). While,
for displaced people data from the current assessment revealed an average yearly per capita income of only USD
164.38. Additionally, Data revealed that average monthly income for displaced HHs was USD 82.80 at Cox’s Bazar,
Bangladesh, which is comparable to the Dadaab camp in Kenya that was USD 72 for displaced HHs (Okello, 2016)
Figure 7.
0 2 4 6 8 10 12
Sale of assets (gold)
Donation and Support from relatives
Farmer/Cultivator
Selling of woodfuel
Handicrafts/Tailoring/ Weaver/handloom
Mason/Carpenter
Small Business
Begging
Selling of breakfast
0 5000 10000 15000 20000 25000
Poultry
Mehanics
Handicrafts/Tailoring/ Weaver/handloom
Selling of woodfuel
Salaried job
Wage Labour
Working with FD
Shrimp/Fry Collector
Sale of assets (gold)
Forign Income

30
Figure 7: Average monthly income per activity.
3.2.5.2 Household Expenditures
This assessment found that the monthly average expenditure on food was BDT 4480 plus BDT 1292 for wood
fuel/kerosene. Considering the number of HHs, cost, and duration, the major costs beside food and fuel were for
house repairs (78 per cent of HHs spent BDT 7207), healthcare (75 per cent and BDT 1457 for three months), clothing
(74 per cent and BDT 2805 for two months), education (43 per cent and BDT 693 for ten months) and mobile phone
plans(59 per cent and BDT 224 for all 12 months). Other expenditures included the purchase of furniture, rent of
land/house, loan repayment, marriage ceremony, purchase of agriculture equipment, electricity/generator bill,
purchase of solar lighting, and entertainment and savings deposits (Table 7).
3.2.5.3 Households income vs. expenditure
Available economic activities for the displaced HHs remain a challenge due to their legal status in the country. The
illegitimate status of UMN’s has resulted in reduced opportunities by the host community for land ownership and
jobs. The consequences have been getting comparatively less wages and a lack of proper payment schedules. These
factors limit the employment opportunities and amount of income compared to their invested labor.
Table 7: Annual expenditures by categories and duration of activity.
Areas of HH Expenditures HH% Average MonthlyExp. Taka
Average Months/ year
Food 306 4480 12
Woodfuel/Kerosene 3o6 1292 9
House repairing 239 7207 1
Healthcare 228 1457 3
Clothes 227 2805 2
Education 133 693 10
Mobile phone balance 180 224 12
Furniture 41 1941 1
Rent of land/house 1`7 426 12
Loan repayment 8 1000 10
Marriage ceremony 6 1501 1
Agriculture equipment 5 1360 1
Electricity/Generator 5 192 12
0 5000 10000 15000 20000 25000
Poultry
Mehanics
Handicrafts/Tailoring/ Weaver/handloom
Selling of woodfuel
Salaried job
Wage Labour
Working with FD
Shrimp/Fry Collector
Sale of assets (gold)
Forign Income

31
Solar lighting 4 4925 1
Entertainment 1 150 12
Savings deposit 1 500 12
Similarly, due to low income, they have limited ability to meet basic daily necessities such as food, healthcare,
clothing, education, cooking fuel, and repair/construction. In comparison, data reveal that displaced HHs monthly
average income (BDT 6599) is slightly lower than their expenditures (6714). Therefore, UMNs are basically living hand
to mouth for their basic necessities. The majority of HH expenditures are for necessities such as foods, wood fuel and
kerosene, house repairing, healthcare, clothing, education and communication by mobile phones.
Displaced HHs expenditures only covered the basic necessities of food, healthcare, clothing, education, shelter, and
communication (Vianello, 2016a). In contrast to the economic activities in old camps, the HHs at newly settled camps
in Balukhali were coping by selling gold and other assets to meet the costs of daily necessities. Also, the HHs were
borrowing loans with high interest rates, borrowing wood fuel at an excessive cost from local market, selling in
advance their labor to get money, and begging to cope with the lean season at all the camp sites. Due to the impact
of lean season, HHs were reducing their food consumption ratio (FCS) to 01 meal/day for the month of July. The
reason for coping this way during the lean season is because of scarcity in economic activities and reduced wood fuel
collection.
3.2.6 Role of Women in Household Income
The women of UMN HHs are performing more than double the duties compared to women of host HHs. Overall,
about a third of women are not involved in any kind of cost saving or economic activity. The primary activity carried
out by women is wood fuel collection, indicating the importance of this activity for sustaining the HHs. The share of
each activity performed by women is available in Figure 8.
Figure 8: Engagement of women in economic activities (% of interviewed).
3.2.7 Labor Seasonal Influence and Coping
To capture the seasonal influence on HHs livelihoods and food security, the PRA participants developed seasonal
calendars at three camp sites (Annex 2). At the time of writing this report, in Balukhali, the UMNs had arrived four
months ago (Nov. 2016), but calendars were not developed because the influence of seasonality was not significant.
0 5 10 15 20 25 30 35
Begging
Wage Labour
Salaried job
Small Business
Fishing net weaving
Domestic Worker
Vegetables Gardening
Handicrafts/Tailoring/ Weaver/handloom
Poultry
Collection of Relief
No Economic Activity
Selling of woodfuel

32
Data from the calendars revealed that HHs were most impacted by the peak of the monsoon season (June to August),
which coincided with the lean season when jobs, income and food were most scarce.
Impacts of Lean Season
• Excessive and heavy rainfall, storms and thunderstorms;
• Restricted mobility due to heavy rainfall;
• Scarce wage labor due to heavy rainfall;
• Reduced or no work at port due to port closure;
• Inaccessibility of hill forests for collection of wood fuel;
• Longer periods of fishing required to harvest fish in the sea;
• No specific schedule for fishing and fear for deep sea fishing using small fishing vessel;
• Increased elephant movement near settlements.
Coping at Lean Season
• Skipping meals, starving, and begging, collecting relief;
• Selling labor in advance and receiving money to meet the expenditures of rainy season;
• Taking loans with high interest rates from individuals;
• Borrowing wood fuel from local shops at high cost;
• Engaging in illegal sources of income;
• Keeping a stock of rope and plastic for repairing homes from heavy rains.
Furthermore, the HHs are coping with the lean
season by reducing the number of their meals.
During the lean season HHs were eating only one
meal in the month of July. HHs reported having 02
meals for 05 months (May-June; Aug-Oct.). HHs were
having 03 meals for 06 months (Nov-Dec-Jan-Apr).
The peak season covered a period of 09 months: Jan.-May; Sept.-Dec. Displaced HHs referred to the peak season as
the highest availability of income activities. The reported advantages during peak season were:
Advantages of Peak Season
• Volume of work for wage labor in the crop field increased;
• Volume of work for dry fish processing increased;
• Volume of work at the port increased;
• Volume of work at sea for fishing increased;
• Easier movement for wood fuel collection;
• Low cost of vegetables and rice during peak harvesting season;
• More frequent travel to engage in income activities;
• Ability to re-pay loans and cost of wood fuel.
3.3 Assessment of energy consumption
The energy consumption for cooking and efficiency depends on cooking technology, cooking practice, fuel quality,
and type of food cooking. The sources, types and quality of cooking fuel, storage of forest fuel are also important
HH Food Consumption Score
• 3 meals for 06 months (Nov.-Dec & Jan.-April)
• 2 meals for 05 months (May-Jun. & Aug.-Oct.)
• 1 meal (July)

33
factors that determine the efficiency. In this section, the assessment findings on cooking energy consumption are
described in detail.
3.3.1 Consumption of wood fuel
The average HH wood fuel consumption was 0.85 Kg/person/day at Kutupalong, 0.72 Kg/person/day at Leda, 0.71
Kg/person/day at Shamlapur and 0.83 Kg/person/day at Balukhali. The overall average consumption of wood
fuel/day/HH was calculated by 1) multiplying the average consumption/person/day by the number of average
household members for each site to get the site-wise average consumption/day/HH, and 2) calculate the average
consumption/day/HH of all four sites to obtain an overall average. Our assessment revealed that the overall average
consumption of wood fuel was 4.285 Kg/day/HH, for the entire AOI. This average was used to calculate the total
yearly biomass consumption/demand for the AOI as reported in Table 8.
Table 8: Current yearly wood fuel consumption/demand by the household. The average value of 4.285 kg/day/HH was used to estimate overall consumption in the area of interest.
Total UMN Displaced+Lower poverty line hosts
Displaced+Higher Lower poverty line hosts
Population (HH) 25577 34815 43255
Biomass (t/Year) 40003 54452 67652
Consumption patterns were affected by volume of wood stock available in surrounding areas or nearby forests. HHs
that were living close to and/or around well-stocked forests tended to have a steady supply of wood fuel and could
afford to meet their daily requirements for wood fuel for cooking. In the current assessment, we observed that the
majority of HHs were “wood fuel dependent”, i.e. about 99% used wood fuel for cooking.
In addition to HH consumption, the volume of wood fuel consumption/demand by other social units is mentioned
below (Table 9). Data revealed that the government and non-government offices are using dried tree branches
(average 80 Kg/day all year long) for cooking. Among both, one office used 75 Kg/Day of charcoal (for five days per
week for cooking, four months/year). The offices stored their fuel in open space inside the kitchen. Similar to HHs, the
majority (70%) of restaurants and tea shops used primarily dried tree branches and secondly large fresh and dry trunk
sections. In addition, they used charcoal and saw dust for cooking (Table 9).
Table 9: The Current wood fuel consumption/demand by other social units under the high poverty line scenario.
Social Units No. of Social Units
Consumption of Woodfuel Biomass (Kg/Day)
Consumption of Woodfuel Biomass (Ton/Year)
Households 43254 4.29 67729
Office of Govt. 42 80 1226
Restaument, Bakery, Tea Shop 298 44.29 4817
Brick field 9 56.14 184
Schools 19 11.29 78
Clinics 10 8.41 31
Total 43632 - 74065
3.3.2 Wood fuel collection dynamics

34
Data revealed that the majority (above 85%) of HHs consumed dry tree branches all year round, and dry leaves
(average 40%) for about seven months in the year (October to April). Fresh tree branches, large fresh and dry trunk
sections were consumed by less than ten per cent of HHs for less than six months/year. Storage patterns among HHs
were similar along with availability of wood fuel types and seasonal influence. The majority of HHs were conducting
sun/air drying of collected fresh wood fuel during the dry season (Figure 9). Storage was usually performed under the
shed inside the kitchen or home, but was also done outside. Dry leaves were also kept in sacks inside the
house/kitchen.
Figure 9: Drying of wood on the roof and on the ground (left) and leaves (right) outside a displaced house.
Wood fuel collection included collection from the forest, or purchased from various locations. Wood collected from
the forest was used for both selling and HH consumption for cooking. Also, wood fuel was used for cooking and selling
food to others in addition to subsistence level consumption. Data revealed that 47.71 per cent of HH purchased wood
fuel, 46.73 per cent collected wood from the forest, and 5.56 per cent did both (Figure 10). Notably, 25.16 per cent
HH sold wood fuel for income. Considering the above collection patterns, we separated purchased wood from
collected wood (Table 10). For collection of wood fuel from the forest in all four sites, the average round trip distance
observed was 8.75 Km and the average time per trip was 4.47 hours. On average, the amount of wood collected was
28.65 Kg/trip. The HHs traveled once per day and 3.07 days/week for 6.21 months/year (Table 10). For comparison,
Sayed, et al. (2012) found that HHs spent 3-7 hours for collection of 25 Kg wood fuel per trip for two trips per week.
Figure 10: Wood fuel collection patterns (% of HH woodfuel collection).
46.73
47.71
5.56
Forest Purchase Both

35
Table 10: Status of HH wood fuel collection in four sites.
Collection Dynamics
Average Distance Travelled Km/Round Trip
Average Hours Spent/ round trip
Units/ Trip
Unit
No. of Trips Conducted
Average daily
Days/ week
Number of months per year
Collection 8.75 4.47 28.65 Kg 1 3.07 6.21
Purchase 2.07 1.19 25.69 Kg 1.22 2.7 8.46
Our assessment found that 6.6 per cent have harvested dried large trunk sections, 29.6 per cent dried branches, and
16 per cent dried leaves, 18.8 per cent fresh large trunk sections, 27 per cent fresh branches and two per cent fresh
leaves. More than 45 per cent of HHs reported that they have collected greenwood fuel to be dried. Only 12 per cent
of the wood was naturally dried. In these cases, the trees were felled and left on the ground until the wood became
dry. Wood fuel collection continued annually with most of the extraction taking place during the dry season.
Regarding the average distance of 8.75 Km, it concerns mostly women and children (see Figure 11) who are solely
engaged in collection of wood fuel (Vianello, 2016b).
For purchasing wood fuel, our study indicated that the observed average distance was 2.07 Km as a round trip
performed in 1.19 hours and collecting 25.69 Kg/trip for 1.22 trips/day, and 2.70 days/week for 8.46 months/year (in
Table 11) is a common example of device for manual wood fuel transportation).
According to Sayed, et al. (2012), 85 per cent HHs observed collected wood fuel from forest in Teknaf Wildlife
Sanctuary. Notably, according to our assessment, 25.16 per cent HHs continued selling of wood fuel for income. The
site-based wood fuel collection distances are presented below (Table 11).
Table 11: Wood fuel collection from forest.
Description Kutupalong Leda Shamlapur Balukhali
Distance moved by a displaced person to collect woodfuel (radious in Km) 8.91 10.14 7.85 8
Kg of Woodfuel are colleccted per trip 20.57 26.43 4.45 33.33
Hours per trip including collection and return 4.49 4.28 4.45 4.33
Figure 11:Child carrying a wood bundle in Kutupalong.
Figure 10: Double bundle transportation of woodfuel.

36
The predominant energy source
for cooking was fuelwood,
observed in over 96 per cent HH
surveyed in our assessment. For
comparison, 93 per cent was
observed for Sub-Saharan Africa
(Lehne et. al., 2016), 89 per cent at
Goudoubo Refugee Camp in
Burkina Faso (Vianello, 2016a) and
90 per cent in Uganda (WFP,
2012). The Global Alliance for
Clean Cook Stoves reported in
2016 that 89 per cent of people in
Bangladesh used solid fuels for
cooking which highlights the
necessity to consider both host
and UMN populations for any
interventions related to wood
based energy supply.
THE RELATIVE IMPORTANCE OF
FUELWOOD FOR COOKING
The Balukhali UMN shelter is nearest to social forestry projects compared to other three sites. However, the UMNs of
Balukhali do not have any kind of legal or illegal access to this forest resource. They continue cooking by using the
dried leaves, roots and fallen tree parts from other areas. The host community guards the trees and UMNs are
collecting wood fuel from areas adjacent to the social forestry areas (Figure 12). The host community and UMNs
report that the stock of wood fuel in the areas surrounding the social forestry projects is reducing sharply.
This emerging demand of wood fuel by the UMNs will promote potential conflict with the host community groups. In
Kutupalong and Leda, the UMNs are paying token money to the host community leaders for wood fuel collection. On
average, BDT 50 for men, 40 for women and 25 for children per trip is paid to go inside the forest and collect wood
fuel by head loading. The token is higher if someone would like to collect wood fuel by cart/vehicle. As there is no
system of token money in Shamlapur, the HHs are walking long distances for collection of wood fuel to safely avoid
the watch tower of Forest Department.
The key challenges reported by the UMNs are attacks by the elephant, pressure from the Forest Department and host
community leaders. Wood fuel collection was also limited during the monsoon rainfall season because roads became
impassable.
3.3.3 Energy Consumption for Cooking
Data for energy consumption was captured for HHs and other social units.
The data considers various sources of energy, including cooking frequency,
daily, weekly and yearly consumption of energy, and so forth described in
the following sub-sections.
Data revealed that in Kutupalong, HHs were cooking using wood fuel,
charcoal and kerosene. The average wood fuel consumption observed was
4.72 Kg/HH/day for 7 days/week and 12 months/year. In addition to wood
fuel, there were six HH using kerosene for cooking, and they used on
average 1 liter/HH/day for 3.16 days/week and 7.33 months/year. In
addition, one HH was observed using charcoal at 2 Kg/day for 7 days/week
and 12 months/year (Table 12).
In Leda, HHs were using wood fuel at 4.11 Kg/day/HH for 7 days/week and
12 months/year. In addition to wood fuel, four HH were using kerosene at
1 liter/day for 4.50 days/week and 4.50 months/year. One HH was using
LPG at 1Kg/day for 7 days/week and 6 months/year. In Leda, HH were
using wood fuel at 3.76 Kg/day/HH for 7 days/week and 12 months/year.

37
Similarly, in Balukhali, HHs were using wood fuel observed as 4.55 Kg/day/HH for seven days/week.
The average wood fuel consumption per HH in Kutupalong was 4.72 Kg/Day, followed by 4.55 Kg/day in Balukhali,
4.11 Kg/day in Leda and 3.76 Kg/day in Shamlapur. Although average energy consumption rates for cooking were
similar at the HH level among the sites, consumption rates varied substantially for others social units according to
cooking practice, efficiency of cooking utensils, purpose of cooking, number of people in camp settlements, and the
type of food they were cooking.
Wood fuel consumption rate was also influenced by site-specific factors. For example, HH rates were affected by
NGO’s that donated food in Kutupalong, bakeries in Shamlapur, and daily cooking for hundreds of workers in
Brickfields in Leda. The amount of energy consumption varied and overlapped for the same social units. For example,
in the same restaurant, they are using more than one cooking system and energy. Overall, considering all cooking
energy types, wood fuel was the most dominant Table 12.
Table 12: Household energy consumption for cooking.
Sites Cooking Energy Sources
HH % Units of Energy
Cost/ unit of energy
Average Energy Consumption
HH Average Consumption/ Day
Days/ Week Months/ Year
Kutupalong
Woodfuel 168 100.00 Kg 14.67 4.72 7 12
Charcoal 1 0.60 Kg 10 2 7 12
Kerosene 6 3.57 Liter 80 1 3.16 7.33
Leda
Woodfuel 66 100.00 Kg 13.5 4.11 7 12
Kerosene 4 6.06 Liter 80 1 4.5 4.5
LPG 1 1.52 Kg 100 1 7 6
Shamlapur Woodfuel 48 100.00 Kg 12.43 3.76 7 12
Balukhali Woodfuel 24 100.00 Kg 13.25 4.55 7 4
Office/Admin. Center Energy Consumption for Cooking
Data revealed that in Kutupalong, two offices were cooking using wood fuel at a rate of 80 Kg/day for 7 days/week
and 12 months/year. Charcoal was used for cooking in one office at 75 Kg/day for 5 days/week and 4 months/year. In
both Kutupalong and Leda, LPG in one office at 1 Kg/day for 6 days/week and 12 months/year, while in Shamlapur,
one office used LPG at 0.21 Kg/day for the same period (Table 13). In Balukhali, there was no office to use energy for
cooking.
Table 13: Status of office/admin center energy consumption for cooking.
Camp Settlement Cooking Energy Sources
Office/Admin. Center
Units energy
Cost/ unit of energy
Average Energy Consumption
Average Con. /Day
Days/ Week
Months/ Year
Kutupalong
Fuelwood 2 Kg 10 80 7 12
Charcoal 1 Kg 15 75 5 4
LPG 1 Kg 100 1 6 12
Electricity 1 Kvh 15 4 6 2
Leda LPG 1 Kg 100 4 6 2
Shamlapur LPG 1 Kg 110 0.21 7 12

38
Restaurant, Tea Shop, Bakery, Brickfield Energy Consumption for Cooking
The same data were collected for restaurants, tea shops, bakery and brickfields. The data in Error! Reference source
not found. illustrates that these activity sectors have a significant role in the energy consumption but they use
diversified sources of energy. The consumption of fuel wood for these commercial activities remained the primary
source of energy in the four settlements.
Table 14: Restaurant, tea shop, bakery, brickfield cooking Energy consumption.
Sites Cooking Energy Sources
# of User Units of energy
Cost/ unit of energy
Average Cooking Frequency
Average Con. /Day
Days/ Week
Months/ Year
Kutupalong
Woodfuel 20 Kg 11.95 20.09 7.00 11.69 Charcoal 3 Kg 11.63 33.33 7.00 12.00 Kerosene 4 Liter 80.00 2.56 5.50 9.25 LPG 4 Kg 100.00 2.25 5.50 9.50 Coal 1 Kg 8.00 3.00 7.00 11.00
Leda
Woodfuel 6 Kg 10.57 1 5.16 7.00 12.00 Charcoal 4 Kg 10.00 19.50 7.00 9.00 LPG 7 Kg 100.00 4.28 7.00 12.00 Wood dust 1 Kg 4.00 20.00 7.00 6.00
Shamlapur Woodfuel 2 Kg 11.46 132.50 7.00 12.00 Charcoal 2 Kg 10.00 60.00 7.00 12.00 LPG 5 Kg 110.00 2.20 6.60 11.40
Balukhali
Woodfuel 5 Kg 10.40 9.40 6.80 5.40
Wood dust 1 Kg 4.00 30.00 7.00 12.00
Kerosene 2 Liter 80.00 1.50 7.00 2.00
LPG 1 Kg 110.00 1.00 7.00 11.00
3.3.4 Expenditure on Cooking Energy
Data revealed that HH weekly expenditure on cooking was mostly similar at all four sites. Kutupalong was observed to
have the highest expenditure (BDT 302.95/week/HH) followed by Leda (BDT 276.11/week/HH), Balukhali (BDT
272.92/week/HH) and Shamlapur (BDT 268.92/week/HH), (Figure 13). The HH cooking energy expenditure was mostly
spent on wood fuel and kerosene.
The weekly expenditure for cooking in restaurants, tea shops, bakeries and brickfield varied largely due to use,
purpose and consumption rate (Figure 13). In Kutupalong, the average expenditure was BDT 1535/week/unit. In Leda,
the average expenditure included food for staff at the brickfields and was BDT 1429 /week/unit. In Shamlapur, the
average expenditure was much higher at BDT 5389 /week/unit due to excessive cooking fuel consumption by two
bakeries. In Balukhali, the cooking energy expenditure was BDT 1182 /week/unit (Figure 13).

39
Figure 13: Average weekly expenditure per household (left) and other social units (right) in the different settlements for cooking energy (all energies combined, in taka/week).
The cooking energy expenditure for office/admin center varied greatly among the camp settlements due to cooking
for staff and beneficiaries during their trainings (data not shown with graphs). Data revealed that in Kutupalong an
average of BDT 2585.40/week/office was spent for cooking for staff and students/beneficiaries, followed by Leda with
an average BDT 2400.00/week/office. In Shamlapur, office cooking is for staff only and BDT 150/week/office was
spent on average. In Balukhali, there is no office/admin center located at the camp settlement.
The overall average cooking energy consumption was USD $3.56/week/HH at the assessment sites. For comparison,
Okello (2016) found USD $4.3/week/HH at Dadaab, Kenya and Vianello (2016a) found USD $2.5/week/HH at
Goudoubo Refugee Camp, Burkina Faso.
On a per HH basis, the average monthly expenditure for cooking fuel was 4.64 per cent of average monthly income
in our assessment. This relatively low value indicates that most of the wood fuel was collected rather than
purchased.
3.4 Screening technologies and local practices for cooking
The cooking technologies were mainly dominated by the nature, availability and type of cooking fuels that are used by
the community people. Also, the cooking practice and technologies are greatly influenced by the fuel cost and
availability. The local coking technologies and practices are described in the following sub-sections.
3.4.1 Cooking System and Energy
HH Cooking System and Energy
Data revealed that all HHs (n = 306) used wood fuel and traditional handmade mud stoves for cooking. Additionally,
one HH usedan LPG Stove at Leda and one usedwood fuel with Bondhu Chula (improved cooking stove made of
concrete) at Kutupalong (Table 15). Okello (2016) found that 98 per cent of the HHs in their study depended on wood
fuel for cooking at Dadaab Refugee Camp, Kenya. Among them, 49 per cent of HHs collected wood fuel free of cost
from the nearby forest. In comparison, our assessment found that 46.73 per cent HHs had collected wood fuel from
the forest.
Table 15: Status of cooking technologies used by households.
Stove Type HH % Stove Model HH% Fuel
Mud Stove 100 Mud Stove 100 Woodfuel
250,00
260,00
270,00
280,00
290,00
300,00
310,00
HH Weekly Average Expenditure (BDT) for Cooking Energy
Kutupalong
Leda
Shamlapur
Balukhali
0
1000
2000
3000
4000
5000
6000
Weekly Average Expenditure for Cooking Energy for Restaurant, Tea Shop, Bakery, and Brickfield
Kutupalong
Leda
Shamlapur
Balukhali

40
At Leda, all the UMN HHs were given Bondhu Chula (improved cooking stove made of concrete, by Infrastructure
Development Company Limited IDCOL. However, all HHs had removed the stove chimney due to rainwater coming
inside the house and 80 per cent had stopped using the Bondhu Chula all together. In addition to problems of water
leaking in through the chimney, apparently utensils used by HH are awkwardly smaller than the Bondhu Chula stove.
Moreover, HHs claimed that the Bondhu Chula stove consumed more wood fuel compared to the mud stove. As HHs
largely rejected the Bondhu Chula stove (Figure 15)., preferring instead familiar traditional mud stoves, either more
instruction is needed for their appropriate use or it’s possible that they are not feasible (Figure 14).
Similar to Leda, in Balukhali, all the host community HHs
were given Bondhu Chula by IDCOL during 2009. However,
at the time of writing this report, all of the newly arrived
UMNs in Balukhali were cooking by wood fuel and
traditional mud stove. Similarly, in Kutupalong and
Shamlapur, 100 per cent HHs were cooking with wood fuel
and traditional mud stove. The HHs were not aware about
the inefficiency of cooking system and wastages of wood
fuel as they continued the traditional cooking system with
open fire (Vianello, 2016a).
Biogas plants and kitchens for cooking were observed in
Leda. There were 40 biogas plants along with 41 kitchens
and 58 burners where 480 HHs were cooking. However, very
few HHs were using the biogas cooking burners, partly due
LPG Stove 0.327 LPG Stove 0.327 LPG
Bondhu Chula 0.327 Bondhu Chula 0.327 Woodfuel
A number of interventions have targeted cooking
fuel and fuel-efficient stoves to address
unsustainable wood fuel supply (Vianello, 2016a).
Such interventions have had limited success as they
have not been in line with the social, economic and
environmental context. Better informed
interventions related to fuel efficient cook stoves
must be achieved to provide a immediate and mid-
term solutions to the energy scarcity faced by
vulnerable communities whilst reducing pressure
on forest and wood resources.
GETTING ENERGY EFFICIENCY RIGHT
Figure 13: Traditional mud stoves used in majority in the displacement settings of the area of interest.
Figure 14: Picture of a bondu chula (improved stove).

41
to the bad smell, but also because irregular supply of gas results in half cooked food. For these reasons, the biogas
option doesn’t appear to be a viable alternative to wood fuel usage.
Office/Admin Center Cooking System and Energy
Data revealed that in Kutupalong, among the six offices, five were using fuel for cooking. Of these five, three used
wood fuel and mud stove for cooking, one used LPG in LPG stove and one used electricity. In Leda, only one office
was using an LPG stove (Table 16). Similarly, in Shamlapur, only one office cooked by using an LPG stove. No office
was located at the camp settlement in Balukhali.
Table 16: Cooking technologies used by office/admin center.
Stove Type Office % Stove Model Off % Cooking Fuel
Mud Stove 42.86 Mud Stove 42.86 Woodfuel
LPG Stove 42.86 LPG Stove 42.86 LPG
Electric stove 14.29 Generic electric stove 14.29 Electricity
Restaurant, Tea shop, Bakery and Brickfield Cooking System and Energy
Data revealed that the majority (35 out of 46) of the restaurants
and tea shops cooked with woodfuel and mud stoves, while 16 of
them used LPG Stove (Figure 16). Four used kerosene and kerosene
stove and four used wood fuels for cooking in improved self-made
stoves with brick, sand, cement/soil and concrete.
Out of these, in Kutupalong, 23 restaurants and tea shops used mud
stove with wood fuel, three used kerosene stoves with kerosene,
and four used LPG stove with LPG. In Leda, seven restaurants, tea
shops and brickfields used mud stoves with wood fuel, and six used
LPG stoves with LPG for cooking. Of the restaurants, tea shops and
bakeries in Shamlapur, one used mud stove with wood fuel, five
used LPG stove with LPG, and two used improved stoves with wood fuel. Of the restaurants and tea shops in
Balukhali, four used mud stoves with wood fuel, one used kerosene stove with kerosene, one used LPG stoves with
LPG, and two used improved stoves with wood fuel (Table 17).
Table 17: Status of cooking technologies used by restaurant, tea shop, bakery and brickfield.
Stove Type Restaurant Stove Model Restaurant Cooking Fuel
Mud Stove 76.09 Mud Stove 76.09 Woodfuel
Made of Concrete and bricks
8.70 Made of Concrete and bricks 8.70 Woodfuel
LPG Stove 34.78 LPG Stove 34.78 LPG
Kerosene stove 8.70 Kerosene stove 8.70 Kerosene
3.4.2 Cooking practices and food types related to wood fuel consumption
Cooking practice includes the use of cooking fuel, type of food cooked, and cooking stove, cooking utensils,
equipment, and cooking frequency (Figure 17). All users cut food ingredients into small pieces before cooking. A large
share (88%) covers the cooking pot with lids when cooking. About half (56%) of them were cutting large pieces of
Figure 15: Restaurant using liquified propane gas burner to prepare food.

42
wood into small pieces, and 23 per cent are sheltering the fire when cooking. None of the users pre-soaked the
legumes or grains and none used the cooking pot with flat bottom (Figure 17). Notably, the households were not very
aware about fuel-efficient cooking practices. In contrast, other social units like office, restaurants, and shops
appeared somewhat aware of using fuel-efficient cooking practices.
Figure 17: Cooking practices in the households.
For cooking frequency, approximately 29 per cent HHs cooked two times every day and over 70 per cent of HHs
cooked three times every day. HHs cooked semi-solid and solid food annually. However, the HHs frequency of food
consumption ratio (FCS) and household dietary diversity (HDD) varied in relation to their food habit, and food
purchase capacity. The average cooking time for food was 23.6 minutes for an average five members HH. Data
revealed that the majority of the HH (85.2%) cooked inside the kitchen or house, while only 14.8 per cent HHs cooked
both inside and outside. Outside cooking by HHs was done mainly during the dry-winter season. HHs also reported
that during the monsoon and lean season they reduced cooking frequency due to lower ability to collect wood fuel.
3.4.3 Opinions towards Alternative Cooking Energy
Figure 18: Percentage of households who consider the use of alternative energy for cooking together with alternative cooking stoves.
88
0
56
100
23
14
00
20
40
60
80
100
120
12.09
25.16
59.48
3.27
Charcoal Kerosene LPG Gas No opinion

43
To reduce the cooking energy consumption and to enhance the efficiency, the survey captured data about alternative
fuels and cooking stoves. Data revealed that most of the respondents were not aware about the scarcity of wood fuel
and not concerned about alternative fuel options. However, data revealed that despite of economic capacity, majority
of the HHs prefer LPG fuel with LPG stove (59.48%); followed by kerosene with kerosene stove (25.16%); charcoal
with traditional mud stove (12.09%). About 3 per cent of the HHs had no opinion about alternative energy for cooking
(Figure 18).
The office/admin centers did not have any opinion for alternative fuelsor stoves as most of them were using different
fuel options like LPG or electricity for cooking. There were 66 per cent who had no opinion about alternative cooking
energy and stove. However, 20 per cent preferred LPG with LPG Stove, followed by kerosene with kerosene stove
(10%) and charcoal with mud stove (4%) (Figure 18). The solar energy shop remained active during the night for
lighting but was not used for cooking purposes.
3.4.4 Energy Sources in Local Market
To determine the energy sources, a total of five local
markets were surveyed in the four sites. Data revealed
that in Kutupalong there were 27 kerosene shops, two
shops selling LPG and stoves, five wood fuel shops, 1
Bondhu Chula shop, and two solar lighting shops. In
Leda, the following were observed: 17 wood fuel shops,
13 kerosene shops, 4 LPG and LPG stove shops, 2 LPG
shops, one charcoal shop and one Bondhu Chula shop
(Figure 19). In Shamlapur, there were 16 kerosene
shops, 4 LPG shops, 3 wood fuel shops, 2 LPG and LPG
stove shops and two solar lighting shops. In Balukhali,
one wood fuel shop, one LPG and LPG stove shop, and
one kerosene shop were located at the entrance local bazar (Paan Bazar) (Table 18).
Table 18: Status of energy sources in local market.
Although wood fuel shops existed in the local market, wood fuel trading was dynamic and was observed in a wide
variety of areas within the settlements. HH level trading of wood fuel was one of the most common economic
activities observed at the camp settlements. In Kutupalong, HH level trading was commonly observed and less so in
Leda and Shamlapur. In Balukhali, the wood fuel trading by newly settled UMNs was still not a major activity.
Energy Sources Kutupalong Leda Shamlapur Balukhali
Kerosene Shop 27 13 16 1 LPG Shop 0 2 4 0 LPG and LPG Stove Shop 2 4 2 1 Woodfuel Shop 5 17 3 1 Charcoal shop 0 1 0 0 Bondhu Chula Shop 1 1 0 0 Solar Energy Shop 2 0 2 0
4
66
20
10
Charcoal Kerosene LPG Gas No opinion
Figure 18: Percentage of other social units (offices and administrative centers) who consider the use of alternative
energy for cooking and cooking stoves.

44
3.5 Multi-Sectoral Challenges
The displaced HHs are facing multi-sectoral challenges for the basic services such as land for shelter and cultivation,
healthcare, food supply, and education. In addition to the scarcity of basic services, the key challenge that they are
facing is collecting enough wood fuel for cooking which impacts attaining basic services. Considering the direct and
indirect impact on basic services, the assessment observed multi-sectoral challenges faced by displaced HHs during
wood fuel collection. These challenges were coupled with health implications and the protection of women and
children during wood fuel collection, which are presented in the sub-sections below.
3.5.1 Health Implications due to use of wood fuel
HHs faced health problems due to poor cooking system and wood fuel. HHs survey data revealed that cooking related
burn and acute respiratory sickness caused more health problems to the children and women who stayed near
cooking areas. Both male and female Children of age 0-10 were observed to suffer from acute respiratory sickness.
Respondents reported problems with allergies (80%), eye infections (52%), eye souring (44%), burns and acute
respiratory infections (36%), food borne diseases due to eating undercooked food (16%) and asthma (08%). Also,
children, adult women and elderly people (male and female) faced more health implications than adult men who
were not involved with cooking (Figure 20).
Figure 20: Percentage households with health problems due to the use of wood fuel for cooking.
The prevalent negative impacts reported by the respondents in this assessment was substantial. It is well documented
that the use of solid fuels for cooking is associated with health implications (Okello, 2016). The Global Alliance for
Clean Cook Stoves (2016) reported that 137,670,000 people in Bangladesh are affected by household air pollution
during 2016 (around 85% of the total population) and that the number of deaths per year related to air pollution
amounts to 78,000 people. According to WHO, 4.3 million people die every year due to household air pollution
(WHO, 2016). Additionally, cooking using wood fuel greatly increases the risk that women and children are burned
(WHO, 2016), which was reflected in the current assessment for 36 per cent of the respondents.
3.5.2 Challenges of Wood fuel Collection
Displaced HHS collected 100% of their wood fuel from government forest lands, which are either natural or social
forests. According to the FGD and SSI findings, the UMNs have faced a number of security problems from multiple
sources (Figure 21). There were 92 per cent of the participants that reported threats by elephant attack, 72 per cent
by Forest Department, 56 per cent by host community, 40 per cent by bandits or opportunists, 16 per cent by police
and Border Guard Bangladesh (BGB), and seven per cent getting lost inside the forest (Figure 20).
8
16
36
36
44
52
80
0 10 20 30 40 50 60 70 80 90
Asthma
Food born diseases/Diarrhea
Burns
Acute Respiratory infections
Eye souring
Eye infections
Allergies

45
1.32
3.95
5.26
19.74
25.00
44.74
- 5.00 10.00 15.00 20.00 25.00 30.00 35.00 40.00 45.00 50.00
Police and BGB
Elephant Attack
Robbers
Ongoing Conflict
Forest Department
Host Community
Figure 21: Status of households reported threats faced by women.
Figure 21: Source of threats faced by individuals during wood fuel collection.
Both males and females experienced threats during the collection of wood fuel, but the assessment focused
particularly on threats experienced by displaced women. Following discussions during HH survey, FGDs, SSIs, data
revealed that women and children faced the highest insecurity concerning access to resources and services. The data
revealed that women collect wood fuel more frequently than men (42.60% v. 36.60%, respectively). A fair share of
children (20.80%) also performed wood fuel collection. Women further reported suffering a variety of assaults
including physical, verbal, sexual and psychosocial trauma (Figure 22).
HH survey data revealed that during the last six months 75.16 per cent of women in HHs (230 out of 306) did not receive any threats and 24.84 per cent did received threats (76 out of 306). Of the HHS with women receiving threats, the highest source was from the host community (44.74%), followed by the Forest Department (25.00%), ongoing conflict related to accessing resources and services (19.74%), attacks from bandits or opportunists (5.26%), elephant attack (3.95%) police and BGB (1.32%). Notably, women travelled comparatively shorter distances and less deep inside the forest for wood fuel so that they faced fewer attacks from elephants than men (Figure 21).
According to respondents, the police and BGB conducted verbal and social abuses. A major consequence of this was
limited communication between the victim and her/his family members, relatives, and friends. One woman was also
arrested. Elephants attacked three women and caused physical abuse and psychological trauma. Robbers verbal
abused four women. Due to ongoing conflict for access to resources and services in nearby wood fuel collection areas,
15 women faced verbal abuse and confiscation of wood fuel. The Forest Department participated in verbal abuse,
confiscation of wood fuel, and the arrests of 19 women. The host community was the threat experienced by the most
HHs (34) and included verbal abuse, social abuse, physical assault, psychological abuse, sexual assault, and
confiscation (Table 19).
7
16
40
56
72
92
0 10 20 30 40 50 60 70 80 90 100
Lost inside the forest
Threats from police and BGB
Threats from bandits or opportunists
Threats from host community
Threats from Forest Department
Threats due to Elephant attack

46
Table 19: Type of threats caused to women by sources. Column HH indicates how many households are concerned and the experienced threats are underlined in X.
Threat Status/ Caused by HH Verbal abuse
Social abuse
Physical abuse
Psychological abuse
Sexual assault
Confiscation of Woodfuel
Arrest
No Threat 230
Police/BGB 1 X X X
Bandits or opportunists 4 X
Host Community 34 X X X X X X
Ongoing Conflict 15 X X
Elephant Attack 3 X X
Forest Depart. 19 X X X
Kiragu, Rosi et al., (2011) also reported the assault of women and children at the makeshift camps. The report of the
WFP-UNHCR joint assessment mission for Bangladesh (2010), also mentions that women and children have expressed
fear from beating and harassment by the villagers during wood fuel collection.
3.5.3 Displaced Women in Difficulties
Data revealed that women faced difficulties from discrimination and exploitation, summarized in (Table 20) The
assessment found that women experienced a lack of empowerment and social position in a patriarchal society.
Individuals from the host community and private employers discriminated against women by giving unequal wages
compared to host employees. The Block Management Committee (BMC) have discriminated against them in the form
of unequal distribution of relief (Table 20). It was also reported that employers and the BMC exploited women for
work and information collection. The details regarding the vulnerability of women are enclosed in Annex-3.
Table 20: Status of difficulties faced by women.
Difficulties Caused by Context
Discrimination
Private/Individual Employer
Majority of the UMN women during FGD shared that they have faced discrimination during work as the host employers not paying them equal wages. Still they are facing the same inequality by the employer. In the brickfield, owner contracted them for the whole season but after completion of work owner didn’t paying their full wages.
Block Management Committee (BMC)
During distribution of relief they are facing discrimination as not being relative or not have good relationship with BMC members.
Exploitation
Individual Employer The UMN women working as domestic worker, wage labour, brickfield worker, and wage labour for salt cultivation. In all work they have to work more in both hours and duration compared to initial work commitment.
Block Management Committee (BMC)
During distribution of relief BMC members have engaged them and pressure them to perform more duties like as during selection of recipients/beneficiaries, for information collection.
UMN women are highly vulnerable due to a lack of protection. UMN women are considered as second-class citizens
by the male members of the displaced community and as “persons for harassment” by the male members of the host
community. Women are assigned responsibilities for taking care of households, children, cooking, cleaning, washing,
collecting wood fuel, children foods, and generating income both outside and inside the home. Discussions revealed

47
that women are engaged in work for an average 12-13 hours daily compared to 9-10 hours for men (Thulstrup, 2015).
The contribution of women to HH income is significant - an average BDT 1972.00/month.
3.5.4 Vulnerable Groups
Vulnerable groups identified using the Vulnerability screening tool (UNHCR and IDC, 2016) were children, adolescent
girls, widows, women of HHs headed by women, divorced, and people with disabilities. Demographic data revealed
that a large number of children (aged 0 to 11) and adolescent girls (11-19) existed in all the settlements followed by
elderly, and disabled. Among the women, the most vulnerable group observed were widows, head of HH women, and
divorced women. More information about vulnerable groups is found in Annex 3.
3.5.5 Causes of conflict
Displaced HHs often reported conflicts over scarce resources, especially wood fuel collection, fetching drinking water,
collection of relief, homestead land, exercise of power, opportunities for labor, wages for labor and fishing. For
example, during certain periods of the year when water levels were lower (peak summer and dry season) conflicts
arose due to a limited number of drinking water access points Error! Reference source not found. Describes in more
detail the observed characteristics of conflicts including ways to resolve them. The intensity of the conflict was
measured as a simple opinion from respondent using the following scale: Low, Moderate and High.
Table 21: Households conflict and causes and recommendations.
Causes of conflict Intensity Conflict with whom Ways to resolve
Wood fuel Moderate Forest Department, Host Community
To develop legal woodfuel collection system, to pay the cost of damages for social forestry programs.
Drinking Water Low BMC To develop rules by BMC.
Relief Moderate Newly arrived UMNs To distribute the relief proportionately.
Homestead Land Moderate Host Community To take initiative with UPC and WM to resolve the matter.
Power exercise Low RR vs. UMN
Registered Refugee (RR) would like to show their power on UMN, while Government Camp In Charge along with CMC and BMC resolved the issues jointly. If failed, govt. camp in charge and police can come to resolve the issue.
Income Activities (Wage Labour)
Moderate Host Community Wage Labour
Advocacy and discussion meeting to get equal working opportunity and wages
Homestead Land Moderate Host, WM, BMC Resolve via discussion with host community.
Fishing opportunity and equal wages
Low Bohoddar/ fishing vessel owners
Advocacy and discussion meeting to get equal working opportunity and wages
3.5.6 Access to Services and Resources

48
Data revealed that more than half (57.52%) of the HHs remained without access to basic services and
resources(Figure 23)The resources that HHs perceived they lacked were access to relief food (63.73), free education
and health services (47.06%), non-food items relief (39.54%), free vocational training and micro credit support to start
income generating activities (17.65%),forest land for cultivation (15.36%),leased land for cultivation (6.21%), share
cropping (5.23%), access for fishing in the sea (4.09%), and registration as refugees (0.33%) (Figure 23).
Figure 23: Accessibility to (top) and need for (bottom) resources and services as perceived by the population (% of interviewed HHs).
3.5.7 Relations with Host Community
In Kutupalong, relations between the host community and displaced HHs were easy and peaceful compared to the
other three settlements. The key reason for this is that the two communities have co-existed since 1992. 83.33 per
cent of the HHs reported peaceful relations with the host community, and 16.67 per cent reported moderate
relations. Also, during FGDs, 66.67 per cent reported moderate relations with host community and the other 33.33
per cent reported peaceful relations but moderate relations with host influential leaders and Forest Department. In
Leda, 33.33 per cent key informants reported peaceful relations with host community, and 66.67 reported moderate
relations. In contrast, during three FGDs, all of the participants reported moderate relations with host community. In
Shamlapur, peaceful and moderate relations with the host community were reported by 50 per cent and 50 per cent
by informants during SSIs. However, during FGDs, 66.67 per cent reported moderate and 33.33 per cent reported
peaceful relations with host community. In Balukhali, 33.33 per cent key Informants reported about peaceful relations
with the host community, and 66.67 per cent reported moderate relationships. In contrast, during two FGDs, all the
participants reported moderate relationships with the host community.
3.5.8 Perceived environmental degradation
The FGD and SSI data revealed that 44 per cent of participants were aware of environmental degradation caused by wood fuel collection. They also considered settlement in forest areas as another cause of soil erosion and forest
degradation. As a way to mitigate the risk, 76 per cent of the participants suggested reforestation activities, followed by 60 per cent who proposed reducing wood fuel consumption, 56 per cent who considered wood-lot planting and
32
56
60
76
0 10 20 30 40 50 60 70 80
Training on sustainable harvesting practices
Woodlot planting/management
Efforts to reduce wood fuel consumtpiont
Deforestration activities

49
management, and 32 per cent proposed training on sustainable forest resource harvesting practices (Figure 24). With regards to training, 92 per cent participants reported that HH members would like to receive the training on sustainable wood
harvesting practices and sustainable charcoal production. Among them, 64 per cent requested to receive training on wood fuel collection management and 36 per cent proposed to receive training on sustainable forest management. It is worth noting here that at most of the sites, there were social forestry project being implemented jointly by Forest Department and host
community groups. During FGD and SSI, data revealed that the government has contracted and implemented a 10 years social forestry project (
Figure 24).
Figure 24: Perceived measures that could mitigate environment degradation (% of the interviewed HHs).
According to the National Forest Policy of Government of Bangladesh (1994), a major target is to conserve the
existing forest areas and bring 20 per cent of the country's land area under the forestation program and increase the
reserve forest land by ten per cent by the year 2015. It was proposed that GO-NGOs coordinate the efforts and that
the people actively participate. Initiatives carried out by the Government could be adapted and reproduced to fit the
need of the population (both host community and displaced population) in the AOI.

50
4 ASSESSING SUPPLY
The second part of the assessment focused on the fuel wood biomass stock currently available in the AOI and the
historical changes in land cover and biomass distribution. This was done by combining field measurements for above
ground biomass stock with historical satellite image time series analysis. The field measurements were carried out
from 01 to 08 March 2017, while the remote sensing change analysis was performed in April 2017.
4.1 Objective
The main objectives of studying supply dynamics are
1. To assess the existing stock of biomass available in different land classes.
2. To assess the recruitment status, the tree species diversity distributed in different land classes and the
potential for social forestry activities
3. To assess changes undergone by the different land cover classes over the period of interest
4.2 Sampling design
For assessing the biomass stock near to refugee camp, concentration was given on land classes having potential for
supplying wood fuel. A total of 19 land classes (Figure 25) were found from the national land class legend (GoB 2017)
in the area of intervention but only five classes were considered to have potential for fuel wood stock: shrubs, rural
settlements, forests, plantations, and agricultural land.
Figure 25: Area of each land cover class found in area of interest (ha).
Samples were taken randomly from different land classes. The number of sampled plots to be taken for estimation
was calculated using Equation 2(Pearson et al.,2006). For a small sampling fraction (that is, when area sampled is less
than 5% of the project area), the following simplified equation can be used for estimating the number of sample
plots:
15170
6466
4770
2895 26921987
1084 951478 394 208 98 74 70 25 22 15 11 11
0
2000
4000
6000
8000
10000
12000
14000
16000

51
Equation 2
22
**
i
iiVAL swE
tn
Where:
n= Number of sample plots required for estimation of biomass stocks within the project boundary;
dimensionless
tVAL= Two-sided Student’s t-value at infinite degrees of freedom for the required confidence level; dimensionless
E= Acceptable margin of error in estimation of biomass stock within the project boundary; t d.m.
Wi = Relative weight of the area of stratum i (the area of the stratum i, divided by the project area); dimensionless
si = Estimated standard deviation of biomass stock in stratum i; t d.m. (or t d.m. ha-1)
i = 1, 2, 3 biomass stock estimation strata within the project boundary
Figure 26: Land cover 2015 classification over the area of interest, location of the field plots and settlements.

52
A total of 20 plot locations were determined sufficient
for the different land classes (using ‘Winrock’s sample
plot calculator’ to assign the correct number of plots per
class1). However, due to time constraints, the total
number of plots measured was reduced to 15. Out of the
15 plots, 5 were shrub dominated areas, 3 were rural
settlement, 3 were forest plantation, 1 under mixed hilly
forest and 3 under crop land class (Figure 26).
The plot design and present wood fuel assessment
followed the same procedures as in the Bangladesh
Forest Inventory (BFD 2016), where each sample plot
consists of 5 sub-plots (1 in center and rest four is in four
cardinal direction) each with a radius of 19 meter, as depicted on (Figure 27).
4.3 Field procedure
4.3.1 Field team
The inventory team consisted of 5 members (1 Team leader, 1 Deputy Team leader, 1 Trained up person, 1 Forest
Department official and 1 labor). The team communicated with the forest department before starting the field work.
And forest department officials were present during the field data collection. It is noted that most of the displaced
people lived on land belonging to the Forest Department.
4.3.2 Plot location identification and plot establishment
Pre-field work included inserting all the coordinates of the selected plots in a GPS and tentatively locating the plot
using Google Earth. A comprehensive plan for field execution was prepared beforehand. The plot centers were
located using GPS. After locating the center of the plot, a distance measuring unit (DME) was calibrated and inserted
at the plot center for measuring distance. The center of other sub plots was identified using measuring tape, GPS and
Compass.
4.3.3 Field measurement
Land feature of the selected plots were classified following the prescribed land feature class and land feature
proportion were calculated using compass and measuring tape. Later a sketch was drawn on the data sheet and
photograph of it was taken in the tablet. Slope percentages of the plot were recorded using clinometer. Crown
coverage was recorded using ocular estimation and leaf cover was recorded using vertical count.
4.3.4 Bio-physical attributes measurement
A plot with 2.5 meters radius was taken at 5 meters distance from the plot center at 900from north. Seedling species
and number within the small plot (2.5m radius) were recorded. Saplings were recorded within the same small plot
(2.5 m radius) by measuring the height and DBH using diameter tape and range finder/clinometer. Trees having DBH
≥10 cm and ≤ 30cm within the medium plot (8 meters radius) were measured. All trees having DBH ≥30 cm within the
19 meters radius were considered for measurement. Stumps were identified following the same rules as for standing
trees and their base diameter and height were recorded in each of the appropriate inner plots.
1https://www.winrock.org/document/winrock-sample-plot-calculator-spreadsheet-tool/
1
2
3
4
5
N
EW
S
Distance between
subplots centers is 38 m
Figure 26: Surveyed plot design.

53
Later four transects of 8 meters were established in four directions (45, 135, 225 and 315 degrees) to count coarse
wood debris and fine wood debris. Data were recorded on the tab and paper format. This process was repeated in
each sub plot. Bamboo stem and clump were counted and average height and DBH of the bamboo stem were
measured.
A schema representing the subplot structure is available on (Figure 28).
Figure 28: Structure of each subplot and further breakdown in stratified zones for measuring biomass.
4.3.5 Equipment used
The following equipment were used for field based biomass measurements. This equipment was provided by FAO to
accomplish the study.
• BFI backpack;
• GPS device to reach the location and to record the coordinates;
• Measuring tape and Diameter tape to measure the plots and DBH of trees
• Compass to identify the directions of the plots;
• DME for measuring distance to the center of the plot;
• Laser Range finder for measuring tree height, inclination distance;
• Clinometer to measure the height and slope %;
• Toughpad tablet for collecting data using Open Foris software.

54
4.4 Biomass estimation
4.4.1 Tree biomass
In this study only trees, standing dead woods and stumps were considered for biomass calculation. It was observed
that majority of the people are used available above ground biomass (twigs, branches, leaves of trees and shrubs) as
wood fuel at displacement settings.
Different allometric equations were used for measuring above ground biomass. Considering the climatic Chave et al.,
(2014)Equation 3was used for calculating wood biomass.
Equation 3𝑨𝑮𝑩𝒕𝒓𝒆𝒆 = 𝟎. 𝟎𝟔𝟕𝟑 × (𝑫𝑩𝑯𝟐 × 𝒉 × 𝑾𝑫)𝟎.𝟗𝟕
Where,
AGBtree= Above ground biomass of a standing tree in kg,
DBH= Diameter at breast height in cm (taken at 1.3 meter),
h = Height in meter,
WD = Wood density in g/cm3. Wood density values were derived from DRYAD’s Global wood density database (Zanne
et al., 2009)
4.4.2 Stump biomass
Stumps were identified in the whole plot (19 meters radius). Base diameter was measured using diameter tape and
height were taken using measuring tape. Later volume of the stump was calculated using the formula of cylinder and
then it was multiplied by wood density and plot expansion factor to measure above ground biomass.
Equation 4 𝑨𝑮𝑩𝒔𝒕𝒖𝒎𝒑 = 𝝅 × 𝒓𝟐 × 𝒉 × 𝑾𝑫
Where, WD= Wood Density in g/cm3 (Zanne et al., 2009)
4.4.3 Basal area
Basal area of the trees was calculated using the following equation 5.
Equation 5 𝑩𝑨 = 𝝅 × (𝑫𝑩𝑯
𝟐)
𝟐
BA= Basal Area, DBH = Diameter at breast height
4.4.4 Tree species diversity and recruitment status
Tree species composition and diversity of the tree species were determined using the Shannon-Wiener’s diversity
index and Menhinicks’s index richness index (Krebs 1989 and Barnes et al., 1998). Discussions with local people and
the Forest Department informed that the area was once dominated by a variety of plant species. However, many
species have disappeared from this biome due to indiscriminate exploitation.
Species richness
Equation 6𝑹𝒊𝒄𝒉𝒏𝒆𝒔𝒔 = 𝑵
√𝑺𝑷
Where N = Number of species found in the land class and SP = Total number of species found in the entire population
(inventoried area)
Species diversity (Shannon index)

55
Equation 7 𝑯 = −𝒑 × 𝐥𝐧 (𝒑)
(where p = number of species in the land class / total number of species)
4.4.5 Social Forestry intervention
Data on social forestry intervention in different ranges under Cox’s Bazaar South Forest Division were collected
through personal communication with the respective forest offices. Social forestry program of the Forest Department
serves the purpose of providing quick solution to timber demand, fuel wood requirement and ensure protection
against land graving by involving the host community.
4.5 Results
4.5.1 Fuel wood stock results
Five different land use class were considered as the pool for supplying wood fuel in the displacement setting namely
mixed hill forest, forest plantation, rural settlement, shrub area and crop land. 15 plots under different land class
category were surveyed for estimating the stock. Duo to accessibility issues, all five subplots were not always
measured and, consequently, only 57 subplots out of a total of 75 possible sub plots were visited and measured.
Table 22: Plots, area, biomass and basal area distribution in the different land classes.
Class Number subplots
Area (ha) AGB (kgs/ha) Total AGB in AOI (tons)
Basal area (m2/ha)
Plantation Forest 14 951 204692 155384 17
Rural Settlement 13 4770 12665 85403 3
Mixed Hilly Forest 1 1987 17003 35765 7
Plantation Mangrove - 208 - 27883 -
Plantation Rubber - 98 13048 -
Hilly Forest 5 70 162468 11357 14
Crops 7 6466 983 11357 0
Shrubs 16 15170 2 27 1
Other 1 7700 - 437 -
Total 2016 57 37420
From Table 22 it is clear that highest biomass is preserved in plantations (155,384 tons) and rural settlements (85,403
tons), followed by mixed hill forest (35,765 tons), with shrub area yielding the lowest (27 tons). Shrub area covers
most of the land (41% , Table 22Error! Reference source not found.) in the area of intervention but has the lowest
amount of biomass in terms of kg/ha. During the field survey, most of the stumps were measured in the shrub land
(Table 23) which defines once these areas had a rich stock but these has been subjected to degradation due to
different anthropogenic reasons. Average basal area in the plantation forest is high (6.93 m2/ha) followed by the rural
area (1.33 m2/ha). Besides plantation forest have highest crown coverage compared to other land class. Crop land
had the lowest basal area as well as the lowest above ground biomass. These areas are more exposed to direct
sunlight with only 15% maximum crown coverage while the minimum is 0.

56
0
10
20
30
40
50
60
70
80
90
Rural Cropland Shrub Land Plantation Native forest
Seedlings/ha Saplings/ha Trees/ha Stump/ha
4.5.2 Biophysical results
Numbers of seedlings, saplings, trees, stumps were counted to determine the recruitment status of the surveyed
area. Table 23shows the status of seedling, saplings, trees and stumps per hectare area. The surveyed 15 plots cover a
total of 6.46 ha of land (Rural- 1.47 ha, Cropland- 0.79 ha, Plantation- 1.70 ha, Shrub land-1.93 ha, and native forest-
0.57 ha) of the AOI. The highest number of samples were taken from the shrub land. From field data, it was observed
that native forest (well managed and protected) and the shrub land has almost same number of seedlings/ha but the
number of saplings falls drastically in the shrub land. All the land classes show irregular patterns of plants in three
stages except in managed forest land.
The density is relatively high (108.63 trees/ha) in the plantation area followed by rural settlement (19.05) and lowest
in the shrub area (5.18). The number of stumps found was highest (8.29) in the shrub land and lowest in the crop land
(0) in Table 23.
Table 23: Biophysical information of different land class.
Classes Plot Area (ha)
No of Sub Plot
No Seedlings
No saplings
No trees
No stump
Seedlings/ha
Saplings/ha
Trees/ha
Stump/ha
Rural 1.47 13 15 7 28 3 10.2 4.76 19.05 2.04 Cropland 0.79 7 12 2 9 0 15.19 2.53 11.39 0 Plantation 1.7 15 18 15 185 2 10.57 8.81 108.63 1.17 Shrub land 1.93 17 51 6 10 16 26.42 3.11 5.18 8.29 Native Forest 0.57 5 15 13 10 1 26.46 22.93 17.64 1.76
Figure 29:Recruitment status at different land classes (number of stem/ha).

57
Figure 29 shows the Recruitment status at different land classes (number of stem/ha). From the observation in the
field and field data it can be inferred that the number of saplings are lower, revealing that saplings do not get a
chance to reach maturity. In contrast, there are seedlings and some trees in the surveyed area (except in the native
forest (plot-11). Protection should be ensured to keep the saplings so that natural regeneration procedure can
continue.
4.5.3 Species diversity
A total of 37 identified and unidentified tree species were observed in different land classes whereas Ahmed and
Haque (1993) found that Ukhia forest range has 38 tree species. This means this area still have the potential to regain
plant diversity if the forests were protected. Tree species composition of the study site is lower than other natural
and semi natural forest of Bangladesh with 183 species in Dudhpukuria WS (Akter et al, 2013), 85 tree species in
Sitapahar Reserve forest of Chittagong Hill Tracts (South) Forest Division (Nath et al, 1998), 92 tree species in Chunati
wildlife sanctuary (Rahman & Hossain, 2003), 62 tree species in Tankawati natural forest (Motaleb & Hossain, 2013).
Species diversity indices were estimated using Shannon’s diversity index (Table 24). From the diversity index, it was
evident that Shrub dominated areas have the highest diversity (21 species) whereas rural settlements have 13 species
mostly of fruit bearing trees. Crop lands and mixed hill forest have the same diversity (8 species) and plantations have
the lowest (7 species). From the above biophysical analysis, it was evident that shrub land possesses the highest
number of seedlings and a high species diversity. Besides, this land class also has the highest number of stumps per
hectare in the area. This depicts previous richness of the land class and provides a strong indicator of landscape
current degradation.
This landscape (AOI) is considered tropical forest and some portion of our study area falls under Inani national Park
and Teknaf wildlife sanctuary. However, diversity was lower compared to other forested area of Bangladesh. The
collected data will be used in further steps of the project to assist reforestation program, by trying to represent the
diversity observed in situ. The diversity and richness coefficients indicated that shrub dominated areas contained the
highest plant biodiversity, although they had the lowest biomass levels. This can be explained by the fact that stumps
and seedlings were accounted for in the species count, when these elements contain very little biomass. For future
steps, afforestation / reforestation programs should try to reproduce the same level of functional diversity in order to
reestablish as much as possible natural equilibrium.
Table 24: Species Diversity and Species richness.
Land class Number of
Species Number of Observations P Diversity
Species richness
Rural 13 50 0.23 0.34 0.68
Crop Land 8 30 0.14 0.28 0.42
Shrub Land 21 67 0.37 0.37 1.09
Native Forest 8 38 0.14 0.28 0.42
Plantation 7 184 0.12 0.26 0.36
Total 57 369 1.51
4.5.4 Social forestry plantation in different forest ranges
Unabated forest degradation and deforestation was evident in Cox’s bazaar south forest division (Belal, 2013). The
BFD has started Social Forest (SF) plantation at buffer zone since 2003/04 in Teknaf area and in 1992 at Ukhia range of
Cox’s Bazaar south forest division. The BFD planted not only the early growth non-native species, but also native

58
species to increase the bio-diversity in the forest. Several SFs plantations that use long-rotation species (40-year plan
for harvest) and re-forestation for wild animal conservation (called “animal feed”) was also included. However, local
demand is for short rotation (SR) plants such as the early growing species like Acacia spp. (Asahiro et al., 2014).
According to the existing social forestry regulation 2500 trees are planted per hectare in the area. After four years of
plantation establishment, 50% of the trees will be thinned out (1st thinning; 1250 trees / ha will remain); after the
year 7, again 50% of the remaining trees will be thinned out (2nd thinning; 625 trees / ha will remain). Finally, after 10
years, the remaining 625 trees will be harvested (see Figure 30). The intermediate thinning provides some return to
the participants which is mostly used as wood fuel.
Figure 30: Social forest stands about to be harvested in the Uhkia beat. Trees (mostly acacia) have reached maturity and are marked for felling.
A list of most frequently used species in social forestry plantation are given below with their local names and scientific
names (Table 25).
Table 25: List of species mostly used in short rotation plantation.
Local name Scientific name (%)
Gamar Gmelina arborea 67
Akashmoni and Mangium Acacia auriculiformis and Acacia mangium 65
Hybrid akashmoni Acacia hybrid 63
Mehogoni Swietenia mahagoni 49
Bohera Terminalia bellirica 44
Koroi Albizia spp. 42
Amlaki Phyllanthus emblica 42
Arjun Terminalia arjuna 37
Haritoki Terminalia chebula 23
Garjan Dipterocarpus sp. 14
Neem Azadirachta indica and Melia azadirachta 14

59
Besides the above-mentioned species, the Forest Department also plants some long rotation species. A complete list
of the principle species is found in Annex 4.
Five forest ranges under the south forest division of Cox’s bazaar have large barren areas which could be brought
under plantation. The status of plantation activities so far done under these five forests are given below (Table 26). It
is noteworthy that plantations raised before 2005 had already completed their tenure and in some cases, they were
harvested to benefit the participants. The protection of the newly established forest should also be ensured through
active participation of the community people.
Table 26: Plantation status of different range areas of Cox’s Bazaar south forest division.
Name of Ranges Area of the ranges Area of Plantation Year Nature of Plantation
Inani 8516.48 ha 1419.39 ha 1999-16 Buffer zone, core zone, wood lot, ANR
Shilkhali 2978.48 HA 1930 ha 1992-2016 Buffer zone, core zone, wood lot, ANR
Teknaf 6624.33 ha 713 ha 2002-16 Buffer zone, core zone, wood lot, ANR
Whykong 5208.3 ha 215 ha 2012-16 Buffer zone, core zone, wood lot, ANR, Fodder
Ukhia 7560.17 ha 3833 ha 1992-2016 Buffer zone, core zone, wood lot, ANR
4.6 Remote sensing
4.6.1 Available input data
The remote sensing based analysis covers 3 epochs for which satellite imagery was acquired: ~1994, 2003 and 2016.
These epochs were chosen to match the main population influxes but were also constrained by the scarce availability
of very high-resolution imagery in the area. The satellite imagery composed the first set of input data into the
classification process.
The second set of input data was derived from the Shuttle Radar Topography Mission product (digital elevation model
DEM @30m) to obtain an elevation map and slope map. They were used to help identify water and high slopes and
separate them from forest objects in the classification.
The third input data is an existing Land Cover object based classification for the year 2015 created by Bangladesh
Forestry Department (GoB 2017) and available at 6m resolution for the whole country, with 34 land use/cover
categories. This data set was used to derive training data for the supervised classification and determine the biomass
allocation categories.
The final input dataset consists of field data measurement conducted on 15 plots, broken down into 57 subplots of
19m radius each. The protocol for the field measurements is described in Section 4.5.
These data were processed in order to provide:
• the amount of wood fuel biomass currently available in the AOI;
• the amount of areal change undergone between 1994, 2003 and 2016 by the land use/cover categories susceptible of containing the wood fuel resources at stake in this study.

60
4.6.2 Satellite data characteristics and pre-processing
The characteristics of the scene IDs available for the study and acquired are given in Table 27.
They consist of several SPOT mission data:
• 1994 with Spot 2 (XS) and 1996 with Spot 3 (Pan);
• 2003 with Spot 5;
• 2016 with Spot 6 and Spot 7.
They were all ortho-rectified and pre-processed at level 1A by the data provider (see Figure 31and Annex 5 for large
scale imagery).
Table 27: Characteristics of the satellite imagery acquired.
Date Satellite Bands Scene ID Res. (m)
22-Jan-1994 Spot 3 Pan 32423079401220430442P 10
22-Jan-1994 Spot 3 Pan 32413079401220430451P 10
24-Oct-1996 Spot 2 NRG 22423079610240424482X 10
20-Feb-2003 Spot 5 NRG 52423080302200452082B 2.5
20-Feb-2003 Spot 5 NRG 52423070302200452002B 2.5
20-Feb-2003 Spot 5 NRG 52423070302200452002A 2.5
19-Dec-2016 Spot 6 RGBN 201612190409029_FR1_FR1_SE1_SE1_E092N21_01790 1.5
17-Nov-2016 Spot 7 RGBN 201611170406034_FR1_FR1_SE1_SE1_E093N21_04307 1.5
The final composites were clipped to the AOI extent and resampled at the finest available spatial resolution (1.5m)
resulting in ~600MB and 390 million pixels for each product (Figure 31).
Figure 31: Spot satellite imagery in 1994, 2003 and 2016.

61
4.6.3 Processing chain
The processing chain used in this study was inspired from the one developed by d’Annunzio et al. (2016). It has been
adapted to take into account the 3 time periods (versus 2 in the original version) and made more automatic by using
existing data maps as training data into the classification scheme, as shown on Figure 31Error! Reference source not
found..
The main steps consist in:
1. preparing the imagery into a standardized framework;
2. running a change detection between 2 dates (IMAD, Canty & Nielsen 2008);
3. performing an unsupervised classification of both time periods independently (k-means algorithm);
4. identifying zones with no land cover change, select segments and inject training data in those;
5. performing a supervised classification using the random Forest algorithm (Breiman & Cutler, 2015);
6. combining and reducing the land cover classes into wood fuel / non-wood fuel and generate consistent
trajectories for these classes through time;
7. combining the obtained maps with field data to generate biomass maps.
The chain is entirely public and available on GitHub at: www.github.com/lecrabe/iom_fao_processing_chain.git. Each
step in the scripts was commented for ease of understanding and anyone interested in details of the imagery analysis
should refer directly there. Below is a quick overview of each main step (Figure 32).

62
Figure 32: Illustration of the processing chain flow.
4.6.3.1 Change detection
The change detection consistsof:
• selecting the same spectral bands for both time periods (Near Infrared, Red, Green);
• using the “otbcli_Multivariate Alteration Detector” Functionality of the OTB library;
• using a hard-coded threshold to declare no change zones (imad2< 1000).
Processing time: ~ 50 min for each time period
4.6.3.2 Preparation of training data
The preparation of training data was fully automatized to ensure easy reproduction of the process and make it as
generic as possible, using available preexisting data. The steps are:
• Normalize each band as a percentage of its maximum statistics;
satellite
image t1
satellite
image t2
satellite
image t3
changet1-t2-t3
(9 classes)
DEM
lc t1 (30
classes)
lc t2 (30
classes)
lc t3 (30
classes)
F-NF t1 - t2
F-NF t2 - t3
change t1 - t2
change t2 - t3
kmeans t1
kmeans t2
kmeans t3
IMAD change detection algorithmChange / No Change mask (C/NC)
Unsupervised classification (k-means algorithm)
Supervised classification (random forest algorithm)
training t1
trainingt2
trainingt3
Creation of training data from kmeans selected polygons, NC mask, DEM and LC reference map
Combination of Fuelwood / non Fuelwood classes for transitions
OBIA map
lc t2 (30
classes)
kmeans t2
trainingt2
Final t1 t2 t3 trajectory, inclusion of stable agriculture and water trajectories
Input data: Spot for 3 time periods, SRTM derived DEM and Land Cover 2015 object based classification
biomassInjection of field data into change data and lc map to derive biomass map field data

63
• Compute the product of each normalized bands;
• Create a mask of water;
• Create a mask of shadow;
• Combine masks of water and shadow to create a light land mask;
• Perform unsupervised classification (oft-kmeans of the OFGT library);
• Clump the classification results and select a sample of the polygons;
• Clip and inject the training product values into the polygons;
• Mask with the no change + light land mask.
Processing time: ~ 25 min for each time period
4.6.3.3 Supervised classification
The steps are:
• Extract spectral signature from the imagery;
• Supervised classification using Random Forest algorithm of R;
• Merge the water + shadows mask.
4.6.3.4 Combination into transition product
The steps are:
• Clump the results of the time 2 classification;
• Compute time 2 classification value on each segment;
• Compute time 1 classification distribution on each segment;
• Compute IMAD change values on each segment;
• Determine criteria for change through a decision tree.
In the case of 2016, because of the presence of substantial clouds in the imagery a cloud mask was hand drawn and
no change was assumed on these
• for each time period, it results in 2-dates product (4 transition classes + agriculture and water) that are
combined again into a 3-dates product (9 classes total, see results section).
4.6.3.5 Combination with field data
The steps are:
• Read shapefile with subplots and AGB data per subplot;
• Merge the AGB data per subplot into the shapefile;
• Merge the wood fuel change data into the shapefile;
• Merge the land cover 2015 data into the shapefile;
• Compute Average of AGB by land cover class and change class;
• Compute Max of basal area by land cover class and change class;
• Reclassify the change product with the AGB values to produce a biomass map.
4.6.4 Tools for remote sensing data processing
In compliance with FAO policy to promote and use free and Open Source Software (FOSS) for IT solutions, all the
processing was done in a Linux environment (Ubuntu OS) using:

64
• R and Rstudio as the general working environment to call the different processing steps;
• the OTB, OFGT and GDAL/OGR libraries for all remote sensing utilities;
• QGIS for all visualization, spatial editing and rendering of the different figures.
Table 28: Tools and software used during the remote sensing analysis.
Description Software/tool used
Working environment Ubuntu 16.04 64bits
i5-6200U [email protected] x 4
Processing Language Bash 4.3.46
Python 2.7.12
Perl 5.22.1
Spatial Data Processing Open Foris Geospatial Toolkits 1.26.6
Orfeo Toolbox 5.8.0
Calculation R 3.3.3
Rstudio 1.0.136
Visualization, spatial editing, rendering QGIS 2.18.3
These tools listed in Table 28 are freely available to the public and can be installed on most OS platforms. FAO has
been maintaining an online cloud-based platform called SEPAL including all these utilities. Access to https://sepal.io
can be granted upon simple request and provides the easiest environment to use the processing chain described
above.
4.6.5 Results of land cover change analysis
The first output of the processing chain is a wood fuel change map that indicates categories that are stable through
time (with wood fuel, without wood fuel, with agriculture and water) and categories that are changing (Loss recent
and old, Gain recent and old, and degraded zone). The list of codes is given in Table 29.
Table 29: Change map legend.
Value Code Description
1 FW Stable fuelwood
2 NFW Stable non-fuelwood
3 Loss R Loss fuel wood 03-16
4 Loss O Loss fuel wood 94-03
5 Gain R Gain fuel wood 03-16
6 Gain O Gain fuel wood 94-03
7 Degrad. Degraded fuelwood
8 Agri. Stable agriculture
9 Water Water
The stable wood fuel category corresponded to zones that contained wood fuel with no major changes overtime.
They were initially set to include the following land cover classes: "rural settlement", "forest hilly mixed", "shrubs",
"forest hilly" and "plantations". The “stable non-wood fuel” category is also stable but as the name suggests tends to
be devoid of wood fuel resources.

65
The Loss categories corresponded to areas that were converted from wood fuel to non-wood fuel categories, for
1994-2003 and 2003-2016 respectively. They mainly target land conversion towards agriculture (paddy fields) and
occur primarily in the lowland northern part of the AOI. An example of degraded land co-existing next to agriculture
field is available on Figure 33.
Figure 33: Overview of the back of Naypara settlement. Vegetation on the hills is highly degraded and paddy fields can be observed in the low land.
The Gain categories corresponded to areas that were essentially converted to new plantations.
The degraded wood fuel category corresponded to areas that fluctuated through time, that went through some loss
during one of the periods and that can recover. They are particularly present in the southern part of the AOI and
mostly occurred in the shrub zone and the rural settlement. In the shrub dominated zone, the visibly degraded part
accounts for almost 10% of the area. These areas could be considered the best areas that were being impacted by
wood fuel collection activities.
Finally, the Agriculture and Water categories are stable categories that have been occupied with those land uses
throughout the period. The change map was intersected with the land cover map in order to compute all area
transitions over the zone, as can be seen in Table 30.

66
0
5,000
10,000
15,000
20,000
25,000
Fuelwood
Agriculture
Water
Non_fuelwood
Degradation
Loss_recent
Gain_old
Gain_recent
Loss_old
Table 30: Cross table with the area of each land cover combined with each change category (ha).
lc_classes total FW NFW Loss R Loss O Gain R Gain O Degrad. Agri Water
Brickfields 22 0 22 0 0 0 0 0 0 0
Beaches 394 0 394 0 0 0 0 0 0 0
plantation_mangrove 208 46 32 0 0 49 75 6 0 0
mud_flats 478 0 478 0 0 0 0 0 0 0
orchards_trees 25 25 0 0 0 0 0 0 0 0
crop_multiple 1,084 0 0 48 6 0 0 0 1,029 0
crop_single 6,466 0 0 1,675 37 0 0 0 4,755 0
Ponds 11 0 11 0 0 0 0 0 0 0
rivers_khals 2,895 0 0 0 0 0 0 0 0 2,895
rural_settlement 4,770 3,004 400 56 12 0 0 1,106 194 0
forest_hilly_mixed 1,987 1,818 43 0 0 0 0 123 2 0
plantation_rubber 98 82 1 0 0 1 13 1 0 0
Shrubs 15,170 13,609 293 190 10 0 0 1,025 43 0
cultivation_shifting 11 0 0 0 0 0 0 0 11 0
forest_hilly 70 61 2 1 0 0 0 7 0 0
salt_pan 2,692 0 1,109 0 0 0 0 0 1,285 299
plantation_forest 951 702 59 5 0 34 109 23 20 0
Lake 15 0 15 0 0 0 0 0 0 0
water_brackish 74 0 0 0 0 0 0 0 0 74
Total 37,420 19,347 2,858 1,975 65 83 198 2,289 7,338 3,268
In terms of the change map, the main category encountered in the zone (52%) is the stable wood fuel class, which is
mostly occurring within the shrub land cover category (13,609 ha out of 19,347 ha). Stable agriculture (including salt
pans, single and multiple crops), stable water and stable non-fuelwood areas represent an additional 36%. The rest of
the AOI correspond to changes in land cover and use, indicating a quite dynamic landscape (12%). These change
concern mostly visible degradation within rural settlements and shrubs and recent losses from forest towards
agriculture (Figure 34).
Figure 34: Areas of each change category in 2016 (ha).

67
Figure 35: Change categories for the 1994-2003-2016 period over the area of interest.
The results of the fieldwork described in chapter 4.5were expressed as average biomass per ha for each of the
transitional categories from which field samples were taken (Figure 35). A total of 57 subplots (Table 31) were
measured in the field, located on land cover and land cover change transitions and accounted for 77% of the area and
84% of the total biomass of the study zone.

68
Table 31: Number of subplots measured in each land cover and change category.
Land Cover Classes Total FW NFW Loss R Loss O Gain R Gain O Degrad. Agri Water
Brickfields
Beaches 1 1
Plantation_mangrove
Mud_flats
orchards_trees
Crop_multiple
Crop_single 7 6 1
Ponds
Rivers_khals
Rural_settlement 13 4 4 1 2 2
Forest_hilly_mixed 1 1
Plantation_rubber
Shrubs 16 14 2
Cultivation_shifting
Forest_hilly 5 5
Salt_pan
Plantation_forest 14 9 3 1 1
Lake
Water_brackish
Total 57 33 8 7 1 1 4 3
For the other transitions, substitutes of the most representative figure measured for the corresponding land cover
category were used. For example,“Single crop” + “Old loss”was assigned 1147 kg/ha, the same value as “Single crop”
+ “New loss” category (Table 32).
shows which categories were represented with samples directly taken in the field (cells in green) and which used a
substitute biomass value (cells in yellow).
Table 32: Average dry biomass content (kg/ha) for each land cover and land cover change category (in green are the values measured in the field and in yellow are the attributed values).
lc_classes total FW NFW Loss R Loss O Gain R Gain O Degrad. Agri Water
brickfields
0
beaches 0
0
plantation_mangrove 134,079 134,079
134,079 134,079 134,079
mud_flats
0
orchards_trees
14,985
crop_multiple
1,147 1,147
0
crop_single 983
1,147 1,147
0 ponds
0
rivers_khals
0 rural_settlement 12,665 14,985 6,529 11,678 11,678
33,457 0
forest_hilly_mixed 17,003 17,003 17,003
33,457 plantation_rubber
134,079 134,079
134,079 134,079 134,079
shrubs 2 2 2 2 2
4 2 cultivation_shifting
2
forest_hilly 162,468 162,468 162,468 162,468
162,468
salt_pan
0
0 0
plantation_forest 204,692 134,079 401,218 134,079
243,442 211,876 134,079 134,079 lake
0

69
water_brackish
0
Total 67,835 63,516 153,721 2,651 243,442 211,876 16,730 0
These values of biomass per hectare were finally injected into both maps to generate a biomass map over the AOI,
summarized in :.The AOI contains an estimated 331,266 tons of dry matter under the form of woody biomass that is
potentially usable for fuel consumption. This is a low value that illustrates the scarcity of the available resources in the
area (average 8t / ha). Half of that amount was situated in the plantation forests (that include social forestry) and one
quarter in rural settlements.
The biomass loss estimated between 1994 and 2016 from land use change was relatively small (-27,441 tons) and
mostly corresponded to land use conversion towards agriculture (paddy fields).Conversely, the newly established
plantations amounted to a greater amount (45,663 tons) added to the area that compensates for the losses.
However, these losses only corresponded to the land use changes that are visible from the available satellite imagery
and do not reflect the full picture of undetected biomass change.
The shrub strata contain virtually no biomass as of 2016 that can be counted for wood fuel consumption. All visited
field subplots (14 out of 57) in the shrub category were visibly extremely degraded (Figure 36).
Figure 36: Example of degradation in the shrub dominated area around Shamlapur. Only a few trees stand out in the hilly landscape, two bundles of wood are visible.

70
Table 33: Biomass contained in each land cover and land cover change category in December 2016 (tons).
Land cover classes total FW NFW Loss R Loss O Gain R Gain O Degrad. Agri Water
Brickfields 0 0 0 0 0 0 0 0 0 0
Beaches 0 0 0 0 0 0 0 0 0 0
Plantationmangrove 27,883 6,199 4,330 0 0 6,508 10,106 740 0 0
Mudflats 0 0 0 0 0 0 0 0 0 0
Orchardstrees 374 374 0 0 0 0 0 0 0 0
Cropmultiple 63 0 0 55 7 0 0 0 0 0
Cropsingle 1,962 0 0 1,920 42 0 0 0 0 0
Ponds 0 0 0 0 0 0 0 0 0 0
Riverskhals 0 0 0 0 0 0 0 0 0 0
Ruralsettlement 85,403 45,013 2,612 652 137 0 0 36,989 0 0
Forest hilly mixed 35,765 30,914 723 0 0 0 0 4,128 0 0
Plantationrubber 13,048 10,997 156 0 0 71 1,749 75 0 0
Shrubs 27 22 0 0 0 0 0 4 0 0
Cultivationshifting 0 0 0 0 0 0 0 0 0 0
Foresthilly 11,357 9,881 296 99 0 0 0 1,081 0 0
SaltPan 0 0 0 0 0 0 0 0 0 0
Plantationforest 155,384 94,089 23,497 680 0 8,250 23,186 3,020 2,663 0
Lake 0 0 0 0 0 0 0 0 0 0
Waterbrackish 0 0 0 0 0 0 0 0 0 0
Total 331,266 197,490 31,614 3,407 186 14,830 35,041 46,036 2,663 0
The biomass measured at the shrub locations was close to zero, but the measurements of stumps provided another
insight into this analysis. The basal area in the shrub plots mainly corresponded to stumps measured under the very
dense shrub cover. In many shrub locations, the large number of recorded stumps were clear proof of resource
extraction. The maximum value registered for these categories (6.9m2/ha, Table 34) indicated that without human
pressure, this area would contain a substantial amount of biomass. This value is indeed close to the basal area
observed under rural settlements and hilly mixed forest for the same category of change (stable wood fuel) (Table
33).

71
Table 34: Maximum basal area in each land cover and land cover change category (m2/ha).
Land cover classes Total FW NFW Loss R Loss O Gain R Gain O Degrad. Agri Water
Brickfields
Beaches 0.00 0.00
Plantationmangrove
Mudflats
Orchardstrees
Cropmultiple
Cropsingle 2.20 2.20 0.00
Ponds
Riverskhals
Ruralsettlement 13.66 8.42 6.29 2.34 13.66 0.00
Forest hilly mixed 7.20 7.20
Plantationrubber
Shrubs 6.90 6.90 0.93
Cultivationshifting
Foresthilly 21.40 21.40
SaltPan
Plantationforest 38.73 24.33 38.73 14.30 23.28
Lake
Waterbrackish
Total 38.73 24.33 38.73 2.34 14.30 23.28 13.66 0.00
If we assume that the same biomass levels can be expected for the same species with the same basal area, it
estimated that many trees were potentially present in the area and destroyed, but they perhaps were not detected
by the remote sensing change analysis. Taking these assumptions into account, and by simulating levels of biomass
prior to loss and gains, allows for a biomass calculation potentially observed in 1994 (Table 35). This can be
graphically represented as a biomass map, visible on Figure 37, showing the evolution of the resources through time.
We can infer that the standing biomass back in 1994 was around 536,707 tons of dry matter, indicating a loss of 40%
of the biomass over 22 years period.
Table 35: Estimated biomass contained in each land cover and land cover change category circa 1994 (tons).
Land cover classes
total_1994
fuelwood
non_fuelwood
loss_recent
loss_old
gain_recent
gain_old
degradation
agriculture
water
Brickfields 0 0 0 0 0 0 0 0 0 0
Beaches 0 0 0 0 0 0 0 0 0 0 Plantation mangrove
13,126 6,199 4,330 0 0 727 1,130 740 0 0
Mud flats 0 0 0 0 0 0 0 0 0 0 Orchards trees
374 374 0 0 0 0 0 0 0 0
Crop multiple
818 0 0 722 96 0 0 0 0 0
Crop single
25,647 0 0 25,097 550 0 0 0 0 0
Ponds 0 0 0 0 0 0 0 0 0 0
Rivers khals
0 0 0 0 0 0 0 0 0 0
Rural 85,403 45,013 2,612 652 137 0 0 36,989 0 0

72
0
50,000
100,000
150,000
200,000
250,000
Shru
bs
Pla
nta
tio
n f
ore
st
Ru
ral S
ettl
em
ents
Mix
ed H
illy
fore
sts
Cro
ps
Pla
nta
tio
n m
angr
ove
s
Pla
nta
tio
n r
ub
ber
Hill
y fo
rest
s
Total 1994 Total 2016
Figure 36: Biomass over the area of interest in 2016 and 1994 for each land cover category (tons).
Land cover classes
total_1994
fuelwood
non_fuelwood
loss_recent
loss_old
gain_recent
gain_old
degradation
agriculture
water
settlement Forest hilly mixed
35,765 30,914 723 0 0 0 0 4,128 0 0
Plantation rubber
11,431 10,997 156 0 0 8 196 75 0 0
Shrubs 226,690 203,937 4,394 2,854 146 0 0 15,358 0 0
Cultivation shifting
0 0 0 0 0 0 0 0 0 0
Forest hilly
11,357 9,881 296 99 0 0 0 1,081 0 0
Salt Pan 0 0 0 0 0 0 0 0 0 0 Plantation forest
126,096 94,089 23,497 680 0 508 1,640 3,020 2,663 0
Lake 0 0 0 0 0 0 0 0 0 0 Water brackish
0 0 0 0 0 0 0 0 0 0
Total 536,707 401,405 36,007 30,104 930 1,243 2,965 61,390 2,663 0

73
Figure 38: Biomass map of the area on interest in 1994 (estimated) and 2016 (measured) (t/ha).
4.6.6 Limitations of the remote sensing analysis
Most of the changes that are the focus of this study could not be directly detected with the available imagery. This is
due to the unavailability of high enough resolution for the past period (10m pan-sharpened) and the difficulty of
detecting accurately the changes at stake. They occur indeed in a mixed landscape of shrub vegetation with some
substantial tree resources. However, the combination of field work and satellite image analysis enabled us to get a
detailed assessment of the location of biomass for the recent time period and a plausible distribution of biomass in
1994.The study also draws attention to the large areas being converted from natural shrub land to agriculture (paddy
fields) as well as reforestation activities led by the Forest Department of Bangladesh.

74
5 INTEGRATION OF DEMAND AND SUPPLY
This analysis aims at understanding the issue, and we used the findings from the previous chapter to deal with
quantifying each component of the problem to propose concrete solutions that contribute measurable ways to
alleviate the pressure on the natural resources. The solutions matrix provides the framework against which
interventions could be proposed and developed. It is not a comprehensive list of activities but should serve to
facilitate discussion on a potential response plan.
Figure 39: Solution analysis for proposed interventions.
5.1 Summary of demand and supply findings
The analysis of the demand findings mainly focused on the perspective of SAFE tool box design aiming to integrate the
wood fuel demand findings along with supply following the third step of the FAO-UNHCR handbook. The analysis also
incorporated the reflections of relevant research literatures, field observations, integration and triangulation of
collected information for portraying a consolidated common picture for the displaced HHs at the camp settings.
Displaced HHs living at the displacement settings assisted by humanitarian agencies don’t have access to cooking
energy and are poorly connected to power supplies. Displaced HHs have relied on wood fuel for cooking and kerosene
for lighting, which have bad impacts on the environment and their health. Access to energy is a basic human need,
recognized by the sustainable development goals (SDG), which aimed to ensure access to affordable, reliable,

75
sustainable, and modern energy for all by 2030 (Goal 7). Basic energy needs must be met to ensure the nutrition and
protection of displaced HHs and to manage the settlements efficiently. Therefore, SDGs call on us to ‘leave no one
behind’, but our findings conclude that displaced HHs are the furthest behind in terms of cooking energy access.
The supply analysis resulted in an understanding of current woody biomass availability and species richness in the
area, and provided a consistent estimate of biomass changes since 1992.The natural resources containing woody
biomass in the area have been undergoing strong pressure due to population growth, both from the displaced
population influxes and the national population growth.
In order to understand the balance between demand and supply, it is necessary to know the productivity of the land
area. This is a complex value to determine, as the landscape is very heterogeneous and dynamic. The approach we
adopted was to measure the demand on the one side and the actual depletion observed in the natural resources
environment, in order to infer the productivity of the landscape as a whole, as the difference between those two
components.
The average current demand is estimated at 54,451 tons/year, when the total available stock is 331,266 tons of dry
biomass. The estimated annual depletion in terms of biomass since 1994 is 10,196 tons/year, showing that the
current demand is higher than what the current supply. Following Equation 8, this results in 54,451 – 10,196 = 44,255
tons AGB / year produced by the vegetation in the area, over the whole period. This corresponds to an average Mean
Annual Increment (MAI) of 3.25 ton / ha /year.
Equation 8 𝑨𝒗𝒆𝒓𝒂𝒈𝒆 𝒄𝒖𝒓𝒓𝒆𝒏𝒕 𝒔𝒖𝒑𝒑𝒍𝒚 = 𝑨𝒗𝒆𝒓𝒂𝒈𝒆 𝒄𝒖𝒓𝒓𝒆𝒏𝒕 𝒅𝒆𝒎𝒂𝒏𝒅 – 𝑨𝒗𝒆𝒓𝒂𝒈𝒆 𝒄𝒖𝒓𝒓𝒆𝒏𝒕 𝒅𝒆𝒑𝒍𝒆𝒕𝒊𝒐𝒏
With estimations of these components, it is possible to estimate the amount of resources needed, either as a
reduction of the demand or as an increase of the supply, in order to reach equilibrium. In the following sections, we
will propose possible solutions to reach the following overarching goal:
Equation 9 𝑭𝒖𝒕𝒖𝒓𝒆 𝒅𝒆𝒎𝒂𝒏𝒅 ≤ 𝑭𝒖𝒕𝒖𝒓𝒆 𝒔𝒖𝒑𝒑𝒍𝒚
5.2 Combined stepwise approach
Complex problems require elaborate solutions that tackle the issue from different angles. The situation in Cox’s
Bazaar puts environmental, society and political constraints in balance that need to be addressed together in order to
alleviate natural resource degradation and improve livelihoods of all concerned parties. The current degradation of
the landscape poses serious risks in the near future in terms of erosion and land stability which need to be addressed.
Yet, the land is still undergoing constant pressure for resources. If the present increasing trend of demand continues,
existing resources will be exhausted within a few years unless immediate measures are taken.
The immediate action that should be taken is to relieve the short-term demand in wood fuel in order to allow land to
regenerate in the middle term through improved energy efficiency. If land stabilization can be achieved in the middle
term, solutions to improve the supply through afforestation programs will be achievable in the longer term.
Plantation forests contain 155,384 tons of dry woody biomass as of December 2016, over an area less than 1000 ha.
Besides their normal usage, the productivity of these plantations could sustain the demand of the population for
wood fuel. Such systems could be adapted and applied for the UMN and host community together to help alleviate
the situation.
Therefore, we recommend a stepwise approach that will:
• Reduce demand in the short term;

76
• Focus on stabilization of the land in the middle term;
• Allow afforestation programs to thrive in the long run.
5.2.1 Short term action: improve technology
As we demonstrated during the demand assessment, wood fuel is the primary source of energy for both households
and other social units and they only employ traditional mud stove to burn the fuel. Serious improvement of these
practices can be envisioned (use of better fuel like briquettes and/or other alternative energies and better stoves like
the Bondu Chula or the Briquette Chula) provided that the right enabling environment is set up. Experience from the
previous initiative to provision Bondu Chula only to have them later abandoned teaches us that training on the use of
new technologies is paramount. The process must include consultations with the users to understand their exact
needs.
If successfully introduced, we estimate that improved fuel and technology would lower 20% of the current demand,
which could potentially bring the balance from Equation 9 to zero temporarily (i.e the current depletion represents
more or less 20% of the current demand). The objective could be reached through a combination of various improved
energies (e.g. briquettes for households, LPG sustained provision for other social units). Table 36 provides
comparative elements of the costs and benefits of different fuels in order to design more specific solutions at later
stage.
Table 36: Comparative cooking energy consumption and costs.
Cooking Energy Units Consumption unit/day (5/HH)
Monthly expenditure/HH
Results
LPG Gas kg 0.56 1,848 Lack of economic capacity
Kerosene liter 0.7 1,680 More time consuming
Woodfuel kg 4.19 1,508 Labour intensive
Charcoal kg 3.5 1,418 Another form of woodfuel
Briquettes kg 3.7 1,221 Cost effective
Our study clearly showed that UMNs do not generally go to the market to purchase wood fuel or other types of fuel
for cooking, depending exclusively on wood fuel collection. However, both charcoal and briquette are available at the
Teknaf and Ukhiya Upazilla level, and briquette producing machines can be found in all the sub-districts on the AOI.
Briquette producing machines are simple man powered mechanical device that requireless time and energy than
charcoal pits. Therefore, we see the option to use briquettes for better energy efficiency as a real potential solution,
provided that the enabling conditions to access and use this energy are united.
In any case, it is important to follow the below steps:
• Consult with local beneficiaries to tailor solutions to specific needs;
• Raise awareness through demonstration;
• Introduce efficient cooking technologies, energies and practices (Table 34);
• Facilitate alternative income generating activities (selling of alternative cooking fuel).
The specific awareness raising actions that could be carried out are:
• To conduct awareness raising campaign and demonstration of fuel efficient cooking technologies and
practices among the targeted community;

77
• To conduct awareness and demonstration that the existing wood fuel collection for cooking is not cost
effective in regard to labor intensive activity and engagement of HH instead of doing other economic
activities;
• To introduce efficient cooking fuel through participatory community lead action plan and implementation.
Introduction and popularize CRH (Compressed rice husk), Briquette and installation of machine for making
these in the close vicinity of displacement settings;
• To support displaced HHs to conduct alternative income generating activities to develop economic capacity to
afford efficient fuel and cooking system;
• To facilitate conflict mitigation discussion with mutual planning for compromise to reduce the frequency of
threats and social unrest;
• To conduct HH level discussion to reduce assignment of women and children for collecting wood fuel to
reduce challenges and enhance protection.
Finally, it could be worth studying the potential of installation of biogas plants which could run using the garbage
produced. As mentioned earlier, many social and cultural aspects need to be resolved first to ensure acceptance by
the beneficiaries if such solutions were to be considered.
5.2.2 Middle term actions: stabilize land
If the demand can be temporarily lowered by improving technologies and behaviors, pressure can be released on the
land to allow for stabilization and rehabilitation actions. Land stabilization would allow to prevent further erosion and
enable environment regeneration. It is recommended to introduce fast growing woody species that possess a strong
rooting system but that will not be targeted for fuel wood collection. These species may have other collateral benefits
in economic termsand could also generate revenues in the longer term (Zyzyphus, Bamboo, Vietnam coconut).The
time scale associated with these species introduction span from 3 to 5 years to reach maturity.
An essential pre-requisite to this sort of action is that local communities and Forest Department obtain ownership of
the project. Awareness raising activities should accompany these plans, in order for all the stakeholders (UMNs, host
community) to understand and accept the purpose of the land stabilization.
5.2.3 Long term actions: afforestation plan
The ultimate goal of this study is to provide a sustainable provision of cooking energy in the area of interest, both in
terms of pressure on the natural resources and cultural acceptance by all parties. At the time of writing, the hills in
the Teknaf Upazilla are either inaccessible or completely barren of trees. However, they were once holding a dense
and strongly stocked natural native forest of Dipterocarpus, illustrating that the current situation is not a fatality and
that the land has the potential to reverse that.
The area is successfully hosting social forestry plantations that are present all along the access road of the zone (see
Error! Reference source not found. to check the geographic distribution of plantations). These plantations cover a s
mall area (less than a 1000 ha) but their high productivity can provide the fuel wood necessary to the host community
(at large). It is proposed to replicate the same kind of land management while opening the benefits of such new
plantations to the UMN population.

78
Fast growing species like Acacia, Albizia or Gmelina spp.have
a history of successful implementation in the zone, with
rotation periods from 5 to 10 years.
The social challenges associated to such afforestation /
reforestation plans are high because the social forestry
program has strict regulations that may prove difficult to
adapt to UMN context. The risks associated to the proposed
solutions and their feasibility in time have been synthesized
on Table 37.
If the necessary political will and enabling environment are
present, we hence suggest a 3 phases approach with short,
middle and long-term alleviation measures that could
sustainably provide the area with the necessary resources in
fuel wood. The proposed intervention can be graphically
represented as in Table 37.
Table 37: Risks and feasibility of the envisioned activities.
Activity Risks Feasibility Effect Time Line
Raise Awareness None High Enabling Immediate
Introduction of improved cook stoves
Be discarded if not adapted to HH needs
High 20% targeted community
Immediate
Introduction of LPG stoves Economic capacity of HH to continue
high As per target Immediate
Introduction of briquettes Host community to block for toll purposes
Medium < 1year
Land stabilization Lack of political will to invest effort in land rehabilitation
Medium 3/5 years
Afforestation Social forestry regulation may not permit inclusion of UMN
Low 10 t/ha/yr 5/10 years
Indigenous species promotion Lack of political will to invest effort in land rehabilitation
Low Enabling 5/10 years
Current Situation: the accessible area for supplying target population is now completely depleted (13,000 ha of
shrubs). Other areas contain biomass but are sensitive (social forestry).
Proposed Intervention: Provide 30,000 HHs with improved technologies, fuel and practices that could potentially lead
to a reduction of demand of 9300 t / year; Stabilize land and start afforestation programs.
Using one of the Acacia species, with a MAI
of10ton / ha / year (from the stocks we measured
on ground, assuming a 10 year rotation to reach
maturity), around 1,000 ha would need to be
planted and sustained in order to fully supply the
population in wood fuel and allow all other
resources to be left under minimal pressure.
HOW MUCH DO WE NEED TO REPLANT?

79
Future situation: Plantations are established (1,000 ha with acacia can supply the necessary 10,000 t / year) (Figure
40).
Figure 40: Overview of the proposed approach.
2017 2020 2030
Improved energy
Land stabilization
Afforestation program
Available fuel wood in accessible land features

80
6 CONCLUSION
The Cox Bazar district is under high pressure for natural resources resulting from a complex web of drivers that
require elaborated and cross cutting solutions. Reducing the demand, improving the supply and alleviating social
conflicts need to be jointly carried out to improve the situation.
We carried out a joint assessment study looking at:
• the wood fuel demand through socio-economic surveys and interviews with the stakeholders;
• the wood fuel supply through biomass measurements on a series of random stratified sampling field plots;
• the historical changes of the land cover and land use since the first influxes of refugees in the area of interest
through the use of satellite imagery.
The demand assessment showed that the average consumption is almost entirely in the form of wood fuel being used
in traditional mud stoves. A detailed analysis of the challenges linked to wood fuel collection and usage has been
performed enabling to understand better the behaviors and energy consumption patterns of the population of
interest.
The supply assessment was carried out in the field in conjunction with a detailed analysis of time series of high
resolution satellite image. Results revealed that a third of the area of the land is currently almost depleted from
standing trees, while the resources in biomass are concentrated in a few patches of plantations and homesteads. It
should be noted that most of the land use conversions from forest to agricultural land concern establishment of
paddy fields in a reserved area that isn’t impacted by wood fuel collection. We were able to map the location of land
cover changes and identify which land categories are undergoing the most changes.
The results present evidence that degradation of the woody biomass resources is occurring essentially in the shrub
dominated hills in the center of the AOI. We estimate that the land has lost 40% of its standing biomass over the
period of interest (22 years).
Our findings show that the current demand in wood fuel resources (4.285 kg / HH / day) is higher than what the
environment is able to provide, leading to a gradual depletion of the natural resources (10,000 tons of dry matter /
year are lost). The land is highly degraded and in a critical state and this situation can only worsen in time if let to
itself. We also underline that all visible land use conversions are occurring from shrub and forest land to agriculture,
for which UMN are not involved.
In the last part of our study, we propose measures to provide for the 10,000 tons of standing biomass that are in
deficit every year and we recommend a stepwise approach that will:
- Reduce demand in the short term by increasing energy efficiency and improving consumption habits;
- Focus on stabilization of the land in the middle term by introducing deep rooting systems woody vegetation;
- Allow afforestation programs to thrive in the long run, replicating the model of social forestry successfully
implemented in the area.
We suggest a 3 phases approach with short, middle and long-term alleviation measures that could sustainably provide
the area with the necessary resources in fuel wood. The overall situation can be described in terms of status,
proposed intervention and foreseen future situation.
The current status indicates that the accessible area for supplying target population with wood fuel is now completely
depleted (13,000 ha of shrub dominated). Other areas contain biomass but are socially and culturally sensitive (social
forestry) and can’t be exploited as is.

81
The proposed intervention consists of raising awareness about the issue, both at the UMN, the host community and
the government level, and immediately provide 30,000 HHs with improved technologies, fuel and practices that could
potentially lead to a reduction of demand of 9300 t / year. This would enable a favorable environment to unroll land
stabilization efforts that could be followed by long term afforestation programs.
The resulting future situation would feature specific plantations established for the benefits of refugees, UMN and
host community (1,000 ha with acacia can supply the necessary 10,000 t / year).
The degraded environment situation in Cox’s Bazaar results from complex interacting pressure on natural resources
and socio-economic, political and cultural constraints. These constraints need to be addressed in a holistic manner,
engaging the different stakeholders together on a common agreed framework before any actions (reduction of
pressure by reducing demand, increasing the supply with afforestation programs) can be implemented with success.

82
7 REFERENCES
Ahmed, G.U and Haque, S.M.S. 1993. Percentage distribution of species and diameter class in natural forest of
Bangladesh. The Chittagong University studies, Part II 17(1):109-113.
Asahiro, K., Nakagaki, A., Rahman, A.M. and Tani, M. 2014. Current conditions of social forests in Teknaf and Shilkhali
ranges of Bangladesh. Proceedings of 5th International Conference on Environmental Aspects of
Bangladesh [ICEAB 2014]
Azad, A., and Jasmin, F. (2013). Durable Solutions To The Protracted Refugee Situation: The Case Of Rohingyas In
Bangladesh. Journal of Indian Research 1(4), 25-35.
Bangladesh POUSH. 2006. Participatory action plan development, Cox’s Bazar Teknaf
Bangladesh Forest Department (2007). National Forest and Tree Resources Assessment 2005-2007 Bangladesh. D.
Altrell, M. Saket, L. Lyckebäck and M. Piazza, Ministry of Environment and Forest (MoEF), Food and
Agriculture Organization of the United Nations (FAO).
Barnes, B.V., Zak, D.R., Denton, S.R. and Spurr, S.H. 1998. Forest Ecology, 4th edition. John Wiley and Sons. New York
BBS (2016) The income survey by Bangladesh Bureau of Statistics during 2016.
BBS (2011) Bangladesh Census conducted by Bangladesh Bureau of Statistics during 2011.
Belal, A.H. 2013. Effectiveness of Co-management Committees in Teknaf Wildlife Sanctuary. In: J. Fox et al. (eds.)
Connecting Communities and Conservation: Co-management Initiatives Implemented by IPAC in
Wetlands and Forests of Bangladesh, 10-23.
BFD (2016). Field Instructions for the Bangladesh Forest Inventory (V.1.1). Bangladesh Forest Department and Food
and Agricultural Organization of the United Nations. Dhaka, Bangladesh.
Breiman and Cutler, 2015 Breiman and Cutler's Random Forests for Classification and Regression,
https://www.stat.berkeley.edu/~breiman/RandomForests/
Canty, M., Nielsen, A., 2008. Automatic radiometric normalization of multitemporal satellite imagery with the
iteratively re-weighted MAD transformation. Remote Sensing of Environment 112 (2008) 1025–1036
Carney, D. (ed). 1998. Implementing the sustain-able rural livelihoods approach. In: Sustainable rural livelihoods, what
contribution can we make? Papers presented at the Department of International Development’s Natural
Resources Advisers’ Conference, London: DFID, pp. 2-26.
Chave, J., Réjou, M., Búrquez, A., Chidumayo, E., Colgan, M. S., Delitti, W. B. C, Vieilledent, G. 2014. Improved
allometric models to estimate the aboveground biomass of tropical trees. Global Change Biology, 20(10),
3177-3190. doi:10.1111/gcb.12629
The ORFEO Tool Box Software Guide, Updated for OTB-6.0.0
D’Annunzio, R., Gianvenuti, A., Henry, M., Thulstrup, A. (2016) Assessing WoodfuelWood fuel Supply and Demand in
Displacement Settings. Rome, Italy.
Epler Wood International. 2009. Teknaf Peninsula Community-Based Ecotourism Strategy.Report submitted to USAID
Bangladesh.

83
Fakir M.A.L, Netzer M, Banik H, Chowdhury R.M. 2015. Forest Carbon Inventory 2014 at Eight Protected Areas in
Bangladesh, Main Report Bangladesh Forest Department and Winrock International
FAO, 2015. The OpenForis initiative, a set of free and open-source software tools to facilitate flexible and efficient
data collection, analysis and reporting. Available at www.openforis.org
Gianvenuti, A., D'Annunzio, R., Henry, M., Thulstrup, A., 2016. SAFE Toolbox: Woodfuel Assessment in Displacement
Settings. A tool for supporting field-based actors to assess woodfuel resources & energy needs in
displacement settings, user guide. Rome 2016
Government of Bangladesh, 2010 Poverty map.
Government of Bangladesh, 2017. National Land Cover Atlas of Bangladesh, Forest Department, Ministry of
Environment and Forests, Government of the People’s Republic of Bangladesh. In press
Gunning, R. 2014. The current state of sustainable energy provision for displaced populations: an analysis. London,
Royal Institute of International Affairs, Chatham House (available at
www.chathamhouse.org/sites/files/chathamhouse/field/field_document/20141201EnergyDisplacedPop
ulationsGunning.pdf).
Hossain, M.A., Hossain, M.K., Salam, M.A., and Rahman, S. 2013. Composition and Diversity of Tree Species in
Dudhpukuria-Dhopachori Wildlife Sanctuary of Chittagong (South) Forest Division, Bangladesh, Research
Journal of Pharmaceutical, Biological and Chemical Sciences, pp:1-11, 2013.
Hossain MK, Rahman ML, Hoque ATMR and Alam MK. J Forestry Res 2004; 15(4):255-260.
ITTO 2009. Manual for project formulation, Third Edition, General Information Series #13, ISBN 4-902045-47-8
Khana M.A.S.A, Uddin, M.S, Haqueb, E (2012). Rural livelihoods of Rohingya refugees in Bangladesh and their impacts
on forests: The case of Teknaf Wildlife Sanctuary, Counter-Narratives on Rohingya Refugees Issue: Re-
look at Migration, Security and Integration, SSRL Publication, Chittagong, pp:1-16
Kiragu, E., Li Rosi, A., & Morris, T. (2011) States of denial: A review of UNHCR’s response to the protracted situation
of stateless Rohingya refugees in Bangladesh. Policy Development and Evaluation Service, UNHCR.
Retrieved from: http://www.unhcr.org/4ee754c19.pdf
Krebs, C.J., 1989. Ecological Methodology. Harper Collins Publishers. New York:
Kumar A, Marcot BG and Saxena A. Tree species diversity and distribution patterns in tropical forests of Garo Hills
Current Science 2006; 91(10):1370-1381.
Lehne, J., Blyth, W., Lahn, G., Bazilian, M., Grafham, O. 2016. Energy services for refugees and displaced people.
Marjokorpi, A. and Chidumayo, E. N. (1997). Biodiversity Management in the Provincial Forestry Action Programme
Area. Ndola.
Motaleb, M.A. and Hossain, M.K. 2011. Assessment of Tree Species Diversity of Tankawati Natural Forest, Chittagong
(south) Forest Division, Bangladesh. Eco-Friendly Agril J 2011; 4(02):542-545
Mulombwa, J. (1998) Wood fuel review and assessment in Zambia.
Nath, T.K., Hossain, M.K. and Alam, M.K., 1998. Diversity and composition of trees in Sitapahar forest reserveof
Chittagong hill tracts (south) forest division, Bangladesh. Annals of Forestry 6 (1): 1-9.

84
Okello, S., 2016. The Energy Situation in the Dadaab Refugee Camps, Kenya. Research Paper on Energy, Environment
and Resources Department, May 2016.
Pearson, T., Walker, S.M., Brown, S., 2006 Sourcebook for Land Use, Land Use Change, and Forestry Projects. Bio
Carbon Fund, Winrock International
Rahman, L.M. and Ahmed, F.U. 2016. Forest Dependent People in Bangladesh. In: Bhuiyan, Z.H., Thakur, A.B., Uddin,
M.S. and Hossain, M.A. (eds.). Souvenir. National Tree Fair Campaign and Tree Fair. Forest Department,
Ministry of Environment and Forests, Government of the People’s Republic of Bangladesh. pp. 57-60.
Rahman MA, Tani M Asahiro A, Moslehuddin AZM, and Rahman MZ. 2013. Impacts of climate change and land use on
forest degradation in Teknaf Peninsula. Proc. ICEAB 2013: 32-35.
Sayed, M. A., Khan, A., Uddin, S. A., and Haque, A. (2012) Rural livelihoods of Rohingya refugees in Bangladesh and
their impacts on forests: The case of Teknaf Wildlife, January 2012.
Tani M, Rahman M.Z, Moslehuddin A.Z.M, and Tsuruta H. 2014. Characterization of Dwellers as a Major Agent of
Deforestation in a Reserved Forest in Bangladesh. International Journal of Environment 4(2): 25-30.
Tani M, Rahman MZ, Rahman MA , Asahiro K, and Akhter S. 2011. Deforestation by daily activities in the Teknaf
Peninsula, Bangladesh. Proc. International Conference on Environmental Aspects in Bangladesh (ICEAB)
2011: 73-75
Thulstrup, A., Henry, W. J. (2015) Women’s access to wood energy during conflict and displacement: lessons from Yei
County, South Sudan (Unasylva 243/244, Vol. 66, 2015/1–2).
Uddin, M.S. and Khan, M.A.S.A. 2007. “Comparing the impacts of local people and Rohingya refugees on Teknaf Game
Reserve, Bangladesh.” in Fox, J., Bushley, B., Dutt, S., Quazi, S.A. (eds), Making conservation work: linking
rural livelihoods & protected area management in Bangladesh, pp. 149-175
UNHCR 2017, UNHCR seeks equal treatment for all Rohingya in Bangladesh. Accessed 8/6/17 from:
http://www.unhcr.org/news/latest/2017/3/58cfac434/unhcr-seeks-equal-treatment-rohingya-
bangladesh.html
UNHCR and IDC, 2016. Vulnerability screening tool, ISBN 978-0-9924831-0-4
Vianello, M., 2016a. The Energy Situation in Goudoubo Refugee Camp, Burkina Faso, Practical Action, Energy,
Environment and Resources Department.
Vianello, M., 2016b. Toolkit for the Moving Energy Initiative, Practical Action, Energy, Environment and Resources
Department.
WFP (2012) Handbook on Safe Access to Firewood and alternative Energy (SAFE), 2012 Edition.
WHO (World Health Organization). 2016. Household air pollution and health. Fact sheet No. 292 [Website] (available
at www.who.int/mediacentre/factsheets/fs292). Accessed June 2016.
Zanne, A.E., Lopez-Gonzalez, G., Coomes, D.A., Ilic, J., Jansen, S., Lewis, S.L., Miller, R.B., Swenson, N.G., Wiemann,
M.C., and Chave, J. 2009. Global wood density database. Dryad. Identifier:
http://hdl.handle.net/10255/dryad.235.

85
Figure 40 Social map of Kutupalong.
8 ANNEXES
8.1 Annex 1: Social maps prepared during the analysis

86
Figure 42: Social map Leda.

87
Figure 43: Social map of Shamlapur.
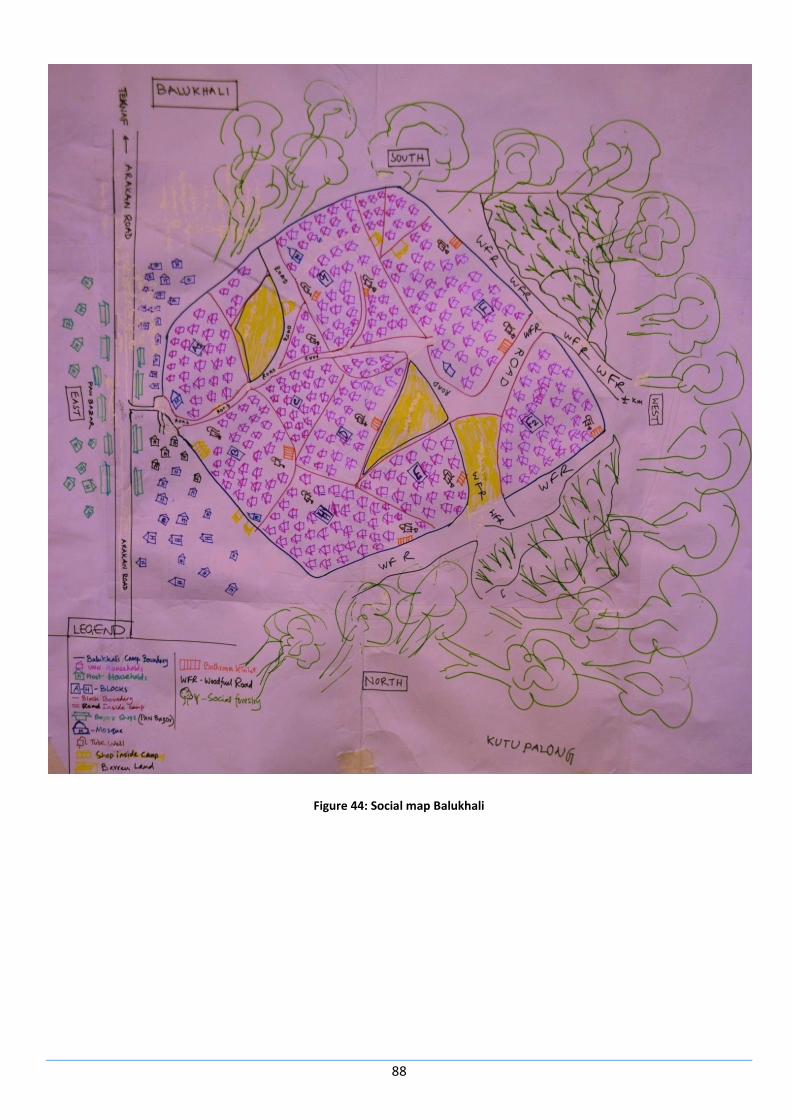
88
Figure 44: Social map Balukhali

89
8.2 Annex 2
Table 38: Calendar of livelihood activities and disasters in the Cox’s Bazaar District.
Months Jan. Feb. March Aril May June July August Septem Octobe Novem Decem,
Seasons Winter Spring Summer Rainy Autumn Late
Autumn
Winter
Potential
Disasters
Fire,
Drought
Heavy Rainfall
Hailstorm
Disaster
Preparedness
To stay
prepared
and stay
safe
Stock and use of
plastic and rope
to cover the
house of UMNs
Peak Season
Peak Season
Characteristics
-wage labour market
-low cost vegetables crops
-processing dry fish
-easy access to forest for wood fuel
collection
-wage labour market
-low cost rice
-fishing at river and sea
Lean Season
Lean Season
Characteristics
/ Ways to Cope
with Lean
Season
Begging,
starving,
skipping
meals,
taking
loans
Repairing houses,
Scarcity of work, less
movement due to heavy
rainfall, reduce woodfuel
collection, elephant
movement increased.
Advance sale of labour.
Livelihood and
Income
Activities
Fishing net weaving, handicrafts
work, small business, tailoring,
handicrafts, afforestation works

90
8.3 Annex 3: Understanding Vulnerable Populations
To capture the gender balance and empowerment status of women in displacement families, FGDs were conducted at the four camp sites. Mapswere prepared considering livelihoods activity, gender, gender based homestead, seasonal calendar, mobility, and benefit. The results are presented in the following sub-sections.
8.3.1. Vulnerability of women and childcare
Displaced populations in general are inherently vulnerable. In this assessment, vulnerable populations refer specifically to children, widowed, divorced, women headed HHs, people with disabilities and the elderly. Children’s vulnerability is more acute when women with younger children are involved in income generating activities outside of the home such as woodfuel collection, begging, small business, and dry fish processing. The current assessment indicated that women tended to leave their children with relatives or older children when they left to collect woodfuel.
8.3.2. Gender based livelihoods activity
At all the sites, women were more involved in income generating activities than men. In Kutupalong, women were mostly involved in rearing chickens, fish processing and woodfuel collection while men were mostly involved in woodfuel collection, and wage labour. In Leda, women were mostly involved in woodfuel collection, begging, and small business while men are mostly involved in collection of woodfuel, as wage labour in the port, fishing, salt cultivation. In Shamlapur, women were mostly involved in homestead vegetables gardening, woodfuel collection and fish processing. In Balukhali, women were mostly involved in woodfuel collection, relief collection, and begging, while men were mostly involved in woodfuel collection and wage labour economic activities.
8.3.3. Gender based homestead activities
Data revealed that women in Kutupalong were involved mostly with homestead activities such as washing utensils, cooking, fetching water, cleaning home, rearing chicken, washing clothes, preparing cooking stove (lighting), feeding the children, bathing children, collecting children food from NGOs, and collecting woodfuel (2 times per week). Women were supported by their husband for purchasing foods (3 times) and woodfuel collection (4 times), daughter (22 times), and son (10 times). For, Leda, Shamlapur and Balukhali activity by women in the home was the same. The compiled engagement of women in homestead activities in a typical day is mentioned below (Table 39). In each cases X means the number of times one activity was conducted by individuals in a given period.
Table 39: Women engagement in daily homestead activities.
Homestead work activities Women
(times = x)
Support provided by:
Husband Daughter Son Younger children
Washing utensils xxx - xx - -
Preparing cooking stove xxx - xx - -
Cooking xxx - xx - -
Fetching water xxx - xx x - Cleaning home xxx - xxx - -
Washing clothes xxx - xx - -
Feeding children xxx - xx xx -
Bathing children xxx - xx x - Collect children food from
NGOs xxx - xx xx -
Homestead level income generating activities xxx - xx - -
Woodfuel collection (weekly) xx xxxx x x -
Purchase of foods - xxx - xxx -

91
8.3.4. Seasonal calendar of activities
The analysis revealed that women were more involved in common household activities than men were. During the monsoon, the economic activities were reduced. The status of seasonal activities is presented in Table 40.
Table 40: Compiled status of seasonal calendar activities.
Jan. Feb Mar Apr May Jun Jul Aug Sep Oct Nov Dec
Women engaged in activities
Cooking
Caring children
Income activities at homestead
Fetching water
Income activities outside home shead
Woodfuel collection
Men engaged in activities
Income activities 1
Income activities 2
Woodfuel collection
Children engaged in activities
Woodfuel collection
Fetching water
Income activities
Education at Madrasha
8.3.5. Gender based mobility map.
Women visited remote locations more often than men in because of their stronger involvement in collecting relief supplies, taking the children to the healthcare centers, and collecting food from NGOs. Women were more involved with woodfuel collection and income generating activities.
8.3.6. Gender in household’s decisions
In most cases, household decisions were taken by men while women were involved in decision making processes for food and healthcare expenditure in Kutupalong and Leda. The status of gender based household’s decision-making analysis is presented below (Table 41).
Table 41: Status of gender based households’ decision-making analysis.
Income Source Use Households
expenses Overall
Decision Making
Purchase
of Cocking
fuel
Food Clothing Health
care
Transportation Other
Selling of
Woodfuel, Wage
Labors
Male Male
and
female
Male Male
and
female
Male Male Male

92
Annex 4
Table 42: List of tree species and their scientific name.
Vernacular Name Scientific name
Segun Tectona grandis
Rain tree Samanea Saman
Chikrashi Chuckrasia tebularis
Jarul Lagerstroemia speciosa
Sal Shorea robusta
Telsur Hopea odorata
Jam Syzygium cumini
Boilam Anispotera scaphula
Kadam Anthocephalus chinensis
Dhakkijam Syzygium firmum
Kainjal Bischofia javanica
Bahdi Lannea coromandelica
Champaful Michelia champaca
Sisso Dalbergia sissoo
Khanta kari Solanum Xanthocarpum
Kawfol Garcinia cowa
Chalta Dillenia indica
Jolpai Elaeocarpus floribundus
Tetul Tamarindus indica
Domor Ficus racemose
Jack fruts Artocarpus heterophyllus
Epil-epei Leucaena leucocephala
Shimul Bombax ceiba
Koshoi Bridelia retusa
Chapalish Artocarphus chama
Bat Ficus benghalensis
Cane (Bet Calamus latifolius
Bamboo Bambusa vulgaris
Supari Areca catechu
Coconut Cocos nucifera
Jhau Casuarna equisitifolia

93
Annex 5
Figure 45: SPOT 2 and 3 Pan+XS for 1994/1996 (Band combination NIR, RED, GREEN).

94
Figure 46: Spot 5 data for 2003 (Band combination NIR, RED, GREEN).

95
Figure 47: Spot 6 and 7 composite for 2016 (Band combination NIR, RED, GREEN).

96