assessment of innovative fuel designs for high performance
TRANSCRIPT

Assessment of Innovative Fuel Designs for High PerformanceLight Water Reactors
by
David Michael Carpenter
Submitted to the Department of Nuclear Science and Engineering in Partial Fulfillment ofthe Requirements for the Degree of
Bachelor of Science in Nuclear Science and Engineeringand
Master of Science in Nuclear Science and Engineering
at theMassachusetts Institute of Technology
June 2006
C Massachusetts Institute of Technology, 2006. All rights reserved.
Signature of Author:Department of Nuclear Science and Engineering
May 12, 2006Certified By:
Certified By:
Certified By:
)("ujid S. Kazimi, Ph.D./ /// TEPCO Professor of Nuclear Engineering
Thesis Supervisor
Gordon Kohse, Ph.D.Principal Research Engineer
Thesis Reader
Pavel Hejzlar, Sc.D.SA / Principal Research Scientist
Thesis Reader
Jeffrey A. Coderre, Ph.D.Chairman, Committee on Graduate Students
ARCHIVES

ABSTRACT
To increase the power density and maximum allowable fuel burnup in light waterreactors, new fuel rod designs are investigated. Such fuel is desirable for improving theeconomic performance light water reactors loaded with transuranic-bearing fuel fortransmutation, as well as those using UO2 fuel.
A proposal for using silicon carbide duplex as fuel cladding is investigated. The claddingconsists of a monolithic inner layer surrounded by a tightly wound fiber-matrixcomposite. The monolith layer retains the volatile fission products while the compositeadds strength. The FRAPCON steady-state thermo-mechanical fuel rod modeling code isused to examine the performance of SiC cladding at high fuel burnup and high powerdensity.
Empirical models are developed to describe the physical properties of the composite as afunction of operating temperature and neutron fluence. A comparison of the behavior ofthe SiC cladding to the conventional Zircaloy cladding demonstrates that the SiC hassuperior resistance to creep and mechanical degradation due to radiation or oxidation.However, the lower thermal conductivity of the SiC is a major issue, which results insignificantly increased peak fuel temperatures. Mixed U0 2-PuO2 fuel is also examined inplace of traditional UO2 pellets, since this may better resemble transmutation fuels of thefuture. It is found that the use of plutonium-bearing mixed-oxide fuels further exacerbatesthe high fuel temperatures.
The silicon carbide cladding is predicted to have more favorable performance when usedfor internally- and externally-cooled annular fuel rods developed at MIT. Both sinteredannular pellets and VIPAC granular fuel are examined. Because of the fuel geometry, theaverage fuel temperature is significantly lower, and the stiffness of the SiC cladding helpsto maintain the geometry of the annulus during extended irradiation.
Experimental projects have been undertaken to study the performance of both the annularfuel rods and silicon carbide duplex cladding. A post-irradiation examination of prototypeannular fuel rods with VIPAC fuel, irradiated in the MIT reactor, has been designed andexecuted. Through this non-destructive examination, the disposition of the fuel grains isexamined, and fuel burnup and fission gas release is estimated. These experimentalresults correlate well with computer calculations. A new irradiation facility was alsoplanned and constructed that consists of a closed loop, operated at pressurized waterreactor pressure, temperature, and chemistry conditions. This facility contains siliconcarbide duplex cladding samples of various constructions, and it will be irradiated in thecore of the MIT reactor for several months.

ACKNOWLEDGEMENTS
I would like to thank the U.S. Department of Energy Advanced Fuel Cycle Initiative forsupporting this research, and in particular, Cathy Dixon and her staff for providinginvaluable resources through the fellowship program for everything from networking tosupport in the definition of this topic. I also want to recognize Carter "Buzz" Savage, Dr.Tom Ward, and Dr. James Bresee at the U.S. Department of Energy, who have providedvaluable assistance and advice along the way.
This project would not exist were it not for the creative ideas, financial support, and verygracious assistance of Herb Feinroth, President of the Gamma Engineering Corporation.He, along with his collaborators Dr. Denwood Ross at Gamma and Dr. Edward Lahodaof Westinghouse Electric have always been forthcoming with helpful, practical adviceand encouragement.
I am grateful for my advisor, Prof. Mujid Kazimi, director of the Center for AdvancedNuclear Energy Systems at MIT, who introduced me to the possibilities of experimentalwork as a freshman. He has been extremely supportive as I have progressed throughdifferent projects and built competence in this field through both research andcoursework.
None of this work would have been possible without the guidance of Dr. Gordon Kohseof the MIT Nuclear Reactor Laboratory, who has supervised my experimental researchwork for the last four years. He has been available at every point to help guide myprogress and correct my errors. I would also like to recognize the invaluable assistance ofYakov Ostrovsky with all of the experimental design, construction, and operation.
The other members of the MIT Nuclear Reactor Laboratory have also been generous withtheir time and their materials. In particular, I would to thank Judith Maro, JohnDiCiaccio, Edward Lau, Dr. Tom Newton, and Fred McWilliams for their help with thepaperwork, planning, and mechanics of my experiments at the reactor.
My modeling efforts are in great debt to Dr. Pavel Hejzlar and Wenfeng Liu at MIT fortheir assistance with FRAPCON, and for helping me to build an understanding of fuel rodbehavior. I would also like to thank Dr. Hejzlar for his support with ORIGEN, MCNP,and MONTEBURNS calculations. In addition, I would like to thank John Styczynski forhis help with the new experiment MCNP model. Dr. Larry Ott at Oak Ridge NationalLaboratory has also provided helpful feedback on my modeling and helped to focus thescope of my work.
Of course, I would like to thank my family for supporting me for the last 23 years, andfor helping me to reach this point. They have been generous and understanding of myinattention at times, but as always, they have my love.

TABLE OF CONTENTS
ABSTRACT ................................................................................................................. 2
ACKNOW LEDGEM ENTS ........................................................................................ 3
TABLE OF CONTENTS .......................................................................................... 4
LIST OF FIGURES .................................................................................................... 8
LIST OF TABLES ..................................................................................................... 13
NOM ENCLATURE ........................................................................................................ 15
1. Introduction .................................................. 161.1 B ackground .............................................................................................................................. 16
1.2 Objectives and Scope ............................................................................................................... 18
1.3 Internally- and Externally-Cooled Annular Fuel ......................................... .......... 20
1.3.1 Sintered Pellets.................................. .. .. ..................................... ....21
1.3.2 VIPAC Fuel...... ................................................................................. 22
1.4 MIT I&EC Annular Fuel Irradiation Program............................................. 24
1.5 Silicon Carbide .................................................... 26
1.5.1 Background ofSiC Development.......................... ................. 26
1.5.2 SiC Composites ................................................................................................ 27
1.5.3 Advanced Clad Project.................................................. ........................ 28
1.6 FRAPCON Computer Code ............................................................................................... 29
1.7 Thesis O rganization.................................................................................................................. 30
2. Fuel Rod M odeling in FRAPCON ......................................... ........................... 322.1 Code Structure................................................... 32
2.1.1 Implementation of I&EC Annular Fuel....................... ....... 33
2.1.2 Implementation of VIPAC Fuel.................................... 34
2.1.3 Implementation of Updated U0 2 and MOX Fuel Models................................ 34
2.1.4 Implementation ofHigh-Burnup Fission Gas Release Model...............................35
2.2 Benchmarking of Updates .................................................................................................. 36
2.2.1 FRAPCON-3.3 with High Burnup Modifications...............................................36
2.2.2 I&EC Annular Fuel with Sintered Annular Pellets Modifications ..................... 39
2.2.3 I&EC Annular Fuel with VIPAC Fuel Modifications.....................44
2.3 Integration of SiC Cladding...................................................................................................... 48

3. General Silicon Carbide Cladding M odel Development ................................ 493.1 Design Parameters ................................................. 49
3.2 Model Implementation ....................................................................................................... 50
3.3 SiC Thermal Conductivity........................................................................................................ 50
3.3.1 Background ...................................................... ............................................... 50
3.3.2 Model Development.........................................................................................51
3.4 SiC Thermal Expansion............................................................................................................ 56
3.5 SiC Irradiation Swelling ..................................................................................................... 57
3.6 SiC Stress and Strain Behavior........................................................................................... 59
3.6.1 Young's Modulus ............................................................................................. 59
3.6.2 Yield Strength ....................................................................................................... 61
3.6.3 Shear Modulus................................................................................................. 64
3.7 Other SiC Properties................................................................................................................. 64
3.7.1 Creep . .............................................................................................. . ......... 64
3.7.2 Oxidation........................... ................................................................... 64
3.7.3 Emissivity ........................................................................................................ 65
3.7.4 Phase Transitions............................................................................................65
3.7.5 Crud Accumulation..........................................................................................66
4. Predicted Behavior of SiC Clad PW R Fuel Rods.................................... 674.1 FRAPCON Test Cases ....................................................................................................... 67
4.2 SiC Model Evaluation .............................................................................................................. 67
4.2.1 Constant Power Analysis................................................67
4.2.2 High Burnup Analysis ......................................... 72
4.3 Sensitivity Analysis .................................................................................................................. 80
4.3.1 Thermal Conductivity Variations .......................................... ........ 80
4.3.2 Thermal Expansion Variations.................................... 86
4.3.3 Irradiation Swelling Variations..........................................................................88
4.3.4 Young's Modulus Variations ..................................................... 91
4.4 Investigation of Possibilities for Performance Enhancement ........................................ 93
4.4.1 Initial Fill Gas Pressure........................................................................................93
4.4.2 A nnular Pellets................................................... ............................................. 97
4.5 M O X Fuel .............................................................................................................................. 101
4.6 Summary of SiC Model Performance.............................. 104
5. I&EC Annular Fuel with Silicon Carbide Cladding............................. 1065.1 I&EC Annular Fuel Considerations ....................................... 106
5.2 FRAPCON VIPAC Model .................................................................................................. 107
5

5.2.1 Model Development. ........................................ 107
5.2.2 Evaluation of VIPAC Fuel Performance ....................................................... 108
5.2.3 VIPAC Fuel at Very High Burnup.................................................................... 110
5.3 FRAPCON Sintered Annular Fuel Model............ ........................ 114
5.3.1 Model Development.............................. 114
5.3.2 Evaluation of Sintered Annular Fuel Performance ........................................ 115
5.3.3 Sintered Annular Fuel at Very High Burnup............................... 119
5.4 Sum m ary ................................................................................................................................ 123
6. I&EC Annular Fuel Post-Irradiation Examination......................................... 256.1 O verview ................................................................................................................................ 125
6.2 Experim ental D esign .............................................................................................................. 126
6.2.1 Hot Box Design ........................................ 126
6.2.2 Counting System .......................................................... ................................. 129
6.2.3 Detector Calibration ............................................................. 132
6.2.4 Capsule Extraction and Handling ............................. 133
6.3 Fuel Exam ination ................................................................................................................... 134
6.3.1 Visual Inspection .............................................................................................. 134
6.3.2 Counting Results ........................................ 137
6.3.3 Fuel Distribution ........................................ 139
6.3.4 Burnup Measurement from Cs-137 Activity ..................................... 141
6.3.5 Burnup Measurement from the Cesium Ratio ...................................... 143
6.3.6 Fission Gas Release ........................................ 145
6.4 Sum m ary ................................................................................................................................ 147
7. Silicon Carbide Cladding Irradiation Facility................................. 1497.1 O verview ................................................................................................................................ 149
7.2 Irradiation Loop Design ........................................ 149
7.2.1 Irradiation Conditions.................................................149
7.2.2 Structural Design ........................................ 152
7.2.3 Safety Review...................................................................................................... 157
7.2.4 P rocedures ........................................ ........................................................... 160
7.3 Rig Construction and Startup ........................................ 162
7.3.1 Sample Characterization and Loop Assembly............................. 162
7.3.2 Loop Installation and Startup........... ......................... 165
8. Summary and Recommendations for Future W ork ..................................... 1708.1 SiC Cladding Modeling in FRAPCON ..................................... 170
6

8.2 Fuel Performance Enhancement.......................................... ........... 172
8.2.1 Possibilities for Power Density Increase................................ 172
8.2.2 Achieving High Fuel Burnup ............................................. 174
8.3 I&EC Annular Fuel Irradiation Results ............................. ........... 175
8.4 Silicon Carbide Cladding Irradiation............................................ .......... 176
8.5 Possibilities for Future W ork....................................... ............. .......... 176
8.5.1 Additional FRAPCON Development and Other Computer Modeling .............. 176
8.5.2 Experimental Studies.................................................................. 178
REFERENCES .............................................................................................................. 179
APPENDIX A: SiC Irradiation Sample Data ........................................................... 184
APPENDIX B: SiC Neutron Activation Analysis Data ............................................ 187

LIST OF FIGURES
Figure 1.1 Conceptual Design for 13xl3 I&EC Annular Fuel PWR Assembly [Kazimi, 2002].............. 20
Figure 1.2 Schematic of I&EC Sintered Annular Pellet Fuel for a 13x13 Assembly ............................... 22
Figure 1.3 Sintered Annular Pellets Produced by Westinghouse [Kazimi, 2003] ................................... 22
Figure 1.4 Schematic of I&EC VIPAC Annular Fuel for a 13x13 Assembly [Kazimi, 2003] ................. 24
Figure 1.5 I&EC VIPAC Annular Fuel Rods Manufactured for Irradiation in MITR-II [Kazimi,
2003] . ......................................................................... 25
Figure 1.6 I&EC VIPAC Annular Fuel Irradiation Rig Installed in the Core of the MITR-II. ................ 26
Figure 1.7 Example SiC Duplex Solid Fuel Rod .......................................................... ........................ 28
Figure 2.1 Simplified Flow Chart ofFRAPCON-3 Iterative Solution Scheme [Berna et al., 1997]........... 32
Figure 2.2 Average Linear Heat Generation Rate for the Manzel Test Case. ................................... . 38
Figure 2.3 Fission Gas Release for Different Versions of FRAPCON Based on the Manzel Test
C ase ...................................................................................................................................................... 39
Figure 2.4 Linear Heat Generation Rate for Original and Updated FRAPCON I&EC with Sintered
Annular Pellets.............................................. 41
Figure 2.5 Average Fuel Temperature for Original and Updated FRAPCON I&EC with Sintered
A nnular Pellets......................................................................................................................... 4 1
Figure 2.6 Outer Gap Conductance for Original and Updated FRAPCON I&EC with Sintered
A nnular Pellets......................................................................................................................... 42
Figure 2.7 Inner Gap Conductance for Original and Updated FRAPCON I&EC with Sintered
Annular Pellets.............................................. 42
Figure 2.8 Fission Gas Release Fraction Predicted by Original and Updated FRAPCON I&EC
w ith Sintered Annular Pellets. ............................................................................................................. 43
Figure 2.9 Outer Cladding Inner Diameter Predicted by Original and Updated FRAPCON I&EC
w ith Sintered A nnular Pellets. ............................................................................................................. 43
Figure 2.10 Inner Cladding Inner Diameter Predicted by Original and Updated FRAPCON I&EC
with Sintered Annular Pellets. ............................................................................................................. 44
Figure 2.11 Average Fuel Temperature Predicted by Original and Updated FRAPCON I&EC
w ith V IPA C Fuel ... ............................................................................................................ 46
Figure 2.12 Fission Gas Release Fraction Predicted by Original and Updated FRAPCON I&EC
w ith V IPA C Fuel ... ............................................................................................................ 46
Figure 2.13 Fuel Outer Diameter Predicted by Original and Updated FRAPCON I&EC with
V IPA C Fuel ....... ............................................................................................................... 47
Figure 2.14 Fuel Inner Diameter Predicted by Original and Updated FRAPCON I&EC with
V IPA C Fuel ....... ............................................................................................................... 47

Figure 3.1 Thermal Conductivity of Un-irradiated SiC Composites as a Function of Temperature. .......... 53
Figure 3.2 Un-irradiated SiC Composites with High Thermal Conductivity as a Function of
Temperature [Yam ada et al., 2004]. .................................................................................................... 53
Figure 3.3 Thermal Conductivity of SiC Composites Irradiated at Room Temperature .......................... 54
Figure 3.4 SiC Composite Thermal Conductivity Predicted by FRAPCON as a Function of DPA
and Temperature ................................................................. 55
Figure 3.5 SiC Composite (Hi-Nicalon Type-S with CVI) Thermal Conductivity as a Function of
DPA and Temperature [Youngblood, 2004] .............................................................. .................. 55
Figure 3.6 Through Thickness Thermal Expansion Coefficient versus Temperature for SiC
Com posites ....... ................................................................................................................ 56
Figure 3.7 In-plane Thermal Expansion Coefficient versus Temperature for SiC Composites............... 57
Figure 3.8 Temperature Dependence of the Irradiation-Induced Swelling of SiC Composites with
Hi-Nicalon Fibers [Ishihara et al., 2002]. ............................................................. ......................... 59
Figure 3.9 Young's Modulus for Un-irradiated SiC Composites versus Temperature......................... 60
Figure 3.10 Young's Modulus of SiC Composites as a Function of DPA. ...................................... 61
Figure 3.11 Yield Strength of SiC Composites versus Temperature ................................................. 62
Figure 3.12 SiC Composite Ultimate Tensile Strength as a Function of DPA ..................................... 63
Figure 4.1 Average LHGR for the Constant Power Test Case ...................... .......... 68
Figure 4.2 Average Burnup for the Constant Power Test Case ........................................ ......... 68
Figure 4.3 Cladding Thermal Conductivity during the Constant Power Test Case .................................. 69
Figure 4.4 Cladding Temperature at the Cladding Outer Diameter (OD) and Cladding Inner
Diameter (ID) for the Constant Power Test Case. .......................................... ............... 70
Figure 4.5 Fuel Temperature at the Fuel Outer Diameter (OD) and Fuel Centerline for the
Constant Pow er Test Case. .................................................................................................................. 70
Figure 4.6 Fuel-Cladding Radial Gap Width for the Constant Power Test Case................................ . 71
Figure 4.7 Fractional Fission Gas Release for the Constant Power Test Case. ..................................... 72
Figure 4.8 Average LHGR for Zircaloy (Zr) and SiC Composite (SiC) Clad Fuel Rods for Manzel
Test Case .................................................. 73
Figure 4.9 Average Burnup for Manzel Test Case .............................................................................. 73
Figure 4.10 Cladding Thermal Conductivity for Manzel Test Case ....................................... ... . 74
Figure 4.11 Radial Fuel-Cladding Gap Width for Manzel Test Case ...................................... ...... 75
Figure 4.12 Cladding Inner Diameter for Manzel Test Case ........................................ ........... 75
Figure 4.13 Cladding Inner and Outer Diameter Temperatures for Manzel Test Case. ........................... 76Figure 4.14 Fuel Temperature for Zircaloy and SiC fuel rods at Fuel Outer Diameter and
Centerline for M anzel Test Case.................................................................................................. 77Figure 4.15 Radial Fuel-Cladding Gap Thermal Conductance for Manzel Test Case. ............................ 77Figure 4.16 Average Fractional Fission Gas Release for the Manzel Test Case ...................................... 78

Figure 4.17 Fuel Rod Free Gas Pressure for Manzel Test Case. ...................................... ......... 79
Figure 4.18 Thermal Conductivity Based on Different Thermal Conductivity Model Parameters. ............ 81
Figure 4.19 Cladding Temperature Based on Different Thermal Conductivity Model Parameters. ........... 82
Figure 4.20 Fuel Temperature Based on Different Thermal Conductivity Model Parameters ................. 83
Figure 4.21 Fission Gas Release Based on Different Thermal Conductivity Model Parameters. ............ 83
Figure 4.22 Internal Free Gas Pressure Based on Different Thermal Conductivity Model
Param eters........................ ................................................................................................. 84
Figure 4.23 Radial Fuel-Cladding Gap Conductance Based on Different Thermal Conductivity
Model Parameters. ................................................................ 85
Figure 4.24 Radial Fuel-Cladding Gap Width Based on Different Thermal Conductivity Model
Parameters.......... ............................................ 85
Figure 4.25 Radial Fuel-Cladding Gap Width for Different Thermal Expansion Models. ...................... 87
Figure 4.26 Fractional Fission Gas Release for Different Thermal Expansion Models. ................ 87
Figure 4.27 Radial Fuel-Cladding Gap Width for Different Irradiation Swelling Models ....................... 89
Figure 4.28 Fuel Temperature for Different Irradiation Swelling Models. ...................................... 90
Figure 4.29 Fractional Fission Gas Release for Different Irradiation Swelling Models........................... 90
Figure 4.30 Cladding Inner Diameter for Different Young's Modulus Models ..................................... 92
Figure 4.31 Radial Fuel-Cladding Gap Width for Different Young's Modulus Models .......................... 93
Figure 4.32 Internal Free Gas Pressure for Different Initial Fill Gas Pressures. ..................................... 95
Figure 4.33 Fuel Temperature for Different Initial Fill Gas Pressures ...................................... ... 96
Figure 4.34 Fuel-Cladding Gap Thermal Conductance for Different Initial Fill Gas Pressures............... 96
Figure 4.35 Fractional Fission Gas Release for Different Initial Fill Gas Pressures. ................................. 97
Figure 4.36 Fuel Temperature for Solid and Annular Fuel Pellets ...................................... ....... 98
Figure 4.37 Radial Fuel-Cladding Gap for Solid and Annular Fuel Pellets. .................................... . 99
Figure 4.38 Fractional Fission Gas Release for Solid and Annular Fuel Pellets ................................... 100
Figure 4.39 Internal Free Gas Pressure for Fuel Rods with Solid and Annular Fuel Pellets .................. 100
Figure 4.40 Fuel Temperature for Zircaloy-Clad Fuel Rods with UO2 and MOX Fuel, and SiC-
Clad Fuel Rods with MOX Fuel. .................................................... 102
Figure 4.41 Fractional Fission Gas Release from UO2 and MOX Fuel Pins with Zr and SiC
Cladding.............................................. 103
Figure 4.42 Internal Free Gas Pressure for UO2 and MOX Fuel Rods with Zr and SiC Cladding........... 104
Figure 5.1 I&EC VIPAC Annular Fuel Rod with SiC Duplex Cladding ...................................... 107
Figure 5.2 Average Fuel Temperature of I&EC VIPAC Annular Fuel Rods with Zircaloy and SiC
Cladding.............................................. 108
Figure 5.3 Average Cladding Temperature of Zr- and SiC-clad I&EC VIPAC Annular Fuel Rods......... 109
Figure 5.4 Internal Free Gas Pressure of Zr- and SiC-clad I&EC VIPAC Annular Fuel Rods ............... 110

Figure 5.5 Average Power of I&EC VIPAC Annular Fuel High Burnup Case with Zircaloy and
SiC Cladding ............................................. 111
Figure 5.6 Average Burnup of I&EC VIPAC Annular Fuel High Burnup Case with Zircaloy and
SiC Cladding ............................................. 111
Figure 5.7 Average Fuel Temperature of I&EC VIPAC Annular Fuel High Burnup Case with
Zircaloy and SiC Cladding................................................................................................................. 112
Figure 5.8 Fractional Fission Gas Release of I&EC VIPAC Annular Fuel High Burnup Case with
Zircaloy and SiC Cladding................................................................................................................. 112
Figure 5.9 Internal Free Gas Pressure of I&EC VIPAC Annular Fuel High Burnup Case with
Zircaloy and SiC Cladding................................................................................................................. 113
Figure 5.10 Average Cladding Strain of I&EC VIPAC Annular Fuel High Burnup Case with
Zircaloy and SiC Cladding................................................................................................................. 114
Figure 5.11 I&EC Sintered Annular Fuel Rod with SiC Duplex Cladding ................... ..................... 115
Figure 5.12 Average Fuel Temperature for I&EC Sintered Annular Pellet Fuel Rods with Zircaloy
and SiC Cladding. ............................................................. 116
Figure 5.13 Cladding Temperature for I&EC Sintered Annular Pellet Fuel Rods with Zircaloy and
SiC Cladding ............................................. 117
Figure 5.14 Average Cladding Strain of Sintered Annular Pellet Fuel Rods with Zircaloy and SiC
Cladding............................................. 118
Figure 5.15 Internal Free Gas Pressure for I&EC Sintered Annular Pellet Fuel Rods with Zircaloy
and SiC Cladding. ............................................................. 118
Figure 5.16 Gap Conductance for I&EC Sintered Annular Pellet Fuel Rods with Zircaloy and SiC
Cladding............................................. 119
Figure 5.17 Average Burnup of I&EC Sintered Annular Fuel High Burnup Case with Zircaloy
and SiC Cladding at 150% Power Density. ..................................... 120
Figure 5.18 Average Fuel Temperature of I&EC Sintered Annular Fuel High Burnup Case with
Zircaloy and SiC Cladding................................................................................................................. 121
Figure 5.19 Fractional Fission Gas Release of I&EC Sintered Annular Fuel High Burnup Case
w ith Zircaloy and SiC Cladding......................................................................................................... 122
Figure 5.20 Internal Free Gas Pressure of I&EC Sintered Annular Fuel High Burnup Case with
Zircaloy and SiC Cladding................................................................................................................. 122
Figure 5.21 Average Cladding Strain of I&EC Sintered Annular Fuel High Burnup Case with
Zircaloy and SiC Cladding................................................................................................................. 123
Figure 6.1 Pre-irradiation I&EC Annular Fuel Irradiation Capsule 4 (left) with Cross-Section
Schem atic.................................................................................................................................... . 125
Figure 6.2 Top View of Collimator and Detector Setup with Hot Box ...................................... 131Figure 6.3 Model of an I&EC Annular Fuel Capsule on the Gamma Counting Stand........................... 131

Figure 6.4 I&EC Annular Fuel Capsule in Hot Box at Beginning of Gamma Counting....................... 132
Figure 6.5 Net Counts per Second from the Cs-137 Absolute Calibration Source.............................. 133
Figure 6.6 I&EC Annular Fuel Capsule's Cover Gas Tube being Cut in MITR-II Core Tank .............. 134
Figure 6.7 I&EC Annular Fuel Capsule 3 after Irradiation ...................................... 135
Figure 6.8 I&EC Annular Fuel Capsule 4 after Irradiation. ..................................... 136
Figure 6.9 Exterior of Hot Box during Capsule Counting ...................................... 138
Figure 6.10 View of Hot Box Interior from Right Viewing Port during Capsule Counting................... 138
Figure 6.11 Net Count Rate for the Zr-95 Peak at 724 keV for Capsule 3 and Capsule 4. .................... 139
Figure 6.12 Net Count Rate of Dominant Radionuclides in Capsule 3 with to-scale Fuel Rod
C ross-Section. .................................................................................................................................... 140
Figure 6.13 Net Count Rate of Dominant Radionuclides in Capsule 4 with to-scale Fuel Rod
Cross-Section . .................................................................. 140
Figure 6.14 Ratio of the Cs-134 to the Cs-137 Net Count Rate in the Fuel Region (position 2.5 to
9.5), Corrected for D ecay................................................................................................................... 144
Figure 6.15 Net Count Rate of Kr-85 (514 keV) for each Capsule ..................................... 146
Figure 7.1 Top View of MITR-II Core Showing SiC Loop In-Core Irradiation Location B-3 ............. 150
Figure 7.2 Axially-Averaged Neutron Flux in Loop In-Core Section Calculated by MCNP................ 150
Figure 7.3 Anticipated Neutron Flux Profile for SiC Irradiation........................... 151
Figure 7.4 Sample Module Containing Three Layers with Three SiC Tubes in Each Layer. ................ 152
Figure 7.5 In-Core Section of SiC Irradiation Loop with Four Modules. .................................... 153
Figure 7.6 Coolant Flow Pattern in SiC Irradiation Loop [Chitelain, 2000]................................ 154
Figure 7.7 SiC Irradiation In-Core Loop in Position B-3 in Simplified MITR-II Core Tank................ 155
Figure 7.8 Coolant Control System for SiC Irradiaition Facility [Chitelain, 2000].............................. 156
Figure 7.9 Hot Cell for SiC Sample PIE...................................... 162
Figure 7.10 Partially Assembled 2-Layer Module with Three SiC Samples, Flow Shroud, and
H olding Platters Shown. .................................................................................................................... 164
Figure 7.11 SiC Irradiation Loop Installed in the MITR-II Core. .................................... 165
Figure 7.12 Thimble and Autoclave Top Seated in Reactor Lid Prior to Insulation and Shielding .......... 166
Figure 7.13 SiC Irradiation Facility Pressure and Water Chemistry Monitors ..................................... 167
Figure 7.14 Heater Power Control Cabinet for SiC Irradiation Facility ..................................... 168

LIST OF TABLES
Table 2.1 Initial Fuel and Cladding Properties for the Manzel Test Case ....................................... 37
Table 2.2 Initial Fuel and Cladding Properties for the SA-100 Test Case..................................... 40
Table 2.3 Initial Fuel and Cladding Properties for the VA-100 Test Case ....................................... 45
Table 3.1 Design Ranges for SiC Property Models ......................................................................... 49
Table 3.2 SiC Fibers of Interest [Ichikawa and Ishikawa, 2000 and Osborne et al., 1998]...................... 50
Table 3.3 SiC Monolith Materials of Interest [Snead et al., 2005] ....................................... ........ 50
Table 4.1 Thermal Conductivity Sensitivity Conditions ................................................................... 80
Table 4.2 Thermal Expansion Sensitivity Conditions ..................................................................... 86
Table 4.3 Irradiation Swelling Sensitivity Conditions............................................ 88
Table 4.4 Young's Modulus Sensitivity Conditions............................................... 91
Table 4.5 Initial Fill Gas Pressure Options .................................................................. .......................... 94
Table 4.6 Fuel Pellet Central Void Dimensions. .................................................................................... 98
Table 4.7 MOX Fuel Actinide Vector ......................................... 101
Table 6.1 1 MeV Photon Attenuation Calculation Material Properties ...................................... 128
Table 6.2 Exposure Rate for a Single Capsule through Various Thicknesses of Lead for 1 MeV
Photons . ..................................................................... 129
Table 6.3 Estimated Activity of Major Isotopes in Fuel................................. 141
Table 6.4 Estimated Activity of Cs-137 in Fuel. ..................................... 142
Table 6.5 Constants Used in Bumup Calculations [Chang, 2005]. ..................................... 143
Table 6.6 Calculated Burnup from Cs-137 Activity ...................................... 143
Table 6.7 Calculated Burnup from Cesium Ratio...................................................................................... 145
Table 6.8 Fuel Rod Geometry Based on Fabrication Report [AECL, 2003]................................ 147
Table 6.9 Data for Fission Gas Release Estimate Based on Kr-85.............................. 147
Table 7.1 Elemental Loading the SiC Irradiation Loop............. ................... 159
Table 7.2 Activities for SiC Irradiation Loop after 1620 Hours (90 EFPD with 75% Capacity
Factor) and 3 D ays of Cooling ........................................................................................................... 159
Table A. 1 Description of SiC Irradiation Loop Specimens ..................................... 184
Table A.2 Location of Loop Specimens (Numbered from Bottom of Core) ........................................ 184
Table A.3 Pre-Irradiation Specimen Dimensions ..................................... 185
Table A.4 Pre-Irradiation Specimen Weights.................................. 186
Table B. 1 Neutron Activation Analysis Sample Description ..................................... 187
Table B.2 Elements Identified in Sample Cl ...................................................................... ................. 187
Table B.3 Elements Identified in Sample G2 ...................................... 188Table B.4 Elements Identified in Sample FI ........................................ 188

Table B.5 Elements Identified in Sample El.................................................... 189
NOMENCLATURE
AFCI Advanced Fuel Cycle Initiative
CVD Carbon Vapor Deposition
CVI Carbon Vapor Infiltration
DNBR Departure from Nucleate Boiling Ratio
DPA Displacements per Atom
EFPD Effective Full Power Days
I&EC Internally- and Externally-Cooled
LHGR Linear Heat Generation Rate
LWR Light Water Reactor
MCNP Monte Carlo N-Particle Code
MITR MIT Nuclear Reactor
MOX Mixed Oxide
ORIGEN Oak Ridge Isotope Generation Code
PIE Post-Irradiation Examination
PIP Polymer Impregnation Pyrolysis
PWR Pressurized Water Reactor
SiC Silicon Carbide
TD Theoretical Density
TRU Transuranic
VIPAC Vibration Packed

1. Introduction
1.1 Background
Transuranic (TRU) elements are responsible for a significant fraction of the long-term
radiation and decay heat of commercial spent reactor fuel, and some TRU isotopes, such
as Pu-239, represent a proliferation risk. It has been demonstrated that it is possible to
destroy these TRU isotopes efficiently in a thermal spectrum, such as that in a light water
reactor (LWR), and therefore there is interest in developing transmutation fuels for use in
current-generation power reactors [Shwageraus et al., 2003].
Transmutation fuels replace some or all of the UO2 in the fuel rod with plutonium and
other TRU from spent fuel, enabling these isotopes to be fissioned in the reactor. Since
all operating commercial reactors in the United States are LWRs utilizing traditional pin-
type fuel rods, the performance of this fuel is critical to the transmutation performance.
These rods consist of a stack of sintered UO2 pellets encased in a thin zirconium-based
cladding. While performance has been continually improved since their inception, this
solid pin design has remained basically unchanged. Recent research at MIT has
investigated possible approaches for significantly improving the power density supported
by LWR fuel rods by altering their geometry or by using different cladding materials
[Yuan et al., 2004]. These changes are applicable to both traditional UO 2 fuel as well as
the transmutation fuels under development.
The primary purpose of these changes is to allow the fuel rods to be run at a higher power
density and to withstand higher burnup. A higher power density increases the rate at
which power is produced (more fissions per unit time), within a given fuel volume,
whereas the increased burnup allows a larger fraction of the fuel in the rod to be
consumed before it is discharged. In addition, these changes will maintain or improve
upon fuel rod performance and safety margins during both normal operation and accident
scenarios.

The improved design could allow power uprating of existing LWR cores with minimal
core modification, and increase the maximum allowable discharge burnup. This is
beneficial for the traditional fuel management in once-through fuel cycles since it
increases the efficiency of uranium usage and increases power output. Since less uranium
fuel volume is required for the same energy output, the volume of waste is reduced. The
design improvements also benefit transmutation since increasing power density increases
the rate that TRU is destroyed and higher burnup enables more TRU to be transmuted
before the fuel is reprocessed. For both traditional and transmutation fuels, higher burnup
significantly reduces the amount of plutonium in the spent fuel for a given amount of
energy generation, and enhances the proliferation resistance by increasing the fraction of
Pu-238 in the plutonium [Zhiwen et al., 2005].
To increase the maximum power density, the fuel rods need to be redesigned. For
example, they can be changed from the traditional pin design to an annular geometry with
internal and external cooling, which increases the cooled surface area for the same
volume of fuel. Research has been done to optimize the geometry, materials, and
manufacturing of this annular fuel and recently prototype annular rods were irradiated in
the MIT reactor. This scoping analysis sought to verify the computer modeling of the
thermal hydraulic and irradiation behavior of the rods. In addition, because the annular
rods used vibration-packed UO2 fuel grains (VIPAC) instead of traditional sintered
pellets, the in-core irradiation also provided an opportunity to examine the VIPAC fuel
irradiation behavior [Kazimi et al., 2005]. VIPAC is an attractive technology because it
increases the ease of manufacturing; a simple manufacturing process is especially
important for fuels with significant amounts of TRU because of its high activity and
spontaneous fission rate.
One of the tasks of this project is the post-irradiation examination of the annular fuel
rods. This experimental analysis is critical because it will allow measurement of the
burnup, fission gas release, and structure of the fuel, which will help to validate the
computer models and give insights into future optimization strategies.
In addition to the geometry changes, a new cladding material could allow increased
burnup and power density by improving heat transfer and the thermal, chemical, and
mechanical stability of the rod. Such improvements in behavior during normal and
transient operation would allow power density and burnup limits set by safety analysis to
be increased.
Silicon carbide (SiC) has been proposed as such a replacement for the traditional Zircaloy
cladding, as it has beneficial features like reasonable thermal conductivity, a higher
melting temperature, does not experience creep like a metal, and does not react
exothermically with water. In order to determine the viability of SiC cladding it will be
necessary to perform computer modeling of its in-core behavior, and ultimately to
conduct irradiation testing of prototype cladding designs for verification of the effects of
radiation damage to its mechanical and thermal properties.
1.2 Objectives and Scope
The overall objective is to examine some of the innovative ideas for increasing the power
density and burnup limits for LWR fuels, in particular by using ceramic cladding for
internally- and externally-cooled annular fuel containing U0 2 and mixed oxide (MOX)
fuel. This objective will be accomplished through four tasks.
The first task is modeling of the thermal and mechanical behavior of the SiC cladding
using a computer code. This requires accurate prediction of the relevant properties of SiC
cladding given different temperature, stress, and irradiation conditions. Next, these
properties will be used to create a model that appropriately predicts the behavior of a
SiC-clad fuel rod under realistic LWR operating conditions. The behavior of this rod can
then be compared to a Zircaloy-clad rod under identical circumstances. Finally, this
modeling will be used to explore the benefits and limitations of SiC cladding by
quantifying important behavior, measuring the sensitivity of the cladding behavior to
property variations, and optimizing the geometry.

The second task is an assessment of the attempt to improve the performance of the
proposed annular fuel design by using SiC cladding. This first involves combining the
SiC cladding model with a previously developed internally- and externally-cooled
annular fuel rod model [Yuan et al., 2004]. Next, the performance of this SiC-clad
annular fuel rod will be compared to a Zr-clad annular rod under identical conditions in
order to understand what additional advantages the ceramic provides, and both rod types
will be studied in combination with sintered annular fuel pellets and the VIPAC fuel
form. In addition, because transmutation fuels would contain a large amount of
plutonium, a MOX fuel model will be incorporated. Modeling MOX fuel allows a study
of the effect of different fuel compositions on fuel rod behavior.
The third task is to conduct the post irradiation examination of the prototype annular UO2
fuel rods. The goals of the examination are to obtain estimates for the average burnup of
the VIPAC fuel, the fraction of fission gas released, and the distribution of fuel particles
within the rod using facilities available at the MIT Nuclear Reactor Laboratory. This
information will be compared to the predictions of the computer models in order to
qualify their precision. It will also expand understanding of the behavior of the annular
rod design and the VIPAC fuel under conditions similar to that of a LWR core.
The final task is preparation for the in-core irradiation of SiC cladding samples in the
MIT reactor (MITR-II). This preparation involves the design and construction of the in-
core test rig, and preparation of the procedures necessary for loading, on-line monitoring,
and removal of the rig from the core. This irradiation will allow multiple cladding
samples of different shapes and construction to be irradiated at known temperatures and
fluxes. The test rig also allows samples to be replaced mid-run without major
disassembly of the rig. Finally, the test rig must meet all reactor safety requirements and
not interfere with possible concurrent in-core experiments. The post-irradiation
examination of the SiC specimens is not within the scope of this work.

1.3 Internally- and Externally-Cooled Annular Fuel
It is desirable to reduce the fuel temperature in order to reduce fission gas release,
swelling, and increase the margin to overheating. Because the highest temperature in a
fuel rod occurs in the center of the pellet, previous investigations in the U.S. [Caner and
Dugan, 2000] and in Russia [Bibilashvili et al., 1994] have looked at creating annular
fuel pellets. These sintered pellets are formed with a central void, usually 10-50 volume
percent, which removes the temperature peaking at the center of the pellet.
This central void is still limiting, however, since heat can still only be removed through
the outer surface of the pellet and it creates a channel for fuel and debris relocation.
Recent work at MIT has resulted in the design of an internally- and externally-cooled
(I&EC) annular fuel rod, which creates an open channel through the center of the fuel rod
to allow coolant flow and the removal of heat. Because the goal of this investigation was
a fuel rod that could be used in existing LWRs, the rod configuration was constrained by
the Westinghouse PWR fuel assembly dimensions, and a 13x13 fuel rod array, shown in
Figure 1.1, was chosen as the base design [Kazimi, 2002].
Figure 1.1 Conceptual Design for 13x13 I&EC Annular Fuel PWR Assembly[Kazimi, 2002].
7Tý77r- 77r 71V_7ýW,
ý!ii +io'tie'
"o,AL Mh
1i;EW4 0 7,1119, ij
.7 ;20 Tr, 0 4, 7, _4
+40 4 Pr ""14
+7
+7 hL

1.3.1 Sintered Pellets
Similar to the annular pellets for solid fuel rods discussed above, one proposed approach
to the I&EC annular fuel rods is through pressed and sintered annular pellets. Such a
manufacturing approach has been considered previously in France with the Advanced
Plutonium Assembly, which used large I&EC plutonium-fueled rods in place of four U0 2
pins in a 17x17 PWR assembly [Puill et al., 2001].
Sintered annular pellets are able to achieve the same density as standard sintered pellets,
but are more difficult to manufacture with the appropriate tolerances on the outer and
inner surfaces. In addition, asymmetry of the pellet-cladding gaps is a point of concern
[Puill 2001]. Such asymmetries may occur due to thermal expansion of the fuel, which
will tend to close the outer fuel-cladding gap first. This closure will cause the gap
conductance to be much larger on the fuel's outer surface, and correspondingly the heat
flux through the fuel rod's outer diameter will increase. A higher heat flux will have
safety implications, as it reduces the Departure from Nucleate Boiling Ratio (DNBR).
DNBR has an NRC regulated minimum, and that would be a limiting factor for the
sintered annular fuel's performance in a PWR. Similarly, in Boiling Water Reactor there
would be concerns over exceeding channel heat flux limits. Possible methods for
alleviating this problem are increasing the initial outer radial gap, decreasing the thermal
conductivity of the outer gap, adding highly conductive bonding filler in place of the gap
cover gas, or decreasing the inner gap [Yuan et al., 2004].
The recent MIT design for I&EC annular fuel with sintered annular pellets, shown in
Figure 1.2, was analyzed for use in a PWR in 13x13 assemblies [Yuan et al., 2004]. In a
collaboration between Gamma Engineering Corporation, MIT, and Westinghouse
Electric Corporation, these pellets were successfully manufactured by Westinghouse in
2003. These pellets, which are shown in Figure 1.3, were made to demonstrate the
mechanical and economic feasibility of creating sintered UO2 pellets, and that the
manufacturing was within the scope of current pellet fabrication facilities [Kazimi, 2003].

- Coolant
Outer Cladding
- Fuel
Inner Cladding
L
Figure 1.2 Schematic of I&EC Sintered Annular Pellet Fuel for a 13x13Assembly.
Figure 1.3 Sintered Annular Pellets Produced by Westinghouse [Kazimi,2003].
1.3.2 VIPAC Fuel
An alternative to the use of sintered pellets is Vibration Packed (VIPAC) fuel, which
consists of fuel grains that are compacted into the fuel rod via vibration and compressive
22
L
14.1mm
9.9mm
IF

impacts. These grains are obtained by crushing and milling sintered fuel forms, then
sorting the resulting shards by diameter. This technique has been used to create MOX and
UO2 fuel for irradiation in the U.S. and Russia [Yuan et al., 2004].
The main benefits of VIPAC fuel are easy loading of the annular geometry, elimination
of the fuel-cladding gap, and simple fuel manufacturing. The simple manufacturing of the
VIPAC grains and straightforward process for loading the fuel rod are key advantages
over the sintered pellets, and these factors could translate into an economic incentive for
using VIPAC fuel. Since there is no fuel-cladding gap the initial thermal resistance at that
interface is significantly reduced [Yuan et al., 2004]. This addresses the asymmetry
problem found with sintered pellets while at the same time lowering the average fuel
temperature. In addition, VIPAC fuel irradiation have shown less chemical and
mechanical interaction with the inside surface of the cladding than pelletized fuel.
The difficulty with VIPAC is achieving acceptable fuel smear densities, at least
equivalent to those of sintered pellets. A high smear density is important both to
maximize fuel loading and to achieve the highest possible thermal conductance in the
fuel. VIPAC fabrication techniques have achieved up to 86% of theoretical density (TD),
compared to the standard sintered pellet density of 94% TD [Icenhour, 2005]. It is
possible that the density could be increased further through selection of different grain
sizes, grain mixing ratios, packing steps, and additives such as powdered uranium metal.
The I&EC annular fuel rod designed by MIT with sintered annular pellets was also
analyzed for use with VIPAC fuel. The inner and outer dimensions of the rod are the
same, however because of the nature of VIPAC fuel there are no gaps between the fuel
and cladding, as shown in Figure 1.4 [Yuan et al., 2004].
In addition, in 2003 a four-foot long I&EC VIPAC annular fuel rod was manufactured by
the Atomic Energy of Canada, Ltd. (AECL) Chalk River Laboratory to the MIT-specified
annulus dimensions. By using two size categories of fuel granules (25-53 tm and 250-

595 Rm), and packing by impacting the fuel rod and using an annular tamping rod, AECL
was able to achieve up to 76.9% TD [Kazimi, 2003].
9.77
7 Coolant
Outer Cladding
SFuel
Inner Cladding
Figure 1.4 Schematic of I&EC VIPAC Annular Fuel for a 13x13 Assembly[Kazimi, 2003].
1.4 MIT I&EC Annular Fuel Irradiation Program
As part of a US Department of Energy sponsored program, six I&EC fuel rods, shown in
Figure 1.5, were manufactured by AECL for irradiation in the MIT reactor. These fuel
rods contained 5% enriched UO2 in VIPAC grains, and three had uranium metal powder
added to increase the smear density. The purpose of this irradiation was to investigate the
behavior of the fuel as a result of the annular geometry and VIPAC fuel form. In
particular, the goals were to examine the temperature difference between the inner and
outer cladding surfaces, as well as the temperature behavior with burnup. Other
parameters of interest were fission gas release, fuel swelling and relocation, and average
burnup [Kazimi, 2003].
14.2mm

Figure 1.5 I&EC VIPAC Annular Fuel Rods Manufactured for Irradiation inMITR-II [Kazimi, 2003].
The geometry of these fuel rods was slightly different than the 13x13 design specified
earlier by MIT because of manufacturing constraints and the need to enclose the cladding
in a secondary containment before irradiation. The fuel rods were 3.94" long with a 2.76"
active fuel length; the fuel region had an OD of 1.17" and an ID of 0.93". By using two
grain sizes (25-53 pm and 250-500 ipm) AECL was able to achieve a smear density of up
to 82% TD in the U0 2-only fuel rods, and 87.5% TD in the fuel rods with 15% uranium
metal powder added [AECL, 2003].
Two of the UOz2-only fuel rods were irradiated in the core of the MIT reactor from March
to September of 2004 inside of specially designed I&EC aluminum capsules [Kazimi et
aL, 2004]. The top of the capsule assembly is shown in Figure 1.6. The inside and outside
surfaces of these capsules were instrumented with thermocouples to allow the
temperature at the inner and outer cladding to be monitored during irradiation, and cover
gas from inside of the aluminum capsule was periodically sampled to measure any fission
gasses escaping from weld imperfections.
After irradiation, the two annular fuel rods were removed from the core and placed in
underwater storage for one year to allow for cooling and decay. In August of 2005, both
25

irradiated capsules were removed from storage and underwent a post-irradiation
examination at MIT. The design, results, and an analysis of this examination is presented
in Chapter 6 of this report. In the future, these capsules may be sent to the Idaho National
Laboratory's Hot Fuel Examination Facility for further analysis.
Top of CapsuleAssembly
Figure 1.6 I&EC VIPAC Annular Fuel Irradiation Rig Installed in the Core ofthe MITR-II.
1.5 Silicon Carbide
1.5.1 Background of SiC Development
Silicon Carbide (SiC) has been considered for use in high-temperature, high-radiation
environments since first investigated by Rovner and Hopkins in 1976 as a first wall
material for fusion reactors [Rovner, 1976]. It has also been considered as structural
coating on fuel kernels for high temperature gas-cooled reactors for many years [CEGA,
1993], and as an inert matrix for fuel pellets [Alkan et al., 2001]. Pure SiC has attractive
properties when compared to available metal alloys, primarily as a consequence of
relative stability up to tens of Displacements per Atom (DPA). Unlike metals, it

experiences minimal swelling or loss of strength, does not creep below 10000C, and is
less prone to degrading chemical interactions. Importantly for fission energy applications,
it also has a small neutron absorption cross section [Hasegawa, 2000].
SiC can be manufactured using several different processes, although the one of most
interest for nuclear applications is Carbon Vapor Deposition (CVD) because it is able to
produce a high-purity SiC layer. This process involves reacting silicon and carbon
compounds, often in gaseous form, with hydrogen at high temperatures. This has been
used to coat fuel particles, but can also be used to create bulk solids [Brook, 1991].
A significant issue when considering SiC as a moderate temperature (<10000 C) structural
material is primarily its brittle fracture characteristic. The small elastic yield is significant
when it must operate up to PWR core temperatures and pressures, around 3000 C and 15
MPa, since it cannot dissipate accumulating external stresses (from irradiation swelling
and thermal expansion of other materials, or fission gas release) through creep. A second
difficulty is the degradation of SiC thermal conductivity with DPA. Although
stoichiometric SiC has excellent thermal conductivity, after only one DPA the thermal
conductivity will saturate at a much lower value due to accumulation of microstructure
defects, typically to 2-8 W/m-K. This is significantly less than other common reactor
materials exposed to similar conditions, such as Zircaloy [PNNL, 2002].
1.5.2 SiC Composites
In order to create large SiC structures, as well as to increase bend strength, SiC/SiC
composite materials were developed. The composite consists of SiC fibers arranged
parallel or braided, and then bonded with an SiC matrix. There are several fabrication
techniques, depending on the method of matrix infiltration, but the two of most interest in
this work are Carbon Vapor Infiltration (CVI) and Polymer Impregnation Pyrolysis (PIP)
[Hasegawa, 2000]; both methods create a high purity SiC matrix between the fibers. The
fibers provide large tensile strength and the ability to withstand localized fractures
without completely failing the structure. The matrix provides stability while allowing the

fibers some ability to flex, meaning the composite will have significantly more yield
perpendicular to the fiber axis than a solid structure.
The mechanical benefits of the composite are balanced by the creation of a less dense,
porous structure, with a lower thermal conductivity. In addition, because the fibers
generally contain impurities of free silicon and carbon, as well as nitrogen or oxygen
additives, there tends to be a difference in irradiation swelling behavior between the
matrix and the fibers that must be considered.
1.5.3 Advanced Clad ProjectA collaboration organized by Gamma Engineering, and involving the MIT Center for
Advanced Nuclear Energy Systems (CANES), is investigating the use of SiC as a fuel
rod cladding material for Light Water Reactors (LWRs). This concept involves the use of
a duplex design, which combines an SiC monolith and an SiC/SiC woven composite to
create a cladding tube where the SiC duplex replaces the traditional Zircaloy cladding.
An example of this duplex design is shown in Figure 1.7. The monolith provides for
containment of fission gasses while the composite provides additional strength and
protection of the monolith surface.
Coolant
Composite
-Monolith
Fuel Space
Figure 1.7 Example SIC Duplex Solid Fuel Rod.

There is interest in using SiC as a cladding material because it maintains strength even at
high temperature (>10000C), has a small neutron absorption cross section, and in general
has good property performance to high DPA. It is expected that these characteristics will
allow higher allowable cladding temperatures, and in particular, better transient and
accident performance, and power uprates. In addition, the stability of its physical
properties under extended irradiation and ability to contain larger internal pressures
without creeping outward may enable the extension of the fuel rod's maximum allowable
burnup.
The MIT part of the current collaboration involves modeling the behavior of SiC duplex
cladding in LWRs using several computer codes, including the steady-state thermo-
mechanical code FRAPCON, which is covered in Chapters 2 through 5 of this report.
Other modeling work is to include transient and accident analysis using the codes
FRAPTRAN and RELAP. In addition to the computer modeling, this project also
includes the irradiation of various duplex cladding designs for at least three months in the
MIT reactor under PWR conditions. After irradiation, the samples will undergo PIE both
at MIT and at Oak Ridge National Laboratory. The purpose and design of this experiment
is covered in more detail in Chapter 7 of this report.
1.6 FRAPCON Computer Code
The FRAPCON-3 steady state fuel rod modeling code was developed by the Pacific
Northwest National Laboratory for use by the U.S. Nuclear Regulatory Commission in
evaluation of LWR fuel rod behavior up to a burnup of 65 MWd/kgU. The code models
the fuel and cladding of a single fuel rod, and calculates temperature distributions, stress
and strain, fission gas release, cladding oxidation, and other physical behavior as a
function of an input power history and core conditions [Berna et al., 1997].
FRAPCON is a deterministic code that relies on a combination of theoretical and
empirical relations to determine the properties of the fuel rod only at discreet time steps,where the step interval is generally days to weeks. The code's predictions have been
29

benchmarked against experimental irradiation data, and it is expected to provide
characteristic results for limited variations on traditional fuel rod design and operating
conditions.
The use of an I&EC annular fuel rod geometry, VIPAC fuel, and SiC cladding, as
investigated in this report, are all outside the scope of FRAPCON's original
programming. Adding these features requires modification of the source code and has
resulted in the creation of several distinct versions of FRAPCON at MIT. The
modifications made to FRAPCON to incorporate SiC cladding are discussed in Chapter 3
of this report. Pertinent modifications made by previous researchers, and other official
updates to the source code are discussed in Chapter 2.
1.7 Thesis Organization
This thesis covers both theoretical and experimental investigation relevant to the
development of a new fuel design for fission reactors: the development of computer
based SiC-clad fuel rod models for evaluation, and the design and evaluation of
experimental studies of the proposed fuel, fuel rod geometry, and cladding materials.
In Chapter 2, the general structure and solution routine of the FRAPCON steady-state
fuel rod modeling code is discussed. Several major modifications to the code relevant to
this project are also discussed, involving the implementation of I&EC annular fuel,
VIPAC fuel, MOX fuel, and improved modeling at high burnup.
In Chapter 3, new FRAPCON routines that were created to model SiC cladding are
discussed and compared to the available data. These changes include all of the material
properties, with particular focus on thermal conductivity, thermal expansion, and
irradiation swelling.
In Chapter 4, the newly created version of FRAPCON with SiC cladding is used to model
fuel rods under typical reactor operating conditions and conditions of special interest,30

such as high power density and high burnup. In addition, possible avenues for enhancing
the performance of the SiC-clad fuel rod are explored, such as variation of fill gas
pressure, use of annular pellets, different assembly configurations, and MOX fuel.
In Chapter 5, the SiC cladding models are applied to the I&EC annular fuel version of
FRAPCON in order to investigate the benefits of this combined construction. There is a
discussion and analysis of the modeling of both VIPAC fuel and sintered annular pellets.
In Chapter 6, the post-irradiation examination of prototype I&EC annular fuel rods is
discussed. This section covers both the design of the PIE station at the MIT reactor and
results of the examination of two irradiated fuel rods. The fuel rods were examined
visually and were analyzed using gamma spectroscopy to infer fuel distribution and
swelling, burnup, and fission gas release.
In Chapter 7, the design and construction of a test rig for the irradiation of SiC cladding
samples is discussed. This rig is designed to allow irradiation of multiple samples of un-
fueled cladding in PWR pressure, temperature, and chemistry conditions in the core of
the MIT reactor. In addition, groups of samples can be removed from the rig in MIT hot
cell facilities after irradiation, and the rig returned to the core with some new samples for
continued irradiation.
In Chapter 8, the results of this thesis research will be summarized and possibilities for
future investigation of the topics covered in this work will be proposed.

2. Fuel Rod Modeling in FRAPCON
2.1 Code Structure
The FRAPCON computer code couples the thermal and mechanical behavior of a single
LWR fuel pin during irradiation at a specified linear heat generation rate under specified
core conditions. It arrives at a solution through the use of empirical models for fuel and
cladding properties, which feed into theoretical calculations of temperature distributions
and physical (mechanical, chemical, and nuclear) responses. It then iterates this process
to find the steady-state behavior of the fuel rod after a given segment of irradiation
history [Berna et al., 1997]. A simplified version of the FRAPCON solution scheme is
shown in Figure 2.1.
V
="L-
L,
F•.5;P.
w
.r
Figure 2.1 Simplified Flow Chart of FRAPCON-3 Iterative Solution Scheme[Berna et al., 1997].
32

The required code inputs include fuel and cladding geometry, fuel enrichment, primary
coolant conditions, and the listing of the neutron flux, linear heat generation rate, and
axial power shape at each time step. The user also inputs a mesh sizing for FRAPCON's
finite difference calculations of pellet heat conduction and fission gas release. FRAPCON
takes these inputs and then uses a pre-defined set of relations for UO2 or MOX pellets
and Zircaloy cladding to calculate physical properties during each iteration. In order to
specify new material behavior, the subroutines controlling the desired property must be
modified and the code re-compiled.
2.1.1 Implementation of I&EC Annular Fuel
The FRAPCON-3 source code was modified by Yi Yuan [Yuan et al., 2004] to model
I&EC annular fuel rods with Zircaloy cladding, and both sintered annular pellets and
VIPAC fuel. This modified code was then used to analyze the behavior of the new fuel
rod geometry and fuel forms, and to conduct parametric studies on the fuel rod design.
The changes that were made to the source code can be generalized into seven areas:
* Radial fuel temperature profile calculation
* Fuel-cladding interaction model
* Heat flux and coolant flow models
* Fission gas release
* Fuel dimensional changes
* Radial power profile
* Cladding conditions
These modifications were focused on adding parameters for the simultaneous calculation
of the inner and outer cladding and fuel behavior where previously only the outer surface
was of concern, as well as new physical models to account for the increased moderation
in the inner coolant channel.

2.1.2 Implementation of VIPAC Fuel
As a part of the implementation of the I&EC annular fuel models in FRAPCON, models
for VIPAC fuel were added [Yuan et al., 2004]. In some ways, the VIPAC fuel models
resemble sintered pellets operating in a closed fuel-cladding gap regime, with some
differences based on the interaction of individual fuel grains. The VIPAC fuel model
differs from the solid sintered pellets and solid annular sintered pellets in the same basic
ways: the inner and outer fuel-cladding gaps are always closed, fuel radial relocation is
removed, thermal expansion serves to contract the inner annulus as well as expand the
outer diameter, and fission gas released is enhanced in proportion to total exposed grain
surface area.
2.1.3 Implementation of Updated UO2 and MOX Fuel Models
The organization responsible for the development of FRAPCON, Pacific Northwest
National Laboratory, issued an update for FRAPCON-3 in May 2005 [Lanning et al.,
2005]. This update, FRAPCON-3.3, included several changes relevant to this work
including updates to models for the properties of urania and MOX fuel. Because these
changes increase the accuracy of the code's predictions, it was desirable to incorporate
these changes into the versions of FRAPCON created for I&EC annular fuel with
sintered pellets and VIPAC fuel.
The changes to the urania fuel models incorporate relations based on newly available
experimental data. Both the urania thermal conductivity and fission gas release models
were modified to better reflect data at higher temperatures and burnup (>2500 K and 30
MWd/kgU).
The update also contains changes to many of the MOX fuel models, which are receiving
attention due to renewed interest in MOX use in LWRs. A significant amount of new data
has become available worldwide from MOX irradiations, and the target MOX plutonium
composition has decreased. To reflect this new information, the following models were
updated: MOX thermal conductivity, fission gas release and He production, swelling and
thermal expansion, and radial power profile [Lanning et al., 2005].34

In addition to these model-specific changes, varieties of other small changes were made
to correct errors or oversights in the previous release version of FRAPCON.
2.1.4 Implementation of High-Burnup Fission Gas Release ModelThe recommended maximum burnup in FRAPCON, based on the data used for the
creation of the fuel thermal and mechanical properties and fission gas release, is 62
MWd/kgU, which provides sufficient coverage of expected burnup in current generation
LWR fuel pins [Lanning et al., 2005]. However, in this investigation there is interest in
extension of the maximum burnup because of the combination SiC cladding's good
radiation tolerance and the improved performance of I&EC annular fuel (i.e. lower fuel
and cladding temperatures). It is thought that these factors could allow LWRs to achieve
burnup up to 100 MWd/kgU.
An investigation into the possibility of using FRAPCON to model fuel rods into this very
high burnup regime was performed by Yun Long at MIT [Long, 2002]. In the course of
this research, fission gas release was identified as a driving parameter for fuel rod
performance at high burnup; however, the current FRAPCON predictions did not agree
well with measured data at very high burnup. As a result, several modifications were
made to the urania fission gas release model to conform better to the current
phenomenological understanding of fission gas release, and replicate experimental
release data at very high burnup more accurately.
The new models explicitly treat the buildup of fission gasses in the rim region of the
pellets, and threshold release caused by fission gas saturation at high burnup. In
particular, the threshold release model replaces the standard athermal model, which
treated fission gas release as linear at high burnup.

2.2 Benchmarking of Updates
2.2.1 FRAPCON-3.3 with High Burnup ModificationsAs the first part of this investigation, Yun Long's changes to FRAPCON concerning
fission gas release in UO2 at high burnup were incorporated into the latest release of
FRAPCON, version 3.3. This new version, hereafter referred to as FRAPCON-3.3HB,
was used as the basis for the development of all other FRAPCON versions used in this
project.
In order to evaluate the performance of this new code, an input case was developed based
on data from an experimental campaign measuring fission gas release up to high burnup.
A recent study of the effect of high burnup on U0 2 was conducted by Manzel and Walker
in Germany [Manzel and Walker, 2000]. In this study, a group of similar fuel rods was
tracked in Siemens PWRs. In order to reach extended burnup these rods were removed
from spent assemblies and placed into a fresh assembly, then irradiated for another series
of burnup cycles. During each refueling, some rods were removed from this cycle and
destructively examined for microstructure changes and fission gas release. In this way,
some fuel rods were irradiated to a maximum burnup of over 100 MWd/kgU. From this
study, fission gas release data is available for average fuel rod burnup between 19 and 98
MWd/kgU.
Data given by Manzel and Walker concerning linear heat generation rate, enrichment,
irradiation cycles, and fuel rod construction was incorporated into a FRAPCON input
file. However, insufficient data on certain factors, such as coolant characteristics and
neutron flux, were given to completely specify the required input, and therefore
additional data had to be obtained from other sources. The missing information was
incorporated from FRAPCON input data supplied by Pacific Northwest National
Laboratory on a reactor similar to the Siemens PWRs, the Oconee plant, a Babcock and
Wilcox PWR utilizing 15x15 assemblies with fuel rod dimensions nearly identical to the
Siemens design. The fuel and cladding properties used in this input file, hereafter referred

to as the "Manzel" test case, are given in Table 2.1. The axial power shape is the Oconee
mid-life profile, which has a peaking factor of 1.12.
Table 2.1 Initial Fuel and Cladding Properties for the Manzel Test Case.
Dimension Units ValueCladding outside diameter cm (in.) 1.09 (4.30x10 -'Cladding inside diameter cm (in.) 9.58x10 - (3.77x10 -1
Cladding thickness mm (in.) 6.73x10 - (2.65 x10 -2)
Clad arithmetic mean roughness mm (mils) 5.00x10 (1.97 x10 -2)
Diametral gap thickness mm (mils) 2.54x10- (10.0)Fuel pellet diameter cm (in.) 9.32xl0-1 (3.67x10 -l)
Fuel stack height m (ft.) 3.58 (11.8)U-235 enrichment at% in U 3.85Fuel rod pitch cm (in.) 1.42 (5.60x10 -1)
Channel equivalent diameter cm (in.) 1.27 (4.99x10 - )
The Manzel input case was run in three versions of FRAPCON for comparison: the most
recently released version (FRAPCON-3.3), the version created by Yun Long
incorporating a new high burnup fission gas release model (FRAPCON-3.2HB), and the
new version created for this study that combines the new fission gas release model with
release version 3.3 (FRAPCON-3.3HB). The average rod linear heat generation rate at
each time step for this input is given in Figure 2.2.

0a,
-Im4.
0 500 1000 1500 2000 2500 3000 3500
Time (days)
Figure 2.2 Average Linear Heat Generation Rate for the Manzel Test Case.
The fission gas release calculated by each of these three versions of FRAPCON is
presented in Figure 2.3, where the data from Manzel and Walker are approximated by a
solid line with error bars showing the approximate scatter in the data. Up to about 70
MWd/kgU, all three codes predict a similar fission gas release fraction, within 5%.
However, at this burnup the effect of the new fission gas release model is apparent; there
is an exponential increase of gas release with burnup in the modified versions of
FRAPCON compared to a nearly linear dependence in FRAPCON-3.3, which is based on
the athermal release model.
Above 70 MWd/kgU there is a dramatic disparity between the two models, with the
modified code comparing well with the measured data with about 25% release by 100
MWd/kgU; FRAPCON-3.3 under predicts this release by almost 70%. This disparity is
especially significant at very high burnup when there is a large inventory of fission gas in
the fuel, so that the fraction released contributes a greater amount to pressurization of the
rod.

30
25
j20
£15
10
5
00 20 40 60 80 100 120
Bumup (MWdIkg)
Figure 2.3 Fission Gas Release for Different Versions of FRAPCON Basedon the Manzel Test Case.
The small difference between the fission gas release predicted by FRAPCON-3.2HB and
FRAPCON-3.3HB can be attributed to the modifications made by the code's developers,
discussed in section 2.1.3, to the urania thermal conductivity and fission gas release
model.
2.2.2 I&EC Annular Fuel with Sintered Annular Pellets Modifications
In the same way that Yun Long's very high burnup fission gas release model was
addressed in the previous section, the I&EC annular fuel model was integrated into
FRAPCON-3.3HB. Yi Yuan, who created this model [Yuan et al., 2004], made two
separate versions of the I&EC annular fuel code: one to handle sintered annular pellets
(FRAPCON-SA), and a second for VIPAC annular fuel (FRAPCON-VA). These two
versions of the code were used to create two new versions incorporating the version 3.3
FRAPCON updates and the high burnup fission gas release modifications to create
FRAPCON-3.3HB-SA and FRAPCON-3.3HB-VIPAC.
In order to evaluate the new solid annular version of FRAPCON, an input file developed
by Yi Yuan [Yuan et al., 2004] to evaluate I&EC fuel performance in current PWRs was
used. This case (hereafter referred to as SA-100) represents an I&EC annular fuel rod of
the 13x13 MIT design. It is irradiated under conditions equivalent to standard fuel rods in39
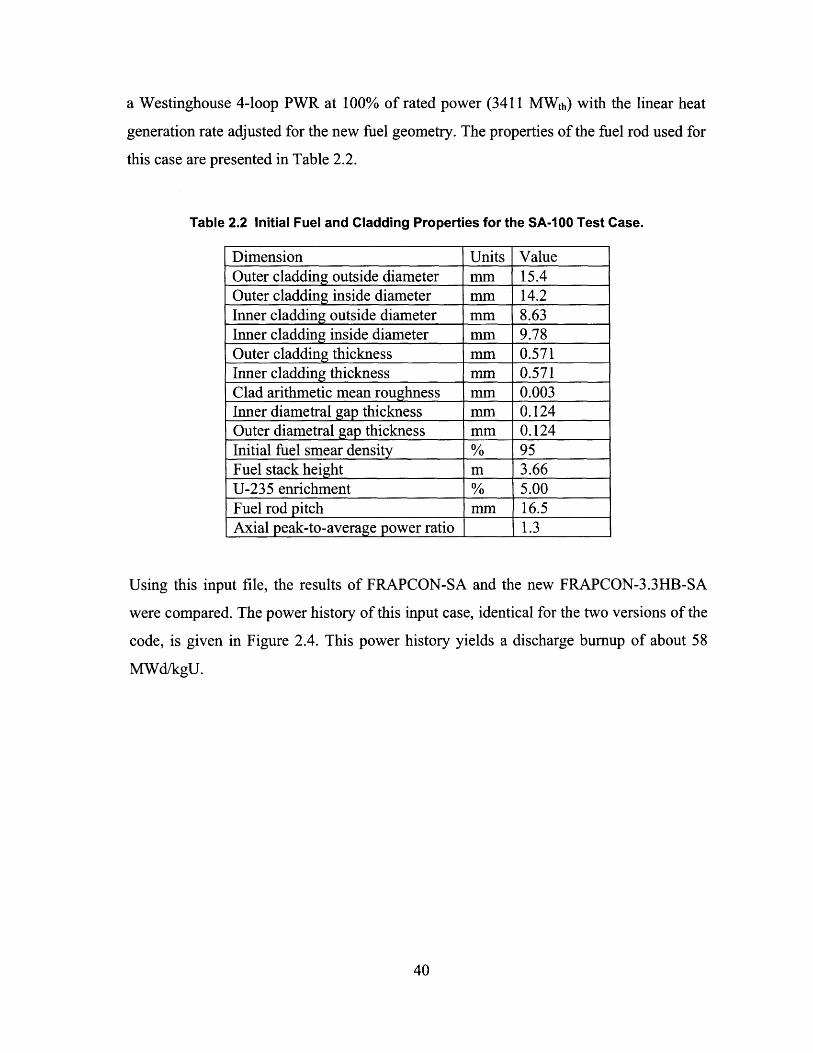
a Westinghouse 4-loop PWR at 100% of rated power (3411 MWth) with the linear heat
generation rate adjusted for the new fuel geometry. The properties of the fuel rod used for
this case are presented in Table 2.2.
Table 2.2 Initial Fuel and Cladding Properties for the SA-100 Test Case.
Dimension Units ValueOuter cladding outside diameter mm 15.4Outer cladding inside diameter mm 14.2Inner cladding outside diameter mm 8.63Inner cladding inside diameter mm 9.78Outer cladding thickness mm 0.571Inner cladding thickness mm 0.571Clad arithmetic mean roughness mm 0.003Inner diametral gap thickness mm 0.124Outer diametral gap thickness mm 0.124Initial fuel smear density % 95Fuel stack height m 3.66U-235 enrichment % 5.00Fuel rod pitch mm 16.5Axial peak-to-average power ratio 1.3
Using this input file, the results of FRAPCON-SA and the new FRAPCON-3.3HB-SA
were compared. The power history of this input case, identical for the two versions of the
code, is given in Figure 2.4. This power history yields a discharge burnup of about 58
MWd/kgU.

--- FRAPCON-SA
-- FRAPCON-3.3HB-SA
a-
H-n&.o;...BCEEEE
500 1000 1500EFPD
Figure 2.4 Linear Heat Generation Rate for Original and Updated FRAPCONI&EC with Sintered Annular Pellets.
800
780
760
740720
700680
660
640620
6000 10 20 30
Bumup (MWdlkgU)
40 50 60
Figure 2.5 Average Fuel Temperature for Original and Updated FRAPCONI&EC with Sintered Annular Pellets.
The average fuel temperature for both of these cases decreases in steps as the power level
changes, as shown in Figure 2.5, and slowly rises over each step mainly due to fission gas
release and cladding oxide buildup decreasing the efficiency of heat conductance through
the rod. The temperature behavior up to the first 10 MWd/kgU is more complex as the
I

inner and outer fuel cladding gaps close, increasing gap conductance, shown in Figure 2.6
for the outer fuel-cladding gap and Figure 2.7 for the inner gap.
5.0E+04
4.5E+04
4.0E+04
3.5E+04
3.0E+04
2.5E+04
2.0E+04
1.5E+04
1.OE+04
5.0E+03
O.OE+00
/ ]
- FRAPCON-SAS- -- FRAPCON-3.3HB-SA
0 10 20 30Bumup (MWdlkgU)
40 50 60
Figure 2.6 Outer Gap Conductance for Original and Updated FRAPCONI&EC with Sintered Annular Pellets.
r
---
---- FRAPCON-SA
-* FRAPCON-3.3HB-SA
'
40 50 6010 20 30Burnup (MWdikgU
Figure 2.7 Inner Gap Conductance for Original and Updated FRAPCONI&EC with Sintered Annular Pellets.
The gaps close by 20 MWd/kgU, causing a sudden increase in the gap conductance in
both codes, however the gap conductance model in FRAPCON-3.3HB-SA predicts a
6.0E+04
5.0E+04
. 4.OE+04
• 3.OE+04
0 2.OE+04
j 1.OE+04
0.OE+00
L -I MIR%
_a~-n-~

higher final conductance due to the changes introduced in the version update. In
particular, the conductance drops as the fission gas release, shown in Figure 2.8,
increases. The athermal fission gas release model in the original code predicts a linear
release past 40 MWd/kgU, whereas the new version has yet to reach the threshold for its
exponential release.
1.8
1.6
1.4
1.2
1
0.80.60.4
0.2
00 10 20 30 40 50 60
Bumup (MWdlkgU)
Figure 2.8 Fission Gas Release Fraction Predicted by Original and UpdatedFRAPCON I&EC with Sintered Annular Pellets.
1.424
1.422
1.421.418
E1.416
E 1.414
P 1.412
1.41
1.408
1.406
--- FRAPCON-SA
- FRAPCON-3.3HB-SA
30Bumup (MWdlkgU)
10 20 40 50 60
Figure 2.9 Outer Cladding Inner Diameter Predicted by Original andUpdated FRAPCON I&EC with Sintered Annular Pellets.
I

0.996
0.994
0.992
E 0.99
0.988ES 0.986
0.984
0.9820 no
- -FRAPCONSA
--- FRAPCON-3.3HB-SA
-I - I I I 1~il l
0 10 20 30 40 50 60Bumup (MWdlkgU)
Figure 2.10 Inner Cladding Inner Diameter Predicted by Original andUpdated FRAPCON I&EC with Sintered Annular Pellets.
The dimensional changes of the cladding in each model correspond well with each other;
both the inner and outer cladding creep down onto the fuel, then expand as the fuel swells
outward. The new FRAPCON model predicts a larger amount of cladding creep down
because there is less fuel swelling, which is manifested as a smaller cladding outer
diameter.
2.2.3 I&EC Annular Fuel with VIPAC Fuel Modifications
An input file similar to SA-100 was developed by Yi Yuan [Yuan et al., 2004] for an
I&EC annular fuel rod with VIPAC fuel corresponding the MIT design dimensions and
loading. This input file, VA-100, corresponds to conditions in a standard Westinghouse
PWR operating at 100% of rated power (3411 MWth) with the linear heat generation rate
adjusted for a 13x13 assembly size. The properties of the fuel rod used in this analysis are
given in Table 2.3. Note that the VIPAC version of FRAPCON only supports a single
grain size, whereas in experimental VIPAC fuel fabrication multiple grain sizes are used
to increase the packing density.

Table 2.3 Initial Fuel and Cladding Properties for the VA-100 Test Case.
Dimensions Units ValueOuter cladding outside diameter mm 15.4Outer cladding inside diameter mm 14.2Inner cladding outside diameter mm 8.63Inner cladding inside diameter mm 9.78Outer cladding thickness mm 0.571Inner cladding thickness mm 0.571Clad arithmetic mean roughness mm 0.003Fuel particle diameter 9m 400Initial fuel smear density % 85Fuel stack height m 3.66U-235 enrichment % 5.00Fuel rod pitch mm 16.5Peak-to-average power ratio 1.3
The power profile used in Annular-100 test case is the same as that shown in Figure 2.2
for the sintered annular pellets. In this case, the behavior of the fuel is more
straightforward since both fuel-cladding gaps are always closed. The average fuel
temperature for each case, shown in Figure 2.11, shows very close agreement between
the old and new version of the code. Toward the end of life, the fuel temperatures diverge
slightly as the athermal fission gas release model in FRAPCON-VA activates, shown in
Figure 2.12.

780
760
740
8 720
& 700E
i.-
680
660
64010 20 30
Burnup (MWd/kgU)50 60
Average Fuel Temperature Predicted by Original and UpdatedFRAPCON I&EC with VIPAC Fuel.
0 10 20 30 40Burnup (MWdlkgU)
Fission Gas Release Fraction Predicted byUpdated FRAPCON I&EC with VIPAC Fuel.
50 60
Original and
The mechanical behavior predicted by the two codes is also in very good agreement, as
shown in Figure 2.13 for the fuel outer diameter and Figure 2.14 for the fuel inner
diameter. There is a slight initial contraction of the fuel due to densification, and then
swelling causing the cladding to creep outward at approximately the same rate on the
--- FRAPCON-VIPAC
-- FRAPCON-3.3HB-VIPAC
• .•,• "-
Figure 2.11
3
2.5
2
= 1.5
1
0.5
0
Figure 2.12
ill r

inner and outer surface. This behavior is particular to VIPAC fuel, where the swelling of
fuel grains will strain both the inner and outer diameter.
1.43
1.425
1.42
1.415
1.410 10 20 30 40 50 60
Burnup (MWd/kgU)
Figure 2.13 Fuel
0.985
0.985
0.98
0.975
0.97
Outer Diameter Predicted by Original and UpdatedFRAPCON I&EC with VIPAC Fuel.
0 10 20 30 40 50 60Bumup (MWdlkgU)
Figure 2.14 Fuel Inner Diameter Predicted by OriginalFRAPCON I&EC with VIPAC Fuel.
and Updated

2.3 Integration of SiC Cladding
Although SiC has been investigated for use in fusion and gas-cooled fission reactor
applications, there is not a large amount of data on its performance under irradiation in
LWR conditions. Research has been conducted to identify the properties of SiC and SiC
composites under conditions of interest such as temperature, fluence, and stress, and this
information can be compiled to achieve an empirical approximation of the behavior under
these conditions simultaneously. This approach to modeling fits well within the structure
of the FRAPCON code, as each cladding property is handled by a separate subroutine.
This project introduces additional complications, since the duplex cladding involves the
interaction of two distinct cladding layers: a solid monolith, and the fiber-matrix
composite. To limit the scope of this thesis, it was decided to focus on the behavior of the
composite, since it is hoped this structure will provide the majority of the strength of the
fuel rod, and because it will be directly exposed to the reactor coolant. This simplification
allows the cladding to be treated normally, as a single homogeneous cylinder. In addition,
by assuming the SiC cladding behavior is governed by the same theoretical relations,
such as mechanical response to stress and strain, as the zirconium-based cladding, the
magnitude of changes to the FRAPCON code are minimized. This approximation is
further aided by the limited scope of the cladding behavior allowed in FRAPCON, since
in a reactor only minimal deformation of fuel rod is permitted.

3. General Silicon Carbide Cladding Model Development
3.1 Design Parameters
Over its operational lifetime, the fuel cladding in an LWR is subjected to a range of
conditions that evolve from insertion to discharge. Early in life there are the highest
temperatures, initial swelling, and restructuring of the fuel. Later in life the temperatures
decrease but fuel-cladding mechanical interaction is more pronounced, the cladding is
embrittled with hydrogen uptake and its thickness is reduced by oxidation, and there is
more stress from fission gas buildup within the fuel and the fuel rod. Based on these
considerations, a design envelope for the SiC clad was developed, and is given in Table
3.1; models created for this investigation therefore should be accurate at least within this
range of variables.
Table 3.1 Design Ranges for SiC Property Models.
Condition Max MinTemperature 1000 K 300 KRadiation Damage 50 DPA 0 DPAFiber Material Stoichiometric SiC SiC-based fibers (various impurities)Matrix Material Stoichiometric SiC
In the development of the SiC cladding property models, a specific set of materials of
interest were identified based on the LWR operating criteria as well as progress in
development and manufacturing of nuclear grade SiC. In general, these materials are
defined as high purity and high density SiC. Also, although this modeling is focused on
the composite, because the ultimate goal of the Advanced Clad Project is modeling of
duplex cladding, it is necessary to quantify the behavior of both the monolith and the
composite and to identify any significant differences. Based on a review of the literature
on the manufacturing and evaluation of SiC and SiC composites, a listing of the materials
of interest was compiled; the fibers are listed in Table 3.2 and monolith materials in
Table 3.3.

Table 3.2 SiC Fibers of Interest [Ichikawa and Ishikawa, 2000 and Osborneet al., 1998].
Name Manufacturer Elemental CompositionHi-Nicalon Nippon Carbon Si, C, OHi-Nicalon Type S Nippon Carbon Si, C, OSylramic Dow Coming Si, C, O, B, N, TiTyranno SA UBE Industries Si, C, Al
Table 3.3 SiC Monolith Materials of Interest [Snead et al., 2005].
Name ManufacturerMorton CVD Rohm and HaasHexoloy-SA CarborundumGE SiC General Electric
3.2 Model Implementation
The changes discussed below modify the properties of the FRAPCON cladding model in
order to simulate the behavior of SiC cladding. As discussed above, these new models
will focus on the behavior of the SiC fiber-matrix composite, which is assumed to
comprise the entire thickness of the cladding.
Each of these models was implemented in a new version of FRAPCON called
FRAPCON-SiC. This version is based on FRAPCON-3.3HB, which was discussed in
Chapter 2, and therefore already includes updates to the fuel behavior at high burnup.
3.3 SiC Thermal Conductivity
3.3.1 Background
The thermal conductivity of the cladding is important because it helps to determine the
temperature of the fuel, which controls swelling, strength, and fission product transport.
A higher thermal conductivity will decrease both the average cladding temperature as
well as the average fuel temperature, and in general lead to better performance over the

fuel rod lifetime. The FRAPCON-SiC thermal conductivity model is particularly
important in this investigation because the difference in conductivity behavior in Zircaloy
and SiC may have a dramatic effect on long-term fuel rod performance.
Because of the lack of conduction shell electrons, thermal conduction in ceramics such as
SiC is predominantly by phonon transport. Despite this fact, SiC can have an extremely
high thermal conductivity, around 500 W/m-K at room temperature, when it is highly
pure and crystalline. This is higher than most high conductivity materials such as copper
(400 W/m-K), and would seem to make SiC an ideal cladding material [Snead et al.,
2005].
For pure SiC, the thermal conductivity decreases as a function of temperature, due to
increased phonon-phonon interactions, reaching a minimum around 1000 0 C. Irradiation
also decreases the thermal conductivity dramatically by introducing defects in the SiC
crystal, with the effect saturating around 1 DPA [Maruyama and Harayama, 2004]. The
behavior of the composite is similar, although it starts with a lower thermal conductivity
due to the anisotropy introduced by the fibers. In addition, the thermal conductivity in the
radial direction (perpendicular to the fibers) is lower due to added phonon scattering from
the fiber-matrix interfaces [Jones et al., 1997].
3.3.2 Model Development
The FRAPCON-3.3 model for Zircaloy cladding thermal conductivity is only a function
of temperature. It increases slightly with temperature, and is about 16 W/m-K at the
standard cladding temperature of 330 0 C. Because of its strong dependence on both
temperature and fluence, the new SiC cladding model incorporates both variables.
For the FRAPCON-SiC model, the temperature dependence of SiC was based on the
measured thermal conductivity of SiC composites given by Maruyama and Harayama
[Maruyama and Harayama, 2004], and the displacement damage (measured in DPA,assumed to be approximately 1x10 25 neutrons/m2 [Osborne et aL, 1998]) dependence
given by Snead [Snead, 2004]. An empirical relation was developed that first calculates51

the thermal conductivity as a function of temperature and DPA as a power relation such
that,
(d+ do)-°4kclad = ksat dsK t (3.1)
where d is the cumulative cladding DPA, do is the effective DPA for k(T) > ksat, which is
the cladding thermal conductivity after reaching the saturation DPA, dsat. In this model, it
is assumed that the thermal conductivity saturates after 1 DPA at 4 W/m-K regardless of
temperature. The temperature effect is then accounted for in the effective DPA factor,
2.5do =dsat ksat 1 (3.2)
Until reaching the radiation saturation point, the temperature dependence of the cladding
then follows the relation,
k(T)= 8 x 10- 6 Td-0.02 Tlad + (k, + 26.4) (3.3)
where k1t is the cladding thermal conductivity at room temperature (300 K) and 0 DPA,
and T is the cladding temperature at the current geometric mesh point in degree Kelvin.
As irradiation progresses, the conductivity becomes a weak function of temperature, and
past the saturation DPA it is assumed to be constant at the saturation conductivity.
The results of this relation as a function of temperature compared to other data are plotted
in Figure 3.1. It should be noted that data show higher values of thermal conductivity for
un-irradiated composites, as presented in Figure 3.2. However, based on the majority of
the data available, and for purposes of a conservative evaluation, the lower conductivity
range was used, and for FRAPCON-SiC kt = 20 W/m-K.

40
35
30
25
U 20W'U
I.C
300 500 700Temperature (19
900
Figure 3.1 Thermal Conductivity of Un-irradiated SiCFunction of Temperature.
50
40
3t;
o
*1
1100 1300
Composites as a
0 200 400 600 800Temperature (K)
1000 1200 1400
Figure 3.2 Un-irradiated SiC Composites with High Thermal Conductivityas a Function of Temperature [Yamada et al., 2004].
Likewise, the relation as a function of radiation damage at room temperature is presented
in Figure 3.3. Overall, there is good agreement between this empirical function and the
-A,-- FRAPCON-SiC
- (DuPont/CVI) Jones et al., 1997
(Hi-Nicalon Type-S/ICVI) Youngblood et al., 2004
-- (Tyranno-SA/ICVI) Youngblood et al., 2004
I (Hi-Nicalon/ICVI) Youngblood et al., 2004
....... •(......
-- e- CVI SiC/SiC (Tyranno SA fiber) --- CVI SiC/SiC (Tyranno SA fiber)
- PICVI SiC/SiC (Tyranno SA fiber) --- PCVI SiC/SiC (Tyranno SA fiber)---- CVI SIC/SiC (Hi-Nicalon Type S fiber) ---o CVI SIC/SiC (H-Nicalon Type S fiber)
P

available data in terms of saturation time and shape, although there is some variation
around the final value of the conductivity. Again, a conservative estimation was used to
determine dsat = 1 DPA and ksat = 4 W/m-K.
Combining the temperature and irradiation effects into the full model, Figure 3.4 shows
the thermal conductivity predicted by FRAPCON-SiC as a function of temperature at
different DPA, with the complimentary experimental data in Figure 3.5. Once again,
there is good agreement both in the general behavior and in the absolute values of the
thermal conductivity model and the experimental data. In all the data presented it is
apparent that the temperature dependence of the thermal conductivity has moderate
influence in the temperature range of interest (600 - 800 K), but that this becomes less
significant as irradiation proceeds. Given typical LWR flux levels, the irradiation
saturation of the SiC thermal conductivity will take place within several weeks, leaving
the major variable in the long-term performance of the cladding the value and stability of
the saturation conductivity.
40
35
30
E
• 25
8 20
15I.-
10
5
00.00 0.50 1.00 1.50 2.00 2.50 3.00 3.50 4.00
DPA
Figure 3.3 Thermal Conductivity of SiC Composites Irradiated at RoomTemperature.

20
18
16
2 14
12
b
0U
a
4
2
0400
DPA
1200600 800 1000Temperature (K)
Figure 3.4 SiC Composite Thermal Conductivity Predicted by FRAPCON asa Function of DPA and Temperature.
400 600 800 1000 1200Temperature (K)
Figure 3.5 SiC Composite (Hi-Nicalon Type-S with CVI) ThermalConductivity as a Function of DPA and Temperature [Youngblood, 2004].
30
25
20
0C,Ot,..
I-
u,r
.E

3.4 SiC Thermal Expansion
Thermal expansion of the cladding is most important at the beginning of life, since the
cladding temperature generally does not vary significantly during irradiation. The
primary effect of the thermal expansion is to drive the change in the geometry of the
radial fuel-cladding gap due to the difference between the expansion of the fuel and
cladding. This gap creates a significant resistance to heat flow between the fuel and the
cladding, and will therefore significantly affect the temperature of the fuel.
Based on published data, the thermal expansion coefficient for SiC composites has a
weak temperature dependence in comparison to pure SiC, and is generally 2-5x10 -6 1/K
depending on the choice of fiber and matrix bonding method [Jones et al., 1997 and
Schwetz, 2000]. See Figure 3.6 and Figure 3.7 for samples of some of the data for the
thermal expansion coefficient of various composites, for measurement through the
thickness or parallel to the fibers.
4.5E-06
2 4.OE-06
. 3.5E-06
- 3.OE-060Oo 2.5E-06
S2.OE-06
X 1.5E-06
1.0E-06
i 5.0E-07
O.OE+00
X
-- -
-- SEP (a)
-.-- DuPont (a)
S-*-DuPont Enhanced (a)
S-x--Gradient CVI SiC/SiC (b)
(a) Jones etal., 1997(b) Schwetz, 2000
I I
0 200 400 600 800 1000 1200 1400Temperature (K)
Figure 3.6 Through Thickness Thermal Expansion Coefficient versusTemperature for SiC Composites.
-
-
-
-
-
-
-
-
-
i
L
I

5.0E-06
4.5E-06
E 4.0E-06
3.5E-065 3.OE-06
0 2.5E-06= 2.OE-06
x, 1.5E-06
• 1.0E-06" 5.OE-07
00+I- nnA fl r. 4-lA
- -#SEP (a)
--w DuPont (a)DuPont Enhanced (a)
- Gradient CVI SiC/SiC (b)
--- DOW/Kaiser S-201 (a)
U.U1L- T.JU VV II
0 200 400 600 800 1000 1200 1400
Temperature (K)
Figure 3.7 In-plane Thermal Expansion Coefficient versus Temperature forSiC Composites.
It is not apparent if there is a significant difference between swelling parallel and
perpendicular to the fiber axis, so it was assumed that the expansion coefficient is
identical in each direction. In addition, because of the small amount of data on variation
with temperature, a constant value was used. The thermal expansion coefficient for SiC
cladding used in FRAPCON-SiC is 3x10 -6 1/K.
3.5 SiC Irradiation Swelling
Radiation interaction with the SiC crystal produces displacement damage and
amorphization that has been experimentally observed to cause swelling. Recently
atomistic modeling and simulation has been used to attempt to explain the cause and
predict the extent of this swelling by studying relaxation after an amorphization of the
SiC crystal structure similar to that caused by neutron and heavy ion bombardment
[Romano et al., 2003]. This work has demonstrated that the swelling due to irradiation is
a non-linear process, but additional study is needed for realization of a comprehensive
theoretical model to predict macroscopic behavior. In general, this cladding swelling
competes with the fuel swelling and thermal expansion to determine the fuel-cladding
gap width, although the irradiation swelling takes place over a longer time scale.
57
+i
I
(a) Jones etal., 1997(b) Schwetz, 2000
I
i

The irradiation swelling of SiC composites with Hi-Nicalon fibers irradiated to 0.5 DPA
are shown in Figure 3.8. Despite the large amount of scatter in the data, it seems that the
composite swells slightly when irradiated at temperatures characteristic of PWR
cladding, around 600 K [Ishihara et al., 2002]. It should be noted that some SiC fibers,
such as Nicalon and Hi-Nicalon fibers, have been shown to increase in density under
irradiation as a result of impurities like carbon. In contrast, the highly stoichiometric
matrix would swell. New, higher purity fibers such as Hi-Nicalon Type-S behave more
like stoichiometric SiC (swelling during irradiation), and therefore it is likely these would
be used in nuclear-grade composites [Brook, 1991].
Based on the limited available information on SiC composites utilizing Hi-Nicalon Type-
S fibers, the cladding in FRAPCON-SiC is assumed to swell with irradiation,
exponentially approaching a saturation value of 2 v/o [Snead et al., 2003]. Based on this
model, the swelling has reached 95% of its saturated value after 1 DPA. It is further
assumed this swelling acts equally in the plane and through the thickness of the
composite, which equates to a maximum of 0.67% linear strain due to irradiation. This
linear strain is then given by the equation,
AL/L = 0.0067 (- e-((DPAI3)) (3.4)
While there may be a temperature dependence to this swelling affecting a transition to
densification around 800 K, the functional form is not clear from this data.

0.4
0.2
0
-0.2
-0.6
-0.8
400
O(
* Fiber (par) o Fiber (purp)1 i*II
500 600 700Irradiation Temp (K)
800 900
Figure 3.8 Temperature Dependence of the Irradiation-Induced Swelling ofSiC Composites with Hi-Nicalon Fibers [Ishihara et al., 2002].
3.6 SiC Stress and Strain Behavior
3.6.1 Young's Modulus
The Young's modulus describes a material's response to stress and strain during elastic
deformation due to tension or compression. This may be approximated by plotting stress
versus strain for an isotropic sample and determining the slope during the elastic portion
of the deformation, where the curve should be linear.
This behavior is somewhat more complex for a composite specimen, since even after
matrix cracking the fibers can continue to hold some load before yielding or de-bonding
entirely from the matrix. In addition, differences between composite types are introduced
since the modulus of the fibers and matrix is different, and other factors such as the
fractional fiber loading, weave pattern, and void volume are important.
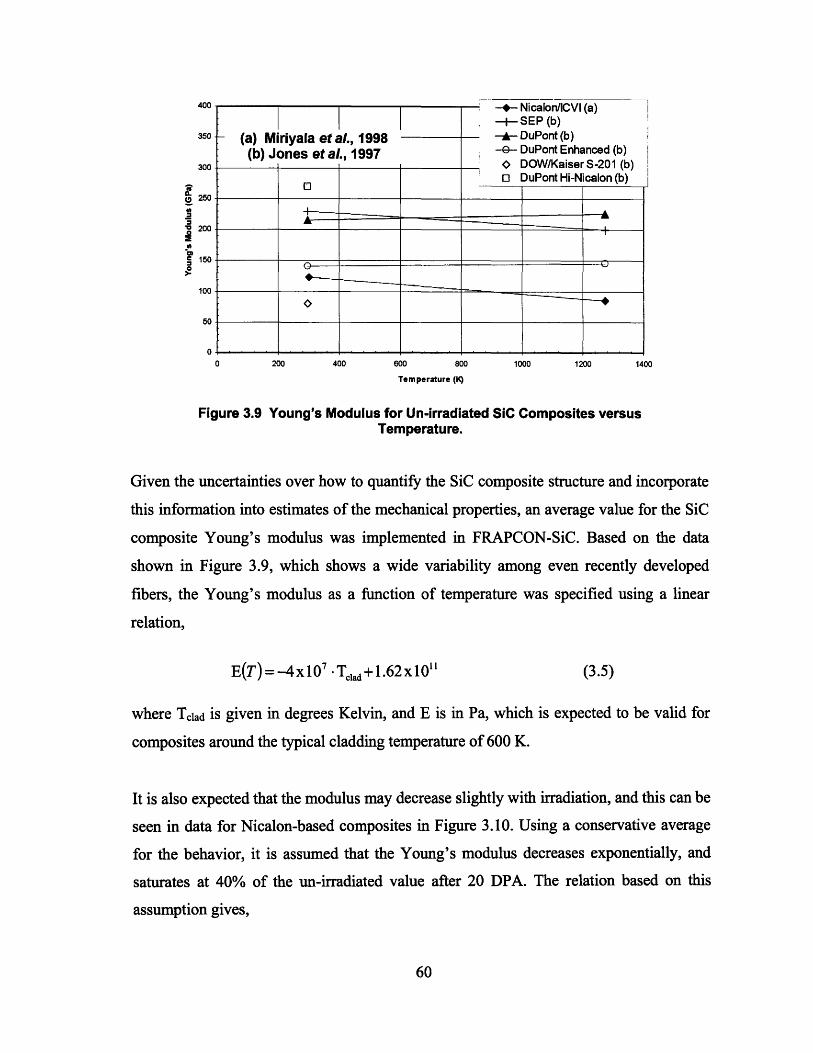
(a) Miriyala et aL, 1998(b) Jones et al., 1997
400
350.
300sa-
a 250
" 200P
E 150
100
50
0
I * ·
400 600 800
Temperature (K)
Figure 3.9 Young's Modulus for Un-irradiatedTemperature.
SiC Composites versus
Given the uncertainties over how to quantify the SiC composite structure and incorporate
this information into estimates of the mechanical properties, an average value for the SiC
composite Young's modulus was implemented in FRAPCON-SiC. Based on the data
shown in Figure 3.9, which shows a wide variability among even recently developed
fibers, the Young's modulus as a function of temperature was specified using a linear
relation,
E(T)= -4 x10⁷' Tla +1.62 x 10 (3.5)
where Tclad is given in degrees Kelvin, and E is in Pa, which is expected to be valid for
composites around the typical cladding temperature of 600 K.
It is also expected that the modulus may decrease slightly with irradiation, and this can be
seen in data for Nicalon-based composites in Figure 3.10. Using a conservative average
for the behavior, it is assumed that the Young's modulus decreases exponentially, and
saturates at 40% of the un-irradiated value after 20 DPA. The relation based on this
assumption gives,
A
--
0
I
~
~
~
· ·
-4-- Nicalon/ICVI (a)-+- SEP (b)- DuPont (b)--- DuPont Enhanced (b)0 DOW/KaiserS-201 (b)o DuPont Hi-Nicalon (b)

E(T,DPA)= E(T).I -O.41 l-e -DPA 20E(T,DPA)= E(T). 1-0.4. (1-e 20
It is not clear from the data how composites based on newer fibers (such as Hi-Nicalon
Type-S) will respond to irradiation. In general, it is expected there will still be some
degradation of the modulus, however, and therefore this model should provide a
conservative estimate of that effect [Snead et al., 1995].
(a) Hollenberg et al, 1995(b) Nogami et al., 2004
-0-
-- Nicalon/ICVI (500*C) (a)-- NicalonlICVI (800*C) (a)
SNicalonlCVI (800"C) (a)
--- NicalonIFCVI (800"C) (a)--- Hi-Nicalon/ICVI (30*C) (b)
-u
DPA
Figure 3.10 Young's Modulus of SiC Composites as a Function of DPA.
3.6.2 Yield Strength
The yield strength of a material is the stress at which it transitions from elastic to plastic
deformation, and therefore represents a maximum on a stress-strain curve. SiC in general
has a higher yield strength than Zircaloy. This is one of the major advantages of SiC
cladding, since it can better resist the significant internal and external stresses imposed in
the LWR environment.
The yield strength model developed for FRAPCON-SiC depends on both temperature
and fluence. The yield strength of several SiC composites versus temperature is plotted in
--
(3.6)

Figure 3.11, where it can be seen that the performance of composites with new fibers
(such as Hi-Nicalon) compares similarly to older composites.
300
250
.- 200
4d
E 150
5-Z 100
50
0600 800
Temperature (K)1000 1200
Figure 3.11 Yield Strength of SiC Composites versus Temperature.
Based on this information, the yield strength for the cladding in FRAPCON-SiC was
modeled as,
S,(T)= 2.66x10⁴ Tclad+2x10 8 (3.7)
with Tclad is given in degrees Kelvin, and Sy in Pa. Because brittle materials such as SiC
experience little plastic deformation before fracturing, the yield strength is very close to
the ultimate strength. For simplicity, in the FRAPCON-SiC model the cladding ultimate
strength is defined as equal to the yield strength. In addition, strains at yield and failure
are defined using Young's modulus and the yield and ultimate strengths, respectively.
The fluence dependence of the yield strength was determined using data shown in Figure
3.12, which suggests a strong fluence dependence saturating after 20 DPA. The decrease
in strength is around 40% for the composites with Nicalon fibers. The effect is even more
AA .- U
+ Nicalon/CVI (a)--- SEP (b)
* DuPont (b)-- DuPont Enhanced (b)
)K DOW/Kaiser S-201 (b)(a) Miriyala et al., 1998 - DuPont Hi-Nicalon (b)(b) Jones et al., 1997
200 400 1400I I I

pronounced in the newer Hi-Nicalon fibers, although the data for these composites only
extend to 7 DPA. Additional data from Hinoki suggests that the 40% degradation may
hold for Hi-Nicalon and Tyranno SA based composites as well, at least up to 7.7 DPA
[Hinoki et al., 2002]. However, he also presents data that shows for an even higher grade
fiber, Hi-Nicalon Type-S, the effect of irradiation is a possible 5% increase in tensile
strength.
Given the majority of the data supporting a decrease in strength with fluence with
commonly used fibers, it is conservative to include this behavior in the model. The
FRAPCON-SiC model therefore incorporates an exponential function that saturates at a
40% reduction in the temperature-dependent ultimate tensile and strengths,
-DPA- -3S,(T,DPA)= S(T){ 1-0.4- 1-e 20
700
600
500
J 400
E 300
200E
100
(3.8)
--- Nicalon/ICV (5000C) (a)+ Nicalon/ICVI(8000C) (a)
-- Nicalo/ICVI (8000C) (a)--- Nicalon/FCVI (8000C) (a)--- Hi-Nicalon/ICVI (30*C) (b)- - Hi-Nicalon/CVI (30"C) (c)
(a) Hollenberg et al., 1995(b) Nogami et al., 2004(c) Snead et al., 1998
I I
15
DPA
Figure 3.12 SiC Composite Ultimate Tensile Strength as a Function of DPA.
I I I ,

3.6.3 Shear Modulus
The shear modulus, which describes a material's response to shear stress, can be defined
as a function of the Young's modulus and Poisson's ratio for that material. Poisson's
ratio describes the strain behavior of the material perpendicular to the direction of strain.
The Poisson's ratio used for SiC cladding is 0.18, which indicates only a relatively small
amount of transverse strain given a stress loading [Shackelford, 1994]. From this
information the shear modulus is calculated as,
EG - (3.9)S2(1+ v)
where G is the shear modulus, E the Young's modulus, and v is Poisson's ratio.
3.7 Other SiC Properties
3.7.1 CreepThe creep rate of a material is the time rate of change of strain given an applied stress.
The deformation due to creep generally increases with temperature and time, and will
lead to the fracture of the material. Creep of Zircaloy at PWR operating temperatures and
pressures is significant (around 0.001% per hour) and must be taken into account. SiC,
however, experiences negligible creep below 1000 K [Zimmerman and Adams, 1989 and
Brook, 1991]. Based on this data, and the fact that maximum cladding temperature is well
below 1000 K in current LWRs, the creep rate in FRAPCON-SiC was set to zero.
3.7.2 OxidationThere is limited information available on the corrosion of SiC in water at LWR
temperatures, pressures, and flow rates, and none for composites like those now being
considered for fuel rod cladding. Additional considerations that may affect the corrosion
rate are the effects of common chemical additives such as boric acid and lithium, the
presence of a significant heat flux through the composite, as well as structural changes
due to dimensional changes with temperature and irradiation.
64

It is also not known whether exposure to the coolant will result in the formation of a
protective oxide layer on the surface of the SiC cladding, as occurs with Zircaloy, which
may lead to weight gain and reduced thermal conductivity. Conversely, there may be a
corrosive effect that results in a weight loss, thinning of the cladding or increase in
porosity.
The data that is available for monolithic SiC in water around 600 K suggests a rate of
weight loss around lxl0-5 g/cm2-hr, which is two orders of magnitude lower that that of
Zircaloy; however, this is for tests of only a few weeks duration. In light of the available
information, the oxidation model in FRAPCON-SiC was set to a zero oxidation rate,
however this should be investigated further as the mechanism for SiC composite
oxidation becomes better understood.
3.7.3 Emissivity
Emissivity is a measure of the fraction of thermal radiation emitted by the surface of a
body relative to a blackbody. The closer to unity, the better the surface is at emitting
thermal radiation, although it is also better at absorbing thermal radiation. From the
available data on composites, a constant value of the cladding emissivity, 0.8, was
obtained [Jones et al., 1997]. Although the emissivity of a surface can be changed
through application of different surface coatings and by altering the roughness, this
emissivity value compares well with the values for monolithic SiC, which fall between
0.8 and 0.95 [CINDAS, 2005].
3.7.4 Phase Transitions
SiC predominantly exists in two crystalline structures, a- and P-phase. It is usually found
in the P-phase below 2300 K, and high-purity SiC fibers and matrix deposits will be of
this structure [Schwetz, 2000]. Phase change of SiC is not modeled in FRAPCON-SiC.

Formally, SiC does not melt, but it will begin to decompose around 2600 K at
atmospheric pressure. However, this is well above the temperature range on interest for
LWR cladding. This high decomposition point is one of the major advantages of SiC
cladding, especially with respect to transient and accident survival.
3.7.5 Crud Accumulation
When the fuel rod is installed in the reactor and there is flow through the core, any
corrosion products suspended in the water will begin to plate onto the surface of the
cladding. This accumulation is accounted for in FRAPCON as either a constant or a
growing crud layer on top of any oxide layer. It will likely be necessary to determine
experimentally the composite cladding's affinity for accumulating these deposits based
on material and surface texture. For this investigation, the rate of crud accumulation in
FRAPCON-SiC, and its thermal resistance, is equal to that of Zircaloy cladding.

4. Predicted Behavior of SiC Clad PWR Fuel Rods
4.1 FRAPCON Test Cases
For analysis of the FRAPCON-SiC computer code, two characteristic input cases were
selected: first, a case at constant power to normal burnup, and second the very high
burnup Manzel test case described in Chapter 2. The constant power case removes the
disruptions due to sudden power level changes and the extreme effects of high burnup
and large fission gas release. The Manzel case, on the other hand, represents a more
realistic case for an operating reactor without the variations accompanying actual power
histories. It also provides insight into the fuel rod behavior at high burnup where the SiC
duplex cladding is needed in order to exceed the performance of Zircaloy.
4.2 SiC Model Evaluation
4.2.1 Constant Power Analysis
Using the input parameters from the Manzel test case, as outlined in Chapter 2 and Table
2.1, the average linear heat generation rate was set to a constant 5 kW/ft for 1500 EFPD,
as shown in Figure 4.1 for the Zircaloy-clad (Zr) and SiC composite-clad (SiC) solid fuel
rods. From this input information, FRAPCON generated a discharge burnup of 40
MWd/kgU, shown in Figure 4.2.

5
4
I-
J2
1
00 500 1000 1500
EFPD
Figure 4.1 Average LHGR for the Constant Power Test Case.
0 500 1000 1500EFPD
Figure 4.2 Average Burnup for the Constant Power Test Case.
The first major difference that is apparent between the Zircaloy and SiC cladding is the
thermal conductivity, graphed in Figure 4.3. It is interesting to note that based on the hot
full-power temperature and limited irradiation damage over the first time step (0.1
EFPD), the thermal conductivity of the SiC has already significantly degraded from its
room-temperature value of 20 W/m-K, and is about 4 W/m-K, less than the value of the
Zircaloy cladding by a factor of 2.5 to 3.0.
Ilr

The SiC thermal conductivity then saturates, due to radiation damage, by the second time
step (65 EFPD) near 3.6 W/m-K, while the Zircaloy value remains basically unchanged.
Even at discharge, the SiC thermal conductivity is less than half of that predicted for the
Zircaloy, which has both crud and oxide layer buildup. Note that the saturation value
used in the SiC thermal conductivity model is 4 W/m-K, however the presence of crud on
the exterior of the cladding further reduces this value. In both the constant power and
Manzel test cases, it is assumed that there is a constant crud layer 0.2 mils thick for SiC
and Zircaloy.
14
12E
S8
0 = 6E 40c
•" 2
0
0 10 20 30 40 50Burnup (MWd/kgU)
Figure 4.3 Cladding Thermal Conductivity during the Constant Power TestCase.
In Figure 4.3, as well as all following figures showing fuel rod temperatures and strains,
the property graphed is for the FRAPCON spatial node that registered the peak axial
temperature. Because of the that power shape and fuel rod behavior, this is always the
same axial location, seven feet above the base of the active fuel region, just above the
fuel rod centerline. Therefore, this data should reflect the point of most extreme change in
the fuel rod over time.
The SiC cladding thermal conductivity does not decrease over time because in this model
there is no effect of oxidation on the SiC outer surface. The effect of this lower thermal
c
x-·j :~ qB ~~b~-~Pira~.;a~~~

conductivity is to increase the temperature drop across the cladding, and thereby increase
the average cladding and fuel temperature, as shown by Figure 4.4 and Figure 4.5. The
SiC inner cladding temperature is higher by about 60 K over the life of the fuel rod, while
the fuel is consistently about 200 K hotter.
700
680
660
640
620
600
580
5600 10 20 30 40 50
Bumup (MWdlkgU)
Figure 4.4 Cladding Temperature at the Cladding Outer Diameter (OD) andCladding Inner Diameter (ID) for the Constant Power Test Case.
160015001400
1300
120011001000
900
800700600
0 10 20 30 40Bumup (MWdlkgU)
Figure 4.5 Fuel Temperature at the Fuel Outer Diameter (OD)Centerline for the Constant Power Test Case.
and Fuel
S' Zr (Centerline) -e- Zr (OD)-- SiC (Centerline) SiC (OD)
ci
r-

The Zr-clad rod benefits from the lower thermal conductivity as well as the creep-down
of the cladding onto the fuel. This has the effect of closing the fuel-cladding gap and
decreasing the thermal resistance through the fuel rod. The fuel-cladding gap width,
plotted in Figure 4.6, increases initially as the fuel density increases and the cladding
swells in the first months after reactor startup. Very quickly, however, the Zircaloy
cladding begins to creep down onto the fuel at a significant rate, achieving soft gap
closure around 26 MWd/kgU, but no hard fuel-cladding contact before discharge. The
SiC cladding experiences no creep down; instead, the gap closes as the fuel pellets swell
outwards due to irradiation swelling and fission gas buildup.
0.009
0.0080.0070.006
0.005
0.004
0.0030.002
0.0010
10 20 30 40 50Bumup (MWd/kgU)
Figure 4.6 Fuel-Cladding Radial Gap Width for theCase.
Constant Power Test

0.45
0.4
0.35
0.3
g 0.25LA.
0.2
0.150.1
0.050
0 10 20 30 40 50Burnup (MWdlkgU)
Figure 4.7 Fractional Fission Gas Release for the Constant Power TestCase.
The fission gas release predicted by FRAPCON and FRAPCON-SiC is identical for this
constant power case, as shown in Figure 4.7. The total gas release fraction is also very
low in both cases, below 0.3% at discharge. The similarity in results is due to the low
power level, fuel temperatures, and burnup achieved, such that neither radial saturation
nor high-burnup threshold was reached in either case.
These results demonstrate the primary differences in the behavior of traditional Zircaloy
and the new SiC cladding at low power levels: the SiC exhibits lower thermal
conductivity after irradiation and does not experience creep. Other changes, such as
swelling and oxidation also have a noticeable effect. In this irradiation scenario, the
higher fuel temperature would not pose a problem during normal operation, but may
decrease the fuel safety margins for accident analysis.
4.2.2 High Burnup Analysis
The constant power test case gives a metric of the performance of the new SiC cladding
models, however it does not test the cladding in the regime where it is favored over
Zircaloy: at very high burnup. A second analysis of the new FRACPON-SiC was
therefore performed using the Manzel test case input as described in Chapter 2.

The power history, Figure 4.8, and burnup, Figure 4.9, for this case are the same for both
the Zircaloy and SiC fuel rods, as expected. The discharge burnup is 102 MWd/kgU after
3240 EFPD for both. This case represents very high burnup compared to the average
assembly discharge burnup of 40 MWd/kgU analyzed earlier, or the 50 MWd/kgU
achieved today in most U.S. PWRs.
0 500 1000 1500 2000 2500 3000 3500
EFPD
Figure 4.8 Average LHGR for Zircaloy (Zr) and SiC Composite (SIC) CladFuel Rods for Manzel Test Case.
120
100
0 500 1000 1500 2000 2500 3000 3500EFPD
Figure 4.9 Average Burnup for Manzel Test Case.

The cladding thermal conductivities behave as expected in both cases, and they are in
part continuations of the behavior calculated during the constant power test case. Both
conductivities, shown in Figure 4.10, decrease with burnup and approach a stable value.
The SiC cladding decreases primarily due to radiation damage, although there is also an
effect of crud. The Zircaloy cladding has a slower change dictated primarily by the rate of
formation of an oxide layer on the outer cladding surface. After about 70 MWd/kgU, this
layer has grown to its maximum thickness and begins to spall away, leaving the
minimum Zr cladding conductivity still 150% greater than the SiC saturation value.
14
. 12
E 10
r 6o
2
00 20 40 60 80 100 120
Bumup (MWd/kgU)
Figure 4.10 Cladding Thermal Conductivity for Manzel Test Case.
The effect of this difference in thermal conductivity is again aggravated by the lack of
creep in SiC, which could serve to close the fuel-cladding gap quickly, as shown in
Figure 4.11. The Zr-clad fuel rod achieves soft closure around 15 MWd/kgU, and hard
fuel-cladding contact after 20 MWd/kgU. The SiC cladding gap is governed by the fuel
pellets swelling outward so that the gap does not close until almost 70 MWd/kgU, and
there is no hard fuel-cladding contact.
This difference in cladding behavior is highlighted in the change of the cladding inner
diameter, shown in Figure 4.12. After initial swelling, the Zircaloy cladding creeps down
quickly onto the fuel given the large external pressure of the coolant. The SiC cladding,
74

conversely, swells outward due to radiation damage up to it saturation value. It is also
notable that the effect of changing power level, and therefore cladding temperature, is not
as apparent in the SiC cladding as it is for Zircaloy. This difference highlights both the
dominance of the radiation swelling as well as the small thermal expansion of SiC.
0.006
0.005
0.004
0.003
0.002
0.001
0
0 20 40 60Bumup (MWd/kgU)
80 100 120
Figure 4.11 Radial Fuel-Cladding Gap Width for Manzel Test Case.
0.98
0.975
0.97
0.965
0.96
0.955
0.95
0.945
0.94
60Bumup (MWdlkgU)
80 100
Figure 4.12 Cladding Inner Diameter for Manzel Test Case.
The peak cladding and fuel temperatures, plotted in Figure 4.13 and Figure 4.14, reflect
these differences in thermal conductivity and gap closure rate. As the SiC fuel-cladding
gap widens initially, the cladding inside diameter temperature quickly increases, and only75
- Zr
SIC
120

slowly approaches the Zircaloy as the gap closes. However, even when both gaps are
closed the difference in temperatures between the two claddings is almost 40 K.
The fuel temperatures are even more widely divergent, with a 400 K difference in
centerline temperatures due to the closing Zr-clad gap and widening SiC-clad gap. The
temperature of the SiC-clad fuel gradually approaches that of the Zr-clad rod as the gap
closes around 70 MWd/kgU. The effect of the SiC-clad rod gap conductance and
cladding thermal conductivity also drive the difference in behavior of the pellet
temperature profile. The Zr-clad pellet has a nearly constant outside temperature over its
lifetime, whereas the SiC-clad pellet is up to 300 K hotter.
850
800
750
700
650
600
5500 20 40 60
Burnup (MWd/kgU)
80 100
Figure 4.13 Cladding Inner and Outer Diameter Temperatures for ManzelTest Case.
120

2200
2000
1800
1600
1400
1200
1000
800
600
Figure 4.14
0 20 40 60 80 100 120Burnup (MWd/kgU)
Fuel Temperature for Zircaloy and SiC fuel rods at Fuel OuterDiameter and Centerline for Manzel Test Case.
I ncLne+0
- 1.0E+05
C
0
O 1.0E+04
1.- 03
1.0E+030 20 40 60
Burnup (MWd/kgU)
80 100 120
Fuel-Cladding Gap Thermal Conductance for ManzelTest Case.
The conductance of the fuel-cladding gap, plotted in Figure 4.15, is being driven by two
factors: the radial width of the gap, and the conductivity of the fill gas. The effect of the
gap width is apparent, with a dramatic rise in conductance by several orders of magnitude
in both cases as the gap closes.
Figure 4.15 Radial
I.V r V

The thermal conductivity of the gap itself is primarily affected by the buildup of fission
gases, which tend to increase the thermal resistance over the initial state of pure helium.
The higher average fuel temperatures in the SiC-clad fuel rod increase the fission gas
release fraction, shown in Figure 4.16, and therefore serve to further decrease the gap
conductance.
0 20 40 60 80 100 120Bumup (MWdlkgU)
Figure 4.16 Average Fractional Fission Gas Release for the Manzel TestCase.
The much higher fuel temperatures in the SiC-clad fuel rod have dramatically increased
the fission gas release after only 5 MWd/kgU of burnup. The release reaches 20% by 35
MWd/kgU, while the predicted release fraction in the Zircaloy rod at the same time is on
order of 1%. This release has the effect of holding down the gap conductance even as the
SiC-clad gap is closing, so that a significant increase in the gap conductance is not
realized until just before full closure.
This high fraction of release creates other issues, primarily pressurization of the fuel rod,
as shown in Figure 4.17. Although the SiC-clad rod's release fraction peaks around 20
MWd/kgU, there is not much pressure increase since the total inventory of fission gas in
the fuel at that time is small. However, by 30 MWd/kg the release fraction is still
significant and the fuel-cladding gap has decreased in the radial direction by almost half,

causing a quick increase in pressure such that beyond 30 MWd/kgU the internal pressure
exceeds the e:xternal primary coolant pressure of 15.2 MPa. The higher fuel temperatures
and previous gas release contributes to increasing the pressure difference between the Zr-
clad and SiC-clad fuel rods even more after the gap is closed at 70 MWd/kgU.
45
40
35- 30
2 25
l 20
15
10
5
0
0 20 40 60 80 100 120Burnup (MWd/kgU)
Figure 4.17 Fuel Rod Free Gas Pressure for Manzel Test Case.
The Manzel test case demonstrates the interaction of the SiC cladding properties in a high
heat flux and high burnup scenario. The low thermal conductivity and lack of creep down
result in higher fuel temperatures and fission gas release than Zircaloy rods under the
same conditions. The behavior becomes similar after closure of the fuel-cladding gap, but
this does not occur until very high burnup, around 70 MWd/kgU.
A significant result of the differences in cladding performance is the higher internal
pressures in the SiC-clad fuel rod, especially at high burnup. Based on the yield strength
model discussed in Chapter 3, the code predicts that the SiC cladding will fail due to
hoop stress around 95 MWd/kgU, when the internal pressure is about 22 MPa higher than
the external coolant pressure of 15 MPa. The failure of the Zircaloy is not predicted until
the net internal pressure reaches 60 MPa.

4.3 Sensitivity Analysis
Because the new FRAPCON models governing SiC cladding behavior rely on
experimental data generated under specific conditions, it is prudent to consider how small
differences in the empirical functions that were developed impact the predicted fuel rod
behavior. This information is important both for gauging the precision of the FRAPCON-
SiC code as well as identifying those properties that require increased scrutiny.
In order to obtain a better understanding of these uncertainties, a basic sensitivity analysis
was performed in which the forms of certain relations were altered to represent the
variations in the available data. The four properties that were chosen - thermal
conductivity, thermal expansion, irradiation swelling, and Young's modulus - represent
properties that showed a significant impact on fuel rod behavior in the constant power
and Manzel test cases in the previous section. The model properties were varied to
represent the minimum and maximum extremes of the available data.
4.3.1 Thermal Conductivity Variations
The thermal conductivity was associated with a wide range of possible values, as
discussed in Chapter 3, although the general form of the temperature and irradiation
dependence are approximately the same. To represent the largest possible extremes two
cases were developed: one representing the highest likely value of the thermal
conductivity, the other representing the lowest likely value. These two scenarios,
representing a high and low range for the thermal conductivity are presented in Table 4.1.
Table 4.1 Thermal Conductivity Sensitivity Conditions.
Condition Selected Value High Range Low RangeRoom temperature conductivity 20 W/m-K 50 W/m-K 15 W/m-KIrradiation saturation conductivity 4 W/m-K 10 W/m-K 2 W/m-KConductivity Saturation DPA 1 2 0.1
The results of these changes on the output thermal conductivity are presented in Figure
4.18, where it is apparent by comparing the final conductivity values in each case that the
80

crud layer has a significant effect on the effective cladding conductivity. For the low
range case, this results in a 2 W/m-K decrease from its saturation value due to the 0.2
mils of crud, whereas the high range case more than doubles the default value.
0 20 40 60Bumup (MWd/kgU)
80 100 120
Figure 4.18 Thermal Conductivity Based on Different Thermal ConductivityModel Parameters.
These changes in the thermal conductivity values have the expected effect on the
temperature of the cladding, shown in Figure 4.19. The higher thermal conductivity range
is a beneficial change, resulting in lower temperatures throughout the cladding. On the
other hand, the low range conductivity model increases the cladding inner surface
temperature by over 175 K. At these high temperatures, it is possible that behavior not
included in the FRAPCON-SiC model, such as creep, may begin to be significant. In
addition, this, low conductivity generates a very large temperature gradient across the
cladding, which may drive other undesirable processes such as chemical diffusion and
cracking and increased thermal stresses.

I UUU
950
900
£ 850800
& 750EI 700
650
600
5500 20 40 60 80 100 120
Burnup (MWd/kgU)
Figure 4.19 Cladding Temperature Based on Different ThermalConductivity Model Parameters.
The fuel temperature also changes in the expected direction for the two extreme models,
although the change is slightly more extreme than that of the cladding, with at a 225 K
increase in fuel centerline temperature for the low conductivity model. This higher pellet
temperature has several effects, most notably an increase in fission gas release and an
increase in the rate of swelling. The fission gas release, plotted in Figure 4.21, shows a
significant change for both models. The high conductivity case decreases the release by
about 1/3 up to 80 MWd/kgU, after which, in the very high burnup regime, it more
closely approximates the observed and FRAPCON-predicted behavior of Zircaloy fuel
rods.
Ar\nr\

2400
2200
2000
1800
1600
1400
1200
1000
800
6000 20 40 60
Burnup (MWd/kgU)
80 100 120
Temperature Based on Different Thermal ConductivityModel Parameters.
0 20 40 60Bumup (MWd/kgU)
80 100 120
Figure 4.21 Fission Gas Release Based on DifferentModel Parameters.
Thermal Conductivity
The low conductivity model increases the fission gas release by about 50%. The absolute
release is 25-30% for a majority of the operational life of the rod. This behavior results in
a large increase in the fuel rod internal pressure, as shown in Figure 4.22. It is important
to note the point where the rod internal pressure surpasses the external coolant pressure,
thus moving the cladding from compression into tension. The low conductivity case
surpasses this point early in life, at 20 MWd/kgU. The chosen model takes longer to cross
83
Figure 4.20 Fuel

the threshold, around 30 MWd/kgU, and the high conductivity model shows the best
performance, not crossing until past 60 MWd/kgU. In the high burnup regime, the
pressure rises more dramatically for all rods, but they remain similar in relation to each
other.
V0 -
50
40
a 30
0. gn
10
0
-
--- High--- Selected_SLow
_.~IL~-~~LL
0 20 40 60 80 100 120Bumup (MWdlkgU)
Figure 4.22 Internal Free Gas Pressure Based on Different ThermalConductivity Model Parameters.
An interesting result of the thermal conductivity change is the relative fuel-cladding gap
conductance predicted by each code, shown in Figure 4.23. Although the fission gas
release in the low conductivity model is much higher than for the other scenarios, the gap
conductance is higher than either of the other models. In fact, the ranking of the gap
thermal conductance below 70 MWd/kgU is the opposite of what would be expected
based on fission gas release, and is instead driven by the gap thickness, shown in Figure
4.24.
The increasing fuel temperature with decreasing cladding conductivity drives the
swelling of the fuel above the thermal expansion of the cladding, causing the gap to close
fastest in the low conductivity model. Past 70 MWd/kgU, when all three models predict
soft gap closure, the conductance is controlled by the fission gas release, and the order of
conductance's reverse.
-
-
I _

0 20 40 60 80 100Burnup (MWd/kgU)
Radial Fuel-Cladding Gap Conductance BasedThermal Conductivity Model Parameters.
on Different
0 20 40 60 80 100Burnup (MWd/kgU)
Figure 4.24 Radial Fuel-Cladding Gap Width Based on Different ThermalConductivity Model Parameters.
1.0E+05
1.0E+04
1.0E+03120
Figure 4.23
U.UVV
0.006
0.005
0.004
5 0.003
0.002
0.001
0
120

4.3.2 Thermal Expansion Variations
The thermal expansion model presented in Chapter 3 was based on data that suggested
that the SiC linear thermal expansion coefficient had a value range between 2.5x10⁻⁶ and
4.5x10 -6 l/K, with very little variation with temperature over the range of interest. In
addition, it was assumed that this expansion was equal in the radial and axial directions.
Although there is limited data for modem composites, it seems reasonable that they will
exhibit properties within a factor of two of the chosen value for both the axial and radial
dimensions. Given this assumption, the sampling range presented in Table 4.2 was
developed.
Table 4.2 Thermal Expansion Sensitivity Conditions.
Condition Selected Value High Range Low RangeThermal Expansion Coefficient 3x10' 1/K 6x10-" 1/K 1.5x10 - 1/K
The results of varying this parameter are less dramatic than the thermal conductivity,
since the radial strain induced by thermal expansion around 700 K is only 0.25% in the
high range model. In addition, the temperature of the cladding does not fluctuate
significantly during operation, so there is little dynamic effect of the thermal expansion.
Some change is noticeable in the gap width, as shown in Figure 4.25. However, the
difference between the cases of higher and lower thermal expansion is only several
thousandths of a millimeter.

0.06
0.05
i" 0.04
v 0.03
, 0.02
0.01
0
0 20 40 60Bumup (MWd/kgU)
80 100
Figure 4.25 Radial Fuel-Cladding Gap Width for Different ThermalExpansion Models.
Because of the wider gap, the higher thermal expansion case has fuel centerline
temperatures 10-20 K higher than for the selected model. This in turn increases the
fission gas release by almost 5% as shown in Figure 4.26 between 30 and 80 MWd/kgU.
The effect of this additional release is also not dramatic in terms of added internal fuel
rod pressure, as it amounts to 1-2 MPa beyond that of the selected case.
0 20 40 60Burnup (MWd/kgU)
Figure 4.26 Fractional
80 100 120
120
Fission Gas Release for Different ThermalExpansion Models.

4.3.3 Irradiation Swelling Variations
The data available for the SiC irradiation swelling model exhibited a large amount of
scatter. The variance in measurements is at least partially attributable to the densification
apparent in SiC fibers with significant impurities, such as free carbon, compared to the
significant swelling of pure SiC crystals, such as the inter-fiber matrix. In addition, this
swelling is also on the same order of magnitude as the thermal expansion (+ 1%).
The values for the swelling sensitivity analysis are given in Table 4.3. Hi-Nicalon fibers
irradiated to 0.5 DPA showed some shrinkage [Ishihara et al., 2002], which is used to set
a low range of -0.05% linear swelling in the radial direction and -0.8% axially.
Conversely, an SiC composite with Hi-Nicalon Type-S fibers, irradiated to 1.1 DPA,
exhibited over 0.7% linear swelling, which supports the idea of an upper range of 0.8%
linear swelling at 1 DPA [Snead et al., 2003].
Table 4.3 Irradiation Swelling Sensitivity Conditions.
Condition Selected Value High Range Low RangeRadial Swelling Limit 0.67% 0.8% -0.05%Axial Swelling Limit 0.67% 0.8% -0.8%Saturation DPA 1 1.5 0.5
The selected and high range swelling models have similar behavior to the thermal
expansion variations; the increased swelling increases the radial fuel-cladding gap width
and increases the time needed to close the gap, as shown in Figure 4.27. The effect of the
low range model, which proposes densification instead of swelling, is more pronounced.
The gap begins closing immediately, unlike the behavior seen previously, and closes by
30 MWd/kgU, at almost 1/3 the burnup of the other cases.

0.06
0.05
- 0.04E
~0.03
o 0.02
0.01
0
0 20 40 60 80 100 120Bumup (MWdlkgU)
Figure 4.27 Radial Fuel-Cladding Gap Width for Different IrradiationSwelling Models.
From Figure 4.28 it can be seen that the quick closing of the gap in the low range model
greatly increases the gap conductance, and as a result, the fuel temperature for this case is
around 200 K lower than the other two cases until they also begin to close around 60
MWd/kgU. The difference between the selected and high cases is smaller, around 30 K
for the 0.13% difference in strain. At very high burnup, above 75 MWd/kgU, all three
models predict gap closure and the fuel temperature profiles are nearly identical.
The most significant result of the lower fuel temperature in the low range model is a
decrease in the predicted fission gas release to about 1/3 the value of the standard model.
This low release, shown in Figure 4.29, is a result of the lower fuel temperature for this
case, and it in turn helps to keep the fuel temperature lower since the conductance of the
gap is not lowered as much by fission gas buildup. The other two cases have a release
fraction around 20% for most of their life, with the higher swelling case showing about
5% higher release than the standard case.

2400
2200
2000
1800
1600
1400
1200
1000
800
6000 20 40 60 80 100 120
Burnup (MWd/kgU)
Figure 4.28 Fuel Temperature for Different Irradiation Swelling Models.
35
30
25
0 20 40 60 80Bumup (MWd/kgU)
Figure 4.29 Fractional Fission Gas Release forSwelling Models.
100 120
Different Irradiation
Although there is a large difference in the release fraction, none of the three cases
examined caused a large change in fuel rod internal pressure; the low swelling case is
about 3 MPa less than the standard case, and the high swelling case about 1 MPa higher
during the majority of the rod life. At very high burnup, above 80 MWd/kgU, when the
high burnup fission gas release becomes significant, the fission gas release and plenum

pressures increase for all three cases and approach the same value, since this release is
dependent on burnup and not fuel temperature.
4.3.4 Young's Modulus Variations
The variation in Young's modulus from the data on SiC composites in Chapter 3 gives
values between 30 and 300 GPa at room temperature, depending on the construction
[Jones et al., 1997 and Nogami et al., 2004]. In addition, the neutron fluence dependence
varies, with reported degradation up to 60% by 26 DPA [Hollenberg et al., 1995], but
with much less change predicted for composites incorporating newer fiber types.
Therefore the models, given in Table 4.4, select these extreme cases in order to elicit the
widest range of likely stress-strain behavior. Since the temperature dependence varies
only slightly in the available cases, the current linear assumption of -40 MPa/K between
300 and 1000 K is maintained in all three models.
Table 4.4 Young's Modulus Sensitivity Conditions.
Condition Selected Value High Range Low RangeRoom Temperature Modulus 150 GPa 300 GPa 30 GPaFluence Dependence -40% at 20 DPA None -60% at 20 DPA
The change in Young's modulus has the anticipated effect of changing the strain of the
cladding at various points during operation, as shown in Figure 4.30. For the models
using the selected value and the high range value of the modulus there is very little
change, but the differences are more apparent for the low range model. The lower
modulus allows the external pressure to have a larger compressive effect on the cladding,reducing the diameter after the effects of swelling and thermal expansion are considered.
At 30 MWd/kgU, the rod internal pressure equals the external pressure, and all three
cases approach the same value. As rod internal pressure continues to increase due to
fission gas release, the low range modulus case again shows this pressure effect most
clearly. It increases rapidly in the very high fission gas release region, and the calculation
becomes numerically unstable past 95 MWd/kgU. The other two cases show a small91

increase in hoop strain, but do not dramatically increase until acted on by fuel swelling at
95 MWd/kgU.
The impact of these three modulus values on gap width is small. As shown in Figure
4.31, at normal burnup they differ by only one thousandths of a millimeter at the widest
point, and the values begin to converge at higher burnup. This small change in gap width
has no appreciable affect on the predicted fuel pellet temperature or the rod internal
pressure, and therefore does not change the predicted fission gas release either. At very
high burnup, the low range model predicts cladding lift-off from the fuel due to the rapid
increase in internal pressure over the external coolant pressure. Again, the results become
numerically unstable as the cladding expands; however, by that point the large strain
would be unacceptable performance in a real reactor.
1.02
1.01
1
0.99
0.98
0.97
0.96
0.950 20 40 60 80 100 120
Bumup (MWdlkgU)
Figure 4.30 Cladding Inner Diameter for Different Young's ModulusModels.

0.14
0.12
E 0.1
• 0.08
cL 0.06
0.04
0.02
0
0 20 40 60 80 100 120Burnup (MWd/kgU)
Figure 4.31 Radial Fuel-Cladding Gap Width for Different Young's ModulusModels.
4.4 Investigation of Possibilities for Performance Enhancement
Based on the results obtained in the constant power and Manzel test case, there are
several areas of SiC-clad fuel rod behavior that indicate a possible need for design
review. In particular, it would be beneficial to the performance of SiC-clad fuel rods both
in normal and very high burnup scenarios to mitigate the low cladding thermal
conductivity and low gap conductance.
The result of the cladding's poor thermal performance is a higher average fuel
temperature, which increases both the rate of fission gas release and pellet swelling. It is
desirable to reduce the fission gas release and pellet swelling because they put additional
mechanical stress on the cladding, and may accelerate chemical interactions. There are
several avenues for addressing these issues, including changing the initial fill gas
pressure and using annular fuel pellets, which are discussed below.
4.4.1 Initial Fill Gas Pressure
In a Zircaloy fuel rod the initial fill gas is required to prevent the cladding from
collapsing under the coolant pressure, and reduces the likelihood of fuel-cladding93

mechanical interaction during the majority of the fuel rod's life. In addition, helium is
used as the fill gas since it has a high thermal conductivity and low neutron capture cross
section.
Because of the high strength of the SiC cladding, large Young's modulus, and lack of
creep, it is possible to change the initial fill gas pressure significantly without
compromising the initial structural stability of the fuel rod. With this ability in mind, two
scenarios were examined: reducing the initial fill gas pressure in order to prevent over-
pressurization, and increasing the initial fill gas pressure in order to improve the gap
conductance.
The fill gas pressure used in the Manzel test case is 3.3 MPa as stipulated by the Oconee
test case supplied by PNNL. For a low pressure test, one tenth of this value was used,
which is about three times atmospheric pressure. For the high pressure case, it was
decided to have an initial pressure that would produce at most one-half of the cladding
failure hoop stress when the rod external surface is at atmospheric pressure (as a safety
factor). The cladding, with internal diameter of 0.958 cm and thickness of 0.673 mm,
may be treated as a thin-walled pressure vessel. The hoop stress is then given as,
P-rGh = (4.1)
t
where P is the net pressure, r is the cladding radius, and t is the cladding thickness. Based
on the model used for FRAPCON-SiC, the minimum ultimate tensile strength of the
cladding is 87 MPa after reaching radiation-induced saturation at 700 K; the desired
initial He fill pressure is then 6 MPa. The reactor coolant pressure is maintained at 15.2
MPa for all three cases.
Table 4.5 Initial Fill Gas Pressure Options.
Selected Value High Case Low CaseCold, zero power He fill gas pressure 3.3 MPa 6 MPa 0.33 MPa

The fuel rod internal pressure histories resulting from these choices of initial fill gas
pressure, which are outlined in Table 4.5, are shown in Figure 4.32. At the beginning of
life there is a large increase in the internal pressure as the rod goes from cold, zero power
to hot, full power. The resulting initial "hot" pressure is 19 MPa for the high range case,
10 MPa for the standard case, and 1 MPa for the low range case. Two interesting trends
are apparent in this plot: the high pressure case mirrors the standard case shifted by the
difference in initial "hot" pressure all the way to very high burnup. On the other hand, the
low case quickly gains pressure and actually surpasses the standard case around 35
MWd/kgU.
60 1
50
-- 40
42 30
0. 20
10
A
--- High_. . • Selected
Low
0 20 40 60 80 100 120Burnup (MWd/kgU)
Figure 4.32 Internal Free Gas Pressure for Different Initial Fill GasPressures.
The reason for the large difference in pressure is the fission gas release, which is driven
by fuel temperature. The fuel temperature for each case as a function of burnup is shown
in Figure 4.33, and clearly identifies the undesirable effects of the low fill pressure case
as the fuel temperatures peaks 400 K higher than the standard case. The difference in
temperature is due to the low gap conductance in the low pressure rod, shown in Figure
4.34, which is caused by the low initial fill pressure and exacerbated by a faster dilution
by fission gasses. Similar to the other two cases, the conductance improves past 70
MWd/kgU as the gap closes.

260024002200
2000
1800
1600
1400
1200
1000
800
6000 20 40 60 80
Burnup (MWdlkgU)
Figure 4.33 Fuel Temperature for Different Initial
1.0E+06
E
S1.OE+05
o
o 1.0E+04
1.0E+03
100 120
Fill Gas Pressures.
0 20 40 60 80 100 120Burnup (MWd/kgU)
Figure 4.34 Fuel-Cladding Gap Thermal Conductance for Different InitialFill Gas Pressures.
The higher initial fill gas pressure, while not producing as dramatic effect as the low
pressure case, does bring measurable improvement to the fuel rod's performance. The
fuel pellet temperatures are reduced up to 50 K from 10 to 50 MWd/kgU, and in general,
the gap conductance is higher than the standard case. The lower fuel temperature lowers
the fission gas release in Figure 4.35 by 5 to 10% during most of operation; at very high
burnup the release figures converge.

It should be noted that while the higher pressure did result in lower fuel temperature, the
absolute internal rod pressure was significantly higher than the standard case for the
length of operation. With the higher internal pressure, the SiC failure stress is achieved at
85 MWd/kgU, about 10 MWd/kgU earlier than the standard case. In addition, the time of
gap closure (and therefore fuel-cladding mechanical interaction) given by the rise in
conductance in Figure 4.34 was not significantly delayed from the standard case. One can
conclude that the selected fill gas pressure shows the best overall performance. This
reflects a proper selection of the initial fill gas pressure by the manufacturer.
Vu
50
40
6 30U.
20
10
00 20 40 60 80 100 120
Bumup (MWd/kgU)
Figure 4.35 Fractional Fission Gas Release for Different Initial Fill GasPressures.
4.4.2 Annular Pellets
As discussed in Chapter 1, annular fuel pellets have been explored as a way to reduce the
peak fuel temperature. The central void can reduce the peak pellet temperature, which
then occurs at the pellet inner diameter, although it removes fuel volume from the core.
For this analysis, pellets with inner void volumes of 5 and 10% of total pellet volumewere used, as detailed in Table 4.6. These void volumes are representative of pastexperiments based on data from the High Burn-Up Effects Program and Russian reportsof VVER fuel performance [Turnbull, 2002 and Bibilashvili et al., 1994].

Table 4.6 Fuel Pellet Central Void Dimensions.
Pellet type Solid Pellet 5% Void 10% VoidFuel outer diameter (cm) 0.932 0.932 0.932Fuel inner diameter (cm) - 0.2085 0.2949
The addition of the void space at the center of the pellet reduces peak fuel temperature (at
the pellet inner diameter), as shown in Figure 4.36 for both of the annular pellet cases.
The 5% pellet central void volume decreases the peak temperature by almost 200 K at the
beginning of life, with the temperature remaining below that of the standard solid pellet
until discharge. Doubling the void volume adds a further temperature reduction, although
only about 50% beyond the reduction achieved by the 5% void volume.
2200
2000
1800
1600
1400
1200
1000
800
60020 40
+-t Solid (Centerline) -- Solid (OD)
'~ -- 5 Vo (ID) -- --5 Vo (OD)1 .--- 10 Vo (ID) e 10 No (OD)
--- -- --- - -- -- -
60Bumup (MWd/kgU)
80 100
Figure 4.36 Fuel Temperature for Solid and Annular Fuel Pellets.
The pellet surface temperatures are up to 100 K higher for the annular pellets versus the
solid, especially around 70 MWd/kgU. The larger difference at this point is mostly
because the radial fuel-cladding gap closes earlier for the solid pellet, since it experiences
more swelling due to the higher centerline temperature. As shown in Figure 4.37, the
consequence of the larger void is that the gap remains open longer, not achieving soft
closure until the end of life for the 10% void volume case.
120I I II

0.07
0.06
0.05E
E 0.04
o 0.03
0.02
0.01
0
Burnup (MWd/kgU)
Figure 4.37 Radial Fuel-Cladding Gap for Solid and Annular Fuel Pellets.
Besides reducing the pellet swelling, the second intention of reducing the peak fuel
temperature is to reduce the fission gas release. From Figure 4.38 it is apparent that this
goal is achieved below 50 MWd/kgU for both void volumes, and extended up to 65
MWd/kgU for the 10 volume percent case. However, beyond that point the fission gas
release exceeds the solid pellet by about 5% for the 5 volume percent pellet, and about
10% for the [10 volume percent pellet. This increase is attributable to the fact that the gap
remains open for the alular pellets, where it has closed for the solid pellet. Therefore,
although the peak fuel temperature is reduced, the average fuel temperature (and
especially the temperature at the pellet rim) will be somewhat higher for the annular
pellets.
1_
20
20
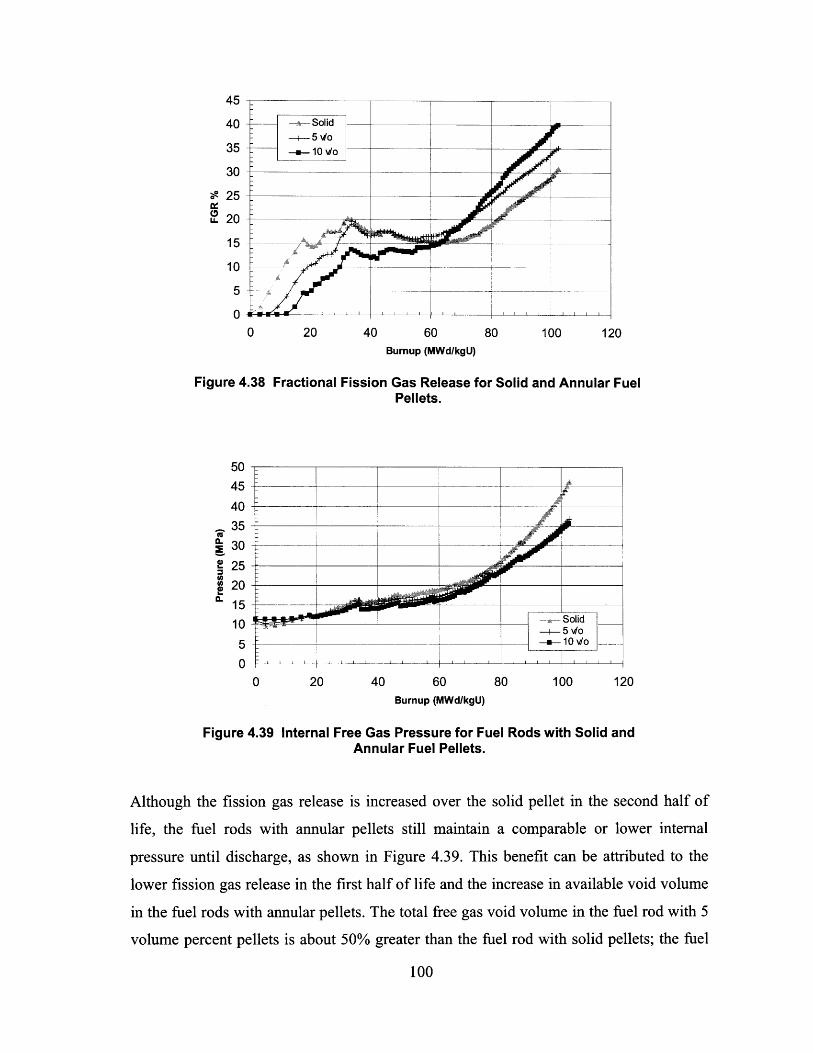
0 20 40 60 80 100Burnup (MWd/kgU)
120
Figure 4.38 Fractional Fission Gas Release for Solid and Annular FuelPellets.
0 20 40 60 80 100Burnup (MWd/kgU)
Figure 4.39
120
Internal Free Gas Pressure for Fuel Rods with Solid andAnnular Fuel Pellets.
Although the fission gas release is increased over the solid pellet in the second half of
life, the fuel rods with annular pellets still maintain a comparable or lower internal
pressure until discharge, as shown in Figure 4.39. This benefit can be attributed to the
lower fission gas release in the first half of life and the increase in available void volume
in the fuel rods with annular pellets. The total free gas void volume in the fuel rod with 5
volume percent pellets is about 50% greater than the fuel rod with solid pellets; the fuel
100

rod with 10 volume percent pellet voids has 100% more void space than the fuel rod with
solid pellets.
4.5 MOX Fuel
Because there is interest in utilizing light water reactors to bum excess plutonium, either
from military stockpiles or extracted from spent commercial nuclear fuel, the
combination of MOX fuel with SiC was investigated. MOX fuel combines U0 2,
generally depleted in U-235, and PuO 2 in a single fuel form. The plutonium loading is
generally on the same order of the U-235 loading in a typical LWR fuel rod.
A typical MOX fuel loading was supplied by PNNL, and is presented in Table 4.7. The
fuel for this case is 5.95 percent plutonium by weight. This plutonium isotopic vector
represents typical MOX fuel fabricated from excess reactor-grade plutonium [Lanning et
al., 2005]. Besides the isotopic loading, the pellet density, geometry and reactor
conditions are the same as the Manzel test case used previously.
Table 4.7 MOX Fuel Actinide Vector.
Isotope Initial Uranium Atom % Initial Plutonium Atom %U-235 0.229U-238 99.771Pu-239 - 65.8Pu-240 23.4Pu-241 - 7.39Pu-242 - 3.33
This analysis compared the behavior of the typical UO2-fueled Zircaloy-clad rod
examined in Chapter 2 with that of both a MOX-fueled Zircaloy-clad rod and the MOX-
fueled SiC-clad rod based on the FRAPCON-SiC code. In this way, both the effect of the
new fuel form and the new cladding can be evaluated. The modifications to the very high
burnup fission gas release model discussed in Chapter 2 were used for MOX fuel
modeling in part because better data was not available, and also because fission gas
101

release mechanisms are thought to be similar in urania and plutonia fuel. The FRAPCON
Massih fission gas release model does take into account the increased rate of gas
diffusion in MOX fuel.
Concerning fuel rod thermo-mechanical behavior, the major difference between UO2 and
MOX is the lower thermal conductivity of the fuel. This raises the fuel temperature, as
shown by Figure 4.40, where the MOX fuel with Zircaloy cladding is 100-200 K hotter at
pellet centerline than the UO2-fuelled pin. This difference is obscured at the beginning of
life, since the MOX fuel experiences more swelling and therefore closes the fuel cladding
gap before this occurs with UO2 pellets. However, by 10 MWd/kgU, when both Zircaloy
fuel-cladding gaps are closed, the temperature difference due to fuel thermal conductivity
is apparent. This distinction remains until the end of life, however the difference
decreases as the pellet heat generation rate decreases.
S-- MOXw/ SiC (Centerline) - MOXw/ SiC (OD)zzuu
2000
1800
e 1600
? 1400
E 1200
1000
800
6000 20 40 60 80 100 120
Burnup (MWdIkgU)
Figure 4.40 Fuel Temperature for Zircaloy-Clad Fuel Rods with U02 andMOX Fuel, and SiC-Clad Fuel Rods with MOX Fuel.
The MOX fuel with SiC cladding experiences high pellet temperatures because of the
lower thermal conductivity of the cladding and because the fuel-cladding gap does not
close until there has been sufficient pellet swelling around 50 MWd/kgU. The results of
these fuel temperatures on the relative fission gas release fraction follows as expected.
From Figure 4.41 it can be seen that the successively higher fuel temperatures in the
102

MOX and SiC fuel rods leads to much higher fission gas release early in life, especially
for the SiC-clad fuel rod.
This release leads to higher internal pressures, shown in Figure 4.42, where it can be seen
that the SiC-clad fuel rod exceeds the primary coolant pressure after 20 MWd/kgU,
whereas the Zircaloy-clad rods take 60-80 MWd/kgU to reach this point. Besides the
increase in fission gas release in the SiC-clad fuel rod, this difference in pressure increase
is also due to the ability of the Zircaloy cladding to expand outward due to increasing
internal pressure more readily than the SiC. However, in all three cases the rod pressure
begins to increase significantly once reaching the very high burnup fission gas release
regime.
40
35
30
25
'A 20
15
10
5
00 20 40 60
Bumup (MWdIkgU)
Figure 4.41 Fractional
103
80 100 120
Fission Gas Release from UO2 and MOX Fuel Pinswith Zr and SiC Cladding.

60
50
40Lu
2 30
1 20
10
n
-- MOXw/ SiC
U02 w/l Zr
-- MOXw/ Zr
I&AW
0 20 40 60 80 100 120Bumup (MWd/kgU)
Figure 4.42 Internal Free Gas Pressure for UO2 and MOX Fuel Rods with Zrand SiC Cladding.
4.6 Summary of SiC Model Performance
The modeling of UO2 fueled rods with SiC cladding has demonstrated both the
advantages and challenges of implementing a ceramic cladding. In general, the SiC
cladding showed good tolerance to the temperatures and pressures that will exist up to
extremely high burnup - 100 MWd/kgU. The models that have been developed show that
the properties of SiC composites are stable after initial radiation interaction up to very
high DPA. The parameters that merit particular refinement are the thermal conductivity
and irradiation swelling, as variations within the available data produced large changes in
critical metrics such as peak fuel temperature and fission gas release. It is also important
that the Young's modulus be sufficiently high, at least on the order of the conservative
estimate used in FRAPCON-SiC, to avoid excessive strain at very high burnup.
The modeling also identified the cladding characteristics that have the greatest impact on
behavior when compared to typical Zircaloy fuel rods. The lower thermal conductivity of
SiC in comparison to Zircaloy increases the average cladding temperature and increases
the temperature gradient across the cladding, as well as increasing the fuel pellet average
temperature. Because the SiC does not experience creep at typical cladding temperatures,104

it demonstrates an excellent ability to maintain geometry despite widely varying internal
pressure and fuel swelling. However, because SiC does not creep down onto the fuel as
occurs in a Zircaloy rod, the gap conductance over the operational life is generally lower,
contributing to higher fuel temperatures. The result of these higher pellet temperatures is
increased fission gas release and therefore increased pressurization of the fuel rod.
These problems could be mitigated through several means, and two were investigated
here: changing the initial fill gas pressure, or using annular fuel pellets. Increasing the fill
pressure does improve gap conductance and decrease the average fuel temperature,
reducing fission gas release. However, the increase in initial cold pressure may reduce the
margin to rod failure due to internal stress more than it is gained by lower fission gas
release.
Annular pellets are very effective at reducing peak fuel pellet temperatures, which results
in a significant reduction in fission gas release up to burnup around 60 MWd/kgU. Once
reaching the very high burnup regime, however, the higher rim temperature tends to
cause more fission gas release than a solid pellet at that burnup. However, there is a
benefit from the reduced fuel rod internal pressurization, which could make this an
advantageous design.
The use of MOX fuel with SiC cladding was also investigated in comparison to MOX
used with Zircaloy cladding. In general, the behavior of the MOX and U0 2 fuel is
equivalent, with the SiC-clad MOX fuel rod running at a higher average temperature than
the Zircaloy-clad fuel rod. In particular, the time for fuel-cladding gap closure and the
fission gas release were both greater in the SiC-clad fuel rod. It is possible that the same
ideas explored to reduce temperature in the UO2 fuel, such as adjusting the fill gas or
using annular pellets, be beneficial applied to the MOX fuel.
105
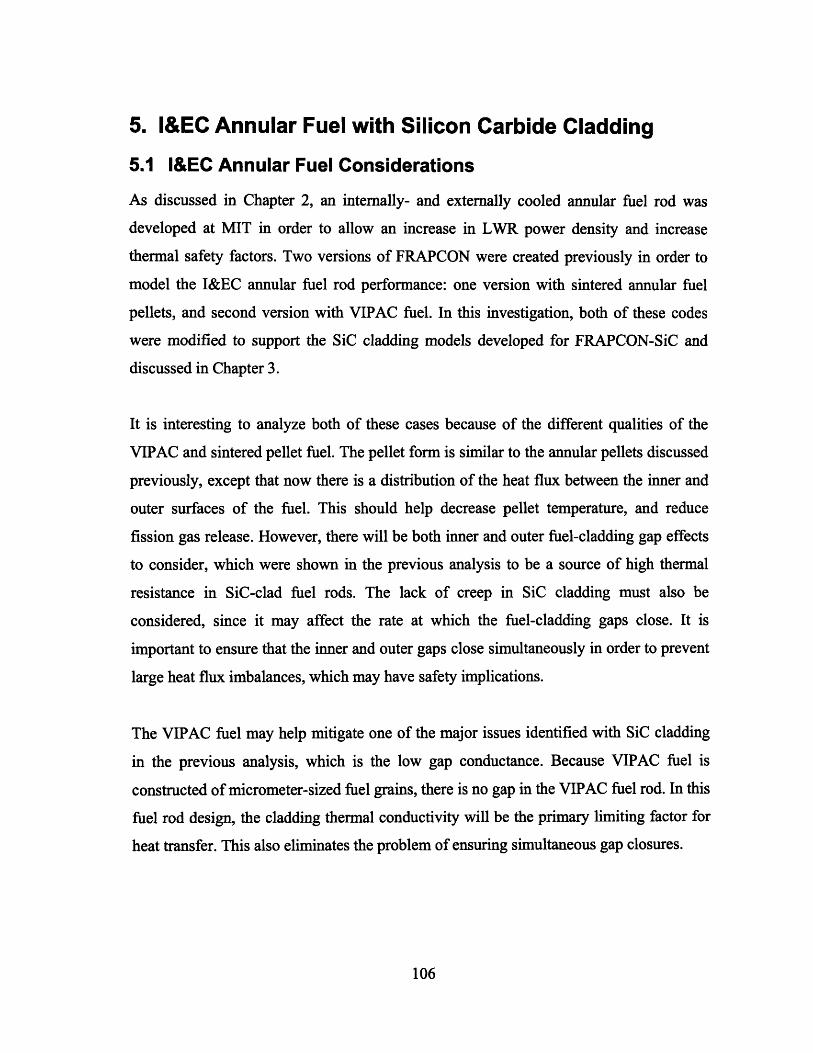
5. I&EC Annular Fuel with Silicon Carbide Cladding
5.1 I&EC Annular Fuel Considerations
As discussed in Chapter 2, an internally- and externally cooled annular fuel rod was
developed at MIT in order to allow an increase in LWR power density and increase
thermal safety factors. Two versions of FRAPCON were created previously in order to
model the I&EC annular fuel rod performance: one version with sintered annular fuel
pellets, and second version with VIPAC fuel. In this investigation, both of these codes
were modified to support the SiC cladding models developed for FRAPCON-SiC and
discussed in Chapter 3.
It is interesting to analyze both of these cases because of the different qualities of the
VIPAC and sintered pellet fuel. The pellet form is similar to the annular pellets discussed
previously, except that now there is a distribution of the heat flux between the inner and
outer surfaces of the fuel. This should help decrease pellet temperature, and reduce
fission gas release. However, there will be both inner and outer fuel-cladding gap effects
to consider, which were shown in the previous analysis to be a source of high thermal
resistance in SiC-clad fuel rods. The lack of creep in SiC cladding must also be
considered, since it may affect the rate at which the fuel-cladding gaps close. It is
important to ensure that the inner and outer gaps close simultaneously in order to prevent
large heat flux imbalances, which may have safety implications.
The VIPAC fuel may help mitigate one of the major issues identified with SiC cladding
in the previous analysis, which is the low gap conductance. Because VIPAC fuel is
constructed of micrometer-sized fuel grains, there is no gap in the VIPAC fuel rod. In this
fuel rod design, the cladding thermal conductivity will be the primary limiting factor for
heat transfer. This also eliminates the problem of ensuring simultaneous gap closures.
106

5.2 FRAPCON VIPAC Model
5.2.1 Model DevelopmentThe MIT I&EC annular fuel geometry, encapsulated in a SiC duplex annular cladding, is
shown schematically in Figure 5.1. In this case, the inner diameter of the fuel is supported
by a SiC monolith, which is reinforced by the fiber-matrix SiC composite outer layer. In
this manner, only the inner and outer composite surfaces are exposed to the reactor
coolant.
As discussed previously, the SiC cladding model for I&EC annular fuel includes only the
properties of the fiber-matrix composite, and assumes that this composite makes up the
entire thickness of the cladding. This new version of FRAPCON has been denoted as
FRAPCON-3.3HB-VIPAC-SiC, and contains the same SiC cladding properties that were
developed and discussed previously as a part of FRAPCON-SiC. This version of the code
was developed directly from the updated version of Yi Yuan's original annular VIPAC
code, FRAPCON-VA, discussed in Chapter 2.
Coolant
SiC Composite
SiC Monolith
- Fuel
Figure 5.1 I&EC VIPAC Annular Fuel Rod with SiC Duplex Cladding.
107
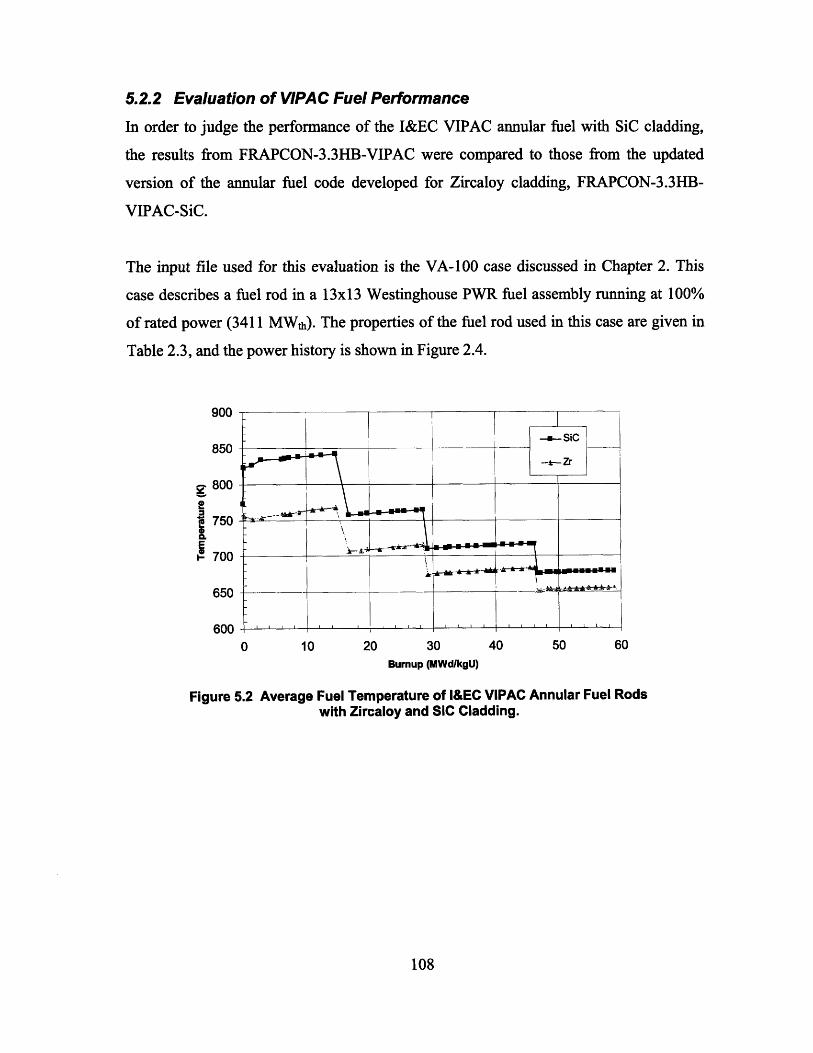
5.2.2 Evaluation of VIPAC Fuel Performance
In order to judge the performance of the I&EC VIPAC annular fuel with SiC cladding,
the results from FRAPCON-3.3HB-VIPAC were compared to those from the updated
version of the annular fuel code developed for Zircaloy cladding, FRAPCON-3.3HB-
VIPAC-SiC.
The input file used for this evaluation is the VA-100 case discussed in Chapter 2. This
case describes a fuel rod in a 13x13 Westinghouse PWR fuel assembly running at 100%
of rated power (3411 MWth). The properties of the fuel rod used in this case are given in
Table 2.3, and the power history is shown in Figure 2.4.
900
850
800
750Ei- 700
650
6000 10 20 30
Burnup (MWdlkgU)
Figure 5.2 Average Fuel Temperature of l&EC VIPACwith Zircaloy and SiC Cladding.
40 50 60
Annular Fuel Rods
108

660
650
640
2 630" 620
C. 610E. 600
590
58057n
a- -. o ----- SiC (OD)
----..- SiC (ID)---•-Zr (OD)-. _--_ Zr (ID)
- - E. (3131. Mi .a a M CE EMooMo
0 10 20 30 40 50 60Bumup (MWdlkgU)
Figure 5.3 Average Cladding Temperature of Zr- and SiC-clad I&EC VIPACAnnular Fuel Rods.
As shown in Figure 5.2, the SiC-clad fuel rod has a higher average fuel temperature than
the Zr-clad fuel rod due to the SiC's lower thermal conductivity. The difference is 50-60
K at beginning of life, and narrowing to less than 20 K by discharge. Overall, however,
the fuel temperature behavior over the irradiation life of the fuel rod is the same as the
Zr-clad fuel rod: a steady temperature profile in time at each power level.
This same relationship, in terms of temperature difference and behavior, is reflected in
the cladding temperature history shown in Figure 5.3. This stable behavior is a result of
the VIPAC fuel maintaining a closed fuel-cladding gap, therefore avoiding large effects
due to gap conductance.
The low fuel temperatures and moderate burnup in this case result in a low fission gas
release, which is calculated to be approximately linear with burnup and below 0.3% by
end of life for both fuel rods. This low gas release and the low initial fill gas pressure, just
1.4 MPa, contribute to a low rod internal pressure during operation that decreases with
time, as plotted in Figure 5.4. The small decrease of about 0.25 MPa over the lifetime of
both fuel rods is attributable to the straining of both the inner and outer cladding due to
fuel swelling. This strain is small, less than 0.2% for either of the fuel rods that were
109

modeled, although the higher fuel temperature in the SiC-clad fuel rod contributed to
several hundredths of a percent more swelling than the Zr-clad fuel rod.
3
2.5
2
S1.5
1
0.5
00 10 20 30
Bumup (MWd/kgU)
Figure 5.4 Internal Free Gas Pressure of Zr-Annular Fuel Rods.
40 50
and SIC-clad I&EC VIPAC
5.2.3 VIPAC Fuel at Very High Burnup
In order to observe the effects of very high burnup on the thermo-mechanical behavior of
the I&EC annular fuel rod with SiC cladding, a new FRAPCON case was created. This
case is a hypothetical extension of the VA-100 case used above, but starts at 150% of the
original power density and continues up to 100 MWd/kgU. This input case will therefore
allow examination of the fuel rod behavior in the very high burnup fission gas release
regime, as well as with increased fuel swelling.
The power history for this case is given in Figure 5.5 and the burnup in Figure 5.6, where
the results for the fuel rod with Zircaloy cladding (Zr) and SiC cladding (SiC) are
equivalent. This burnup and power scheme represents about 4.5 years of full power
reactor operation at a 95% capacity factor.
110

T~ 1 [ [ r 1e-ammee I I I I-V,
I ' 7jMM"-__ ____
s-meI m I i_____II ___I
1000Time (days)
1500500 2000
Figure 5.5 Average Power of I&EC VIPAC Annular Fuel High Burnup Casewith Zircaloy and SiC Cladding.
120
100
0 500 1000 1500
Time (days)
2000
Figure 5.6 Average Burnup of I&EC VIPAC Annular Fuel High Burnup Casewith Zircaloy and SiC Cladding.
The fuel temperature history for these cases, shown in Figure 5.7, gives a higher average
temperature for the SiC cladding throughout the irradiation. This temperature difference
is due almost entirely to the difference in thermal conductivity between the Zircaloy and
the SiC, since both fuel-cladding gaps are always closed. However, as shown in Figure
5.8, the higher fuel temperature is not significant enough to yield a higher fission gas
111
20
z15
0z- 10-J
5
0

release for the SiC cladding case. Overall, the fission gas release for both cladding types
is significantly lower for this case than the Manzel high burnup case that was examined
earlier; the maximum release at 100 MWd/kgU is below 10%.
1000
950
900
850
800
750
700
650
6000 20 40 60 80 100
Burnup (MWdlkgU)
Figure 5.7 Average Fuel Temperature of I&EC VIPAC Annular Fuel HighBurnup Case with Zircaloy and SiC Cladding.
0 20 40 60 80Bumup (MWdlkgU)
100
Figure 5.8 Fractional Fission Gas Release of I&EC VIPAC Annular FuelHigh Burnup Case with Zircaloy and SIC Cladding.
112

Given the small amount of fission gas release over the lifetime of the fuel rods, both rod
internal pressure predictions are low and roughly equivalent, as shown in Figure 5.8.
Even at the end of life, the pressure in both rods is well below the external coolant
pressure. There are small drops in the pressure around 30, 60, and 85 MWd/kgU due to
drops in the fuel temperature as the power level decreases.
The cladding strain for each fuel rod follows a similar trend, shown in Figure 5.10, where
both claddings are strained outward by a small amount (the outer cladding diameter
increases while the inner cladding diameter decreases); less than one tenth of a millimeter
for both fuel rods. This movement is due to mechanical interaction with the fuel as it
swells due to microstructure changes and the buildup of fission products. The higher
temperature of the SiC cladding, along with the higher temperature of the fuel and higher
plenum pressure contributes to slightly more swelling in the SiC-clad fuel rod.
a.
£3
2
1
00 20 40 60 80
Bumup (MWdlkgU)100
Figure 5.9 Internal Free Gas Pressure of I&EC VIPAC Annular Fuel HighBurnup Case with Zircaloy and SiC Cladding.
113
A

flA _ _
0.3
0.2
0.1
0S-0.1
-0.2
-0.3
-0.4
-0.50 20 40 60 80 100
Bumup (MWd/kgU)
Figure 5.10 Average Cladding Strain of I&EC VIPAC Annular Fuel HighBurnup Case with Zircaloy and SiC Cladding.
5.3 FRAPCON Sintered Annular Fuel Model
5.3.1 Model Development
The sintered annular pellet model uses a fuel form very similar to the annular pellets
discussed in Chapter 4, however they are generally larger in diameter, and the boundary
conditions on the inner fuel surface are more complex. A cross section of this fuel rod
design is shown in Figure 5.11, which highlights the major difference between this model
and the VIPAC fuel model discussed previously - the presence of fuel cladding gaps in
the inner and outer annulus.
The version of FRAPCON developed to model this fuel is FRAPCON-3.3HB-SA-SiC.
The results were compared to the Zircaloy-clad I&EC sintered annular fuel rod using
FRAPCON-3.3HB-SA. The SiC modeling version was developed from the Zircaloy
version by adding the SiC property models discussed previously.
114

Coolant
SiC Composite
SiC Monolith
- Fuel
"Gas Gap
Figure 5.11 I&EC Sintered Annular Fuel Rod with SiC Duplex Cladding.
5.3.2 Evaluation of Sintered Annular Fuel PerformanceThe case used for this analysis of the SiC-clad I&EC sintered annular fuel rod is the SA-
100 case described in Chapter 2. This case is a 13x13 Westinghouse PWR fuel assembly
running at 100% of rated power (3411 MWth), with the fuel and cladding properties given
in Table 2.2.
The fuel rod temperature profile develops over the first few time steps in this case due to
swelling and creep in the claddings; The average fuel temperatures are shown in Figure
5.12. The Zircaloy cladding creeps down onto the fuel's internal and external surface by
about 7 MWd/kgU, and the gap remains closed for the rest of the irradiation.
The SiC cladding does not creep, but instead swells due to thermal expansion and
irradiation over the first few time steps. This opens the fuel-cladding gap and raises the
temperature of both the fuel and the cladding, which is shown in Figure 5.13. At the peak,
the fuel temperatures of the SiC-clad fuel rod are 140 K higher than the Zr-clad rod.
There is also a larger difference in the temperature profile across the fuel pellet radius,with the inner surface 20-50 K higher than the outer surface. This is compared to at most
a 10 K difference in the Zr-clad pellet.
115

An interesting effect of the lower thermal conductivity of the SiC cladding is that the
average temperatures of the inner and outer SiC cladding are almost identical, whereas
there is about a 10 K difference in the Zircaloy. Although the average SiC cladding
temperature is higher, a close match between these temperature of the inner and outer
cladding indicates a better balance of the heat flux through the two surfaces to the
coolant, which is advantageous from a safety standpoint.
850
800
750
E 700I-
650
6000 10 20
B
30uumup (MWd/kgU)
40 50 60
Figure 5.12 Average Fuel Temperature for I&EC Sintered Annular PelletFuel Rods with Zircaloy and SiC Cladding.
116

650
640
630
E 620
. 610E
600
590
5800 10 20 30 40 50 60
Bumup (MWdlkgU)
Figure 5.13 Cladding Temperature for I&EC Sintered Annular Pellet FuelRods with Zircaloy and SiC Cladding.
The SiC cladding also exhibits more stable mechanical behavior over the irradiation
history, shown in Figure 5.14. By the second time step, the SiC cladding has reached its
final radial deformation due to the interplay of the coolant pressure acting on the inner
and outer cladding surfaces, and the thermal expansion and irradiation swelling of the
cladding. The creep in the Zircaloy cladding results in larger initial strains as the fuel-
cladding gap closes, and then the cladding is pushed outward through mechanical contact
with the expanding fuel pellet.
The fuel rod internal pressure in these sintered annular pellet cases, plotted in Figure
5.15, is similar to that of the VIPAC fuel. It starts with a helium fill pressure of 1.4 MPa,
and is aided by the low fuel temperatures that keep fission gas release around 0.3% for
the length of the irradiation. The SiC-clad fuel rod pressure rises by about 1 MPa as the
fuel swells and closes the radial fuel-cladding gap.
117

1
S0.5
e 0
-0.5
-10 10 20 30 40 50 60
Bumup (MWdlkgU)
Figure 5.14 Average Cladding Strain of Sintered Annular Pellet Fuel Rodswith Zircaloy and SiC Cladding.
a.IL
-3ED0ccLD-A
0 10 20 30 40 50Bumup (MWdlkgU)
Figure 5.15 Internal Free Gas Pressure for I&EC Sintered Annular PelletFuel Rods with Zircaloy and SiC Cladding.
The fuel-cladding gap conductance, which is important for determining the balance of the
heat flux through the inner and outer cladding surfaces, is shown in Figure 5.16. The
conductivity of the gap with Zircaloy cladding rises significantly as the cladding creeps
down, then drops primarily due to fission gas release. On the other hand, the SiC-clad
fuel rod's conductance remains lower but relatively constant. A steady conductance
118

history is important for ensuring that there are not large changes in the heat flux through
either surface, which may have safety implications related to departure from nucleate
boiling.
6.0E+04
J 5.OE+04E
4.0E+04
3.OE+04
2.OE+04
1.OE+04
O.OE+000 10 20 30
Bumup (MWdlkgU)
40 50 60
Gap Conductance for I&EC Sintered Annularwith Zircaloy and SiC Cladding.
Pellet Fuel Rods
5.3.3 Sintered Annular Fuel at Very High Burnup
As with the VIPAC fuel analysis, it is desirable to predict the performance of I&EC
sintered annular fuel rod at very high burnup. Using the SA-100 input case from the
above analysis, the initial power density was increased by 150%, and the irradiation time
extended to achieve about 100 MWd/kgU at discharge. The power history for this case is
the same as the one shown in Figure 5.5, and the burnup is given in Figure 5.17.
119
Figure 5.16

4nn--_IU.IUUVV
9080
5 7060
E 50= 40E1 30
201000 500 1000 1500 2000
EFPD
Figure 5.17 Average Burnup of I&EC Sintered Annular Fuel High BurnupCase with Zircaloy and SiC Cladding at 150% Power Density.
The average fuel temperature for the SiC-clad fuel rod is even higher in this case than the
VIPAC fuel rod because of the fuel-cladding gap. In Figure 5.18 the closure of the
Zircaloy fuel-cladding gap, which occurs by 10 MWd/kgU, is revealed by the sudden
drop in the average fuel temperature. The opposite is true for the SiC-clad fuel rod, where
the fuel pellet outer diameter temperature increases during the first few time steps as the
cladding swells outward, away from the fuel. The result is the fuel temperature averaging
100-150 K higher during the first half of life; the temperatures of the two fuel rods begin
to converge at high burnup as the fuel swells outward and closes both gaps at 70
MWd/kgU.
120

1UUU
950
900
850
8000.E 750i-
700
650
6000 20 40 60 80 100
Bumup (MWd/kgU)
Figure 5.18 Average Fuel Temperature of I&EC Sintered Annular Fuel HighBurnup Case with Zircaloy and SiC Cladding.
Like the fission gas release prediction for VIPAC fuel, the gas releases for the sintered
annular pellets is low, with the most significant release predicted in the very high burnup
region. As shown in Figure 5.19, the release is very similar for the two fuel rods due to
the low average fuel temperatures, and is below 8% at discharge.
The resulting internal pressurization of the fuel rods, shown in Figure 5.20, is again
similar to the VIPAC case. The majority of the pressure increase occurs during the very
high burnup fission gas release, but final pressures are still below the external pressure.
The SiC-clad fuel rod experiences slightly higher pressures due in part to the higher gap
temperatures because of the wider fuel-cladding gaps, and because the SiC does not yield
outwards as readily under the pressure from the gas pressure and from the fuel
mechanical interaction.
121
IIIAA

0 20 40 60 80Burnup (MWd/kgU)
100
Figure 5.19 Fractional Fission Gas Release of I&EC Sintered Annular FuelHigh Burnup Case with Zircaloy and SiC Cladding.
0 20 40 60 80Bumup (MWd/kgU)
Figure 5.20
100
Internal Free Gas Pressure of I&EC Sintered Annular Fuel HighBurnup Case with Zircaloy and SiC Cladding.
The cladding strains during this high burnup case, shown in Figure 5.21, are very similar
to the SA-100 case analyzed above at low burnup. The Zircaloy creeps inward due to the
external coolant pressure until it contacts the fuel, and then moves outward as the fuel
swells and the fuel rod internal pressure increases. The SiC cladding experiences some
initial irradiation swelling, then remains stable until very high burnup, when the fuel
contacts both the inner and outer cladding surfaces and begins to stress them outwards.
122

1.5
1
S0.5
-0.5
-1
-1.50 20 40 60 80 100
Bumrnup (MWdlkgU)
Figure 5.21 Average Cladding Strain of I&EC Sintered Annular Fuel HighBurnup Case with Zircaloy and SiC Cladding.
5.4 Summary
Modeling of I&EC annular fuel with SiC cladding has demonstrated that this cladding
provides the same advantages as that of Zr-based cladding: lower fuel temperature at
higher power densities than traditional pin-type fuel rods. Both the VIPAC fuel and
sintered annular pellets experienced lower temperatures and lower fission gas release at
comparable discharge burnup to those examined in the Manzel test case, around 100
MWd/kgU.
The annular fuel rod with VIPAC fuel has the advantage of no-fuel cladding gap,
although there is therefore constant mechanical interaction between the cladding and the
fuel grains. This combination of fuel and rod geometry achieves the lowest fuel and
cladding temperatures and internal pressures, which suggests opportunity for further
power density up-rating as well as a probable improvement in accident performance.
The sintered annular pellets have behavior similar to the pin-type fuel rods examined
earlier; the Zircaloy cladding creep down is contrasted by the open SiC fuel-cladding
123

gaps, which leads to a further increased pellet temperature for the SiC-clad fuel rod.
However, this also means that no mechanical interaction between the pellet and the SiC
cladding is expected until very high burnup, which corresponds to a more stable rod
geometry. For both fuel types, the internal pressure remained low during most of the
irradiation, increasing primarily due to very high burnup fission gas release. Even at its
maximum in the high burnup case, this pressure is below the external coolant pressure,
and well within what is tolerated by the stress limits of the SiC composite.
124

6. I&EC Annular Fuel Post-Irradiation Examination
6.1 Overview
As a part of the MIT I&EC annular fuel irradiation program discussed in Chapter 1, two
prototype annular fuel rods were irradiated in the core of the MIT reactor. After six
months of irradiation, the fuel rods, each enclosed in a separate aluminum capsule as
shown in Figure 6.1, were removed from the core and placed in underwater storage. They
remained in storage for one year of decay and cooling before being extracted for post-
irradiation examination (PIE) at the MIT Nuclear Reactor Laboratory.
,over Gas Tube
,eramic Spacer
'lenum Spring
7irconia Spacer
7ircaloy Cladding
(IPAC U0 2
,BE Fill Space
kluminum Capsule
Figure 6.1 Pre-irradiation I&EC Annular Fuel Irradiation Capsule 4 (left)with Cross-Section Schematic.
Preliminary design and planning of the PIE facilities was conducted by Yi Yuan [Yuan et
al., 2004] and Jiyun Zhao [Zhao, 2005] at MIT, and called for the use of a hot box facility
to conduct gamma spectroscopy and fission gas release measurements on the fuel rods.
125

The gamma spectroscopy was designed to be conducted in a piecewise manner along the
axis of the fuel rods with the aid of a collimator, and therefore allow some spatial
resolution. The proposed fission gas release measurement system included a gas sampling
apparatus that would puncture the cladding and draw out the gas into a counting chamber.
As a part of this thesis, the final design of this PIE system was decided, manufactured,
and installed in the hot box. The following sections describe the final configuration of the
PIE systems, their setup, and the data that was acquired. In addition, estimations of the
fuel disposition, burnup, and fission gas release are discussed.
6.2 Experimental Design
6.2.1 Hot Box Design
The MIT hot box facility consists of a steel-lined, lead-filled rectangular box 6.5 feet
wide, 4.5 feet tall, and 4.5 feet deep. The walls are 6 inches thick lead, with 1/2-inch
thick steel plates surrounding either side; in addition, there are three 12-inch-thick leaded
glass viewports. Handling inside the hot box is facilitated by two master/slave
manipulators that penetrate through ports on the lid. Samples are normally inserted via a
2-inch wide cylindrical port located on the lid between the manipulators, however this
was not possible in this case because of the size of the annular fuel capsules.
For this project, loading was accomplished by removing one manipulator, lowering the
capsule into the hot box from the transfer cask, and then replacing the manipulator once
the capsule was secure inside a specially built shield cave. There is also a sliding door
mounted at the rear of the box that opens onto a 12-inch-diameter port. This door was
removed in order to allow insertion of the collimator and gamma ray detector.
The hot box came equipped with an internal fire alarm and suppression system, pressure
gauge, and a meter for measuring exposure rate mounted on the rear wall. In addition,
there is a roof opening for ventilation ducting. A ventilated exhaust is provided in the
126

reactor building, and the hot box was connected to this in order to maintain internal air
pressure below the ambient pressure during any work with the capsules.
In order to minimize the exposure rate around the hot box and reduce the background
radiation during the gamma spectroscopy, it was decided to allow only one capsule into
the hot box at any time. To ensure that the hot box would provide sufficient shielding for
the capsules during their examinations and any storage time required when the hot box
was not in use, a shielding analysis was performed.
This analysis was based on a measured exposure rate of 600 R/hr 13 inches from the
capsules in water when they were removed from the core in September 2004. An
ORIGEN calculation was performed based on this irradiation, which produced the
expected intensity and energy distribution of gamma rays at discharge of the fuel from
the core, as well as after three months of decay (the earliest time that examinations were
expected to begin). One capsule was predicted to have somewhat higher activity since it
was located at an axial position of higher flux; however, the difference between the
capsules was small compared to the absolute activity.
For either capsule and from discharge to three months, the highest intensity of gamma
rays was in the 0.85 MeV energy group, and therefore for a conservative analysis it was
assumed that all photons had an energy of 1 MeV (The higher the photon energy, the
more shielding is required to provide the same effective dose rate reduction). For the
attenuation calculation, it was assumed the capsules could be represented as a mono-
energetic plane source, which allowed easier calculation with the most conservative
geometry considerations. In addition, all attenuation of the photons in air was neglected.
First, the effective exposure rate on contact with the capsules, Eo, was determined.
Exposure rate is given by,
E = B Eo e-~x (6.1)
127

where B is the dose buildup factor, gl is the attenuation coefficient, and x is the distance
from the point of measurement to the source [Turner, 1995]. The properties of water and
lead used for this calculation are given in Table 6.1. The attenuation coefficient is found
from,
[= Jm p (6.2)
where p.m is the mass attenuation coefficient for a material, and p is the density.
Table 6.1 1 MeV Photon Attenuation Calculation Material Properties.
Material Density (g/cm3) Mass Attenuation Coefficient (cm2/g)Water 1.0 0.0707Lead 11.4 0.0710
The dose buildup factor for a material can be found from pre-compiled tables based on
the photon energy and the number of relaxation lengths, which is the product lx, where x
is the shield thickness. From 13 inches of water, the dose buildup factor can be looked up
as approximately 3.8. Thus, the exposure rate on contact for the combination of the two
irradiated capsules at discharge is estimated to be 1630 R/hr at discharge.
Using this information, the expected maximum exposure rate at the surface of the
shielding was calculated. The exposure rate for a single capsule through various
thicknesses of shielding is given in Table 6.2.
128

Table 6.2 Exposure Rate for a Single Capsule through VariousThicknesses of Lead for 1 MeV Photons.
Lead Relaxation DoseThickness Lengths Buildup Expos Rate
(in) (cm) (11x) Factor
0 0 0 - 8154 10.2 8.2 2.9 0.656 15.2 12.3 3.6 0.0138 20.3 16.4 4.3 0.0002610 25.4 20.6 5.1 5x10 6
From this calculation, the exposure rate at the surface of the 6-inch thick lead walls of the
hot box will be at most 13 mR/hr, and likely less due to decay, the source geometry, and
attenuation in the air and the steel plates.
Based on this result, it was determined that no additional shielding was required for the
hot box during counting. However, a storage cave was created inside the hot box, adding
an additional 4 inches of lead when the capsule was stored between counts, and allowing
limited unshielded access to the interior of the hot box, such as during the re-installation
of the manipulator after transferring in a capsule.
6.2.2 Counting System
A system for measuring fuel burnup using a gamma detector was described in previous
work on the annular fuel project by Yi Yuan [Yuan et al., 2004]. In addition, a separate
apparatus for measuring fission gas release was proposed; this system would require the
aluminum capsule to be removed so that the cladding could be punctured and the plenum
space swept for fission gasses. This system was ultimately discarded because of the
complex machinery required, the small amount of fission gas expected, and the hazardous
waste that would be produced by compromising the aluminum and Zircaloy
containments.
129

Instead, it was decided to use the gamma spectroscopy system to accomplish both burnup
and fission gas release measurements, as well as to attempt to evaluate the physical
disposition of the VIPAC fuel. This method has the added advantage of avoiding any
destructive examination, so the fuel capsules can still be easily shipped to other
laboratories for further analysis in their original condition.
In order to allow gamma counting using a Ge detector, a lead collimator was designed to
fit into the back of the hot cell. This collimator was designed to allow the entire diameter
of the capsule to be viewed by the detector, but with a width of only 1/16 of an inch so
that some axial resolution could be achieved. The expected count rate at the detector for
various collimator thicknesses was calculated, and it was decided to use a collimator
thickness of 20 inches. This gives a count rate of around 2500 counts per second at the
detector for a 1.7 Ci source with less than 0.01% background-to-signal ratio [Yuan et al.,
2004].
The collimator is a stepped plug with a slot in the center for the collimation window, as
shown in Figure 6.2. The open slit was fabricated from a piece of rectangular steel bar,
stepped to fit into a stepped hole in the lead outer collimator, but then cut in half down
the long axis. The cut surface was polished and then welded back together along the
edges leaving a 1/16-inch gap between the two sides. This created a uniform window that
could be removed from the bulk of the collimator and modified later, should the count
rate be found to be unacceptably high or low.
130

/Hot Cell Wall
'Lead Collimator
Steel Collimator
Detector
Sw inmaow
Fuel Capsule
Figure 6.2 Top View of Collimator and Detector Setup with Hot Box.
To support the capsule in front of the collimator window and allow simple but repeatable
axial positioning, a support stand was designed. This stand, pictured in Figure 6.3 and
Figure 6.4, takes advantage of the azimuthal alignment pegs present on each capsule with
a series of slots, each 0.08 inches wide and 0.37 inches apart. Placing the capsule such
that four of the pegs fit into the slots, the capsule can be moved from one side of the
collimator window to the other in small, even intervals with the use of the manipulators.
-Hot Box(back wall)
-Collimator(front)
-Fuel Capsule
-Counting Stand
Figure 6.3 Model of an I&EC Annular Fuel Capsule on the Gamma CountingStand.
131
--'

Figure 6.4 I&EC Annular Fuel Capsule in Hot Box at Beginning of GammaCounting.
The Ge detector, mounted to a liquid N2 Dewar for cooling, was placed at the rear of the
hot box aligned with the collimator window and shielded against background radiation.
The detector connected to a data acquisition computer that used multi-channel analyzer
hardware and software to process the signal.
6.2.3 Detector Calibration
The detector was energy-calibrated using Co-60 and Cs-137 calibration sources before
being installed in the rear of the hot cell. Once installed this calibration was re-checked
using a Cs-137 source that also served as an absolute activity calibration. In order to
replicate the geometry and self-shielding effects, this second calibration used a small
cylindrical source chamber attached to the end of a metered rod. This was then placed
inside of a fueled but un-irradiated annular fuel capsule, which therefore contained
significant amounts of uranium and lead to attenuate the gamma rays.
132

The source was moved through the capsule in 1/32-inch increments, with a six-minute
count at each position. The results of this procedure are shown in Figure 6.5, where it is
apparent the source is concentrated in a small volume. Based on this figure, it was
assumed the 5.9 mCi source was uniformly distributed over a 3/32-inch length. If this is
true, at the position where the entire width of the collimator window is exposed to the
source the detector registered 141 net counts per second for the Cs-137 662 keV peak.
This gives a detector absolute energy calibration of 3.59x10⁴ counts/Ci-sec at this energy.
100
6Positon (xil1")
Figure 6.5 Net Counts per Second from theSource.
Cs-137 Absolute Calibration
6.2.4 Capsule Extraction and Handling
Before being transferred to the MIT reactor spent fuel pool from the reactor core tank
storage ring, the cover gas tubes on the two irradiated annular capsules were cut as shown
in Figure 6.6. This allowed the capsules to fit more easily into the hot cell interior. The
annular fuel capsules were then placed in a transfer container and moved from the core
tank to the spent fuel pool.
Once the hot cell was prepared to receive the capsules they were moved one at a time
from the pool into the hot cell. This was performed by removing the desired capsule from
133
__ __ i. 1
_________ Ir _________
40
20
_ _ _
T I I I I
I 1 ~
i

the storage container in the spent fuel pool, then placing it into a basket that was remotely
retracted into a transfer cask suspended above the pool. The cask was then moved onto
the top of the hot cell where one of the manipulators had been removed, and the basket
was lowered into the cask through that open port.
Figure 6.6 I&EC Annular Fuel Capsule's Cover Gas Tube being Cut inMITR-II Core Tank.
6.3 Fuel Examination
6.3.1 Visual Inspection
The first irradiated capsule moved into the hot box for examination was Capsule 3,
shown in Figure 6.7. The outer aluminum capsule, which was exposed to the reactor
primary coolant, had dulled significantly and had dark hairline streaks running along the
vertical axis. There is also a discolored band clearly visible along the middle of the
capsule, corresponding to the location of the fuel within the inner cladding. This
134

discolored area, bounded by two darker bands, was uniform in texture, and did not
feature the vertical streaks seen elsewhere. These effects were uniform around the
circumference of the capsule.
Figure 6.7 I&EC Annular Fuel Capsule 3 after Irradiation.
The second I&EC annular fuel capsule loaded into the hot box, pictured in Figure 6.8,
was Capsule 4. This capsule displayed the same features as Capsule 3, however there
were added effects due to the presence of three steel shim stock bands that were spot
welded to the outside of the capsule. These bands held in place two thermocouples used
to measure the capsule external temperature during irradiation. Two more thermocouples
were secured by two additional steel bands in approximately the same axial position on
the inside of the capsule.
The discolored bands and streaks found on the first capsule are apparent to the same
magnitude on Capsule 4, on both the inner and outer surfaces. Again, the discolored
region approximately overlays the internal location of the fuel, and its shape and intensity
135

is affected by the presence of fin-like perturbations on the capsule surface that would
have modified the local heat flux like the alignment pegs, steel bands, and thermocouple
sheaths.
For a rough exposure rate estimate, each capsule was held at the back of the hot box
against a measuring tape leading to the in-box radiation monitor. At 60 cm from the in-
box detector, the exposure rate reading for Capsule 3 was about 20 R/hr. Capsule 4,
which had resided below Capsule 3 in a slightly lower flux region of the core, was 12
R/hr.
Figure 6.8 I&EC Annular Fuel Capsule 4 after Irradiation.
136

6.3.2 Counting Results
A fuel capsule in place on the hot box stand during counting is shown in Figure 6.9, and
with a view of the collimator face and storage area in Figure 6.10. Because of the high
count rates encountered in the fueled regions of the capsules compared to the very low
count rates at the edges, the counting time was varied to allow the large number of axial
counts required for each capsule to be completed in a reasonable time. The live counting
time varied between 3 and 30 minutes, with dead times over 94% in the fueled region.
About twenty radionuclides were identified in each capsule from the results of the
gamma spectroscopy. The dominant elements were the same in both capsules, with
zirconium being the dominant activity by at least an order of magnitude in both cases.
The Zr-95 distribution is plotted for both capsules in Figure 6.11, where the fueled region
is most apparent, followed by sharp drops in activity on either side. At the left end of the
graph, the cladding sits on top of a ceramic spacer at the bottom of the aluminum capsule
and the counts drop almost directly to zero. At the top, however, there is a clearly defined
plenum space that is an order of magnitude lower in activity than the cladding adjacent to
the fuel.
Some broadening of the shape apparent in this and later figures due to the finite width of
the collimator window, which is significant given the size of the features being observed.
The collimator window is 1/16 inch wide, and therefore is counting over an area about
1/3 of width of each position mark on the graph, where the indicated measurement is the
center of that field.
137

Figure 6.9 Exterior of Hot Box during Capsule Counting.
Figure 6.10 View of Hot Box Interior from Right Viewing Port duringCapsule Counting.
138

0.
Zzn
0 2 4 6 8 10 12 14 16
Position (x0.37"
Figure 6.11 Net Count Rate for the Zr-95 Peak at 724 keV for Capsule 3 andCapsule 4.
6.3.3 Fuel Distribution
The dominant radionuclides (besides zirconium) found in the fuel region were Ru-106
(622 and 1050 keV from Rh-106) and Pr-144 (697 keV), both fission fragments. The
distribution of these isotopes in Capsule 3 is shown in Figure 6.12, and in Figure 6.13 for
Capsule 4. These figures also display a cross section of the fuel rod to the appropriate
scale; it is apparent that the detected nuclides correspond strongly to when the collimator
window is viewing the fueled region.
Based on the detector calibration, the average count rate over the fuel area, and the
relative intensity of the detected gammas, an estimate for the activity of these isotopes
was generated, and is given in Table 6.3. These correspond fairly well with the relative
radioisotope yields that were predicted by the ORIGEN fuel burnup and decay code. The
difference in the results may be an indication of errors in the assumptions made for the
ORIGEN calculation or inaccuracy in the absolute energy calibration.
139

1 .00E+03
1.00E+02
1.00E+01
1.00E+00
1.00E-01
0
Figure 6.12
2 4 6 8 10 12 14 16
Position (x0.3r')
Net Count Rate of Dominant Radionuclides in Capsule 3 withto-scale Fuel Rod Cross-Section.
0 2 4 6 8 10 12 14 16
Position (x0.37")
Figure 6.13 Net Count Rate of Dominant Radionuclides in Capsule 4 withto-scale Fuel Rod Cross-Section.
140
1.00E+03
1.00E+02
1.00E+01
1.00E+00
1.00E-01

Table 6.3 Estimated Activity of Major Isotopes in Fuel.
Energy Relative Estimated Activity Activity Calculated byIsotop (keV) Intensity (%) (Ci) ORIGEN (Ci)
Capsule 3 Capsule 4 Capsule 3 Capsule 4Ru-106 622 9.93 5.0 4.1 2.4 2.4Ru-106 1050 1.56 3.5 2.8 2.4 2.4Pr-144 697 1.34 43 39 31 23
Based on the axial distribution of these peaks in both capsules, it appears that the fuel
particles did not migrate through the top spacers into the plenum. Although it is noted
that there are small peaks at the top weld in the fuel rod and the aluminum capsule, these
are not well coordinated among the three energies found in the fuel, and may represent
noise introduced by the larger amount of structural material in those cross sections.
Based on the count rates at the edges of the fuel region there is no reason to suspect any
significant swelling or densification has occurred since the fuel rods were manufactured
[AECL, 2003]. In addition, the distribution of fuel activity appears relatively uniform,
although it does peak at both ends, and rises slightly towards the top of Capsule 3 and
bottom of Capsule 4. These effects are consistent with the neutron flux distribution in the
reactor core.
6.3.4 Burnup Measurement from Cs-137 Activity
Two methods were used to deduce the average fuel burnup, both depending on
proportional relationships between cesium activity and burnup. The first involved
calculating the Cs-137 activity in the fuel, which depends heavily on the accuracy of the
detector calibration. The second method used the ratio of the count rates for gammas
from Cs-137 and Cs-134, which eliminates the dependence on the detector activity
calibration.
First the activity of Cs-137 was calculated for each capsule by averaging the count rate
over the fuel area, adjusting for the relative intensity of the detected gamma (85.1% at
662 keV), and using the activity correlation determined previously. This experimental
141

result (corrected for one year of decay) is compared to the ORIGEN calculation in Table
6.4, which shows relative agreement, although the measured activities are higher than the
predicted activities.
Table 6.4 Estimated Activity of Cs-137 in Fuel.
Energy Relative Estimated Activity Activity Calculated by(keV) Intensity (%) (Ci) ORIGEN (Ci)
Capsule 3 Capsule 4 Capsule 3 Capsule 4662 85.1 4.7 3.99 2.53 1.86
Because of its long half-life (30.07 years), the activity of Cs-137 in the fuel, A7, during
the six-month irradiation was assumed dependent only on the rate of yield from fission.
Thus, using a method described by Hawari [Hawari et al., 2001],
A7 = X7,Vf, YZf, - p(t) dt (6.3)
where X7 is the Cs-137 decay constant, Vf is the total volume of the fuel, Y7 is the Cs-
137 fission yield (accumulated), ,f is the fission cross section, p is the thermal flux, and
t is the irradiation time. The fluence term can be related to the burnup, B, by,
B = 1. Ef Z f - f(t) dt (6.4)P
where p is the fuel density and Ef is the energy released per fission [Zhengpei and
Wenfeng, 2002]. Combining equations (6.3) and (6.4),
1 A,B=-. Ef (6.5)p X7.Vf -Y,
The values of the constants used in equation (6.5) are found in Table 6.5, and the two
burnup estimates calculated using this equation are given in Table 6.6. One estimate is
based on the experimentally measured Cs-137 activity and the other from the activity
calculated by the ORIGEN code.
142
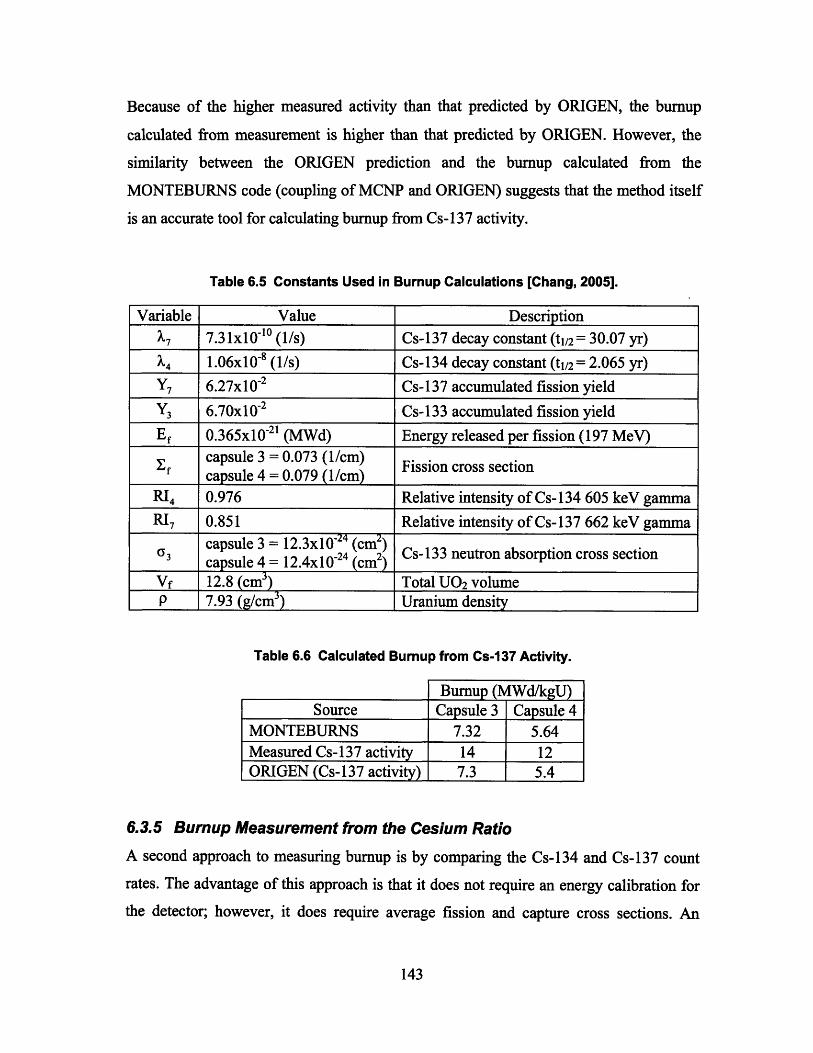
Because of the higher measured activity than that predicted by ORIGEN, the burnup
calculated from measurement is higher than that predicted by ORIGEN. However, the
similarity between the ORIGEN prediction and the burnup calculated from the
MONTEBURNS code (coupling of MCNP and ORIGEN) suggests that the method itself
is an accurate tool for calculating burnup from Cs-137 activity.
Table 6.5 Constants Used inBurnup Calculations [Chang, 2005].
Variable Value Description7, 7.31x10 -'0 (l/s) Cs-137 decay constant (t1/2= 30.07 yr)
X4 1.06x10 8- (l/s) Cs-134 decay constant (tl/ 2 = 2.065 yr)
Y7 6.27x10 -2 Cs-137 accumulated fission yield
Y3 6.70x10⁻² Cs-133 accumulated fission yieldEf 0.365x10 -21 (MWd) Energy released per fission (197 MeV)
capsule 3 = 0.073 (1/cm) Fission cross sectioncapsule 4 = 0.079 (1/cm)
RI 4 0.976 Relative intensity of Cs-134 605 keV gammaRI 7 0.851 Relative intensity of Cs-137 662 keV gamma
capsule 3 = 12.3x10 -24 (cm2)o3 capsule 4 = 12.4x10 -24 (cm2 Cs-133 neutron absorption cross sectionVf 12.8 (cm 3) Total UO2 volumeP 7.93 (g/cm 3) Uranium density
Table 6.6 Calculated Burnup from Cs-137 Activity.
SourceMONTEBURNSMeasured Cs-137 activityORIGEN (Cs-137 activity)
Burnup (MWd/kgU)Capsule 3 Capsule 4
7.32 5.6414 12
7.3 5.4
6.3.5 Burnup Measurement from the Cesium RatioA second approach to measuring burnup is by comparing the Cs-134 and Cs-137 count
rates. The advantage of this approach is that it does not require an energy calibration for
the detector; however, it does require average fission and capture cross sections. An
143
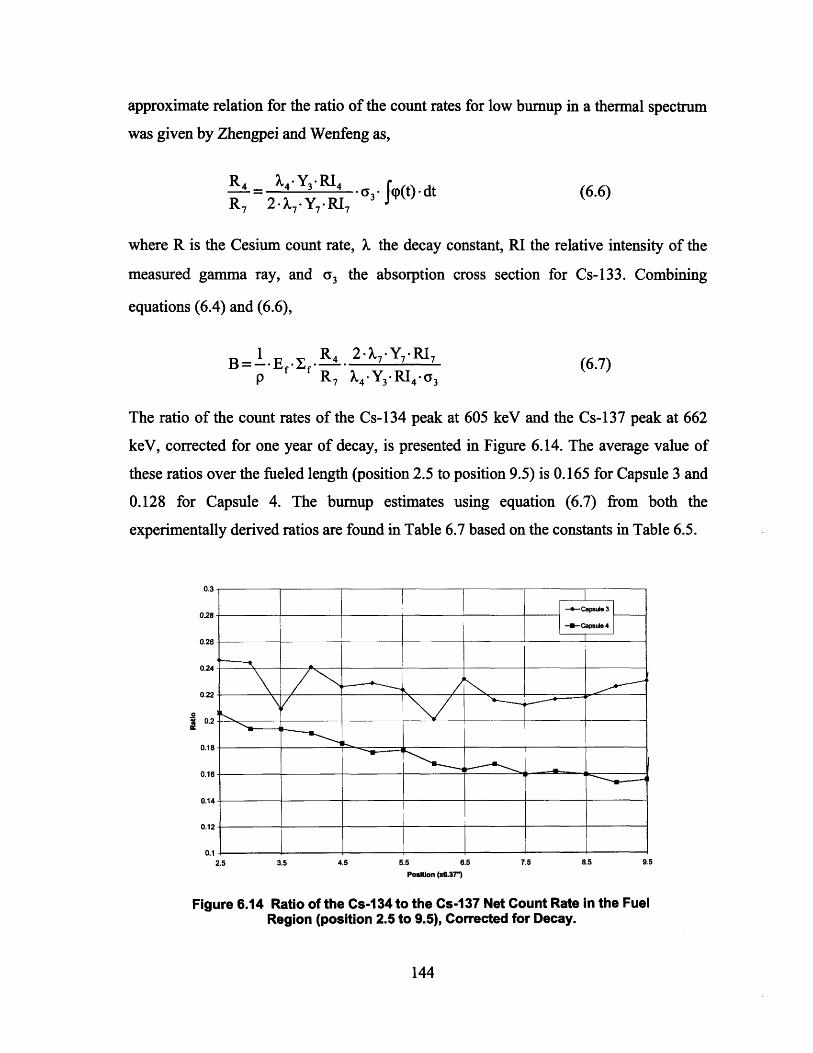
approximate relation for the ratio of the count rates for low burnup in a thermal spectrum
was given by Zhengpei and Wenfeng as,
R4 X4 Y 3 R 4 3 - f(p(t) -dtR7 2- 7.Y7 RI7
(6.6)
where R is the Cesium count rate, X the decay constant, RI the relative intensity of the
measured gamma ray, and a 3 the absorption cross section for Cs-133. Combining
equations (6.4) and (6.6),
1 R 2-X *Y, -RIB=- Ef 4 7p R 7 X4 *Y3* RI4 o 3
(6.7)
The ratio of the count rates of the Cs-134 peak at 605 keV and the Cs-137 peak at 662
keV, corrected for one year of decay, is presented in Figure 6.14. The average value of
these ratios over the fueled length (position 2.5 to position 9.5) is 0.165 for Capsule 3 and
0.128 for Capsule 4. The burnup estimates using equation (6.7) from both the
experimentally derived ratios are found in Table 6.7 based on the constants in Table 6.5.
0.22 -
0.2
nlR- -
___ I ___ i ___________ ___
2.5 3.5 4.5 5.5 6.5 7.5 8.5 9.5
Posltion (x0.37"
Figure 6.14 Ratio of the Cs-134 to the Cs-137 Net Count Rate in the FuelRegion (position 2.5 to 9.5), Corrected for Decay.
144
--4- Capsule 3
--M-Capsule 4
Si~

Table 6.7 Calculated Burnup from Cesium Ratio.
Burnup (MWd/kgU)Source Capsule 3 Capsule 4
MONTEBURNS 7.32 5.64Measured Cs-134/Cs-137 ratio 6.9 5.7
The burnup calculated using the experimentally measured cesium ratio gives a value
closer to the MONTEBURNS prediction than that from the Cs-137 activity in Table 6.6.
First, this suggests that using the ratio of Cs-134 to Cs-137 count rates is a predictable
method of measuring burnup. Second, it casts further doubt on the accuracy of the
activity calibration of the detector.
6.3.6 Fission Gas Release
For a passive measurement of the fractional fission gas release, the best candidates for
detection are Kr-85 and Xe-137. Kr-85 has a major gamma emission at 514 keV, whereas
Xe-137 decays to Cs-137 whose major emission is at 662 keV. The fission gas release is
estimated by comparing the relative activity of an isotope in the fuel region to the gas
plenum.
However, because of the lack of a fuel-cladding gap in the VIPAC fuel rod, fission gases
released from the fuel microstructure must migrate through the fuel by diffusion to the
plenum. Due to the short half life of Xe-137 (3.82 minutes), it is likely that very little of
the released gas escaped the fuel before decaying to Cs-137, which would have been
solid at the operating temperature and pressure inside of the fuel rod. Therefore, it was
considered unlikely that Cs-137 could be used as an accurate measure of fission gas
release in this case.
The axial profile of the Kr-85 count rate at 514 keV for each capsule is presented in
Figure 6.15. Because this peak was not distinguishable from the 511 keV peak caused by
annihilation photons, there is some uncertainty in the magnitude. Although there were not
a large number of high-energy gamma rays (able to cause pair production) detected, there145

were up to several thousand counts per second above 1 MeV from activation of the spring
and other capsule components near the plenum.
0 2 4 6 8 10 12 14
Position (x0.37")
Figure 6.15 Net Count Rate of Kr-85 (514 keV) for each Capsule.
16
Because it has a 10-year half-life, it was assumed that all Kr-85 that was released by fuel
discharge had migrated to the plenum by the time of examination. Because the count rate
is directly proportional to the atomic abundance, the fractional fission gas release was
found using count rates and the length of the fuel and plenum,
(6.8)FGR = -1,- cp + lfcf
where l, is plenum length, If is fuel length, and the average count rates for the plenum
and fuel are c, and cf , respectively.
The average net count rate (l/s) in the fuel (positions 2.5 to 9.5) was 757.7 for Capsule 3,
and 653.3 for Capsule 4. The average net count rate in the plenum (positions 10.5 and 11)
was 24.9 for Capsule 3, and 18.7 for Capsule 4. See Table 6.9 for the calculated fission
gas release based on equation (6.8) and properties in Table 6.8.
146

Table 6.8 Fuel Rod Geometry Based on Fabrication Report [AECL, 2003].
Variable Value Description
lp capsule 3 = 1.334 (cm)capsule 4 = 1.312 (cm) Plenum length
if capsule 3 = 7.066 (cm)capsule 4 = 7.088 (cm)
Table 6.9 Data for Fission Gas Release Estimate Based on Kr-85.
Capsule 3 Capsule 4Average fuel count rate (1/s) 757.7 653.3Average plenum count rate (1/s) 24.9 18.7Fission gas release (%) 0.617 0.527
The fission gas release estimates for both capsules are below 1%, as is expected in fuel at
very low burnup (5-10 MWd/kgU) and irradiated at low temperature (peak fuel
temperature below 3500 C) [Kazimi et al., 2006]. Furthermore, this release compares well
with the fission gas release that was predicted by FRAPCON-VA for this fuel of about
0.6% at 5 MWd/kgU [Yuan et al., 2004].
6.4 Summary
A post-irradiation examination of two prototype I&EC annular fuel rods was completed
using facilities built at the MIT Nuclear Reactor Laboratory. A hot box facility was
constructed that allowed for remote handling, visual examination, and gamma
spectroscopy of the irradiated fuel capsules. After six months of irradiation in the MIT
reactor and one year of cooling, the capsules were transferred individually into this
facility and counted piecewise axially.
This scanning yielded spatial information on the distribution of radionuclides, and was
used to determine the fuel disposition, burnup, and fission gas release. The fuel's physical
147

condition appeared unchanged since fabrication; there was no noticeable swelling,
densification, voiding, or relocation of fuel grains within the fuel rod.
Although results of the activity calibration of the detector are called into question due to
disagreements with the computer predicted activities, burnup and fission gas release
estimates based on ratio of count rates were reasonably precise. The experimentally
estimated burnup based on the ratio of cesium isotopes was 6.9 MWd/kgU for Capsule 3
and 5.7 MWd/kgU for Capsule 4, compared to 7.32 and 5.64 predicted by the computer,
respectively.
The results of the fission gas release estimate based on Kr-85 count rates in the fuel
versus the plenum region yielded a release of 0.62% for Capsule 3 and 0.53% for Capsule
4, compared to a computer prediction of 0.6% at a burnup of 5 MWd/kgU. These results
suggest that the simple non-destructive PIE was able to determine accurately burnup and
fission gas release of irradiated fuel.
148

7. Silicon Carbide Cladding Irradiation Facility
7.1 Overview
In addition to the computer calculation performed as a part of this thesis, the MIT
collaboration in the design of SiC LWR fuel cladding includes irradiation of SiC cladding
samples in the MIT reactor (MITR-II). This irradiation facility, planned for insertion in
the core in the spring of 2006, is designed to expose the cladding samples to PWR
coolant and neutron flux conditions for at least three months before the samples are
extracted for initial examination in an MIT hot cell facility. The samples will then be sent
for further PIE, including mechanical stress testing, at ORNL.
7.2 Irradiation Loop Design
7.2.1 Irradiation Conditions
In order to provide the characteristic radiation environment that SiC cladding would be
exposed to in an LWR core, the cladding samples will be inserted into the MITR-II, a 5
MWth light-water cooled, heavy water reflected thermal reactor. The neutron flux in the
core approximates that of an LWR, with peak fast and thermal fluxes of lx1014 and
4x10 3 n/cm2-s, respectively. The SiC irradiation loop will be inserted into a hollow
dummy fuel element located at position B-3 in the middle of the core's three rings; see
Figure 7.1 for the layout of the core with the B-3 location highlighted. Figure 7.2 gives
the flux energy profile for the SiC loop in the B-3 position as calculated by MCNP, and
Figure 7.3 plots the anticipated axial flux profile based on standard operational
experience.
149

B-3 IrradiationLocation
Figure 7.1 Top View of MITR-II Core Showing SiC Loop In-Core IrradiationLocation B-3.
7.OE+12
6.OE+12
5.OE+12
E 4.OE+12
3.OE+12
2.OE+12
1.OE+12
O.OE+001.OE-10 1.OE-08 1.OE-06 1.OE-04 1.OE-02 1.OE+00 1.OE+02
Energy (MeV)
Figure 7.2 Axially-Averaged Neutron Flux in LoopCalculated by MCNP.
In-Core Section
150

0z,.r
0.00 10.00 20.00 30.00 40.00 50.00 60.00Height above Core Bottom (cm)
Figure 7.3 Anticipated Neutron Flux Profile for SiC Irradiation.
Besides the appropriate flux, it is also the goal of this irradiation to simulate PWR coolant
conditions. By running in a closed loop separate from the primary reactor coolant
environment the pressure, temperature, and water chemistry can be adjusted at will to suit
this purpose. In the loop, the inlet water temperature will be 300'C at a pressure of 1500
psi, and at a mass flow rate of 0.25 kg/s; the primary reactor coolant runs at a core outlet
temperature of 500 C and at atmospheric pressure. Because the heated portion of the loop
is insulated by a CO 2 gas gap, a temperature drop of not more than 200 C is expected over
the length of the in-core section.
Any free oxygen in the water is removed by bubbling H2 through the coolant makeup
water tank, and the dissolved 02 and H2 levels are constantly monitored. In addition, to
follow standard mid-cycle reactivity control practice, boric acid will be added to the
water to achieve 800 ppm of boron. For pH control, 2.2 ppm of lithium is also included as
lithium hydroxide.
151

7.2.2 Structural Design
The SiC irradiation facility consists of three main sections: the in-core assembly, the
heating and flow control, and the let-down chemistry system. In addition, there is a data
acquisition system that continuously records temperature, pressure, and chemistry
indicators from the loop and the support equipment.
The in-core section consists of the sample assembly, autoclave, and thimble. The sample
assembly is made up of any number of individual modules, each holding three to nine
SiC cladding samples. An example of a three-layer module is shown in Figure 7.4. A
majority of the specimens will be open-ended tubes like those shown this figure, and
therefore those modules are held together by tie-rods running through the center of the
specimen tubes. There are small radial holes in these tie-rods to allow some coolant to
flow along the center of the samples in order to prevent coolant stagnation. For those
samples with joined end caps, the modules are secured with a hollow central tie-rod.
Coolant flow hole
SiC tube
- Spine rod hole
Flow shroud
Figure 7.4 Sample Module Containing Three Layers with Three SiC Tubesin Each Layer.
These modules stack onto a spine rod that hangs down from a fitting at the base of the
water outlet pipe. Two feet above the in-core section is a second set of modules
152

containing more SiC samples. These tubes will be exposed to the same coolant conditions
as the in-core samples but without the neutron flux.
Surrounding and in the space between each module are flow shrouds, as shown in Figure
7.5, which separate the flow into two channels. When the sample assembly is placed
inside of the autoclave, a 1.57 inch OD titanium tube, coolant enters the top of the
autoclave, flows down around the outside of the modules, then up through the inside of
each module before returning through the reactor lid. A diagram of this flow pattern is
shown in Figure 7.6.
Module
upport spine
Flow shroud
Flow shroud (x-section)
Figure 7.5 In-Core Section of SiC Irradiation Loop with Four Modules.
153

Charging Flow
LetdownOut
Coolant Plow
Figure 7.6 Coolant Flow Pattern in SiC Irradiation Loop [Chatelain, 2000].
Outside of the autoclave is an aluminum thimble that provides separation between the
reactor coolant and the autoclave surface. The in-core section of the thimble is sealed,
and at the top is a large annular cylinder filled with lead into which the autoclave top
bolts. There is a gap between the thimble and autoclave filled with CO2 at about 1 psig.
When fully inserted in the core, the thimble fits into a hollow dummy fuel assembly as
shown in Figure 7.7, with the lead-filled end resting in a port in the reactor lid and
supporting the entire weight of the experiment
Because the experiment is not locked into the core as are ordinary fuel elements, in order
to prevent ejection from the core tank the thimble is held down by steel "L" brackets.
154

These brackets attach to the surrounding modular lead shielding designed for this
experiment. This shield, which weighs approximately 225 kg, is in turn bolted to the
reactor lid, which is held in place with several large manual hold-down clamps.
Autoclave top
Aluminum thimble
Dummy element
Figure 7.7 SiC Irradiation In-Core Loop in Position B-3 in Simplified MITR-IICore Tank.
The out-of-core systems are consistent with those used in past experimental loops in the
MITR-II for simulating PWR and BWR conditions. A diagram of the control system is
given in Figure 7.8.
155

:nt
argingnp
opLoop -
Figure 7.8 Coolant Control System for SiC Irradiaition Facility [ChAtelain,2000].
The inlet coolant feed to the loop runs from the top of the autoclave, across the reactor
lid, and into the heater. In the heater, the pipe runs through a lead bath that heated by a
series of electric strip heaters. The outlet pipe mirrors the inlet flow from the autoclave
top until it reaches the heater box, where about 10% of the flow is diverted into the let-
down loop. This let-down flow travels through a regenerative and then a non-regenerative
heat exchanger (cooled by the reactor secondary coolant system) before moving through
a pressure regulator. Now at atmospheric pressure, this flow travels to the chemistry
monitoring system and hydrogen re-combiner before emptying into the makeup water
tank, where H2 is bubbling through. The outlet from this tank goes through a charging
156

pump and a regenerative heat exchanger before rejoining the main loop flow just after the
circulation pump. This re-combined flow then goes into the heater section. Some water is
also constantly drawn from the makeup tank, filtered, and run through a secondary
chemistry monitoring array before being returned to the tank.
There is also a pressurizer attached to the let-down system after the heat exchangers to
prevent boiling in the loop. The temperature in the pressurizer is maintained above that of
the main loop, so in the event of sudden depressurization of the main loop the water will
boil in the pressurizer first. This vaporization will slow the rate of pressure drop in the
main loop as the heaters are deactivated.
Water in the loop is highly radioactive during reactor operation due to the 0-16 (n,p)
reaction, which forms N-16. This N-16 decays with a half-life of 7.1 seconds and emits a
6 MeV gamma, requiring lead shielding. The main coolant loop, including the circulation
pump and heaters, is therefore enclosed in specially designed modular shielding. The let-
down flow is first separated under this shielding, and travels through a looping section of
pipe to allow time for the N- 16 decay before exiting the shielding for the heat exchangers
and chemistry monitoring equipment.
The loop shielding consists of two major sections: modular pieces to cover sections of
pipe running across the reactor lid, and a permanent shield coffin surrounded by lead
plates and bricks to house the heaters, circulation pump, and initial let-down line loops.
7.2.3 Safety Review
Following normal experimental procedure, an extensive safety review was conducted to
evaluate the impact of the SiC loop on the operation of the MITR-II. This review
included a description of the systems and their operation as described here, as well as
calculations of the reactivity worth of the experiment and expected activation [MIT-NRL,2006].
157

The reactivity worth of the SiC irradiation loop was calculated using a full core model of
the MITR-II in MCNP. Based on this analysis, the total reactivity worth of the in-core
section of the loop was determined to be -437 ±53 mo (where error is quoted as one
standard deviation) compared to a solid aluminum dummy fuel element in that core
position. This is well below the single-experiment reactivity limit set by the reactor
technical specifications at 2290 mp.
There is also an accident scenario reactivity transient qualification. In case of voiding of
all of the water initially present in the in-core section of the loop, followed immediately
by re-flooding with room-temperature water at atmospheric pressure, the maximum
reactivity change was calculated to be 96 ±103 mp. This falls within the specified non-
secured reactivity limit of 636 mp, and therefore the SiC irradiation loop meets the in-
core experiment reactivity safety guidelines.
Based on the expected elemental loading of the SiC irradiation loop, given in Table 7.1,
the activation of the loop components was calculated using ORIGEN. This calculation
was based on the planned 90-day irradiation at an anticipated 75% capacity factor. This
capacity factor is based on the probability of unplanned shutdowns and expected
refueling and maintenance outages. After shutdown, there is an additional three-day
decay period required before the experiment can be manipulated; this is therefore the
minimum decay time analyzed in the code. The results of this activation analysis are
given in Table 7.2, where the total activity was found to be 33.9 Ci. This activity is
primarily due to neutron capture in the aluminum and fast neutron reactions in the
titanium.
158

Table 7.1 Elemental Loading the
Element Internals (g) Thimble (g) Autoclave (g) Total (g)Al 16.1 844 16.1 876Cr - 3.08 - 3.08Cu - 3.52 - 3.52Fe - 6.15 - 6.15Mg - 10.5 - 10.5Mn - 1.32 - 1.32Si 70.7 7.03 - 77.7Ti 507 1.32 506 1014V 13.4 - 13.4 26.8Zn - 2.20 - 2.20
Table 7.2 Activities for SiC Irradiation Loop after 1620 Hours75% Capacity Factor) and 3 Days of Cooling.
(90 EFPD with
Precursor Abundance (%) Reaction Daughter T Aftercooling(Ci)
Thermal neutron capture reactionCr-50 4.35 (n,y) Cr-51 27.7 d 11.54Cu-63 69.17 (n,y) Cu-64 12.7 h 1.23Fe-54 5.85 (n,y) Fe-55 2.7 a 0.12Fe-58 0.282 (n,y) Fe-59 44.5 d 0.09Ti-50 5.18 (n,y) Ti-51 5.76 m 2.18Zn-64 48.6 (n,y) Zn-65 244 d 0.78
Total activity from thermal capture reactions: 15.94Fast neutron reactions
A1-27 100 (n,a) Na-24 14.99 h 0.84Fe-54 5.85 (n,p) Mn-54 312 d 0.07Ti-46 8.25 (n,p) Sc-46 83.8 d 5.35Ti-47 7.44 (n,p) Sc-47 3.4 d 10.11Ti-48 74 (n,p) Sc-48 162.7 d 1.54
Total activity from fast capture reactions: 17.91
Because hydrogen gas is bubbled through the makeup tank for oxygen control, it is
necessary to minimize the explosive hazard. With this in mind, the level of the makeup
tank is required to be maintained near full in order to minimize the gas pocket at the top
of the tank. In addition, in order to minimize the amount of H2 present within the reactor
containment building at any time, a small gas cylinder is used at the reactor top. This
ensures that, in addition to the H2 in the loop, the experiment contains less than the
159
SiC Irradiation Loop.

imposed limit of 10 SCF (based on safety analysis of previous in-core loops [Kohse et
al., 1993]).
7.2.4 Procedures
The assembled stack of sample modules is attached via the spine rod and coolant outlet
fitting to the autoclave top. This stack is then inserted into the body of the autoclave, and
it forms a high-pressure seal at the top utilizing a C-ring. The autoclave is then inserted
into the thimble and is bolted down to the lead annulus with a gasket in between to form a
low-pressure seal for the CO2 gas gap.
The reactor is prepared by placing the hollow dummy element in position B-3 and
rotating the proper lid plug into position over this element. After the autoclave is filled
with water, the assembled experiment is lifted using a crane into position above the open
lid port and lowered into the dummy assembly in the core. The gas and coolant feed lines
are attached and the system is then brought up to the operating pressure. After checking
for leaks at the reactor top, the exposed piping is insulated and the system is brought up
to temperature; the loop is allowed to operate for at least 18 hours before the reactor is
brought back online.
Before reactor operation, the modular shielding is put into place around the piping and
additional shielding is added around ion filters and pumps. Reactor power is then raised
in small steps with additional shielding is added as necessary.
On-line monitoring of the loop is accomplished with several sets of independent
controllers and alarm boxes. A data acquisition computer at the reactor top logs the
temperature of the system at eight locations, pressure in the loop as well as the pressure
drop across the circulation pump, the dissolved 02 and H2 concentrations, and the water's
electrical conductivity. Additional remote controllers monitoring separate feeds of the
temperature of the loop's core outlet flow, the lead bath temperature, and the pressurizer
temperature will automatically shut off the heaters due to high temperature.
160

Pressure switches on the loop indicating low or high system pressure will activate
dedicated alarms in the reactor control room, as will low pressure drop across the
circulation pump, high or low loop core outlet temperature, low makeup tank water level,low flow or high temperature in the loop secondary cooling system, or loss of pressure in
the CO 2 gap.
After the irradiation is complete and the system is cooled and depressurized, the loop is
removed from the core in two steps. First, the autoclave top is detached from the
autoclave tube and is moved, along with the sample modules, in a cask to the hot cell
adjacent the reactor. The sample stack, suspended from the autoclave top by the spine rod
and coolant tube are then lowered into the cell. The autoclave top rests in a special
bracket secured above the cell to the wall of the reactor containment building. The
autoclave and thimble can then be removed from the core and placed in storage either in a
cask or into another port in the hot cell top adjacent to the sample assembly.
The hot cell, shown in Figure 7.9, is a larger facility than the hot box used for the I&EC
annular fuel capsule examination. It provides ports on top so that the sample assembly
may be suspended in the cell, provides a tabletop area for working, and has wall ports for
removing samples. Once in the hot cell, the modules will be removed from the spine rod
and sorted. If irradiation of this experiment will continue, those modules slated for
continued exposure will be put back in place with the addition of new modules with fresh
SiC samples. The other modules will be disassembled in the cell, and the SiC tubes
examined.
161

Figure 7.9 Hot Cell for SiC Sample PIE.
The specimens will be photographed and weighed, then baked to remove moisture. After
baking, the samples will be re-weighed to determine if any weight loss or gain has
occurred. Once no further weight loss can be achieved by baking, the final weight of the
specimens will be recorded. At the conclusion of the physical examination, and after
allowing sufficient time for decay, these SiC tubes will be packaged and shipped to
ORNL for mechanical testing.
7.3 Rig Construction and Startup
7.3.1 Sample Characterization and Loop Assembly
Gamma Engineering sent twenty-four samples to MIT for irradiation in the SiC loop.
This includes seventeen duplex tubes with several different fiber, matrix, and monolith
constructions, three duplex tubes with joined end caps, two tubes with only the SiC
monolith layer, and two Zircaloy tubes for comparison.
162

Prior to assembly, each sample was measured, weighed, and compared to the as-
manufactured data provided by Gamma Engineering. This test showed good agreement
for all the samples. They were then baked in batches of eight at 1200C for one hour and
then re-weighed. For the first batch, no weight change was measured after the first hour,
and a second hour of baking also produced no discernable change. Therefore, all other
specimens were baked for one hour, then weighed and assigned their official pre-
irradiation weight. The results of these measurements are given in Appendix A.
A sample matrix, provided in Appendix A, was prescribed by Gamma Engineering that
assigned the axial position of each sample. Because of slight variations in the sample
lengths, they were also sorted by height such that given three samples per layer, each
axial column of samples within a module would have a nearly equivalent height. Because
the height of the entire module (generally containing multiple samples stacked on each
other) is set by the flow shroud height, this prevents excess contact with the titanium
platters supporting either end of the specimens. During irradiation, this contact may cause
damage to the ends of the tubes. A partially assembled module exhibiting the various
common components is pictured in Figure 7.10.
163

Figure 7.10 Partially Assembled 2-Layer Module with Three SiC Samples,Flow Shroud, and Holding Platters Shown.
Prior to assembly of the loop, four tube fragments representing a cross section of the
materials within the SiC specimens were studied using neutron activation analysis. The
purpose of this testing was to identify any unexpected contaminants and to provide an
estimate of the activity of the actual SiC samples after irradiation. This information is
important for determining proper radiological controls as well as for setting a schedule
for examination and shipping.
These specimens were irradiated, together with a NIST standard, in a pneumatic rabbit
positioned in the reflector region near the MITR-II core centerline for ten hours. After
several days to allow for decay of short-lived isotopes, the fragments underwent gamma
164

spectroscopy with a three-hour count for each specimen. Following an addition two-week
decay to reduce the background, each fragment was counted again for twenty-four hours.
The results of this spectroscopy analysis are presented in Appendix B.
7.3.2 Loop Installation and StartupThe loop was successfully pressure tested up to 1700 psi at room temperature before
being installed in the reactor. The loop inserted in the dummy fuel element in the MITR-
II core is shown in Figure 7.11; the thimble and autoclave top seated in the reactor lid
port is shown in Figure 7.12. It was then connected to the inlet and outlet coolant pipes,
the system was brought to the operating pressure of 1500 psi, and the circulation pump
was started.
Thimble
DummyElement
Figure 7.11 SiC Irradiation Loop Installed in the MITR-II Core.
165

Figure 7.12 Thimble and Autoclave Top Seated in Reactor Lid Prior toInsulation and Shielding.
During this initial testing, helium gas was substituted for the H2 in the bubbling system.
The reactor top pressure and water chemistry monitors are shown in Figure 7.13. After
several days, the oxygen content of the coolant was reduced from an initial value of about
6 ppm to less than 0.4 ppb. At this point, the heaters and pressurizer were activated from
the controller pictured in Figure 7.14. The temperature was then raised in increments by
increasing the power output to the heaters towards the operation temperature of 300"C.
166

Figure 7.13 SiC Irradiation Facility Pressure and Water ChemistryMonitors.
167

Figure 7.14 Heater Power Control Cabinet for SiC Irradiation Facility.
However, when the coolant temperature reached 230 0C, the circulation pump, which
utilizes a magnetic coupling between the motor and the pump impeller, de-coupled and
the loop coolant stopped circulating. Temperature was decreased slightly and the pump
was restarted, however it was found to de-couple consistently at this temperature.
Through subsequent testing and rebuilding of the pump, it was determined this was likely
due to thermal expansion of the graphite bearings on the impeller shaft, which was
causing the shaft to jam in its housing. By raising the temperature just below the de-
coupling point and running for several hours, it was found the maximum temperature
could then be increased further as the bearings experienced mechanical wear.
By repeating this process, the loop was brought up to the correct temperature for
operation. However, because this situation prevented normal operation of the experiment
168

and might expose the samples to unusual temperature and pressure effects, the in-core
section was removed and placed in storage in the hot cell until the pump was properly
conditioned. With the mechanical systems now functioning properly, the in-core section
will be re-inserted in the reactor at the next scheduled shutdown so the irradiation may
begin.
169

8. Summary and Recommendations for Future Work
8.1 SiC Cladding Modeling in FRAPCONSiC-based materials are being considered for use as fuel rod cladding for LWRs. The
proposed form is a duplex, with a solid SiC monolith tube as the inner cladding layer to
retain fission gas, and a woven SiC fiber-matrix composite forming the outer layer for
strength.
The SiC has advantages over traditional Zircaloy cladding that include a very high
melting point, negligible creep at LWR temperatures, good irradiation stability, a low
oxidation rate, and high strength. These properties may allow SiC-clad fuel rods to be run
at higher power densities and to higher fuel bumup than is achievable with current
Zircaloy-clad fuel rods.
As a result of this work, the FRAPCON steady-state fuel modeling code was equipped
with appropriate properties to simulate a fuel rod with SiC composite cladding. The first
version that was produced, FRAPCON-SiC, combined previous work addressing the
FRAPCON very high burnup fission gas release relations with new models for the
cladding. These models described the thermo-physical properties of SiC composite
cladding in relation to pertinent conditions such as neutron fluence, temperature, and
stress.
170

The new models are concerned with the following SiC composite properties:
* Thermal Conductivity
* Thermal Expansion
* Irradiation Swelling
* Young's Modulus
* Yield Strength
* Shear Modulus
* Creep
* Oxidation
* Emissivity
* Phase Transitions
* Crud Accumulation
Each of these models was based on data available in the literature for SiC composites,
and those composites using new, radiation-resistant fiber types when available.
This new code was then run using input cases representing normal burnup at constant
power, and very high burnup (up to 100 MWd/kgU) starting at a high LHGR. These
cases highlighted the performance characteristics of SiC and how they contrast with those
of traditional Zircaloy cladding. In general, the lower thermal conductivity and absence
of creep are the most significant properties. The un-irradiated SiC thermal conductivity
may be large compared to Zircaloy, however it quickly degrades with radiation exposure
to a saturation value around 4 W/m-K. This lower thermal conductivity increases the
temperature drop across the cladding, and thereby increases the fuel temperature.
Because the SiC cladding does not creep down onto the fuel, there is no pellet-cladding
interaction even at high burnup. However, this also implies the fuel-cladding gap remains
open longer. This gap creates an additional thermal resistance that further increases the
fuel temperature. The primary consequence of the higher fuel temperatures is increased
fission gas release leading to increasing pressurization of the fuel rod. However, because
171

SiC does not creep at typical operating temperatures and maintains high strength even
after a significant amount of radiation damage, the SiC-clad fuel rod performs better than
Zircaloy when the internal pressure exceeds the external coolant pressure.
The next step was the application of SiC cladding to a new fuel geometry, the I&EC
annular fuel developed at MIT. Previously, two versions of the FRAPCON code had been
created to model this fuel rod geometry with either sintered annular fuel pellets or VIPAC
fuel. The VIPAC fuel consists of sintered U0 2 grains of various sizes that are packed into
the fuel rod, thus eliminating fuel-cladding gaps and allowing simplified fabrication,
especially for non-standard geometries. These codes were modified with very high
burnup fission gas release models incorporated into FRAPCON-SiC, and then the SiC
cladding properties were included as well to create two new versions of the code, one for
each fuel type.
The SiC-clad I&EC annular fuel was then evaluated under normal PWR conditions and at
150% normal power to very high fuel burnup (100 MWd/kgU). The primary differences
in behavior between these fuel forms are the potential gap asymmetries present in a
sintered annular pellet opposed to the zero gap in VIPAC fuel rods. However, the VIPAC
fuel is in constant mechanical contact with the cladding, and experiences somewhat
higher fission gas release due to the large surface area of the fuel grains.
8.2 Fuel Performance Enhancement
8.2.1 Possibilities for Power Density Increase
One of the possible advantages of SiC cladding is the ability to increase the fuel power
density. Increasing power density is desirable because it permits an increase the power
output of a reactor while maintaining the existing fuel assembly and core geometry. For
transmutation fuel, this is equivalent to increasing the rate of actinide destruction.
Comparing the performance of SiC and Zircaloy cladding in the normal pin-type fuel rod
172

geometry at high power densities indicates that higher fuel temperatures may be the
limiting factor, since thermal safety margins must be maintained.
This issue could be mitigated by several different approaches, two of which were
considered here: changing the initial fill pressure, and using annular fuel pellets. With
only a 5 v/o central void, annular pellets provide a significant reduction in peak fuel
temperature (by almost 200 K at beginning of life in the high power density case studied),
which can be increased with increasing void. The combination of reduced peak fuel
temperature and added void space in these rods also greatly reduces the pressurization
due to fission gas release.
Changing the initial fill gas pressure may also provide some benefit. Increasing the initial
pressure improves the gap thermal conductance, important for SiC because of the lack of
creep. However, this benefit must be balanced by accepting a higher internal pressure
over the operating life of the fuel rod.
Replacing the UO2 with MOX fuel, temperature remains the dominant issue. The thermal
conductivity of the MOX fuel is lower than the UO2, therefore peak fuel temperatures
tended to be higher. Because of this, the MOX fuel rods experienced significantly higher
fission gas release and plenum pressurization than U0 2 fuel rods under the same
operating conditions.
Applying SiC cladding to I&EC annular fuel presents a new opportunity for power
density increases. The average cladding and fuel temperatures are 100-150 K higher with
SiC instead of Zircaloy cladding, however the overall performance is identical or better,
especially in the case of sintered annular pellets. Because the SiC cladding is more rigid
than the Zircaloy, the fuel-cladding gaps remain more symmetric and the heat flux
through the inner and outer surfaces remains balanced, an important safety consideration.
Even at 150% of nominal PWR power, the maximum fuel temperature with the I&EC
annular fuel with SiC cladding is half that of the comparable solid pin with Zircaloy
173
cladding. This leads to very low fission gas release even at very high burnup (< 10% at
100 MWd/kgU), little fuel rod pressurization, and excellent thermal safety margins.
8.2.2 Achieving High Fuel BurnupIncreasing the fuel burnup maximizes the amount of energy that is extracted from the fuel
before it is discharged from the reactor, which minimizes the mass of actinides that must
be disposed of or reprocessed. The challenges of reaching high burnup include preventing
over-pressurization of the fuel rod, excessive cladding strain, excessive fuel-cladding
mechanical interaction, and maintaining acceptable thermal margins. It is difficult to use
Zircaloy cladding at high fuel burnup because the swelling fuel strains and wears at the
cladding, and high fission gas release at very high burnup can cause bloating of the fuel
rod.
As discussed previously, SiC cladding with the traditional solid fuel rod geometry
reduces the fuel-cladding interaction even to very high burnup because the fuel-cladding
gap only closes as the fuel pellets swell outwards. In addition, within the stress
limitations, pressurization of the SiC cladding beyond the external coolant pressure does
not result in outward strain. The major issue with this cladding remains the peak fuel
temperature, although it is reduced considerably at high burnup as the gap closes and the
fuel pin LHGR is decreased.
Using I&EC annular fuel rods with SiC cladding gives the additional advantage of very
low fission gas release, which maintains the SiC hoop stress well below the limit up to
very high burnup. This annular design also keeps the peak fuel temperature significantly
lower than solid fuel at a comparable LHGR, which could address concerns for
transmutation fuels like MOX, which have lower thermal conductivity than U0 2.
174

8.3 I&EC Annular Fuel Irradiation Results
Two prototype I&EC VIPAC annular fuel rods were irradiated in the MIT reactor for six
months, then examined in a hot box facility at the MIT Nuclear Reactor Laboratory.
These non-destructive examinations included evaluation of the fuel disposition and
estimates of the fuel burnup and fission gas release.
From the results of the gamma spectroscopy performed in piecewise intervals along the
axis of each fuel rod, the fuel form appeared to retain its physical dimensions. There was
no evidence of migration, densification, or voiding within the fuel rod, and the burnup
appeared uniform along the length of the fuel. Although attempts to calculate the activity
of various isotopes based on spectroscopy yielded questionable results, fuel burnup
calculations relying on the ratio of cesium isotopes were more consistent with previous
simulations. For Capsule 3, the burnup estimated by the ratio method was 6.9 MWd/kgU
compared to 7.32 MWd/kgU calculated by MONTEBURNS; for Capsule 4 the estimated
fuel burnup was 5.7 MWd/kgU compared to 5.64 MWd/kgU calculated. These
experimentally derived results are within 6% of the values calculated by
MONTEBURNS.
The fission gas release calculation, which used the Kr-85 count rates in the fuel and
plenum region, yielded similarly consistent results. The measured fission gas was 0.62%
for Capsule 3 and 0.53% for Capsule 4, whereas the release calculated by FRAPCON for
a burnup of 6 MWd/kgU is 0.6%.
Overall, the results of the examination verified the integrity of the I&EC annular fuel
rods, and confirmed the anticipated behavior of the VIPAC fuel. Furthermore, the good
agreement between the calculated and measured fuel burnup and fractional fission gas
release demonstrates the ability to use non-destructive techniques to characterize this
irradiated fuel form appropriately.
175

8.4 Silicon Carbide Cladding Irradiation
An experiment has been planned at MIT to investigate the performance of SiC duplex
cladding under PWR conditions. Small samples of SiC duplex cladding tubes have been
placed in an irradiation loop that will be installed in the core of the MITR-II. The reactor
will provide a typical PWR flux spectrum, while controls on the loop will ensure
appropriate pressure, temperature, and water chemistry conditions during the irradiation.
The SiC samples will be irradiated for a few months followed by several days for cooling
and decay before they are transferred into a hot cell at the MIT Nuclear Reactor
Laboratory. This facility will allow some of the samples to be removed from the loop and
examined. Other SiC tubes, along with new samples, may be re-installed in the
experiment and returned to the core for additional irradiation.
After irradiation, these samples will undergo PIE first at MIT before being sent to ORNL
for mechanical testing. At MIT, the samples will be examined for dimensional and
weight changes as well as any other significant macroscopic effects. Because these
samples represent several different SiC fabrication and assembly techniques, it is hoped
this irradiation will provide information on which type to pursue for further development
and testing.
8.5 Possibilities for Future Work
8.5.1 Additional FRAPCON Development and Other Computer Modeling
Based on the SiC cladding performance modeling so far, it is important to refine the
empirical relations that have been developed, especially concerning the thermal
conductivity and the strength of the composite. In particular, the models should include
the effects of particular fiber and matrix compositions and assemblies.
The effect of oxidation and other chemical interactions on the SiC is also of particular
interest; it was omitted from this investigation due to inconclusive information. However,176

as more data becomes available through experiments on new SiC materials, such as the
irradiation at MIT, a more informed conclusion can be reached as to whether the effect is
significant enough to include in this code.
A significant advancement to the current modeling scheme would involve including
explicitly both the monolith and the composite layers of the SiC duplex cladding. This
involves the complexity of the mechanical bonding between the two layers, heat transfer
at the interface, and distribution of stresses. This will also involve developing models to
explicitly deal with the monolith material properties.
Additional work is also needed to explore the incorporation of SiC cladding with
different transmutation fuels. SiC cladding in combination with I&EC annular fuel rods
demonstrated the ability to achieve higher power densities and very high fuel burnup than
current fuel rods, and therefore this construction may be advantageous for increasing the
efficiency of thermal transmutation. It would be valuable to first extend the MOX fuel
model into this geometry, since the MOX fuel models that have already been developed
for FRAPCON could then provide an indication of the performance of other actinide-
bearing fuel.
Because the simplified fabrication process for VIPAC fuel makes it a preferred form for
reprocessed fuel, a VIPAC annular fuel simulation with SiC cladding and MOX fuel
would be an instructive FRAPCON model to explore. Other transmutation fuel types
under development, such as inert matrix fuels, may also be included by incorporating
their properties into the FRAPCON.
In addition, the evaluations thus far have concerned steady-state and long-term thermo-
mechanical behavior, but transient analysis will be equally important. In the same way
FRAPCON has been modified for SiC cladding, transient codes such as FRAPTRAN
may be utilized to perform analysis of events such as reactivity insertion accidents.
Thermal-hydraulic and neutronic analysis of SiC cladding will also be necessary for
177

steady-state and transients, especially in exploring the results of the differences in cross
sections, temperature, strain behavior, and surface texture.
8.5.2 Experimental Studies
In order to validate the predictions of FRAPCON, it will be important to perform more
irradiations on duplex cladding samples under LWR conditions. Although irradiation
studies have been conducted on the fiber, monolith, and matrix material independently,
observing their interplay under irradiation and stress will provide important experimental
data.
Future irradiations should also provide the internal pressure and heat flux that will test the
SiC cladding performance in more realistic conditions. The pressure and heat flux may
exacerbate conditions that have gone unnoticed until now, especially in consideration of
the desire to achieve very high burnup with this material. Studies will need to evaluate
the behavior after an effective irradiation time of at least six years, in which case
behavior such as crack propagation, fretting, and thermal cycling become more apparent.
Experimental testing will also be needed to study the transient behavior of the cladding,
such as exploring the effects of over-pressurization, vibration, and thermal shock. A
study of the chemical reactions between the parts of the SiC cladding and the LWR
coolant and the fuel pellet under normal and accident conditions will also be needed to
determine the effect these processes have on the cladding's mechanical performance and
heat transfer.
178

REFERENCES
AECL, Fabrication Report for VIPAC Annular Fuel Test Specimens, Revision DI,Atomic Energy of Canada, Ltd., 2003.
Alkan, Z., et al., "Silicon carbide encapsulated fuel pellets for light water reactors,"Progress in Nuclear Energy, 38 (2001) 411-414.
Berna, G. A., et. al., "FRAPCON-3: A Computer Code for the Calculation of Steady-State, Thermal-Mechanical Behavior of Oxide Fuel Rods for High Burnup, Vol. 2",NUREG/CR-6534, PNNL-11513, prepared for the U.S. Nuclear Regulatory Commissionby Pacific Northwest Laboratory, Richland, Washington. 1997.
Bibilashvili, Y., et al., "Toward High Burnup in Russian WWER Reactors and Status ofWater Reactor Fuel Technology," American Nuclear Society, Int. Topical Meeting onLWR Fuel Performance, Florida, USA, April 16-19, 1994.
Brook, R.J. (ed.), Concise Encyclopedia ofAdvanced Ceramic Materials, MIT Press,Cambridge, 1991.
Caner, M. and Dugan E.T., "ThO2-UO2 annular pins for high burnup fuels," Annals ofNuclear Energy, 27 (2000) 759-770.
CEGA, NP-MHTGR, Material Models of Pyrocarbon and Pyrolytic Silicon Carbide,CEGA Corporation, San Diego, 1993.
Chang, J., KAERI Table of Nuclides, Korea Atomic Energy Research Institute, Online,2005, http://atom.kaeri.re.kr/ton
Chaitelain, A.R., "Enhanced corrosion of Zirconium-base alloys in proximity to othermetals: the 'shadow effect,'" MS. Thesis, Massachusetts Institute of Technology, Feb.2000.
CINDAS LLC., Thermophysical Properties of Matter Database. Online, 2005.https://cindasdata.com/Products/TPMD
Gamma Engineering Corporation, "Continuous fiber ceramic composite (CFCC)cladding for commercial water reactor fuel; final project report," US Department ofEnergy NERI Report DE-FGO3-99SF21887, 2001.
Hasegawa, A. et al., "Critical issues and current status of SiC/SiC composites for fusion,"Journal ofNuclear Materials, 283-287 (2000) 128-137.
179

Hawari, A., et al., "Assessment of on-line burnup monitoring of pebble bed reactor fuelusing passive gamma-ray spectrometry," Nuclear Science Symposium ConferenceRecord, 1 (2001) 398-402.
Hejzlar, Pavel., "Fuel performance modeling of UO2 fuel with SIC cladding," PersonalCommunication, 2005.
Hollenberg, G.W., et al., "The effect of irradiation on the stability and properties ofmonolithic silicon carbide and SiCf/SiC composites up to 25 dpa," Journal of NuclearMaterials, 219 (1995) 70-86.
Icenhour, A.S. and Williams D.F., "Sphere-pac evaluation for transmutation," ORNL/TM-2005/41, Oak Ridge National Laboratory, May 2005.
Ichikawa, H. and Ishikawa, T., "Silicon carbide fibers (organometallic pyrolysis),"Comprehensive Composite Materials, Pergamon, 2000.
Ishihara, M., et al., "Irradiation effects on thermal expansion of SiC/SiC compositematerials," Journal of Nuclear Materials, 307-311 (2002) 1168-1172.
Jones, R.H., et al., "Radiation resistant ceramic matrix composites," Journal of NuclearMaterials, 245 (1997) 87-107.
Kazimi, M.S., "High Performance Fuel Design for Next Generation PWRs AnnualReport," MIT-NFC-PR-048, Massachusetts Institute of Technology, August 2002.
Kazimi, M.S., "High Performance Fuel Design for Next Generation PWRs: 2nd AnnualReport," MlT-NFC-PR-058, Massachusetts Institute of Technology, August 2003.
Kazimi, M.S. and Hejzlar, P., "High Performance Fuel Design for Next GenerationPWRs: Final Report," MIT-NFC-PR-082, Massachusetts Institute of Technology, January2006.
Kazimi, M.S., et al., "High Performance Fuel Design for Next Generation PWRs; 3rdAnnual Report, Part I," US Department of Energy NERI Report DE-FG03-01 SF22329,Oct. 2004.
Kohse, G. et al., "Safety evaluation report for the IASCC project: In-pile SSRT and ECPmeasurement facilities, MIT-NRL-052", Safety Review SR#-0-92-21, MassachusettsInstitute of Technology Nuclear Reactor Laboratory, 1993.
Lanning, D.D., Beyer, C.E., Geelhood K.J., "FRAPCON-3 Updates, Including Mixed-Oxide Fuel Properties," NUREG/CR-6534, Vol. 4, PNNL- 11513, Pacific NorthwestNational Laboratory, Richland, WA, May 2005.
180

Lee, Chan Bock., "SiC Cladding Properties for Performance Analysis with FRAPCON,"Personal Communication, June, 2005.
Long, Yun, "Modeling the performance of high burnup thoria and urania PWR fuel,"Ph.D. Thesis, Massachusetts Institute of Technology, 2002.
Manzel, R. and Walker, C.T., "High burnup fuel microstructure and its effect on fuel rodperformance," Proceedings of the 2000 International Topical Meeting on L WR FuelPerformance, Park City, Utah, April 10-13, 2000.
Maruyama, T. and Harayama, M., "Relationship between dimensional changes and thethermal conductivity of neutron-irradiated SiC," Journal ofNuclear Materials, 329-333(2004) 1022-1028.
Miriyala, N., et al., "The mechanical behavior of a Nicalon/SiC composite at roomtemperature and 1000C," Journal ofNuclear Materials, 253 (1998) 1-9.
MIT-NRL, "Advanced Clad Irradiation Loop," Safety Review SR#-0-06-04,Massachusetts Institute of Technology Nuclear Reactor Laboratory, 2006.
NIST Physical Reference Data: X-Ray Mass Attenuation Coefficients. Online, January2005, http://physics.nist.gov/PhysRefData/XrayMassCoef/tab3.html
Nogami, S., et al., "Effect of pre-implantation and neutron irradiation on mechanicalproperties of SiC/SiC composites," Journal of Nuclear Materials, 329-333 (2004) 577-581.
Nozawa, T., et al., "Neutron irradiation effects on high-crystallinity and near-stoichiometry SiC fibers and their composites," Journal of Nuclear Materials, 329-333(2004) 544-548.
Osborne, M.C., et al., "Neutron irradiation effects on the density, tensile properties andmicrostructural changes in Hi-Nicalon and Sylramic SiC fibers," Journal of NuclearMaterials, 253 (1998) 67-77.
PNNL, "Advanced Ceramic Composites for High-Temperature Fission Reactors," FinalNERI Project Report DE-FG03-990281, Pacific Northwest National Laboratory,Richland, WA, 2002.
Puill A., Bergeron J., Rohart M., Aniel-Buchheit S., Bergeron A., Matheron P., "Progressin the studies of the Advanced Plutonium fuel Assembly," Progress in Nuclear Energy,38 (2001) 403-406.
Romano, A., et al., "Modeling SiC swelling under irradiation: influence ofamorphization," Nuclear Instruments and Methods in Physics Research, B202 (2003)100-106.
181

Rovner, L.H. and Hopkins, G.R., "Ceramic materials for fusion," Nuclear Technology, 29(1976) 274-302.
Schwetz, K.A., "Silicon Carbide Based Hard Materials," Handbook of Ceramic HardMaterials, Riedel, Ralph (ed.), Wiley-VCH, 2000.
Shackelford, J.F. (ed.), CRC Materials Science and Engineering Handbook, 2nd ed.,CRC Press, 1994.
Shwageraus, E., Hejzlar, P., and Kazimi, M., "Optimization of the LWR nuclear fuelcycle for minimum waste production," MIT-NFC-TR-060, Massachusetts Institute ofTechnology, October 2003.
Snead, L.L., et al., "Low dose irradiation performance of SiC interphase SiC/SiCcomposites," Journal of Nuclear Materials, 253 (1998) 20-30.
Snead, L.L., "Limits on irradiation-induced thermal conductivity and electrical resistivityin silicon carbide materials," Journal of Nuclear Materials, 329-333 (2004) 524-529.
Snead, L.L., Hinoki, T., and Katoh, Y., "Strength of neutron irradiated silicon carbideand silicon carbide composite," Fusion Materials Volume 33, Semi-Annular ProgressReport for Period Ending December 31, 2002, Oak Ridge National Laboratory, March2003.
Snead, L.L., Osborne, M., and More, K.L., "Effects of radiation on SiC-based Nicalonfibers," Journal of Materials Research, 10 (1995) 736-747.
Snead, L.L., Zinkle, S.J., and White, D.P., "Thermal conductivity degradation of ceramicmaterials due to low temperature, low dose neutron irradiation," Journal of NuclearMaterials, 340 (2005) 187-202.
Turnbull, J.A. (ed.), Database: IFPE/HBEP Rev.1, Battelle's High Burn-Up EffectsProgramme for Fuel Performance, NEA-1510, 2002.
Turner, James E., Atoms, Radiation, and Radiation Protection, John Wiley and Sons, Inc,(1995).
Youngblood, G.E., presented at the 6th IEA SiC/SiC Workshop, Boston, June 10-11,2004.
Youngblood, G.E., Senor, D.J., and Jones, R.H., "Effects of irradiation and post-irradiation annealing on the thermal conductivity/diffusivity of monolithic SiC and f-SiC/SiC composites," Journal of Nuclear Materials, 329-333 (2004) 507-512.
182

Yuan, Y., Kazimi, M.S., and Hejzlar, P., "The design of high power density annular fuelfor LWRs," MIT-NFC-TR-067, Massachusetts Institute of Technology, Sept. 2004.
Zhao, Jiyun, Personal Communication, 2005.
Zhengpei, L. and Wenfeng L. "The measurement of bum-up level in HTR-10,"Proceedings of the Conference on High Temperature Reactors, International AtomicEnergy Agency, (2002) 1-5.
Zhiwen, X., Kazimi, M., and Driscoll, M., "Impact of High Burnup on PWR Spent FuelCharacteristics," Nuclear Science and Engineering, 151 (2005) 261-273.
Zimmerman, R.S. and Adams, D.F., "Static tensile and tensile creep testing of fiveceramic fibers at elevated temperatures," NASA Contractor Report 177525, NASA AmesResearch Center, 1989.
183
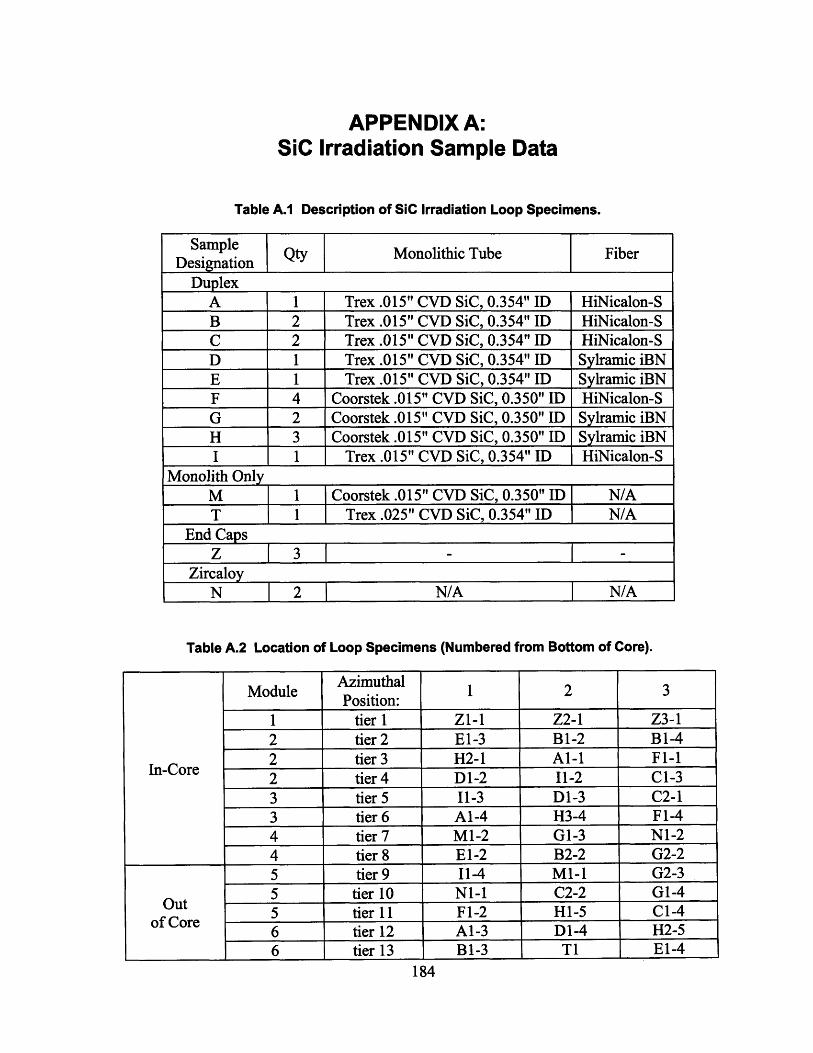
APPENDIX A:SiC Irradiation Sample Data
Table A.1 Description of SiC Irradiation Loop Specimens.
Sample Qty Monolithic Tube FiberDesignation
DuplexA 1 Trex .015" CVD SiC, 0.354" ID HiNicalon-SB 2 Trex .015" CVD SiC, 0.354" ID HiNicalon-SC 2 Trex .015" CVD SiC, 0.354" ID HiNicalon-SD 1 Trex .015" CVD SiC, 0.354" ID Sylramic iBNE 1 Trex .015" CVD SiC, 0.354" ID Sylramic iBNF 4 Coorstek .015" CVD SiC, 0.350" ID HiNicalon-SG 2 Coorstek .015" CVD SiC, 0.350" ID Sylramic iBNH 3 Coorstek .015" CVD SiC, 0.350" ID Sylramic iBNI 1 Trex.015" CVD SiC, 0.354" ID HiNicalon-S
Monolith OnlyM 1 Coorstek.015" CVD SiC, 0.350" ID N/AT 1 Trex.025" CVD SiC, 0.354" ID N/A
End CapsZ 3 - -
ZircaloyN 2 N/A N/A
Table A.2 Location of Loop Specimens (Numbered from Bottom of Core).
AzimuthalModule i 1 2 3
Position:1 tier 1 ZI-1 Z2-1 Z3-12 tier 2 E1-3 B1-2 Bl-42 tier 3 H2-1 Al-1 Fl-12 tier 4 D1-2 11-2 C1-33 tier 5 11-3 DI-3 C2-13 tier 6 Al-4 H3-4 F1-44 tier 7 M1-2 G1-3 N1-24 tier 8 E1-2 B2-2 G2-25 tier 9 11-4 M1-1 G2-35 tier 10 NI-1 C2-2 Gl-4
Out 5 tier 11 Fl-2 H1-5 C1-46 tier 12 Al-3 D1-4 H2-56 tier 13 B1-3 T1 El-4
184

Table A.3 Pre-Irradiation Specimen Dimensions.
As-Manufactured Measurements MIT MeasurementsSample Min ID Meas. Min OD Max OD Length Length Diff
ID (in) Temp (C) (in) (in) (in) (in) (in)Al- 1 0.3515 26 0.409 0.411 1.904 1.906 0.002Al- 3 0.3510 26 0.406 0.411 1.895 1.895 0.000Al- 4 0.3513 26 0.406 0.410 1.897 1.897 0.000B 1- 2 0.3508 26 0.411 0.423 1.898 1.9 0.002B1- 3 0.3508 26 0.414 0.425 1.906 1.906 0.000B1- 4 0.3518 26 0.414 0.424 1.909 1.909 0.000B2- 2 0.3523 26 0.412 0.426 1.897 1.897 0.000C1- 3 0.3523 24 0.416 0.424 1.910 1.912 0.002Cl- 4 0.3525 24 0.417 0.428 1.910 1.91 0.000C2- 1 0.3525 24 0.413 0.424 1.909 1.91 0.001C2- 2 0.3530 24 0.411 0.424 1.905 1.909 0.004D1l- 2 0.3515 23 0.426 0.427 1.912 1.915 0.003D l- 3 0.3518 23 0.425 0.426 1.895 1.898 0.003D l- 4 0.3520 23 0.426 0.427 1.900 1.898 -0.002El- 2 0.3523 23 0.417 0.430 1.901 1.901 0.000El- 3 0.3530 23 0.417 0.430 1.887 1.887 0.000E 1- 4 0.3525 23 0.424 0.447 1.909 1.909 0.000F 1- 1 0.3463 23 0.406 0.418 1.897 1.896 -0.001F 1- 2 0.3465 23 0.407 0.415 1.909 1.909 0.000F 1- 4 0.3465 23 0.414 0.406 1.870 1.871 0.001G1- 3 0.3473 24 0.413 0.427 1.900 1.898 -0.002G 1- 4 0.3470 24 0.415 0.427 1.905 1.906 0.001G2- 2 0.3473 24 0.414 0.422 1.894 1.894 0.000G2- 3 0.3468 24 0.410 0.420 1.892 1.892 0.000H 1- 5 0.3465 26 0.416 0.432 1.909 1.909 0.000H2- 1 0.3460 26 0.415 0.426 1.903 1.902 -0.001H2- 5 0.3468 26 0.410 0.425 1.901 1.902 0.001H3- 4 0.3458 26 0.413 0.425 1.893 1.893 0.000I 1- 2 0.3520 23 0.425 0.426 1.904 1.901 -0.003I 1- 3 0.3520 23 0.425 0.426 1.890 1.893 0.003I 1- 4 0.3518 23 0.425 0.426 1.889 1.889 0.000Ml1- 1 0.3460 23 0.384 0.384 1.890 1.888 -0.002Ml1- 2 0.3460 23 0.385 0.385 1.875 1.872 -0.003Ni- 1 0.3713 24 0.421 0.421 1.902 1.902 0.000N1- 2 0.3713 24 0.421 0.421 1.908 1.913 0.005T 1- 1 0.3530 24 0.403 0.405 1.908 1.908 0.000Z 1- 1 - - - - - 1.922 1.922Z2- 1 1.917 1.917Z3- 1 - (end cap loose)
185

Table A.4 Pre-Irradiation Specimen Weights.
OriginalWeight (g)
3.047AlA 1AlB 1B 1B 1B2C 1C1C2C2D1D1D1E lE lE 1F 1F lF lG1G iG2G2H1H2H2H3I 1I 1I 1
N1N1T 1Z 1Z2Z3
- 1- 3- 4- 2- 3- 4- 2- 3- 4- 1- 2- 2- 3- 4- 2- 3- 4- 1- 2- 4- 3- 4- 2- 3- 5- 1- 5- 4
- 2- 3- 4
- 1
- 1- I
-
BakeTime (hr)
2.9102.8523.2693.3243.4053.2123.2933.3763.1993.2304.0163.9833.9693.6893.6573.8233.3003.2663.1573.4743.4353.4133.3203.8213.7653.6713.7043.9903.9733.9251.8931.8896.1086.1443.0028.2148.316
Bake Temp(F)280
2222222111111111111111111111111111111
280
Post-BakeWeight (g)
3.047280280280280280280280280280280280280280280280280280280280280280280280280280280280280280280280280280280280280280
9.373
WeightChange (g)
2.9132.8493.2713.3233.4083.21
3.2943.3793.2003.2314.0163.9853.9683.6873.6563.8223.3003.2663.1573.4733.4363.4123.3203.8213.7643.6713.7053.9923.9733.9241.8941.8886.1086.1463.0028.2168.316
-0.001
186
SampleID
0.003-0.0030.002-0.0010.003-0.0020.0010.0030.0010.001
00.002-0.001-0.002-0.001-0.001
000
-0.0010.001-0.001
00
-0.0010
0.0010.002
0-0.0010.001-0.001
00.002
00.002
09.3749.3 ,
I ,

APPENDIX B:SiC Neutron Activation Analysis Data
Table B.1 Neutron Activation Analysis Sample Descriptions.
Sample Monolith Fiber Weight (g)C1 TREX Hi-Nicalon Type-S 0.172G2 CoorsTek Hi-Nicalon Type-S 0.295Fl CoorsTek Hi-Nicalon Type-S 0.211El TREX Sylramic 0.278
Table B.2 Elements Identified in Sample C1
3 hr CountConcentration
(jIg/g)212.2960195.0690190.725067.172017.03502.10301.20501.19000.42150.14360.04710.0377
I
(jlg/g)8.127011.90503.5090
13.49200.38600.08600.02500.02900.09080.00300.00130.0095
24 hr CountConcentration 1 YElement
(gg/g) (lAgFe 215.5380 0.0065Zn 73.0600 0.0146Hf 18.1140 0.0036Co 1.2720 0.0003Sc 0.1529 0.0306Se 0.0690 0.0155Ta 0.0512 0.0103Zr 0.0088 0.0157
187
Element
FeBaNaZnHfCrLaCo
ScSbAs
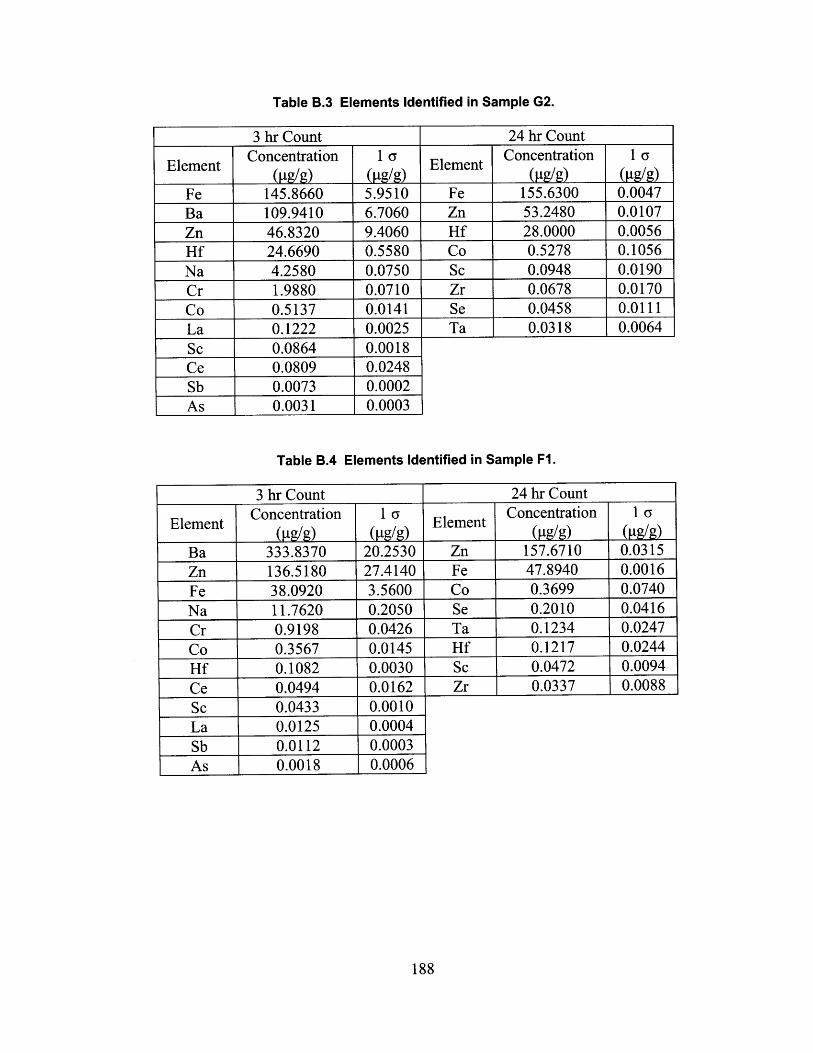
Table B.3 Elements Identified in Sample G2.
3 hr Count 24 hr CountConcentration 1 ( Concentration 1 y
Element Element
Fe 145.8660 5.9510 Fe 155.6300 0.0047Ba 109.9410 6.7060 Zn 53.2480 0.0107Zn 46.8320 9.4060 Hf 28.0000 0.0056Hf 24.6690 0.5580 Co 0.5278 0.1056Na 4.2580 0.0750 Sc 0.0948 0.0190Cr 1.9880 0.0710 Zr 0.0678 0.0170Co 0.5137 0.0141 Se 0.0458 0.0111La 0.1222 0.0025 Ta 0.0318 0.0064Sc 0.0864 0.0018Ce 0.0809 0.0248Sb 0.0073 0.0002As 0.0031 0.0003
Table B.4 Elements Identified in Sample Fl.
Element
BaZnFeNaCrCoHfCe
LaSbAI
3 hr CountConcentration
(jig/g)333.8370136.518038.092011.76200.91980.35670.10820.04940.04330.01250.011200018
1 a(Itg/g)
20.253027.41403.56000.20500.04260.01450.00300.01620.00100.00040.00030.0006
24 hr CountConcentration 1 (
Element (ng/g) (gg/g)Zn 157.6710 0.0315Fe 47.8940 0.0016Co 0.3699 0.0740Se 0.2010 0.0416Ta 0.1234 0.0247Hf 0.1217 0.0244Sc 0.0472 0.0094Zr 0.0337 0.0088
188
3 hr Count
.0

Table B.5 Elements Identified in Sample El.
3 hr CountConcentration
258.5160219.0630102.361088.17001.02200.69430.68930.29010.08730.05280.02120.0112
I 0
15.70303.84605.354017.70600.04400.01430.01850.06050.00260.00120.00060.0033
24 hr CountConcentration 1 0Element
Fe 103.4900 0.0032Zn 98.5260 0.0197Co 0.7453 0.1491Hf 0.0953 0.0191Sc 0.0551 0.0110Se 0.0446 0.0111Ta 0.0303 0.0061Zr 0.0272 0.0074
189
Element
BaNaFeZnCrLaCoCeHfScSbAs