assessment of nonlinear bond laws for near- surface
TRANSCRIPT
1
ASSESSMENT OF NONLINEAR BOND LAWS FOR NEAR-
SURFACE-MOUNTED SYSTEMS IN CONCRETE ELEMENTS
Francesca CERONI*
Assistant Professor
Engineering Department, University of Sannio
Piazza Roma, 21, 82100 - Benevento, Italy, [email protected]*
Joaquim A.O. BARROS
Full Professor
Department of Civil Engineering, University of Minho
Campus de Azurém, 4800-058 Guimarães, Portugal, [email protected]
Marisa PECCE
Full Professor
Engineering Department, University of Sannio
Piazza Roma, 21, 82100 - Benevento, Italy, [email protected]
Marco IANNICIELLO
Graduate student
Engineering Department, University of Sannio
Piazza Roma, 21, 82100 - Benevento, Italy, [email protected]
Abstract
This paper presents a numerical plane Finite Element (FE) Model for use in simulating
the behaviour of different types of Near Surface Mounted (NSM) Fibre Reinforced
Plastic (FRP) strengthening systems for concrete elements. Based on a nonlinear bond
law for simulating the behaviour of the FRP reinforcement-adhesive-concrete interface,
the model employs an interface element between the NSM FRP reinforcement and the
*Corresponding author
Engineering Department, University of Sannio
Piazza Roma, 21, 82100 - Benevento, Italy
Tel. +39-824-305566, Fax +39-824325246, E-mail: [email protected]

2
concrete. The results of two different experimental programs, both dealing with 'bond
tests' but with distinct set-ups, are briefly summarised and analysed. The main objective
of this research is to assess the values of the parameters that define the nonlinear bond
laws for each type of FRP reinforcement tested. This assessment was accomplished by
inverse analysis, fitting numerically the pullout load–displacement curves that were
experimentally recorded. The effect of bond length on different types of NSM FRP
reinforcement is assessed. Finally, the bond behaviour in the transverse plane is
examined too.
Keywords: A. Polymer-matrix composites (PMCs), B. Debonding, B. Fibre/matrix
bond, C. Finite Element Analysis, NSM systems.
1. Introduction
Recently, the use of Fibre Reinforced Plastic (FRP) materials for the repair and
strengthening of concrete structures has increased due to several advantages of these
composites for use as external reinforcement compared to conventional materials and
construction systems, such as externally bonded steel plates, steel or concrete jackets
and external post-tensioning (CSA [1]; JSCE [2]; fib bulletin [3]; CNR DT 200 [4]; ACI
440 [5]). One of the main design issue in using FRP plates or sheets that have been
externally bonded to concrete elements is the well-known phenomenon of debonding of
the reinforcement from the concrete substrate, which is a typical failure mode of this
strengthening system and precludes the exploitation of the high tensile strength of the
fibres (Smith and Teng [6]; Ceroni and Pecce [7]).
A more recently developed technique, designated as Near Surface Mounted (NSM)

3
reinforcement, has been shown to be very effective for flexural (Barros and Fortes,
2005) and shear (Dias and Barros [8]) strengthening of concrete elements, because the
tensile capacity of FRP systems is more effectively mobilised. NSM systems are
composed of FRP bars or strips that are installed in grooves cut into the concrete cover
of the element to be strengthened (De Lorenzis and Nanni [9]; Blaschko and Zilch [10].
Several researchers have investigated the NSM technique, executing experimental tests
to assess its capabilities in terms of load-carrying capacity (De Lorenzis and Nanni [9];
De Lorenzis and Teng [11]; Sena Cruz and Barros [12]; Hassan and Rizkalla [13];
Seracino et al. [14]; Bilotta et al. [15]; Novidis and Pantazopoulou [16]; Borchert and
Zilch [17]; Encore & fib reports [18]). The experimental results show that the load-
carrying capacity of NSM systems is strongly influenced by the bond behaviour, which
is dependent on: the mechanical properties of the FRP reinforcement, the groove filler
and the concrete substrate, the surface properties of the FRP reinforcement and of the
grooves, the shape of the strengthening system (bars or strips), the dimensions of the
groove and the depth of the FRP reinforcement in the groove (De Lorenzis and Nanni
[9]; De Lorenzis and Teng [11]; Sena Cruz and Barros [12]; Seracino et al. [14]).
The objective of this research is the assessment of the values of the parameters of a
bond stress–slip law, τ–s, for the modelling of the interface behaviour between NSM
FRP bars/strips and concrete, using a Finite Element Model (FEM). Using the general
τ–s law proposed by Sena Cruz et al., [19], the pullout bond tests conducted by Bilotta
et al. [15] and Macedo et al. [20] on concrete blocks where different types of FRP NSM
systems were installed, were simulated with a FE model. Some of the experimental
results are summarised herein. The strain field in the FRP NSM reinforcement, the shear
stresses along the FRP-concrete interface, and the tensile stresses in the concrete

4
surrounding the FRP reinforcement were determined numerically. By fitting the global
pullout force–displacement curves recorded in the experimental tests, the values of the
parameters of the bond law were determined for each NSM system tested.
2. Synthesis of the experimental results
2.1 Experimental programs
As previously introduced, the numerical studies presented in this paper are based on the
experimental results of two different programs on bond tests carried out by the authors
(Bilotta et al. [15]; Macedo et al. [20]). The meaningful data obtained from the two
programs, designated as Programs 1 and 2, are herein presented and discussed briefly
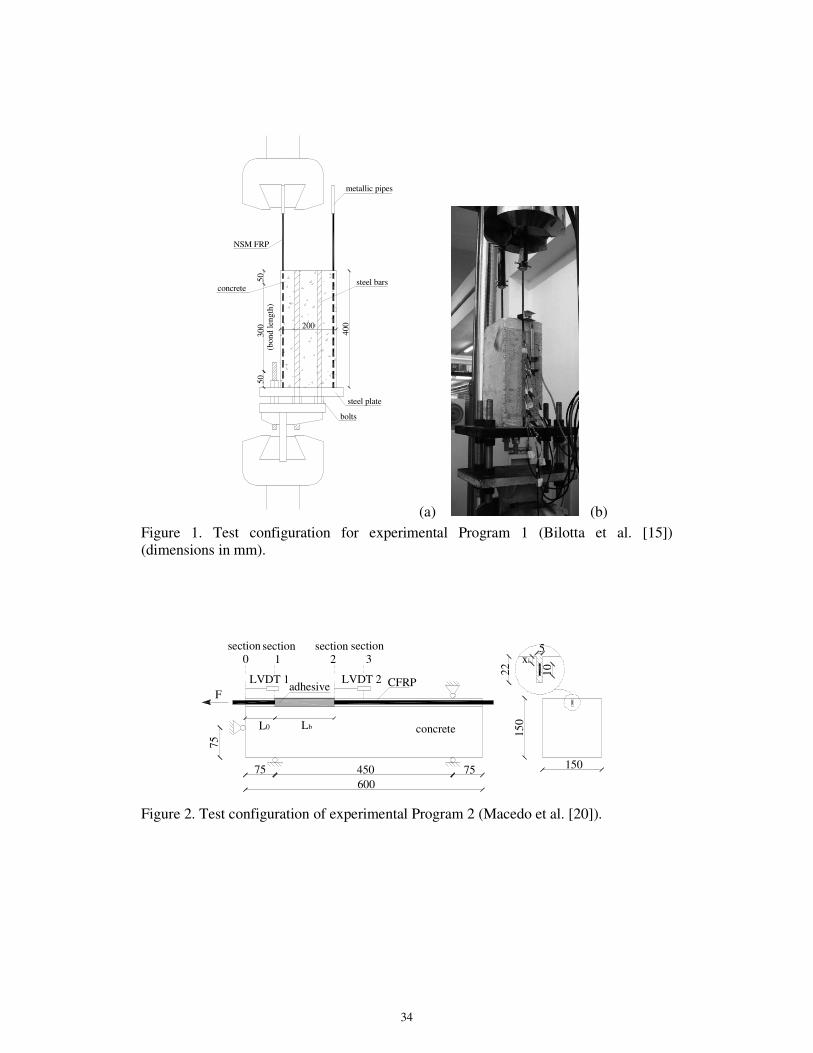
.The specimens tested in Program 1, described in detail in (Bilotta et al. [15]), are made
of prismatic concrete blocks (dimensions bc = 160 mm, hc = 200 mm, Lc = 400 mm)
where glass, basalt and carbon FRP bars or carbon FRP strips were installed into
longitudinal grooves (NSM technique,Figure 1). Four different types of bar and a strip
were considered, and three equal specimens have been prepared and tested for each type
of FRP. NSM reinforcement was embedded in a groove longitudinally cut into the cover
of the prisms after concrete hardening (Figure 1). The experimental arrangement is an
asymmetrical 'pull–pull' test, wherein the FRP reinforcement is pulled by the upper grips
of an universal testing machine, while the concrete block is fixed to the lower grips of the
same machine by means of a pair of internal steel bars connected with bolts to a stiff steel
plate (see Figure 1). This configuration introduces a tensile load in the concrete block. To
reuse each specimen as much as possible, the NSM systems were applied on two lateral
faces of the concrete block so that two pullout tests could be conducted on each
5
specimen. The same bond length was used for all of the specimens (Lb = 300 mm). Five
strain gauges, spaced 70 mm apart, have been glued onto the surface of each NSM bar
or strip before the adhesive was applied and the reinforcement was placed into the
groove.
The main test variables were the following: the type of reinforcement (bars or strips),
the type of fibres (glass, basalt, or carbon), Young’s modulus (46 to 182 GPa), the
diameter of the bars (d = 6 or 8 mm), and the surface treatments of the bars. The
following combinations of bar fibre type, diameter, and surface treatment were used:
sand-coated round basalt bars 6 and 8 mm in diameter (B-6-SC and B-8-SC), ribbed
round glass bars 8 mm in diameter (G-8-RB), smooth round carbon bars 8 mm in
diameter (C-8-S), and smooth carbon strips 2.5 mm thick and 15 mm wide (C-2.5x15-
S). The 6- and 8-mm-diameter bars were placed into square grooves 10 and 14 mm on a
side, respectively; the strips were placed in grooves with rectangular cross-sections of
25 mm x 8 mm. The groove shape factor, k, is defined as the ratio between the groove
width and the bar diameter or strip width and is always greater than 1.5. This is the
minimum value suggested to avoid splitting failure of the epoxy (De Lorenzis and Teng
[11]).
Epoxy adhesive was used to affix the bars and the strips into the grooves.
The notation of specimens is A-x-B-n, where A refers to the reinforcement material (B,
G, or C for Basalt, Glass or Carbon), x identifies the bar diameter or strip thickness and
width (6 or 8 mm for the round bars and 2.5x15 for the strips), B denotes the surface
treatment (“SC” for Sand-Coating, “S” for Smooth, “RB” for RiBbed), and n
distinguishes the ordinal number of tests (1, 2 or 3).
6
All of the specimens have been cast in a single batch. The mean cylinder concrete
compressive strength at 28 days after casting was fcm = 19 MPa, and the mean Young’s
modulus, Ec, was 18.6 GPa. At the time of the bond tests (about 200 days after casting),
the mean cubic compressive strength was 23.1 MPa. The average tensile strength, fctm,
was estimated to be 2.0 MPa (Eurocode 2 [21]). The low values of these mechanical
properties are due to the chosen concrete mixture, designed to simulate poor-quality
concrete in an existing building.
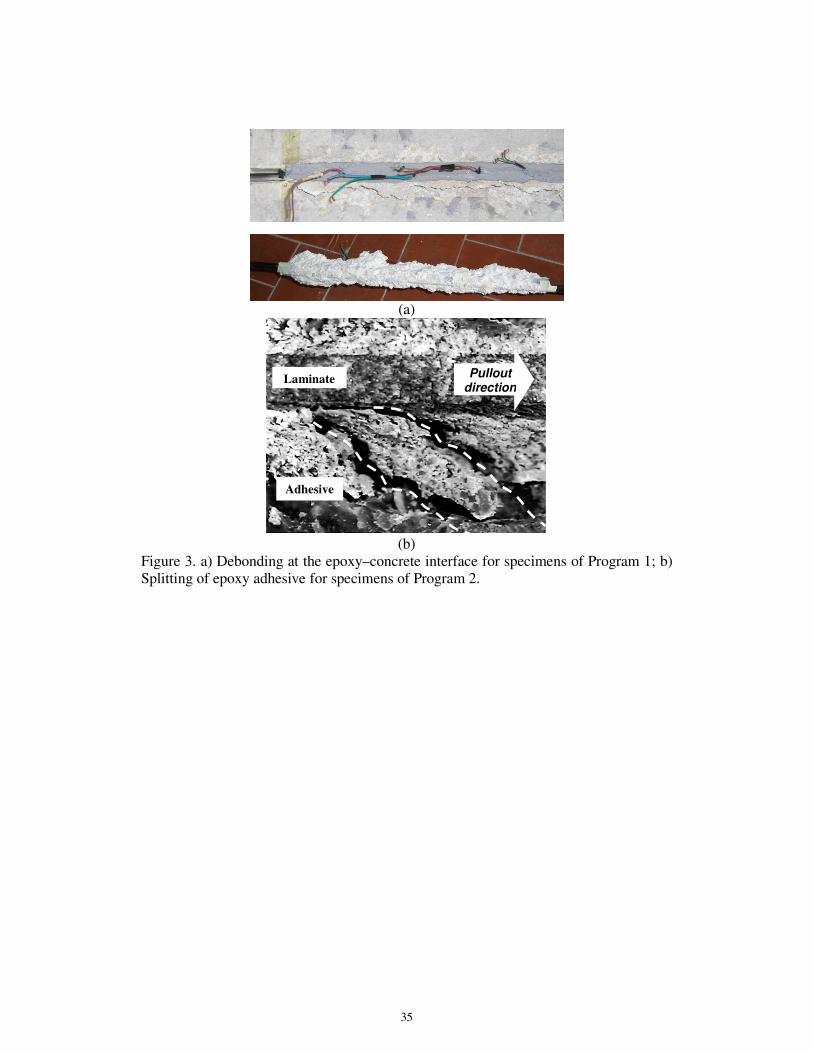
In experimental Program 2, described in detail in (Macedo et al. [20]), the bond tests
were conducted on concrete blocks where smooth carbon FRP strips ( cross-section of
1.4 mm by 10 mm, C-1.4x10-S) were inserted in grooves. The experimental
arrangement was an asymmetrical pullout configuration in which the NSM strips were
loaded in tension and the concrete block was compressed (see Figure 2). The specimens
had dimensions of 150 mm x 150 mm x 600 mm, and several bond lengths (40, 70, 90,
120, and 150 mm) were tested. The strips were placed in a groove with rectangular
cross section of 22 mm x 5 mm. Thus, the minimum shape factor k was 2.2. For each
value of Lb, two specimens were prepared to test the effect of the position of the strip in
the groove; two positions were considered and identified by the distance, xi, of the strip
from the top (6 and 12 mm, as shown in Figure 2). Epoxy adhesive was used to affix the
strips in the grooves.
One displacement transducer (LVDT1) was used to measure the displacement between
the left edge of concrete specimen (section 0) and the first FRP point bonded to concrete
(section 1). This displacement is hereafter referred to as the displacement at the loaded
end, dl. A second displacement transducer (LVDT2) was used to measure the
displacement at the free end, dfr, i.e., the displacement between the last FRP bonded
7
point (section 2) and the concrete point located at section 3. Strain gauges were also
glued on the strip to estimate the strain variation in the bonded region. The notation
used for the series of tests is LbY_xZ, where Y and Z are the CFRP bond length (40, 70,
90, 120 or 150 mm) and its position in the groove (6 or 12 mm), respectively.
The mean cylinder compressive strength, fcm, at 28 days after casting was25 MPa, and
the mean Young’s modulus, Ec, was 29 GPa. Based on the Eurocode 2 [21], the average
tensile strength, fctm, was estimated to be 2.6 MPa.
2.2 Experimental results
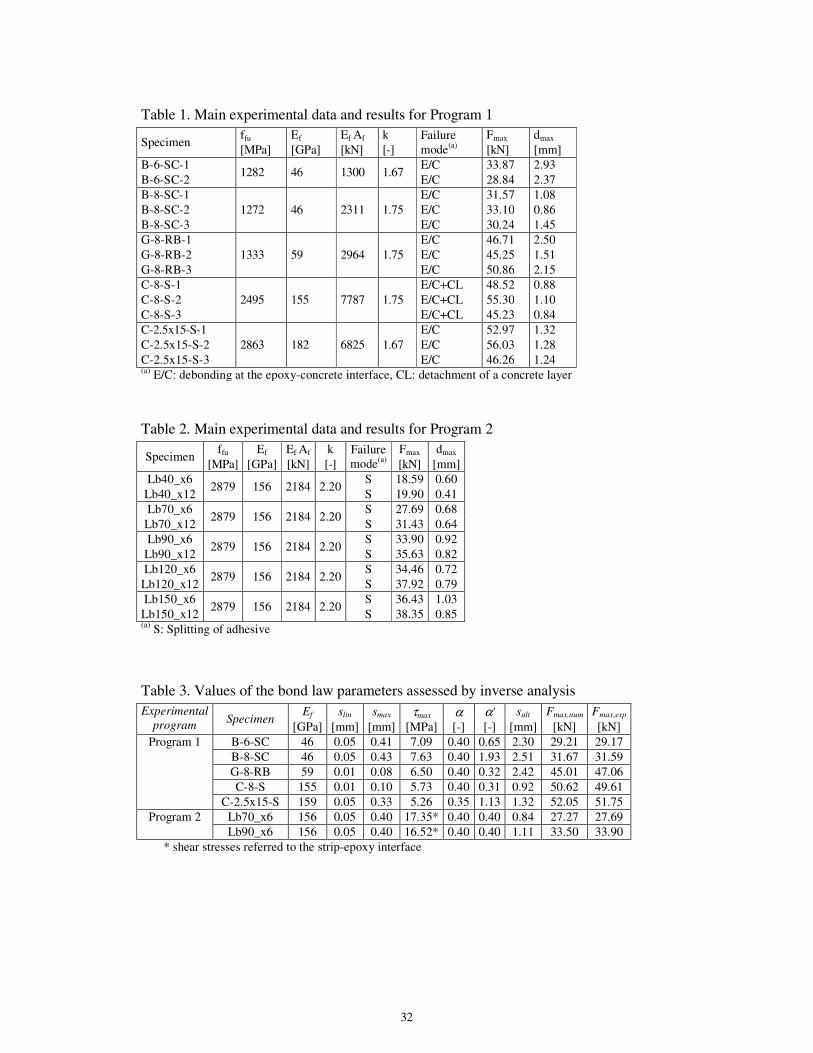
For each NSM system tested in Programs 1 and 2, Tables 1 and 2 show the following
relevant results: the ultimate tensile strength ffu, the Young’s modulus Ef, the axial
stiffness Ef Af , the groove shape factor k, the failure mode, the maximum load Fmax, and
the loaded-end slip at Fmax, dmax. The mechanical properties of the FRP are the average
values obtained from experimental tensile tests with five specimens, according to
(ASTM-D3039, 2000).
In Program 1, the displacements d were calculated by integrating the measures of strain
along the bonded length, while in Program 2 they were determined directly as the
difference between the LVDT1 measure, dl, and the elastic elongation of the unbonded
part of the FRP strip.
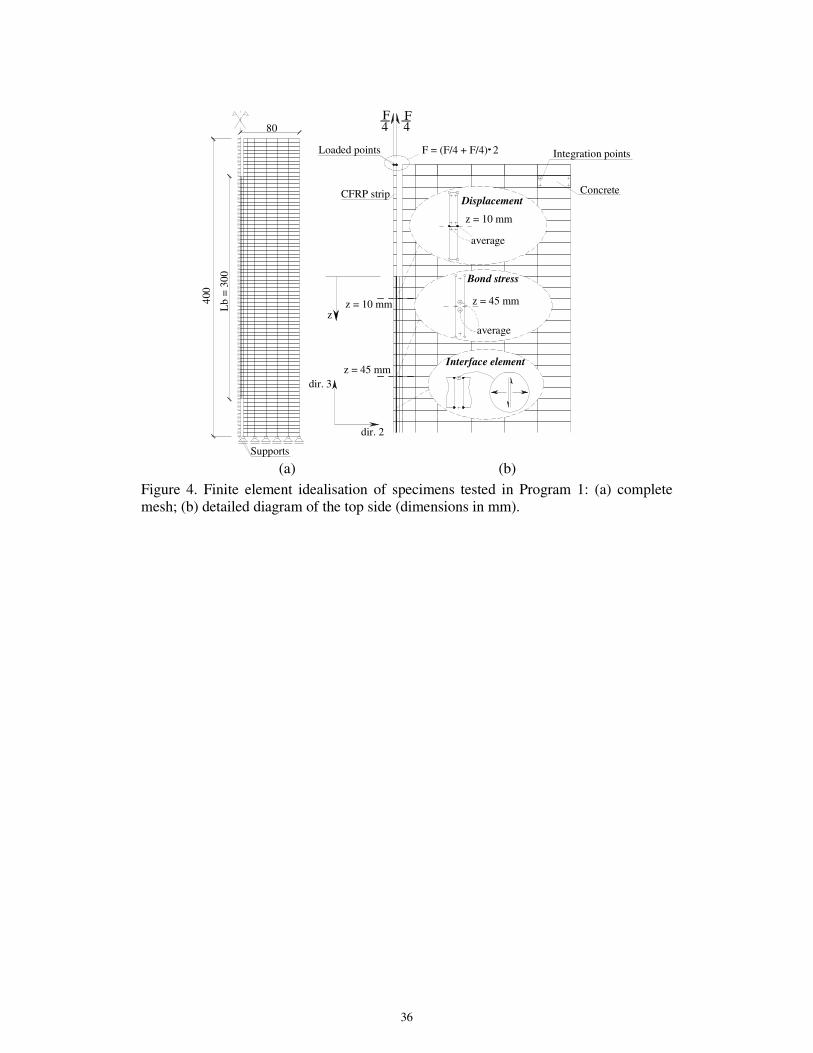
In Program 1, bond failure occurred along the epoxy–concrete interface with a layer of
concrete attached to the reinforcement for all specimens (see Figure 3a). In Program 2,
splitting of the epoxy occurred in all specimens (see Figure 3b), despite the high values
of the shape factor, k.
In Program 1, the values of axial stiffness of the NSM reinforcements are quite

8
dissimilar, ranging between 1300 and 7787 kN. The axial stiffness of the carbon strips
tested in Program 2 (2184 kN) is comparable to the stiffness of the 8-mm-diameter
basalt bar tested in Program 1 (2311 kN).
3. Numerical analysis
3.1 The FEM model
Numerical simulations were conducted with FEMIX v4.0, an FEM-based computer
program that can be used for nonlinear analysis of materials. Several constitutive
models for cement-based materials, steel and composites can be implemented in
FEMIX (Sena Cruz et al. [19]). Both of the test configurations described previously
were modelled as plane stress problems.
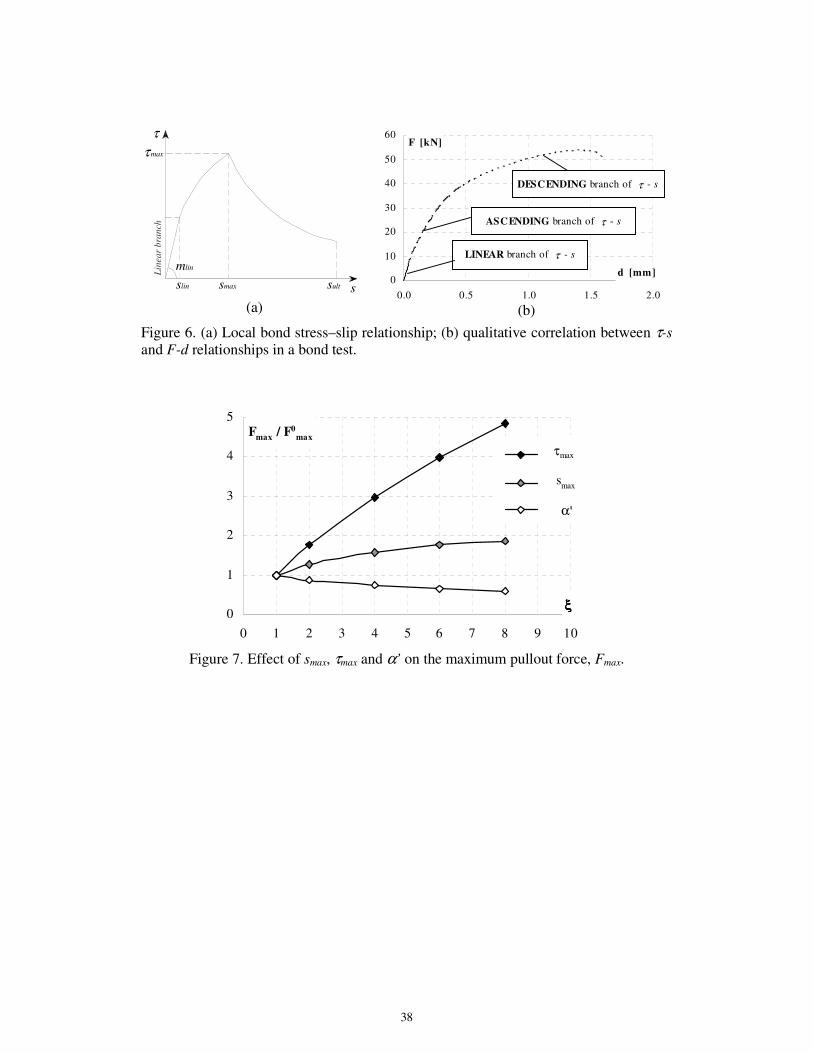
To simulate the boundary conditions of the specimens tested in Program 1 (Figure 4),
the the displacements in direction 3 were set to zero for the nodes of the inferior part of
the specimen, as well as the displacement in direction 2 for the nodes of the symmetry
axis.
To simulate as closely as possible the support conditions of the specimens tested in
Program 2, the top side of the specimen was restrained to prevent displacement in
direction 3 and two supports were placed at the lateral faces to prevent displacement in
direction 2 at these points (Figure 5).
In both cases, due to the symmetric conditions of the test configurations, only half of
each specimen was modelled.
Four-node Lagrangian plane stress elements with a 2×2 Gauss–Legendre integration
scheme were used to simulate both the concrete and the FRP NSM reinforcement. The

9
FRP reinforcement and the concrete were modelled as linear elastic materials, with the
Young’s modulus values determined in the experimental characterization tests (see
Table 1 and 2), and Poisson’s ratios of 0.2 for concrete and 0.0 for the FRP
reinforcements. Since adopting values of Poisson's ratio available in the literature for
the FRP materials has negligible influence on the results of the simulations performed,
it was decided to assume a null value for this parameter.
The adhesive was simulated by four-node line interface finite elements with a two-point
Lobatto integration rule. The tangential stiffness of the constitutive law of these
interface elements is defined once the values of the parameters that define the local τ - s
bond law are known. A constant value of 1.0e+06 N/mm3 was used for the normal
stiffness.
The load was applied at two points, and the arc length method was applied by
controlling the displacement at the loaded end of the FRP reinforcement, imposing a
displacement increment of 0.01 mm in direction 3 (Figure 4b and 5b).
3.2 The bond law of the interface finite element
In this study, the determination of the local bond stress–slip relationship for both strips
and bars is based on the approach described by Sena Cruz and Barros [11]. Thus, the
nonlinear bond law, s−τ , adopted in the FE model is composed of the following three
branches:
sms lin ⋅=)(τ
if limss ≤
α
ττ
=
max
max)(s
ss
if maxlim sss ≤≤
'
max
max)(
α
ττ
−
=
s
ss
if maxss >
(1)

10
where τmax is the shear bond strength and smax is the corresponding slip; α and α’ are
parameters defining the shape of the pre- and post-peak branches, respectively; and mlin
represents the initial stiffness of the bond law, assumed to be linear up to a slip of lims
(Figure 6a). The shape of the pre- and post-peak branches is assumed to be nonlinear.
The bond law is fully identified by five parameters, and their significance to the global
bond behaviour of concrete elements, where different types of FRP NSM systems were
installed, was investigated as described below. The post-peak softening branch of the
bond law can tend asymptotically toward a residual or a zero shear stress. The influence
of the three branches of the local bond law (ascending linear, ascending nonlinear, and
nonlinear softening) on the global pullout relation of a specimen tested in a bond test is
represented in Figure 6b. In particular, the maximum force is theoretically reached
when the displacement at the loaded end attains the value corresponding to the residual
or zero value of shear stress. The bonded length corresponding to these bond conditions
is considered the effective bonded length since it guaranties the application of the
maximum pullout force. Moreover, the slip corresponding to this condition is defined as
the ultimate one, sult.
3.3 The influence of bond law parameters on the pullout load
Parametric numerical analyses conducted using the FE model described in 3.1 and
applied to concrete specimens with carbons strips according to the scheme shown in
Figure 4 demonstrate that, among the five parameters defining the bond law, the
following ones have a significant influence on the global behaviour:
- the peak value of the bond stress–slip curve, τmax, and its corresponding slip, smax;
and

11
- the parameter that defines the shape of the post-peak branch of the τ – s relationship,
α’.
The effect of each of these parameters on the global behaviour is identified as the
maximum pullout force, Fmax, that can be applied to the FRP reinforcement. Note that
both the maximum pullout force, Fmax, and the ultimate displacement, sult, of the bond
law are results of the numerical procedure solving the differential equations of bond. As
previously explained, sult is the value corresponding to the maximum force that is
attained when the descending branch of global P-d curve starts (see Figure 6a and 6b).
In Figure 7, the ratio Fmax/F0
max is plotted against the parameter ξ, which is given by the
following three different expressions according to the parameter of the bond law varied
in the parametric analyses :
0'
'
0
max
max
0
max
max
α
α
τ
τξ ===
s
s (2)
where 0
maxs , 0
maxτ and 0'α represent the minimum values of
maxs , maxτ and
'α used in
the parametric studies, respectively (i.e., 0
maxs = 0.08 mm, 0
maxτ = 1.25 MPa and 0'α =
0.20), and 0
maxF is the maximum numerical pullout force for these values. The influence
of the other two parameters, slin and α , on Fmax was observed to be very low (less than
6% for slin between 0.03 and 0.30 mm and for α between 0.20 and 1.60) so that in all of
the parametric analyses represented in Figure 7, they have been assumed to be equal to
0.05 mm and 0.40, respectively. Figure 7 shows that the most significant parameter that
affects the maximum pullout force is the bond strength, τmax. In fact, for
80'
'
0
max
max
0
max
max ====α
α
τ
τξ
s
s, the values of the 0
maxmax / FF ratio are approximately 5, 2, and

12
0.5, respectively. The significant effect of τmax on the global strength was demonstrated
by Ceroni et al. [22] too, even when a simplified bilinear bond law was assumed.
4. Experimental–numerical comparison
4.1 Inverse analysis
The differential equation of bond was solved for some of the specimens tested by
Bilotta et al. [15] and Macedo et al. [20], assuming the general bond laws given by Eq.
(1).
For the specimens tested in Program 1, the maximum bond stress, τmax, was assessed
using the experimental s−τ relationships obtained on the basis of the strain gauges
measurements and considering the experimental average value of equal specimens. In
particular, the shear stress was calculated using the measures of the first two strain
gauges that were placed at 10 and 80 mm from the loaded end of the FRP
reinforcement; thus, the experimental measures refer to the abscissa z = 45 mm (see
Figure 4b). The corresponding slip was calculated by integrating the experimental
measures of strain along the whole bonded length. Successively, an inverse analysis was
performed by determining the values of smax and α’ that best fit the experimental
pullout force–displacement curves.
In contrast, for the specimens tested in Program 2, the inverse analysis was used directly
to assess the values of all of the parameters of the s−τ relationship because only the
slips at the loaded and free ends were measured experimentally.

13
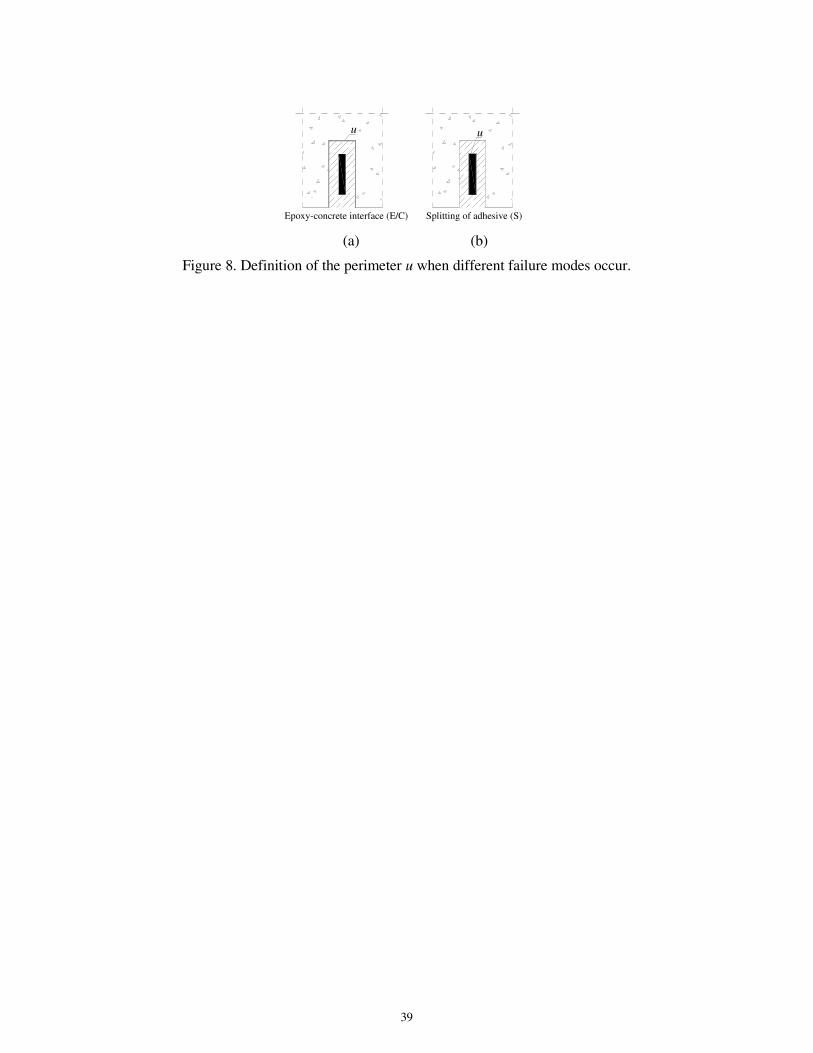
For the specimens tested in Program 1 the bond shear stresses are referred to the
perimeter of the epoxy–concrete interface (because the failure occurred at the epoxy–
concrete interface see Figure 8a), while for the specimens tested in Program 2 to the
perimeter of the epoxy–FRP reinforcement interface (because a splitting failure of the
resin occurred, see Figure 8b). However, the numerical value of maximum pullout
force, Fmax, is independent of the perimeter because the thickness attributed to the
interface finite elements that simulate the adhesive is the aforementioned perimeter.
Because the slim and α parameters have relatively little influence on the F–d response
(see section 3.3), values of 0.05 or 0.01 and 0.35 or 0.40, respectively, were assumed for
these parameters.
In Table 3, the values of the parameters of the bond law assessed for each NSM system
are listed for both experimental programs. The numerical and experimental maximum
pullout forces (Fmax,num and Fmax,exp, respectively) are also listed.
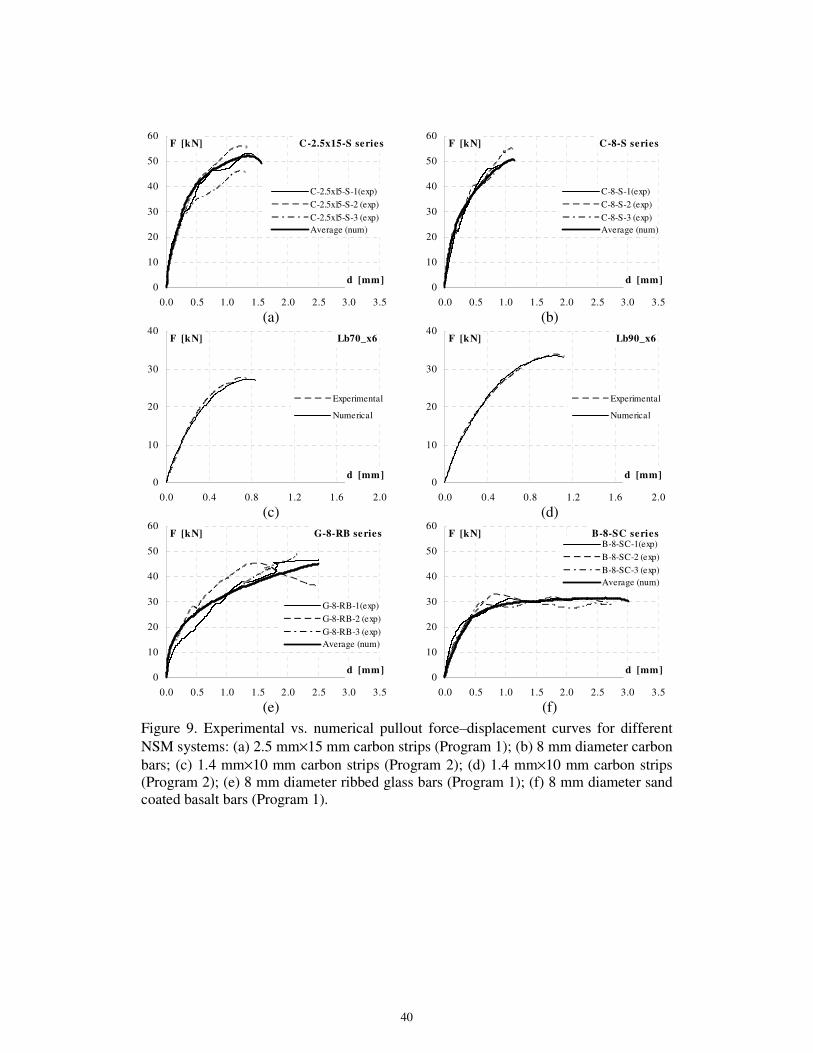
In Figure 9, the full numerical and experimental load–displacement curves are
compared. Good agreement can be observed, in terms of both the F–d curves and the
maximum load.
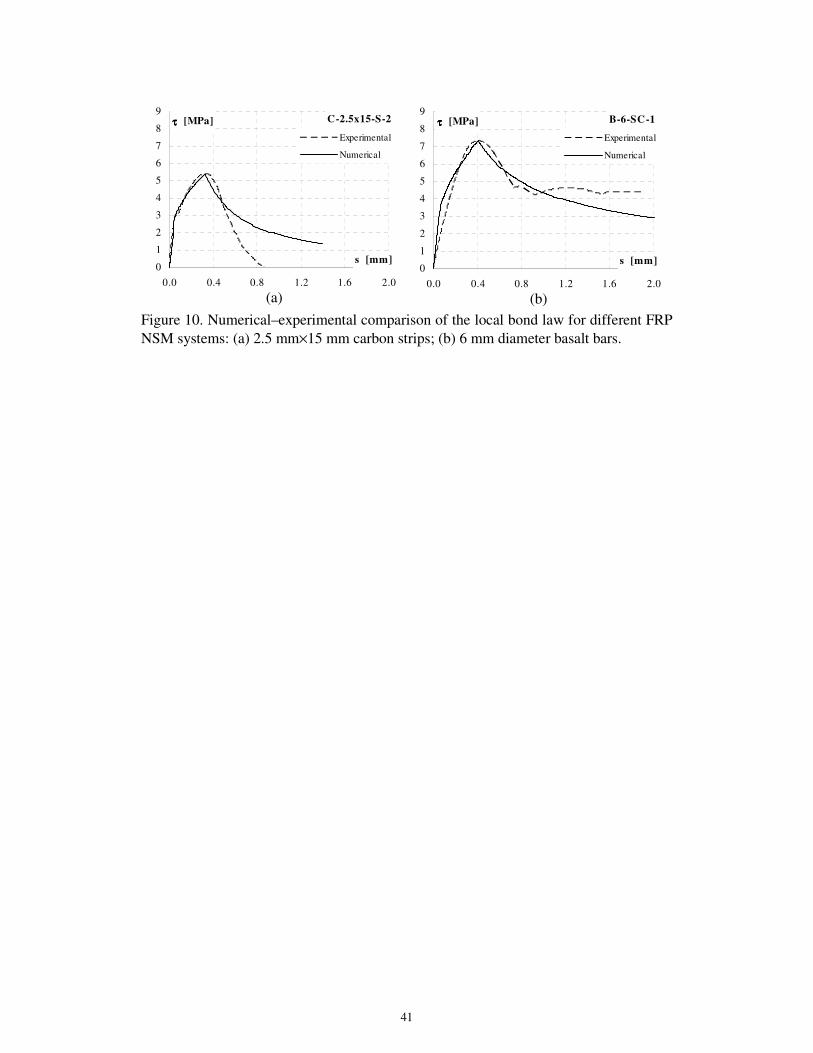
In Figure 10, the experimental s−τ bond laws derived from the strain gauge
measurements and the ones determined from the numerical fitting procedure conducted
by the inverse analysis are compared for the carbon strips and the 6-mm-diameter basalt
bars tested in Program 1. This type of comparison has been presented for all of the
tested specimens by Ianniciello [23]. The graphs demonstrate quite good predictive
performance up to the bond strength. The experimental measures are low reliable in the
post-peak phase when the damage along the bond length can be significant and, indeed,

14
were not used for defining the bond law parameters. This confirms that the global
behaviour is well captured by the numerical simulations using the inverse analysis
approach, while the approach based on local experimental measures is not always
reliable.
4.2 Analysis of the bond behaviour by means of the numerical model
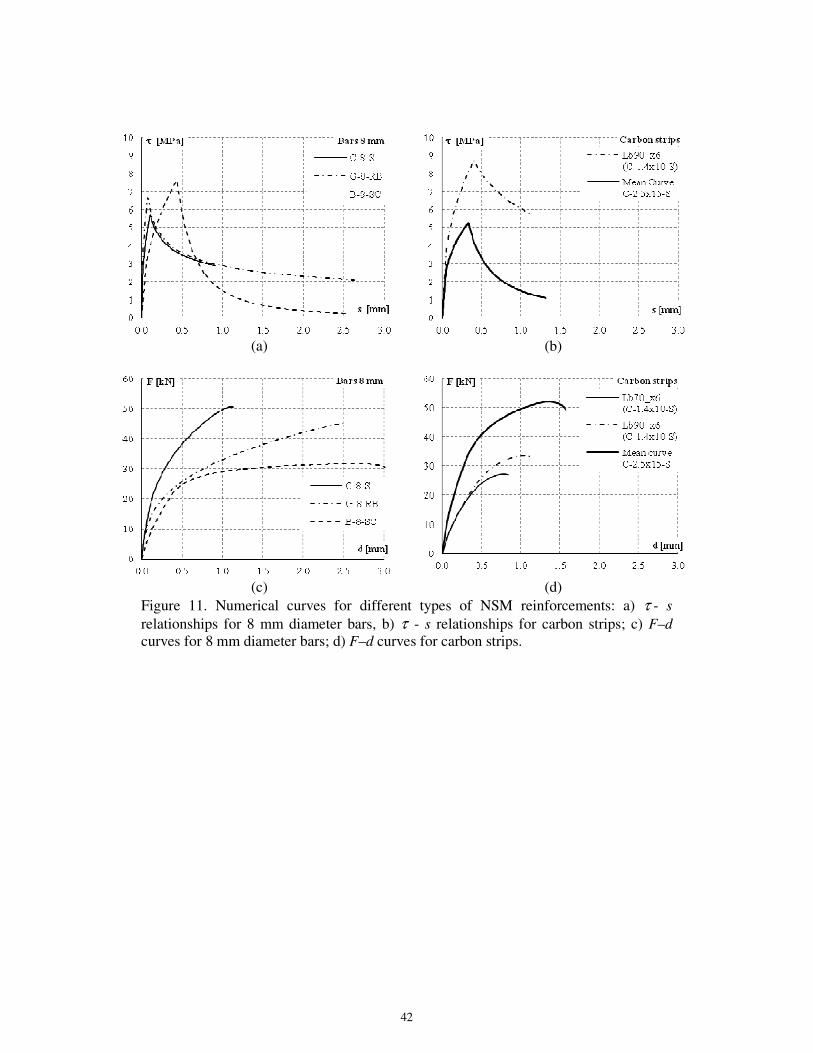
In Figures 11a–b, the theoretical bond laws assessed for the three types of 8-mm-
diameter bars and for the two types of carbon strips are compared, while in Figures
11c–d, the corresponding global F–d curves are shown.
In order to compare results of specimens failed in different ways (epoxy-concrete
interface failure or epoxy splitting), the bond shear stresses plotted in Figures 11 pertain
to the perimeter of the epoxy–concrete interfaces for all specimens of both Programs 1
and 2. These results illustrate the following points:
1) The bond law for the ribbed glass bars has a lower shear strength than that for
the sand-coated basalt bars, but a notably lower value of α' makes the post-peak
softening branch less brittle (Figure 11a). Moreover, the glass bars are more effective in
term of maximum pullout force than the basalt ones (about +50%, see Figure 11c),
despite the values of Young's modulus for the two types of bars not being very different
(59 GPa vs. 46 GPa). This might be a positive effect of the surface treatment (ribs made
of epoxy resin) in the glass bars, while in the case of the basalt bars, only a sand coating
is present. In this latter case, the bond law should be, in general, primarily influenced by
the cohesion, chemical adhesion and friction phenomena, rather than by interlocking
effects that are activated by the presence of ribs along the surface of the glass bars.
Thus, for a smooth surface, the post-peak bond behaviour is usually more brittle than
for a ribbed surface, due to the rapid decay of bond when the interlocking phenomena

15
are less pronounced (Eligehausen et al. [24]). However, more testing is necessary to
confirm these results, and in this respect, it is important to compare the bond behaviour
of bars made of the same materials and dimensions, but with different surface
treatments.
2) The smooth carbon bars, with no surface treatment, developed a bond law
similar to that of glass bars (Figure 11a), even if they attained a notably smaller ultimate
slip (0.9 mm vs. 2.6 mm), which contributed to a less ductile global behaviour of the
carbon bars (Figure 11c). The efficiency of the carbon bars is, however, very relevant in
terms of failure load, which was the highest one (about 50 kN) within the specimens
tested in this experimental program. The relatively high Young's modulus (about 155
GPa) allowed to reach high loads, even if, coupled with the smooth surface of these
bars, contributed to make more brittle the global behaviour and have lower ultimate
slips in the local bond law.
3) In terms of local behaviour, Young's modulus Ef influences the values of τmax
and sult: in particular, τmax decreases with an increase in Ef, and sult increases with a
decrease in Ef.
4) In terms of global behaviour, as Ef increases, the ultimate displacement
reached by the systems, dmax, decreases. The initial stiffness of the F–d curves for the 8
mm diameter bars (Figure 11c) also increases with Ef, because this contributes to an
increase in the axial stiffness of the FRP system, Ef·Af. In addition, the maximum
pullout force, Fmax, increases with Ef, being Af equal for the three types of bar.
5) The comparison of the s−τ of carbon bars and strips of similar Ef and
smooth surface tested in Program 1 (Figure 11a and 11b) confirms that the strip type C-
2.5x15-S (Figure 11b) developed a bond law of greater smax and sult compared with the

16
carbon bars C-8-S, leading to a more ductile response in terms of F–d too (Figure 11c
and 11d). In particular, the favourable effect of the rectangular shape of the cross-
section of the strips is reflected in terms of larger ductility and similar maximum pullout
load (mean value approximately 52 kN), despite the smaller axial stiffness of the strips.
This can be explained by the larger bond perimeter and the high degree of confinement
provided by the surrounding concrete in the case of the strips (Barros and Kotynia [25]).
6) The comparison of the bond law of the two types of carbon strips (one type
tested in Program 1 and the other tested in Program 2 and both referred to the epoxy–
concrete interface, Figure 11b), reveals that τmax is 8.7 MPa for the C-1.4x10-S strip and
5.2 MPa for the C-2.5x15-S strip. This can be explained by the different geometries of
the two strips, which can be characterized by a shape ratio defined as the ratio of the
perimeter to the cross-sectional area of the strip, pfrp/Afrp. For the C-2.5x15-S strip, the
ratio pfrp/Afrp is 0.93, while for the C-1.4x10-S strip, the ratio is 1.63. If pfrp/Afrp is
higher, a larger transfer of shear load is expected: indeed, a larger value pfrp means that
a larger surface exists for shear transfer, while a smaller value of Afrp means a lower
axial stiffness that, as already observed for Ef, is indicative of a larger stress transfer.
Indeed, in general as the axial stiffness is lower as the strain distribution in the FRP
reinforcement are more concentrated and, thus, characterized by lower transfer length;
this means higher shear stress close to the loaded end (see the following section 4.3). If
the τmax of the C-1.4x10-S strip (8.7 MPa) is scaled by the ratio 0.93/1.63=0.57, a value
similar to the τmax of the C-2.5x15-S strip is obtained (approximately 5 MPa). In
contrast, the values of the maximum bond stress for the C-2.5x15-S strips and the C-8-S
bars, are similar (approximately 5–5.5 MPa), despite the lower value of pfrp/Afrp (0.5 vs.
0.93) for the bars. However, in this case, the influence of the shape of the NSM

17
reinforcement (round bar or strip) on the bond behaviour is confirmed because of the
different confinement effects of the surrounding concrete that are not taken into account
in the simple geometric factor pfrp/Afrp.
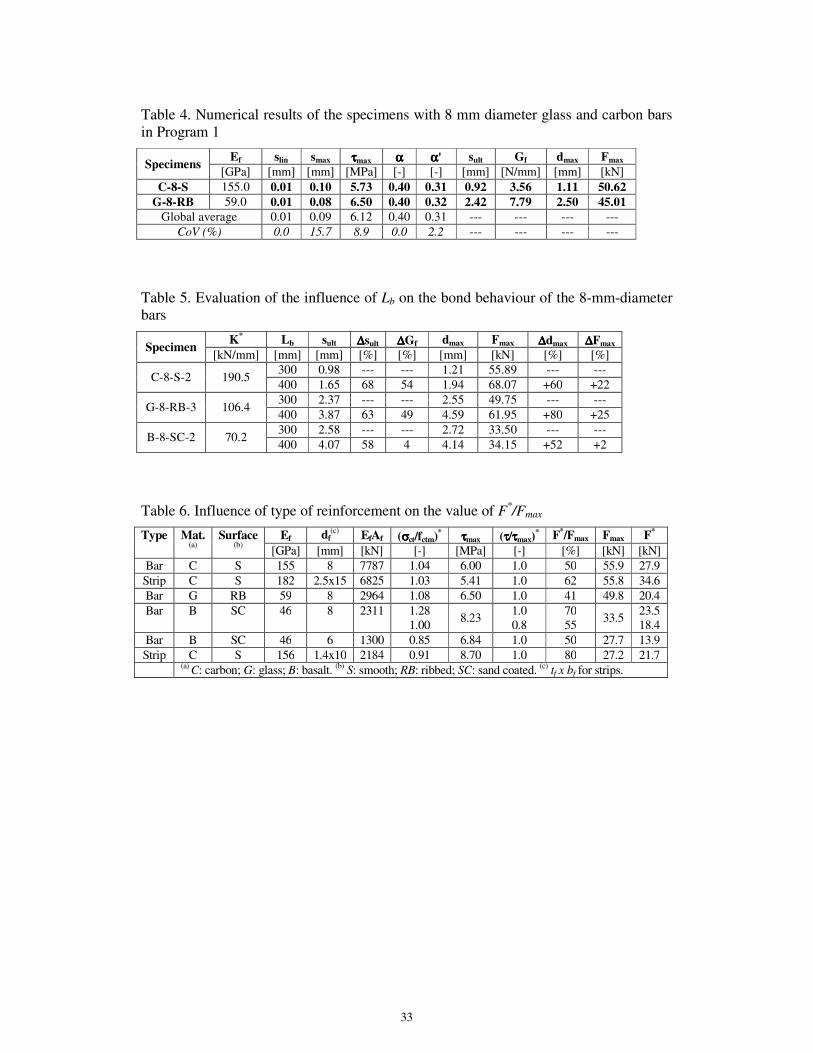
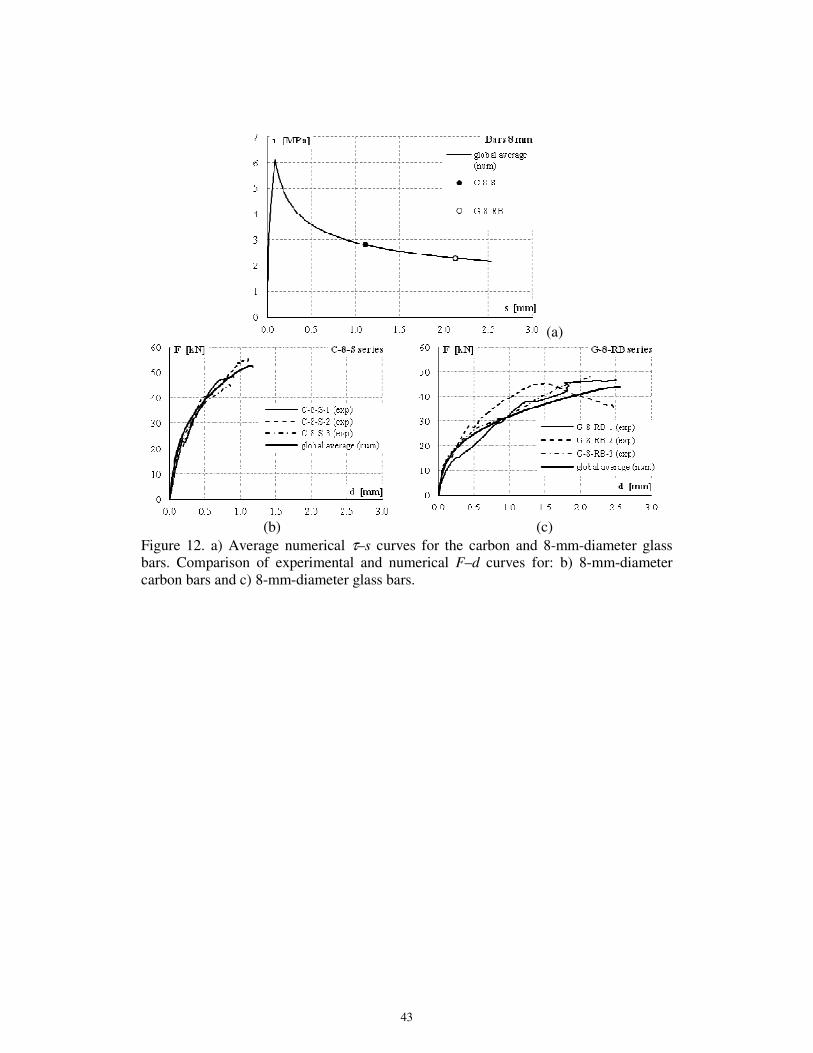
Finally, because the values of the bond parameters of carbon and glass bars tested in
Program 1 are relatively similar, the average value for each parameter was determined
too. The simulation conducted with these average values for the bond parameters was
designated “global average” (Table 4) and is represented in Figure 12a, in which the
maximum slip reached by the two types of bars is also indicated. In Figures 12b–c, the
numerical F–d curve obtained using the average bond law is compared with the
experimental ones of both carbon and glass bars. For carbon bars, the global average
curve reproduces with good accuracy the experimental results (Figure 12b), while for
glass bars, due to the larger scatter of the experimental results, the fit is less accurate.
4.3 The strain distribution
The distribution of tensile strain in FRP reinforcement externally bonded to concrete
elements depends on the Young's modulus of the FRP reinforcement, Ef: The effective
transfer length, Le, indeed, is directly proportional to Ef (Chen and Teng [26]; fib
bulletin 14 [3]). This means that as lower is the value of Ef, the more strains are
concentrated close to the loaded end, leading to a smaller Le. Consequently, smaller
volumes of concrete are involved in the debonding failure along the interface.
Moreover, since shear bond stresses are related to the gradient of tensile strains along
the FRP reinforcement, lower values of Ef also lead to higher shear stresses in the first
part of the bonded length. This phenomenon, well known for externally bonded FRP
plates and sheets externally, was also observed for the NSM systems tested in Program
1 and characterised by different values of Ef (Bilotta et al. [15]).
18
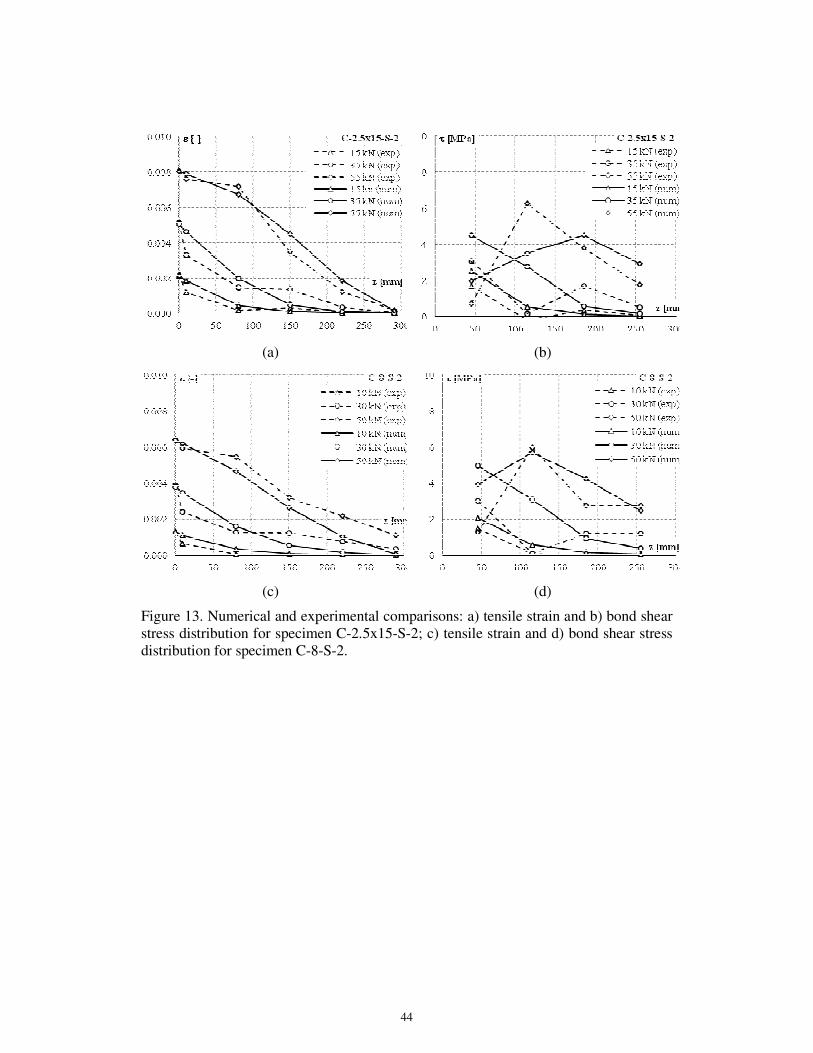
For the carbon strips tested in Program 1 (i.e., specimen C-2.5x15-S-2) the experimental
and theoretical distributions of tensile strains in the strips and bond shear stresses along
the concrete–epoxy interface at several load levels (15, 35 and 55 kN, corresponding to
approximately 30, 65, and 100% of the maximum load, respectively) are represented in
Figures 13a–b, where 'exp' and 'num' indicate curves derived from experimental data
and from numerical simulation, respectively. The curves of strains (Figure 13a) clearly
show that the FE model is able to reproduce the experimental results for each load level
very well. In contrast, for bond stresses, the fit is not as good (Figure 13b). Note that the
experimental shear stresses are calculated from the experimental readings from two
consecutive strain gauges and their accuracy could be improved by employing a greater
number of strain gauges along the reinforcement to reduce the spacing across which the
stresses are assumed to be constant. However, using too many strain gauges could alter
the bond conditions of the reinforcement, preventing a characterization of the bond
conditions representative of NSM-strengthened element (Seracino et al. [14]). The
spacing chosen for the tests of Program 1 (70 mm) is considered a reasonable
compromise to limit the influence of the strain gauges on the bond mechanisms and to
obtain reliable local measures of the bond shear stresses.
Furthermore, Figure 13c and 13d compare the experimental and the numerical
distributions of strains and shear stresses, respectively, for a specimen with the 8 mm
diameter carbon bar. The good agreement obtained for the strain distributions and the
poorer predictive performance for the shear bond stresses is confirmed again and are in
general typical of all the simulations conducted in this study.
19
4.4 Effect of the bonded length
For the specimens where 8 mm diameter bars were installed, an investigation of the
influence of bond length on the global strength of the NSM bar systems was conducted
using the FE model. A bond length of 400 mm was studied in addition to the value of
300 mm used in the experimental tests.
Figure 14 illustrates the numerical F–d curves for the specimens C-8-S-2, G-8-RB-3
and B-8-SC-2 for two values of bond length (Lb= 300 and 400 mm). Note that the
initial stiffness of the curves, clearly, does not change with bond length, while the
maximum load increases notably for the glass and carbon bars and remains constant for
the basalt bars. These results indicate that a bond length of 300 mm is not sufficient to
transfer the maximum load in the case of the glass and carbon bars; thus the theoretical
effective length, corresponding to the full transfer of the maximum pull-out load, is
larger than the one adopted in this experimental program (300 mm). By contrast, for the
basalt bars the effective length can be estimated about 300 mm. This can be justified by
the high axial stiffness of carbon bars and the ribbed surface of the glass bars compared
with the basalt ones. As discussed previously, the basalt fibres have an Ef that is similar
to that of the glass bars, but the bars are only sand-coated and this could lead to develop
a lower effective bond length.
In Figure 15, the bond laws of the 8 mm diameter bars are compared for the bond
lengths of 300 and 400 mm. The values of the parameters identifying the bond laws are
the same as those listed in Table 3, with the exception of the ultimate slip sult that is
defined after the numerical simulation is run because is related to the failure condition.
Thus, about the local behaviour the increase in bond length only determined an increase
in sult.
20
Table 5 quantifies the effects of the larger Lb for each NSM system. The values of sult,
dmax and Fmax are listed for each series. The initial stiffness of the F–d curve, k*
(assuming a linear branch up to F = 15 kN), is also reported and, as mentioned
previously, it remains unchanged when Lb increases. The increase in bond length
significantly increases sult in the local bond law (+58-68%) and dmax (+52-80%) in the
global behaviour for all types of NSM systems, as evidenced in Figures 14 and 15 too.
In contrast, Fmax, increased markedly for the Lb for the carbon and glass bars only
(approximately +23%, on average), while for the basalt bar the change was negligible
(+2%). For the basalt bars, indeed, the bond law for the case of Lb = 300 mm was
already characterised by a large ultimate slip (approximately 2.6 mm) with a negligible
residual shear stress (approximately 0.2 MPa). Thus, the further increase in bond length
determined a significant increase of the ultimate slip (4.1 mm) that does not, however,
appreciably influence the ultimate load because the residual shear stress is almost zero.
4.5 Bond behaviour in the transverse plane
The bond between tensile reinforcement and concrete is essentially a three-dimensional
problem. Indeed, the bond law, identified by the interface τ - s relationship, depends on
the stress distribution in the surrounding concrete (the radial components of the bond
stresses determine tensile stresses in the concrete normal to the reinforcement axis),
which can be analysed as a plane strain problem in the plane transverse to the
reinforcement. The distribution of the shear bond stresses along the reinforcement is
normally determined for a uniaxial condition by solving the differential equation of
bond (Sena Cruz et al. [27]).
Using the FE model described previously, the radial components of the bond stresses in
the surrounding concrete, σct, were obtained for the first bonded finite element closest

21
to the reinforcement (the loaded end at x = 1.86 mm, Figure 16a) during the entire
loading history. Thus, σct was calculated by averaging the stress components in the x
direction of the four integration points of this element. In Figures 16b-c the
distributions of the tangential stress, τ, and the radial stress, σct, versus the loaded end
slip, s, are depicted for the two types of carbon strips (C-2.5x15-S and C-1.4x10-S).
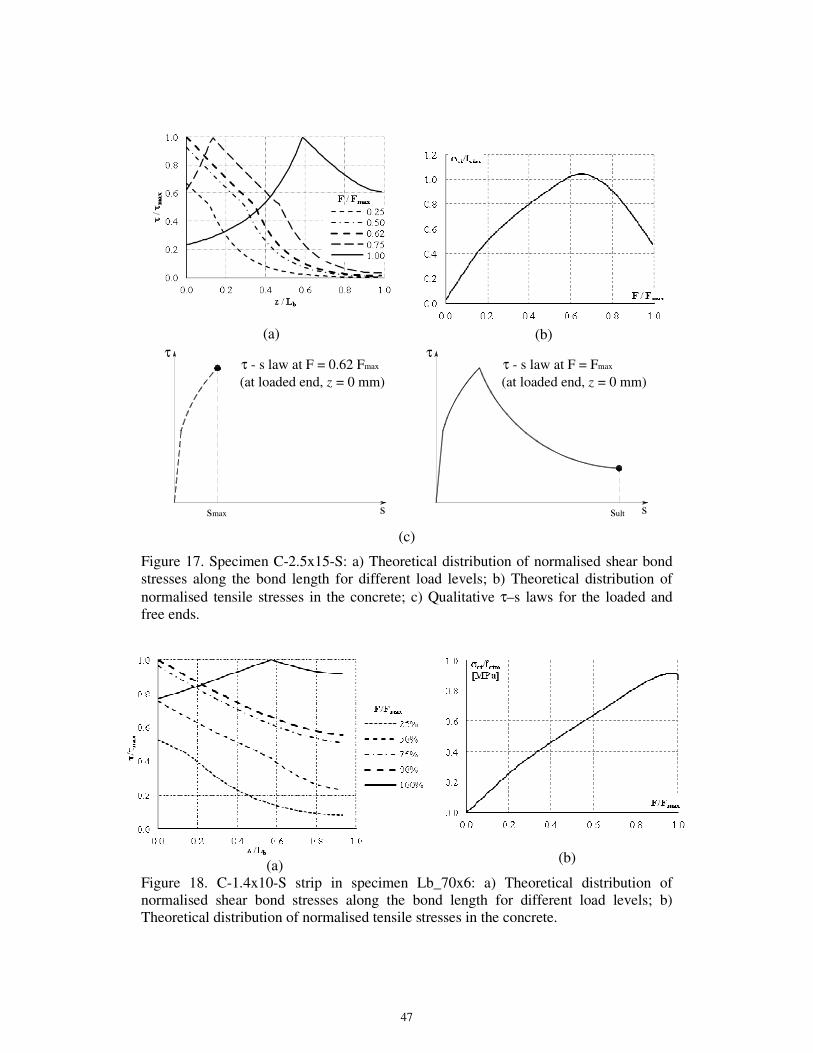
Figure 17a shows the evolution of the τ/τmax ratio along the normalized bond length,
z/Lb, for several load levels, for the C-2.5x15-S strip. The load for which the finite
element closest to the loaded end reaches τmax is 62% of the maximum load (F*=34.60
kN). As the load increases, the τ at the loaded end decreases because the descending
branch of the τ – s law is activated in the first bonded part of the FRP reinforcement.
Thus, the maximum shear stress moves in the direction of the free end. When the
maximum load is attained (F/Fmax = 1.0), the bond law is fully developed, which means
that at the loaded end the ultimate slip of the τ – s law, sult, is reached (see Figure 17c).
In Figure 17b, the trend of σct/fctm versus the normalised force, F/Fmax, is shown for the
same finite element, where fctm is the concrete average compressive strength. Note that
the tensile stress in the concrete reaches a maximum when the load is approximately
60% of Fmax, which is similar to F*. The σct/fctm ratio exceeds lightly unity because the
behaviour of concrete was assumed in the model to be indefinitely linearly elastic.
However, the experimental failure mode for this type of strip (Figure 3a) showed that
cracks in the concrete actually formed parallel to the load direction.
The distributions along z/Lb of τ/τmax and σct/fctm are shown in Figures 18a and 18b,
respectively, for the C-1.4x10-S strip (specimen Lb_70x6) tested in Program 2. For this
type of strip, the maximum tensile stress in the concrete surrounding the groove does
22
not attain the value of fctm. Thus, cracks do not form in the concrete. This result
confirms the observation that the specimens tested by Macedo et al. [20] failed by
splitting of the adhesive (see Figure 3b). Note that in this case, the load at which the
maximum values of τ/τmax and σct/fctm are reached is approximately 80% of the
maximum load (F*=21.73 kN).
Finally, Figure 19a shows the distribution of the radial tensile stress in the concrete, σct,
along the entire bond length at the load level F* previously defined for the C-2.5x15-S
strip (F*= 0.62 Fmax =34.60 kN) in the concrete elements close to the reinforcement. In
Figure 19b, the same distribution is plotted along the bonded length and for the entire
thickness of the concrete block with a colour contour map. At a distance of
approximately 50 mm (that is, 20% of Lb) from the loaded end, σct becomes negative
(i.e., compressive stress) and approaches zero at the free end of the reinforcement.
These compressive stresses are evidence of a confinement effect of the concrete
surrounding the FRP strip. As Costa and Barros [28] proved, this confinement effect
increases with the depth of the strip into the groove, resulting in higher values of Fmax.
Graphs of the same type are shown in Figures 19 c–d for the C-1.4x10-S strip in
specimen Lb-70x6 at Fmax, which is the load level at which σct/fctm is maximum. The
curve shows that σct is positive (tensile stress) up to approximately 40% of Lb, and then
becomes increasingly negative (compressive stress) up to the free end of the bond
length. This trend is different from the one observed in Figures 19a–b for the C-2.5x15-
S strip. This may be due to the different loading conditions of the concrete block: in
Program 2 (Macedo et al. [20]), the block is loaded in compression, while in Program 1
(Bilotta et al. [15]), the block is loaded in tension.

23
The distribution of the radial tensile stress in the concrete surrounding the groove, σct,
was determined for all of the specimens where strips and bars were applied. F* indicates
the load at which both σct/fctm and τ/τmax attain their maximum values. The results are
summarised in Table 6 for all types of NSM systems.
For the two carbon systems tested in Program 1 (bars and strips having comparable
values of axial stiffness), the tensile strength of the concrete is reached in both cases,
but at a lower value of F* for the bars (28 vs. 35 kN).
Moreover, for the 8-mm-diameter bars tested in Program 1 (smooth carbon, ribbed glass
and sand-coated basalt bars), the load F* decreases if the axial stiffness decreases. In
particular, the tensile strength in the concrete is reached (σct/fctm =1) at 27.9 kN for the
carbon bars, 20.4 kN for the glass bars, and 18.4 kN for the basalt bars.
Lower values of F* mean that the tensile strength in the concrete is reached earlier; thus,
there is a higher transfer of shear bond stresses along the interfaces that leads to the
formation of cracks in the concrete surrounding the NSM reinforcement at lower loads.
Therefore, referring to the comparison of carbon strips and bars, the lower value of F*
means that for the bars, the elastic branch of the τ - s law should be stiffer. Indeed, the
assessment of the bond parameters by the inverse analysis yielded to estimate a value
for smax of approximately 0.10 mm for the carbon bars and approximately 0.33 mm for
the strips, while the values of τmax are comparable for the two systems. These values
determine a stiffer elastic branch in the bond law of the bars and, as previously observed
in section 4.2, the differences in the bond laws depend on the different shape factor of
the two systems.
Moreover, referring to the comparison of the 8-mm-diameter bars, the values of F*
show that decreasing the axial stiffness of the NSM system increases the bond transfer,

24
which is in agreement with the trends in the experimental distributions of strains
discussed in section 4.3. Indeed, the gradient of strain distribution near the loaded end
increases when the axial stiffness of the reinforcement decreases. A higher gradient
means a higher bond stress transfer and, consequently, higher tensile stresses transferred
to the surrounding concrete.
Finally, it is interesting to notice that for the 6-mm-diameter basalt bars, the concrete
tensile strength is never reached (σct = 0.85 fctm), while for the 8-mm-diameter basalt
bars the maximum tensile stress in the concrete increases until it exceeds the strength
(1.28·fctm) at a load of 23.5 kN. This is an unrealistic result because concrete in tension
is assumed indefinitely elastic in the model, but it is however significant since leads to
suppose that using bars of smaller diameter prevents concrete cracking because the
shear stresses along smaller lateral surfaces contribute to do not exceeding the tensile
strength of the concrete. However, this conclusion confirms what generally occurs also
in concrete elements reinforced with internal steel re-bars: to reduce the risk of concrete
spalling, it is better to use more bars of smaller diameter than fewer bars of greater
diameter. However, this can be clearly disadvantageous in terms of costs.
5. Conclusions
The FE modelling approach applied in this study to analysis of NSM strengthening
systems appears to be well suited to derivation of the values of the significant
parameters that define the bond law by inverse analysis. The results of this calibration
demonstrate the appropriateness of the selected shape of the s−τ relationship in terms
of simulating the global behaviour of the strengthened element.
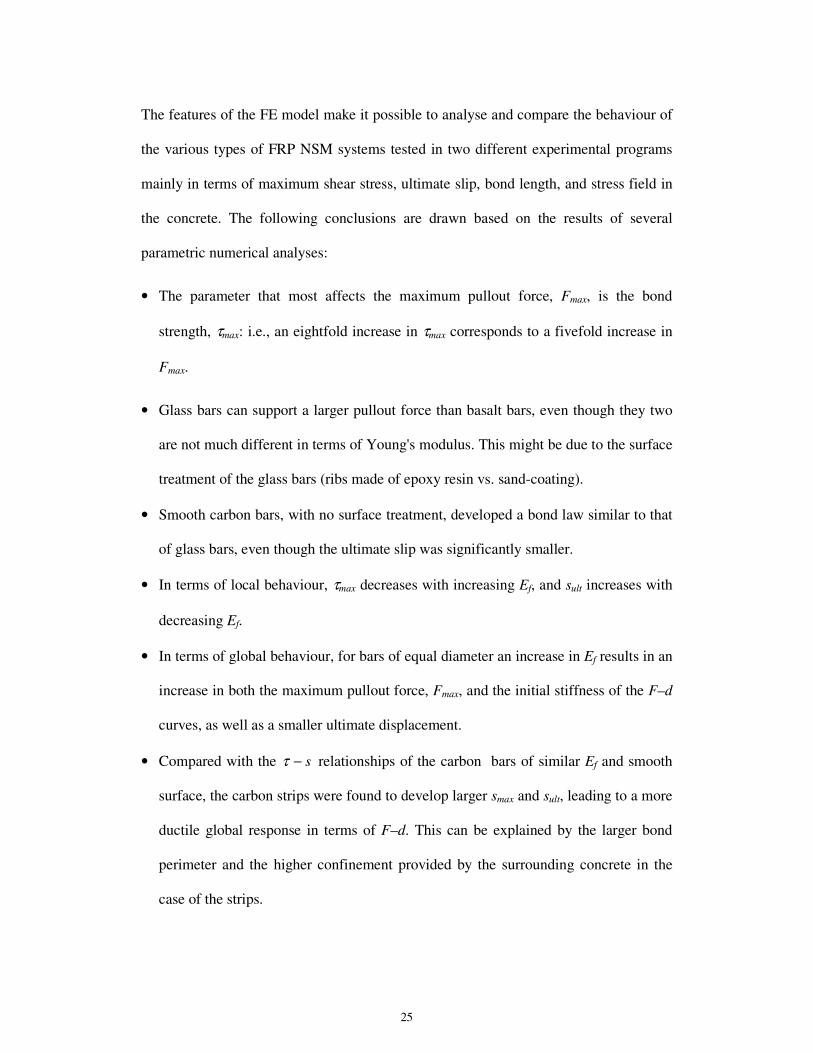
25
The features of the FE model make it possible to analyse and compare the behaviour of
the various types of FRP NSM systems tested in two different experimental programs
mainly in terms of maximum shear stress, ultimate slip, bond length, and stress field in
the concrete. The following conclusions are drawn based on the results of several
parametric numerical analyses:
• The parameter that most affects the maximum pullout force, Fmax, is the bond
strength, τmax: i.e., an eightfold increase in τmax corresponds to a fivefold increase in
Fmax.
• Glass bars can support a larger pullout force than basalt bars, even though they two
are not much different in terms of Young's modulus. This might be due to the surface
treatment of the glass bars (ribs made of epoxy resin vs. sand-coating).
• Smooth carbon bars, with no surface treatment, developed a bond law similar to that
of glass bars, even though the ultimate slip was significantly smaller.
• In terms of local behaviour, τmax decreases with increasing Ef, and sult increases with
decreasing Ef.
• In terms of global behaviour, for bars of equal diameter an increase in Ef results in an
increase in both the maximum pullout force, Fmax, and the initial stiffness of the F–d
curves, as well as a smaller ultimate displacement.
• Compared with the s−τ relationships of the carbon bars of similar Ef and smooth
surface, the carbon strips were found to develop larger smax and sult, leading to a more
ductile global response in terms of F–d. This can be explained by the larger bond
perimeter and the higher confinement provided by the surrounding concrete in the
case of the strips.

26
• Because the values of the bond parameters of carbon and glass bars are not very
different, an average bond law has been identified that is capable of predicting fairly
well the global pullout behaviour for either type of reinforcement.
• The agreement of the theoretical and experimental results was satisfactory for the
strain distributions and less satisfactory for the shear bond stresses, primarily because
of the uncertainties associated with the experimental measurement of the latter.
• An increase in bond length from 300 to 400 mm increases sult in local behaviour and,
thus, dmax in global behaviour. This results in a +23% increase in Fmax for the carbon
and glass bars. For the basalt bar, however, the load increase is negligible because
the ultimate slip corresponding to Lb = 300 mm was already characterised by a very
low residual shear stress. This allowed to estimate the effective bond length as about
300 mm for the basalt bars and larger than 300 mm for the carbon and glass bars.
• The distribution of the tensile stresses in the concrete surrounding the NSM
reinforcement confirmed the experimental failure mode of the strip tested in Program
2 (splitting of the adhesive) and of strips and bars tested in Program 1 (cracks in the
concrete parallel to the load direction).
• The tensile stresses in the concrete along the bond length approached zero at the free
end of the reinforcement in the specimens tested in Program 1 (with the concrete
block loaded in tension), and became compressive stresses for the specimens tested
in Program 2 (with the concrete block loaded in compression).
• The load at crack initiation (i.e., the value corresponding to the condition σct=fctm)
decreases if the axial stiffness decreases and when carbon bars are used instead of
strips having similar axial stiffness. This decrease is indicative of a higher transfer of
shear bond stresses along the interfaces, which leads to cracking in the concrete
27
surrounding the NSM reinforcement at lower loads. In terms of local bond law, this
means a stiffer elastic branch and/or higher bond strength.
• For bars made of the same material and having the same surface treatment, using a
greater number of bars of smaller diameter confirms a low risk of concrete spalling,
as well known for concrete elements reinforced with internal steel bars.
Acknowledgements
The experimental activities of Program 1 described in this paper were developed within
the research work of the “European Network for Composite Reinforcement - TR 9.3”.
The research conducted is part of the FCT PreLami project PTDC/ECM/114945/2009.
28
References
[1] Canadian Standards Association International (CSA). Canadian Highway Bridge
design code, CSA-S6-00, Toronto.
[2] JSCE. Recommendation for the Upgrading of Concrete Structures with use of
Continuous Fiber Sheets. In: Concrete Engineering Series No. 41, Japanese Society of
Civil Engineers, Tokyo, 250 pp. (available in English).
[3] CEB-FIB. Externally bonded FRP reinforcement for RC structures, International
Federation for Structural Concrete - Technical report, July 2001, 130 pp.
[4] CNR (National Research Council). Guide for the Design and Construction of
Externally Bonded FRP Systems for Strengthening Existing Structures, Advisory
Committee on Technical Recommendation for Construction of National Research
council, Rome, Italy, pp. 154.
[5] ACI-440. Guide for design and construction of externally bonded FRP systems for
strengthening concrete structures, ACI Technical Report, May 2002, 118 pp.
[6] Smith, S.T., Teng, J.G. FRP-strengthened RC beams-I: review of debonding strength
models. In: Engineering Structures, 24 (4), pp. 385–95, 2002.
[7] Ceroni, F., Pecce, M. Statistical analysis of debonding load in concrete elements
externally strengthened with CFRP materials. In: Advances in Structural Engineering,
15 (1), pp. 155-168, 2012.
[8] Dias, S.J.E.; Barros, J.A.O. Performance of reinforced concrete T beams
strengthened in shear with NSM CFRP laminates. In: Engineering Structures Journal,
32 (2), pp. 373-384, 2010.
[9] De Lorenzis, L., Nanni, A. Shear strengthening of reinforced concrete beams with
near-surface mounted fiber reinforced polymer rods. In: ACI Structural Journal, 98 (1),
pp. 60-68, 2001.
[10] Blaschko, M., Zilch, K. Rehabilitation of concrete structures with CFRP strips
glued into slits. In: Proceeding of the 12th International Conference on Composite
Materials, Paris, France, 1999.
[11] De Lorenzis, L., Teng, J.C. Near-surface mounted FRP reinforcement: An emerging
technique for strengthening structures. In: Composites Part B: Engineering, 38, pp. 119-
43, 2007.
[12] Sena Cruz, J.M., Barros, J.A.O. Bond Between Near-Surface Mounted Carbon-
Fiber-Reinforced Polymers Laminate Strips and Concrete. In: ASCE Journal of
Composite for Construction, 8 (6), pp. 519-527, 2004.
[13] Hassan, T., Rizkalla, S., (2003). “Investigation of bond in concrete structures
strengthened with near surface mounted carbon fiber reinforced polymer strips”, ASCE
Journal of Composites for Construction, 7 (3), pp. 248-257.
[14] Seracino, R., Jones, N.M., Page, M.W., Ali, M.S.S., Oehlers, D.J. Bond strength of
near-surface mounted FRP-to-concrete joints. In: ASCE Journal of Composites for
Construction, 11 (4), pp. 401-409, 2007.
[15] Bilotta, A., Ceroni, F., Di Ludovico, M., Nigro, E., Pecce, M., Manfredi, G. Bond
efficiency of EBR and NSM FRP systems for strengthening of concrete members. In:
29
ASCE Journal of Composites for Construction, doi: 10.1061/(ASCE)CC.1943-
5614.0000204, 2011.
[16] Novidis, D.G., Pantazopoulou, S.J. Bond test of short NSM-FRP and steel bar
anchorage. In: ASCE Journal of Composites for Construction, 12 (3), pp. 323-333,
2008.
[17] Borchert, K., Zilch H. Bond behaviour of NSM FRP strips in service, Structural
Concrete. In: Thomas Telford and fib journal, pp. 1464–4177, 2008.
[18] En-Core & fib TG 9.3. Internal reports: Round Robin Testing Exercise -
Universities of Gent, Minho and Budapest available on
http://cigroup.shef.ac.uk/encore/rrt/index.php, 2011.
[19] Sena-Cruz, J.M., Barros, J.A.O., Azevedo, A.F.M., Ventura-Gouveia, A. Numerical
simulation of the nonlinear behavior of RC beams strengthened with NSM CFRP strips.
In: Proc. of CMNE 2007 - Congress on Numerical Methods in Engineering and XXVIII
CILAMCE - Iberian Latin American Congress on Computational Methods in
Engineering, paper nº 485 published in CD – FEUP, 20 pp., Porto, 13-15 June 2007.
[20] Macedo, L., Costa, I.G., Barros, J.A.O. Evaluation of influence of adhesive and
geometry of laminated carbon fiber on the behavior of startup tests. In: Proc. of
Structural Concrete 2008, Guimarães, Portugal, 2008 [in Portuguese].
[21] Eurocode 2. Design of Concrete structures – Part 1-1: General Rules and Rules for
Buildings, ENV 1992-1-1: 2004: E.
[22] Ceroni, F., Bilotta, A., Nigro, E, Pecce, M. Bond behaviour of FRP NSM systems
in concrete elements, Composites: Part B, 43, pp. 99–109, 2012.
[23] Ianniciello, M. Modeling of bond behavior in RC elements externally bonded with
NSM FRP systems. Master Thesis in Structural Engineering, University of Sannio,
Benevento, Italy, 197 pp., 2011
[24] Eligehausen R., Popov E.P., Bertero V.V. Local Bond Stress-Slip Relationships of
Deformed Bars Under Generalized Excitations. In: Report n° 83/23, EERC, University
of California, Berkeley, 1983.
[25] Barros, J.A.O.; Kotynia, R. Possibilities and challenges of NSM for the flexural
strengthening of RC structures. In: Proc. of Fourth International Conference on FRP
Composites in Civil Engineering (CICE2008), Zurich, Switzerland, 22-24July 2008.
[26] Chen, J.F., Teng, J.G. Anchorage strength models for FRP and Steel Plates bonded
to concrete. In: Journal of Structural Engineering, 127 (7), pp. 784-791, 2001.
[27] Sena-Cruz, J.M., Barros, J.A.O., Gettu, R., Azevedo, A.F.M. Bond Behavior of Near-
Surface Mounted CFRP Laminate Strips under Monotonic and Cyclic Loading. In: ASCE
Journal of Composites for Construction, 10 (4), pp. 295-303, 2006.
[28] Costa, I.G., Barros, J.A.O. Assessment of the bond behavior of NSM FRP materials
by pullout tests. In: Proc. of First Middle East Conference on Smart Monitoring,
Assessment and Rehabilitation of Civil Structures, Dubai, 8-10 February 2011.
30
List of Table
Table 1. Main experimental data and results for Program 1
Table 2. Main experimental data and results for Program 2
Table 3. Values of the bond law parameters assessed by inverse analysis
Table 4. Numerical results of the specimens strengthened with 8 mm diameter glass and
carbon bars in Program 1
Table 5. Evaluation of the influence of Lb on the bond behaviour of the 8-mm-diameter
bars
Table 6. Influence of type of reinforcement on the value of F*/Fmax
List of Figures
Figure 1. Test configuration for experimental Program 1 (Bilotta et al., 2011)
(dimensions in mm).
Figure 2. Test configuration of experimental Program 2 (Macedo et al., 2008).
Figure 3. a) Debonding at the epoxy–concrete interface for specimens of Program 1; b)
Splitting of epoxy adhesive for specimens of Program 2.
Figure 4. Finite element idealisation of specimens tested in Program 1: (a) complete
mesh; (b) detailed diagram of the top side (dimensions in mm).
Figure 5. Finite element idealisation of specimens tested in Program 2: (a) complete
mesh; (b) detailed diagram of the top side (dimensions in mm).
Figure 6. (a) Local bond stress–slip relationship; (b) qualitative correlation between τ-s and F-d relationships in a bond test.
Figure 7. Effect of smax, τmax and α’ on the maximum pullout force, Fmax.
Figure 8. Definition of the perimeter u when different failure modes occur.
Figure 9. Experimental vs. numerical pullout force–displacement curves for different
NSM systems: (a) 2.5 mm×15 mm carbon strips (Program 1); (b) 8 mm diameter carbon
bars; (c) 1.4 mm×10 mm carbon strips (Program 2); (d) 1.4 mm×10 mm carbon strips
(Program 2); (e) 8 mm diameter ribbed glass bars (Program 1); (f) 8 mm diameter sand
coated basalt bars (Program 1).
Figure 10. Numerical–experimental comparison of the local bond law for different FRP
NSM systems: (a) 2.5 mm×15 mm carbon strips; (b) 6 mm diameter basalt bars.
Figure 11. Numerical curves for different types of NSM reinforcements: a) τ - s
relationships for 8 mm diameter bars, b) τ - s relationships for carbon strips; c) F–d curves for 8 mm diameter bars; d) F–d curves for carbon strips.
Figure 12. a) Average numerical τ–s curves for the carbon and 8-mm-diameter glass
bars. Comparison of experimental and numerical F–d curves for: b) 8-mm-diameter
carbon bars and c) 8-mm-diameter glass bars.
Figure 13. Numerical and experimental comparisons: a) tensile strain and b) bond shear
stress distribution for specimen C-2.5x15-S-2; c) tensile strain and d) bond shear stress
distribution for specimen C-8-S-2.
31
Figure 14. Comparison between the numerical F–d curves for smooth carbon, ribbed
glass and sand-coated basalt bars for bond lengths of 300 and 400 mm.
Figure 15. Comparison between the numerical τ–s curves for smooth carbon, ribbed glass and sand-coated basalt bars for bond lengths of 300 and 400 mm.
Figure 16. a) Scheme for the calculation of tensile stress in the concrete in the
transverse plane; Distribution of bond shear stresses and tensile stress in the concrete at
the loaded end: b) C-2.5x15-S carbon strip tested in Program 1; c) C-1.4x10-S carbon
strip tested in Program 2.
Figure 17. Specimen C-2.5x15-S: a) Theoretical distribution of normalised shear bond
stresses along the bond length for different load levels; b) Theoretical distribution of
normalised tensile stresses in the concrete; c) Qualitative τ–s laws for the loaded and
free ends.
Figure 18. C-1.4x10-S strip in specimen Lb_70x6: a) Theoretical distribution of
normalised shear bond stresses along the bond length for different load levels; b)
Theoretical distribution of normalised tensile stresses in the concrete.
Figure 19. Distribution of σct along the bond length at F = 0.62 Fmax: a) specimen C-2.5x15-S-2; b) C-1.4x10-S strip in specimen Lb_70x6.
32
Table 1. Main experimental data and results for Program 1
Specimen ffu Ef Ef Af k Failure
mode(a)
Fmax dmax
[MPa] [GPa] [kN] [-] [kN] [mm]
B-6-SC-1 1282 46 1300 1.67
E/C 33.87 2.93
B-6-SC-2 E/C 28.84 2.37
B-8-SC-1
1272 46 2311 1.75
E/C 31.57 1.08
B-8-SC-2 E/C 33.10 0.86
B-8-SC-3 E/C 30.24 1.45
G-8-RB-1
1333 59 2964 1.75
E/C 46.71 2.50
G-8-RB-2 E/C 45.25 1.51
G-8-RB-3 E/C 50.86 2.15
C-8-S-1
2495 155 7787 1.75
E/C+CL 48.52 0.88
C-8-S-2 E/C+CL 55.30 1.10
C-8-S-3 E/C+CL 45.23 0.84
C-2.5x15-S-1
2863 182 6825 1.67
E/C 52.97 1.32
C-2.5x15-S-2 E/C 56.03 1.28
C-2.5x15-S-3 E/C 46.26 1.24 (a) E/C: debonding at the epoxy-concrete interface, CL: detachment of a concrete layer
Table 2. Main experimental data and results for Program 2
Specimen ffu Ef Ef Af k Failure
mode(a)
Fmax dmax
[MPa] [GPa] [kN] [-] [kN] [mm]
Lb40_x6 2879 156 2184 2.20
S 18.59 0.60
Lb40_x12 S 19.90 0.41
Lb70_x6 2879 156 2184 2.20
S 27.69 0.68
Lb70_x12 S 31.43 0.64
Lb90_x6 2879 156 2184 2.20
S 33.90 0.92
Lb90_x12 S 35.63 0.82
Lb120_x6 2879 156 2184 2.20
S 34.46 0.72
Lb120_x12 S 37.92 0.79
Lb150_x6 2879 156 2184 2.20
S 36.43 1.03
Lb150_x12 S 38.35 0.85 (a)
S: Splitting of adhesive
Table 3. Values of the bond law parameters assessed by inverse analysis
Experimental
program Specimen
Ef slin smax τmax α α' sult Fmax,num Fmax,exp
[GPa] [mm] [mm] [MPa] [-] [-] [mm] [kN] [kN]
Program 1 B-6-SC 46 0.05 0.41 7.09 0.40 0.65 2.30 29.21 29.17
B-8-SC 46 0.05 0.43 7.63 0.40 1.93 2.51 31.67 31.59
G-8-RB 59 0.01 0.08 6.50 0.40 0.32 2.42 45.01 47.06
C-8-S 155 0.01 0.10 5.73 0.40 0.31 0.92 50.62 49.61
C-2.5x15-S 159 0.05 0.33 5.26 0.35 1.13 1.32 52.05 51.75
Program 2 Lb70_x6 156 0.05 0.40 17.35* 0.40 0.40 0.84 27.27 27.69
Lb90_x6 156 0.05 0.40 16.52* 0.40 0.40 1.11 33.50 33.90
* shear stresses referred to the strip-epoxy interface
33
Table 4. Numerical results of the specimens with 8 mm diameter glass and carbon bars
in Program 1
Specimens Ef slin smax ττττmax αααα αααα' sult Gf dmax Fmax
[GPa] [mm] [mm] [MPa] [-] [-] [mm] [N/mm] [mm] [kN]
C-8-S 155.0 0.01 0.10 5.73 0.40 0.31 0.92 3.56 1.11 50.62
G-8-RB 59.0 0.01 0.08 6.50 0.40 0.32 2.42 7.79 2.50 45.01
Global average 0.01 0.09 6.12 0.40 0.31 --- --- --- ---
CoV (%) 0.0 15.7 8.9 0.0 2.2 --- --- --- ---
Table 5. Evaluation of the influence of Lb on the bond behaviour of the 8-mm-diameter
bars
Specimen K* Lb sult ∆∆∆∆sult ∆∆∆∆Gf dmax Fmax ∆∆∆∆dmax ∆∆∆∆Fmax
[kN/mm] [mm] [mm] [%] [%] [mm] [kN] [%] [%]
C-8-S-2 190.5 300 0.98 --- --- 1.21 55.89 --- ---
400 1.65 68 54 1.94 68.07 +60 +22
G-8-RB-3 106.4 300 2.37 --- --- 2.55 49.75 --- ---
400 3.87 63 49 4.59 61.95 +80 +25
B-8-SC-2 70.2 300 2.58 --- --- 2.72 33.50 --- ---
400 4.07 58 4 4.14 34.15 +52 +2
Table 6. Influence of type of reinforcement on the value of F*/Fmax
Type Mat. (a)
Surface
(b)
Ef df(c) EfAf (σσσσct/fctm)
* ττττmax (ττττ/ττττmax)
* F*/Fmax Fmax F*
[GPa] [mm] [kN] [-] [MPa] [-] [%] [kN] [kN]
Bar C S 155 8 7787 1.04 6.00 1.0 50 55.9 27.9
Strip C S 182 2.5x15 6825 1.03 5.41 1.0 62 55.8 34.6
Bar G RB 59 8 2964 1.08 6.50 1.0 41 49.8 20.4
Bar B SC 46 8 2311 1.28
1.00 8.23
1.0
0.8
70
55 33.5
23.5
18.4
Bar B SC 46 6 1300 0.85 6.84 1.0 50 27.7 13.9
Strip C S 156 1.4x10 2184 0.91 8.70 1.0 80 27.2 21.7 (a)
C: carbon; G: glass; B: basalt. (b) S: smooth; RB: ribbed; SC: sand coated. (c) tf x bf for strips.
34
bolts
concrete
steel plate
NSM FRP
steel bars
metallic pipes
200
40
0
3
00
(bo
nd
len
gth
)5
05
0
(a) (b)
Figure 1. Test configuration for experimental Program 1 (Bilotta et al. [15])
(dimensions in mm).
section 0
section 3
adhesive
concrete
22
10
section 1
section 2
LVDT 1 LVDT 2 CFRP
L0 Lb
75
75 75
600
F
xi
5
15
0
150450
Figure 2. Test configuration of experimental Program 2 (Macedo et al. [20]).
35
(a)
(b)
Figure 3. a) Debonding at the epoxy–concrete interface for specimens of Program 1; b)
Splitting of epoxy adhesive for specimens of Program 2.
Pullout
direction Laminate
Adhesive
36
CFRP strip
dir. 3
dir. 2
F4
Loaded points F = (F/4 + F/4) 2
z = 10 mm
z = 45 mm
Displacement
average
z = 10 mm
Bond stress
z = 45 mm
average
Interface element
Integration points
Concrete
z
Lb =
300
80
400
Supports
F4
(a) (b)
Figure 4. Finite element idealisation of specimens tested in Program 1: (a) complete
mesh; (b) detailed diagram of the top side (dimensions in mm).

37
Loaded points
Concrete
Integration points
CFRP strip
dir. 2
dir. 3
F44
F
F = (F/4 + F/4) 2
z = 0 mm
Bond stress
Displacements
average
z = 0 mm
Interface element
z
z = 0 mm
Supports
Lb =
70
75
60
0
(a) (b)
Figure 5. Finite element idealisation of specimens tested in Program 2: (a) complete
mesh; (b) detailed diagram of the top side (dimensions in mm).
38
mlin
Lin
ea
r b
ran
ch
slin smax s
τ
τ max
sult
(a)
0
10
20
30
40
50
60
0.0 0.5 1.0 1.5 2.0
d [mm]
F [kN]
LINEAR branch of τ - s
DESCENDING branch of τ - s
ASCENDING branch of τ - s
(b)
Figure 6. (a) Local bond stress–slip relationship; (b) qualitative correlation between τ-s and F-d relationships in a bond test.
0
1
2
3
4
5
0 1 2 3 4 5 6 7 8 9 10
ξ ξ ξ ξ
Fmax
/ F0max
smax
α'
τmax
Figure 7. Effect of smax, τmax and α’ on the maximum pullout force, Fmax.
39
u
Epoxy-concrete interface (E/C) Splitting of adhesive (S)
u
(a) (b)
Figure 8. Definition of the perimeter u when different failure modes occur.
40
C-2.5x15-S series
0
10
20
30
40
50
60
0.0 0.5 1.0 1.5 2.0 2.5 3.0 3.5
d [mm]
F [kN]
C-2.5x15-S-1 (exp)
C-2.5x15-S-2 (exp)
C-2.5x15-S-3 (exp)
Average (num)
(a)
C-8-S series
0
10
20
30
40
50
60
0.0 0.5 1.0 1.5 2.0 2.5 3.0 3.5
d [mm]
F [kN]
C-8-S-1 (exp)
C-8-S-2 (exp)
C-8-S-3 (exp)
Average (num)
(b)
Lb70_x6
0
10
20
30
40
0.0 0.4 0.8 1.2 1.6 2.0
d [mm]
F [kN]
Experimental
Numerical
(c)
Lb90_x6
0
10
20
30
40
0.0 0.4 0.8 1.2 1.6 2.0
d [mm]
F [kN]
Experimental
Numerical
(d)
G-8-RB series
0
10
20
30
40
50
60
0.0 0.5 1.0 1.5 2.0 2.5 3.0 3.5
d [mm]
F [kN]
G-8-RB-1 (exp)
G-8-RB-2 (exp)
G-8-RB-3 (exp)
Average (num)
(e)
B-8-SC series
0
10
20
30
40
50
60
0.0 0.5 1.0 1.5 2.0 2.5 3.0 3.5
d [mm]
F [kN]B-8-SC-1 (exp)
B-8-SC-2 (exp)
B-8-SC-3 (exp)
Average (num)
(f)
Figure 9. Experimental vs. numerical pullout force–displacement curves for different
NSM systems: (a) 2.5 mm×15 mm carbon strips (Program 1); (b) 8 mm diameter carbon
bars; (c) 1.4 mm×10 mm carbon strips (Program 2); (d) 1.4 mm×10 mm carbon strips
(Program 2); (e) 8 mm diameter ribbed glass bars (Program 1); (f) 8 mm diameter sand
coated basalt bars (Program 1).
41
C-2.5x15-S-2
0
1
2
3
4
5
6
7
8
9
0.0 0.4 0.8 1.2 1.6 2.0
s [mm]
ττττ [MPa]
Experimental
Numerical
(a)
B-6-SC-1
0
1
2
3
4
5
6
7
8
9
0.0 0.4 0.8 1.2 1.6 2.0
s [mm]
ττττ [MPa]
Experimental
Numerical
(b)
Figure 10. Numerical–experimental comparison of the local bond law for different FRP
NSM systems: (a) 2.5 mm×15 mm carbon strips; (b) 6 mm diameter basalt bars.
42
(a)
(b)
(c)
(d)
Figure 11. Numerical curves for different types of NSM reinforcements: a) τ - s
relationships for 8 mm diameter bars, b) τ - s relationships for carbon strips; c) F–d
curves for 8 mm diameter bars; d) F–d curves for carbon strips.
43
(a)
(b)
(c)
Figure 12. a) Average numerical τ–s curves for the carbon and 8-mm-diameter glass bars. Comparison of experimental and numerical F–d curves for: b) 8-mm-diameter
carbon bars and c) 8-mm-diameter glass bars.
44
(a) (b)
(c) (d)
Figure 13. Numerical and experimental comparisons: a) tensile strain and b) bond shear
stress distribution for specimen C-2.5x15-S-2; c) tensile strain and d) bond shear stress
distribution for specimen C-8-S-2.

45
Figure 14. Comparison between the numerical F–d curves for smooth carbon, ribbed
glass and sand-coated basalt bars for bond lengths of 300 and 400 mm.
Figure 15. Comparison between the numerical τ–s curves for smooth carbon, ribbed glass and sand-coated basalt bars for bond lengths of 300 and 400 mm.

46
Lb FR
P
integration
points
concrete
1.86
x
z
(a)
(b)
(c)
Figure 16. a) Scheme for the calculation of tensile stress in the concrete in the
transverse plane; Distribution of bond shear stresses and tensile stress in the concrete at
the loaded end: b) C-2.5x15-S carbon strip tested in Program 1; c) C-1.4x10-S carbon
strip tested in Program 2.
47
(a)
(b)
(at loaded end, z = 0 mm)(at loaded end, z = 0 mm)
τ - s law at F = Fmax
sult
τ
ssmax
τ - s law at F = 0.62 Fmax
s
τ
(c)
Figure 17. Specimen C-2.5x15-S: a) Theoretical distribution of normalised shear bond
stresses along the bond length for different load levels; b) Theoretical distribution of
normalised tensile stresses in the concrete; c) Qualitative τ–s laws for the loaded and
free ends.
(a)
(b)
Figure 18. C-1.4x10-S strip in specimen Lb_70x6: a) Theoretical distribution of
normalised shear bond stresses along the bond length for different load levels; b)
Theoretical distribution of normalised tensile stresses in the concrete.

48
(a)
(b)
(c)
(d)
Figure 19. Distribution of σct along the bond length at F = 0.62 Fmax: a) specimen C-
2.5x15-S-2; b) C-1.4x10-S strip in specimen Lb_70x6.