assignment classification table (by topic) · e8-17 fifo and lifo—periodic and perpetual....
TRANSCRIPT
Copyright © 2011 John Wiley & Sons, Inc. Kieso, IFRS, 1/e, Solutions Manual (For Instructor Use Only) 8-1
CHAPTER 8
Valuation of Inventories: A Cost-Basis Approach
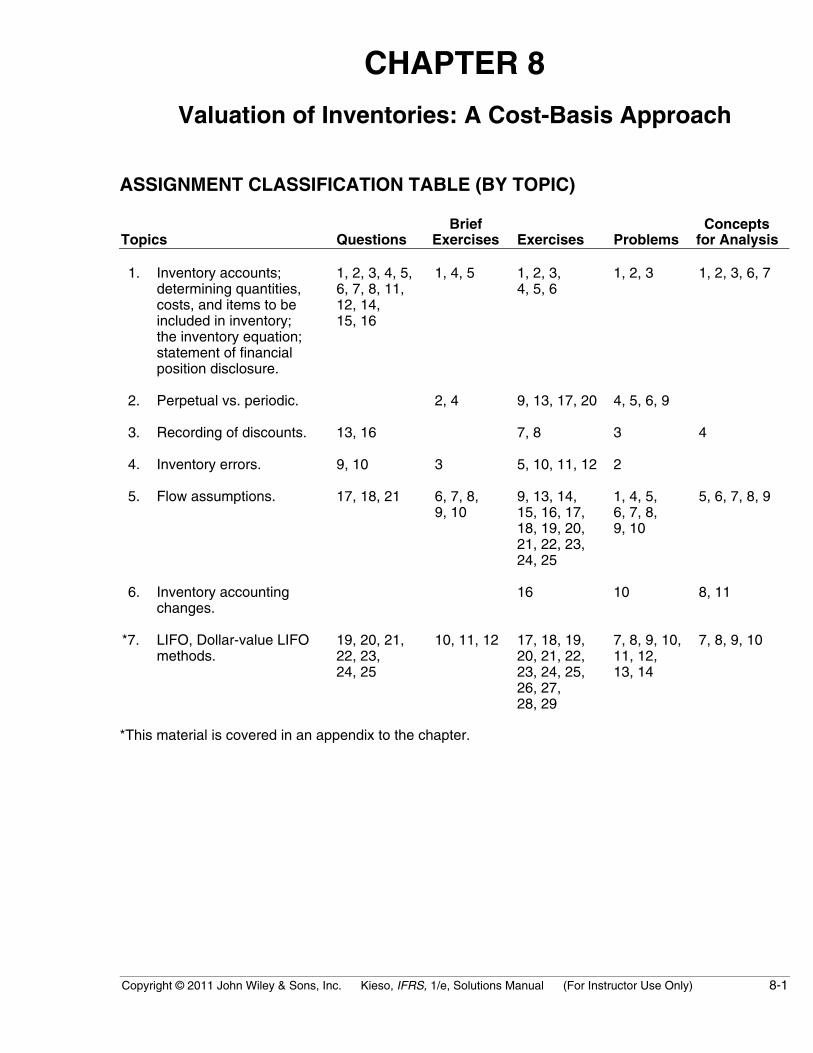
ASSIGNMENT CLASSIFICATION TABLE (BY TOPIC)
Topics QuestionsBrief
Exercises Exercises Problems Conceptsfor Analysis
1. Inventory accounts;determining quantities,costs, and items to beincluded in inventory;the inventory equation;statement of financialposition disclosure.
1, 2, 3, 4, 5,6, 7, 8, 11,12, 14,15, 16
1, 4, 5 1, 2, 3,4, 5, 6
1, 2, 3 1, 2, 3, 6, 7
2. Perpetual vs. periodic. 2, 4 9, 13, 17, 20 4, 5, 6, 9
3. Recording of discounts. 13, 16 7, 8 3 4
4. Inventory errors. 9, 10 3 5, 10, 11, 12 2
5. Flow assumptions. 17, 18, 21 6, 7, 8,9, 10
9, 13, 14,15, 16, 17,18, 19, 20,21, 22, 23,24, 25
1, 4, 5,6, 7, 8,9, 10
5, 6, 7, 8, 9
6. Inventory accountingchanges.
16 10 8, 11
*7. LIFO, Dollar-value LIFOmethods.
19, 20, 21,22, 23,24, 25
10, 11, 12 17, 18, 19,20, 21, 22,23, 24, 25,26, 27,28, 29
7, 8, 9, 10,11, 12,13, 14
7, 8, 9, 10
*This material is covered in an appendix to the chapter.
8-2 Copyright © 2011 John Wiley & Sons, Inc. Kieso, IFRS, 1/e, Solutions Manual (For Instructor Use Only)
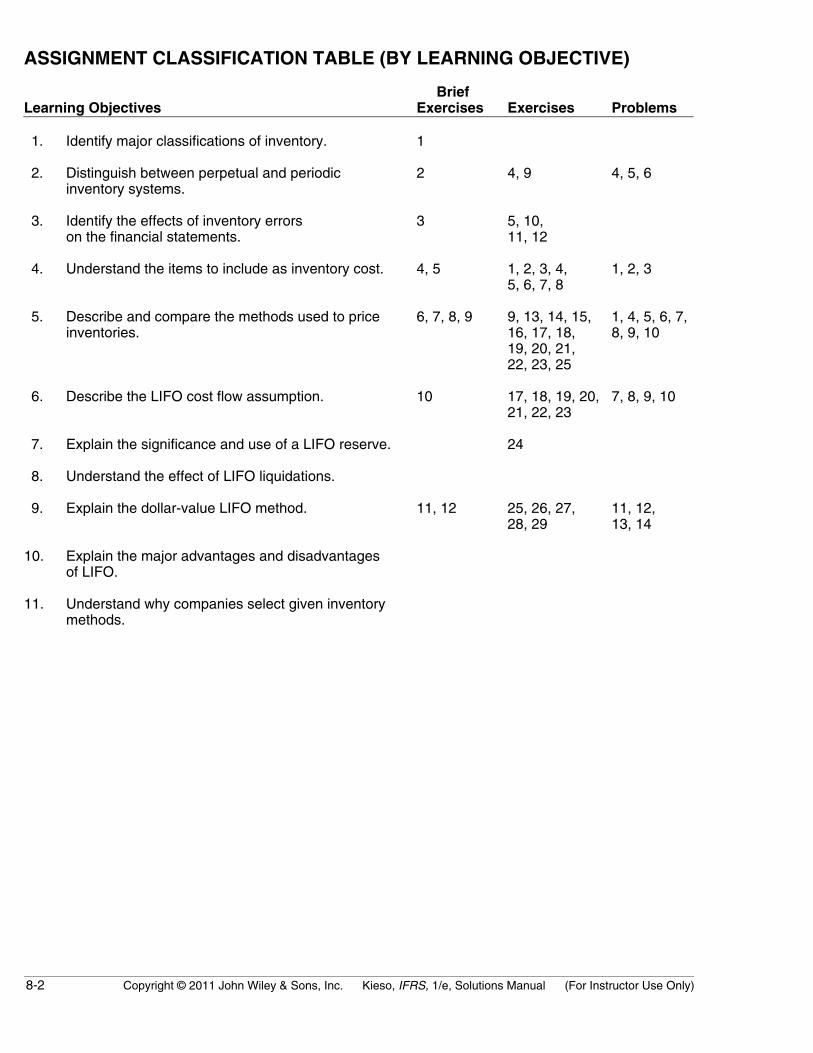
ASSIGNMENT CLASSIFICATION TABLE (BY LEARNING OBJECTIVE)
Learning Objectives BriefExercises Exercises Problems
1. Identify major classifications of inventory. 1
2. Distinguish between perpetual and periodicinventory systems.
2 4, 9 4, 5, 6
3. Identify the effects of inventory errorson the financial statements.
3 5, 10,11, 12
4. Understand the items to include as inventory cost. 4, 5 1, 2, 3, 4,5, 6, 7, 8
1, 2, 3
5. Describe and compare the methods used to priceinventories.
6, 7, 8, 9 9, 13, 14, 15,16, 17, 18,19, 20, 21,22, 23, 25
1, 4, 5, 6, 7,8, 9, 10
6. Describe the LIFO cost flow assumption. 10 17, 18, 19, 20,21, 22, 23
7, 8, 9, 10
7. Explain the significance and use of a LIFO reserve. 24
8. Understand the effect of LIFO liquidations.
9. Explain the dollar-value LIFO method. 11, 12 25, 26, 27,28, 29
11, 12,13, 14
10. Explain the major advantages and disadvantagesof LIFO.
11. Understand why companies select given inventorymethods.
Copyright © 2011 John Wiley & Sons, Inc. Kieso, IFRS, 1/e, Solutions Manual (For Instructor Use Only) 8-3
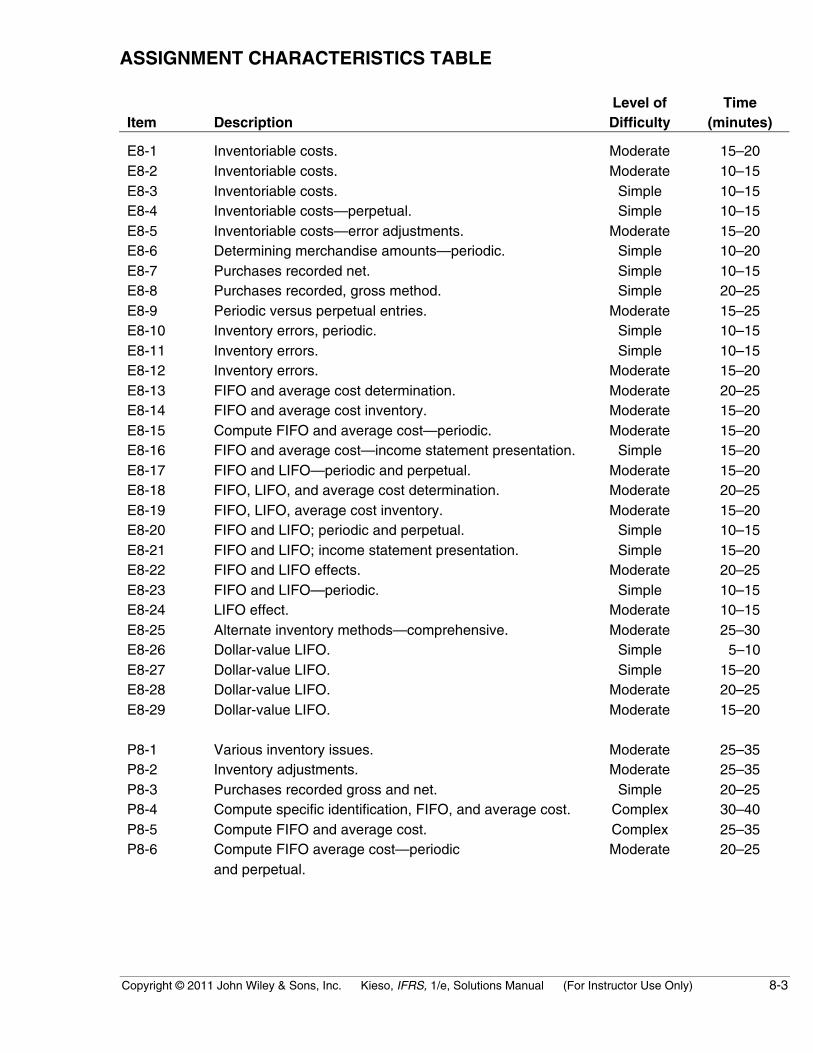
ASSIGNMENT CHARACTERISTICS TABLE
Item DescriptionLevel ofDifficulty
Time(minutes)
E8-1 Inventoriable costs. Moderate 15–20E8-2 Inventoriable costs. Moderate 10–15E8-3 Inventoriable costs. Simple 10–15E8-4 Inventoriable costs—perpetual. Simple 10–15E8-5 Inventoriable costs—error adjustments. Moderate 15–20E8-6 Determining merchandise amounts—periodic. Simple 10–20E8-7 Purchases recorded net. Simple 10–15E8-8 Purchases recorded, gross method. Simple 20–25E8-9 Periodic versus perpetual entries. Moderate 15–25E8-10 Inventory errors, periodic. Simple 10–15E8-11 Inventory errors. Simple 10–15E8-12 Inventory errors. Moderate 15–20E8-13 FIFO and average cost determination. Moderate 20–25E8-14 FIFO and average cost inventory. Moderate 15–20E8-15 Compute FIFO and average cost—periodic. Moderate 15–20E8-16 FIFO and average cost—income statement presentation. Simple 15–20E8-17 FIFO and LIFO—periodic and perpetual. Moderate 15–20E8-18 FIFO, LIFO, and average cost determination. Moderate 20–25E8-19 FIFO, LIFO, average cost inventory. Moderate 15–20E8-20 FIFO and LIFO; periodic and perpetual. Simple 10–15E8-21 FIFO and LIFO; income statement presentation. Simple 15–20E8-22 FIFO and LIFO effects. Moderate 20–25E8-23 FIFO and LIFO—periodic. Simple 10–15E8-24 LIFO effect. Moderate 10–15E8-25 Alternate inventory methods—comprehensive. Moderate 25–30E8-26 Dollar-value LIFO. Simple 5–10E8-27 Dollar-value LIFO. Simple 15–20E8-28 Dollar-value LIFO. Moderate 20–25E8-29 Dollar-value LIFO. Moderate 15–20
P8-1 Various inventory issues. Moderate 25–35P8-2 Inventory adjustments. Moderate 25–35P8-3 Purchases recorded gross and net. Simple 20–25P8-4 Compute specific identification, FIFO, and average cost. Complex 30–40P8-5 Compute FIFO and average cost. Complex 25–35P8-6 Compute FIFO average cost—periodic
and perpetual.Moderate 20–25

8-4 Copyright © 2011 John Wiley & Sons, Inc. Kieso, IFRS, 1/e, Solutions Manual (For Instructor Use Only)
ASSIGNMENT CHARACTERISTICS TABLE (Continued)
Item DescriptionLevel ofDifficulty
Time(minutes)
P8-7 Compute FIFO, LIFO, and average cost. Complex 40–55P8-8 Compute FIFO, LIFO, and average cost. Complex 40–55P8-9 Compute FIFO, LIFO, and average cost—periodic
and perpetual.Moderate 25–35
P8-10 Financial statement effects of FIFO and LIFO. Moderate 30–40P8-11 Dollar-value LIFO. Moderate 30–40P8-12 Internal indexes—dollar-value LIFO. Moderate 25–35P8-13 Internal indexes—dollar-value LIFO. Complex 30–35P8-14 Dollar-value LIFO. Moderate 40–50
CA8-1 Inventoriable costs. Moderate 15–20CA8-2 Inventoriable costs. Moderate 15–25CA8-3 Inventoriable costs. Moderate 25–35CA8-4 Accounting treatment of purchase discounts. Simple 15–25CA8-5 Average cost and FIFO. Simple 15–20CA8-6 Inventory choices—ethical issues Moderate 20–25CA8-7 General inventory issues. Moderate 20–25CA8-8 LIFO inventory advantages. Simple 15–20CA8-9 LIFO application and advantages. Moderate 25–30CA8-10 Dollar-value LIFO issues. Moderate 25–30CA8-11 FIFO and LIFO. Moderate 30–35

Copyright © 2011 John Wiley & Sons, Inc. Kieso, IFRS, 1/e, Solutions Manual (For Instructor Use Only) 8-5
ANSWERS TO QUESTIONS
1. In a merchandising concern, inventory normally consists of only one category, that is the productawaiting resale. In a manufacturing concern, inventories consist of raw materials, work in process,and finished goods. Sometimes a manufacturing or factory supplies inventory account is alsoincluded.
2. (a) Inventories are unexpired costs and represent future benefits to the owner. A statement offinancial position includes a listing of all unexpired costs (assets) at a specific point in time.Because inventories are assets owned at the specific point in time for which a statement offinancial position is prepared, they must be included in order that the owners’ financialposition will be presented fairly.
(b) Beginning and ending inventories are included in the computation of net income only for thepurpose of arriving at the cost of goods sold during the period of time covered by the state-ment. Goods included in the beginning inventory which are no longer on hand are expired coststo be matched against revenues earned during the period. Goods included in the endinginventory are unexpired costs to be carried forward to a future period, rather than expensed.
3. In a perpetual inventory system, data are available at any time on the quantity and dollar amountof each item of material or type of merchandise on hand. A physical inventory means thatinventory is periodically counted (at least once a year) but that up-to-date records are notnecessarily maintained. Discrepancies often occur between the physical count and the perpetualrecords because of clerical errors, theft, waste, misplacement of goods, etc.
4. No. Mishima, Inc. should not report this amount on its statement of financial position. Asconsignee, it does not own this merchandise and therefore it is inappropriate for it to recognize thismerchandise as part of its inventory.
5. Product financing arrangements are essentially off-balance-sheet financing devices. These arrange-ments make it appear that a company has sold its inventory or never taken title to it so they cankeep loans off their statement of financial position. A product financing arrangement should not berecorded as a sale. Rather, the inventory and related liability should be reported on the statementof financial position.
6. (a) Inventory.(b) Not shown, possibly in a note to the financial statements if material.(c) Inventory.(d) Inventory, separately disclosed as raw materials.(e) Not shown, possibly a note to the financial statements.(f) Inventory or manufacturing supplies.
7. Yang can consider the inventory sold if it can reasonably estimate the amount of returns. Thegenerous return policy does not prohibit Yang from recording a sale unless returns are unpredictable.
8. Holland can consider goods sold through installment plans as revenue if it can reasonably estimatethe percentage of bad debts. Even though legal title does not pass to the buyer, Holland willconsider the goods sold as long as it can estimate bad debts accurately.
9. Beckham should explain to the Swiss president that an error in the ending inventory of 2010 alsoaffects the beginning inventory of 2011. For example, understating the 2010 ending inventorywould cause the 2011 beginning inventory to be understated also. This understatement wouldcause an understatement of the 2011 cost of goods sold and an overstatement of the 2011 netincome.
8-6 Copyright © 2011 John Wiley & Sons, Inc. Kieso, IFRS, 1/e, Solutions Manual (For Instructor Use Only)
Questions Chapter 8 (Continued)
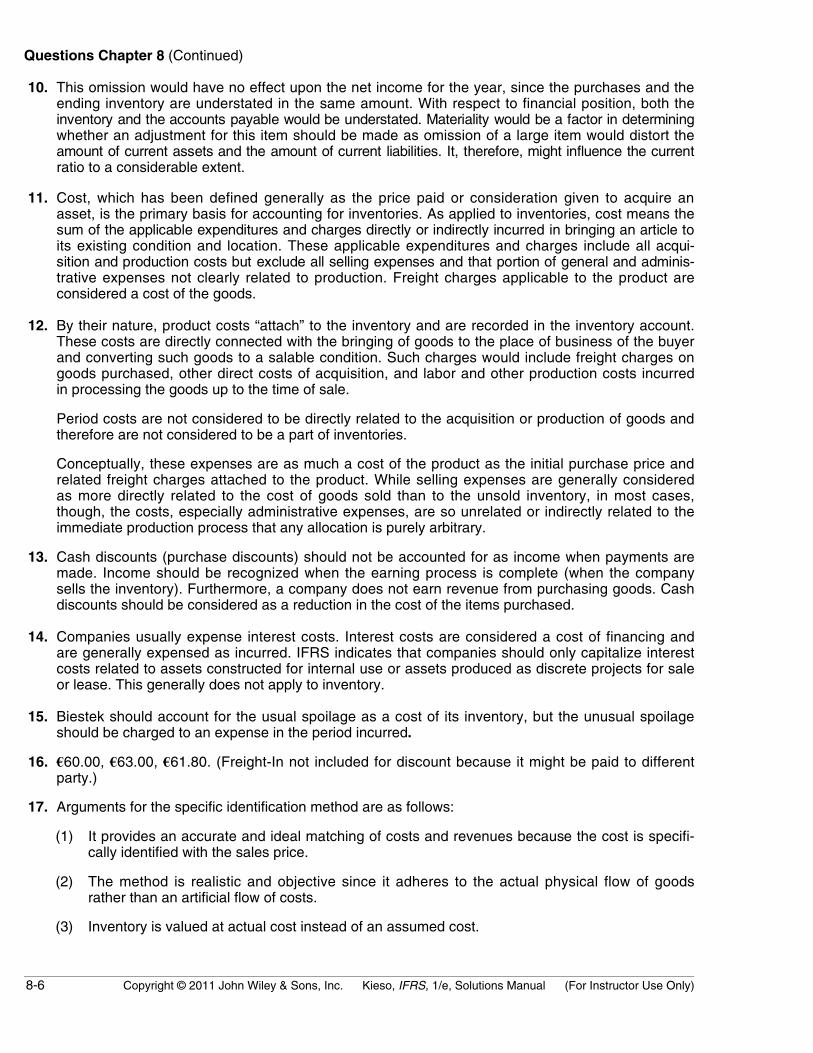
10. This omission would have no effect upon the net income for the year, since the purchases and theending inventory are understated in the same amount. With respect to financial position, both theinventory and the accounts payable would be understated. Materiality would be a factor in determiningwhether an adjustment for this item should be made as omission of a large item would distort theamount of current assets and the amount of current liabilities. It, therefore, might influence the currentratio to a considerable extent.
11. Cost, which has been defined generally as the price paid or consideration given to acquire anasset, is the primary basis for accounting for inventories. As applied to inventories, cost means thesum of the applicable expenditures and charges directly or indirectly incurred in bringing an article toits existing condition and location. These applicable expenditures and charges include all acqui-sition and production costs but exclude all selling expenses and that portion of general and adminis-trative expenses not clearly related to production. Freight charges applicable to the product areconsidered a cost of the goods.
12. By their nature, product costs “attach” to the inventory and are recorded in the inventory account.These costs are directly connected with the bringing of goods to the place of business of the buyerand converting such goods to a salable condition. Such charges would include freight charges ongoods purchased, other direct costs of acquisition, and labor and other production costs incurredin processing the goods up to the time of sale.
Period costs are not considered to be directly related to the acquisition or production of goods andtherefore are not considered to be a part of inventories.
Conceptually, these expenses are as much a cost of the product as the initial purchase price andrelated freight charges attached to the product. While selling expenses are generally consideredas more directly related to the cost of goods sold than to the unsold inventory, in most cases,though, the costs, especially administrative expenses, are so unrelated or indirectly related to theimmediate production process that any allocation is purely arbitrary.
13. Cash discounts (purchase discounts) should not be accounted for as income when payments aremade. Income should be recognized when the earning process is complete (when the companysells the inventory). Furthermore, a company does not earn revenue from purchasing goods. Cashdiscounts should be considered as a reduction in the cost of the items purchased.
14. Companies usually expense interest costs. Interest costs are considered a cost of financing andare generally expensed as incurred. IFRS indicates that companies should only capitalize interestcosts related to assets constructed for internal use or assets produced as discrete projects for saleor lease. This generally does not apply to inventory.
15. Biestek should account for the usual spoilage as a cost of its inventory, but the unusual spoilageshould be charged to an expense in the period incurred.
16. €60.00, €63.00, €61.80. (Freight-In not included for discount because it might be paid to differentparty.)
17. Arguments for the specific identification method are as follows:
(1) It provides an accurate and ideal matching of costs and revenues because the cost is specifi-cally identified with the sales price.
(2) The method is realistic and objective since it adheres to the actual physical flow of goodsrather than an artificial flow of costs.
(3) Inventory is valued at actual cost instead of an assumed cost.
Copyright © 2011 John Wiley & Sons, Inc. Kieso, IFRS, 1/e, Solutions Manual (For Instructor Use Only) 8-7
Questions Chapter 8 (Continued)
Arguments against the specific identification method include the following:
(1) The cost of using it restricts its use to goods of high unit value.
(2) The method is impractical for manufacturing processes or cases in which units are com-mingled and identity lost.
(3) It allows an artificial determination of income by permitting arbitrary selection of the items tobe sold from a homogeneous group.
(4) It may not be a meaningful method of assigning costs in periods of changing price levels.
18. The first-in, first-out method approximates the specific identification method when the physical flowof goods is on a FIFO basis. When the goods are subject to spoilage or deterioration, FIFO isparticularly appropriate. In comparison to the specific identification method, an attractive aspect ofFIFO is the elimination of the danger of artificial determination of income by the selection ofadvantageously priced items to be sold. The basic assumption is that costs should be charged inthe order in which they are incurred. As a result, the inventories are stated at the latest costs.Where the inventory is consumed and valued in the FIFO manner, there is no accounting recognitionof unrealized gain or loss. A criticism of the FIFO method is that it maximizes the effects of pricefluctuations upon reported income because current revenue is matched with the oldest costs which areprobably least similar to current replacement costs. On the other hand, this method produces astatement of financial position value for the asset close to current replacement costs. It is claimedthat FIFO is deceptive when used in a period of rising prices because the reported income is notfully available since a part of it must be used to replace inventory at higher cost.
The results achieved by the weighted-average method resemble those of the specific identificationmethod where items are chosen at random or there is a rapid inventory turnover. Compared withthe specific identification method, the weighted-average method has the advantage that the goodsneed not be individually identified; therefore accounting is not so costly and the method can beapplied to fungible goods. The weighted-average method is also appropriate when there is nomarked trend in price changes. In opposition, it is argued that the method is illogical. Since itassumes that all sales are made proportionally from all purchases and that inventories will alwaysinclude units from the first purchases, it is argued that the method is illogical because it is contraryto the chronological flow of goods. In addition, in periods of price changes there is a lag betweencurrent costs and costs assigned to income or to the valuation of inventories.
*19. A company may obtain a price index from an outside source (external index)—the government, atrade association, an exchange—or by computing its own index (internal index) using the doubleextension method. Under the double extension method the ending inventory is priced at bothbase-year costs and at current-year costs, with the total current cost divided by the total base costto obtain the current year index.

8-8 Copyright © 2011 John Wiley & Sons, Inc. Kieso, IFRS, 1/e, Solutions Manual (For Instructor Use Only)
Questions Chapter 8 (Continued)
*20. Under the double extension method, LIFO inventory is priced at both base-year costs and current-year costs. The total current-year cost of the inventory is divided by the total base-year cost toobtain the current-year index.
The index for the LIFO pool consisting of product A and product B is computed as follows:
Base-Year Cost Current-Year CostProduct Units Unit Total Unit TotalA 25,500 $10.20 $260,100 $21.00 $ 535,500B 10,350 $37.00 382,950 $45.60 471,960December 31, 2010 inventory $643,050 $1,007,460
Current-Year Cost $1,007,460Base-Year Cost = $643,050 = 156.67, index at 12/31/10.
*21. The LIFO method results in a smaller net income because later costs, which are higher thanearlier costs, are matched against revenue. Conversely, in a period of falling prices, the LIFOmethod would result in a higher net income because later costs in this case would be lower thanearlier costs, and these later costs would be matched against revenue.
*22. The dollar-value method uses dollars instead of units to measure increments, or reductions in aLIFO inventory. After converting the closing inventory to the same price level as the opening in-ventory, the increases in inventories, priced at base-year costs, is converted to the current pricelevel and added to the opening inventory. Any decrease is subtracted at base-year costs todetermine the ending inventory.
The principal advantage is that it requires less record-keeping. It is not necessary to keep recordsnor make calculations of opening and closing quantities of individual items. Also, the use of a baseinventory amount gives greater flexibility in the makeup of the base and eliminates many detailedcalculations.
The unit LIFO inventory costing method is applied to each type of item in an inventory. Any type ofitem removed from the inventory base (e.g., magnets) and replaced by another type (e.g., coils)will cause the old cost (magnets) to be removed from the base and to be replaced by the morecurrent cost of the other item (coils).
The dollar-value LIFO costing method treats the inventory base as being composed of a base ofcost in dollars rather than of units. Therefore a change in the composition of the inventory (lessmagnets and more coils) will not change the cost of inventory base so long as the amount of theinventory stated in base-year dollars does not change.
*23. (a) LIFO layer—a LIFO layer (increment) is formed when the ending inventory at base-year pricesexceeds the beginning inventory at base-year prices.
(b) LIFO reserve—the difference between the inventory method used for internal purposesand LIFO.
(c) LIFO effect—the change in the LIFO reserve (Allowance to Reduce Inventory to LIFO) fromone period to the next.

Copyright © 2011 John Wiley & Sons, Inc. Kieso, IFRS, 1/e, Solutions Manual (For Instructor Use Only) 8-9
Questions Chapter 8 (Continued)
*24. December 31, 2010 inventory at December 31, 2009 prices, $1,053,000 ÷ 1.08.............. $975,000Less: Inventory, December 31, 2009 ......................................................................................... 800,000Increment added during 2010 at base prices............................................................................. $175,000
Increment added during 2010 at December 31, 2010 prices, $175,000 X 1.08 ................. $189,000Add: Inventory at December 31, 2009 ......................................................................................... 800,000Inventory, December 31, 2010, under dollar-value LIFO method.......................................... $989,000
*25. Phantom (paper) profits occur when the inventory costs matched against sales are less than thereplacement cost of the inventory. The cost of goods sold therefore is understated and profit isconsidered overstated. Phantom profits are said to occur when FIFO is used during periods ofrising prices.
High LIFO profits through involuntary liquidation occur if a company is forced to reduce its LIFObase or layers. If the base or layers of old costs are eliminated, strange results can occur becauseold, irrelevant costs can be matched against current revenues. A distortion in reported income fora given period may result, as well as consequences that are detrimental from an income tax pointof view.
8-10 Copyright © 2011 John Wiley & Sons, Inc. Kieso, IFRS, 1/e, Solutions Manual (For Instructor Use Only)
SOLUTIONS TO BRIEF EXERCISES
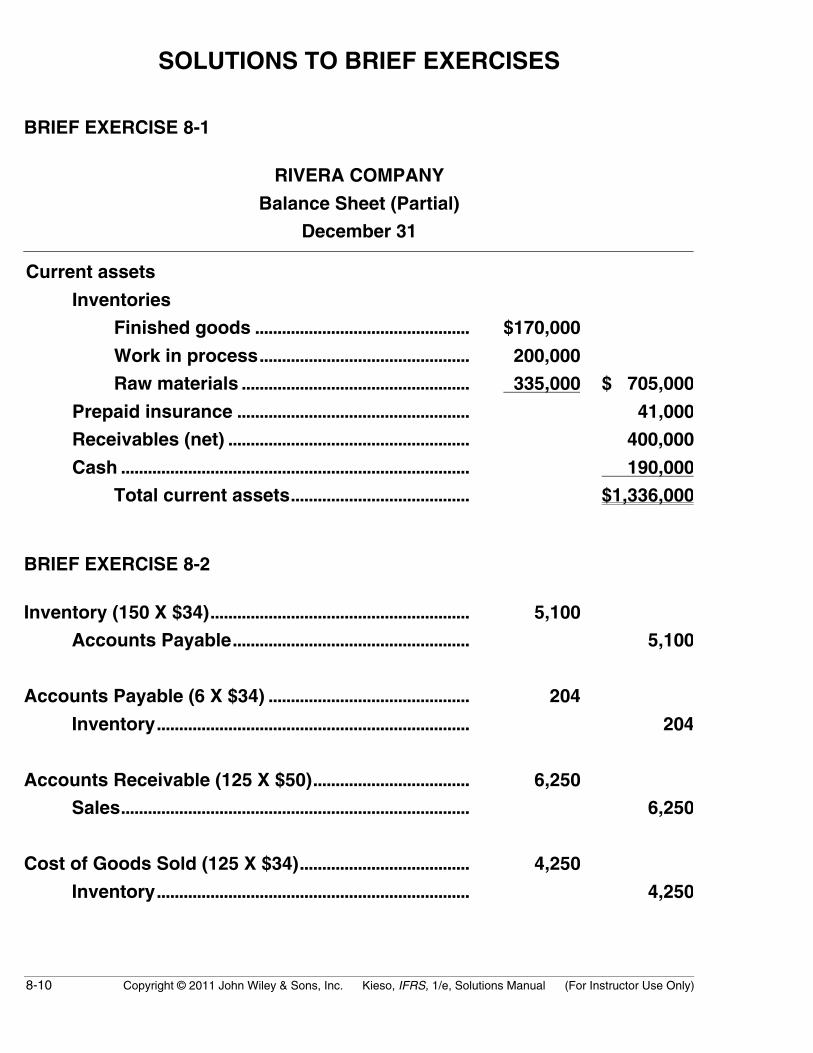
BRIEF EXERCISE 8-1
RIVERA COMPANY
Balance Sheet (Partial)
December 31
Current assets
Inventories
Finished goods ................................................ $170,000
Work in process............................................... 200,000
Raw materials ................................................... 335,000 $ 705,000
Prepaid insurance .................................................... 41,000
Receivables (net) ...................................................... 400,000
Cash .............................................................................. 190,000
Total current assets........................................ $1,336,000
BRIEF EXERCISE 8-2
Inventory (150 X $34).......................................................... 5,100
Accounts Payable..................................................... 5,100
Accounts Payable (6 X $34) ............................................. 204
Inventory...................................................................... 204
Accounts Receivable (125 X $50)................................... 6,250
Sales.............................................................................. 6,250
Cost of Goods Sold (125 X $34)...................................... 4,250
Inventory...................................................................... 4,250
Copyright © 2011 John Wiley & Sons, Inc. Kieso, IFRS, 1/e, Solutions Manual (For Instructor Use Only) 8-11
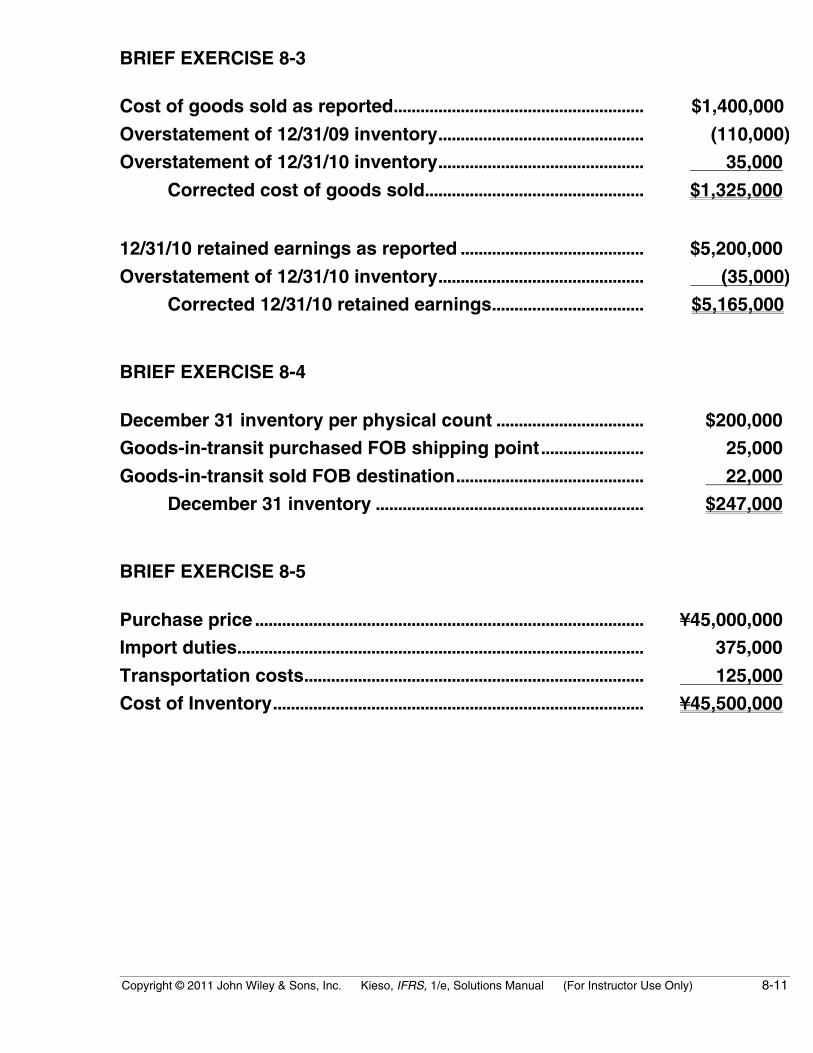
BRIEF EXERCISE 8-3
Cost of goods sold as reported........................................................ $1,400,000
Overstatement of 12/31/09 inventory.............................................. (110,000)
Overstatement of 12/31/10 inventory.............................................. 35,000
Corrected cost of goods sold................................................. $1,325,000
12/31/10 retained earnings as reported ......................................... $5,200,000
Overstatement of 12/31/10 inventory.............................................. (35,000)
Corrected 12/31/10 retained earnings.................................. $5,165,000
BRIEF EXERCISE 8-4
December 31 inventory per physical count ................................. $200,000
Goods-in-transit purchased FOB shipping point....................... 25,000
Goods-in-transit sold FOB destination.......................................... 22,000
December 31 inventory ............................................................ $247,000
BRIEF EXERCISE 8-5
Purchase price ....................................................................................... ¥45,000,000
Import duties........................................................................................... 375,000
Transportation costs............................................................................ 125,000
Cost of Inventory................................................................................... ¥45,500,000
8-12 Copyright © 2011 John Wiley & Sons, Inc. Kieso, IFRS, 1/e, Solutions Manual (For Instructor Use Only)
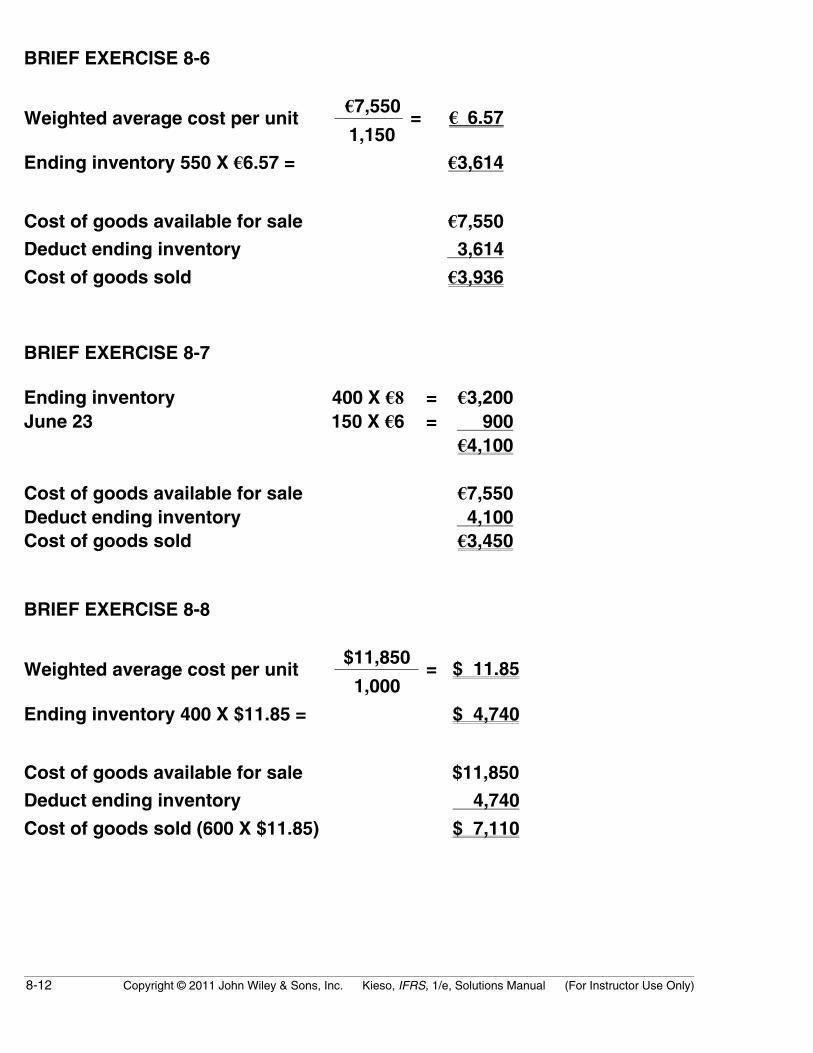
BRIEF EXERCISE 8-6
€7,550Weighted average cost per unit
1,150= € 6.57
Ending inventory 550 X €6.57 = €3,614
Cost of goods available for sale €7,550
Deduct ending inventory 3,614
Cost of goods sold €3,936
BRIEF EXERCISE 8-7
Ending inventory 400 X €8 = €3,200June 23 150 X €6 = 900
€4,100
Cost of goods available for sale €7,550Deduct ending inventory 4,100Cost of goods sold €3,450
BRIEF EXERCISE 8-8
$11,850Weighted average cost per unit
1,000= $ 11.85
Ending inventory 400 X $11.85 = $ 4,740
Cost of goods available for sale $11,850
Deduct ending inventory 4,740
Cost of goods sold (600 X $11.85) $ 7,110
Copyright © 2011 John Wiley & Sons, Inc. Kieso, IFRS, 1/e, Solutions Manual (For Instructor Use Only) 8-13
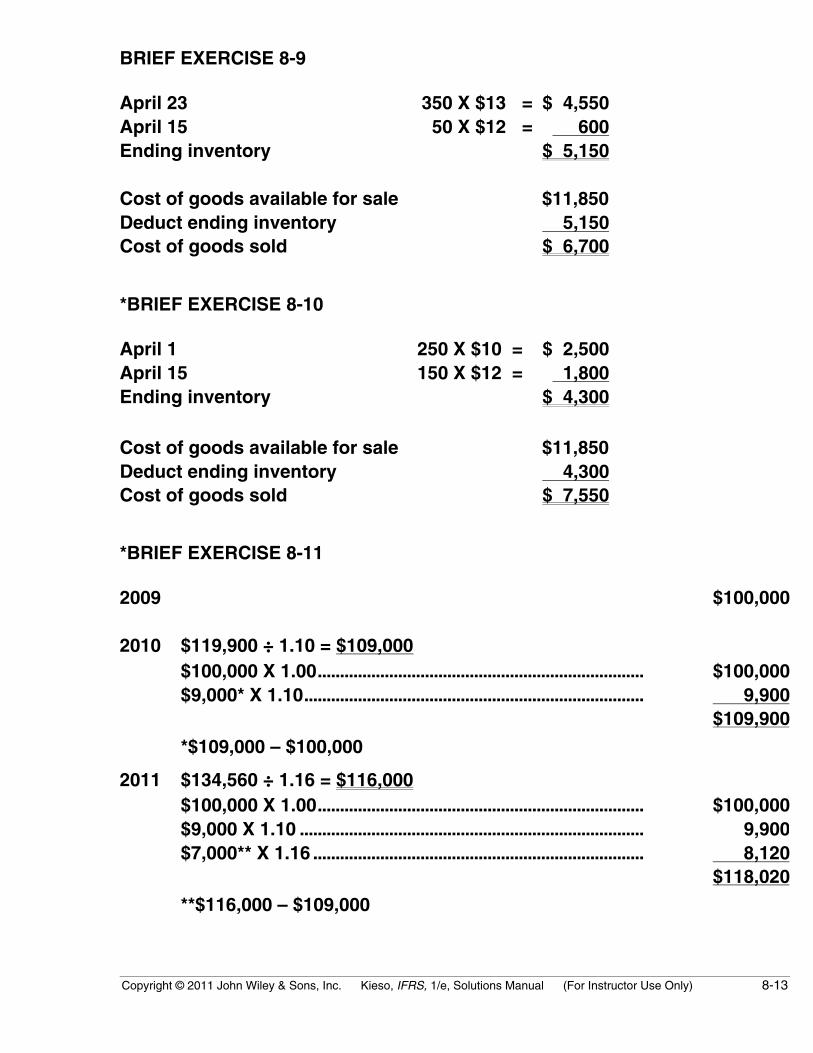
BRIEF EXERCISE 8-9
April 23 350 X $13 = $ 4,550April 15 50 X $12 = 600Ending inventory $ 5,150
Cost of goods available for sale $11,850Deduct ending inventory 5,150Cost of goods sold $ 6,700
*BRIEF EXERCISE 8-10
April 1 250 X $10 = $ 2,500April 15 150 X $12 = 1,800Ending inventory $ 4,300
Cost of goods available for sale $11,850Deduct ending inventory 4,300Cost of goods sold $ 7,550
*BRIEF EXERCISE 8-11
2009 $100,000
2010 $119,900 ÷ 1.10 = $109,000$100,000 X 1.00......................................................................... $100,000$9,000* X 1.10............................................................................ 9,900
$109,900
*$109,000 – $100,000
2011 $134,560 ÷ 1.16 = $116,000$100,000 X 1.00......................................................................... $100,000$9,000 X 1.10 ............................................................................. 9,900$7,000** X 1.16 .......................................................................... 8,120
$118,020
**$116,000 – $109,000
8-14 Copyright © 2011 John Wiley & Sons, Inc. Kieso, IFRS, 1/e, Solutions Manual (For Instructor Use Only)
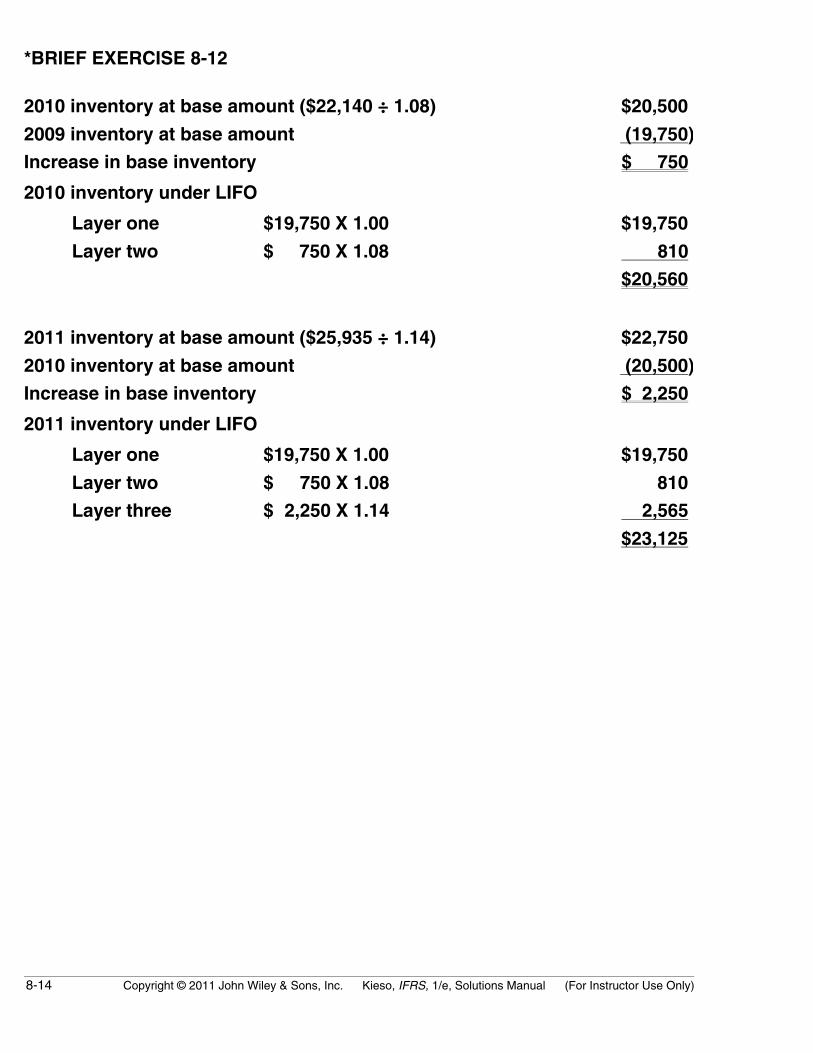
*BRIEF EXERCISE 8-12
2010 inventory at base amount ($22,140 ÷ 1.08) $20,500
2009 inventory at base amount (19,750)
Increase in base inventory $ 750
2010 inventory under LIFO
Layer one $19,750 X 1.00 $19,750
Layer two $ 750 X 1.08 810
$20,560
2011 inventory at base amount ($25,935 ÷ 1.14) $22,750
2010 inventory at base amount (20,500)
Increase in base inventory $ 2,250
2011 inventory under LIFO
Layer one $19,750 X 1.00 $19,750
Layer two $ 750 X 1.08 810
Layer three $ 2,250 X 1.14 2,565
$23,125

Copyright © 2011 John Wiley & Sons, Inc. Kieso, IFRS, 1/e, Solutions Manual (For Instructor Use Only) 8-15
SOLUTIONS TO EXERCISES
EXERCISE 8-1 (15–20 minutes)
Items 2, 3, 5, 8, 10, 13, 14, 16, and 17 would be reported as inventory in thefinancial statements.
The following items would not be reported as inventory: 1. Cost of goods sold in the income statement. 4. Not reported in the financial statements. 6. Cost of goods sold in the income statement. 7. Cost of goods sold in the income statement. 9. Interest expense in the income statement.11. Advertising expense in the income statement.12. Office supplies in the current assets section of the statement of
financial position.15. Not reported in the financial statements.18. Short-term investments in the current asset section of the statement
of financial position.
EXERCISE 8-2 (10–15 minutes)
Inventory per physical count .................................................................... $441,000Goods in transit to customer, f.o.b. destination................................. + 33,000Goods in transit from vendor, f.o.b. shipping point.......................... + 51,000Inventory to be reported on statement of financial position.......... $525,000
The consigned goods of $61,000 are not owned by Garza and were properlyexcluded.
The goods in transit to a customer of $46,000, shipped f.o.b. shipping point,are properly excluded from the inventory because the title to the goodspassed when they left the seller (Garza) and therefore a sale and relatedcost of goods sold should be recorded in 2010.
The goods in transit from a vendor of $73,000, shipped f.o.b. destination,are properly excluded from the inventory because the title to the goodsdoes not pass to Garza until the buyer (Garza) receives them.

8-16 Copyright © 2011 John Wiley & Sons, Inc. Kieso, IFRS, 1/e, Solutions Manual (For Instructor Use Only)
EXERCISE 8-3 (10–15 minutes)
1. Include. Merchandise passes to customer only when it is shipped.
2. Do not include. Title did not pass until January 3.
3. Include in inventory. Product belonged to Webber Inc. at December 31,
2010.
4. Do not include. Goods received on consignment remain the property
of the consignor.
5. Include in inventory. Under invoice terms, title passed when goods
were shipped.
EXERCISE 8-4 (10–15 minutes)
1. Raw Materials Inventory ......................................... 8,100
Accounts Payable .......................................... 8,100
2. No adjustment necessary.
3. Raw Materials Inventory ......................................... 28,000
Accounts Payable .......................................... 28,000
4. Accounts Payable..................................................... 7,500
Raw Materials Inventory .............................. 7,500
5. Raw Materials Inventory ......................................... 19,800
Accounts Payable .......................................... 19,800
Copyright © 2011 John Wiley & Sons, Inc. Kieso, IFRS, 1/e, Solutions Manual (For Instructor Use Only) 8-17
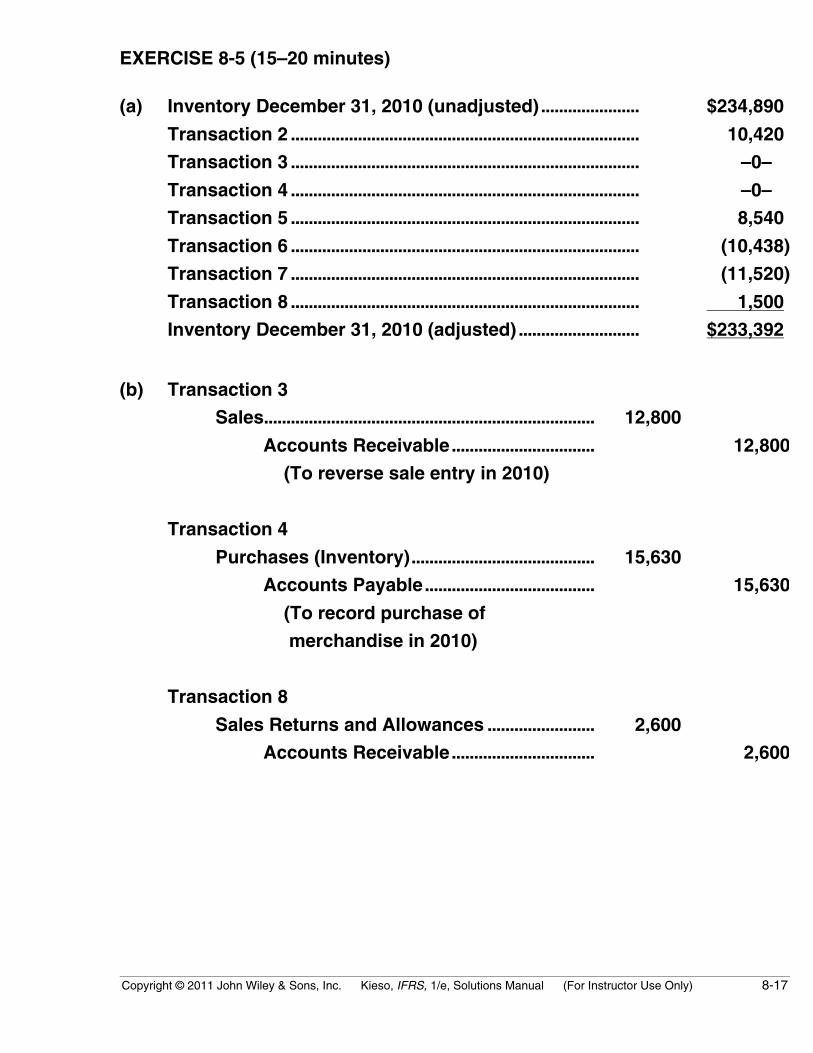
EXERCISE 8-5 (15–20 minutes)
(a) Inventory December 31, 2010 (unadjusted)...................... $234,890
Transaction 2 .............................................................................. 10,420
Transaction 3 .............................................................................. –0–
Transaction 4 .............................................................................. –0–
Transaction 5 .............................................................................. 8,540
Transaction 6 .............................................................................. (10,438)
Transaction 7 .............................................................................. (11,520)
Transaction 8 .............................................................................. 1,500
Inventory December 31, 2010 (adjusted) ........................... $233,392
(b) Transaction 3
Sales.......................................................................... 12,800
Accounts Receivable................................ 12,800
(To reverse sale entry in 2010)
Transaction 4
Purchases (Inventory)......................................... 15,630
Accounts Payable...................................... 15,630
(To record purchase of
merchandise in 2010)
Transaction 8
Sales Returns and Allowances ........................ 2,600
Accounts Receivable................................ 2,600
8-18 Copyright © 2011 John Wiley & Sons, Inc. Kieso, IFRS, 1/e, Solutions Manual (For Instructor Use Only)
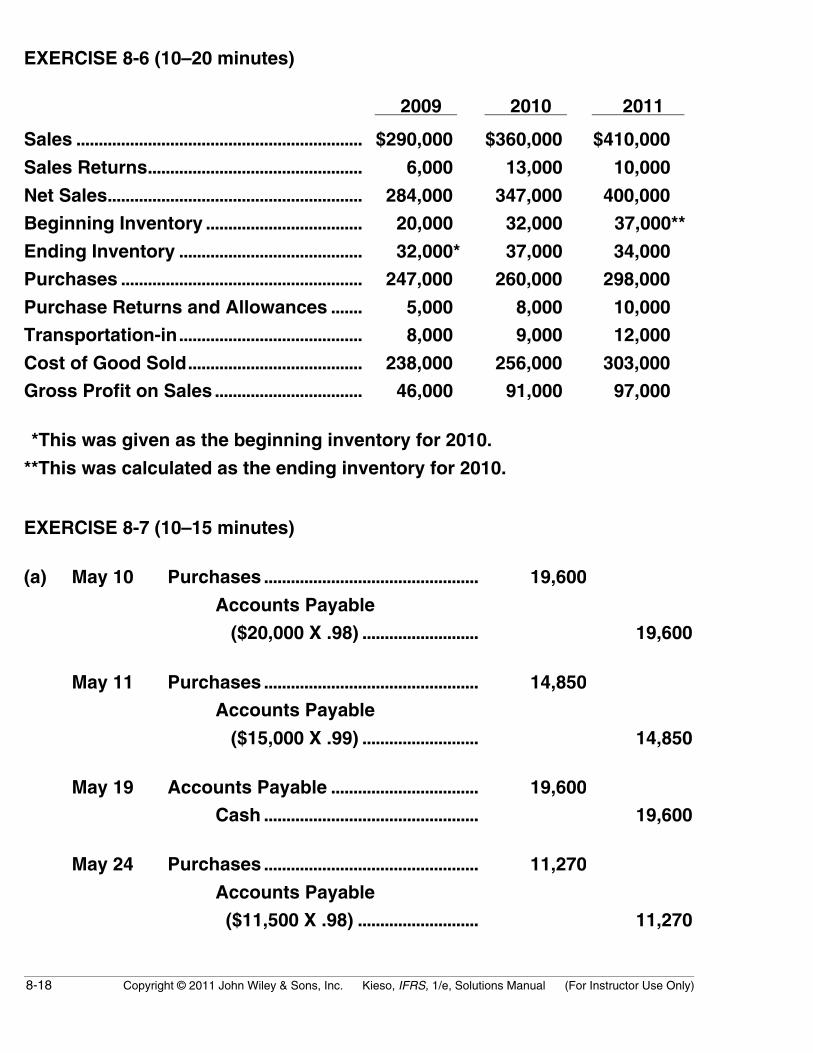
EXERCISE 8-6 (10–20 minutes)
2009 2010 2011
Sales ................................................................ $290,000 $360,000 $410,000
Sales Returns................................................ 6,000 13,000 10,000
Net Sales......................................................... 284,000 347,000 400,000
Beginning Inventory ................................... 20,000 32,000 37,000**
Ending Inventory ......................................... 32,000* 37,000 34,000
Purchases ...................................................... 247,000 260,000 298,000
Purchase Returns and Allowances ....... 5,000 8,000 10,000
Transportation-in......................................... 8,000 9,000 12,000
Cost of Good Sold....................................... 238,000 256,000 303,000
Gross Profit on Sales ................................. 46,000 91,000 97,000
*This was given as the beginning inventory for 2010.
**This was calculated as the ending inventory for 2010.
EXERCISE 8-7 (10–15 minutes)
(a) May 10 Purchases ................................................ 19,600
Accounts Payable
($20,000 X .98) .......................... 19,600
May 11 Purchases ................................................ 14,850
Accounts Payable
($15,000 X .99) .......................... 14,850
May 19 Accounts Payable ................................. 19,600
Cash ................................................ 19,600
May 24 Purchases ................................................ 11,270
Accounts Payable
($11,500 X .98) ........................... 11,270
Copyright © 2011 John Wiley & Sons, Inc. Kieso, IFRS, 1/e, Solutions Manual (For Instructor Use Only) 8-19
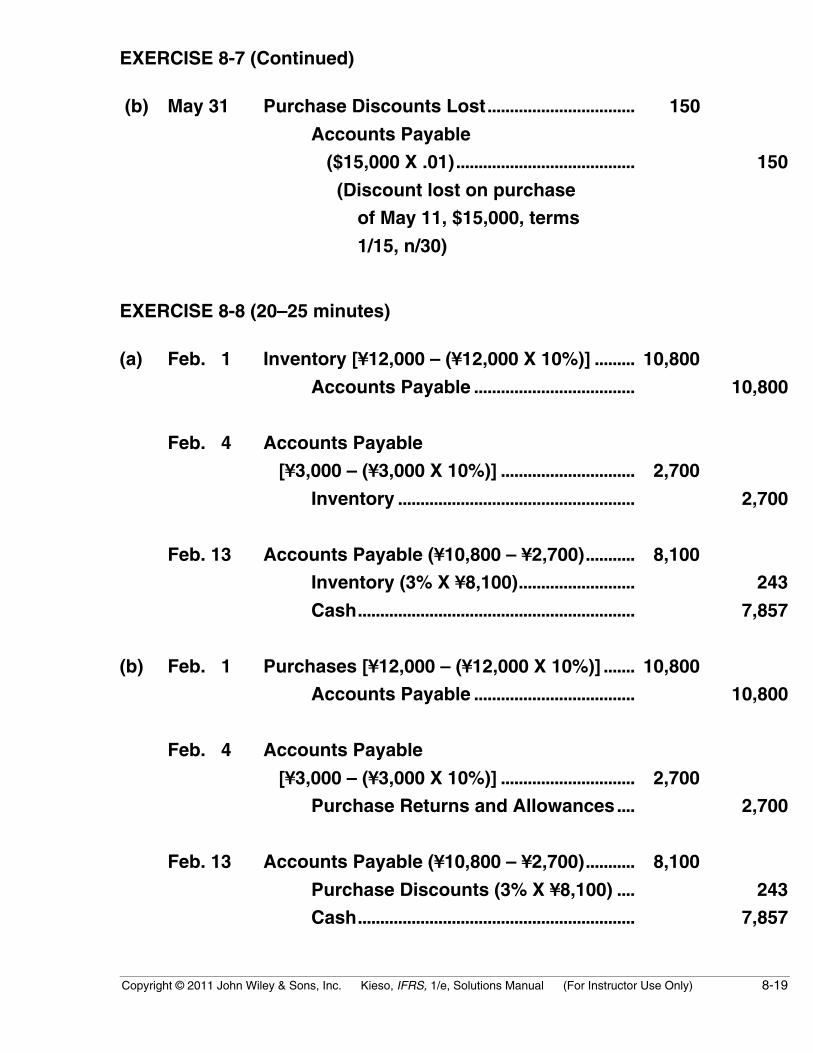
EXERCISE 8-7 (Continued)
(b) May 31 Purchase Discounts Lost................................. 150
Accounts Payable
($15,000 X .01)........................................ 150
(Discount lost on purchase
of May 11, $15,000, terms
1/15, n/30)
EXERCISE 8-8 (20–25 minutes)
(a) Feb. 1 Inventory [¥12,000 – (¥12,000 X 10%)] ......... 10,800
Accounts Payable .................................... 10,800
Feb. 4 Accounts Payable
[¥3,000 – (¥3,000 X 10%)] .............................. 2,700
Inventory ..................................................... 2,700
Feb. 13 Accounts Payable (¥10,800 – ¥2,700)........... 8,100
Inventory (3% X ¥8,100).......................... 243
Cash.............................................................. 7,857
(b) Feb. 1 Purchases [¥12,000 – (¥12,000 X 10%)] ....... 10,800
Accounts Payable .................................... 10,800
Feb. 4 Accounts Payable
[¥3,000 – (¥3,000 X 10%)] .............................. 2,700
Purchase Returns and Allowances.... 2,700
Feb. 13 Accounts Payable (¥10,800 – ¥2,700)........... 8,100
Purchase Discounts (3% X ¥8,100) .... 243
Cash.............................................................. 7,857
8-20 Copyright © 2011 John Wiley & Sons, Inc. Kieso, IFRS, 1/e, Solutions Manual (For Instructor Use Only)
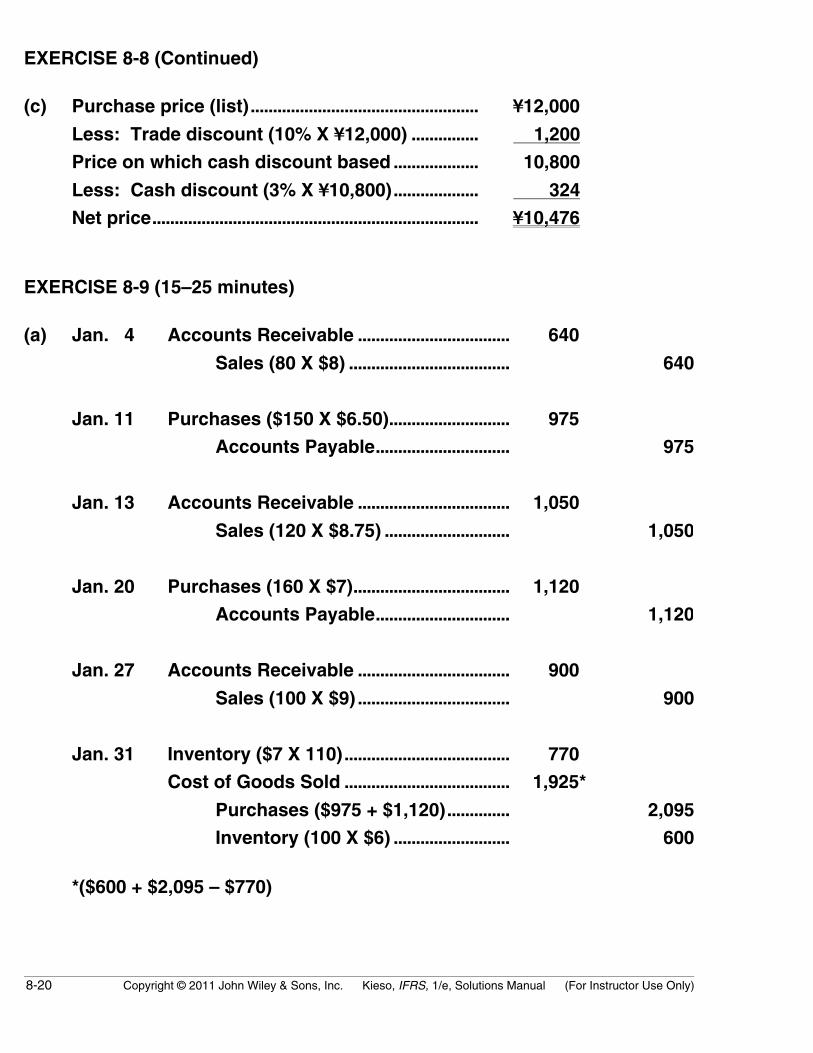
EXERCISE 8-8 (Continued)
(c) Purchase price (list)................................................... ¥12,000
Less: Trade discount (10% X ¥12,000) ............... 1,200
Price on which cash discount based ................... 10,800
Less: Cash discount (3% X ¥10,800)................... 324
Net price......................................................................... ¥10,476
EXERCISE 8-9 (15–25 minutes)
(a) Jan. 4 Accounts Receivable .................................. 640
Sales (80 X $8) .................................... 640
Jan. 11 Purchases ($150 X $6.50)........................... 975
Accounts Payable.............................. 975
Jan. 13 Accounts Receivable .................................. 1,050
Sales (120 X $8.75) ............................ 1,050
Jan. 20 Purchases (160 X $7)................................... 1,120
Accounts Payable.............................. 1,120
Jan. 27 Accounts Receivable .................................. 900
Sales (100 X $9) .................................. 900
Jan. 31 Inventory ($7 X 110)..................................... 770
Cost of Goods Sold ..................................... 1,925*
Purchases ($975 + $1,120).............. 2,095
Inventory (100 X $6) .......................... 600
*($600 + $2,095 – $770)

Copyright © 2011 John Wiley & Sons, Inc. Kieso, IFRS, 1/e, Solutions Manual (For Instructor Use Only) 8-21
EXERCISE 8-9 (Continued)
(b) Sales ($640 + $1,050 + $900)....................... $2,590Cost of goods sold......................................... 1,925Gross profit ...................................................... $ 665
(c) Jan. 4 Accounts Receivable................................... 640Sales (80 X $8)..................................... 640
Cost of Goods Sold...................................... 480Inventory (80 X $6) ............................. 480
Jan. 11 Inventory.......................................................... 975Accounts Payable (150 X $6.50) ....... 975
Jan. 13 Accounts Receivable................................... 1,050Sales (120 X $8.75)............................. 1,050
Cost of Goods Sold...................................... 770Inventory ([(20 X $6) + (100 X $6.50)] .................................... 770
Jan. 20 Inventory.......................................................... 1,120Accounts Payable (160 X $7).......... 1,120
Jan. 27 Accounts Receivable................................... 900Sales (100 X $9)................................... 900
Cost of Goods Sold...................................... 675Inventory [(50 X $6.50) + (50 X $7)] ............................................ 675
(d) Sales ................................................................... $2,590Cost of goods sold ($480 + $770 + $675)................................... 1,925Gross profit ...................................................... $ 665

8-22 Copyright © 2011 John Wiley & Sons, Inc. Kieso, IFRS, 1/e, Solutions Manual (For Instructor Use Only)
EXERCISE 8-10 (10–15 minutes)
Current Year Subsequent Year1. Working capital No effect No effect
Current ratio Overstated* No effectRetained earnings No effect No effectNet income No effect No effect
2. Working capital Overstated No effectCurrent ratio Overstated No effectRetained earnings Overstated No effectNet income Overstated Understated
3. Working capital Overstated No effectCurrent ratio Overstated No effectRetained earnings Overstated No effectNet income Overstated Understated
*Assume that the correct current ratio is greater than one.
EXERCISE 8-11 (10–15 minutes)
€390,000(a)€200,000
= 1.95 to 1
€390,000 + €22,000 – €13,000 + €3,000 €402,000(b)€200,000 – €20,000
=€180,000
= 2.23 to 1
(c)Event Effect of Error
Adjust IncomeIncrease (Decrease)
1. Understatement of endinginventory
Decreases net income €22,000
2. Overstatement of purchases Decreases net income 20,0003. Overstatement of ending
inventoryIncreases net income (13,000)
4. Overstatement of advertisingexpense; understatementof cost of goods sold,assuming goods sold. 0
€29,000
Copyright © 2011 John Wiley & Sons, Inc. Kieso, IFRS, 1/e, Solutions Manual (For Instructor Use Only) 8-23
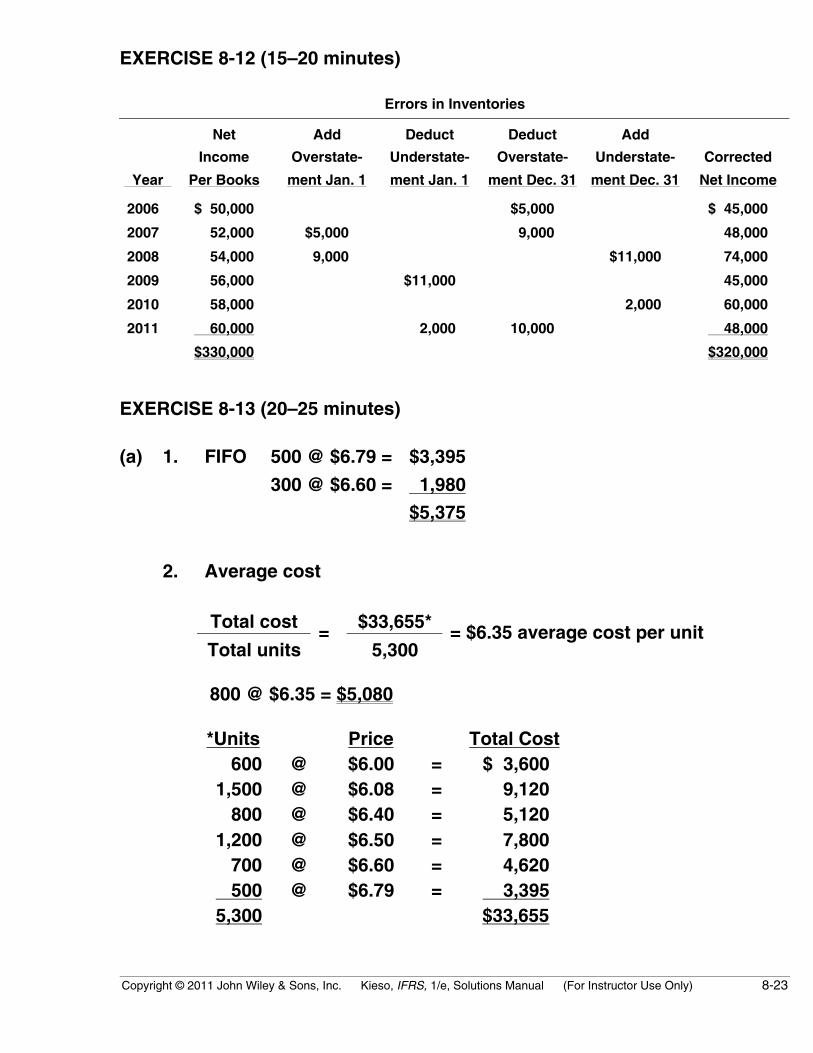
EXERCISE 8-12 (15–20 minutes)
Errors in Inventories
Year
Net
Income
Per Books
Add
Overstate-
ment Jan. 1
Deduct
Understate-
ment Jan. 1
Deduct
Overstate-
ment Dec. 31
Add
Understate-
ment Dec. 31
Corrected
Net Income
2006 $ 50,000 $5,000 $ 45,000
2007 52,000 $5,000 9,000 48,000
2008 54,000 9,000 $11,000 74,000
2009 56,000 $11,000 45,000
2010 58,000 2,000 60,000
2011 60,000 2,000 10,000 48,000
$330,000 $320,000
EXERCISE 8-13 (20–25 minutes)
(a) 1. FIFO 500 @ $6.79 = $3,395
300 @ $6.60 = 1,980
$5,375
2. Average cost
Total cost $33,655*
Total units=
5,300= $6.35 average cost per unit
800 @ $6.35 = $5,080
*Units Price Total Cost600 @ $6.00 = $ 3,600
1,500 @ $6.08 = 9,120800 @ $6.40 = 5,120
1,200 @ $6.50 = 7,800700 @ $6.60 = 4,620
500 @ $6.79 = 3,3955,300 $33,655

8-24 Copyright © 2011 John Wiley & Sons, Inc. Kieso, IFRS, 1/e, Solutions Manual (For Instructor Use Only)
EXERCISE 8-13 (Continued)
(b) 1. FIFO 500 @ $6.79 = $3,395
300 @ $6.60 = 1,980
$5,375
2. Average cost.
Purchased Sold Balance
DateNo. of units
Unit cost
No. of units
Unit cost
No. of units
Unit cost Amount
April 1 600 $6.0000 $3,6003 500 $6.000 100 6.0000 6004 1,500 $6.08 1,600 6.0750 9,7208 800 6.40 2,400 6.1833 14,8409 1,300 6.1833 1,100 6.1833 6,802
11 600 6.1833 500 6.1833 3,09213 1,200 6.50 1,700 6.4071 10,89221 700 6.60 2,400 6.4633 15,51223 1,200 6.4633 1,200 6.4633 7,75627 900 6.4633 300 6.4633 1,93929 500 6.79 800 6.6675 5,334
Inventory April 30 is $5,334
(c) FIFO; older items with lower costs are assumed sold first.
Copyright © 2011 John Wiley & Sons, Inc. Kieso, IFRS, 1/e, Solutions Manual (For Instructor Use Only) 8-25
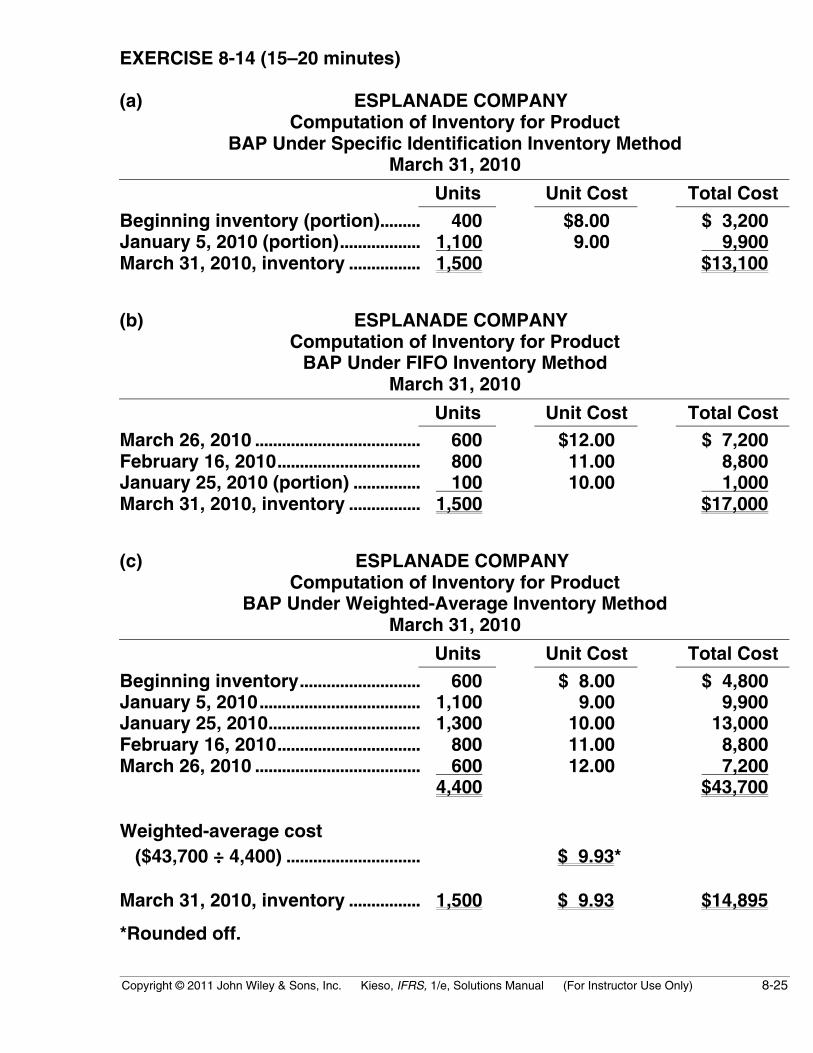
EXERCISE 8-14 (15–20 minutes)
(a) ESPLANADE COMPANYComputation of Inventory for Product
BAP Under Specific Identification Inventory MethodMarch 31, 2010
Units Unit Cost Total CostBeginning inventory (portion)......... 400 $8.00 $ 3,200January 5, 2010 (portion).................. 1,100 9.00 9,900March 31, 2010, inventory ................ 1,500 $13,100
(b) ESPLANADE COMPANYComputation of Inventory for Product
BAP Under FIFO Inventory MethodMarch 31, 2010
Units Unit Cost Total CostMarch 26, 2010 ..................................... 600 $12.00 $ 7,200February 16, 2010................................ 800 11.00 8,800January 25, 2010 (portion) ............... 100 10.00 1,000March 31, 2010, inventory ................ 1,500 $17,000
(c) ESPLANADE COMPANYComputation of Inventory for Product
BAP Under Weighted-Average Inventory MethodMarch 31, 2010
Units Unit Cost Total CostBeginning inventory........................... 600 $ 8.00 $ 4,800January 5, 2010.................................... 1,100 9.00 9,900January 25, 2010.................................. 1,300 10.00 13,000February 16, 2010................................ 800 11.00 8,800March 26, 2010 ..................................... 600 12.00 7,200
4,400 $43,700
Weighted-average cost ($43,700 ÷ 4,400) .............................. $ 9.93*
March 31, 2010, inventory ................ 1,500 $ 9.93 $14,895
*Rounded off.
8-26 Copyright © 2011 John Wiley & Sons, Inc. Kieso, IFRS, 1/e, Solutions Manual (For Instructor Use Only)
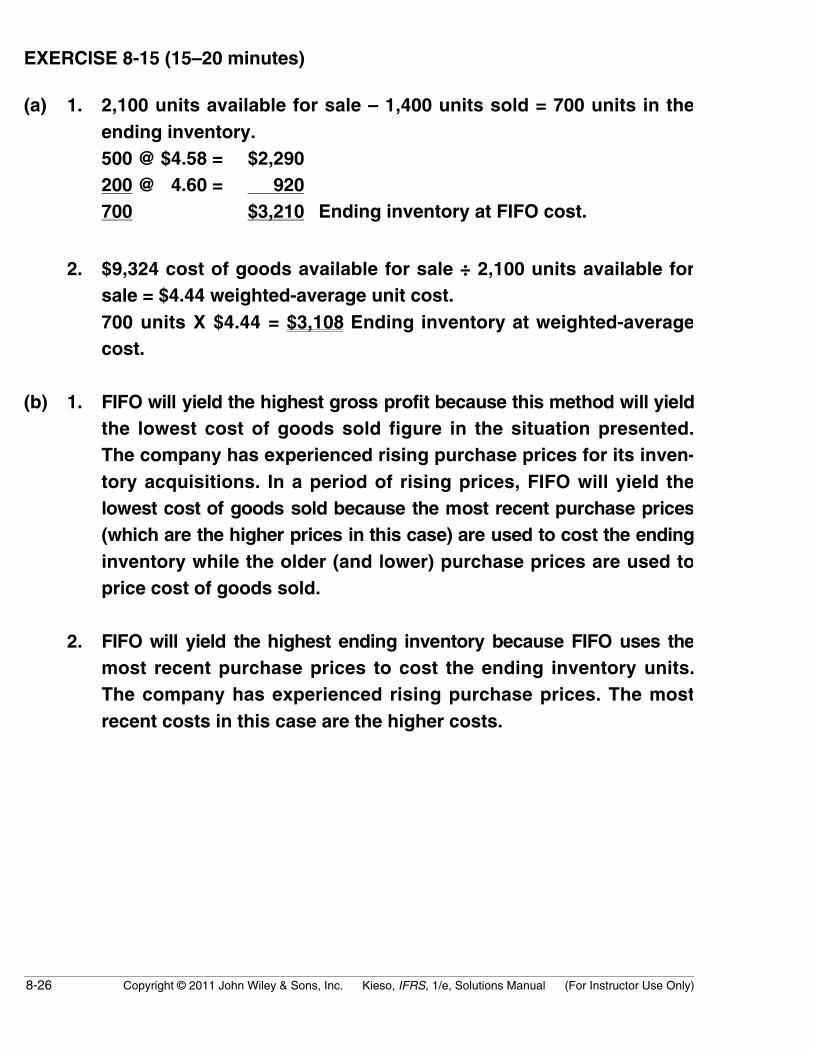
EXERCISE 8-15 (15–20 minutes)
(a) 1. 2,100 units available for sale – 1,400 units sold = 700 units in theending inventory.500 @ $4.58 = $2,290200 @ 4.60 = 920700 $3,210 Ending inventory at FIFO cost.
2. $9,324 cost of goods available for sale ÷ 2,100 units available forsale = $4.44 weighted-average unit cost.700 units X $4.44 = $3,108 Ending inventory at weighted-averagecost.
(b) 1. FIFO will yield the highest gross profit because this method will yieldthe lowest cost of goods sold figure in the situation presented.The company has experienced rising purchase prices for its inven-tory acquisitions. In a period of rising prices, FIFO will yield thelowest cost of goods sold because the most recent purchase prices(which are the higher prices in this case) are used to cost the endinginventory while the older (and lower) purchase prices are used toprice cost of goods sold.
2. FIFO will yield the highest ending inventory because FIFO uses themost recent purchase prices to cost the ending inventory units.The company has experienced rising purchase prices. The mostrecent costs in this case are the higher costs.
Copyright © 2011 John Wiley & Sons, Inc. Kieso, IFRS, 1/e, Solutions Manual (For Instructor Use Only) 8-27
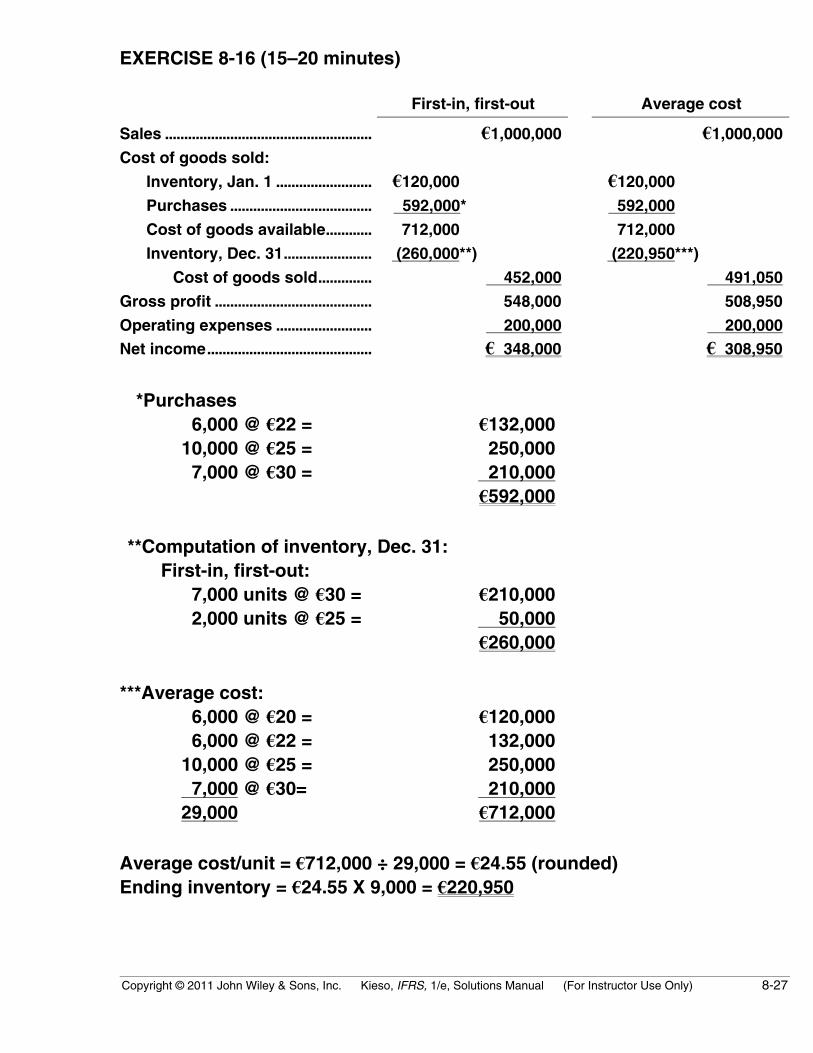
EXERCISE 8-16 (15–20 minutes)
First-in, first-out Average cost
Sales ...................................................... €1,000,000 €1,000,000
Cost of goods sold:
Inventory, Jan. 1 ......................... €120,000 €120,000
Purchases ..................................... 592,000* 592,000
Cost of goods available............ 712,000 712,000
Inventory, Dec. 31....................... (260,000**) (220,950***)
Cost of goods sold.............. 452,000 491,050
Gross profit ......................................... 548,000 508,950
Operating expenses ......................... 200,000 200,000Net income........................................... € 348,000 € 308,950
*Purchases 6,000 @ €22 = €132,000 10,000 @ €25 = 250,000 7,000 @ €30 = 210,000
€592,000
**Computation of inventory, Dec. 31: First-in, first-out: 7,000 units @ €30 = €210,000 2,000 units @ €25 = 50,000
€260,000
***Average cost: 6,000 @ €20 = €120,000 6,000 @ €22 = 132,000 10,000 @ €25 = 250,000 7,000 @ €30= 210,000 29,000 €712,000
Average cost/unit = €712,000 ÷ 29,000 = €24.55 (rounded)Ending inventory = €24.55 X 9,000 = €220,950
8-28 Copyright © 2011 John Wiley & Sons, Inc. Kieso, IFRS, 1/e, Solutions Manual (For Instructor Use Only)
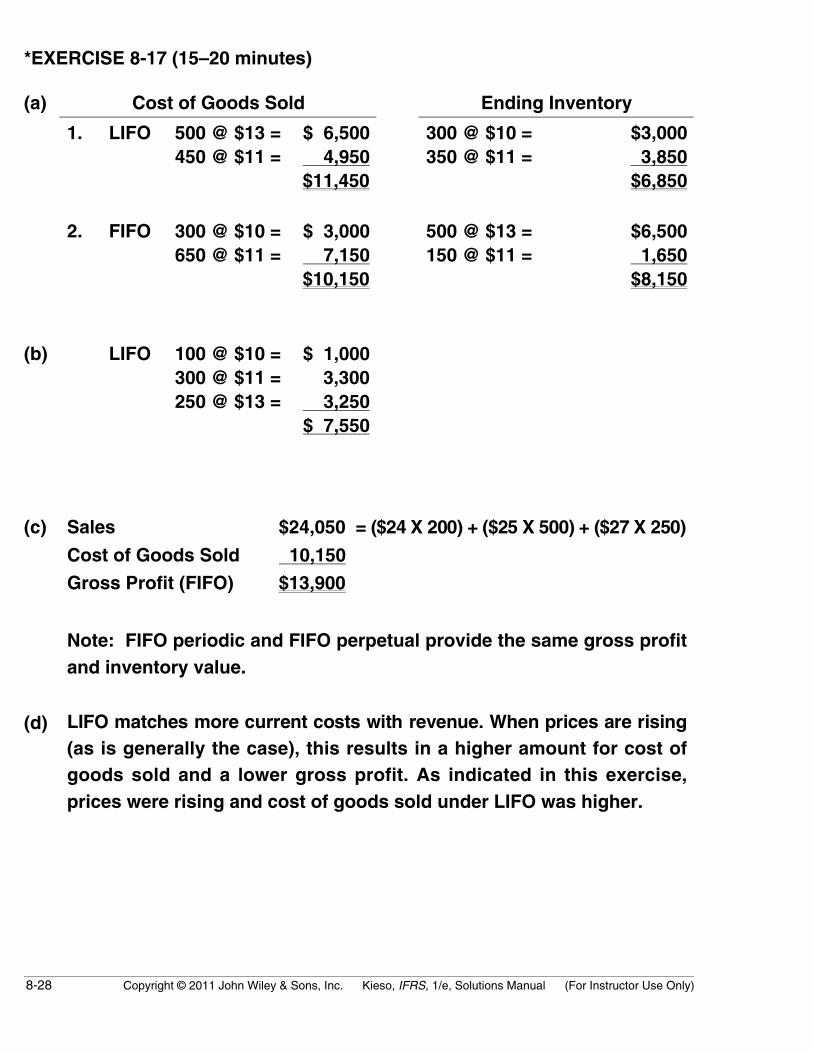
*EXERCISE 8-17 (15–20 minutes)
(a) Cost of Goods Sold Ending Inventory
1. LIFO 500 @ $13 = $ 6,500 300 @ $10 = $3,000450 @ $11 = 4,950 350 @ $11 = 3,850
$11,450 $6,850
2. FIFO 300 @ $10 = $ 3,000 500 @ $13 = $6,500650 @ $11 = 7,150 150 @ $11 = 1,650
$10,150 $8,150
(b) LIFO 100 @ $10 = $ 1,000300 @ $11 = 3,300250 @ $13 = 3,250
$ 7,550
(c) Sales $24,050 = ($24 X 200) + ($25 X 500) + ($27 X 250)
Cost of Goods Sold 10,150
Gross Profit (FIFO) $13,900
Note: FIFO periodic and FIFO perpetual provide the same gross profitand inventory value.
(d) LIFO matches more current costs with revenue. When prices are rising(as is generally the case), this results in a higher amount for cost ofgoods sold and a lower gross profit. As indicated in this exercise,prices were rising and cost of goods sold under LIFO was higher.
Copyright © 2011 John Wiley & Sons, Inc. Kieso, IFRS, 1/e, Solutions Manual (For Instructor Use Only) 8-29
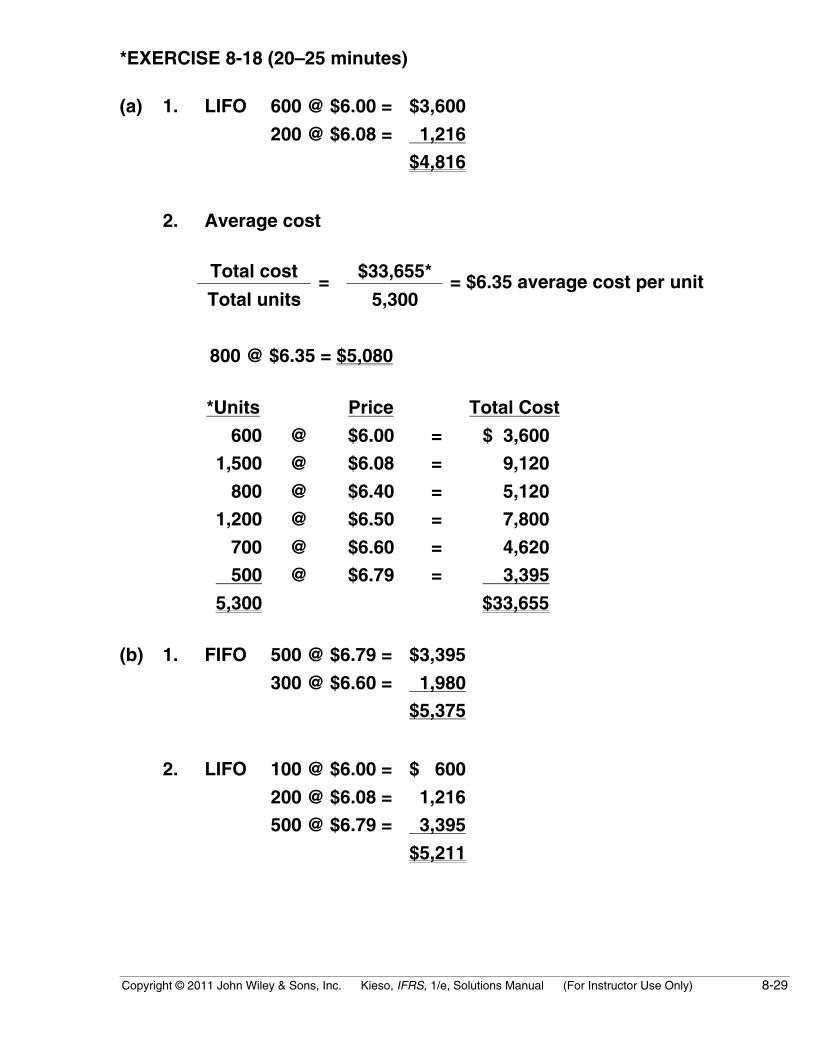
*EXERCISE 8-18 (20–25 minutes)
(a) 1. LIFO 600 @ $6.00 = $3,600
200 @ $6.08 = 1,216
$4,816
2. Average cost
Total cost $33,655*
Total units=
5,300= $6.35 average cost per unit
800 @ $6.35 = $5,080
*Units Price Total Cost
600 @ $6.00 = $ 3,600
1,500 @ $6.08 = 9,120
800 @ $6.40 = 5,120
1,200 @ $6.50 = 7,800
700 @ $6.60 = 4,620
500 @ $6.79 = 3,395
5,300 $33,655
(b) 1. FIFO 500 @ $6.79 = $3,395
300 @ $6.60 = 1,980
$5,375
2. LIFO 100 @ $6.00 = $ 600
200 @ $6.08 = 1,216
500 @ $6.79 = 3,395
$5,211

8-30 Copyright © 2011 John Wiley & Sons, Inc. Kieso, IFRS, 1/e, Solutions Manual (For Instructor Use Only)
*EXERCISE 8-18 (Continued)
(c) Total merchandise available for sale $33,655
Less inventory (FIFO) 5,375
Cost of goods sold $28,280
(d) FIFO will show the highest income in an inflationary period.
*EXERCISE 8-19 (15–20 minutes)
(a) MILLS COMPANYComputation of Inventory for Product
Zone Under FIFO Inventory MethodMarch 31, 2010
Units Unit Cost Total Cost
March 26, 2010...................................... 600 $12.00 $ 7,200February 16, 2010 ................................ 800 11.00 8,800January 25, 2010 (portion)................ 100 10.00 1,000March 31, 2010, inventory................. 1,500 $17,000
(b) MILLS COMPANYComputation of Inventory for Product
Zone Under LIFO Inventory MethodMarch 31, 2010
Units Unit Cost Total Cost
Beginning inventory ........................... 600 $8.00 $ 4,800January 5, 2010 (portion) .................. 900 9.00 8,100March 31, 2010, inventory................. 1,500 $12,900
Copyright © 2011 John Wiley & Sons, Inc. Kieso, IFRS, 1/e, Solutions Manual (For Instructor Use Only) 8-31
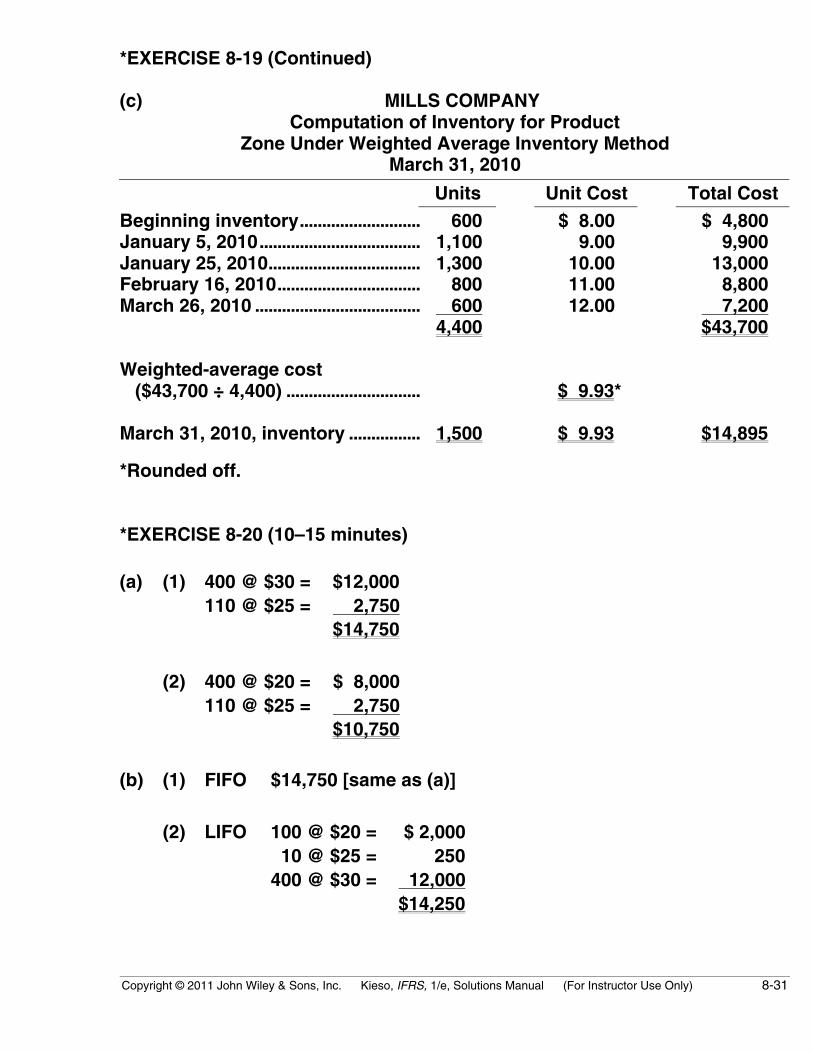
*EXERCISE 8-19 (Continued)
(c) MILLS COMPANYComputation of Inventory for Product
Zone Under Weighted Average Inventory MethodMarch 31, 2010
Units Unit Cost Total CostBeginning inventory........................... 600 $ 8.00 $ 4,800January 5, 2010.................................... 1,100 9.00 9,900January 25, 2010.................................. 1,300 10.00 13,000February 16, 2010................................ 800 11.00 8,800March 26, 2010 ..................................... 600 12.00 7,200
4,400 $43,700
Weighted-average cost ($43,700 ÷ 4,400) .............................. $ 9.93*
March 31, 2010, inventory ................ 1,500 $ 9.93 $14,895
*Rounded off.
*EXERCISE 8-20 (10–15 minutes)
(a) (1) 400 @ $30 = $12,000110 @ $25 = 2,750
$14,750
(2) 400 @ $20 = $ 8,000110 @ $25 = 2,750
$10,750
(b) (1) FIFO $14,750 [same as (a)]
(2) LIFO 100 @ $20 = $ 2,000 10 @ $25 = 250400 @ $30 = 12,000
$14,250
8-32 Copyright © 2011 John Wiley & Sons, Inc. Kieso, IFRS, 1/e, Solutions Manual (For Instructor Use Only)
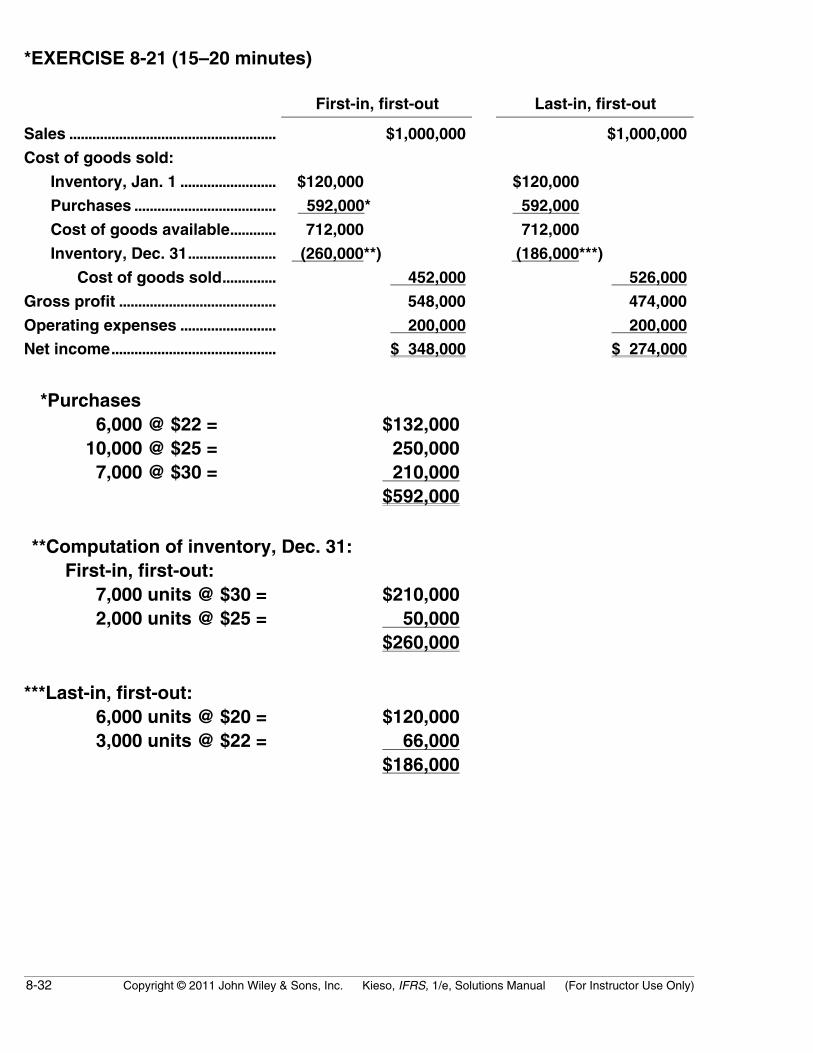
*EXERCISE 8-21 (15–20 minutes)
First-in, first-out Last-in, first-out
Sales ...................................................... $1,000,000 $1,000,000
Cost of goods sold:
Inventory, Jan. 1 ......................... $120,000 $120,000
Purchases ..................................... 592,000* 592,000
Cost of goods available............ 712,000 712,000
Inventory, Dec. 31....................... (260,000**) (186,000***)
Cost of goods sold.............. 452,000 526,000
Gross profit ......................................... 548,000 474,000
Operating expenses ......................... 200,000 200,000Net income........................................... $ 348,000 $ 274,000
*Purchases 6,000 @ $22 = $132,000 10,000 @ $25 = 250,000 7,000 @ $30 = 210,000
$592,000
**Computation of inventory, Dec. 31: First-in, first-out: 7,000 units @ $30 = $210,000 2,000 units @ $25 = 50,000
$260,000
***Last-in, first-out: 6,000 units @ $20 = $120,000 3,000 units @ $22 = 66,000
$186,000
Copyright © 2011 John Wiley & Sons, Inc. Kieso, IFRS, 1/e, Solutions Manual (For Instructor Use Only) 8-33
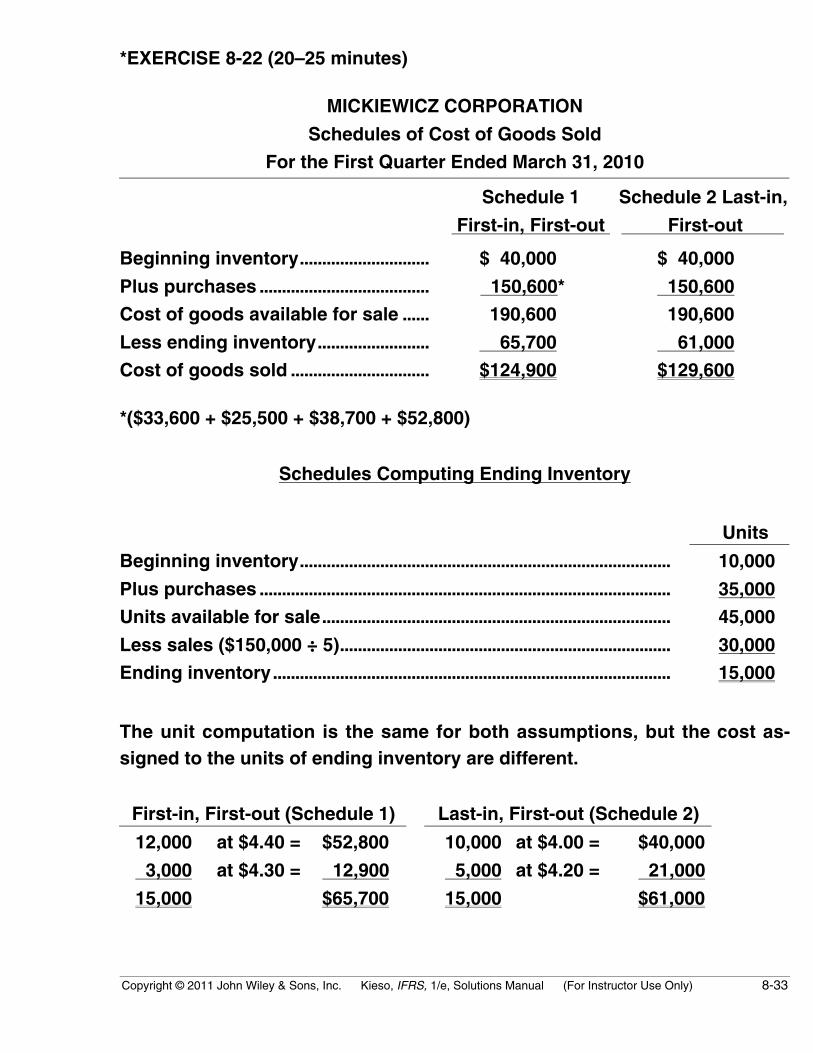
*EXERCISE 8-22 (20–25 minutes)
MICKIEWICZ CORPORATION
Schedules of Cost of Goods Sold
For the First Quarter Ended March 31, 2010
Schedule 1
First-in, First-out
Schedule 2 Last-in,
First-out
Beginning inventory............................. $ 40,000 $ 40,000
Plus purchases ...................................... 150,600* 150,600
Cost of goods available for sale ...... 190,600 190,600
Less ending inventory......................... 65,700 61,000
Cost of goods sold ............................... $124,900 $129,600
*($33,600 + $25,500 + $38,700 + $52,800)
Schedules Computing Ending Inventory
Units
Beginning inventory................................................................................... 10,000
Plus purchases ............................................................................................ 35,000
Units available for sale.............................................................................. 45,000
Less sales ($150,000 ÷ 5).......................................................................... 30,000
Ending inventory......................................................................................... 15,000
The unit computation is the same for both assumptions, but the cost as-signed to the units of ending inventory are different.
First-in, First-out (Schedule 1) Last-in, First-out (Schedule 2)
12,000 at $4.40 = $52,800 10,000 at $4.00 = $40,000
3,000 at $4.30 = 12,900 5,000 at $4.20 = 21,000
15,000 $65,700 15,000 $61,000

8-34 Copyright © 2011 John Wiley & Sons, Inc. Kieso, IFRS, 1/e, Solutions Manual (For Instructor Use Only)
*EXERCISE 8-23 (10–15 minutes)
(a) FIFO Ending Inventory 12/31/10 76 @ $10.89* = $ 827.64 34 @ $11.88** = 403.92
$1,231.56
*$11.00 – [.01 ($11.00)]**$12.00 – [.01 ($12.00)]
(b) LIFO Cost of Goods Sold—2010 76 @ $10.89 = $ 827.64 84 @ $11.88 = 997.92 90 @ $14.85* = 1,336.50 5 @ $15.84** = 79.20
$3,241.26
*$15.00 – [.01 ($15)]**$16.00 – [.01 ($16)]
(c) FIFO matches older costs with revenue. When prices are declining, asin this case, this results in a higher amount for cost of goods sold.Therefore, it is recommended that FIFO be used by Tom Brady Shop tominimize taxable income.
*EXERCISE 8-24 (10–15 minutes)
(a) The difference between the inventory used for internal reporting pur-poses and LIFO is referred to as the Allowance to Reduce Inventory toLIFO or the LIFO reserve. The change in the allowance balance fromone period to the next is called the LIFO effect (or as shown in thisexample, the LIFO adjustment).
(b) LIFO subtracts inflation from inventory costs by charging the items pur-chased recently to cost of goods sold. As a result, ending inventory(assuming increasing prices) will be lower than under FIFO or averagecost.

Copyright © 2011 John Wiley & Sons, Inc. Kieso, IFRS, 1/e, Solutions Manual (For Instructor Use Only) 8-35
*EXERCISE 8-24 (Continued)
(c) Cash flow was computed as follows:Revenue ........................................ $3,200,000Cost of goods sold .................... (2,800,000)Operating expenses .................. (150,000)Income taxes................................ (75,600)Cash flow ...................................... $ 174,400
If the company has any sales on account or payables, then the cash flownumber is incorrect. It is assumed here that the cash basis of accountingis used.
(d) The company has extra cash because its taxes are less. The reasontaxes are lower is because cost of goods sold (in a period of inflation)is higher under LIFO than FIFO. As a result, net income is lower whichleads to lower income taxes. If prices are decreasing, the oppositeeffect results.
*EXERCISE 8-25 (25–30 minutes)
(a) 1. Ending inventory—Specific IdentificationDate No. Units Unit Cost Total Cost
December 2 100 $30 $3,000July 20 30 25 750
130 $3,750
2. Ending inventory—FIFODate No. Units Unit Cost Total Cost
December 2 100 $30 $3,000September 4 30 28 840
130 $3,840
3. Ending inventory—LIFODate No. Units Unit Cost Total Cost
January 1 100 $20 $2,000March 15 30 24 720
130 $2,720

8-36 Copyright © 2011 John Wiley & Sons, Inc. Kieso, IFRS, 1/e, Solutions Manual (For Instructor Use Only)
*EXERCISE 8-25 (Continued)
4. Ending inventory—Average Cost
Date ExplanationNo.
UnitsUnitCost
TotalCost
January 1 Beginning inventory 100 $20 $ 2,000March 15 Purchase 300 24 7,200July 20 Purchase 300 25 7,500September 4 Purchase 200 28 5,600December 2 Purchase 100 30 3,000
1,000 $25,300
$25,300 ÷ 1,000 = $25.30
Ending Inventory—Average Cost
No. Units Unit Cost Total Cost
130 $25.30 $3,289
(b) Double Extension Method
Base-Year Costs Current Costs
UnitsBase-Year
Cost Per Unit Total UnitsCurrent-YearCost Per Unit Total
130 $20 $2,600 100 $30 $3,000 30 $28 840
$3,840
Ending Inventory for the Period at Current Cost $3,840Ending Inventory for the Period at Base-Year Cost
=$2,600
= 1.4769
Ending inventory at base-year prices ($3,840 ÷ 1.4769) ......... $ 2,600Base layer (100 units at $20) ............................................................ (2,000)Increment in base-year dollars........................................................ 600Current index......................................................................................... 1.4769Increment in current dollars ............................................................. 886Base layer (100 units at $20) ............................................................ 2,000Ending inventory at dollar-value LIFO .......................................... $ 2,886
Copyright © 2011 John Wiley & Sons, Inc. Kieso, IFRS, 1/e, Solutions Manual (For Instructor Use Only) 8-37
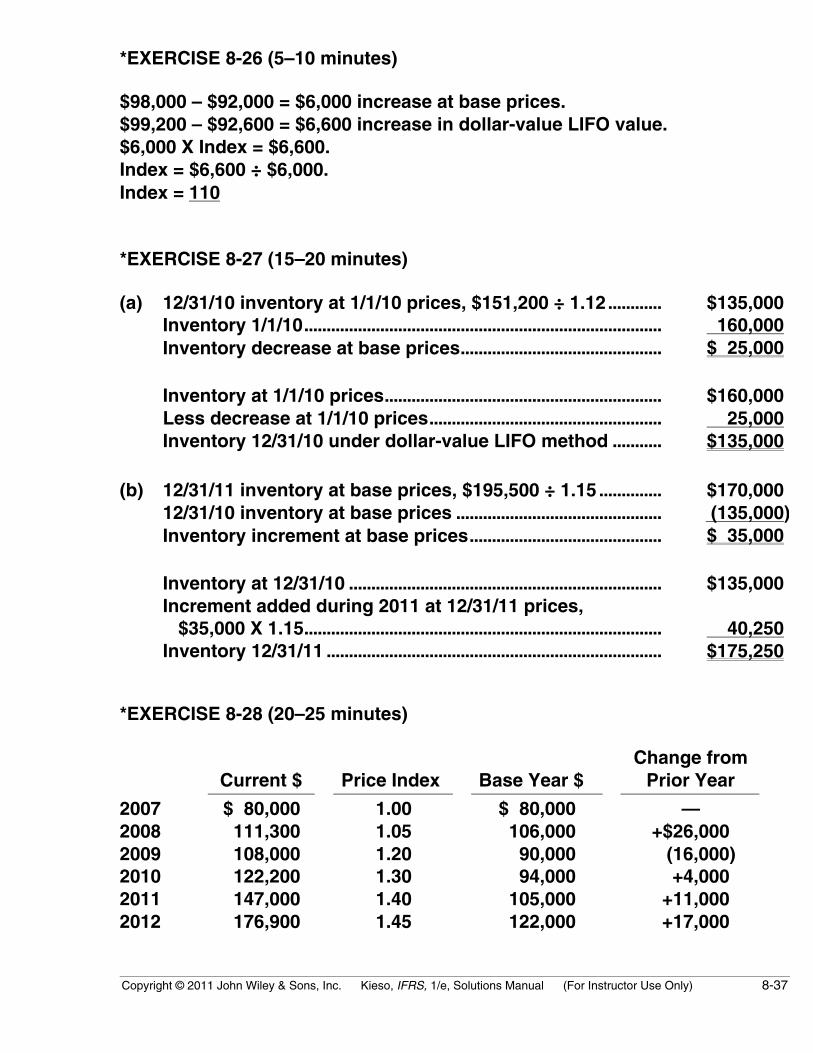
*EXERCISE 8-26 (5–10 minutes)
$98,000 – $92,000 = $6,000 increase at base prices.$99,200 – $92,600 = $6,600 increase in dollar-value LIFO value.$6,000 X Index = $6,600.Index = $6,600 ÷ $6,000.Index = 110
*EXERCISE 8-27 (15–20 minutes)
(a) 12/31/10 inventory at 1/1/10 prices, $151,200 ÷ 1.12............ $135,000Inventory 1/1/10................................................................................ 160,000Inventory decrease at base prices............................................. $ 25,000
Inventory at 1/1/10 prices.............................................................. $160,000Less decrease at 1/1/10 prices.................................................... 25,000Inventory 12/31/10 under dollar-value LIFO method ........... $135,000
(b) 12/31/11 inventory at base prices, $195,500 ÷ 1.15 .............. $170,00012/31/10 inventory at base prices .............................................. (135,000)Inventory increment at base prices........................................... $ 35,000
Inventory at 12/31/10 ...................................................................... $135,000Increment added during 2011 at 12/31/11 prices, $35,000 X 1.15................................................................................ 40,250Inventory 12/31/11 ........................................................................... $175,250
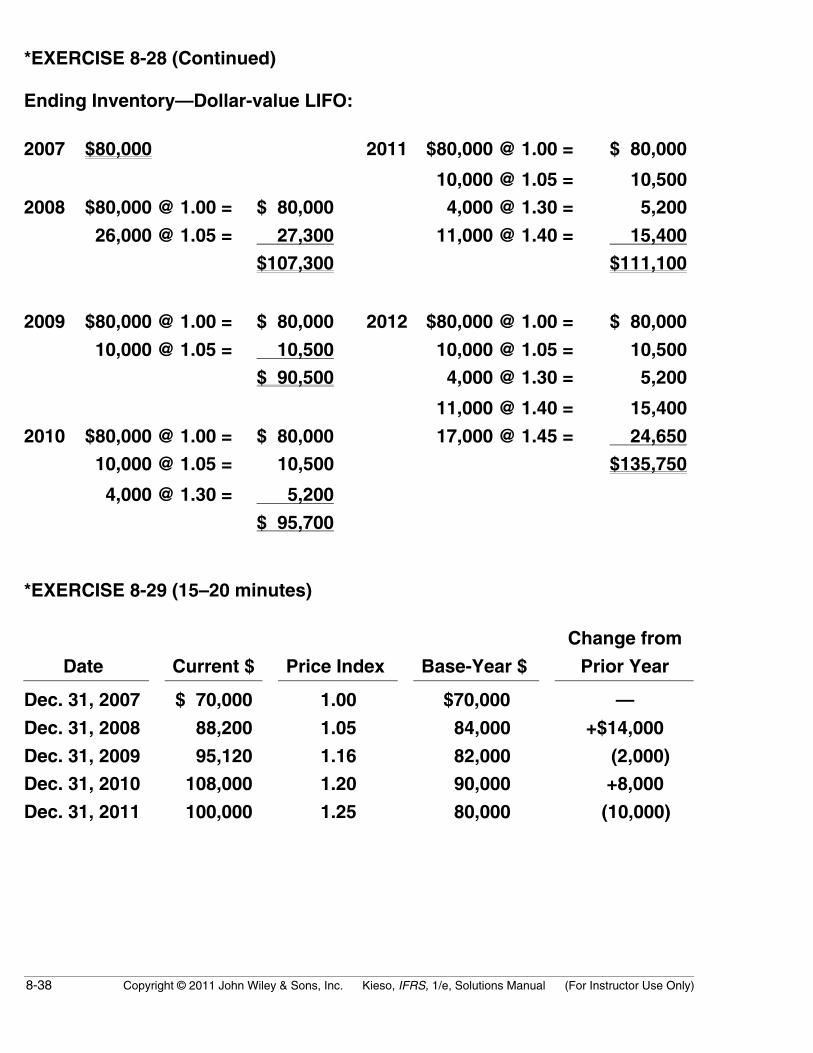
*EXERCISE 8-28 (20–25 minutes)
Current $ Price Index Base Year $Change from
Prior Year
2007 $ 80,000 1.00 $ 80,000 —2008 111,300 1.05 106,000 +$26,0002009 108,000 1.20 90,000 (16,000)2010 122,200 1.30 94,000 +4,0002011 147,000 1.40 105,000 +11,0002012 176,900 1.45 122,000 +17,000
8-38 Copyright © 2011 John Wiley & Sons, Inc. Kieso, IFRS, 1/e, Solutions Manual (For Instructor Use Only)
*EXERCISE 8-28 (Continued)
Ending Inventory—Dollar-value LIFO:
2007 $80,000 2011 $80,000 @ 1.00 = $ 80,000
10,000 @ 1.05 = 10,500
2008 $80,000 @ 1.00 = $ 80,000 4,000 @ 1.30 = 5,200
26,000 @ 1.05 = 27,300 11,000 @ 1.40 = 15,400
$107,300 $111,100
2009 $80,000 @ 1.00 = $ 80,000 2012 $80,000 @ 1.00 = $ 80,000
10,000 @ 1.05 = 10,500 10,000 @ 1.05 = 10,500
$ 90,500 4,000 @ 1.30 = 5,200
11,000 @ 1.40 = 15,400
2010 $80,000 @ 1.00 = $ 80,000 17,000 @ 1.45 = 24,650
10,000 @ 1.05 = 10,500 $135,750
4,000 @ 1.30 = 5,200
$ 95,700
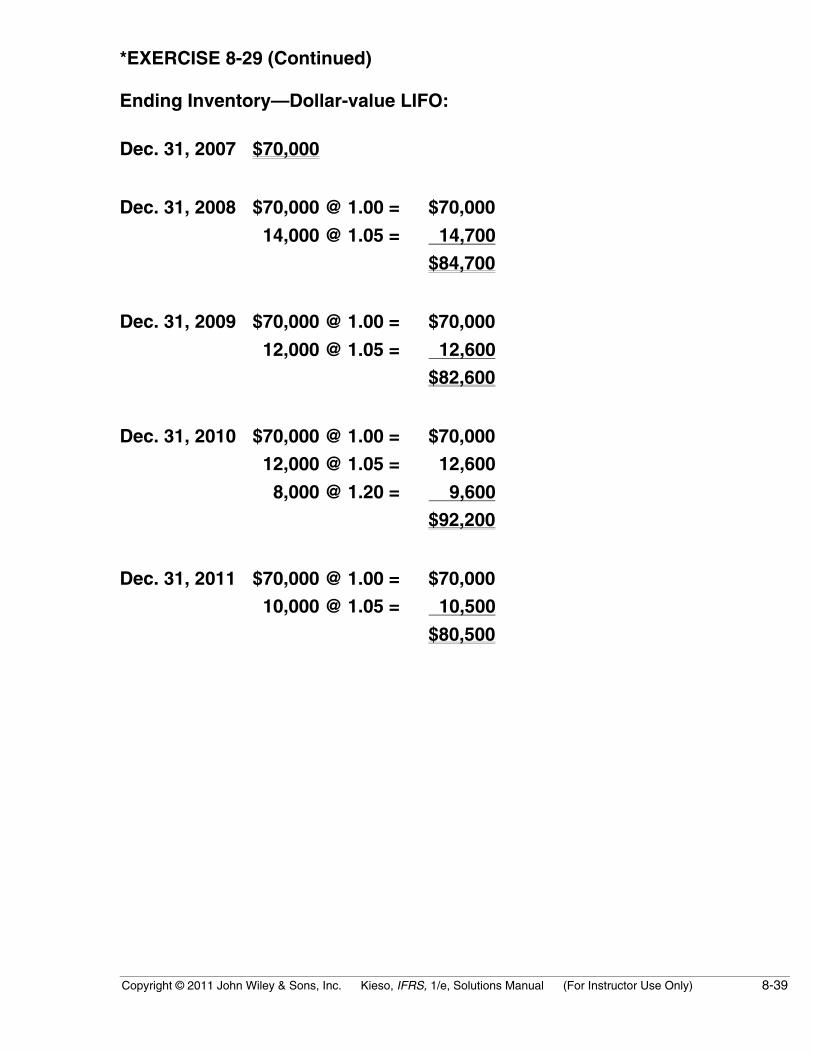
*EXERCISE 8-29 (15–20 minutes)
Date Current $ Price Index Base-Year $
Change from
Prior Year
Dec. 31, 2007 $ 70,000 1.00 $70,000 —
Dec. 31, 2008 88,200 1.05 84,000 +$14,000
Dec. 31, 2009 95,120 1.16 82,000 (2,000)
Dec. 31, 2010 108,000 1.20 90,000 +8,000
Dec. 31, 2011 100,000 1.25 80,000 (10,000)
Copyright © 2011 John Wiley & Sons, Inc. Kieso, IFRS, 1/e, Solutions Manual (For Instructor Use Only) 8-39
*EXERCISE 8-29 (Continued)
Ending Inventory—Dollar-value LIFO:
Dec. 31, 2007 $70,000
Dec. 31, 2008 $70,000 @ 1.00 = $70,000
14,000 @ 1.05 = 14,700
$84,700
Dec. 31, 2009 $70,000 @ 1.00 = $70,000
12,000 @ 1.05 = 12,600
$82,600
Dec. 31, 2010 $70,000 @ 1.00 = $70,000
12,000 @ 1.05 = 12,600
8,000 @ 1.20 = 9,600
$92,200
Dec. 31, 2011 $70,000 @ 1.00 = $70,000
10,000 @ 1.05 = 10,500
$80,500
8-40 Copyright © 2011 John Wiley & Sons, Inc. Kieso, IFRS, 1/e, Solutions Manual (For Instructor Use Only)
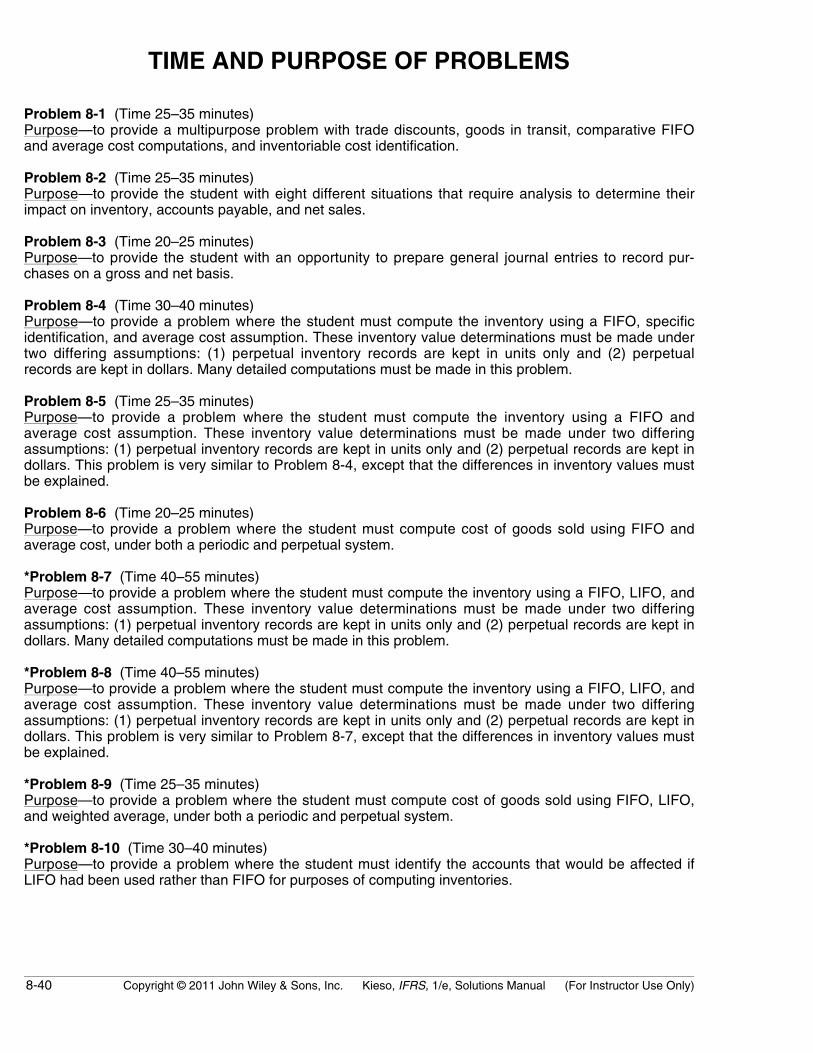
TIME AND PURPOSE OF PROBLEMS
Problem 8-1 (Time 25–35 minutes)Purpose—to provide a multipurpose problem with trade discounts, goods in transit, comparative FIFOand average cost computations, and inventoriable cost identification.
Problem 8-2 (Time 25–35 minutes)Purpose—to provide the student with eight different situations that require analysis to determine theirimpact on inventory, accounts payable, and net sales.
Problem 8-3 (Time 20–25 minutes)Purpose—to provide the student with an opportunity to prepare general journal entries to record pur-chases on a gross and net basis.
Problem 8-4 (Time 30–40 minutes)Purpose—to provide a problem where the student must compute the inventory using a FIFO, specificidentification, and average cost assumption. These inventory value determinations must be made undertwo differing assumptions: (1) perpetual inventory records are kept in units only and (2) perpetualrecords are kept in dollars. Many detailed computations must be made in this problem.
Problem 8-5 (Time 25–35 minutes)Purpose—to provide a problem where the student must compute the inventory using a FIFO andaverage cost assumption. These inventory value determinations must be made under two differingassumptions: (1) perpetual inventory records are kept in units only and (2) perpetual records are kept indollars. This problem is very similar to Problem 8-4, except that the differences in inventory values mustbe explained.
Problem 8-6 (Time 20–25 minutes)Purpose—to provide a problem where the student must compute cost of goods sold using FIFO andaverage cost, under both a periodic and perpetual system.
*Problem 8-7 (Time 40–55 minutes)Purpose—to provide a problem where the student must compute the inventory using a FIFO, LIFO, andaverage cost assumption. These inventory value determinations must be made under two differingassumptions: (1) perpetual inventory records are kept in units only and (2) perpetual records are kept indollars. Many detailed computations must be made in this problem.
*Problem 8-8 (Time 40–55 minutes)Purpose—to provide a problem where the student must compute the inventory using a FIFO, LIFO, andaverage cost assumption. These inventory value determinations must be made under two differingassumptions: (1) perpetual inventory records are kept in units only and (2) perpetual records are kept indollars. This problem is very similar to Problem 8-7, except that the differences in inventory values mustbe explained.
*Problem 8-9 (Time 25–35 minutes)Purpose—to provide a problem where the student must compute cost of goods sold using FIFO, LIFO,and weighted average, under both a periodic and perpetual system.
*Problem 8-10 (Time 30–40 minutes)Purpose—to provide a problem where the student must identify the accounts that would be affected ifLIFO had been used rather than FIFO for purposes of computing inventories.
Copyright © 2011 John Wiley & Sons, Inc. Kieso, IFRS, 1/e, Solutions Manual (For Instructor Use Only) 8-41
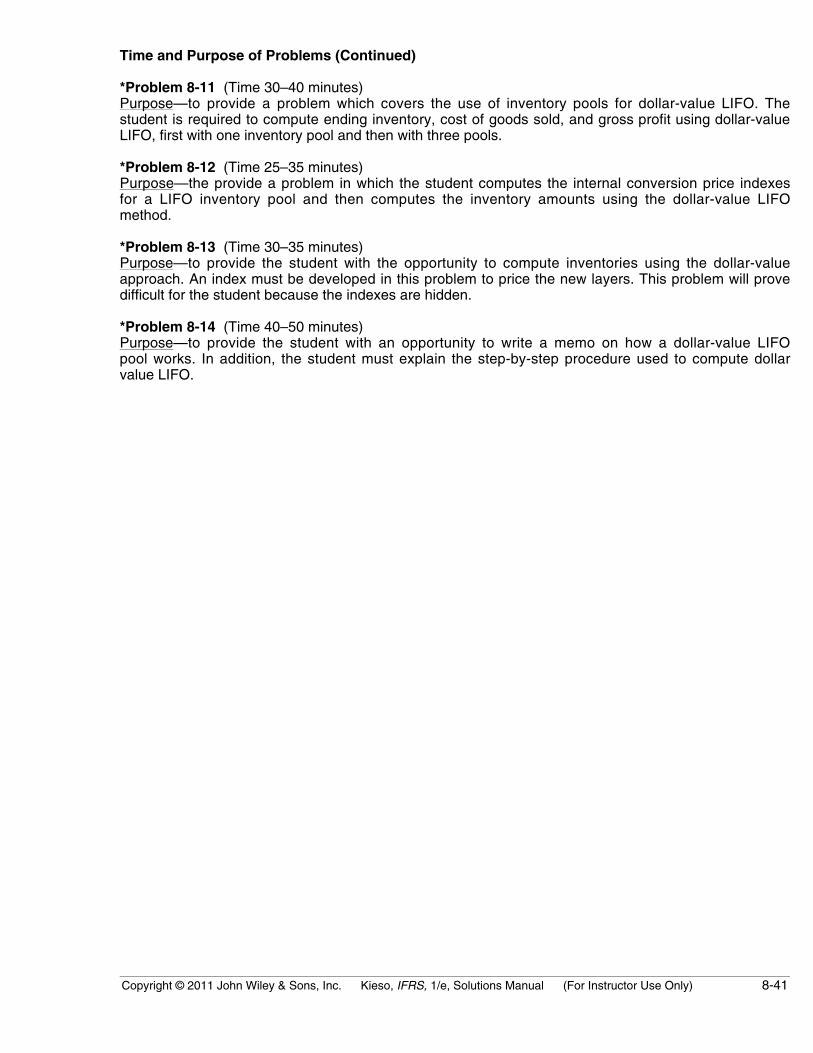
Time and Purpose of Problems (Continued)
*Problem 8-11 (Time 30–40 minutes)Purpose—to provide a problem which covers the use of inventory pools for dollar-value LIFO. Thestudent is required to compute ending inventory, cost of goods sold, and gross profit using dollar-valueLIFO, first with one inventory pool and then with three pools.
*Problem 8-12 (Time 25–35 minutes)Purpose—the provide a problem in which the student computes the internal conversion price indexesfor a LIFO inventory pool and then computes the inventory amounts using the dollar-value LIFOmethod.
*Problem 8-13 (Time 30–35 minutes)Purpose—to provide the student with the opportunity to compute inventories using the dollar-valueapproach. An index must be developed in this problem to price the new layers. This problem will provedifficult for the student because the indexes are hidden.
*Problem 8-14 (Time 40–50 minutes)Purpose—to provide the student with an opportunity to write a memo on how a dollar-value LIFOpool works. In addition, the student must explain the step-by-step procedure used to compute dollarvalue LIFO.

8-42 Copyright © 2011 John Wiley & Sons, Inc. Kieso, IFRS, 1/e, Solutions Manual (For Instructor Use Only)
SOLUTIONS TO PROBLEMS
PROBLEM 8-1
1. $175,000 – ($175,000 X .20) = $140,000;$140,000 – ($140,000 X .10) = $126,000, cost of goods purchased
2. $1,100,000 + $69,000 = $1,169,000. The $69,000 of goods in transit onwhich title had passed on December 24 (f.o.b. shipping point) shouldbe added to 12/31/10 inventory. The $29,000 of goods shipped (f.o.b.shipping point) on January 3, 2011, should remain part of the 12/31/10inventory.
3. Because no date was associated with the units issued or sold, theperiodic (rather than perpetual) inventory method must be assumed.
FIFO inventory cost: 1,000 units at $24 $ 24,0001,000 units at 23 23,000 Total $ 47,000
Average cost: 1,500 at $21 $ 31,5002,000 at 22 44,0003,500 at 23 80,5001,000 at 24 24,000
Totals 8,000 $180,000
$180,000 ÷ 8,000 = $22.50
Ending inventory (2,000 X $22.50) is $45,000.

Copyright © 2011 John Wiley & Sons, Inc. Kieso, IFRS, 1/e, Solutions Manual (For Instructor Use Only) 8-43
PROBLEM 8-1 (Continued)
4. The inventoriable costs for 2011 are:
Merchandise purchased ........................................ $909,400Add: Freight-in......................................................... 22,000
931,400Deduct: Purchase returns.................................... $16,500 Purchase discounts .............................. 6,800 23,300Inventoriable cost .................................................... $908,100
8-44 Copyright © 2011 John Wiley & Sons, Inc. Kieso, IFRS, 1/e, Solutions Manual (For Instructor Use Only)
PROBLEM 8-2
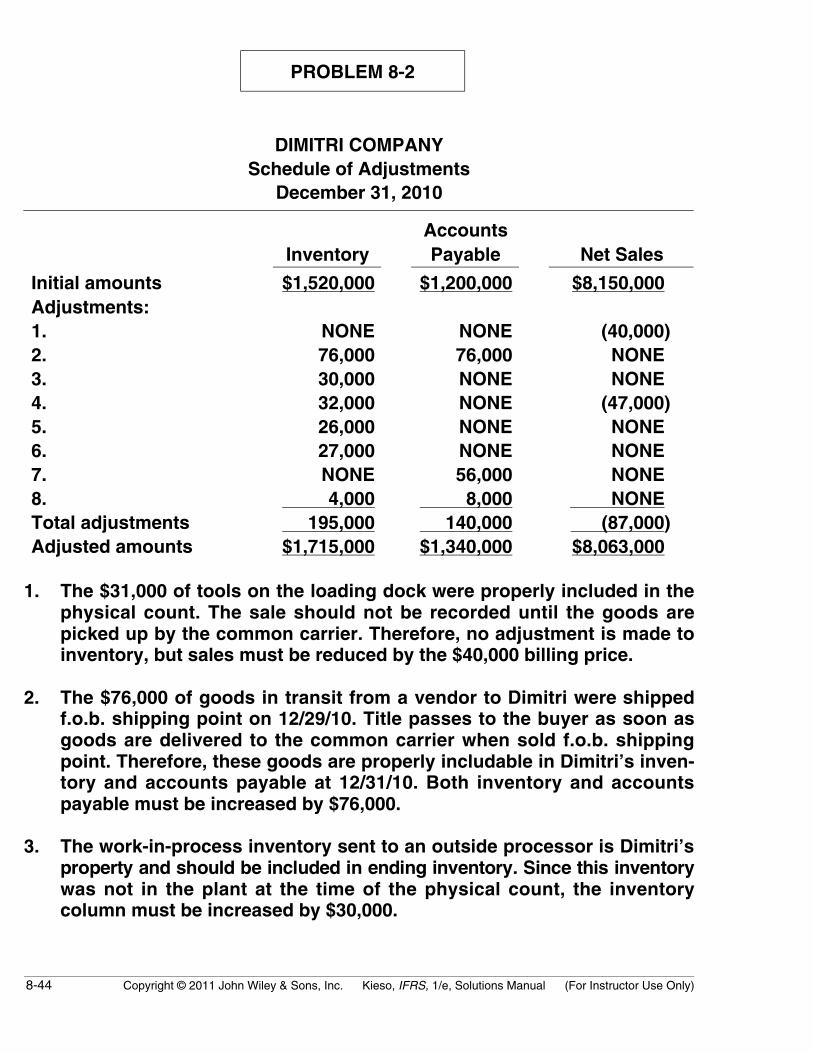
DIMITRI COMPANYSchedule of Adjustments
December 31, 2010
InventoryAccountsPayable Net Sales
Initial amounts $1,520,000 $1,200,000 $8,150,000Adjustments:1. NONE NONE (40,000)2. 76,000 76,000 NONE3. 30,000 NONE NONE4. 32,000 NONE (47,000)5. 26,000 NONE NONE6. 27,000 NONE NONE7. NONE 56,000 NONE8. 4,000 8,000 NONETotal adjustments 195,000 140,000 (87,000)Adjusted amounts $1,715,000 $1,340,000 $8,063,000
1. The $31,000 of tools on the loading dock were properly included in thephysical count. The sale should not be recorded until the goods arepicked up by the common carrier. Therefore, no adjustment is made toinventory, but sales must be reduced by the $40,000 billing price.
2. The $76,000 of goods in transit from a vendor to Dimitri were shippedf.o.b. shipping point on 12/29/10. Title passes to the buyer as soon asgoods are delivered to the common carrier when sold f.o.b. shippingpoint. Therefore, these goods are properly includable in Dimitri’s inven-tory and accounts payable at 12/31/10. Both inventory and accountspayable must be increased by $76,000.
3. The work-in-process inventory sent to an outside processor is Dimitri’sproperty and should be included in ending inventory. Since this inventorywas not in the plant at the time of the physical count, the inventorycolumn must be increased by $30,000.
Copyright © 2011 John Wiley & Sons, Inc. Kieso, IFRS, 1/e, Solutions Manual (For Instructor Use Only) 8-45
PROBLEM 8-2 (Continued)
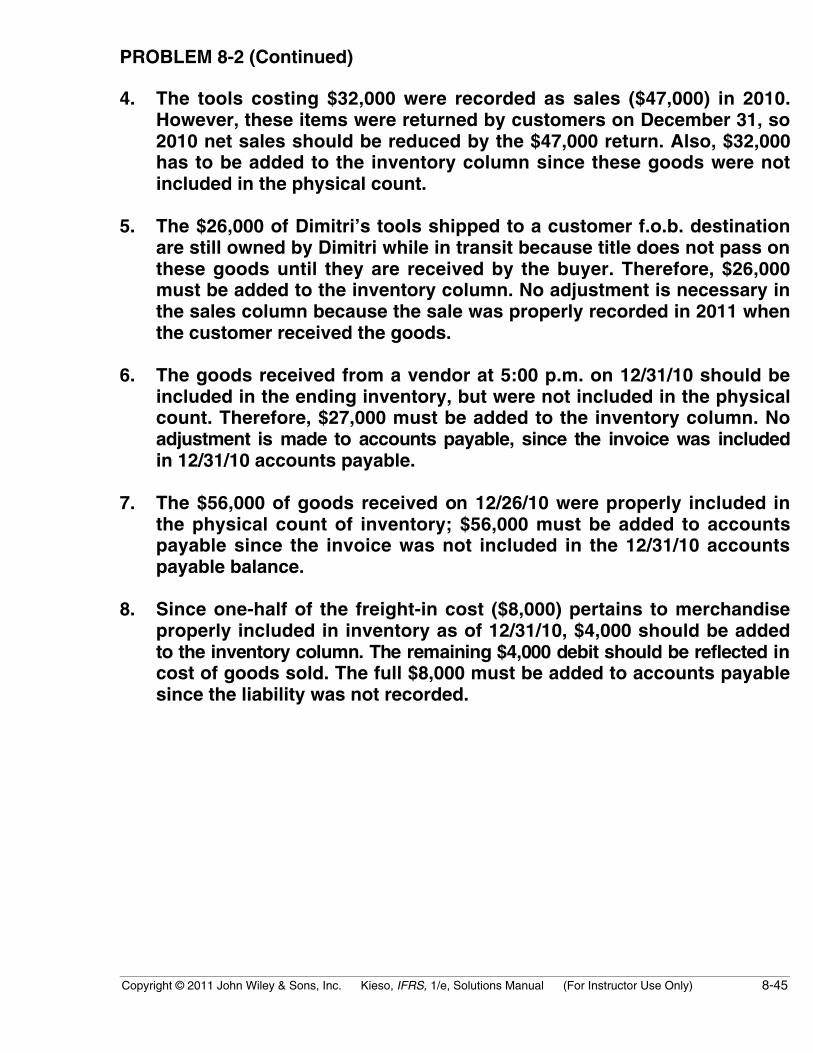
4. The tools costing $32,000 were recorded as sales ($47,000) in 2010.However, these items were returned by customers on December 31, so2010 net sales should be reduced by the $47,000 return. Also, $32,000has to be added to the inventory column since these goods were notincluded in the physical count.
5. The $26,000 of Dimitri’s tools shipped to a customer f.o.b. destinationare still owned by Dimitri while in transit because title does not pass onthese goods until they are received by the buyer. Therefore, $26,000must be added to the inventory column. No adjustment is necessary inthe sales column because the sale was properly recorded in 2011 whenthe customer received the goods.
6. The goods received from a vendor at 5:00 p.m. on 12/31/10 should beincluded in the ending inventory, but were not included in the physicalcount. Therefore, $27,000 must be added to the inventory column. Noadjustment is made to accounts payable, since the invoice was includedin 12/31/10 accounts payable.
7. The $56,000 of goods received on 12/26/10 were properly included inthe physical count of inventory; $56,000 must be added to accountspayable since the invoice was not included in the 12/31/10 accountspayable balance.
8. Since one-half of the freight-in cost ($8,000) pertains to merchandiseproperly included in inventory as of 12/31/10, $4,000 should be addedto the inventory column. The remaining $4,000 debit should be reflected incost of goods sold. The full $8,000 must be added to accounts payablesince the liability was not recorded.
8-46 Copyright © 2011 John Wiley & Sons, Inc. Kieso, IFRS, 1/e, Solutions Manual (For Instructor Use Only)
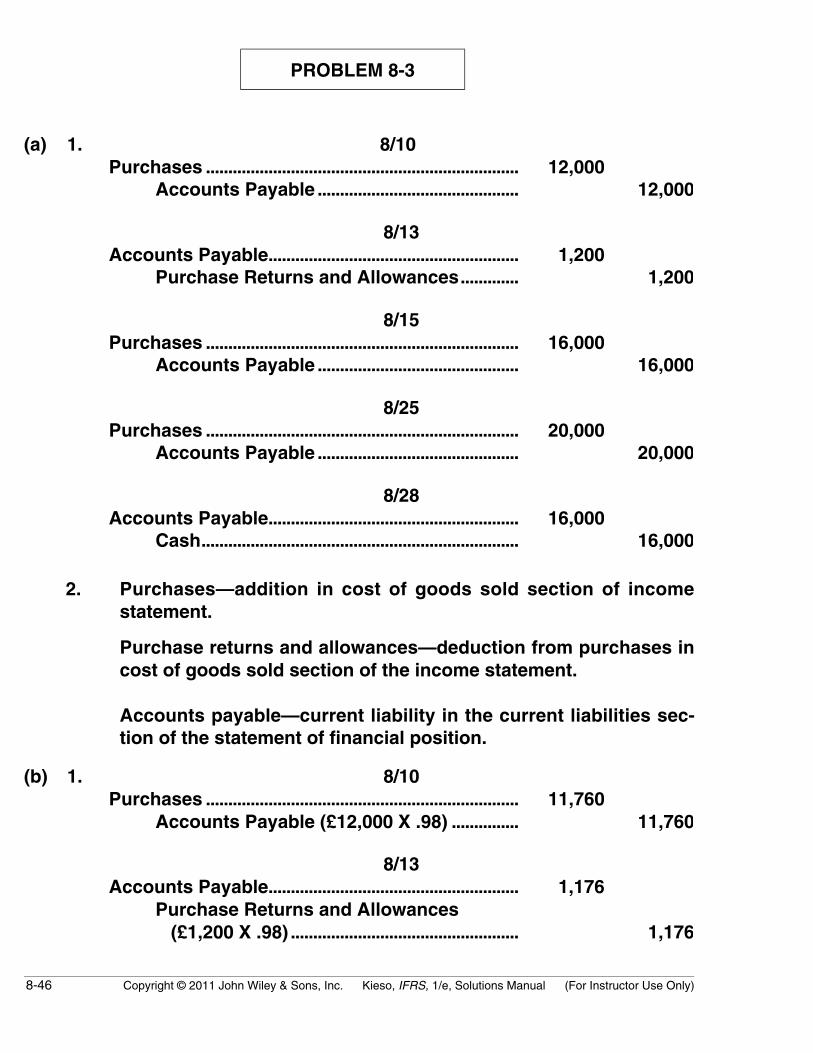
PROBLEM 8-3
(a) 1. 8/10Purchases ...................................................................... 12,000
Accounts Payable ............................................. 12,000
8/13Accounts Payable........................................................ 1,200
Purchase Returns and Allowances............. 1,200
8/15Purchases ...................................................................... 16,000
Accounts Payable ............................................. 16,000
8/25Purchases ...................................................................... 20,000
Accounts Payable ............................................. 20,000
8/28Accounts Payable........................................................ 16,000
Cash....................................................................... 16,000
2. Purchases—addition in cost of goods sold section of incomestatement.
Purchase returns and allowances—deduction from purchases incost of goods sold section of the income statement.
Accounts payable—current liability in the current liabilities sec-tion of the statement of financial position.
(b) 1. 8/10Purchases ...................................................................... 11,760
Accounts Payable (£12,000 X .98) ............... 11,760
8/13Accounts Payable........................................................ 1,176
Purchase Returns and Allowances (£1,200 X .98) ................................................... 1,176
Copyright © 2011 John Wiley & Sons, Inc. Kieso, IFRS, 1/e, Solutions Manual (For Instructor Use Only) 8-47
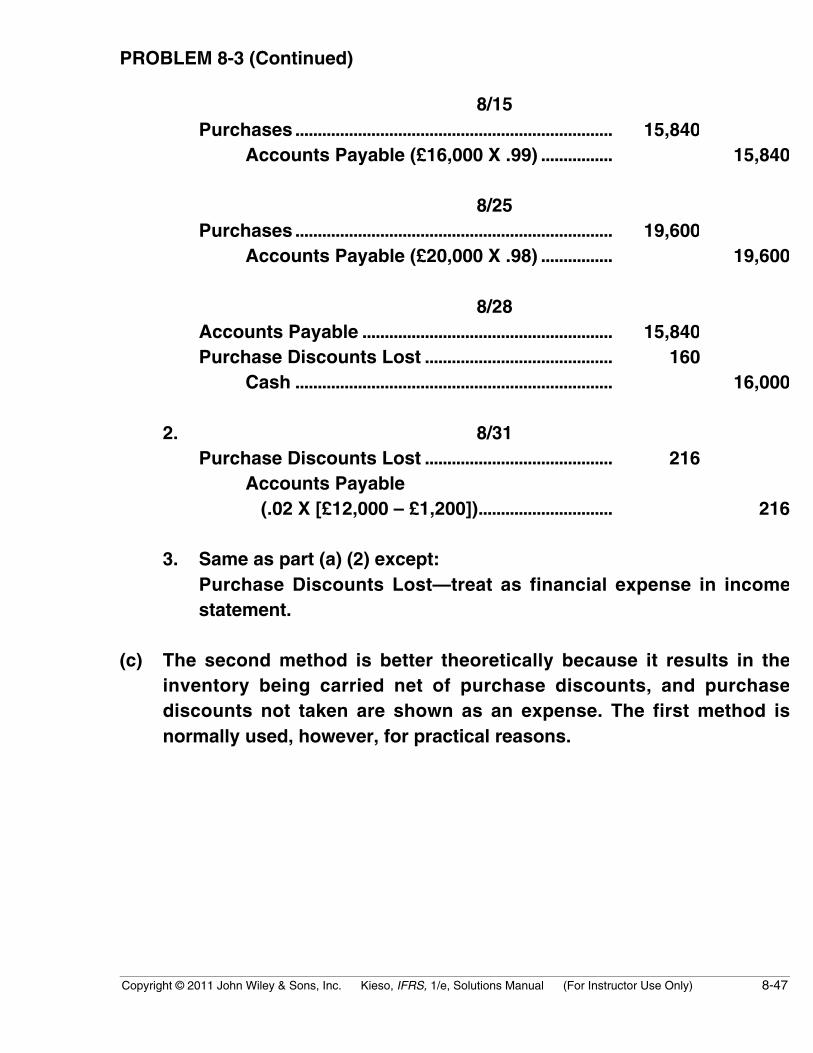
PROBLEM 8-3 (Continued)
8/15Purchases ....................................................................... 15,840
Accounts Payable (£16,000 X .99) ................ 15,840
8/25Purchases ....................................................................... 19,600
Accounts Payable (£20,000 X .98) ................ 19,600
8/28Accounts Payable ........................................................ 15,840Purchase Discounts Lost .......................................... 160
Cash ....................................................................... 16,000
2. 8/31Purchase Discounts Lost .......................................... 216
Accounts Payable (.02 X [£12,000 – £1,200]).............................. 216
3. Same as part (a) (2) except:Purchase Discounts Lost—treat as financial expense in incomestatement.
(c) The second method is better theoretically because it results in theinventory being carried net of purchase discounts, and purchasediscounts not taken are shown as an expense. The first method isnormally used, however, for practical reasons.
8-48 Copyright © 2011 John Wiley & Sons, Inc. Kieso, IFRS, 1/e, Solutions Manual (For Instructor Use Only)
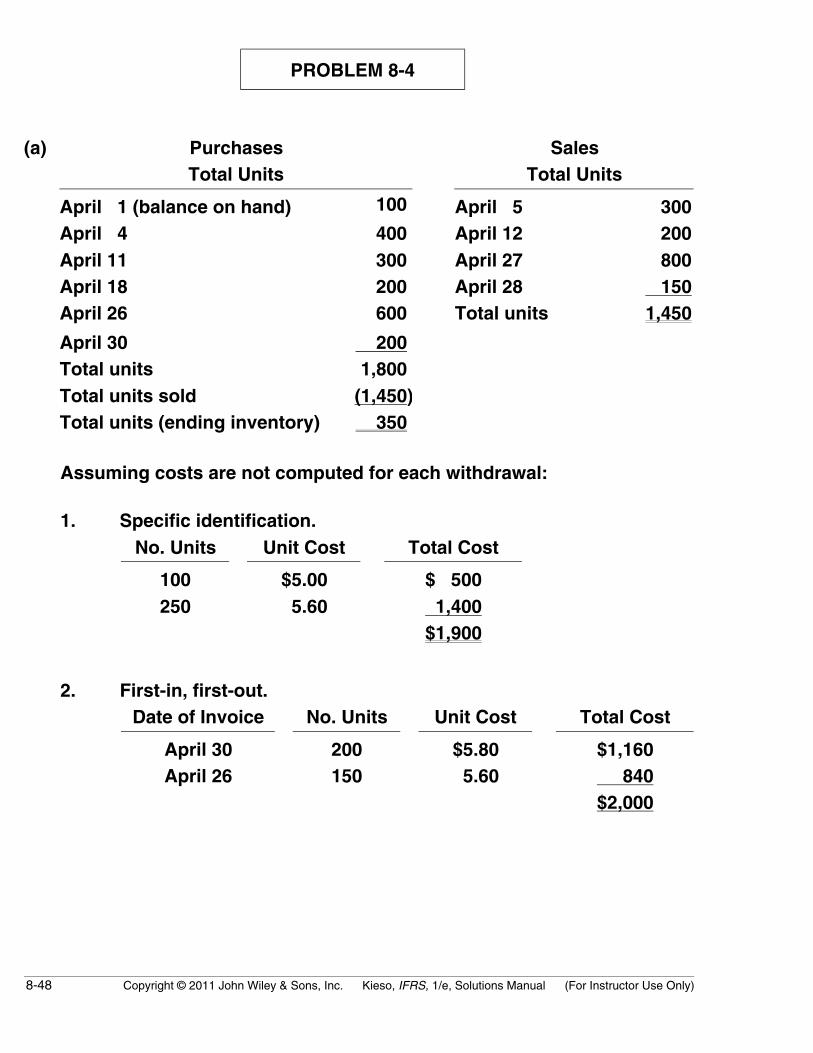
PROBLEM 8-4
(a) PurchasesTotal Units
SalesTotal Units
April 1 (balance on hand) 100 April 5 300April 4 400 April 12 200April 11 300 April 27 800April 18 200 April 28 150April 26 600 Total units 1,450
April 30 200Total units 1,800Total units sold (1,450)Total units (ending inventory) 350
Assuming costs are not computed for each withdrawal:
1. Specific identification.No. Units Unit Cost Total Cost
100 $5.00 $ 500250 5.60 1,400
$1,900
2. First-in, first-out.Date of Invoice No. Units Unit Cost Total Cost
April 30 200 $5.80 $1,160April 26 150 5.60 840
$2,000
Copyright © 2011 John Wiley & Sons, Inc. Kieso, IFRS, 1/e, Solutions Manual (For Instructor Use Only) 8-49
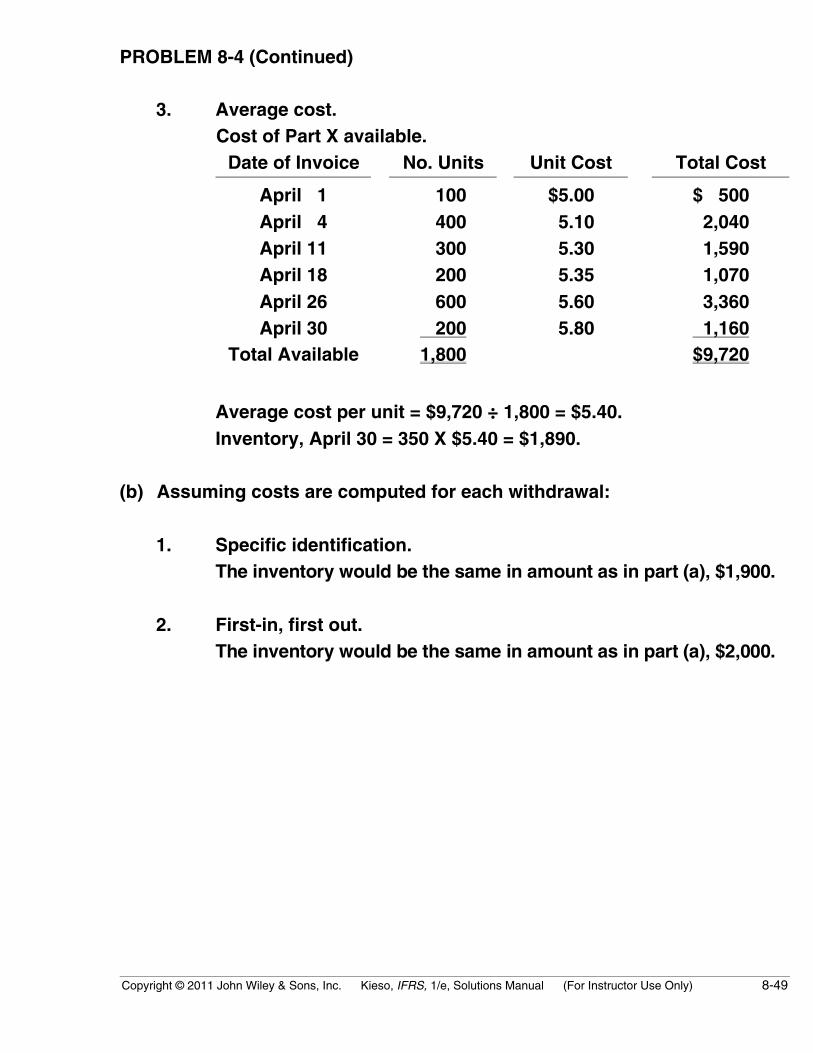
PROBLEM 8-4 (Continued)
3. Average cost.Cost of Part X available.
Date of Invoice No. Units Unit Cost Total Cost
April 1 100 $5.00 $ 500April 4 400 5.10 2,040April 11 300 5.30 1,590April 18 200 5.35 1,070April 26 600 5.60 3,360April 30 200 5.80 1,160
Total Available 1,800 $9,720
Average cost per unit = $9,720 ÷ 1,800 = $5.40.Inventory, April 30 = 350 X $5.40 = $1,890.
(b) Assuming costs are computed for each withdrawal:
1. Specific identification.The inventory would be the same in amount as in part (a), $1,900.
2. First-in, first out.The inventory would be the same in amount as in part (a), $2,000.
8-50 Copyright © 2011 John Wiley & Sons, Inc. Kieso, IFRS, 1/e, Solutions Manual (For Instructor Use Only)
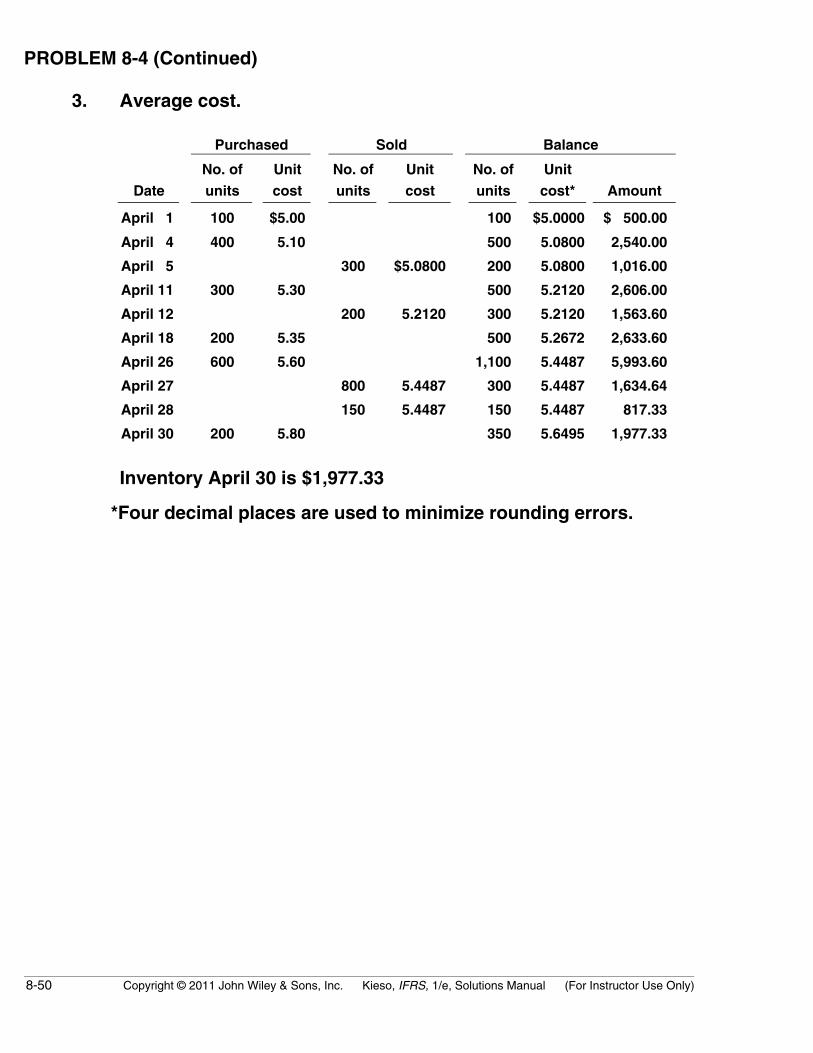
PROBLEM 8-4 (Continued)
3. Average cost.
Purchased Sold Balance
Date
No. of
units
Unit
cost
No. of
units
Unit
cost
No. of
units
Unit
cost* Amount
April 1 100 $5.00 100 $5.0000 $ 500.00
April 4 400 5.10 500 5.0800 2,540.00
April 5 300 $5.0800 200 5.0800 1,016.00
April 11 300 5.30 500 5.2120 2,606.00
April 12 200 5.2120 300 5.2120 1,563.60
April 18 200 5.35 500 5.2672 2,633.60
April 26 600 5.60 1,100 5.4487 5,993.60
April 27 800 5.4487 300 5.4487 1,634.64
April 28 150 5.4487 150 5.4487 817.33
April 30 200 5.80 350 5.6495 1,977.33
Inventory April 30 is $1,977.33
*Four decimal places are used to minimize rounding errors.

Copyright © 2011 John Wiley & Sons, Inc. Kieso, IFRS, 1/e, Solutions Manual (For Instructor Use Only) 8-51
PROBLEM 8-5
(a) Assuming costs are not computed for each withdrawal (units received,5,700, minus units issued, 4,700, equals ending inventory at 1,000 units):
1. First-in, first-out.Date of Invoice No. Units Unit Cost Total Cost
Jan. 28 1,000 ¥3.50 ¥3,500
2. Average cost.Cost of goods available:
Date of Invoice No. Units Unit Cost Total Cost
Jan. 2 1,200 ¥3.00 ¥ 3,600Jan. 10 600 3.20 1,920Jan. 18 1,000 3.30 3,300Jan. 23 1,300 3.40 4,420Jan. 28 1,600 3.50 5,600
Total Available 5,700 ¥18,840
Average cost per unit = ¥18,840 ÷ 5,700 = ¥3.31 (rounded)Cost of inventory Jan. 31 = 1,000 X ¥3.31 = ¥3,310
(b) Assuming costs are computed at the time of each withdrawal:
Under FIFO—Yes. The amount shown as ending inventory would bethe same as in (a) above. In each case the units on hand would beassumed to be part of those purchased on Jan. 28.
Under Average Cost—No. A new average cost would be computedeach time a withdrawal was made instead of only once for all itemspurchased during the year.
8-52 Copyright © 2011 John Wiley & Sons, Inc. Kieso, IFRS, 1/e, Solutions Manual (For Instructor Use Only)
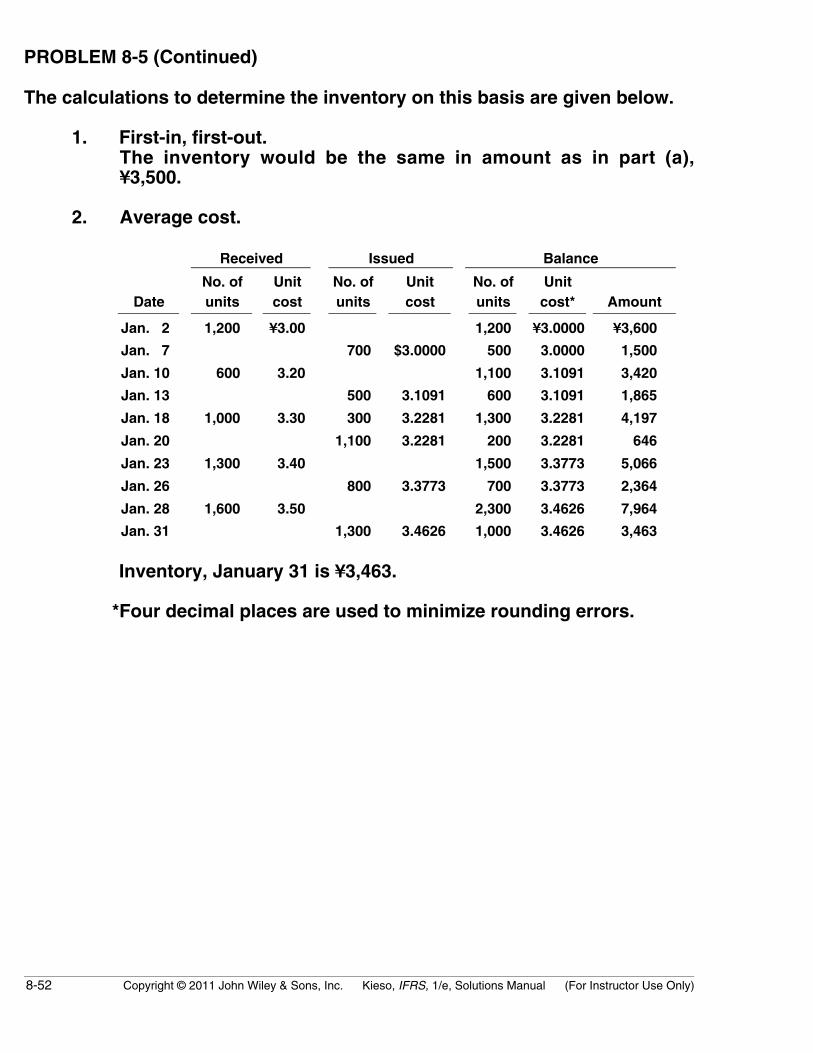
PROBLEM 8-5 (Continued)
The calculations to determine the inventory on this basis are given below.
1. First-in, first-out.The inventory would be the same in amount as in part (a),¥3,500.
2. Average cost.
Received Issued Balance
DateNo. ofunits
Unitcost
No. ofunits
Unitcost
No. ofunits
Unitcost* Amount
Jan. 2 1,200 ¥3.00 1,200 ¥3.0000 ¥3,600
Jan. 7 700 $3.0000 500 3.0000 1,500
Jan. 10 600 3.20 1,100 3.1091 3,420
Jan. 13 500 3.1091 600 3.1091 1,865
Jan. 18 1,000 3.30 300 3.2281 1,300 3.2281 4,197
Jan. 20 1,100 3.2281 200 3.2281 646
Jan. 23 1,300 3.40 1,500 3.3773 5,066
Jan. 26 800 3.3773 700 3.3773 2,364
Jan. 28 1,600 3.50 2,300 3.4626 7,964
Jan. 31 1,300 3.4626 1,000 3.4626 3,463
Inventory, January 31 is ¥3,463.
*Four decimal places are used to minimize rounding errors.
Copyright © 2011 John Wiley & Sons, Inc. Kieso, IFRS, 1/e, Solutions Manual (For Instructor Use Only) 8-53
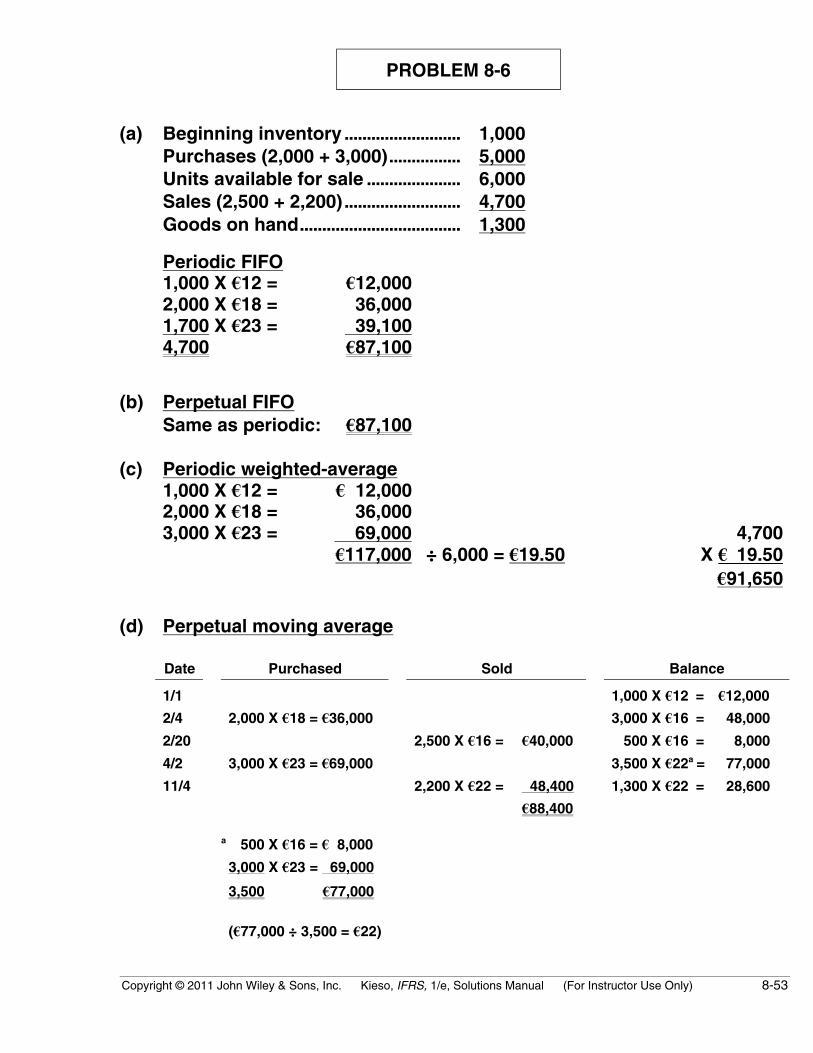
PROBLEM 8-6
(a) Beginning inventory .......................... 1,000Purchases (2,000 + 3,000)................ 5,000Units available for sale ..................... 6,000Sales (2,500 + 2,200).......................... 4,700Goods on hand.................................... 1,300
Periodic FIFO1,000 X €12 = €12,0002,000 X €18 = 36,0001,700 X €23 = 39,1004,700 €87,100
(b) Perpetual FIFOSame as periodic: €87,100
(c) Periodic weighted-average1,000 X €12 = € 12,0002,000 X €18 = 36,0003,000 X €23 = 69,000 4,700
€117,000 ÷ 6,000 = €19.50 X € 19.50€91,650
(d) Perpetual moving average
Date Purchased Sold Balance
1/1 1,000 X €12 = €12,000
2/4 2,000 X €18 = €36,000 3,000 X €16 = 48,000
2/20 2,500 X €16 = €40,000 500 X €16 = 8,000
4/2 3,000 X €23 = €69,000 3,500 X €22a = 77,000
11/4 2,200 X €22 = 48,400 1,300 X €22 = 28,600
€88,400
a 500 X €16 = € 8,000
3,000 X €23 = 69,000
3,500 €77,000
(€77,000 ÷ 3,500 = €22)
8-54 Copyright © 2011 John Wiley & Sons, Inc. Kieso, IFRS, 1/e, Solutions Manual (For Instructor Use Only)
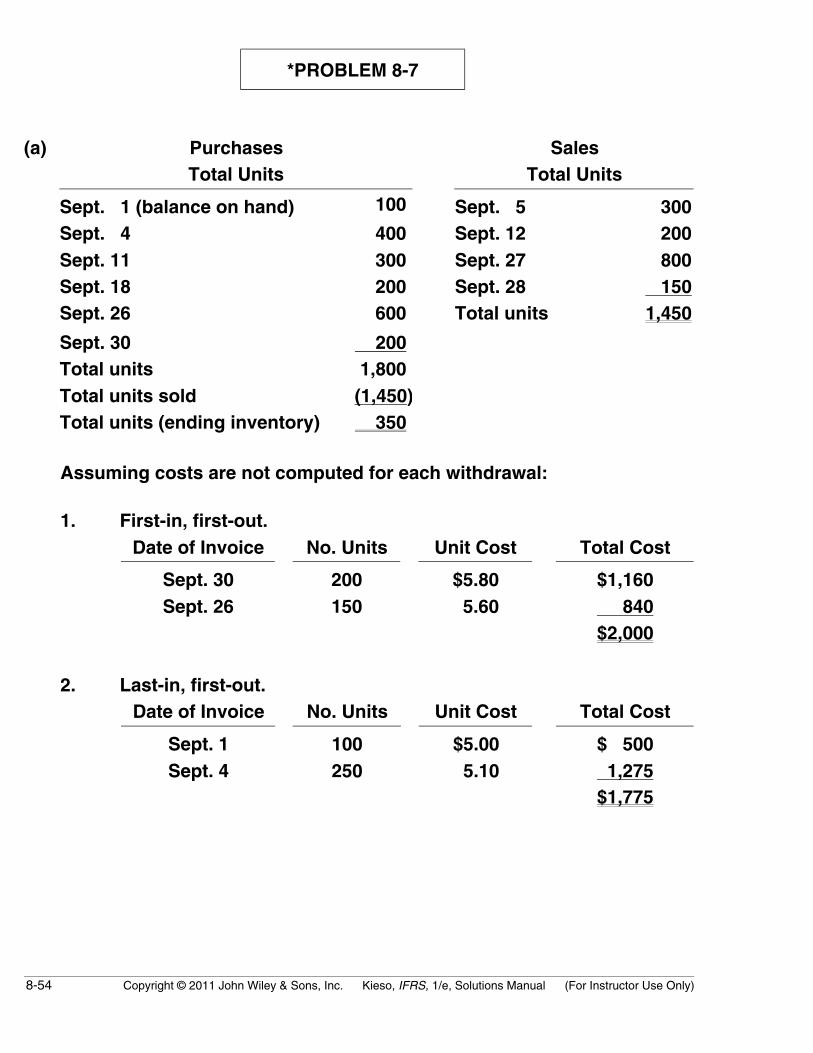
*PROBLEM 8-7
(a) PurchasesTotal Units
SalesTotal Units
Sept. 1 (balance on hand) 100 Sept. 5 300Sept. 4 400 Sept. 12 200Sept. 11 300 Sept. 27 800Sept. 18 200 Sept. 28 150Sept. 26 600 Total units 1,450
Sept. 30 200Total units 1,800Total units sold (1,450)Total units (ending inventory) 350
Assuming costs are not computed for each withdrawal:
1. First-in, first-out.Date of Invoice No. Units Unit Cost Total Cost
Sept. 30 200 $5.80 $1,160Sept. 26 150 5.60 840
$2,000
2. Last-in, first-out.Date of Invoice No. Units Unit Cost Total Cost
Sept. 1 100 $5.00 $ 500Sept. 4 250 5.10 1,275
$1,775
Copyright © 2011 John Wiley & Sons, Inc. Kieso, IFRS, 1/e, Solutions Manual (For Instructor Use Only) 8-55
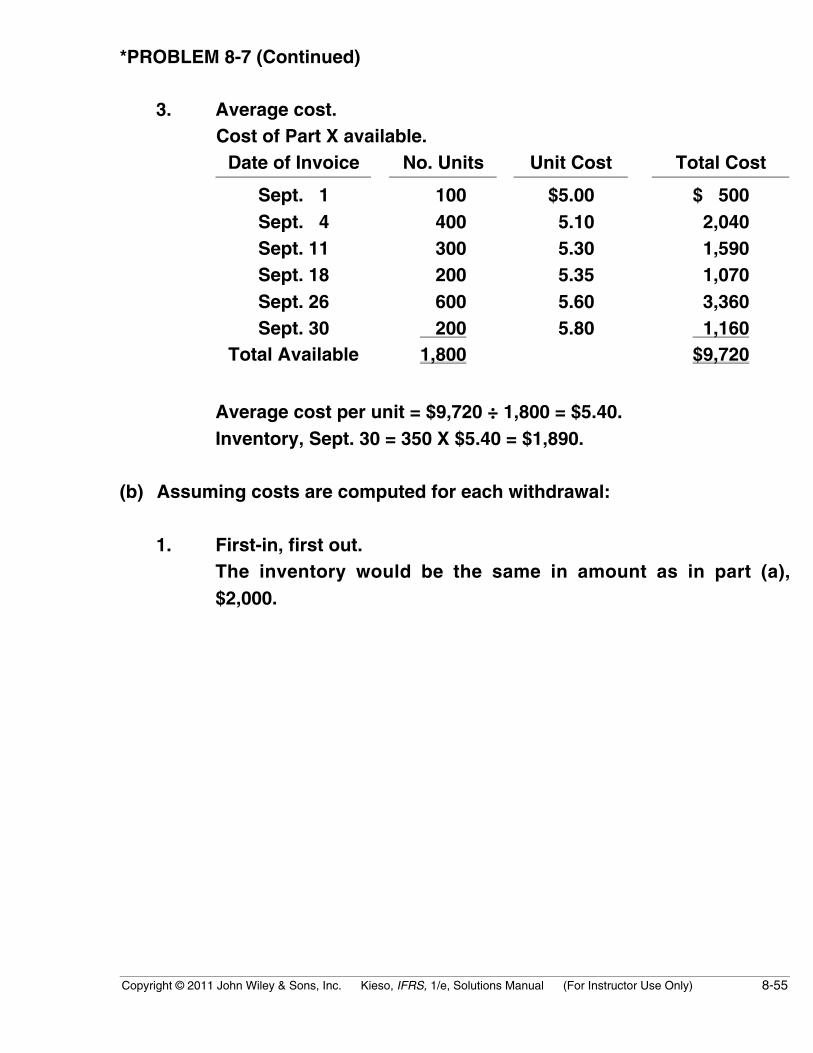
*PROBLEM 8-7 (Continued)
3. Average cost.Cost of Part X available.
Date of Invoice No. Units Unit Cost Total Cost
Sept. 1 100 $5.00 $ 500Sept. 4 400 5.10 2,040Sept. 11 300 5.30 1,590Sept. 18 200 5.35 1,070Sept. 26 600 5.60 3,360Sept. 30 200 5.80 1,160
Total Available 1,800 $9,720
Average cost per unit = $9,720 ÷ 1,800 = $5.40.Inventory, Sept. 30 = 350 X $5.40 = $1,890.
(b) Assuming costs are computed for each withdrawal:
1. First-in, first out.The inventory would be the same in amount as in part (a),$2,000.
8-56 Copyright © 2011 John Wiley & Sons, Inc. Kieso, IFRS, 1/e, Solutions Manual (For Instructor Use Only)
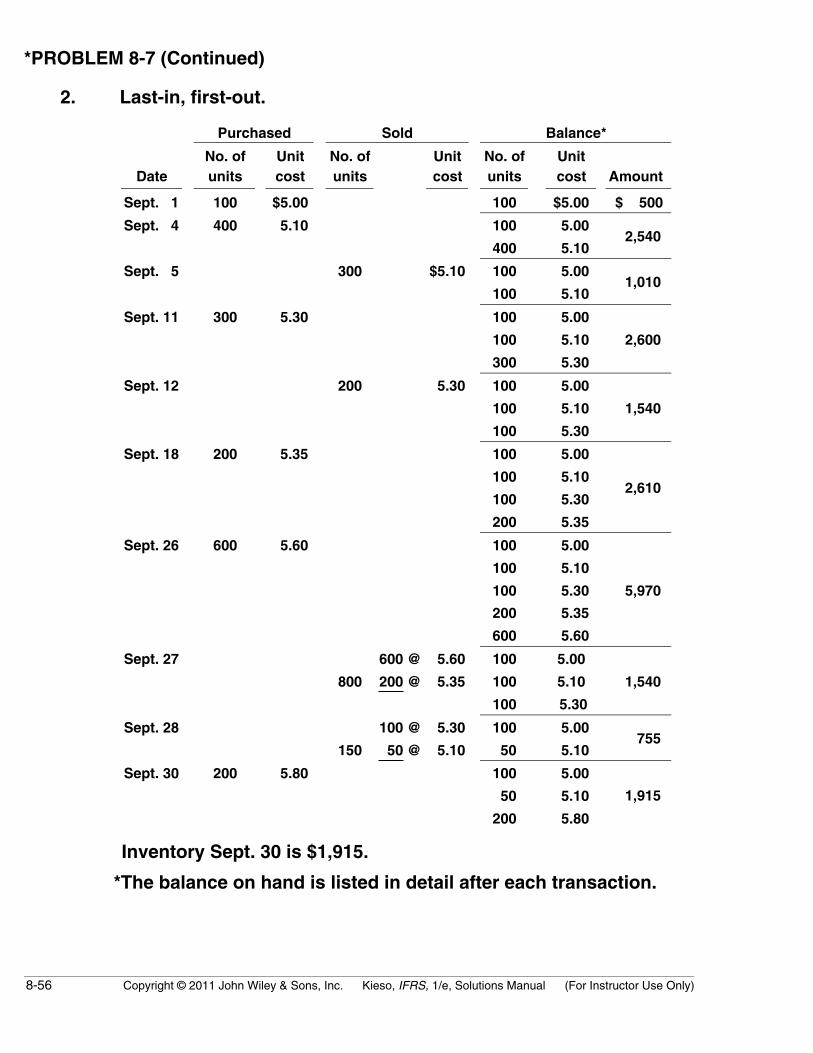
*PROBLEM 8-7 (Continued)
2. Last-in, first-out.
Purchased Sold Balance*
DateNo. ofunits
Unitcost
No. ofunits
Unitcost
No. ofunits
Unitcost Amount
Sept. 1 100 $5.00 100 $5.00 $ 500
Sept. 4 400 5.10 100 5.00
400 5.10 2,540
Sept. 5 300 $5.10 100 5.00
100 5.10 1,010
Sept. 11 300 5.30 100 5.00
100 5.10 2,600
300 5.30
Sept. 12 200 5.30 100 5.00
100 5.10 1,540
100 5.30
Sept. 18 200 5.35 100 5.00
100 5.10
100 5.30 2,610
200 5.35
Sept. 26 600 5.60 100 5.00
100 5.10
100 5.30 5,970
200 5.35
600 5.60
Sept. 27 600 @ 5.60 100 5.00
800 200 @ 5.35 100 5.10 1,540
100 5.30
Sept. 28 100 @ 5.30 100 5.00
150 50 @ 5.10 50 5.10 755
Sept. 30 200 5.80 100 5.00
50 5.10
200 5.80
1,915
Inventory Sept. 30 is $1,915.
*The balance on hand is listed in detail after each transaction.
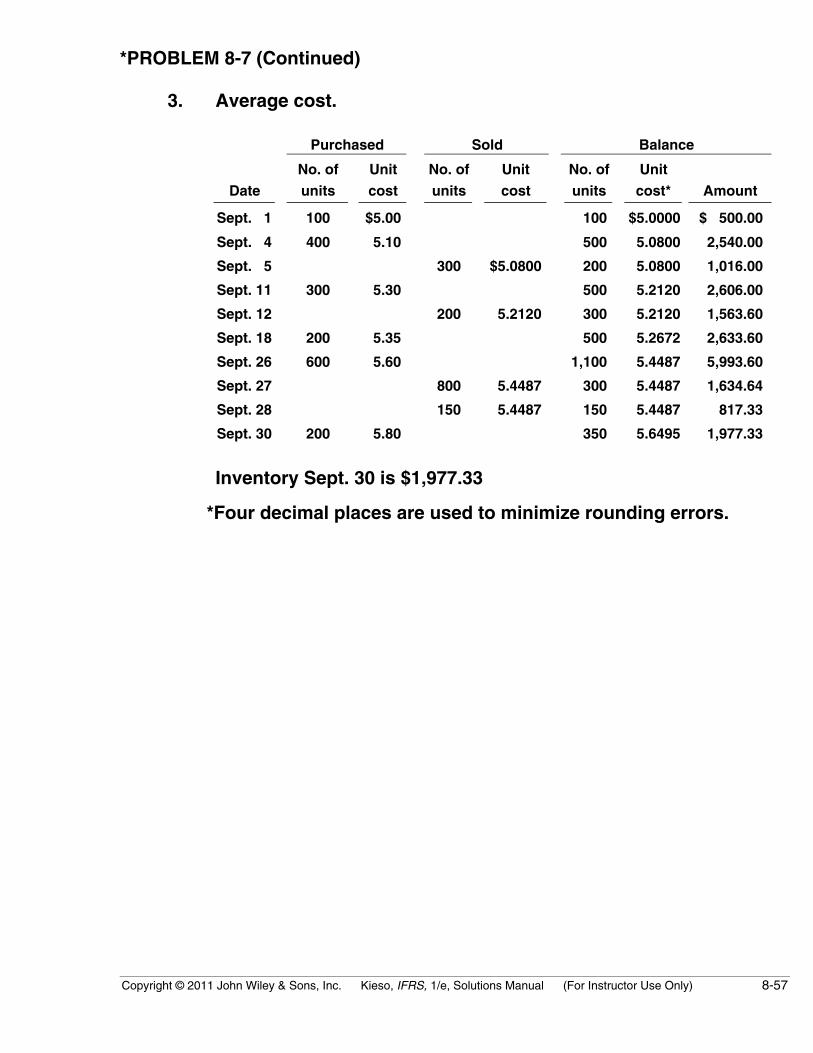
Copyright © 2011 John Wiley & Sons, Inc. Kieso, IFRS, 1/e, Solutions Manual (For Instructor Use Only) 8-57
*PROBLEM 8-7 (Continued)
3. Average cost.
Purchased Sold Balance
Date
No. of
units
Unit
cost
No. of
units
Unit
cost
No. of
units
Unit
cost* Amount
Sept. 1 100 $5.00 100 $5.0000 $ 500.00
Sept. 4 400 5.10 500 5.0800 2,540.00
Sept. 5 300 $5.0800 200 5.0800 1,016.00
Sept. 11 300 5.30 500 5.2120 2,606.00
Sept. 12 200 5.2120 300 5.2120 1,563.60
Sept. 18 200 5.35 500 5.2672 2,633.60
Sept. 26 600 5.60 1,100 5.4487 5,993.60
Sept. 27 800 5.4487 300 5.4487 1,634.64
Sept. 28 150 5.4487 150 5.4487 817.33
Sept. 30 200 5.80 350 5.6495 1,977.33
Inventory Sept. 30 is $1,977.33
*Four decimal places are used to minimize rounding errors.
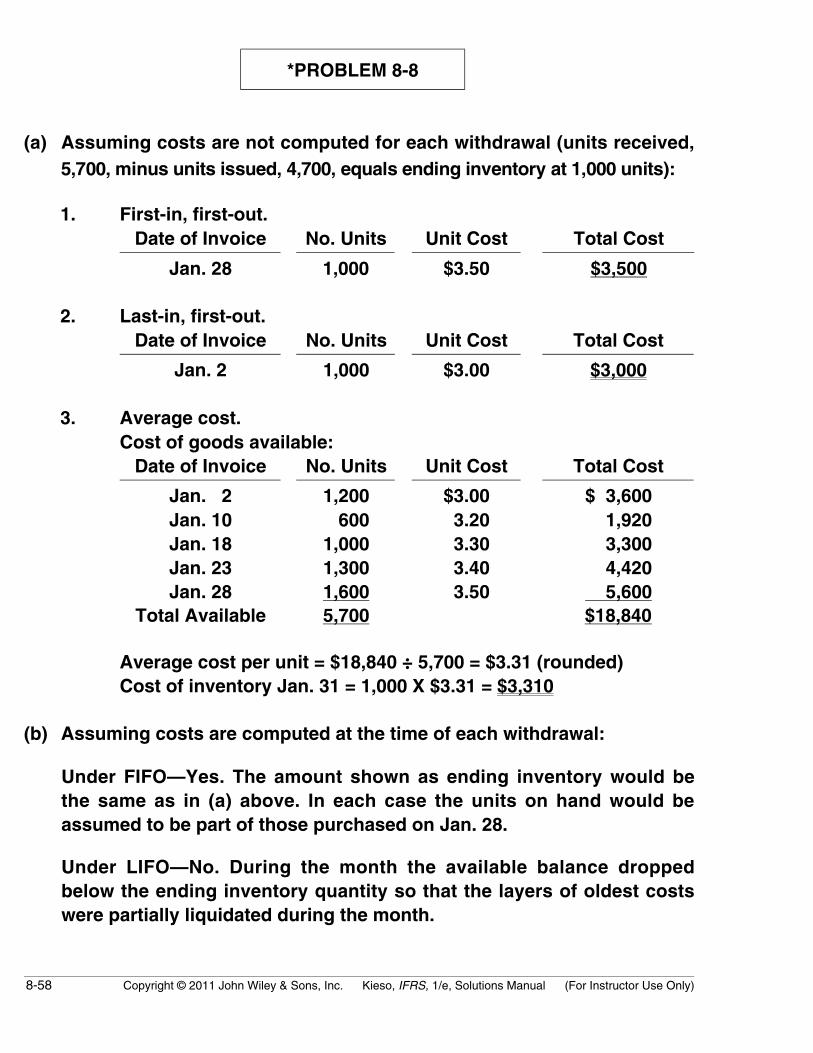
8-58 Copyright © 2011 John Wiley & Sons, Inc. Kieso, IFRS, 1/e, Solutions Manual (For Instructor Use Only)
*PROBLEM 8-8
(a) Assuming costs are not computed for each withdrawal (units received,5,700, minus units issued, 4,700, equals ending inventory at 1,000 units):
1. First-in, first-out.Date of Invoice No. Units Unit Cost Total Cost
Jan. 28 1,000 $3.50 $3,500
2. Last-in, first-out.Date of Invoice No. Units Unit Cost Total Cost
Jan. 2 1,000 $3.00 $3,000
3. Average cost.Cost of goods available:
Date of Invoice No. Units Unit Cost Total Cost
Jan. 2 1,200 $3.00 $ 3,600Jan. 10 600 3.20 1,920Jan. 18 1,000 3.30 3,300Jan. 23 1,300 3.40 4,420Jan. 28 1,600 3.50 5,600
Total Available 5,700 $18,840
Average cost per unit = $18,840 ÷ 5,700 = $3.31 (rounded)Cost of inventory Jan. 31 = 1,000 X $3.31 = $3,310
(b) Assuming costs are computed at the time of each withdrawal:
Under FIFO—Yes. The amount shown as ending inventory would bethe same as in (a) above. In each case the units on hand would beassumed to be part of those purchased on Jan. 28.
Under LIFO—No. During the month the available balance droppedbelow the ending inventory quantity so that the layers of oldest costswere partially liquidated during the month.

Copyright © 2011 John Wiley & Sons, Inc. Kieso, IFRS, 1/e, Solutions Manual (For Instructor Use Only) 8-59
*PROBLEM 8-8 (Continued)
Under Average Cost—No. A new average cost would be computedeach time a withdrawal was made instead of only once for all itemspurchased during the year.
The calculations to determine the inventory on this basis are given below.
1. First-in, first-out.The inventory would be the same in amount as in part (a),$3,500.
2. Last-in, first-out.
Received Issued Balance
DateNo. ofunits
Unitcost
No. ofunits
Unitcost
No. ofunits
Unitcost* Amount
Jan. 2 1,200 $3.00 1,200 $3.00 $3,600
Jan. 7 700 $3.00 500 3.00 1,500
Jan. 10 600 3.20 500 3.00
600 3.20 3,420
Jan. 13 500 3.20 500 3.00
100 3.20 1,820
Jan. 18 1,000 3.30 300 3.30 500 3.00
100 3.20 4,130
700 3.30
Jan. 20 700 3.30
100 3.20
300 3.00 200 3.00 600
Jan. 23 1,300 3.40 200 3.00
1,300 3.40 5,020
Jan. 26 800 3.40 200 3.00
500 3.40 2,300
Jan. 28 1,600 3.50 200 3.00
500 3.40 7,900
1,600 3.50
Jan. 31 1,300 3.50 200 3.00
500 3.40 3,350
300 3.50
Inventory, January 31 is $3,350.
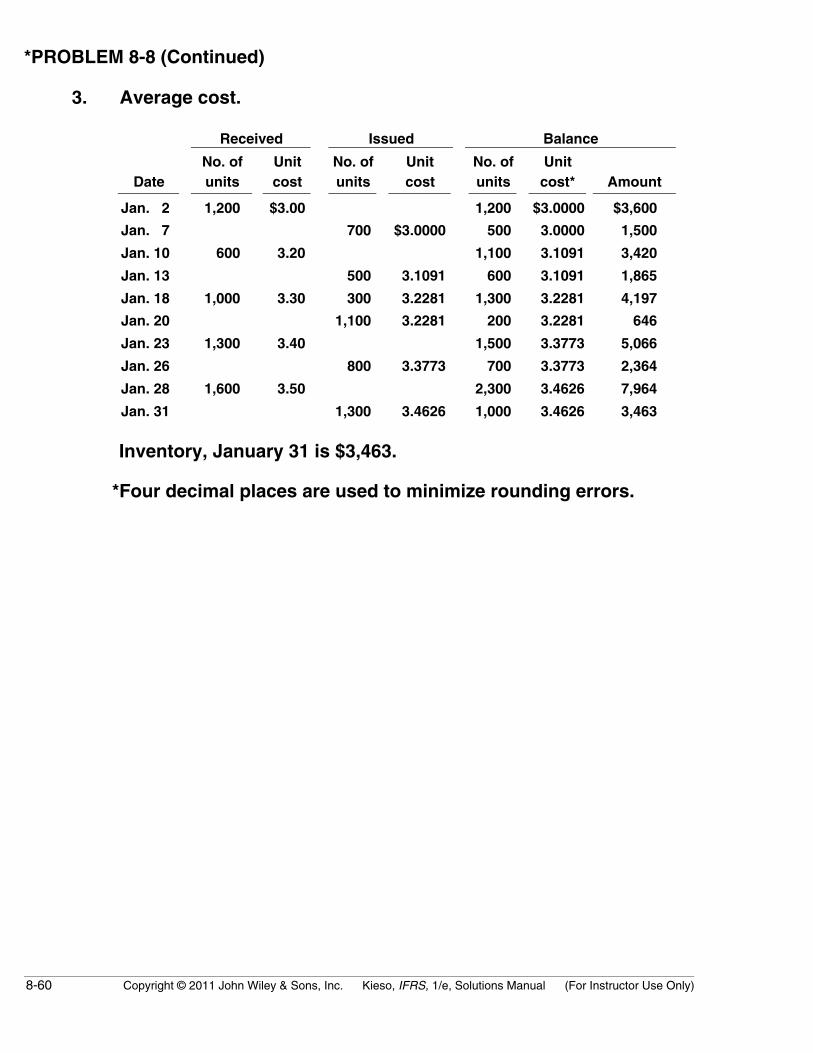
8-60 Copyright © 2011 John Wiley & Sons, Inc. Kieso, IFRS, 1/e, Solutions Manual (For Instructor Use Only)
*PROBLEM 8-8 (Continued)
3. Average cost.
Received Issued Balance
DateNo. ofunits
Unitcost
No. ofunits
Unitcost
No. ofunits
Unitcost* Amount
Jan. 2 1,200 $3.00 1,200 $3.0000 $3,600
Jan. 7 700 $3.0000 500 3.0000 1,500
Jan. 10 600 3.20 1,100 3.1091 3,420
Jan. 13 500 3.1091 600 3.1091 1,865
Jan. 18 1,000 3.30 300 3.2281 1,300 3.2281 4,197
Jan. 20 1,100 3.2281 200 3.2281 646
Jan. 23 1,300 3.40 1,500 3.3773 5,066
Jan. 26 800 3.3773 700 3.3773 2,364
Jan. 28 1,600 3.50 2,300 3.4626 7,964
Jan. 31 1,300 3.4626 1,000 3.4626 3,463
Inventory, January 31 is $3,463.
*Four decimal places are used to minimize rounding errors.

Copyright © 2011 John Wiley & Sons, Inc. Kieso, IFRS, 1/e, Solutions Manual (For Instructor Use Only) 8-61
*PROBLEM 8-9
(a) Beginning inventory .......................... 1,000Purchases (2,000 + 3,000)................ 5,000Units available for sale ..................... 6,000Sales (2,500 + 2,200).......................... 4,700Goods on hand.................................... 1,300
Periodic FIFO1,000 X $12 = $12,0002,000 X $18 = 36,0001,700 X $23 = 39,1004,700 $87,100
(b) Perpetual FIFOSame as periodic: $87,100
(c) Periodic LIFO3,000 X $23 = $69,0001,700 X $18 = 30,6004,700 $99,600
(d) Perpetual LIFO
Date Purchased Sold Balance
1/1 1,000 X $12 = $12,000
2/4 2,000 X $18 = $36,000 1,000 X $12
2,000 X $18} 48,000
2/20 2,000 X $18
500 X $12} $42,000
500 X $12 = 6,000
4/2 3,000 X $23 = $69,000 500 X $12
3,000 X $23} 75,000
11/4 2,200 X $23 = 50,600 500 X $12
_______ 800 X $23} 24,400
$92,600
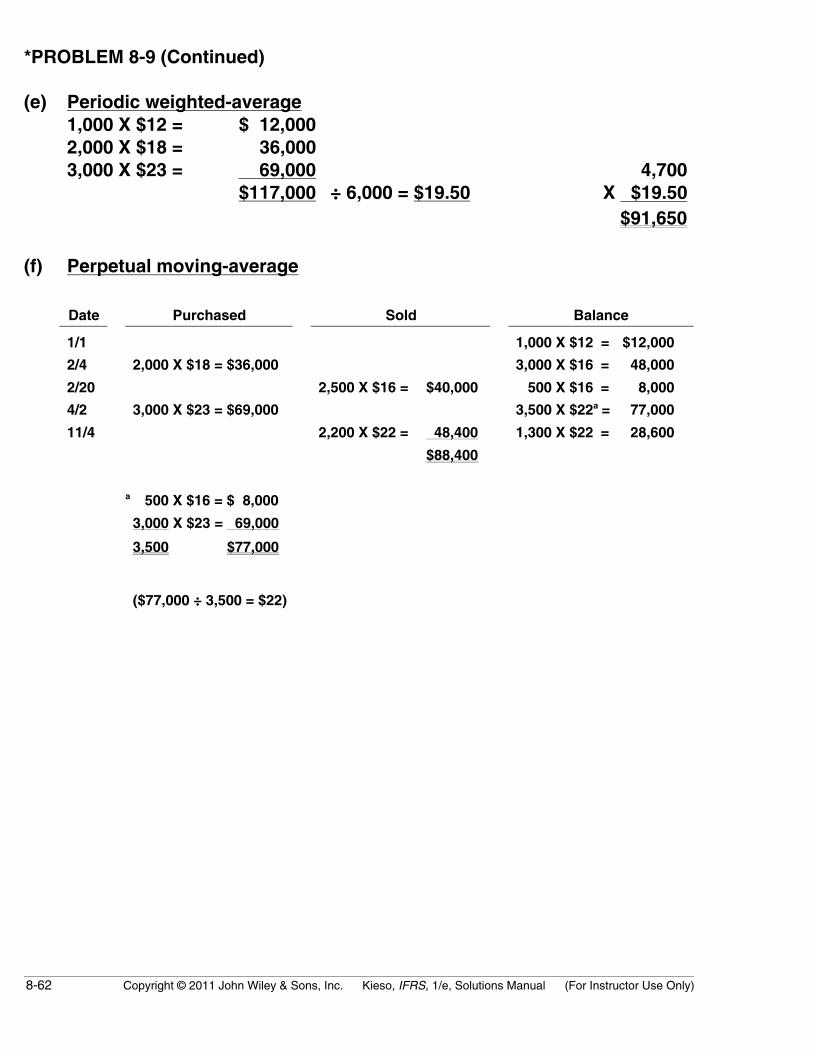
8-62 Copyright © 2011 John Wiley & Sons, Inc. Kieso, IFRS, 1/e, Solutions Manual (For Instructor Use Only)
*PROBLEM 8-9 (Continued)
(e) Periodic weighted-average1,000 X $12 = $ 12,0002,000 X $18 = 36,0003,000 X $23 = 69,000 4,700
$117,000 ÷ 6,000 = $19.50 X $19.50$91,650
(f) Perpetual moving-average
Date Purchased Sold Balance
1/1 1,000 X $12 = $12,000
2/4 2,000 X $18 = $36,000 3,000 X $16 = 48,000
2/20 2,500 X $16 = $40,000 500 X $16 = 8,000
4/2 3,000 X $23 = $69,000 3,500 X $22a = 77,000
11/4 2,200 X $22 = 48,400 1,300 X $22 = 28,600
$88,400
a 500 X $16 = $ 8,000
3,000 X $23 = 69,000
3,500 $77,000
($77,000 ÷ 3,500 = $22)

Copyright © 2011 John Wiley & Sons, Inc. Kieso, IFRS, 1/e, Solutions Manual (For Instructor Use Only) 8-63
*PROBLEM 8-10
The accounts in the 2011 financial statements which would be affected bya change to LIFO and the new amount for each of the accounts are asfollows:
AccountNew amount
for 2011(1) Cash $176,400(2) Inventory 120,000(3) Retained earnings 226,400(4) Cost of goods sold 792,000(5) Income taxes 101,600
The calculations for both 2010 and 2011 to support the conversion to LIFOare presented below.
Income for the Years Ended 12/31/10 12/31/11
Sales $900,000 $1,350,000Less: Cost of goods sold 525,000 792,000 Other expenses 205,000 304,000
730,000 1,096,000Income before taxes 170,000 254,000Income taxes (40%) 68,000 101,600 Net income $102,000 $ 152,400
Cost of Good Sold andEnding Inventory for the Years Ended 12/31/10 12/31/11
Beginning inventory ( 40,000 X $3.00) $120,000 ( 40,000 X $3.00) $120,000Purchases (150,000 X $3.50) 525,000 (180,000 X $4.40) 792,000Cost of goods available 645,000 912,000Ending inventory ( 40,000 X $3.00) (120,000) ( 40,000 X $3.00) (120,000) Cost of goods sold $525,000 $792,000
Determination of Cash at 12/31/10 12/31/11
Income taxes under FIFO $ 76,000 $116,000Income taxes as calculated under LIFO 68,000 101,600Increase in cash 8,000 14,400Adjust cash at 12/31/11 for 2010 tax difference — 8,000 Total increase in cash 8,000 22,400Cash balance under FIFO 130,000 154,000Cash balance under LIFO $138,000 $176,400

8-64 Copyright © 2011 John Wiley & Sons, Inc. Kieso, IFRS, 1/e, Solutions Manual (For Instructor Use Only)
*PROBLEM 8-10 (Continued)
Determination of Retained Earnings at 12/31/10 12/31/11
Net income under FIFO $114,000 $174,000Net income under LIFO (102,000) (152,400)Reduction in retained earnings 12,000 21,600Adjust retained earnings at 12/31/11 for 2010 reduction — 12,000 Total reduction in retained earnings 12,000 33,600Retained earnings under FIFO 200,000 260,000Retained earnings under LIFO $188,000 $226,400
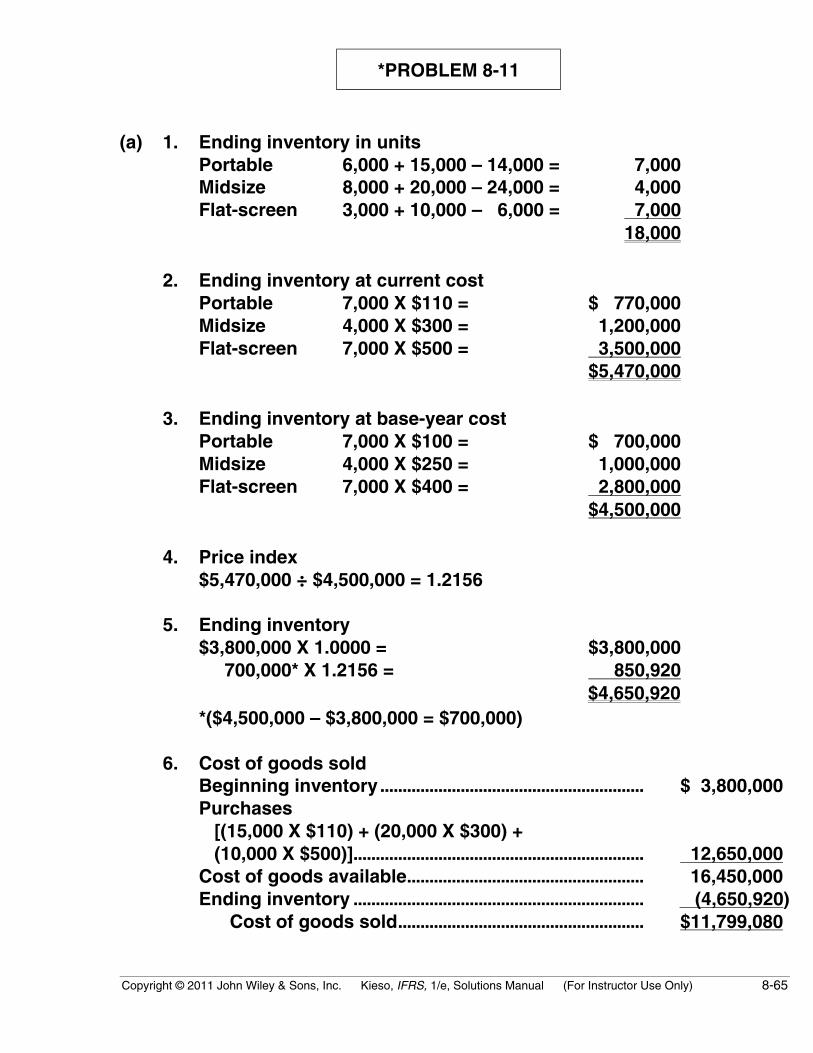
Copyright © 2011 John Wiley & Sons, Inc. Kieso, IFRS, 1/e, Solutions Manual (For Instructor Use Only) 8-65
*PROBLEM 8-11
(a) 1. Ending inventory in unitsPortable 6,000 + 15,000 – 14,000 = 7,000Midsize 8,000 + 20,000 – 24,000 = 4,000Flat-screen 3,000 + 10,000 – 6,000 = 7,000
18,000
2. Ending inventory at current costPortable 7,000 X $110 = $ 770,000Midsize 4,000 X $300 = 1,200,000Flat-screen 7,000 X $500 = 3,500,000
$5,470,000
3. Ending inventory at base-year costPortable 7,000 X $100 = $ 700,000Midsize 4,000 X $250 = 1,000,000Flat-screen 7,000 X $400 = 2,800,000
$4,500,000
4. Price index$5,470,000 ÷ $4,500,000 = 1.2156
5. Ending inventory$3,800,000 X 1.0000 = $3,800,000 700,000* X 1.2156 = 850,920
$4,650,920*($4,500,000 – $3,800,000 = $700,000)
6. Cost of goods soldBeginning inventory........................................................... $ 3,800,000Purchases [(15,000 X $110) + (20,000 X $300) + (10,000 X $500)]................................................................. 12,650,000Cost of goods available..................................................... 16,450,000Ending inventory ................................................................. (4,650,920) Cost of goods sold....................................................... $11,799,080

8-66 Copyright © 2011 John Wiley & Sons, Inc. Kieso, IFRS, 1/e, Solutions Manual (For Instructor Use Only)
*PROBLEM 8-11 (Continued)
7. Gross profitSales [(14,000 X $150) + (24,000 X $405) + (6,000 X $600)] ...................................................................... $15,420,000Cost of goods sold................................................................. 11,799,080Gross profit............................................................................... $ 3,620,920
(b) 1. Ending inventory at current cost restated to base costPortable $ 770,000 ÷ 1.10 = $ 700,000Midsize 1,200,000 ÷ 1.20 = $1,000,000Flat-screen 3,500,000 ÷ 1.25 = $2,800,000
2. Ending inventoryPortable $ 600,000 X 1.00 = $ 600,000
100,000 X 1.10 = 110,000Midsize 1,000,000 X 1.00 = 1,000,000Flat-screen 1,200,000 X 1.00 = 1,200,000
1,600,000 X 1.25 = 2,000,000$4,910,000
3. Cost of good soldCost of good available ...................................... $16,450,000Ending inventory................................................. (4,910,000) Cost of goods sold ...................................... $11,540,000
4. Gross profitSales........................................................................ $15,420,000Cost of goods sold............................................. 11,540,000Gross profit........................................................... $ 3,880,000
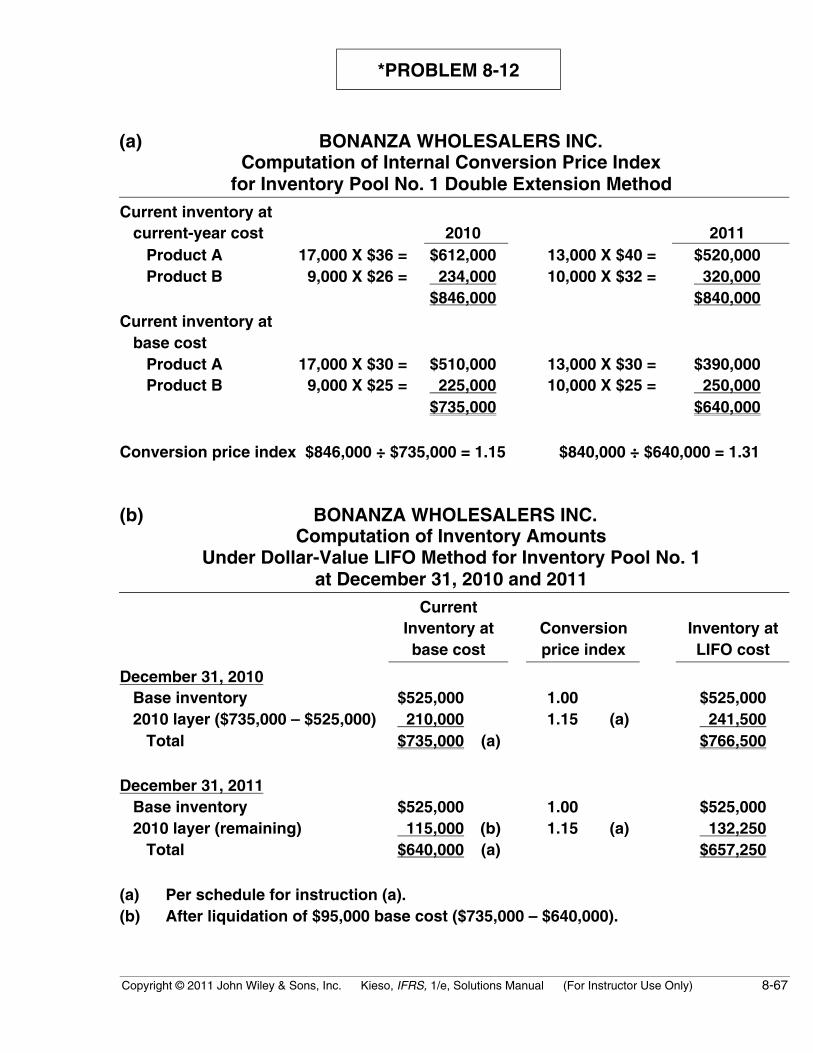
Copyright © 2011 John Wiley & Sons, Inc. Kieso, IFRS, 1/e, Solutions Manual (For Instructor Use Only) 8-67
*PROBLEM 8-12
(a) BONANZA WHOLESALERS INC.Computation of Internal Conversion Price Index
for Inventory Pool No. 1 Double Extension MethodCurrent inventory at current-year cost 2010 2011 Product A 17,000 X $36 = $612,000 13,000 X $40 = $520,000 Product B 9,000 X $26 = 234,000 10,000 X $32 = 320,000
$846,000 $840,000Current inventory at base cost Product A 17,000 X $30 = $510,000 13,000 X $30 = $390,000 Product B 9,000 X $25 = 225,000 10,000 X $25 = 250,000
$735,000 $640,000
Conversion price index $846,000 ÷ $735,000 = 1.15 $840,000 ÷ $640,000 = 1.31
(b) BONANZA WHOLESALERS INC.Computation of Inventory Amounts
Under Dollar-Value LIFO Method for Inventory Pool No. 1at December 31, 2010 and 2011
CurrentInventory atbase cost
Conversionprice index
Inventory atLIFO cost
December 31, 2010 Base inventory $525,000 1.00 $525,000 2010 layer ($735,000 – $525,000) 210,000 1.15 (a) 241,500 Total $735,000 (a) $766,500
December 31, 2011 Base inventory $525,000 1.00 $525,000 2010 layer (remaining) 115,000 (b) 1.15 (a) 132,250 Total $640,000 (a) $657,250
(a) Per schedule for instruction (a).(b) After liquidation of $95,000 base cost ($735,000 – $640,000).

8-68 Copyright © 2011 John Wiley & Sons, Inc. Kieso, IFRS, 1/e, Solutions Manual (For Instructor Use Only)
*PROBLEM 8-13
Base-YearCost Index %
Dollar-ValueLIFO
December 31, 2009January 1, 2009, base $45,000 100 $45,000December 31, 2009, layer 11,000 112* 12,320
$56,000 $57,320
December 31, 2010January 1, 2009, base $45,000 100 $45,000December 31, 2009, layer 11,000 112 12,320December 31, 2010, layer 12,400 128** 15,872
$68,400 $73,192
December 31, 2011January 1, 2009, base $45,000 100 $45,000December 31, 2009, layer 11,000 112 12,320December 31, 2010, layer 12,400 128 15,872December 31, 2011, layer 1,600 130*** 2,080
$70,000 $75,272
*$62,700 ÷ $56,000 **$87,300 ÷ $68,400***$90,800 ÷ $70,000

Copyright © 2011 John Wiley & Sons, Inc. Kieso, IFRS, 1/e, Solutions Manual (For Instructor Use Only) 8-69
*PROBLEM 8-14
(a)
Schedule A
A B C D
Current $ Price Index Base-Year $Change from
Prior Year2006 $ 80,000 1.00 $ 80,000 —2007 111,300 1.05 106,000 +$26,0002008 108,000 1.20 90,000 (16,000)2009 128,700 1.30 99,000 +9,0002010 147,000 1.40 105,000 +6,0002011 174,000 1.45 120,000 +15,000
Schedule B
Ending Inventory-Dollar-Value LIFO:
2006 $ 80,000 2010 $80,000 @ $1.00 = $ 80,0002007 $80,000 @ $1.00 = $ 80,000 10,000 @ 1.05 = 10,500
26,000 @ 1.05 = 27,300 9,000 @ 1.30 = 11,700$107,300 6,000 @ 1.40 = 8,400
2008 $80,000 @ 1.00 = $ 80,000 $110,600
10,000 @ 1.05 = 10,500 2011 $80,000 @ 1.00 = $ 80,000$ 90,500 10,000 @ 1.05 = 10,500
2009 $80,000 @ 1.00 = $ 80,000 9,000 @ 1.30 = 11,700 10,000 @ 1.05 = 10,500 6,000 @ 1.40 = 8,400 9,000 @ 1.30 = 11,700 15,000 @ 1.45 = 21,750
$102,200 $132,350
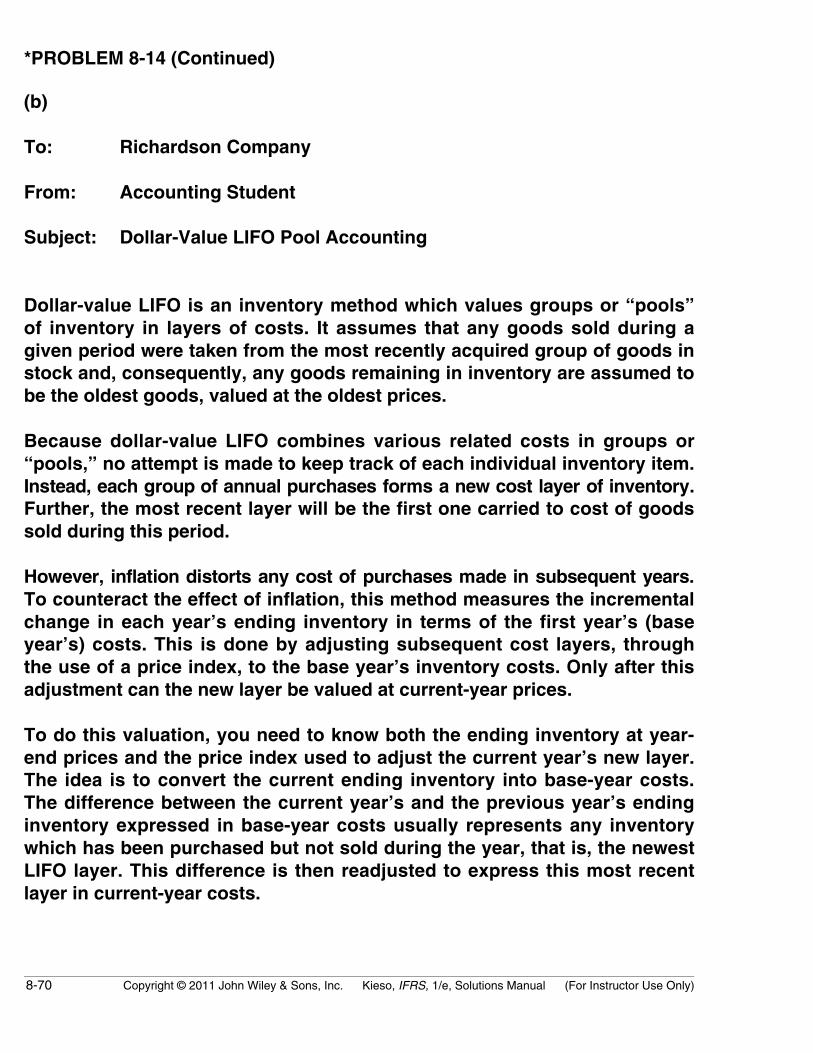
8-70 Copyright © 2011 John Wiley & Sons, Inc. Kieso, IFRS, 1/e, Solutions Manual (For Instructor Use Only)
*PROBLEM 8-14 (Continued)
(b)
To: Richardson Company
From: Accounting Student
Subject: Dollar-Value LIFO Pool Accounting
Dollar-value LIFO is an inventory method which values groups or “pools”of inventory in layers of costs. It assumes that any goods sold during agiven period were taken from the most recently acquired group of goods instock and, consequently, any goods remaining in inventory are assumed tobe the oldest goods, valued at the oldest prices.
Because dollar-value LIFO combines various related costs in groups or“pools,” no attempt is made to keep track of each individual inventory item.Instead, each group of annual purchases forms a new cost layer of inventory.Further, the most recent layer will be the first one carried to cost of goodssold during this period.
However, inflation distorts any cost of purchases made in subsequent years.To counteract the effect of inflation, this method measures the incrementalchange in each year’s ending inventory in terms of the first year’s (baseyear’s) costs. This is done by adjusting subsequent cost layers, throughthe use of a price index, to the base year’s inventory costs. Only after thisadjustment can the new layer be valued at current-year prices.
To do this valuation, you need to know both the ending inventory at year-end prices and the price index used to adjust the current year’s new layer.The idea is to convert the current ending inventory into base-year costs.The difference between the current year’s and the previous year’s endinginventory expressed in base-year costs usually represents any inventorywhich has been purchased but not sold during the year, that is, the newestLIFO layer. This difference is then readjusted to express this most recentlayer in current-year costs.
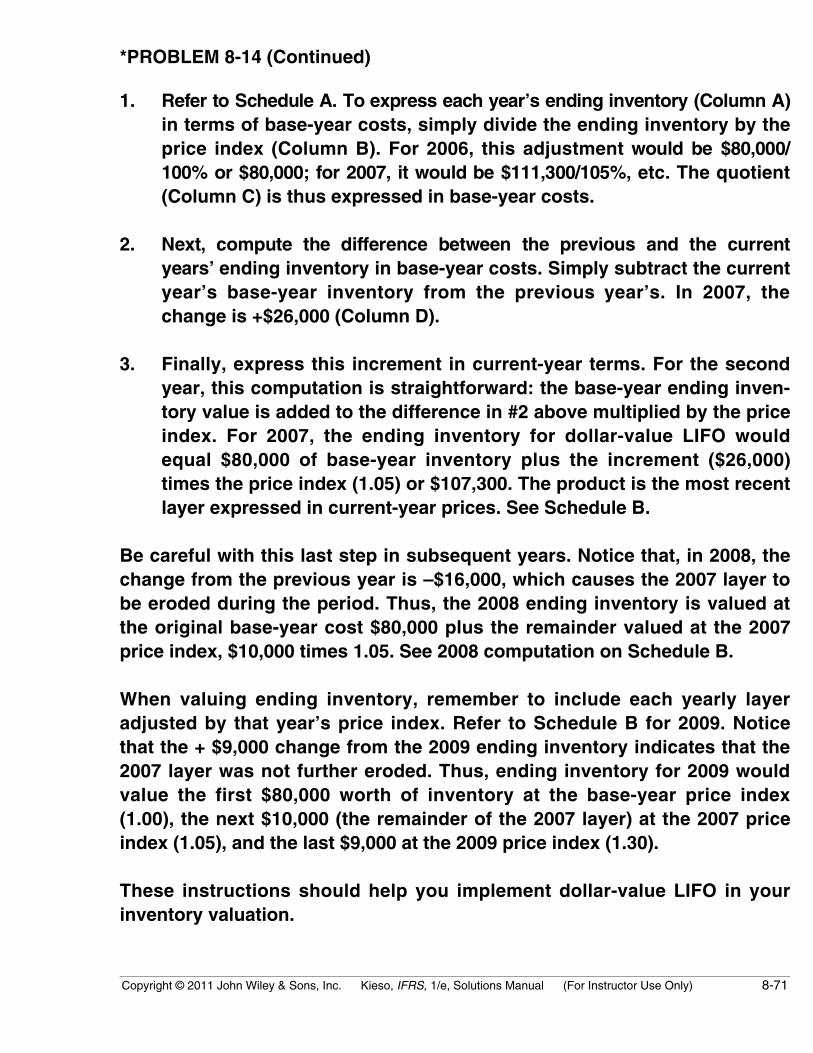
Copyright © 2011 John Wiley & Sons, Inc. Kieso, IFRS, 1/e, Solutions Manual (For Instructor Use Only) 8-71
*PROBLEM 8-14 (Continued)
1. Refer to Schedule A. To express each year’s ending inventory (Column A)in terms of base-year costs, simply divide the ending inventory by theprice index (Column B). For 2006, this adjustment would be $80,000/100% or $80,000; for 2007, it would be $111,300/105%, etc. The quotient(Column C) is thus expressed in base-year costs.
2. Next, compute the difference between the previous and the currentyears’ ending inventory in base-year costs. Simply subtract the currentyear’s base-year inventory from the previous year’s. In 2007, thechange is +$26,000 (Column D).
3. Finally, express this increment in current-year terms. For the secondyear, this computation is straightforward: the base-year ending inven-tory value is added to the difference in #2 above multiplied by the priceindex. For 2007, the ending inventory for dollar-value LIFO wouldequal $80,000 of base-year inventory plus the increment ($26,000)times the price index (1.05) or $107,300. The product is the most recentlayer expressed in current-year prices. See Schedule B.
Be careful with this last step in subsequent years. Notice that, in 2008, thechange from the previous year is –$16,000, which causes the 2007 layer tobe eroded during the period. Thus, the 2008 ending inventory is valued atthe original base-year cost $80,000 plus the remainder valued at the 2007price index, $10,000 times 1.05. See 2008 computation on Schedule B.
When valuing ending inventory, remember to include each yearly layeradjusted by that year’s price index. Refer to Schedule B for 2009. Noticethat the + $9,000 change from the 2009 ending inventory indicates that the2007 layer was not further eroded. Thus, ending inventory for 2009 wouldvalue the first $80,000 worth of inventory at the base-year price index(1.00), the next $10,000 (the remainder of the 2007 layer) at the 2007 priceindex (1.05), and the last $9,000 at the 2009 price index (1.30).
These instructions should help you implement dollar-value LIFO in yourinventory valuation.
8-72 Copyright © 2011 John Wiley & Sons, Inc. Kieso, IFRS, 1/e, Solutions Manual (For Instructor Use Only)
TIME AND PURPOSE OF CONCEPTS FOR ANALYSIS
CA 8-1 (Time 15–20 minutes)Purpose—a short case designed to test the skills of the student in determining whether an item shouldbe reported in inventory. In addition, the student is required to speculate as to why the company maywish to postpone recording this transaction.
CA 8-2 (Time 15–25 minutes)Purpose—to provide the student with four questions about the carrying value of inventory. Thesequestions must be answered and defended with rationale. The topics are shipping terms, freight–in,weighted-average cost vs. FIFO, and consigned goods.
CA 8-3 (Time 25–35 minutes)Purpose—to provide a number of difficult financial reporting transactions involving inventories. This caseis vague and much judgment is required in its analysis. Right or wrong answers should be discouraged;rather emphasis should be placed on the underlying rationale to defend a given position. Includes aproduct versus period cost transaction, proper classification of a possible inventory item, and a productfinancing arrangement.
CA 8-4 (Time 15–25 minutes)Purpose—to provide the student with the opportunity to discuss the acceptability of alternative methodsof reporting cash discounts.
CA 8-5 (Time 15–20 minutes)Purpose—to provide the student with an opportunity to discuss the cost flow assumptions of averagecost and FIFO. The student is also required to distinguish between weighted-average and moving-average and discuss the effect of average cost on the SFP and I/S in a period of rising prices.
CA 8-6 (Time 20–25 minutes)Purpose—to provide the student with an opportunity to analyze the ethical implications of purchasingdecisions under average cost.
*CA 8-7 (Time 20–25 minutes)Purpose—to provide a broad overview to students as to why inventories must be included in thestatement of financial position and income statement. In addition, students are asked to determine whytaxable income and accounting income may be different. Finally, the conditions under which FIFO andLIFO may give different answers must be developed.
*CA 8-8 (Time 15–20 minutes)Purpose—to provide the student with the opportunity to discuss the rationale for the use of the LIFOmethod of inventory valuation. The conditions that must exist before the tax benefits of LIFO will accruealso must be developed.
*CA 8-9 (Time 25–30 minutes)Purpose—to provide the student with the opportunity to discuss the differences between traditionalLIFO and dollar-value LIFO. In this discussion, the specific procedures employed in traditional LIFO anddollar-value LIFO must be examined. This case provides a good basis for discussing LIFO conceptualissues.

Copyright © 2011 John Wiley & Sons, Inc. Kieso, IFRS, 1/e, Solutions Manual (For Instructor Use Only) 8-73
Time and Purposes of Concepts for Analysis (Continued)
*CA 8-10 (Time 25–30 minutes)Purpose—to provide the student with an opportunity to discuss the concept of a LIFO pool and its usein various LIFO methods. The student is also asked to define LIFO liquidation, to explain the use ofprice indexes in dollar-value LIFO, and to discuss the advantages of using dollar-value LIFO.
*CA 8-11 (Time 30–35 minutes)Purpose—to provide the student with an opportunity to analyze the effect of changing from the FIFOmethod to the LIFO method on items such as ending inventory, net income, earnings per share, andyear-end cash balance. The student is also asked to make recommendations considering the resultsfrom computation and other relevant factors.
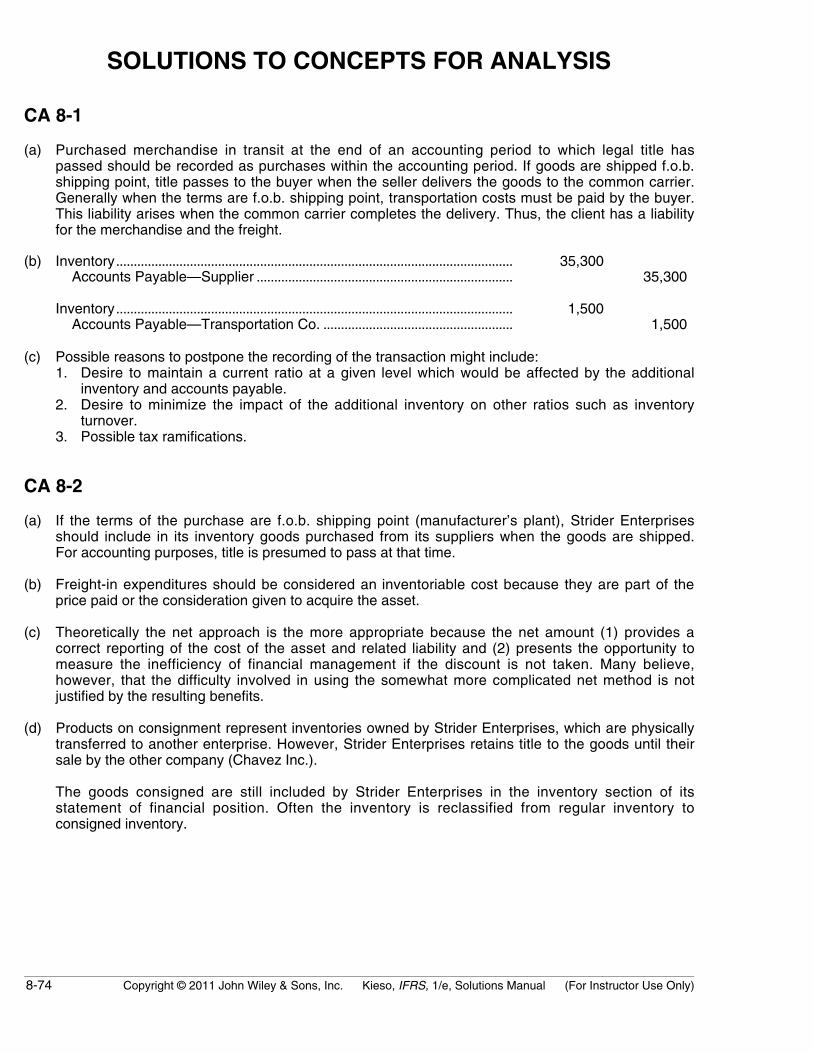
8-74 Copyright © 2011 John Wiley & Sons, Inc. Kieso, IFRS, 1/e, Solutions Manual (For Instructor Use Only)
SOLUTIONS TO CONCEPTS FOR ANALYSIS
CA 8-1
(a) Purchased merchandise in transit at the end of an accounting period to which legal title haspassed should be recorded as purchases within the accounting period. If goods are shipped f.o.b.shipping point, title passes to the buyer when the seller delivers the goods to the common carrier.Generally when the terms are f.o.b. shipping point, transportation costs must be paid by the buyer.This liability arises when the common carrier completes the delivery. Thus, the client has a liabilityfor the merchandise and the freight.
(b) Inventory................................................................................................................. 35,300Accounts Payable—Supplier ......................................................................... 35,300
Inventory................................................................................................................. 1,500Accounts Payable—Transportation Co. ...................................................... 1,500
(c) Possible reasons to postpone the recording of the transaction might include:1. Desire to maintain a current ratio at a given level which would be affected by the additional
inventory and accounts payable.2. Desire to minimize the impact of the additional inventory on other ratios such as inventory
turnover.3. Possible tax ramifications.
CA 8-2
(a) If the terms of the purchase are f.o.b. shipping point (manufacturer’s plant), Strider Enterprisesshould include in its inventory goods purchased from its suppliers when the goods are shipped.For accounting purposes, title is presumed to pass at that time.
(b) Freight-in expenditures should be considered an inventoriable cost because they are part of theprice paid or the consideration given to acquire the asset.
(c) Theoretically the net approach is the more appropriate because the net amount (1) provides acorrect reporting of the cost of the asset and related liability and (2) presents the opportunity tomeasure the inefficiency of financial management if the discount is not taken. Many believe,however, that the difficulty involved in using the somewhat more complicated net method is notjustified by the resulting benefits.
(d) Products on consignment represent inventories owned by Strider Enterprises, which are physicallytransferred to another enterprise. However, Strider Enterprises retains title to the goods until theirsale by the other company (Chavez Inc.).
The goods consigned are still included by Strider Enterprises in the inventory section of itsstatement of financial position. Often the inventory is reclassified from regular inventory toconsigned inventory.

Copyright © 2011 John Wiley & Sons, Inc. Kieso, IFRS, 1/e, Solutions Manual (For Instructor Use Only) 8-75
CA 8-3
(a) According to IFRS, cost generally means that the sum of the applicable expenditures and chargesdirectly or indirectly incurred in bringing an article to its existing condition and location. Withrespect to inventory, selling expenses are not part of the inventory costs. To the extent thatwarehousing is a necessary function of importing merchandise before it can be sold, certainelements of warehousing costs might be considered an appropriate cost of inventory in thewarehouse. For example, if goods must be brought into the warehouse before they can be madeready for sale, the cost of bringing such goods into the warehouse would be considered a cost ofinventory. Similarly, if goods must be handled in the warehouse for assembly or for removal offoreign packaging, etc., it would be appropriate to include such costs in inventory. However, costsinvolved in storing the goods for any additional period would appear to be period costs. Costs ofdelivering the goods from the warehouse would appear to be selling expenses related to the goodssold, and should not under any circumstances be allocated to goods that are still in thewarehouse.
In theory, warehousing costs are considered a product cost because these costs are incurred tomaintain the product in a salable condition. However, in practice, warehousing costs are most fre-quently treated as a period cost.
(b) It is correct to conclude that obsolete items are excludable from inventory. Cost attributable tosuch items is “nonuseful” and “nonrecoverable” cost (except for possible scrap value) and shouldbe written off. If the cost of obsolete items was simply excluded from ending inventory, the resultantcost of goods sold would be overstated by the amount of these costs. The cost of obsolete items, ifimmaterial, should be commingled with cost of goods sold. If material, these costs should beseparately disclosed.
(c) The primary use of the airplanes should determine their treatment on the statement of financialposition. Since the airplanes are held primarily for sale, and chartering is only a temporary use, theairplanes should be classified as current assets. Depreciation would not be appropriate if theplanes are considered inventory.
(d) The transaction is a product financing arrangement and should be reported by the company asinventory with a related liability. The substance of the transaction is that inventory has beenpurchased and the fact that a trust is established to purchase the goods has no economicsignificance. Given that the company agrees to buy the coal over a certain period of time atspecific prices, it appears clear that the company has the liability and not the trust.
CA 8-4
(a) Cash discounts should not be accounted for as financial income when payments are made.Income should be recognized when the earnings process is complete (when the company sells theinventory). Furthermore, cash discounts should not be recorded when the payments are madebecause in order to properly match a cash discount with the related purchase, the cash discountshould be recorded when the related purchase is recorded.
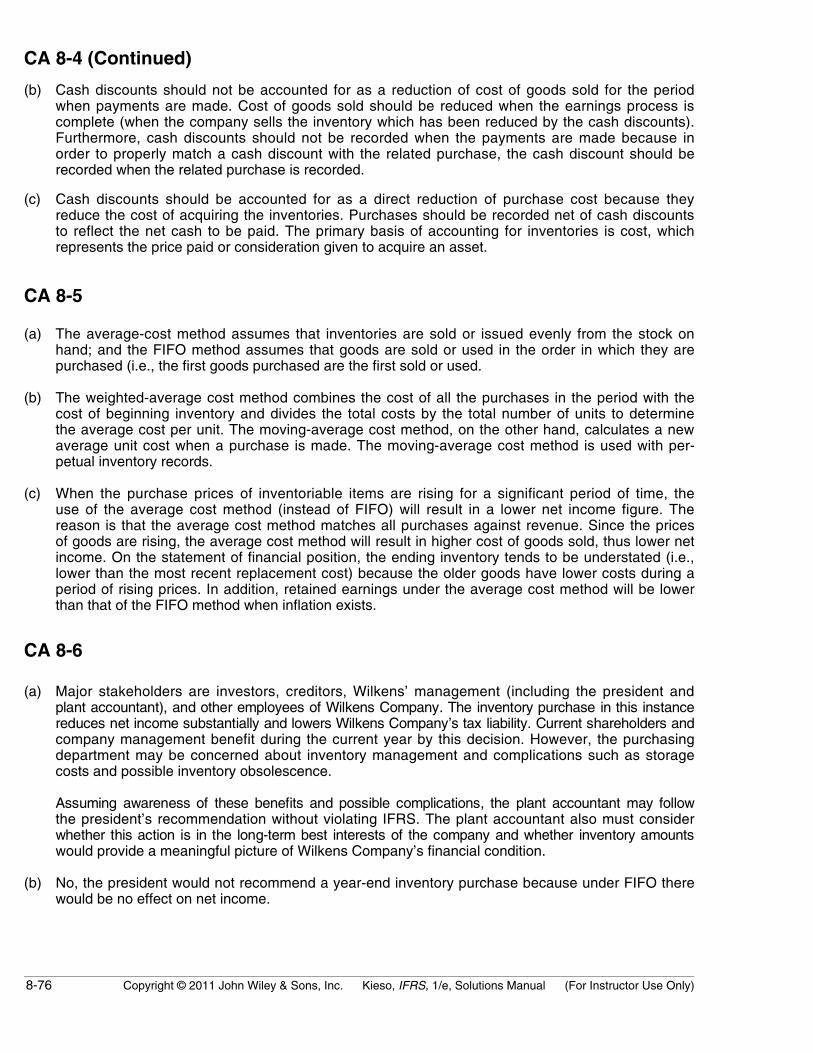
8-76 Copyright © 2011 John Wiley & Sons, Inc. Kieso, IFRS, 1/e, Solutions Manual (For Instructor Use Only)
CA 8-4 (Continued)
(b) Cash discounts should not be accounted for as a reduction of cost of goods sold for the periodwhen payments are made. Cost of goods sold should be reduced when the earnings process iscomplete (when the company sells the inventory which has been reduced by the cash discounts).Furthermore, cash discounts should not be recorded when the payments are made because inorder to properly match a cash discount with the related purchase, the cash discount should berecorded when the related purchase is recorded.
(c) Cash discounts should be accounted for as a direct reduction of purchase cost because theyreduce the cost of acquiring the inventories. Purchases should be recorded net of cash discountsto reflect the net cash to be paid. The primary basis of accounting for inventories is cost, whichrepresents the price paid or consideration given to acquire an asset.
CA 8-5
(a) The average-cost method assumes that inventories are sold or issued evenly from the stock onhand; and the FIFO method assumes that goods are sold or used in the order in which they arepurchased (i.e., the first goods purchased are the first sold or used.
(b) The weighted-average cost method combines the cost of all the purchases in the period with thecost of beginning inventory and divides the total costs by the total number of units to determinethe average cost per unit. The moving-average cost method, on the other hand, calculates a newaverage unit cost when a purchase is made. The moving-average cost method is used with per-petual inventory records.
(c) When the purchase prices of inventoriable items are rising for a significant period of time, theuse of the average cost method (instead of FIFO) will result in a lower net income figure. Thereason is that the average cost method matches all purchases against revenue. Since the pricesof goods are rising, the average cost method will result in higher cost of goods sold, thus lower netincome. On the statement of financial position, the ending inventory tends to be understated (i.e.,lower than the most recent replacement cost) because the older goods have lower costs during aperiod of rising prices. In addition, retained earnings under the average cost method will be lowerthan that of the FIFO method when inflation exists.
CA 8-6
(a) Major stakeholders are investors, creditors, Wilkens’ management (including the president andplant accountant), and other employees of Wilkens Company. The inventory purchase in this instancereduces net income substantially and lowers Wilkens Company’s tax liability. Current shareholders andcompany management benefit during the current year by this decision. However, the purchasingdepartment may be concerned about inventory management and complications such as storagecosts and possible inventory obsolescence.
Assuming awareness of these benefits and possible complications, the plant accountant may followthe president’s recommendation without violating IFRS. The plant accountant also must considerwhether this action is in the long-term best interests of the company and whether inventory amountswould provide a meaningful picture of Wilkens Company’s financial condition.
(b) No, the president would not recommend a year-end inventory purchase because under FIFO therewould be no effect on net income.

Copyright © 2011 John Wiley & Sons, Inc. Kieso, IFRS, 1/e, Solutions Manual (For Instructor Use Only) 8-77
*CA 8-7
(a) 1. Inventories are unexpired costs and represent future benefits to the owner. A statement offinancial position includes a listing of unexpired costs and future benefits of the owner’s assetsat a specific point in time. Because inventories are assets owned at the specific point in time forwhich a statement of financial position is prepared, they must be included in order that theowner’s financial position will be presented fairly.
2. Beginning and ending inventories are included in the computation of net income only forthe purpose of arriving at the cost of goods sold during the period of time covered by thestatement. Goods included in the beginning inventory which are no longer on hand are expiredcosts to be matched against revenues earned during the period. Goods included in the endinginventory are unexpired costs to be carried forward to a future period, rather than expensed.
(b) Financial accounting has as its goal the proper reporting of financial transactions and events inaccordance with international financial reporting standards. Income tax accounting has as its goalthe reporting of taxable transactions and events in conformity with income tax laws and regulations.While the primary purpose of an income tax is the production of tax revenues to finance theoperations of government, income tax laws and regulations are often produced by various forces.The income tax may be used as a tool of fiscal policy to stimulate all of the segments of theeconomy or to decelerate the economy. Some income tax laws may be passed because of politicalpressures brought to bear by individuals or industries. When the purposes of financial accountingand income tax accounting differ, it is often desirable to report transactions or events differentlyand to report the deferred tax consequences of any existing temporary differences as assets orliabilities.
(c) FIFO and LIFO are inventory costing methods employed to measure the flow of costs. FIFOmatches the first cost incurred with the first revenue produced while LIFO matches the last costincurred with the first revenue produced after the cost is incurred. (This, of course, assumes aperpetual inventory system is in use and may not be precisely true if a periodic inventory system isemployed.) If prices are changing, different costs would be matched with revenue for the samequantity sold depending upon whether the LIFO or FIFO system is in use. (In a period of rising orfalling prices FIFO tends to value inventories at approximate fair value in the statement of financialposition and LIFO tends to match approximately the current replacement cost of an item with therevenue produced.)
*CA 8-8
(a) Inventory profits occur when the inventory costs matched against sales are less than the replace-ment cost of the inventory. The cost of goods sold therefore is understated and net income is con-sidered overstated. By using LIFO (rather than some method such as FIFO), more recent costsare matched against revenues and inventory profits are thereby reduced.
(b) As long as the price level increases and inventory quantities do not decrease, a deferral of incometaxes occurs under LIFO because the items most recently purchased at the higher price level arematched against revenues. It should be noted that where unit costs tend to decrease as produc-tion increases, the tax benefits that LIFO might provide are nullified. Also, where the inventoryturnover is high, the difference between inventory methods is negligible.

8-78 Copyright © 2011 John Wiley & Sons, Inc. Kieso, IFRS, 1/e, Solutions Manual (For Instructor Use Only)
*CA 8-9
(a) 1. The LIFO method (periodic) allocates costs on the assumption that the last goods purchasedare used first. If the amount of the inventory is computed at the end of the month under aperiodic system, then it would be assumed that the total quantity sold or issued during themonth would have come from the most recent purchases, and ordinarily no attempt would bemade to compare the dates of purchases and sales.
2. The dollar-value method of LIFO inventory valuation is a procedure using dollars instead ofunits to measure increments or reductions in inventory. The method presumes that goods inthe inventory can be classified into pools or homogenous groups. After the grouping into poolsthe ending inventory is priced at the end-of-year prices and a price index number is applied toconvert the total pool to the base-year price level. Such a price index might be obtained fromgovernment sources, if available, or computed from the company’s records. The pools orgroupings of inventory are required where a single index number is inappropriate for allelements of the inventory.
After the closing inventory and the opening inventory have been placed on the same base-yearprice level, any difference between the two inventories is attributable to an increase ordecrease in inventory quantity at the base-year price. An increase in quantity so determined isconverted to the current-year price level and added to the amount of the opening inventory as aseparate inventory layer. A decrease in quantity is deducted from the appropriate layer ofopening inventory at the price level in existence when the layer was added.
(b) The advantages of the dollar-value method over the traditional LIFO method are as follows:1. The application of the LIFO method is simplified because, under the pooling procedure, it is not
necessary to assign costs to opening and closing quantities of individual items. As a result,companies with inventories comprised of thousands of items may adopt the dollar-value methodand minimize their bookkeeping costs.
2. Base inventories are more easily maintained. The dollar-value method permits greater flexibilitybecause each pool is made up of dollars rather than quantities. Thus, the problem of a LIFOliquidation is less possible.
The disadvantages of the dollar-value method as compared to the traditional LIFO method areas follows:1. Due to technological innovations and improvements over time, material changes in the com-
position of inventory may occur. Items found in the ending inventory may not have existedduring the base year. Thus, conversion of the ending inventory to base-year prices may bedifficult to calculate or to justify conceptually. This may necessitate a periodic change in thechoice of base year used.
2. Application of a year-end index, although widely used, implies use of the FIFO method. Otherindexes used include beginning-of-year index and average indexes.
3. Determination of the degree of similarity between items for the purpose of grouping them intopools may be difficult and may be based upon arbitrary management decisions.
(c) The basic advantages of LIFO are:1. Matching—In LIFO, the more recent costs are matched against current revenues to provide a
better measure of current earnings.
2. Tax benefits—As long as the price level increases and inventory quantities do not decrease, adeferral of income taxes occurs.
3. Improved cash flow—By receiving tax benefits from use of LIFO, the company may reduce itsborrowings and related interest costs.

Copyright © 2011 John Wiley & Sons, Inc. Kieso, IFRS, 1/e, Solutions Manual (For Instructor Use Only) 8-79
*CA 8-9 (Continued)
4. Future earnings hedge—With LIFO, a company’s future reported earnings will not be affectedsubstantially by future price declines. LIFO eliminates or substantially minimizes write-downs tomarket as a result of price decreases because the inventory value ordinarily will be much lowerthan net realizable value, unlike FIFO.
The major disadvantages of LIFO are:1. Reduced earnings—Because current costs are matched against current revenues, net income
is lower than it is under other inventory methods when price levels are increasing.
2. Inventory understated—The inventory valuation on the statement of financial position isordinarily outdated because the oldest costs remain in inventory.
3. Physical flow—LIFO does not approximate physical flow of the items except in peculiarsituations.
4. Real income not measured—LIFO falls short of measuring real income because it is often notan adequate substitute for replacement cost.
5. Involuntary liquidation—If the base or layers of old costs are partially liquidated, irrelevantcosts can be matched against current revenues.
6. Poor buying habits—LIFO may cause poor buying habits because a company may simplypurchase more goods and match the cost of these goods against revenue to insure that oldcosts are not charged to expense.
*CA 8-10
(a) A LIFO pool is a group of similar items which are combined and accounted for together under theLIFO inventory method.
(b) It is possible to use a LIFO pool concept without using dollar-value LIFO. For example, the specificgoods pooled approach utilizes the concept of a LIFO pool with quantities as its measurementbasis.
(c) A LIFO liquidation occurs when a significant drop in inventory level leads to the erosion of anearlier or base inventory layer. In a period of inflation (as usually is the case) LIFO liquidation willdistort net income (make it higher) and incur substantial tax payments.
(d) Price indexes are used in the dollar-value LIFO method to: (1) convert the ending inventory atcurrent year-end cost to base-year cost, and (2) determine the current-year cost for each inventorylayer other than the base-year layer.
(e) The dollar-value LIFO method measures the increases and decreases in a pool in terms of totaldollar value, not by the physical quantity of the goods in the inventory pool. As a result, the dollar-value LIFO approach has the following advantages over specific goods LIFO pool. First, the pooledapproach reduces record keeping and clerical costs. Second, replacement is permitted if it is asimilar material, or similar in use, or interchangeable. Thus, it is more difficult to erode LIFO layerswhen using dollar-value LIFO techniques.

8-80 Copyright © 2011 John Wiley & Sons, Inc. Kieso, IFRS, 1/e, Solutions Manual (For Instructor Use Only)
*CA 8-11
(a) FIFO (Amounts in thousands, except earnings per share)
2010 2011 2012
Sales $11,000 $12,000 $15,600
Cost of goods sold Beginning inventory 8,000 7,200 9,000 Purchases 8,000 9,900 12,000 Cost of goods available for sale 16,000 17,100 21,0001. Ending inventory* (7,200) (9,000) (9,000) Cost of goods sold 8,800 8,100 12,000 Gross profit 2,200 3,900 3,600 Operating expenses (15% of sales) (1,650) (1,800) (2,340) Depreciation expense (300) (300) (300) Income before taxes 250 1,800 960 Income tax expense (40%) 100 720 3842. Net income $ 150 $ 1,080 $ 576
3. Earnings per share $ 0.15 $ 1.08 $ 0.58
4. Cash balance Beginning balance $ 400 $ 1,150 $ 230 Sales proceeds 11,000 12,000 15,600 Purchases (8,000) (9,900) (12,000) Operating expenses (1,650) (1,800) (2,340) Property, plant, and equipment (350) (350) (350) Income taxes (100) (720) (384) Dividends (150) (150) (150) Ending balance $ 1,150 $ 230 $ 606
*2010 = $ 8 X (1,000 + 1,000 – 1,100) = $7,200. 2011 = $ 9 X ( 900 + 1,100 – 1,000) = $9,000. 2012 = $10 X (1,000 + 1,200 – 1,300) = $9,000.

Copyright © 2011 John Wiley & Sons, Inc. Kieso, IFRS, 1/e, Solutions Manual (For Instructor Use Only) 8-81
*CA 8-11 (Continued)
LIFO (Amounts in thousands, except earnings per share)
2010 2011 2012
Sales $11,000 $12,000 $15,600
Cost of goods sold Beginning inventory 8,000 7,200 8,100 Purchases 8,000 9,900 12,000 Cost of goods available for sale 16,000 17,100 20,1001. Ending inventory** (7,200) (8,100) (7,200) Cost of goods sold 8,800 9,000 12,900 Gross profit 2,200 3,000 2,700 Operating expenses (1,650) (1,800) (2,340) Depreciation expense (300) (300) (300) Income before taxes 250 900 60 Income tax expense 100 360 242. Net income $ 150 $ 540 $ 36
3. Earnings per share $ 0.15 $ 0.54 $ 0.04
4. Cash balance Beginning balance $ 400 $ 1,150 $ 590 Sales proceeds 11,000 12,000 15,600 Purchases (8,000) (9,900) (12,000) Operating expenses (1,650) (1,800) (2,340) Property, plant, and equipment (350) (350) (350) Income taxes (100) (360) (24) Dividends (150) (150) (150) Ending balance $ 1,150 $ 590 $ 1,326
**2010 = $8 X (1,000 + 1,000 – 1,100) = $7,200. 2011 = ($8 X 900) + ($9 X 100) = $8,100. 2012 = $8 X 900 = $7,200.

8-82 Copyright © 2011 John Wiley & Sons, Inc. Kieso, IFRS, 1/e, Solutions Manual (For Instructor Use Only)
*CA 8-11 (Continued)
(b) According to the computation in (a), Harrisburg Company can achievethe goal of income tax savings by switching to the LIFO method. Asshown in the schedules, under the LIFO method, Harrisburg will havelower net income and thus lower income taxes for 2011 and 2012 (taxsavings of $360,000 in each year). As a result, Harrisburg will have abetter cash position at the end of 2011 and especially 2012 (year-endcash balance will be higher by $360,000 for 2011 and $720,000 for 2012).
However, since Harrisburg Company is in a period of rising purchaseprices, the LIFO method will result in significantly lower net incomeand earnings per share for 2011 and 2012. The management may needto evaluate the potential impact that lower net income and earningsper share might have on the company before deciding on the changeto the LIFO method.

Copyright © 2011 John Wiley & Sons, Inc. Kieso, IFRS, 1/e, Solutions Manual (For Instructor Use Only) 8-83
FINANCIAL STATEMENT ANALYSIS CASE 1
(a) Sales....................................................................................... $618,876,000Cost of goods sold*........................................................... 476,746,000Gross profit .......................................................................... 142,130,000Selling and administrative expenses .......................... 102,112,000Income from operations................................................... 40,018,000Other expense..................................................................... (24,712,000)Income before income tax............................................... $ 15,306,000
*Cost of goods sold (per annual report) ...................... $475,476,000AC effect ($5,263,000 – $3,993,000).............................. 1,270,000Cost of goods sold (per average cost) ....................... $476,746,000
(b) $15,306,000 income before income tax X 46.6% tax = $7,132,596 tax;$15,306,000 – $7,132,596 tax = $8,173,404 net income as compared to$8,848,000 net income under average cost. This is $674,596 or about8% different. The question as to materiality is to allow the students anopportunity to judge the significance of the difference between thetwo costing methods. Since it is less than 10% different, some studentsmay feel that it is not material. An 8% change in net income, however,is probably material, but this would depend on the industry andperhaps on the company’s own past averages.
(c) No, the use of different costing methods does not necessarily meanthat there is a difference in the physical flow of goods. As explainedin the text, the actual physical flow need have no relationship to thecost flow assumption. The management of Lumber Supply Internationalhas determined that average cost is appropriate only for a subset of itsproducts, and these reasons have to do with economic characteristics,rather than the physical flow of the goods.

8-84 Copyright © 2011 John Wiley & Sons, Inc. Kieso, IFRS, 1/e, Solutions Manual (For Instructor Use Only)
FINANCIAL STATEMENT ANALYSIS CASE 2
(a) The most likely physical flow of goods for a pharmaceutical manufac-turer would be FIFO; that is, the first goods manufactured would be thefirst goods sold. This is because pharmaceutical goods have an expi-ration date. The manufacturer would be careful to ship the goods madeearliest first and thereby reduce the risk that outdated goods willremain in the warehouse.
(b) Noven should consider first whether the inventory costing methodwill make a difference. If the prices in the economy, especially if theraw materials prices, are stable, then the inventory cost will be nearlythe same under any of the measurement methods. If inventory levelsare very small, then the method used will make little difference. Novenshould also consider the cost of keeping records. A small companymight not want to invest in complicated record keeping. The tax effectsof any differences should be considered, as well as any internationalrules that might dictate Noven’s measurement of part of its inventory.
(c) This amount is likely not shown in a separate inventory accountbecause it is immaterial; that is, it is not large enough to make a differ-ence with investors. Another possible reason is that no goods have yetbeen offered for sale. This amount might be in the Inventory of suppliesaccount, but it is more likely to be included with Prepaid and othercurrent assets, since it clearly is not just an article of supplies. Thiswill definitely be shown separately as soon as Noven begins to sell itsproducts to outside customers.
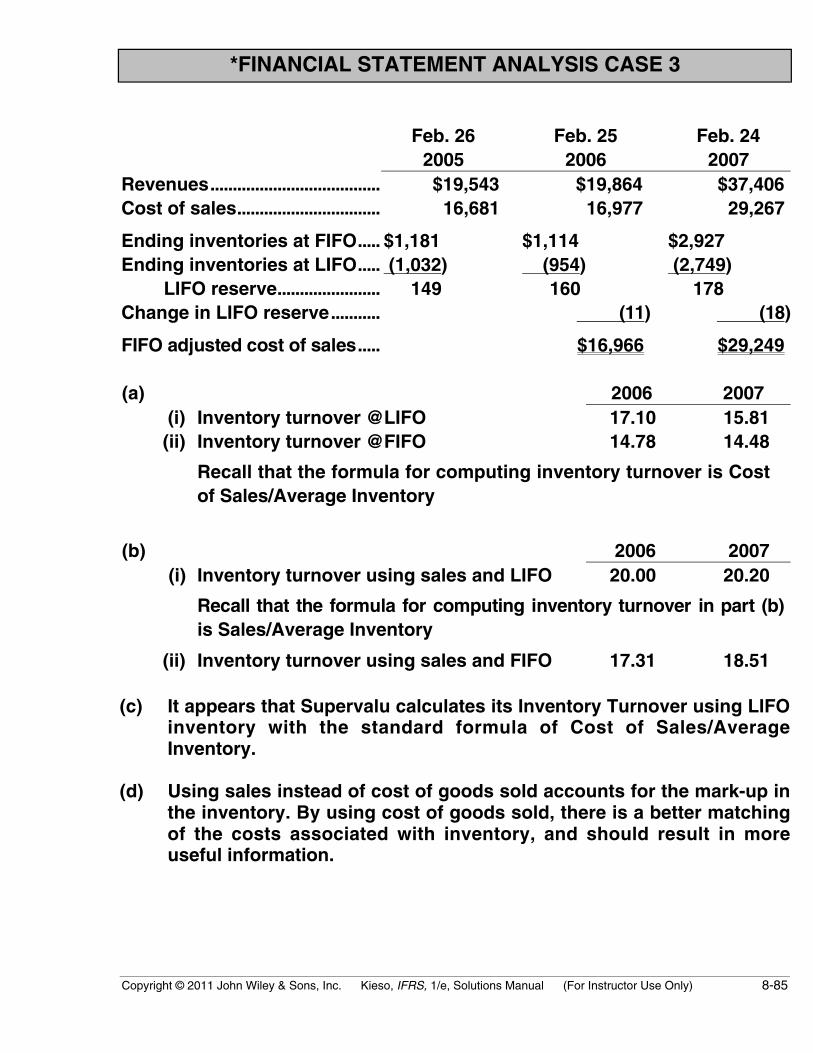
Copyright © 2011 John Wiley & Sons, Inc. Kieso, IFRS, 1/e, Solutions Manual (For Instructor Use Only) 8-85
*FINANCIAL STATEMENT ANALYSIS CASE 3
Feb. 26 Feb. 25 Feb. 242005 2006 2007
Revenues...................................... $19,543 $19,864 $37,406Cost of sales................................ 16,681 16,977 29,267
Ending inventories at FIFO..... $1,181 $1,114 $2,927Ending inventories at LIFO..... (1,032) (954) (2,749)
LIFO reserve....................... 149 160 178Change in LIFO reserve........... (11) (18)
FIFO adjusted cost of sales..... $16,966 $29,249
(a) 2006 2007(i) Inventory turnover @LIFO 17.10 15.81(ii) Inventory turnover @FIFO 14.78 14.48
Recall that the formula for computing inventory turnover is Costof Sales/Average Inventory
(b) 2006 2007(i) Inventory turnover using sales and LIFO 20.00 20.20
Recall that the formula for computing inventory turnover in part (b)is Sales/Average Inventory
(ii) Inventory turnover using sales and FIFO 17.31 18.51
(c) It appears that Supervalu calculates its Inventory Turnover using LIFOinventory with the standard formula of Cost of Sales/AverageInventory.
(d) Using sales instead of cost of goods sold accounts for the mark-up inthe inventory. By using cost of goods sold, there is a better matchingof the costs associated with inventory, and should result in moreuseful information.
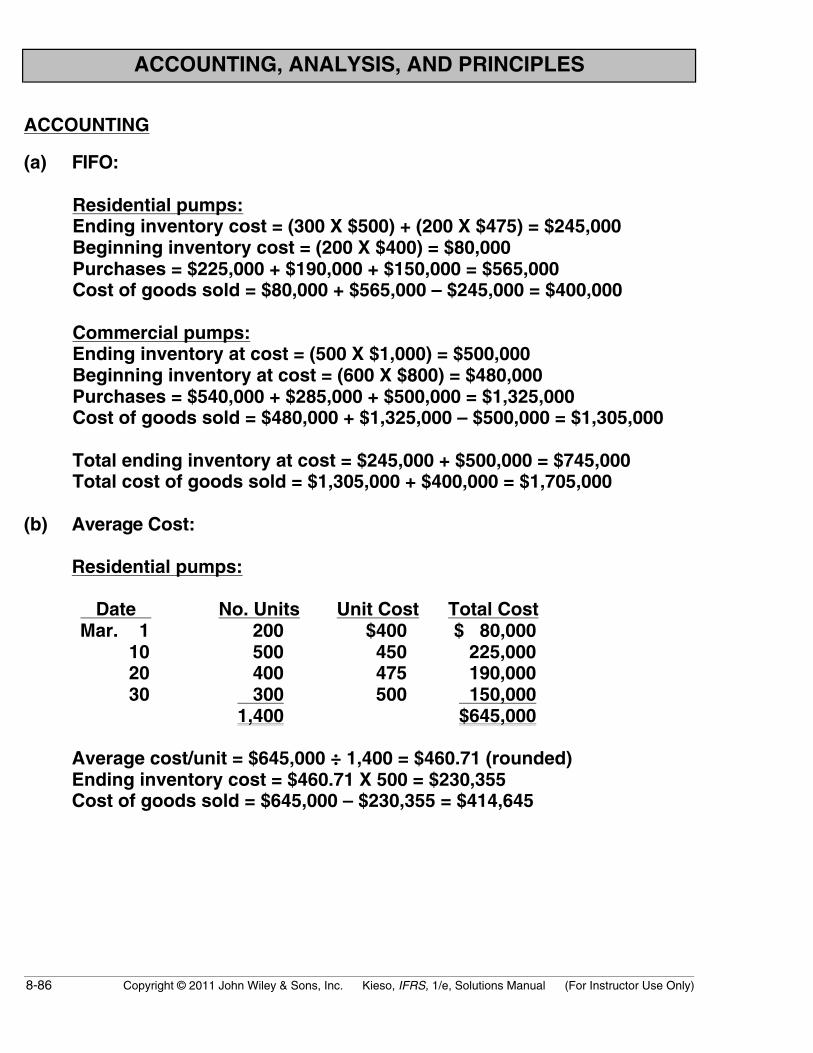
8-86 Copyright © 2011 John Wiley & Sons, Inc. Kieso, IFRS, 1/e, Solutions Manual (For Instructor Use Only)
ACCOUNTING, ANALYSIS, AND PRINCIPLES
ACCOUNTING
(a) FIFO:
Residential pumps:Ending inventory cost = (300 X $500) + (200 X $475) = $245,000Beginning inventory cost = (200 X $400) = $80,000Purchases = $225,000 + $190,000 + $150,000 = $565,000Cost of goods sold = $80,000 + $565,000 – $245,000 = $400,000
Commercial pumps:Ending inventory at cost = (500 X $1,000) = $500,000Beginning inventory at cost = (600 X $800) = $480,000Purchases = $540,000 + $285,000 + $500,000 = $1,325,000Cost of goods sold = $480,000 + $1,325,000 – $500,000 = $1,305,000
Total ending inventory at cost = $245,000 + $500,000 = $745,000Total cost of goods sold = $1,305,000 + $400,000 = $1,705,000
(b) Average Cost:
Residential pumps:
Date No. Units Unit Cost Total CostMar. 1 200 $400 $ 80,000
10 500 450 225,00020 400 475 190,00030 300 500 150,000
1,400 $645,000
Average cost/unit = $645,000 ÷ 1,400 = $460.71 (rounded)Ending inventory cost = $460.71 X 500 = $230,355Cost of goods sold = $645,000 – $230,355 = $414,645
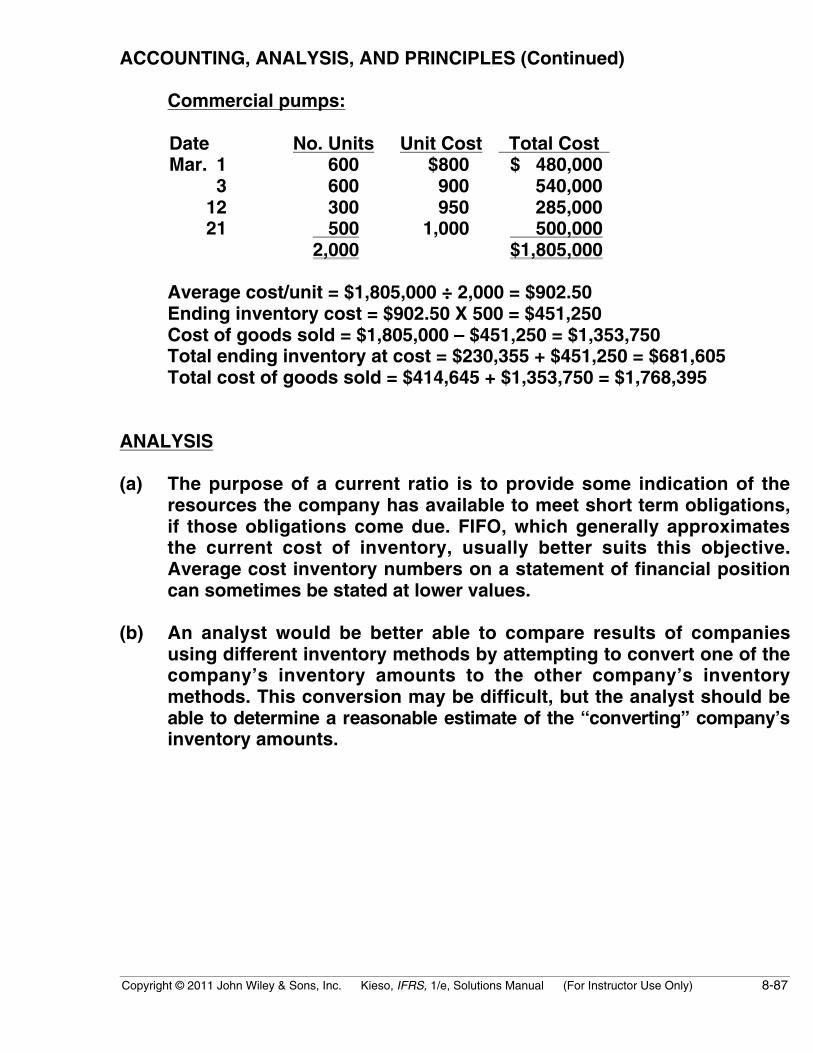
Copyright © 2011 John Wiley & Sons, Inc. Kieso, IFRS, 1/e, Solutions Manual (For Instructor Use Only) 8-87
ACCOUNTING, ANALYSIS, AND PRINCIPLES (Continued)
Commercial pumps:
Date No. Units Unit Cost Total Cost Mar. 1 600 $800 $ 480,000
3 600 900 540,00012 300 950 285,00021 500 1,000 500,000
2,000 $1,805,000
Average cost/unit = $1,805,000 ÷ 2,000 = $902.50Ending inventory cost = $902.50 X 500 = $451,250Cost of goods sold = $1,805,000 – $451,250 = $1,353,750Total ending inventory at cost = $230,355 + $451,250 = $681,605Total cost of goods sold = $414,645 + $1,353,750 = $1,768,395
ANALYSIS
(a) The purpose of a current ratio is to provide some indication of theresources the company has available to meet short term obligations,if those obligations come due. FIFO, which generally approximatesthe current cost of inventory, usually better suits this objective.Average cost inventory numbers on a statement of financial positioncan sometimes be stated at lower values.
(b) An analyst would be better able to compare results of companiesusing different inventory methods by attempting to convert one of thecompany’s inventory amounts to the other company’s inventorymethods. This conversion may be difficult, but the analyst should beable to determine a reasonable estimate of the “converting” company’sinventory amounts.
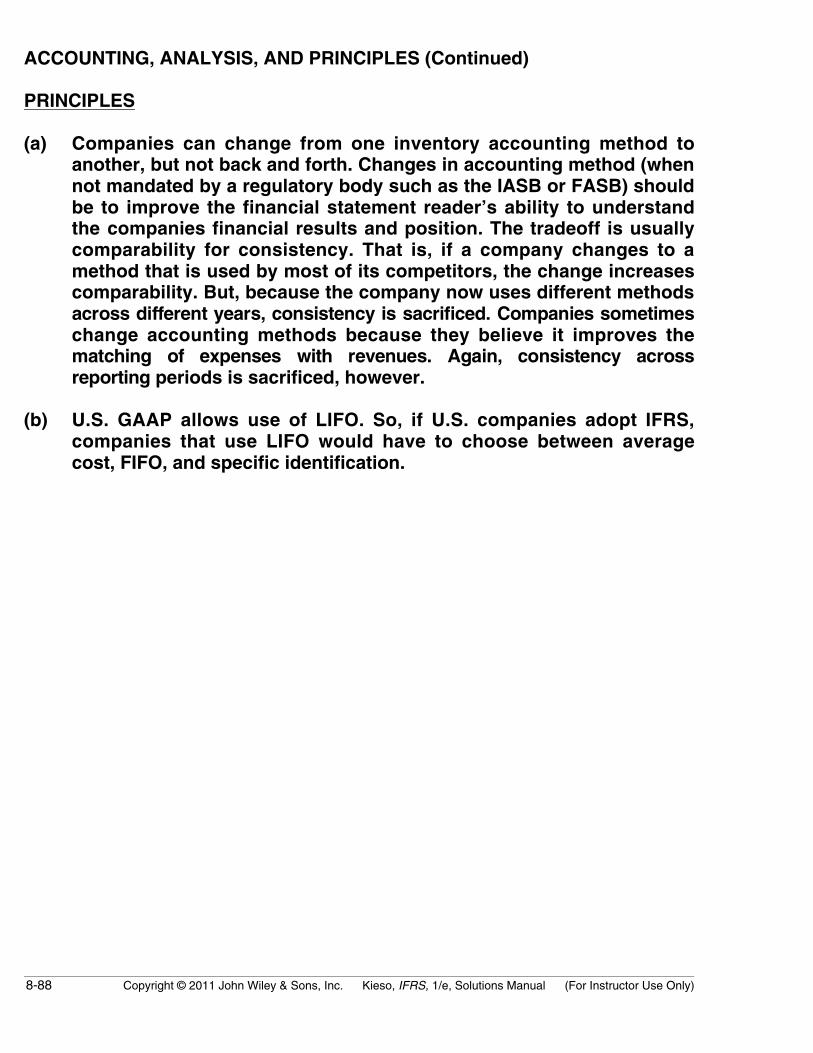
8-88 Copyright © 2011 John Wiley & Sons, Inc. Kieso, IFRS, 1/e, Solutions Manual (For Instructor Use Only)
ACCOUNTING, ANALYSIS, AND PRINCIPLES (Continued)
PRINCIPLES
(a) Companies can change from one inventory accounting method toanother, but not back and forth. Changes in accounting method (whennot mandated by a regulatory body such as the IASB or FASB) shouldbe to improve the financial statement reader’s ability to understandthe companies financial results and position. The tradeoff is usuallycomparability for consistency. That is, if a company changes to amethod that is used by most of its competitors, the change increasescomparability. But, because the company now uses different methodsacross different years, consistency is sacrificed. Companies sometimeschange accounting methods because they believe it improves thematching of expenses with revenues. Again, consistency acrossreporting periods is sacrificed, however.
(b) U.S. GAAP allows use of LIFO. So, if U.S. companies adopt IFRS,companies that use LIFO would have to choose between averagecost, FIFO, and specific identification.
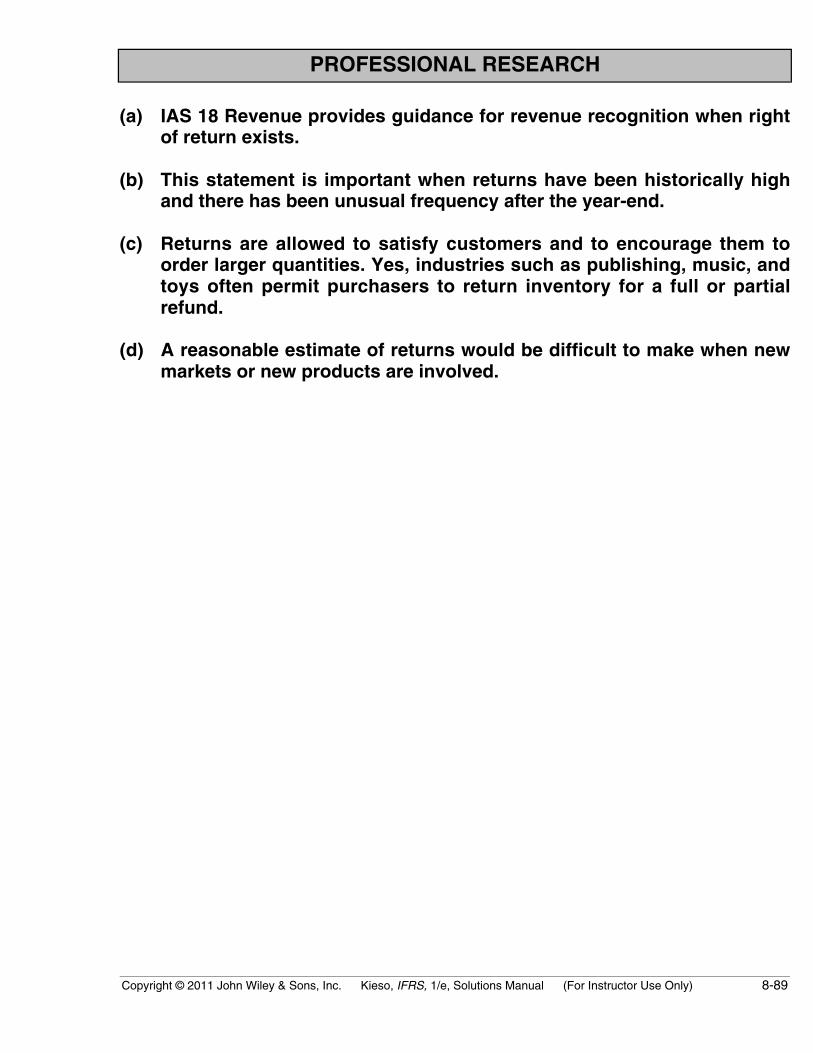
Copyright © 2011 John Wiley & Sons, Inc. Kieso, IFRS, 1/e, Solutions Manual (For Instructor Use Only) 8-89
PROFESSIONAL RESEARCH
(a) IAS 18 Revenue provides guidance for revenue recognition when rightof return exists.
(b) This statement is important when returns have been historically highand there has been unusual frequency after the year-end.
(c) Returns are allowed to satisfy customers and to encourage them toorder larger quantities. Yes, industries such as publishing, music, andtoys often permit purchasers to return inventory for a full or partialrefund.
(d) A reasonable estimate of returns would be difficult to make when newmarkets or new products are involved.

8-90 Copyright © 2011 John Wiley & Sons, Inc. Kieso, IFRS, 1/e, Solutions Manual (For Instructor Use Only)
PROFESSIONAL SIMULATION
Explanation
To: Norwel Management
From: Student
Re: Advantages of FIFO
The major advantages of the FIFO inventory method include the preventionof income manipulation and the valuation of ending inventory close tocurrent cost. In times of declining prices, FIFO will result in lower taxableincome, which in turn will reduce current taxes. As illustrated in the analysisabove the switch to FIFO resulted in a higher ending inventory, which leadsto a lower cost of goods sold and higher income; thus, Norwel’s reportedincome will be higher but so will its taxes. Note that under average cost,future taxes may be higher when lower cost items of inventory are sold infuture periods and matched with higher sales prices.