august 13, 2015 presentation: preliminary estimate
TRANSCRIPT

Department of Toxic Substances Control Kate Burger, P.G., Ph.D Senior Engineering Geologist Clean-up August 13,2015
Preliminary Estimate Distribution of Exide’s Lead Emissions in Soil
1

Preface
2
• Goal: Assess and document distribution of Exide’s lead emissions in soil – Data evaluation approach is different from methods used
to assess risk to human health and the environment.
– Rather, looking for distance from Exide facility at which Exide’s lead emissions are no longer present
• Findings presented today are preliminary. The evaluation is on-going.
• Based on data evaluation approach to be presented here, preliminary estimates show distribution of Exide’s emissions beyond initial Assessment Area

Conceptual Site Model for Distribution of Exide’s Lead Emissions in Soil
3
Decreasing lead concentrations with increasing distance from facility
Exide facility Urban levels

Conceptual Site Model for Distribution of Exide’s Lead Emissions in Soil
4
Carried further in downwind directions. Higher soil lead concentrations expected to the: - North - Southwest - Northeast - East
Source: SCAQMD, 2012, Ambient Measurements of Air Toxic Pollutants at Resurrection Catholic High School, Final Report, April, 2012.
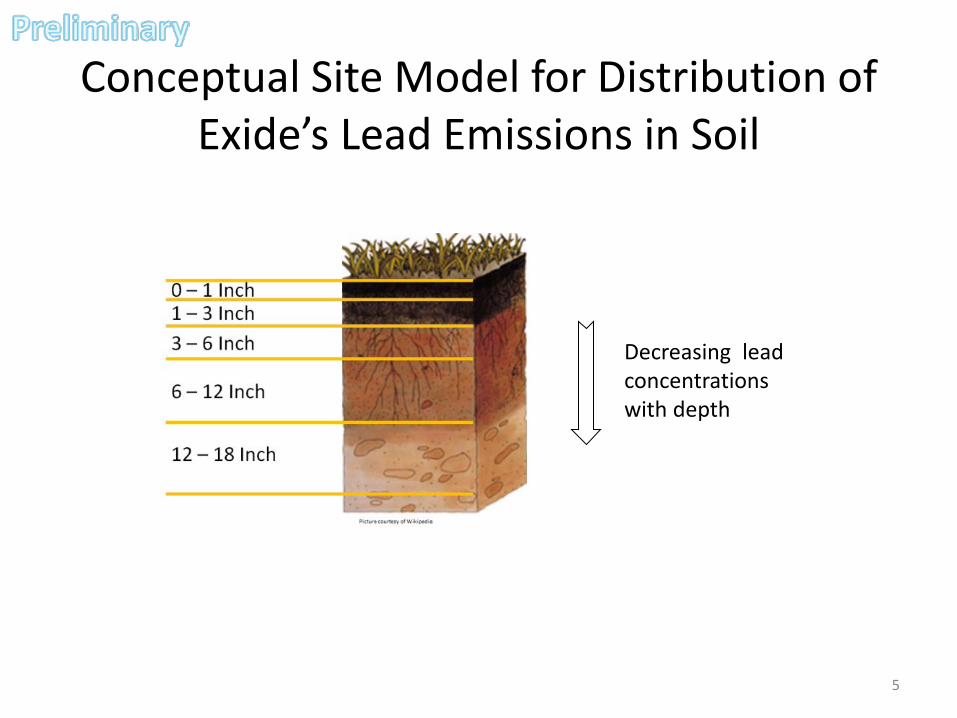
Conceptual Site Model for Distribution of Exide’s Lead Emissions in Soil
5
Decreasing lead concentrations with depth

Expected Pattern of Soil Lead Distribution Modified by Activities and Processes in Area
6
earth work
collection in drip zones
redistribution

Other Considerations
7
Table of Contents from USEPA’s report entitled “Sources of Lead in Soil: A Literature Review” (EPA 747-R-98-001a)
DTSC’s focus is holding Exide accountable for its lead emissions in soil.

Approach for Analyzing Geographic Distribution of Exide’s Lead Emissions in Soil
• Let data speak for itself
• Use straightforward data evaluation methods
• Develop multiple lines of evidence to estimate distribution of Exide’s emissions – Lead – Other metals
• Work with 0 to 6 inch depth interval because all data sets were sampled in this interval
8

Geographic Distribution of Metals Data
9

Summary of Soil Lead Data
Statistic Near Northern Assessment
Area
Northern Expanded
Area
Northern Transect
Southern Assessment
Area
Southern Expanded
Area
Southwest Transect
Northeast Transect
Eastern Area
Median (mg/kg)
280 220 195 130 155 156 110 130 91
10
Based on all samples collected from 0-6 inch depth interval “Near” samples collected from facility perimeter and 2,640 feet. mg/kg is milligrams per kilogram

Example Boxplot
11
Incr
easin
g Co
ncen
trat
ion
Data Group 1 Data Group 2
*
*
Median concentration (half data fall below this line, half of data falls above this line)
Lower line (“whisker”) represents 25% of data with lowest concentrations
Upper line (“whisker”) represents 25% of data with highest concentrations
Values significantly higher than rest of data in group

Summary of Soil Lead Data
12
milligrams per kilogram (mg/kg) Near, Northeast, and East of Exide
Near and North of Exide
Near
Near and South of Exide
Near
Near
“Near” data set is provided for reference on each graph
For visual clarity, values > 2,000 mg/kg not shown
For visual clarity, values > 2,000 mg/kg not shown
For visual clarity, values > 2,000 mg/kg not shown

Summary of Lead Data
13
Statistic Near Northern Assessment
Northern Expanded
N Stepout
No. Samples
48 2650 2988 63
Median (mg/kg)
280 220 195 130
Mean (mg/kg)
636 289 286 174
95% UCL (mg/kg)
874 312 324 209
For visual clarity, values > 6,000 mg/kg not shown
For visual clarity, values > 5,000 mg/kg not shown
Statistic Near Southern Assessment
Southern Expanded
SW Stepout
No. Samples
48 3702 2270 66
Median (mg/kg)
280 155 156 110
Mean (mg/kg)
636 193 194 377
95% UCL (mg/kg)
874 218 211 504
milligrams per kilogram (mg/kg)
Near Near
Near and North of Exide Near and South of Exide
For visual clarity, values > 2,000 mg/kg not shown
For visual clarity, values > 2,000 mg/kg not shown

Summary of Lead Data
14
Statistic Near NE Stepout East
No. Samples 48 63 48
Median (mg/kg)
280 130 91
Mean (mg/kg)
636 205 122
95% UCL (mg/kg)
874 269 146 milligrams per kilogram (mg/kg)
Near, Northeast, and East of Exide
For visual clarity, values > 2,000 mg/kg not shown

Summary of Lead Data
• In general, data fit conceptual site model that concentrations are decreasing with increasing distance from Exide facility.
– Mean concentration for data from southwest transect does not follow expected pattern and requires further evaluation.
• Further evaluate data with other methods.
15
Based on all samples collected from 0-6 inch depth interval “Near” samples collected from facility perimeter and 2,640 feet. mg/kg is milligrams per kilogram
Statistic Near Northern Assessment
Area
Northern Expanded
Area
Northern Transect
Southern Assessment
Area
Southern Expanded
Area
Southwest Transect
Northeast Transect
Eastern Area
Median (mg/kg)
280 220 195 130 155 156 110 130 91

Other Methods Used to Evaluate Lead Data
• Evaluate data based on – distance from facility – direction from facility, particularly in downwind
directions (N, SW, NE, E)
• Descriptive statistics
• Scatterplots
• Statistical comparisons
16

Analyze Data in Groups Based on Direction from Exide Facility
17
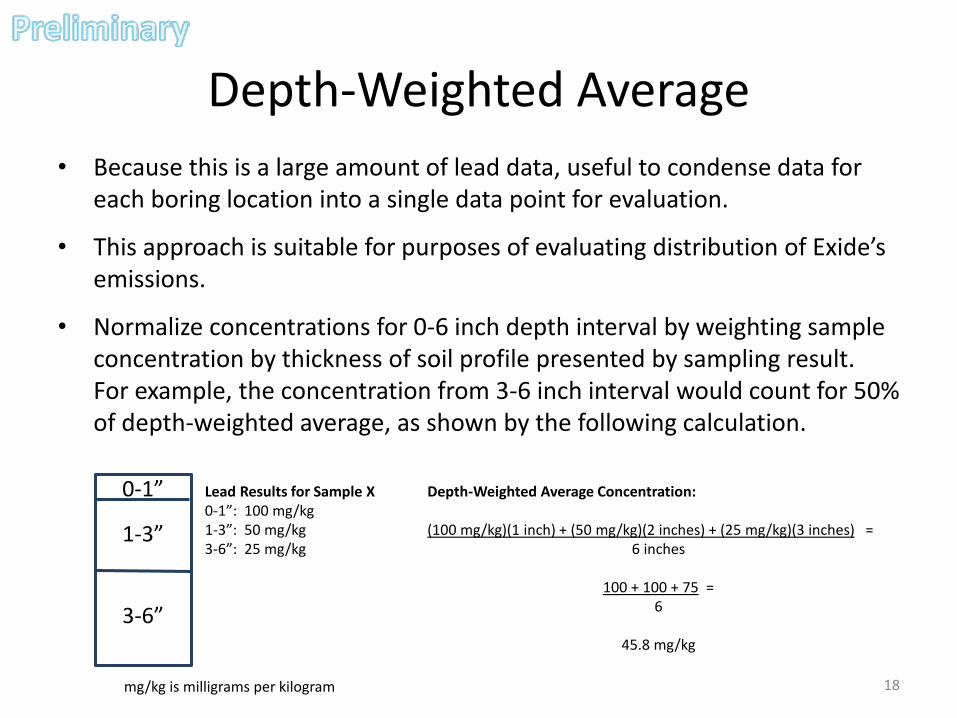
Depth-Weighted Average • Because this is a large amount of lead data, useful to condense data for
each boring location into a single data point for evaluation.
• This approach is suitable for purposes of evaluating distribution of Exide’s emissions.
• Normalize concentrations for 0-6 inch depth interval by weighting sample concentration by thickness of soil profile presented by sampling result. For example, the concentration from 3-6 inch interval would count for 50% of depth-weighted average, as shown by the following calculation.
18
0-1”
1-3”
3-6”
Lead Results for Sample X 0-1”: 100 mg/kg 1-3”: 50 mg/kg 3-6”: 25 mg/kg
Depth-Weighted Average Concentration: (100 mg/kg)(1 inch) + (50 mg/kg)(2 inches) + (25 mg/kg)(3 inches) =
6 inches
100 + 100 + 75 = 6
45.8 mg/kg
mg/kg is milligrams per kilogram

Lead Data Evaluation: Descriptive Statistics
19
Data Group No. of Data
Points
Mean (mg/kg)
Median (mg/kg)
Range (mg/kg)
Near 3 764 585 273 - 1433
Initial Area 885 294 229 11 - 2338
Expanded Area
758 291 202 13 - 4858
Step-out 21 181 135 26 - 612
Example: Northern Data Set (one data point per boring location)
Depth-weighted average concentrations mg/kg is milligrams per kilogram.
For visual clarity, values > 2,000 mg/kg not shown

Lead Data Evaluation: Scatterplot
20
0
500
1000
1500
2000
2500
3000
3500
4000
4500
5000
0 5000 10000 15000 20000 25000
Conc
entr
atio
n (m
g/kg
)
Distance from Exide (feet)
Soil (0-6 inches) Lead Concentrations vs. Distance North of Facility
(One data point per boring location)
Initial & Expanded Assessment Area locations
Near facility locations (only 3 locations fall in northern directional wedge)
Railyard No Access
Step-out sampling locations, northern transect
mg/kg is milligrams per kilogram

Lead Data Evaluation: Scatterplot
21
0
500
1000
1500
2000
2500
3000
3500
4000
4500
5000
0 5000 10000 15000 20000 25000
Conc
entr
atio
n (m
g/kg
)
Distance from Exide (feet)
Soil (0-6 inches) Lead Concentrations vs. Distance North of Facility
(One data point per residential property)
Visually interpreted breakpoint in data at ~7,100 to 9,000 feet (1.3 to 1.7 miles)
Data fits conceptual site model: Decreasing concentrations with increasing distance from facility.
Raily
ard
– no
acc
ess
mg/kg is milligrams per kilogram

Statistically Compare Amounts of Lead Closer to and Farther From Facility
• Similar to graphical approach shown on previous slide
• Compares mean concentrations from data group closer to facility vs. data group farther from facility
– At some distance, amount of lead in soil closer to the facility will be higher than amount of lead in soil farther from facility
22
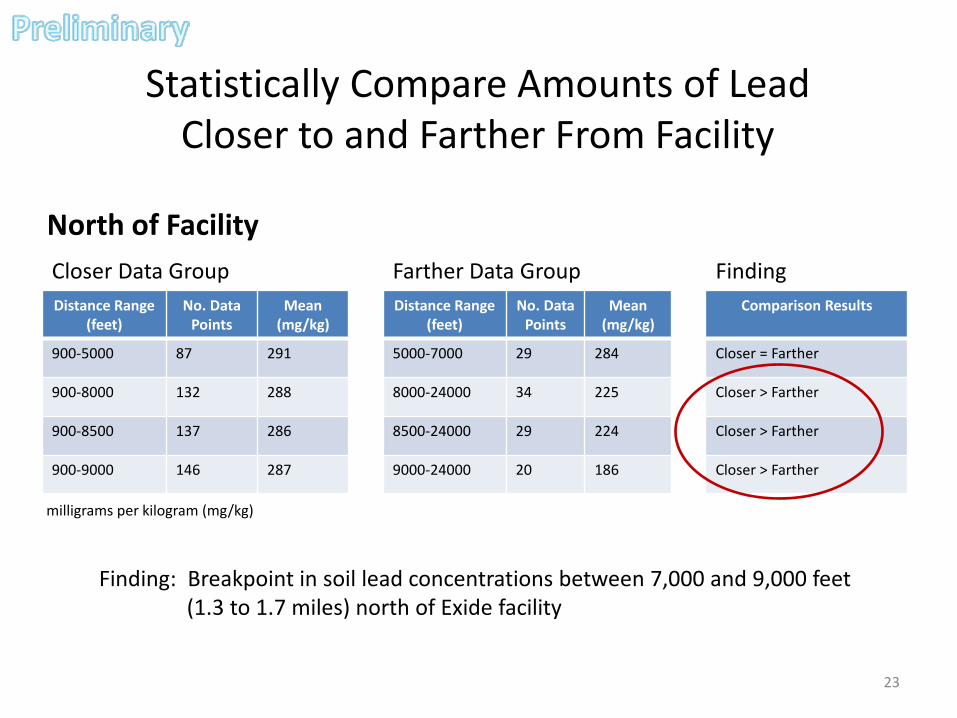
Statistically Compare Amounts of Lead Closer to and Farther From Facility
23
milligrams per kilogram (mg/kg)
Distance Range (feet)
No. Data Points
Mean (mg/kg)
900-5000 87 291
900-8000 132 288
900-8500 137 286
900-9000 146 287
Distance Range (feet)
No. Data Points
Mean (mg/kg)
5000-7000 29 284
8000-24000 34 225
8500-24000 29 224
9000-24000 20 186
Comparison Results
Closer = Farther
Closer > Farther
Closer > Farther
Closer > Farther
Closer Data Group Farther Data Group Finding
Finding: Breakpoint in soil lead concentrations between 7,000 and 9,000 feet (1.3 to 1.7 miles) north of Exide facility
North of Facility

Soil Lead Concentrations in Areas Estimated to be Inside and Outside of Exide Emissions
24
Mean: 287 Median: 262
Mean: 186 Median: 136
Inside Preliminary Estimate of Area of Influence from Exide Emissions
Outside Preliminary Estimate of Area of Influence from Exide Emissions
mg/kg is milligrams per kilogram
North of Facility

Lead Data Evaluation: South & Southwest of Facility
25
Preliminary statistical comparisons were not conclusive. Additional data required.
0
1000
2000
3000
4000
5000
6000
0 5000 10000 15000 20000 25000
Conc
entr
atio
n (m
g/Kg
)
Distance from Exide (feet)
Soil (0-6 inches) Lead Concentrations vs. Distance (One Data Point per Boring Location)
mg/kg is milligrams per kilogram
Near
Initial & Expanded Assessment Areas
Possible breakpoint in data ~8,300-9400 feet (1.5 to 1.8 miles)
Southwest Transect

Lead Data Evaluation: Northeast and East of Facility
26
0
500
1000
1500
2000
2500
0 5000 10000 15000 20000 25000
Conc
entr
atio
n (m
g/kg
)
Distance from Exide Facility (Feet)
Soil (0-6 Inches) Lead Concentrations vs. Distance Northeast and East of Exide Facility
(One data point per boring location)
NE
E
Visually interpreted breakpoint in data ~7,600 to 9000 feet (1.4–1.7 miles)
Because smaller data set, more difficult to draw conclusions. More data needed to support statistical comparisons. Process underway to obtain more data.
No. Data Points Mean Median 172 255 182
No. Data Points Mean Median 63 191 168
Inside Area of Exide Emissions
Outside Area of Exide Emissions Near facility locations within NE/E directional wedge
No
acce
ss (r
aily
ard)
or a
cces
s co
nstr
aint
s (c
omm
erci
al a
rea)
mg/kg is milligrams per kilogram

Emissions from Secondary Lead Smelters Include Other Metals
• Commonly associated metals: – Antimony (about 5% of “hard lead”) – Arsenic – Cadmium – Copper – Nickel – Zinc
• To support evaluation, performed additional analyses for metals on previously collected samples
27

Evaluation of Other Metals
• Additional line of evidence to refine estimated distribution
• 0 – 6 inch depth interval
• 1,556 boring locations have metals data in addition to lead – Used all available data, even if not specifically
collected for this analysis – Work with individual data points
28

Evaluation Methods for Other Metals
• Evaluate groupings of data based on distance and direction from facility
• Descriptive statistics
• Graphing
• Comparison to reference concentrations for California soils
• Literature techniques to look for emission signature
29

Antimony Concentrations in Soil
30
Statistic Near Assessment (north & south)
Expanded (north & south)
No. Samples with Detections
45 459 138
Mean (mg/kg) 7.6 1.2 1.6
Median (mg/kg) 4.3 1.0 1.2
mg/kg is milligrams per kilogram
Near
For visual clarity, values > 20 mg/kg not shown

Distribution of Antimony Concentrations in Soil
31
0
5
10
15
20
25
30
35
40
0 5000 10000 15000 20000 25000
Conc
entr
atio
n (m
g/Kg
)
Distance from Exide Facility (feet)
Soil Concentrations (0-6 inches) vs. Distance from Exide Facility (each sample result plotted individually)
mg/kg is milligrams per kilogram

Distribution of Antimony Concentrations in Soil
32
0
5
10
15
20
25
30
35
40
0 2000 4000 6000 8000 10000 12000 14000 16000
Conc
entr
atio
n (m
g/Kg
)
Distance from Exide Facility (feet)
Antimony Concentrations in Soil (0-6 inches) vs. Distance from Exide Facility
N
NE
E
SE
S
SW
W
NW
Potential breakpoint to N ~1.5 miles
mg/kg is milligrams per kilogram

Literature Methods
• Correlation of metal to lead concentration in given sample. High degree of correlation as possible indicator of smelter emissions.
• Ratio of metal to lead concentration in given sample. Potential signature of smelter emissions.
• Initial stages of analysis. More work to be done.
33

Example Antimony to Lead Correlation
34
y = 0.0054x + 1.5756 R² = 0.9042
0
5
10
15
20
25
30
0 500 1000 1500 2000 2500 3000 3500 4000 4500 5000
Antim
ony
(mg/
kg)
Lead (mg/kg)
Antimony vs. Lead Concentrations in Soil (0-6") to West
Data available between facility perimeter and 2,400 feet.
mg/kg is milligrams per kilogram
Western Data Set

Antimony to Lead Ratio
35
0
50
100
150
200
250
300
0 2000 4000 6000 8000 10000 12000 14000 16000
Antim
ony
to L
ead
Ratio
(N
orm
aliz
ed L
ead
Conc
entr
atio
n)
Distance from Exide Facility (feet)
Ratio of Antimony to Lead in Soil (0-6 inches) vs. Distance from Exide Facility
N
NE
E
SE
S
SW
W
NW
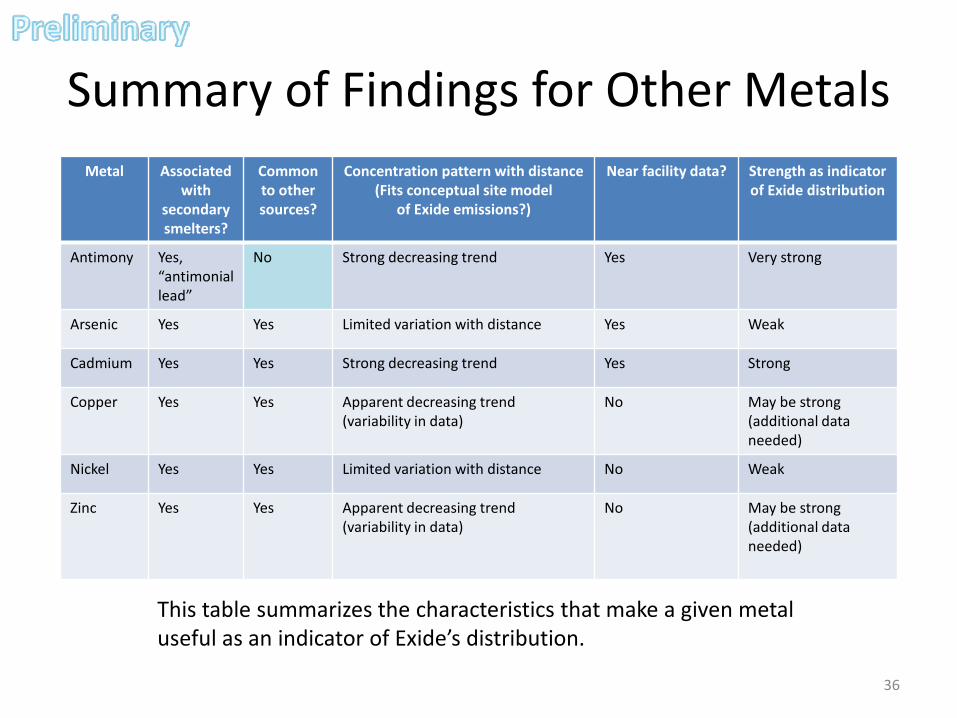
Summary of Findings for Other Metals Metal Associated
with secondary smelters?
Common to other sources?
Concentration pattern with distance (Fits conceptual site model
of Exide emissions?)
Near facility data? Strength as indicator of Exide distribution
Antimony Yes, “antimonial lead”
No Strong decreasing trend Yes Very strong
Arsenic Yes Yes Limited variation with distance Yes Weak
Cadmium Yes Yes Strong decreasing trend Yes Strong
Copper Yes Yes Apparent decreasing trend (variability in data)
No May be strong (additional data needed)
Nickel Yes Yes Limited variation with distance No Weak
Zinc Yes Yes Apparent decreasing trend (variability in data)
No May be strong (additional data needed)
36
This table summarizes the characteristics that make a given metal useful as an indicator of Exide’s distribution.

Summary
37
Line of Evidence
N NE / E S / SW W / NW
Lead ~1.3-1.7 miles ~1.4-1.7 miles ~1.5-1.8 miles --
Antimony ~1.5 miles -- -- >0.5 miles
• Findings support conceptual site model of: (1) decreasing concentrations with increasing distance and (2) lead concentrations that merge with urban lead levels
• Based on data evaluation approach presented, preliminary estimates of distribution of Exide’s emissions:

Next Steps
38
• Continue evaluating lead distribution
• Address data gaps – more data near facility (upcoming industrial sampling effort)
– more data near estimated extent
• Summary report (in development) will be shared for external scientific peer review