resource estimate, preliminary economic assessment ... · 1 resource estimate, preliminary economic...
TRANSCRIPT

1
RESOURCE ESTIMATE, PRELIMINARY ECONOMIC ASSESSMENT & DETAILED FEASIBILITY STUDY
ON THE
OMAGH GOLD PROJECT
COUNTY TYRONE,
NORTHERN IRELAND
26th July 2014
R.Phelps C.Eng., B.Sc(Hons), MIOM3
Dr. S. Coulter B.Sc(Hons), M.Sc, PhD, FGS
M. Mawson B.Sc(Hons), FGS.,
G. Harris B.Eng(Hons), ACSM, GradIMMM

2
NI.43-101 Report, 2014 Revision
Contents 1. SUMMARY ..................................................................................................................................... 6
1.1 SUMMARY DESCRIPTION……………………………………………………………………………………………….……..….6
1.2 MINERAL RESOURCE ESTIMATE ……………………………………………………………………………………….……...9
1.3 MINING STUDY RESOURCE UTILISATION ………………………………………………………….………………..….11
1.4 MINE PLAN………………………………………..……………………………………………………………………………….….11
1.5 ECONOMIC SUMMARY………………………………………………………………………………………..…………………13
2. INTRODUCTION ........................................................................................................................... 14 3. RELIANCE ON THIRD PARTIES ...................................................................................................... 15 4. PROPERTY DESCRIPTION AND LOCATION ................................................................................... 15
4.1 MINERAL LEGISLATION AND LICENSING .................................................................................. 15 4.2 LOCATION ................................................................................................................................. 16 4.3 OMAGH MINERALS LTD LICENCES ........................................................................................... 16 4.4 PERMITS ................................................................................................................................... 19
5. ACCESSIBILITY, CLIMATE, LOCAL RESOURCES, INFRASTRUCTURE AND PHYSIOGRAPHY ............ 19 6. HISTORY ...................................................................................................................................... 20
6.1. PROJECT HISTORY ..................................................................................................................... 21 6.2 HISTORICAL ESTIMATES OF MINERAL RESOURCES AND RESERVES. ........................................ 22
6.2.1 INTRODUCTION ................................................................................................................ 22 6.2.2 1995 RESOURCE/RESERVE ESTIMATE .............................................................................. 23 6.2.3 CONFORMITY OF 1995 RESOURCES TO CIM CLASSIFICATION ......................................... 24 6.2.4 2004 RESOURCE AND RESERVE STUDY ............................................................................ 24 6.2.5 BULK MINING TRIALS, 2003.............................................................................................. 25 6.2.6 2008 RESOURCE ESTIMATE .............................................................................................. 26
6.3 OPEN PIT MINING, 2006-2012 ................................................................................................. 27 7 GEOLOGICAL SETTING AND MINERALISATION ............................................................................ 27
7.1 REGIONAL GEOLOGY AND GOLD DEPOSITS ............................................................................. 28 7.2 LOCAL GEOLOGY ....................................................................................................................... 29 7.3 MINERALISATION ..................................................................................................................... 32
8 DEPOSIT TYPES ............................................................................................................................ 34 9. REGIONAL AND CROSS BORDER EXPLORATION .......................................................................... 34 10. HISTORICAL EXPLORATION WITHIN THE MINE SITE .................................................................... 39
10.1 CHANNEL SAMPLING, 2012 ...................................................................................................... 40 10.1.1 KEARNEY VEIN .................................................................................................................. 40 10.1.2 JOSHUA VEIN .................................................................................................................... 40 10.1.3 KERR VEIN ......................................................................................................................... 40
10.2 EXPLORATION POTENTIAL AND PRIORITISED PROJECT TARGETS IN OM1-09 ......................... 41 11 DRILLING ...................................................................................................................................... 45
11.1 OVERVIEW ................................................................................................................................ 45 11.2 DRILLING METHODOLOGY ....................................................................................................... 48 11.3 CORE RECOVERY ....................................................................................................................... 49 11.4 DRILLING RESULTS 2011-2014.................................................................................................. 53
11.4.1 JOSHUA DRILLING ............................................................................................................. 55 11.4.2 KEARNEY DRILLING ........................................................................................................... 56 11.4.3 KERR DRILLING ................................................................................................................. 57
12 SAMPLE PREPARATION, ANALYSES AND SECURITY ..................................................................... 57
3
12.1 QUALITY ASSURANCE AND QUALITY CONTROL ....................................................................... 60 12.1.1 OMAC INTERNAL LABORATORY QA/QC ........................................................................... 60
12.2 GALANTAS QA/QC .................................................................................................................... 63
12.2.1 GALANTAS STANDARD SAMPLES, 2012-2014 .................................................................. 63 12.2.1.1 GALANTAS STANDARD SAMPLES, 2013-2014 .............................................................. 65 12.2.2 PULP RE ASSAY SAMPLES ................................................................................................. 66 12.2.3 BLANK SAMPLES ............................................................................................................... 67
12.3 QA/QC CONCLUSIONS .............................................................................................................. 68 13 DATA VERIFICATION .................................................................................................................... 68 14 MINERAL PROCESSING AND METALLURGICAL TESTING ............................................................. 69 15 MINERAL RESOURCE ESTIMATES ................................................................................................ 69
15.1 RESOURCE ESTIMATION OVERVIEW ........................................................................................ 69 15.2 SOFTWARE................................................................................................................................ 69 15.3 DATABASE COMPILATION ........................................................................................................ 69 15.4 DATABASE VALIDATION ........................................................................................................... 71 15.5 COLLAR LOCATIONS.................................................................................................................. 72
15.6.1 INTERPRETATION OF MINERALISED ZONES ..................................................................... 73 15.7 WIREFRAMING ......................................................................................................................... 75
15.7.1 SAMPLE DATA SELECTION, TOP-CUTTING AND COMPOSITING ....................................... 78 15.7.2 GLOBAL REFERENCE ESTIMATE ........................................................................................ 81 15.7.3 GEOSTATISTICS ................................................................................................................. 81
15.8 BLOCK MODELLING .................................................................................................................. 82 15.9 GRADE INTERPOLATION ........................................................................................................... 83 15.10 RESOURCE CLASSIFICATION ................................................................................................. 88 15.11 DENSITY ................................................................................................................................ 91 15.12 RESOURCE TABLE ................................................................................................................. 92 15.13 MODEL VALIDATIONS ........................................................................................................... 93 15.14 COMPARISON WITH PREVIOUS RESOURCE ESTIMATES ...................................................... 97
16 MINERAL RESERVE ESTIMATES .................................................................................................... 98 17 MINING STUDY ........................................................................................................................... 98
17.1 MINING OVERVIEW .................................................................................................................. 98 17.2 SITE LAYOUT ............................................................................................................................. 99 17.3 MINING PARAMETERS .............................................................................................................. 99 17.4 ADIT INSTALLATION ................................................................................................................ 100
17.4.1 KEARNEY PIT REHABILITATION ....................................................................................... 100 17.4.2 MINE ADIT ...................................................................................................................... 101
17.5 GEOTECHNICAL PARAMETERS ............................................................................................... 102 17.5.1 ROCK MASS CHARACTERISATION ................................................................................... 103 17.5.2 Q - QUALITY RATING ....................................................................................................... 103 17.5.3 RMR AND MRMR – ROCK MASS RATING SYSTEM.......................................................... 104 17.5.4 MINE DESIGN PARAMETERS ........................................................................................... 105 17.5.5 MODIFIED STABILITY GRAPH ASSESSMENT .................................................................... 105 17.5.6 MODIFIED ROCK TUNNELLING QUALITY Q’ VALUE ........................................................ 105 17.5.7 STOPE SPANS .................................................................................................................. 106 17.5.8 DEVELOPMENT ............................................................................................................... 107
17.6 UNDERGROUND MINE LATERAL DEVELOPMENT ................................................................... 107 17.6.1 LATERAL DEVELOPMENT ASSUMPTIONS ....................................................................... 107 17.6.2 DEVELOPMENT DIMENSIONS ......................................................................................... 108 17.6.3 DEVELOPMENT GROUND SUPPORT ............................................................................... 109 17.6.4 RESIN GROUTED BOLTS .................................................................................................. 109
4
17.6.5 FRICTION BOLTS ............................................................................................................. 110 17.6.6 FIBRECRETE ..................................................................................................................... 110 17.6.7 WELDED MESH ............................................................................................................... 111 17.6.8 GROUND SUPPORT MANAGEMENT PLAN ..................................................................... 111 17.6.9 DEVELOPMENT DRILLING ............................................................................................... 111 17.6.10 DEVELOPMENT CHARGING ........................................................................................ 111
17.7 UNDERGROUND MINE VERTICAL DEVELOPMENT ................................................................. 112 17.7.1 VENTILATION SHAFTS AND RAISES ................................................................................. 112 17.7.2 EMERGENCY EGRESS AND LADDERWAY RAISES ............................................................ 112 17.7.3 MAN WAYS AND ORE PASSES ........................................................................................ 113 17.7.4 STOPING RAISES ............................................................................................................. 113
17.8 UNDERGROUND MOBILE EQUIPMENT .................................................................................. 114 17.9 VENTILATION .......................................................................................................................... 114
17.9.1 PRIMARY VENTILATION .................................................................................................. 115 17.9.2 SECONDARY VENTILATION ............................................................................................. 115 17.9.3 DIESEL EXHAUST EMISSIONS .......................................................................................... 115 17.9.4 DUST ............................................................................................................................... 116 17.9.5 EXPLOSIVE FUMES .......................................................................................................... 116
17.10 STOPING ............................................................................................................................. 116 17.10.1 SUBLEVEL LONGHOLE STOPING (SLS) ......................................................................... 116 17.10.2 SHRINKAGE STOPING ................................................................................................. 117
17.11 BACKFILLING ....................................................................................................................... 118 17.11.1 PASTE FILL PROCESS ................................................................................................... 118 17.11.2 PASTE RETICULATION ................................................................................................. 119 17.11.3 PASTE BACKFILL OF STOPES ....................................................................................... 119 17.11.4 BACKFILL BARRICADES ................................................................................................ 119 17.11.5 CEMENT CONTENT ..................................................................................................... 120
17.12 UNDERGROUND INFRASTRUCTURE ................................................................................... 121 17.12.1 MINE POWER .............................................................................................................. 121 17.12.2 COMPRESSED AIR ....................................................................................................... 121 17.12.3 MINE WATER .............................................................................................................. 121 17.12.4 UNDERGROUND CRUSHER ......................................................................................... 121 17.12.5 ORE CONVEYORS ........................................................................................................ 121 17.12.6 SERVICE BAY ............................................................................................................... 123
17.13 LABOUR .............................................................................................................................. 123 17.14 MINING RESOURCES ........................................................................................................... 124
17.14.1 DILUTION .................................................................................................................... 124 17.14.2 MINING RECOVERY ..................................................................................................... 124 17.14.3 CUT OFF GRADE DETERMINATION ............................................................................. 125 17.14.4 RESERVE CUT OFF GRADE (RCOG) .............................................................................. 125 17.14.5 INCREMENTAL CUT OFF GRADE (ICOG)...................................................................... 125 17.14.6 CUT OFF GRADES ........................................................................................................ 125 17.14.7 MINING STUDY ESTIMATE .......................................................................................... 126
17.15 MINE PRODUCTION ............................................................................................................ 127 17.15.1 MINE LAYOUT ............................................................................................................. 127 17.15.2 KEARNEY OREBODY .................................................................................................... 127 17.15.3 JOSHUA OREBODY ...................................................................................................... 129 17.15.4 MINING RATES ............................................................................................................ 130 17.15.5 MINE OPERATING HOURS AND SHIFT DURATIONS .................................................... 130 17.15.6 DAILY AND ANNUAL ORE PRODUCTION ..................................................................... 131
17.16 MINING SCHEDULE ............................................................................................................. 131
5
17.16.1 MINING PHYSICALS ..................................................................................................... 131 17.17 INCLUSION OF INFERRED RESOURCE ................................................................................. 132
17.17.1 COMPARISON OF LOM SCHEDULE INCLUDING AND EXCLUDING INFERRED RESOURCE ......... 134 18 MINERAL PROCESSING .............................................................................................................. 136
18.1 PROCESSING FACILITY ............................................................................................................ 136 18.2 PROCESS FLOW SHEET ........................................................................................................... 138 18.3 MILL RECOVERY ...................................................................................................................... 139
18.3.1 CONCENTRATE ............................................................................................................... 139 18.3.2 REFINING ........................................................................................................................ 140 18.3.3 TAILINGS ......................................................................................................................... 140
19 CONTRACTS AND MARKET STUDIES .......................................................................................... 140 19.1 OFF-TAKE AGREEMENT .......................................................................................................... 140 19.2 GOLD PRICE IN US DOLLARS AND UK STERLING ..................................................................... 140
20 ENVIRONMENTAL STUDIES, PERMITTING AND SOCIAL OR COMMUNITY IMPACT .................. 143 20.1 PERMITTING ........................................................................................................................... 143 20.2 RECENT ENVIRONMENTAL STUDIES ....................................................................................... 143
21 CAPITAL, OPERATING COSTS .................................................................................................... 143 22 ECONOMIC ANALYSIS ................................................................................................................ 145 23 ADJACENT PROPERTIES…………………………………………………………………………………………………………147 24. OTHER RELEVANT DATA AND INFORMATION ........................................................................... 147 25. INTERPRETATION AND CONCLUSIONS ...................................................................................... 148 26. RECOMMENDATIONS……………………………………………………………………………………………………………148
27. REFERENCES ............................................................................................................................... 149 28. CERTIFICATE ............................................................................................................................... 152 APPENDIX 1: CIM AND PERC COMPARISON ............................................................................. 153 APPENDIX 2: DRILL DATA………………………………………………………………………………………………………154 APPENDIX 3: VEIN WIDTH AND GRADE FREQUENCY……………………………………………………………..162

6
1. SUMMARY
Galantas Gold Corporation (with its wholly owned subsidiary Omagh Minerals Ltd - OML) has prepared
an updated mineral resource estimate for the Cavanacaw gold deposit, in accordance with the
reporting standards and definitions of the Pan-European Reporting Code (PERC). This report (Galantas
2014) provides a summary of the project geology and exploration programme, a revised mineral
resource estimate and the results of economic studies.
INDEPENDENCE
This report (Galantas 2014) has not been prepared independently of Galantas Gold Corporation. It has
been prepared under the overall supervision of R. Phelps C.Eng. MIOM3, (President & CEO of Galantas
Gold Corporation) a Qualified Person for the purposes of Canadian National Instrument 43-101. Parts
of the report have been drawn from prior independent reports where that information has been
assessed as reasonable in the context in which it is used.
REGULATORY CONTEXT
The economic study, summarised in this report, includes use of Measured and Indicated resources
with a minor portion of Inferred resources estimated for two veins (Joshua and Kearney veins). The
Inferred resources are contiguous with or lie within scheduled mining areas. The use of Inferred
resources, in a restricted qualifying manner, is permitted by the PERC code in regard to economic
studies but is excluded within Canadian National Instrument 43-101, except within a “Preliminary
Economic Assessment (PEA)”. In compliance with the disclosure requirements of Canadian National
Instrument (NI.) 43-101, it has been determined that the economic study including associated inferred
resources is deemed a Preliminary Economic Assessment. PERC is an approved code is respect of NI.
43-101. As part of PERC requirements, a comparative study is required which does not include inferred
resources. In the circumstances of this report, this second economic study meets the requirements of
a feasibility study.
1.1 SUMMARY DESCRIPTION The Cavanacaw Mine is located approximately 5 kilometres from of Omagh, County Tyrone, Northern
Ireland. It is situated on freehold land owned by Omagh Minerals Ltd (OML). OML holds a Mining
License for gold and silver from the Crown Estate Commissioners (CEC) and Exploration Licenses from
CEC and the Department of Enterprise, Trade and Investment Northern Ireland (DETI), the latter over
approximately 439 sq. kms. Additionally OML holds Exploration Licenses in the Republic Of Ireland,
contiguous with its licenses in Northern Ireland.
The mine has good access by public road and is approximately a 1.5 hour drive west of Belfast. The
mine is located on rough agricultural land.
ACA Howe International Ltd (ACA Howe), in an independent Technical Report On The Omagh Gold
Project, Counties Tyrone and Fermanagh, Northern Ireland - Parker and Pearson August 10th 2012
(Howe 2012) gave the following historical context, geological description and description of data
gathering techniques employed by Galantas :-
The occurrence of gold in the Sperrin Mountains in Northern Ireland has been known for centuries but
no mining operations have taken place prior to that at Cavanacaw. Following the discovery of vein gold
7
at Curraghinalt by Ennex International in the mid 1980’s, Riofinex North Ltd (Riofinex) commenced
exploration of an area of similar rocks located south-west of Omagh which led to the discovery of the
gold bearing Kearney vein structure and the surrounding swarm of veins at Cavanacaw. The deposit
was evaluated by stripping of overburden and carrying out intensive channel sampling of the exposed
vein and by diamond drilling.
In 1990, the Riofinex project was transferred to Omagh Minerals (OML) who commissioned
metallurgical, mining and environmental studies.
In 1997, European Gold Resources Inc (EGR) acquired Omagh Minerals (OML) who re-excavated the
open cut on the Kearney structure and carried out selective mining trials at the southern end of the
Kearney structure to extract high grade ore and produce gold bullion and jewellery under the Galantas
brand name.
In 2003, EGR commissioned ACA Howe to prepare a technical report in compliance with Canadian NI
43-101 and to carry out a compilation of exploration data over the Lack inlier. The study identified
twenty-four exploration targets. Follow-up on these targets resulted in the discovery of gold
mineralisation at Cornavarrow Burn East, where a shear zone containing disseminated pyrite and
galena included a 1.5m section returning 1.15 g/t gold.
European Gold Resources Inc was re-named Galantas Gold Corporation in 2004. Subsequent to a
financing in the spring of 2005, Galantas initiated mine development by engaging technical staff,
updating engineering design, procuring both mobile plant and processing plant equipment and
removing further overburden. Construction of the ore processing plant commenced in November 2005
and mining development commenced in early 2006.
The mineral resources on which the Omagh Gold Project is based are hosted by a system of mineralised
veins and shear structures within which more than a dozen individual deposits have been identified
over a 4 sq. kms area. The most intensively studied area is the Kearney Structure, which has been
diamond drill tested over its approximately 850 m length and shown to persist to at least 300 m below
surface.
A resource and reserve estimate carried out by ACA Howe in 1995 estimated a total of 1.9 million
tonnes at 7.06 g/t Au of Indicated resources and Probable reserves. That historical estimate is not in
accordance with the Canadian Institute of Mining and Metallurgy and Petroleum CIM Standards on
Minerals Resources and Reserve Definitions (“CIM Standards”) and therefore does not conform to
sections 1.3 and 1.4 of NI 43-101.
A CIM compliant resource estimate by ACA Howe in 2008 estimated Measured resources at the
Kearney vein at 78,000 t at 6.35 g.t Au, Indicated resources at 350,000 at 6.74 g/t Au and Inferred
resources at 730,000 t at 9.27 g/t Au. Open Pit mining at the Kearney vein commenced in 2006. By May
2012, mining was largely restricted to the northern end of the pit, mining in other parts having reached
its economic limits as dictated by stripping ratio, by the property boundary and public road to the east,
and by rock stockpiles to the west.
The Cavanacaw deposit lies within the Caledonian orogeny which extends through Scandinavia, the
British Isles, Newfoundland and the Appalachians. It is hosted by rocks of Neoproterozoic age of the
Dalradian Supergroup, which host similar orogenic vein deposits at Curraghinalt 27 km northeast and
8
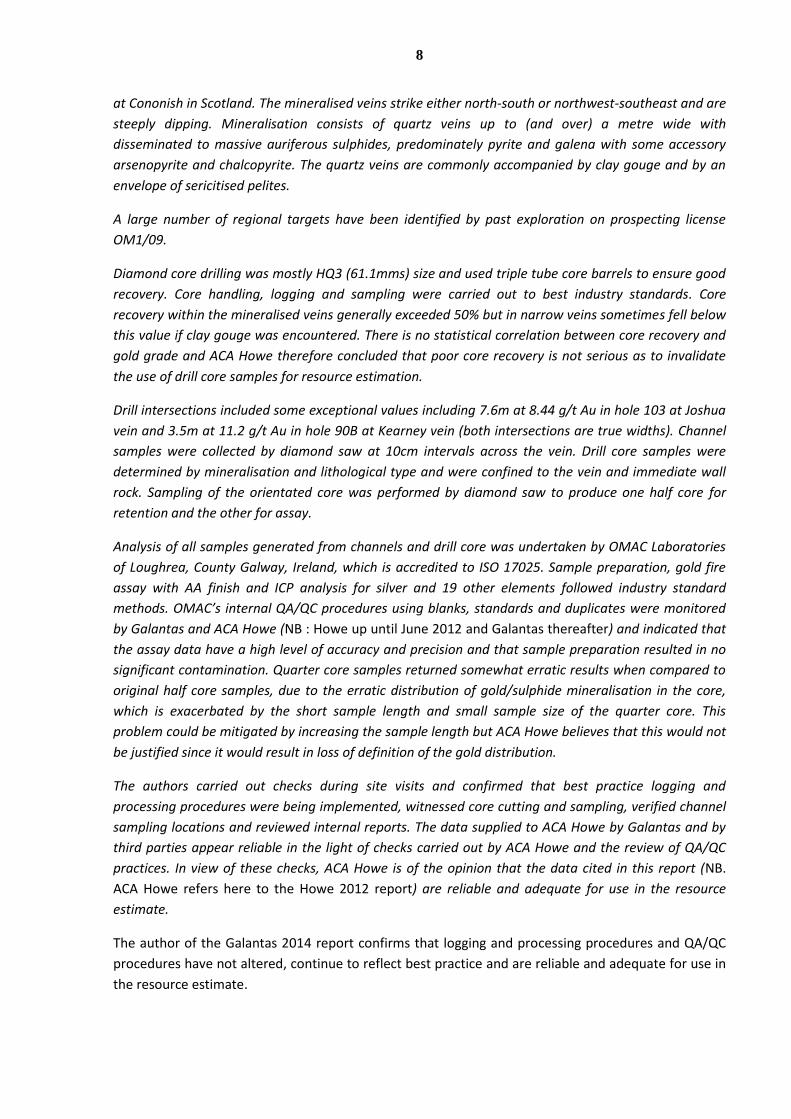
at Cononish in Scotland. The mineralised veins strike either north-south or northwest-southeast and are
steeply dipping. Mineralisation consists of quartz veins up to (and over) a metre wide with
disseminated to massive auriferous sulphides, predominately pyrite and galena with some accessory
arsenopyrite and chalcopyrite. The quartz veins are commonly accompanied by clay gouge and by an
envelope of sericitised pelites.
A large number of regional targets have been identified by past exploration on prospecting license
OM1/09.
Diamond core drilling was mostly HQ3 (61.1mms) size and used triple tube core barrels to ensure good
recovery. Core handling, logging and sampling were carried out to best industry standards. Core
recovery within the mineralised veins generally exceeded 50% but in narrow veins sometimes fell below
this value if clay gouge was encountered. There is no statistical correlation between core recovery and
gold grade and ACA Howe therefore concluded that poor core recovery is not serious as to invalidate
the use of drill core samples for resource estimation.
Drill intersections included some exceptional values including 7.6m at 8.44 g/t Au in hole 103 at Joshua
vein and 3.5m at 11.2 g/t Au in hole 90B at Kearney vein (both intersections are true widths). Channel
samples were collected by diamond saw at 10cm intervals across the vein. Drill core samples were
determined by mineralisation and lithological type and were confined to the vein and immediate wall
rock. Sampling of the orientated core was performed by diamond saw to produce one half core for
retention and the other for assay.
Analysis of all samples generated from channels and drill core was undertaken by OMAC Laboratories
of Loughrea, County Galway, Ireland, which is accredited to ISO 17025. Sample preparation, gold fire
assay with AA finish and ICP analysis for silver and 19 other elements followed industry standard
methods. OMAC’s internal QA/QC procedures using blanks, standards and duplicates were monitored
by Galantas and ACA Howe (NB : Howe up until June 2012 and Galantas thereafter) and indicated that
the assay data have a high level of accuracy and precision and that sample preparation resulted in no
significant contamination. Quarter core samples returned somewhat erratic results when compared to
original half core samples, due to the erratic distribution of gold/sulphide mineralisation in the core,
which is exacerbated by the short sample length and small sample size of the quarter core. This
problem could be mitigated by increasing the sample length but ACA Howe believes that this would not
be justified since it would result in loss of definition of the gold distribution.
The authors carried out checks during site visits and confirmed that best practice logging and
processing procedures were being implemented, witnessed core cutting and sampling, verified channel
sampling locations and reviewed internal reports. The data supplied to ACA Howe by Galantas and by
third parties appear reliable in the light of checks carried out by ACA Howe and the review of QA/QC
practices. In view of these checks, ACA Howe is of the opinion that the data cited in this report (NB.
ACA Howe refers here to the Howe 2012 report) are reliable and adequate for use in the resource
estimate.
The author of the Galantas 2014 report confirms that logging and processing procedures and QA/QC
procedures have not altered, continue to reflect best practice and are reliable and adequate for use in
the resource estimate.
9
1.2 MINERAL RESOURCE ESTIMATE
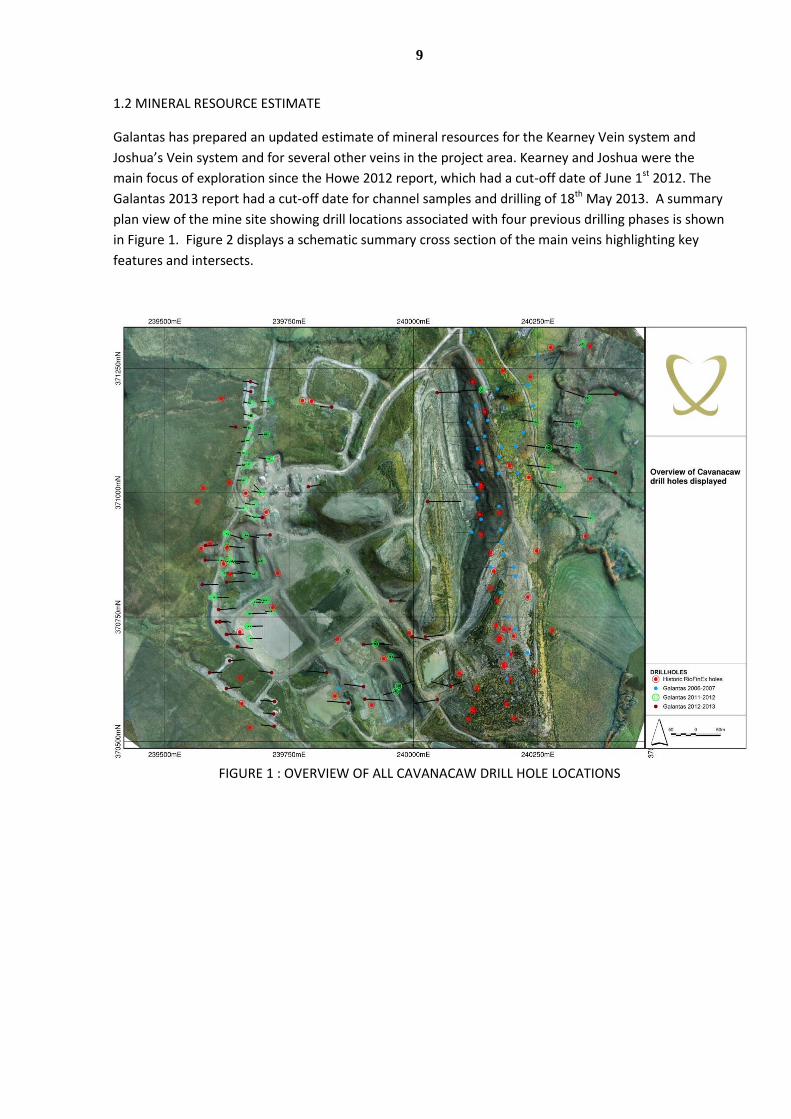
Galantas has prepared an updated estimate of mineral resources for the Kearney Vein system and
Joshua’s Vein system and for several other veins in the project area. Kearney and Joshua were the
main focus of exploration since the Howe 2012 report, which had a cut-off date of June 1st 2012. The
Galantas 2013 report had a cut-off date for channel samples and drilling of 18th May 2013. A summary
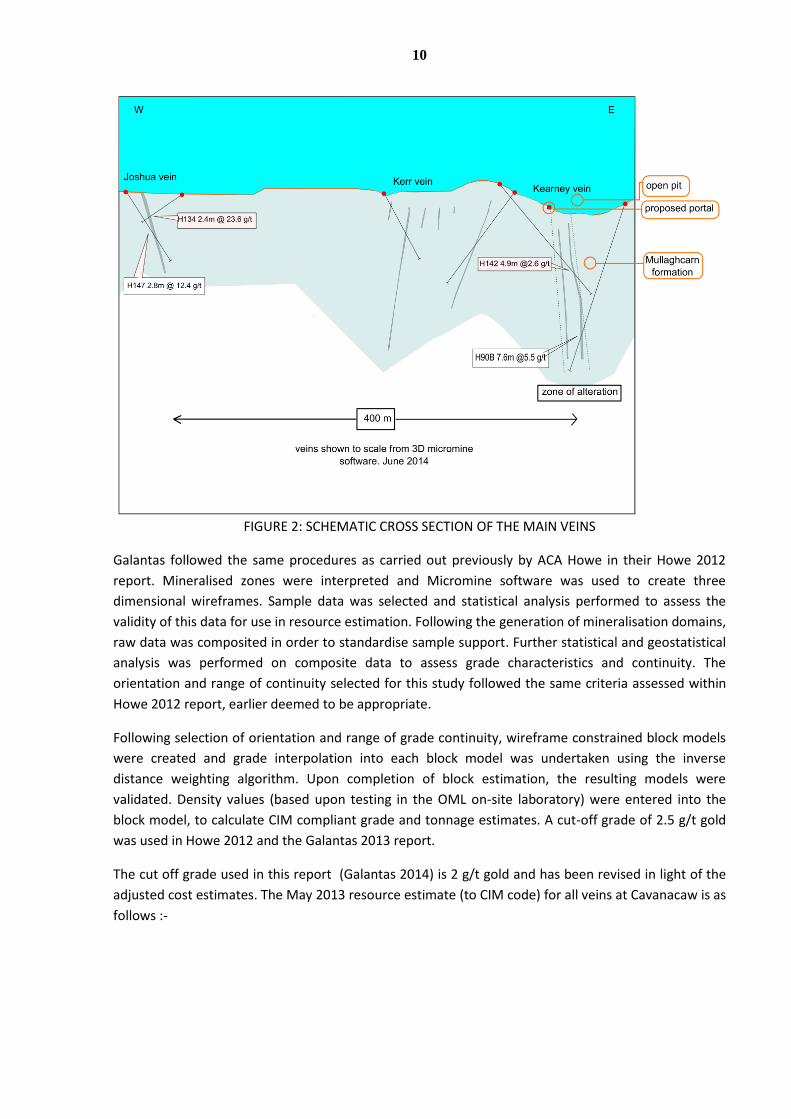
plan view of the mine site showing drill locations associated with four previous drilling phases is shown
in Figure 1. Figure 2 displays a schematic summary cross section of the main veins highlighting key
features and intersects.
FIGURE 1 : OVERVIEW OF ALL CAVANACAW DRILL HOLE LOCATIONS
10
FIGURE 2: SCHEMATIC CROSS SECTION OF THE MAIN VEINS
Galantas followed the same procedures as carried out previously by ACA Howe in their Howe 2012
report. Mineralised zones were interpreted and Micromine software was used to create three
dimensional wireframes. Sample data was selected and statistical analysis performed to assess the
validity of this data for use in resource estimation. Following the generation of mineralisation domains,
raw data was composited in order to standardise sample support. Further statistical and geostatistical
analysis was performed on composite data to assess grade characteristics and continuity. The
orientation and range of continuity selected for this study followed the same criteria assessed within
Howe 2012 report, earlier deemed to be appropriate.
Following selection of orientation and range of grade continuity, wireframe constrained block models
were created and grade interpolation into each block model was undertaken using the inverse
distance weighting algorithm. Upon completion of block estimation, the resulting models were
validated. Density values (based upon testing in the OML on-site laboratory) were entered into the
block model, to calculate CIM compliant grade and tonnage estimates. A cut-off grade of 2.5 g/t gold
was used in Howe 2012 and the Galantas 2013 report.
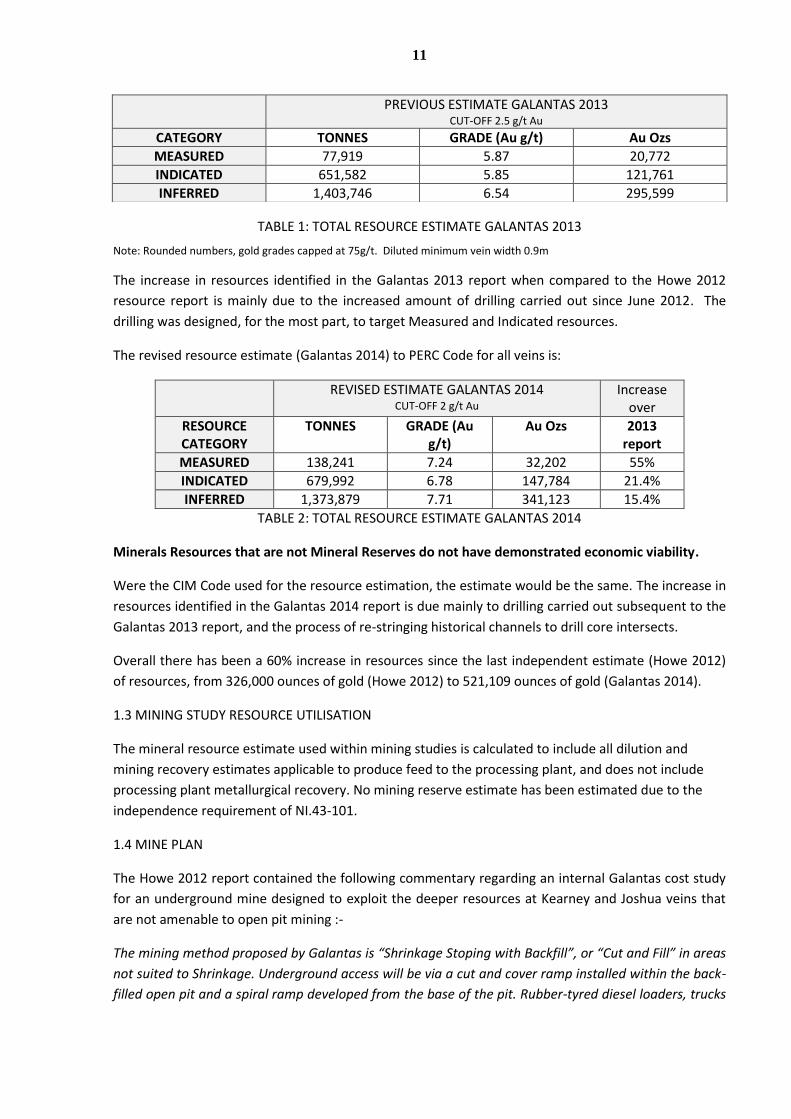
The cut off grade used in this report (Galantas 2014) is 2 g/t gold and has been revised in light of the
adjusted cost estimates. The May 2013 resource estimate (to CIM code) for all veins at Cavanacaw is as
follows :-
11
TABLE 1: TOTAL RESOURCE ESTIMATE GALANTAS 2013
Note: Rounded numbers, gold grades capped at 75g/t. Diluted minimum vein width 0.9m
The increase in resources identified in the Galantas 2013 report when compared to the Howe 2012
resource report is mainly due to the increased amount of drilling carried out since June 2012. The
drilling was designed, for the most part, to target Measured and Indicated resources.
The revised resource estimate (Galantas 2014) to PERC Code for all veins is:
REVISED ESTIMATE GALANTAS 2014 CUT-OFF 2 g/t Au
Increase over
RESOURCE CATEGORY
TONNES GRADE (Au g/t)
Au Ozs 2013 report
MEASURED 138,241 7.24 32,202 55%
INDICATED 679,992 6.78 147,784 21.4%
INFERRED 1,373,879 7.71 341,123 15.4%
TABLE 2: TOTAL RESOURCE ESTIMATE GALANTAS 2014
Minerals Resources that are not Mineral Reserves do not have demonstrated economic viability.
Were the CIM Code used for the resource estimation, the estimate would be the same. The increase in
resources identified in the Galantas 2014 report is due mainly to drilling carried out subsequent to the
Galantas 2013 report, and the process of re-stringing historical channels to drill core intersects.
Overall there has been a 60% increase in resources since the last independent estimate (Howe 2012)
of resources, from 326,000 ounces of gold (Howe 2012) to 521,109 ounces of gold (Galantas 2014).
1.3 MINING STUDY RESOURCE UTILISATION
The mineral resource estimate used within mining studies is calculated to include all dilution and
mining recovery estimates applicable to produce feed to the processing plant, and does not include
processing plant metallurgical recovery. No mining reserve estimate has been estimated due to the
independence requirement of NI.43-101.
1.4 MINE PLAN
The Howe 2012 report contained the following commentary regarding an internal Galantas cost study
for an underground mine designed to exploit the deeper resources at Kearney and Joshua veins that
are not amenable to open pit mining :-
The mining method proposed by Galantas is “Shrinkage Stoping with Backfill”, or “Cut and Fill” in areas
not suited to Shrinkage. Underground access will be via a cut and cover ramp installed within the back-
filled open pit and a spiral ramp developed from the base of the pit. Rubber-tyred diesel loaders, trucks
PREVIOUS ESTIMATE GALANTAS 2013 CUT-OFF 2.5 g/t Au
CATEGORY TONNES GRADE (Au g/t) Au Ozs
MEASURED 77,919 5.87 20,772
INDICATED 651,582 5.85 121,761
INFERRED 1,403,746 6.54 295,599
12
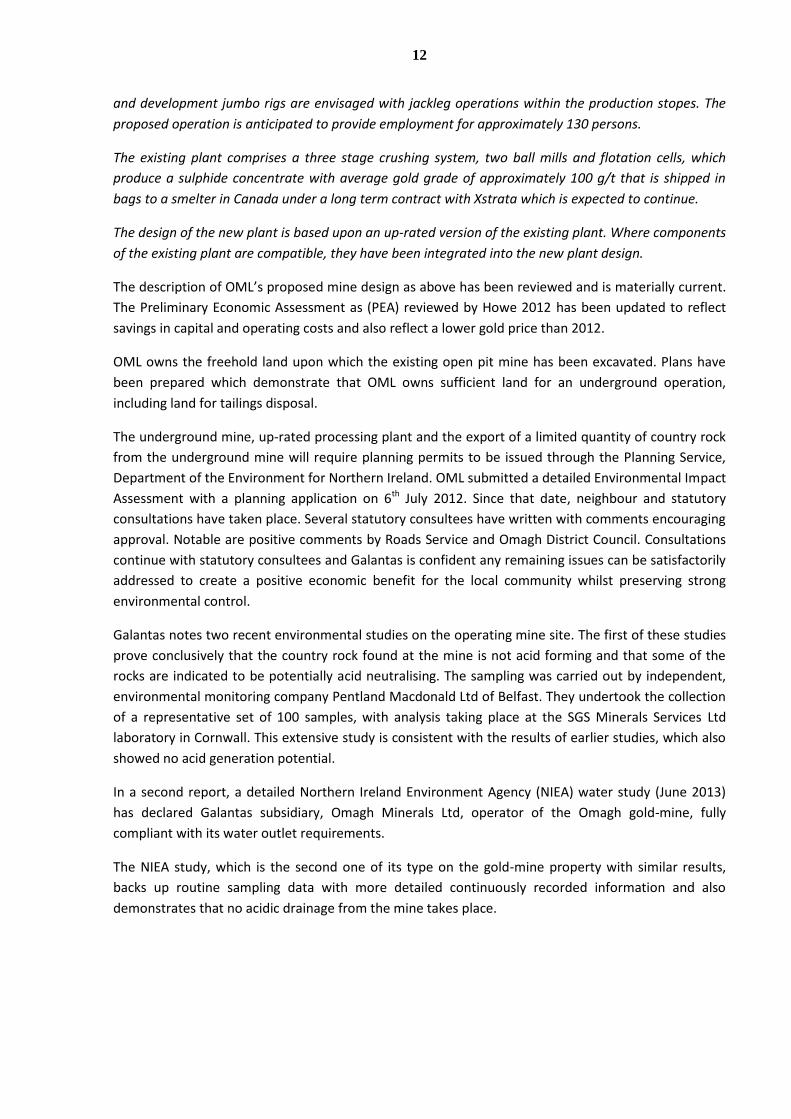
and development jumbo rigs are envisaged with jackleg operations within the production stopes. The
proposed operation is anticipated to provide employment for approximately 130 persons.
The existing plant comprises a three stage crushing system, two ball mills and flotation cells, which
produce a sulphide concentrate with average gold grade of approximately 100 g/t that is shipped in
bags to a smelter in Canada under a long term contract with Xstrata which is expected to continue.
The design of the new plant is based upon an up-rated version of the existing plant. Where components
of the existing plant are compatible, they have been integrated into the new plant design.
The description of OML’s proposed mine design as above has been reviewed and is materially current.
The Preliminary Economic Assessment as (PEA) reviewed by Howe 2012 has been updated to reflect
savings in capital and operating costs and also reflect a lower gold price than 2012.
OML owns the freehold land upon which the existing open pit mine has been excavated. Plans have
been prepared which demonstrate that OML owns sufficient land for an underground operation,
including land for tailings disposal.
The underground mine, up-rated processing plant and the export of a limited quantity of country rock
from the underground mine will require planning permits to be issued through the Planning Service,
Department of the Environment for Northern Ireland. OML submitted a detailed Environmental Impact
Assessment with a planning application on 6th July 2012. Since that date, neighbour and statutory
consultations have taken place. Several statutory consultees have written with comments encouraging
approval. Notable are positive comments by Roads Service and Omagh District Council. Consultations
continue with statutory consultees and Galantas is confident any remaining issues can be satisfactorily
addressed to create a positive economic benefit for the local community whilst preserving strong
environmental control.
Galantas notes two recent environmental studies on the operating mine site. The first of these studies
prove conclusively that the country rock found at the mine is not acid forming and that some of the
rocks are indicated to be potentially acid neutralising. The sampling was carried out by independent,
environmental monitoring company Pentland Macdonald Ltd of Belfast. They undertook the collection
of a representative set of 100 samples, with analysis taking place at the SGS Minerals Services Ltd
laboratory in Cornwall. This extensive study is consistent with the results of earlier studies, which also
showed no acid generation potential.
In a second report, a detailed Northern Ireland Environment Agency (NIEA) water study (June 2013)
has declared Galantas subsidiary, Omagh Minerals Ltd, operator of the Omagh gold-mine, fully
compliant with its water outlet requirements.
The NIEA study, which is the second one of its type on the gold-mine property with similar results,
backs up routine sampling data with more detailed continuously recorded information and also
demonstrates that no acidic drainage from the mine takes place.
13
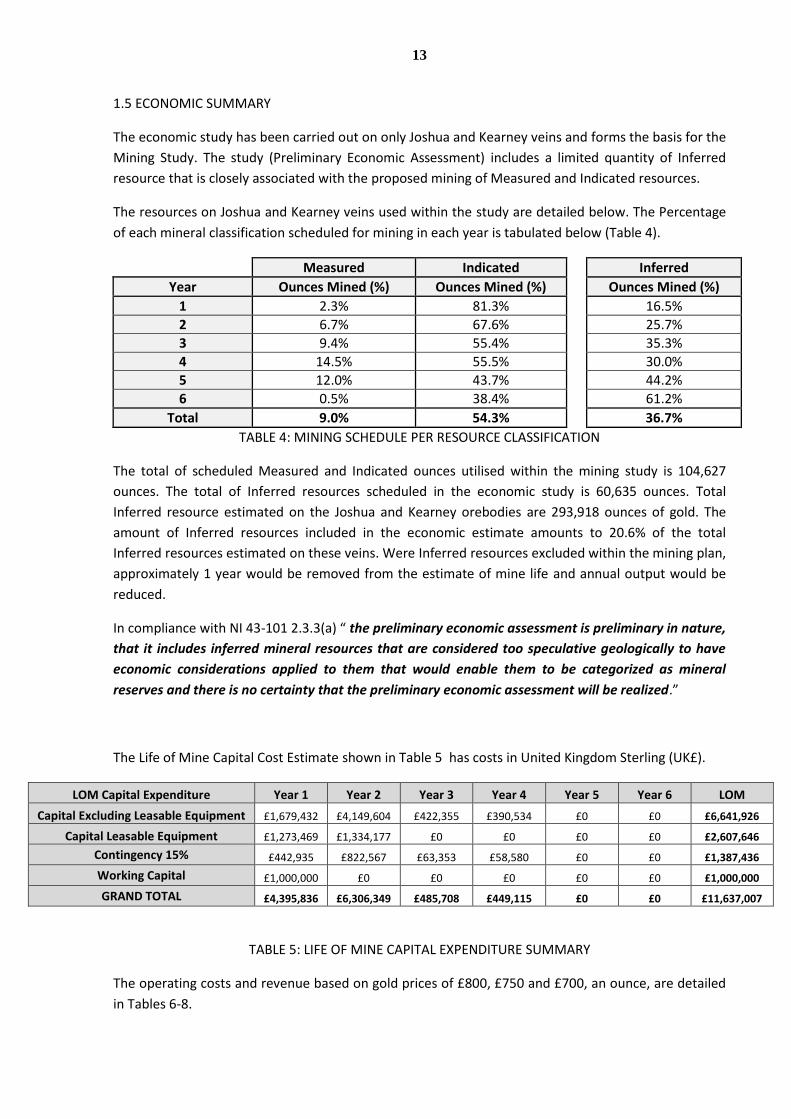
1.5 ECONOMIC SUMMARY
The economic study has been carried out on only Joshua and Kearney veins and forms the basis for the
Mining Study. The study (Preliminary Economic Assessment) includes a limited quantity of Inferred
resource that is closely associated with the proposed mining of Measured and Indicated resources.
The resources on Joshua and Kearney veins used within the study are detailed below. The Percentage
of each mineral classification scheduled for mining in each year is tabulated below (Table 4).
Measured Indicated
Inferred
Year Ounces Mined (%) Ounces Mined (%)
Ounces Mined (%)
1 2.3% 81.3%
16.5%
2 6.7% 67.6%
25.7%
3 9.4% 55.4%
35.3%
4 14.5% 55.5%
30.0%
5 12.0% 43.7%
44.2%
6 0.5% 38.4%
61.2%
Total 9.0% 54.3%
36.7%
TABLE 4: MINING SCHEDULE PER RESOURCE CLASSIFICATION
The total of scheduled Measured and Indicated ounces utilised within the mining study is 104,627
ounces. The total of Inferred resources scheduled in the economic study is 60,635 ounces. Total
Inferred resource estimated on the Joshua and Kearney orebodies are 293,918 ounces of gold. The
amount of Inferred resources included in the economic estimate amounts to 20.6% of the total
Inferred resources estimated on these veins. Were Inferred resources excluded within the mining plan,
approximately 1 year would be removed from the estimate of mine life and annual output would be
reduced.
In compliance with NI 43-101 2.3.3(a) “ the preliminary economic assessment is preliminary in nature,
that it includes inferred mineral resources that are considered too speculative geologically to have
economic considerations applied to them that would enable them to be categorized as mineral
reserves and there is no certainty that the preliminary economic assessment will be realized.”
The Life of Mine Capital Cost Estimate shown in Table 5 has costs in United Kingdom Sterling (UK£).
LOM Capital Expenditure Year 1 Year 2 Year 3 Year 4 Year 5 Year 6 LOM
Capital Excluding Leasable Equipment £1,679,432 £4,149,604 £422,355 £390,534 £0 £0 £6,641,926
Capital Leasable Equipment £1,273,469 £1,334,177 £0 £0 £0 £0 £2,607,646
Contingency 15% £442,935 £822,567 £63,353 £58,580 £0 £0 £1,387,436
Working Capital £1,000,000 £0 £0 £0 £0 £0 £1,000,000
GRAND TOTAL £4,395,836 £6,306,349 £485,708 £449,115 £0 £0 £11,637,007
TABLE 5: LIFE OF MINE CAPITAL EXPENDITURE SUMMARY
The operating costs and revenue based on gold prices of £800, £750 and £700, an ounce, are detailed
in Tables 6-8.

14
Gold Price £800/oz Year 1 Year 2 Year 3 Year 4 Year 5 Year 6 LOM
Operating Costs £5,693,338 £10,430,904 £11,964,071 £11,261,136 £10,830,431 £8,459,001 £58,638,882
Revenue £5,711,798 £16,637,139 £21,615,178 £20,520,831 £21,092,405 £12,524,609 £98,101,960
Cashflow £18,460 £6,206,235 £9,651,107 £9,259,695 £10,261,974 £4,065,608 £39,463,079
TABLE 6: OPERATING CASH FLOW AT AN AVERAGE GOLD PRICE OF £800 PER OUNCE
Gold Price £750/oz Year 1 Year 2 Year 3 Year 4 Year 5 Year 6 LOM
Operating Costs £5,693,338 £10,430,904 £11,964,071 £11,261,136 £10,830,431 £8,459,001 £58,638,882
Revenue £5,354,810 £15,597,318 £20,264,230 £19,238,279 £19,774,130 £11,741,821 £91,970,588
Cashflow -£338,528 £5,166,414 £8,300,158 £7,977,143 £8,943,699 £3,282,820 £33,331,706
TABLE 7: OPERATING CASH FLOW AT AN AVERAGE GOLD PRICE OF £750 PER OUNCE
Gold Price £700/oz Year 1 Year 2 Year 3 Year 4 Year 5 Year 6 LOM
Operating Costs £5,693,338 £10,430,904 £11,964,071 £11,261,136 £10,830,431 £8,459,001 £58,638,882
Revenue £4,997,823 £14,557,497 £18,913,281 £17,955,727 £18,455,855 £10,959,033 £85,839,215
Cashflow -£695,515 £4,126,592 £6,949,210 £6,694,591 £7,625,424 £2,500,032 £27,200,334
TABLE 8: OPERATING CASH FLOW AT AN AVERAGE GOLD PRICE OF £700 PER OUNCE
At a gold price of UK£750 / ounce, the net cash flow (pre-tax operating surplus less capital
expenditure) provides an Internal Rate of Return of 72% and, at an 8% discount rate, a net present
value of approximately UK£14.5m and a cash cost of production of UK£394 per ounce (USD$662 at
$1.68/UK£). The study scheduled approximately 36% of the combined resources identified on the
Kearney and Joshua veins.
2. INTRODUCTION
This report (Galantas 2014) is an updated mineral resource estimate for the Cavanacaw gold deposit,
prepared in accordance with PERC (Pan European Reporting Standard). The report also summarises
the project’s geology and exploration potential. The economic study, summarised in this report,
includes use of a minor portion of Inferred resources estimated for two veins (Joshua and Kearney
veins). The Inferred resources are contiguous with or lie within scheduled mining areas. The use of
Inferred resources, in a restricted qualifying manner, is permitted by the PERC code but is excluded
within the CIM code / NI.43-101. For Canadian public disclosure, an economic study that uses any
portion of inferred resources can only be considered a preliminary economic assessment, although
PERC is an approved code in respect of NI. 43-101. A comparable economic study is shown which
excludes the use of any inferred resources and is a feasibility study under NI.43-101. A comparison of
terms associated with the CIM and PERC codes is tabulated in Appendix 1.
The report is not independent and is prepared under the supervision of R.Phelps C.Eng. MIOM3,
(President & CEO, Galantas Gold Corporation), a Qualified Person for the purposes of NI 43-101.
15
The updated mineral resource estimate is based upon exploration drilling, conducted since May 2013.
An interim, independent report (Howe 2012), commissioned from ACA Howe International Ltd,
reported upon data generated to June 1st 2012 by the drilling & sampling campaign, which continued
thereafter. The Galantas 2013 and 2014 reports include, in addition, data generated to 18th May 2013
and 31st March 2014, respectively.
This report is written in compliance with Canadian National Instrument (NI) 43-101 and in conformity
with the requirements of the Ontario Securities Commission and utilises National Instrument 43-101 –
Standards of Disclosure for Minerals Projects, Form 43-101F1 and Companion Policy 43-101CP.
3. RELIANCE ON THIRD PARTIES
Some data has been sourced from independent third parties, for instance, in the case of laboratory
analyses and this data has been relied upon. Quality control checks were put in place to monitor the
accuracy of third party data and those checks are deemed to provide an acceptable degree of
repeatability.
The author has reviewed and relied upon independent reports, by ACA Howe International Ltd,
calculating historical reserves and resources, evaluating exploration targets and reporting geophysical
evaluations and field work. Please note that italicised parts of this document have been drawn from
previous Howe reports. The author has also reviewed and relied upon internal Galantas Gold
Corporation reports, third party reports commissioned by OML and a report on Title to Lands by Elliott
Duffy Garrett (Solicitors to OML).
Additional information relied upon has been sourced from Galantas personnel, published topographic
and geological maps, government authorities and government agencies. First-hand information known
to the author has also been included.
To the best of the author’s knowledge, having taken reasonable care, the information contained in this
report is in accordance with the facts and makes no omission likely to affect the import of such
information. While exercising all reasonable supervision and diligence in checking and confirming the
data, the author has relied upon the information within the OML database and notes this is also
reviewed for the greater part by independent persons.
4. PROPERTY DESCRIPTION AND LOCATION
4.1 MINERAL LEGISLATION AND LICENSING
Two licensing (option) regimes are in place in Northern Ireland, relating to OML’s operations. One is
administered by the Crown Estate Commissioners (CEC), for gold and silver. The second is
administered by the Department of Enterprise, Trade and Investment (DETI) of the devolved
Government of Northern Ireland and covers base metals and other minerals.
DETI provides the following description of minerals licensing at www.detini.gov.uk :- “The Mineral
Development Act (Northern Ireland) 1969 (“the 1969 Act”) vested most minerals in the Department
and enables it to grant prospecting licences and mining licences for exploration and development of
minerals. This licensing system is based on the provisions of the 1969 Act and on subsequent

16
subordinate legislation. The provisions relating to prospecting for minerals are quite separate and
distinct from those relating to the development of minerals.
There is no automatic continuity between exploration and development work. The legislation covers all minerals with three main exceptions (the scheduled substances): (i) Gold and Silver belong to the Crown Estates and were not vested in the Department, (ii) the few mineral deposits (mainly salt) which were being worked at the time of the 1969 Act were not vested in the Department, and, (iii) ‘common’ substances including crushed rock, sand and gravel and brick clays are excluded.”
Prospecting licences, from DETI and Options (formerly Crown Exploration Licences), from CEC, require
agreed work programmes and can run for up to six years in two year increments. Generally drilling and
other forms of exploration do not require planning consent but are regulated by statutory rules in
Section 16 of the Planning (General Development) Order (Northern Ireland) 1993. Bonding
arrangements are required and are in place. Mining operations need a separate Mining License and
Planning Consent is required to enable the application to be made. In Northern Ireland, DETI collects
royalties for base metals, where appropriate and precious metals royalties are payable to the Crown
Estate.
In the Republic Of Ireland, Minerals Licences are administered by the Department of Communications,
Energy and Natural Resources, through its Exploration and Mining Division. A six year programme is
agreed at the onset of the license and the licence is renewable. Royalties, where a Mining Lease has
been granted, are fixed by individual agreement. Further information is available on www.dcenr.gov.ie
Freehold title to the lands owned by Omagh Minerals Ltd has been reviewed by Elliott Duffy Garrett
(EDG), OML’s Belfast based lawyers. The author is satisfied from past reports on title by EDG, which he
has personally seen, that OML has title to its land in all material respects but the author is not an
expert in such matters and relies upon the advice of EDG. For completeness, the author notes a
mortgage debenture in respect of a loan from G&F Phelps Ltd (a company related to the author).
4.2 LOCATION
The Cavanacaw Mine is located 5 kms west / south-west of Omagh, at approximately latitude 540 35’
00” north and longitude 70 22’ 50” west. Related to the Irish National Grid, which is used for
topographic and exploration data, this is the equivalent of IH 40046E and 70748N.
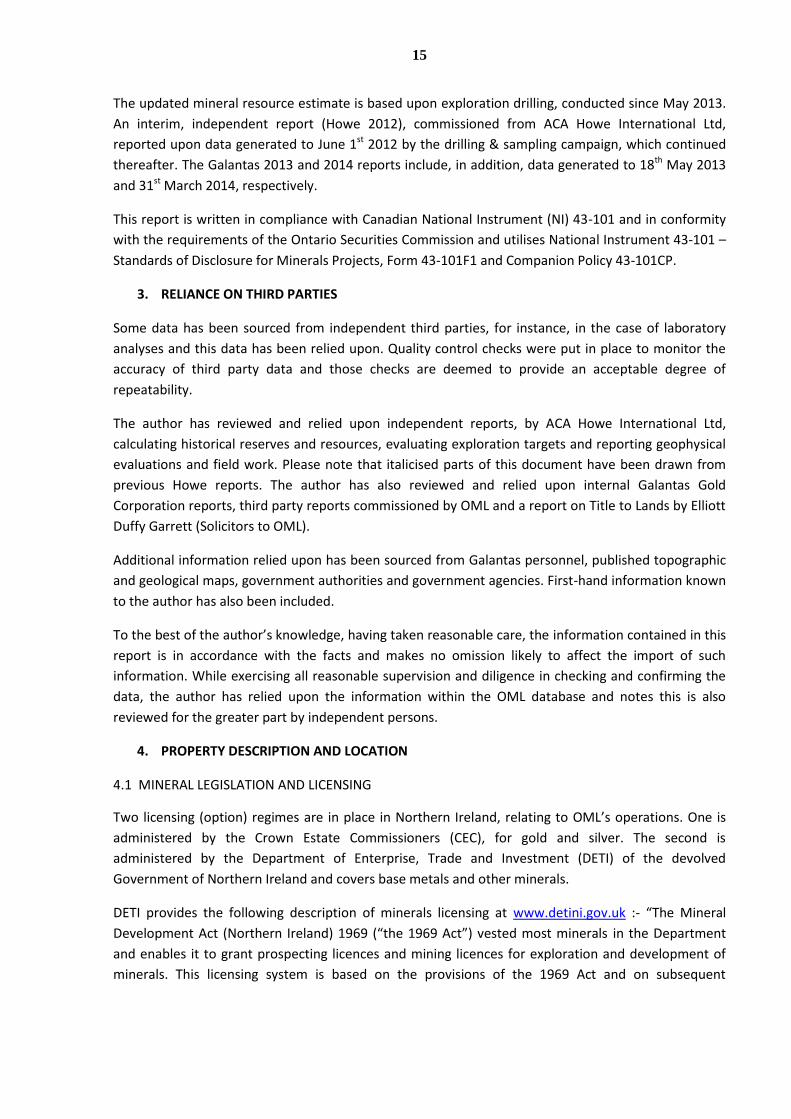
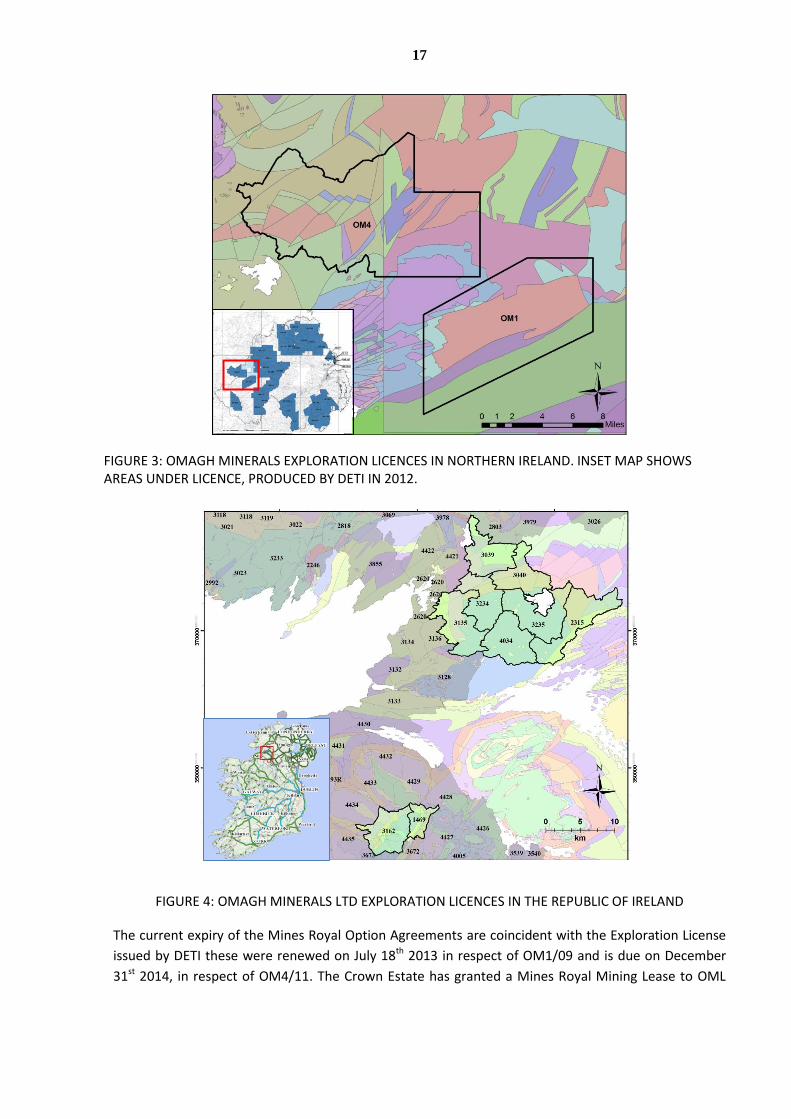
4.3 OMAGH MINERALS LTD LICENCES
Galantas Gold Corporations owns, through OML, exclusive exploration rights for gold, silver, base
metals and other minerals, over the Northern Ireland licence areas shown in Figure 3 and the Republic
of Ireland licence areas Figure 4.
17
FIGURE 3: OMAGH MINERALS EXPLORATION LICENCES IN NORTHERN IRELAND. INSET MAP SHOWS AREAS UNDER LICENCE, PRODUCED BY DETI IN 2012.
FIGURE 4: OMAGH MINERALS LTD EXPLORATION LICENCES IN THE REPUBLIC OF IRELAND
The current expiry of the Mines Royal Option Agreements are coincident with the Exploration License
issued by DETI these were renewed on July 18th 2013 in respect of OM1/09 and is due on December
31st 2014, in respect of OM4/11. The Crown Estate has granted a Mines Royal Mining Lease to OML

18
expiring June 22nd 2015 for the area shown in Figure 5, covering most of the OML freehold land but
excluding the Elkins veins. Figure 5 is drawn from the “Howe 2012” report but the detail is unchanged.
FIGURE 5: CAVANACAW PROJECT SHOWING FREEHOLD AND CROWN LEASE
19
4.4 PERMITS
The Department of the Environment for Northern Ireland (DoE NI) granted planning permission for
open pit mining of gold and silver and associated minerals on certain areas of OML land in May 1995. A
number of conditions were attached. The permission remains valid and in operation.
A further planning permission granted in 2012 by Planning Service, DoE NI, which permitted phased
continuous restoration of the site and confirmed disposal of waste rock by road transport, was
quashed by judicial review on the grounds of procedural failing by the Planning Service. The
application awaits re-determination.
A planning application for an underground mine, uprated processing plant and the export of a limited
quantity of country rock was submitted to the Planning Service, DoE NI, with a detailed Environmental
Impact Assessment, on 6th July 2012. Since that date, neighbour and statutory consultations have
taken place. Several statutory consultees have written with satisfied comments. Notable are positive
comments by Roads Service and Omagh District Council. Consultations continue with statutory
consultees and OML management is confident any remaining issues can be satisfactorily addressed.
OML holds Discharge Consents for mine waters from DoE NI, via the Northern Ireland Environment
Agency (NIEA). OML and NIEA monitor flows from the mine and the author notes that the results are
routinely within the limits imposed. A detailed compliance check on the consent conditions relating to
ground waters and surface waters from the premises of Omagh Minerals was passed by NIEA and
recorded as such on the 14th September 2011. A similar study, carried out in June 2013 also concluded
compliance in all respects.
Other operating permits, such as that issued by the Industrial Pollution and Radiochemical
Inspectorate (IPRI), are in operation and OML is adhering to the requirements.
A study of potential for acid drainage, reported in January 2013, concluded that the country rock
found at the mine is not acid forming and that some of the rocks are indicated to be potentially acid
neutralising. The sampling was carried out by an independent, environmental monitoring company,
Pentland Macdonald Ltd of Belfast. They undertook the collection of a representative set of 100
samples, with analysis taking place at the SGS Minerals Services Ltd laboratory in Cornwall. This
extensive study is consistent with the results of earlier work, which also showed no acid generation
potential.
Restoration requirements exist under agreements made with regulating authorities. The Crown Estate
hold a restoration Bond from OML to ensure the requirements for site restoration are met.
5. ACCESSIBILITY, CLIMATE, LOCAL RESOURCES, INFRASTRUCTURE AND PHYSIOGRAPHY
The county town of Omagh and the mine area are easily accessible by paved road from Belfast. The
road distance is less than 100 kms and takes approximately 1.5 hours. Belfast is served by two airports
with domestic and international flights. Situated some 5 kms from Omagh, the mine site is accessible
by public paved roads. Some local roads have been recently improved, at OML expense, with
additional passing bays, in order to improve a surplus rock haulage route. The mine site contains a
20
concreted road to the processing plant and various unpaved roads. One upland section of the mine
site is only reachable on foot.
Two power lines (33 kV and 11kV) traverse close to or on the site, however, power to the mill is
generated with diesel on site.
The principal Prospecting Licence & Option (OM1/09) is situated on the south-western fringe of the
Sperrin Mountains in glaciated terrain. Topography ranges from 140 m to 160 metres above sea level
with rounded hills up to 330 m. Glacially derived till in thicknesses up to 18 m, provides generally low
quality grazing, except where techniques such as drainage and fertility have been carried out to
improve grazing quality. Farming, which is the principal local economic activity is dominated by small /
medium sized operations that rely on raising cattle and sheep. Upland hills and hollows in the
landscape, support peat bogs which have a history of small scale cutting for domestic fuel use. There
has been some urbanisation of housing closer to the county town of Omagh, although it is understood
that planning policy has in recent years restricted outwards growth further from the town. There are
some small coniferous plantations for commercial forestry and one is situated on the mine site. Wind
farms have been approved in the region, including one on an upland area within the western part of
OM1/09, part of the mine site might be suitable for such a purpose.
The climate is temperate with about 1500 mm of rainfall per annum. The usual pattern of mild winters
has been disrupted in recent years by severe falls in temperature. The mine has experienced some
production difficulties during very cold temperatures but the disruption has been short lived.
Omagh is a County town and hosts schools, colleges and is a local administrative centre. The standard
of education locally is good, housing costs are modest compared to many areas of the UK and
unemployment is a local issue following the closure of several large employers. Operators of mobile
plant are available in the local workforce. There is local knowledge of crushing and screening and local
manufacturing of such equipment. Operators of the flotation plant have been trained. A number of
skilled, small and medium size, engineering companies exist in the local region and the out-sourcing of
a wide range of engineering and maintenance work is available.
OML has acquired its freehold land over a number of years, its latest acquisition being a parcel of 52
acres in January 2012 covering part of the Joshua vein. OML holds an estimated 220 acres of freehold
land, which it believes is sufficient to operate its planned underground mine.
6. HISTORY
Howe 2012 contains the following description, which the author has reviewed :-
The occurrence of gold has been known for several centuries but no mining operations have taken
place prior to Cavanacaw. A regional study of mineralisation by the Geological Survey of Northern
Ireland (Arthurs, 1976) encouraged a new phase of mineral exploration in the Dalradian meta-
sedimentary rocks in the 1980’s resulting in the discovery of vein hosted gold prospects associated with
shear zones in Dalradian rocks at Curraghinalt (Earls et al.,1989; Clifford et al., 1992), Cavanacaw (Cliff
and Wolfenden, 1992) and Golan Burn (Woodham etal., 1989).
21
6.1 PROJECT HISTORY
Following the Curraghinalt gold discovery, Riofinex commenced exploration on the Lack Inlier, a
geologically uplifted block of Dalradian metasediments. The Kearney structure was discovered
comparatively early in the exploration programme, the author has been told that it was concentrated
upon partly because of ease of access.
A number of exploration and resource definition methodologies were employed. These included
geological mapping, which is not readily achieved given the paucity of local rock exposures. Stream
sediment was panned for gold and sulphide evidence. Loose boulders were sampled. Soil samples and
deep overburden samples (Pionjar) were also taken. Induced polarisation geophysical work was
deployed and core drilling (size NQ) carried out. The Kearney vein was stripped and an intense channel
sampling programme resumed, backed by vein mapping. A resource was assessed and a mining project
scoped. Environmental baseline studies were commenced.
In 1990 Omagh Minerals acquired the project from Riofinex and engineering studies from Kilborn
Engineering Ltd, Knight Piesold and Lakefield Research. Wardell Armstrong carried out an
Environmental Impact Assessment, which was completed in late 1992. The Crown estate
Commissioners entered into a Mining Lease with OML, conditional on planning consent.
Following a Public Enquiry in 1993 and 1994, conditional planning consent was granted in 1995. The
planning conditions were fulfilled in 2001, crystallising the consent.
Further engineering studies were carried out by Kilborn in 1995.
In 1997, European Gold Resources of Ontario acquired OML. OML excavated a section of the Kearney
structure, to the north of the Riofinex trench, and mapped and sampled in a similar manner to
Riofinex. ACA Howe carried out stream sediment sampling they also digitised and consolidated the
resulting geochemical data.
In 1998, Lakefield Research completed further metallurgical and environmental studies.
In 2000 and 2001, OML carried out selective mining trials and produced a high grade, sulphidic ore.
Following specialist laboratory treatment to separately recover the gold, the bullion was made into 18
ct jewellery with accreditation of the Irish gold source and test marketed under the Galantas brand
name.
In 2003 EGR commissioned ACA Howe to analyse Landsat satellite imagery over the whole of the Lack
Inlier and to integrate with other exploration data using MapInfo software. Resulting reconnaissance
sampling, mapping, data compilation and interpretation was carried out subsequently (ACA Howe
2004A). Twenty-four exploration targets were identified.
European Gold Resources was renamed Galantas Gold Corporation (Galantas) in 2004.
Following a financing in early 2005, Galantas commenced mine development.
During the summer of 2005, Galantas contracted Geotech Airborne Ltd to carry out an airborne time
domain electromagnetic (VTEM) and magnetic survey over the Lack Inlier. The results identified new
geophysical targets and helped prioritise existing targets.
22
In December 2005, ACA Howe studied the resource potential of all targets and ranked them. Eight vein
structures, including Kearney and Joshua veins were ranked as having good potential for upgrading of
the reserves and resources previously enumerated.
Galantas started to build the ore processing plant in November 2005 and commenced mining
development in early 2006.
6.2 HISTORICAL ESTIMATES OF MINERAL RESOURCES AND RESERVES.
Mineral resources that are not mineral reserves do not have demonstrated economic viability.
ACA Howe in their Howe 2012 report summarised their numerous reports, reserve and resource
estimates from 1995 to 2008 as follows :-
Historical data used to calculate resources and reserves comprised saw-cut outcrop channel sampling,
drill core sampling and selective mining trials by Riofinex and Omagh Minerals. Prior to 2007, three
resource/reserve estimation studies (1995, 2004 and 2008) and a bulk mining trial (2003) were
undertaken and are summarised below.
The following comparison of Howe’s historic estimates is drawn from Howe’s 2012 report.
6.2.1 INTRODUCTION
The mineral resources on which the Lack Gold project is based are hosted by a system of mineralised veins and shear structures within which more than a dozen individual deposits have been identified over a 4 sq. km area. The deposits can be grouped as:
the well-established Kearney Structure; several other nearby structures which have been variously explored, and whose
reserves will be upgraded as part of on-going mine development to provide for continuation and later expansion of open pit operations, and;
a large number of essentially untested gold occurrences, geological targets and geochemical anomalies distributed along the 20 km length and 5 km breadth of the Lack Inlier.
The most intensively studied area is the Kearney Structure which has been diamond drill tested over its approximately 850m length and shown to persist to at least 300m below surface. It was investigated at surface by both Riofinex and Omagh by means of stripping and detailed bedrock sampling. The Kearney Structure has hitherto been the main focus of project studies both by Riofinex and Omagh and has been the main focus of open pit mining since 2006.
23
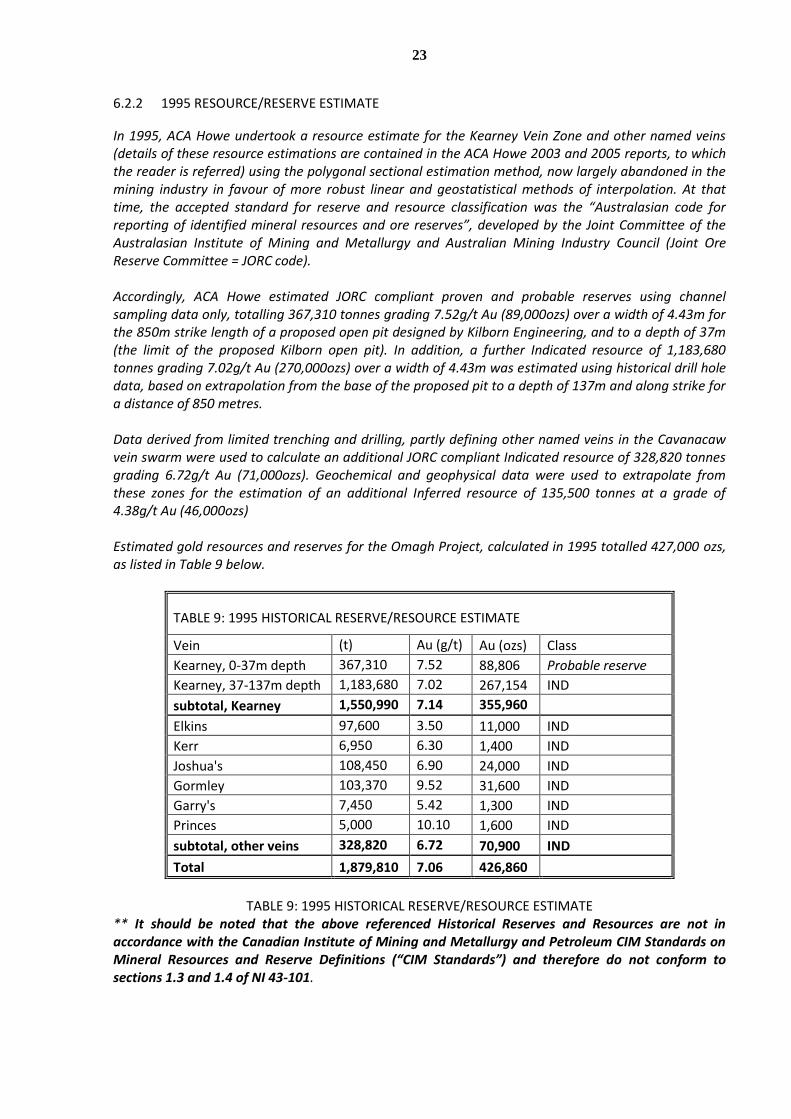
6.2.2 1995 RESOURCE/RESERVE ESTIMATE
In 1995, ACA Howe undertook a resource estimate for the Kearney Vein Zone and other named veins (details of these resource estimations are contained in the ACA Howe 2003 and 2005 reports, to which the reader is referred) using the polygonal sectional estimation method, now largely abandoned in the mining industry in favour of more robust linear and geostatistical methods of interpolation. At that time, the accepted standard for reserve and resource classification was the “Australasian code for reporting of identified mineral resources and ore reserves”, developed by the Joint Committee of the Australasian Institute of Mining and Metallurgy and Australian Mining Industry Council (Joint Ore Reserve Committee = JORC code). Accordingly, ACA Howe estimated JORC compliant proven and probable reserves using channel sampling data only, totalling 367,310 tonnes grading 7.52g/t Au (89,000ozs) over a width of 4.43m for the 850m strike length of a proposed open pit designed by Kilborn Engineering, and to a depth of 37m (the limit of the proposed Kilborn open pit). In addition, a further Indicated resource of 1,183,680 tonnes grading 7.02g/t Au (270,000ozs) over a width of 4.43m was estimated using historical drill hole data, based on extrapolation from the base of the proposed pit to a depth of 137m and along strike for a distance of 850 metres. Data derived from limited trenching and drilling, partly defining other named veins in the Cavanacaw vein swarm were used to calculate an additional JORC compliant Indicated resource of 328,820 tonnes grading 6.72g/t Au (71,000ozs). Geochemical and geophysical data were used to extrapolate from these zones for the estimation of an additional Inferred resource of 135,500 tonnes at a grade of 4.38g/t Au (46,000ozs) Estimated gold resources and reserves for the Omagh Project, calculated in 1995 totalled 427,000 ozs, as listed in Table 9 below.
TABLE 9: 1995 HISTORICAL RESERVE/RESOURCE ESTIMATE
Vein (t) Au (g/t) Au (ozs) Class
Kearney, 0-37m depth 367,310 7.52 88,806 Probable reserve
Kearney, 37-137m depth 1,183,680 7.02 267,154 IND
subtotal, Kearney 1,550,990 7.14 355,960
Elkins 97,600 3.50 11,000 IND
Kerr 6,950 6.30 1,400 IND
Joshua's 108,450 6.90 24,000 IND
Gormley 103,370 9.52 31,600 IND
Garry's 7,450 5.42 1,300 IND
Princes 5,000 10.10 1,600 IND
subtotal, other veins 328,820 6.72 70,900 IND
Total 1,879,810 7.06 426,860
TABLE 9: 1995 HISTORICAL RESERVE/RESOURCE ESTIMATE
** It should be noted that the above referenced Historical Reserves and Resources are not in accordance with the Canadian Institute of Mining and Metallurgy and Petroleum CIM Standards on Mineral Resources and Reserve Definitions (“CIM Standards”) and therefore do not conform to sections 1.3 and 1.4 of NI 43-101.
24
6.2.3 CONFORMITY OF 1995 RESOURCES TO CIM CLASSIFICATION
Although justified under the reporting code of the time, extrapolation of surface channel data over the entire 850m strike length of the Kearney deposit, into areas containing very little or no sample data does not meet the criteria for defining Indicated resources under current CIM guidelines (see Section 16.8, Howe 2012) since those parts of the resource informed by extrapolated grade data and not based on actual grade data are not reliably informed. Similarly, resources below the proposed pit floor at the time, estimated to a depth of 137m based on sparse drill hole data at spacing of between 75m and 200m does not meet the criteria for reporting Indicated resources under current CIM guidelines since the sample spacing is too wide to demonstrate grade continuity to the required level of confidence. In addition, the recognition of a sub-parallel, north plunging structure (the Lack Shear) which effectively cuts off the mineralisation to the south of the Kearney pit (drill tested by sterilisation holes during the 2006 drilling campaign) suggests that the extrapolation of resources down to 137m depth over the whole deposit resulted in a significant overestimation of contained resource tonnage. Resources at the other named veins were classified as Indicated under the reporting code of the time, whereas the 2008 and 2012 estimates largely classify these resources as Inferred by virtue of the drill spacing (50m by 50m and 100m by 100m), and lack of demonstrated continuity, adhering to current CIM guidelines.
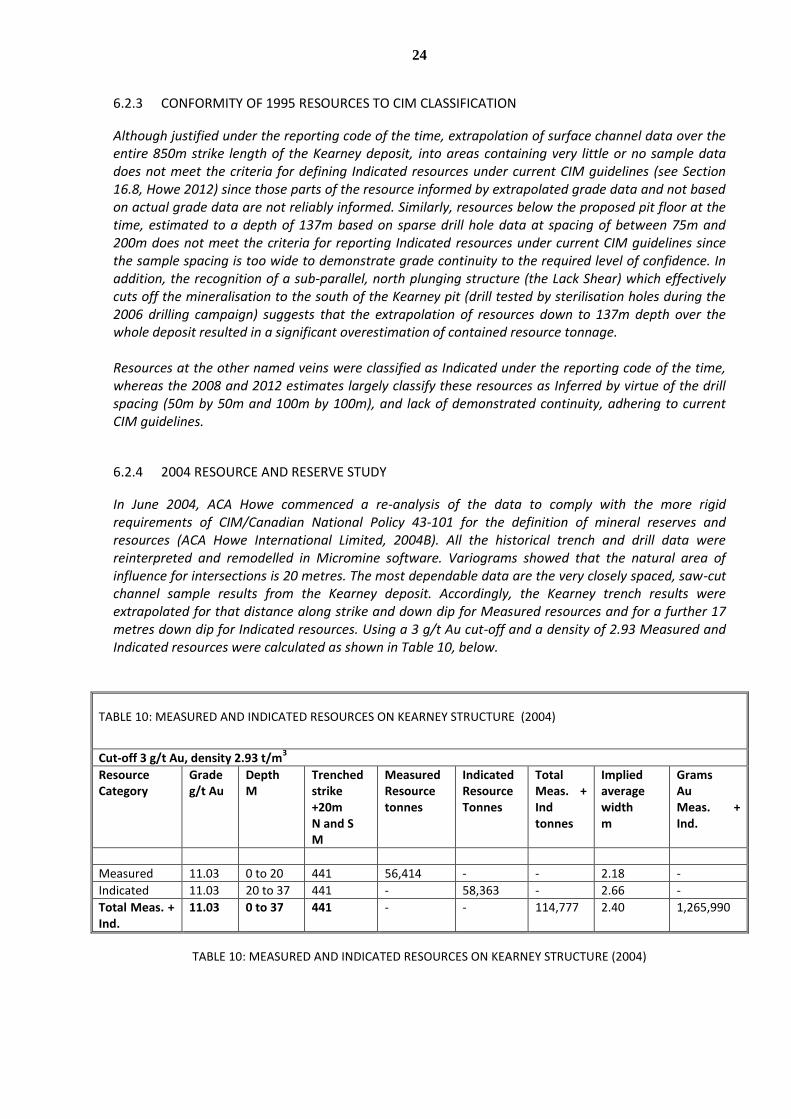
6.2.4 2004 RESOURCE AND RESERVE STUDY
In June 2004, ACA Howe commenced a re-analysis of the data to comply with the more rigid requirements of CIM/Canadian National Policy 43-101 for the definition of mineral reserves and resources (ACA Howe International Limited, 2004B). All the historical trench and drill data were reinterpreted and remodelled in Micromine software. Variograms showed that the natural area of influence for intersections is 20 metres. The most dependable data are the very closely spaced, saw-cut channel sample results from the Kearney deposit. Accordingly, the Kearney trench results were extrapolated for that distance along strike and down dip for Measured resources and for a further 17 metres down dip for Indicated resources. Using a 3 g/t Au cut-off and a density of 2.93 Measured and Indicated resources were calculated as shown in Table 10, below.
TABLE 10: MEASURED AND INDICATED RESOURCES ON KEARNEY STRUCTURE (2004)
Cut-off 3 g/t Au, density 2.93 t/m3
Resource Category
Grade g/t Au
Depth M
Trenched strike +20m N and S M
Measured Resource tonnes
Indicated Resource Tonnes
Total Meas. + Ind tonnes
Implied average width m
Grams Au Meas. + Ind.
Measured 11.03 0 to 20 441 56,414 - - 2.18 -
Indicated 11.03 20 to 37 441 - 58,363 - 2.66 -
Total Meas. + Ind.
11.03 0 to 37 441 - - 114,777 2.40 1,265,990
TABLE 10: MEASURED AND INDICATED RESOURCES ON KEARNEY STRUCTURE (2004)
25
This partial estimation of the Kearney deposit resources, confirmed that higher grades could be maintained in a mining operation. Proportions of these Measured and Indicated resources could then be converted to proven and probable reserves respectively, following the development of a final mining plan.
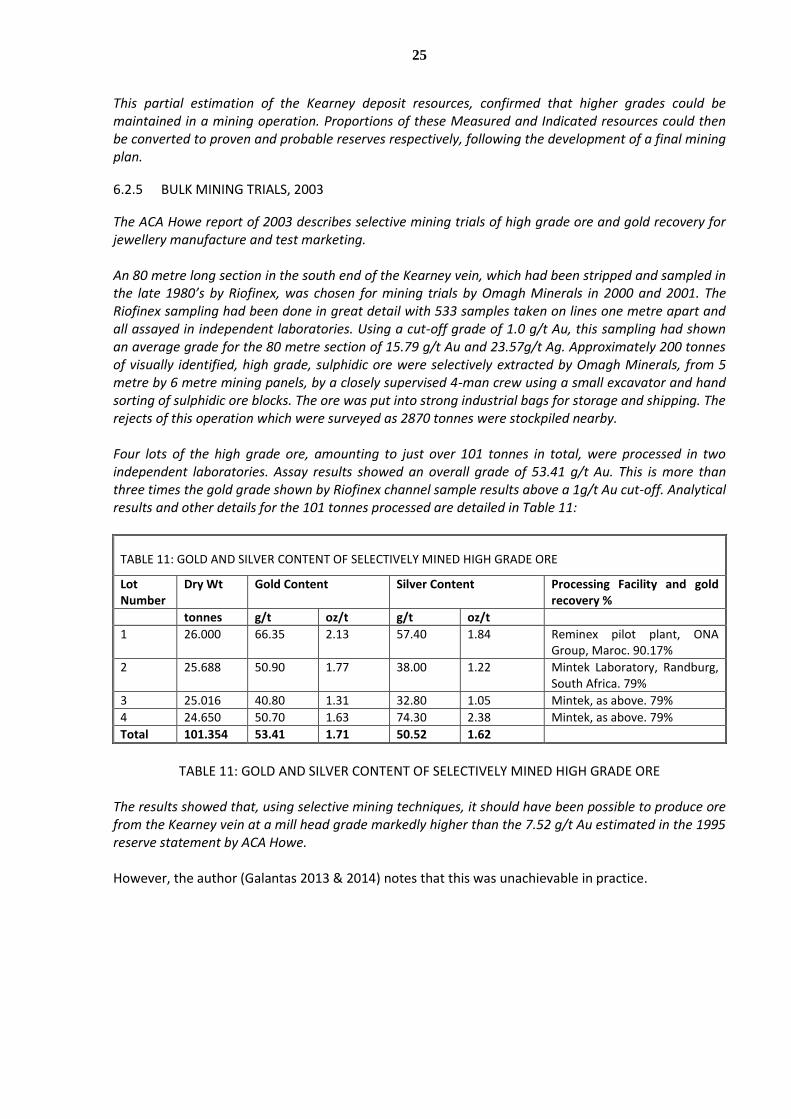
6.2.5 BULK MINING TRIALS, 2003
The ACA Howe report of 2003 describes selective mining trials of high grade ore and gold recovery for jewellery manufacture and test marketing. An 80 metre long section in the south end of the Kearney vein, which had been stripped and sampled in the late 1980’s by Riofinex, was chosen for mining trials by Omagh Minerals in 2000 and 2001. The Riofinex sampling had been done in great detail with 533 samples taken on lines one metre apart and all assayed in independent laboratories. Using a cut-off grade of 1.0 g/t Au, this sampling had shown an average grade for the 80 metre section of 15.79 g/t Au and 23.57g/t Ag. Approximately 200 tonnes of visually identified, high grade, sulphidic ore were selectively extracted by Omagh Minerals, from 5 metre by 6 metre mining panels, by a closely supervised 4-man crew using a small excavator and hand sorting of sulphidic ore blocks. The ore was put into strong industrial bags for storage and shipping. The rejects of this operation which were surveyed as 2870 tonnes were stockpiled nearby. Four lots of the high grade ore, amounting to just over 101 tonnes in total, were processed in two independent laboratories. Assay results showed an overall grade of 53.41 g/t Au. This is more than three times the gold grade shown by Riofinex channel sample results above a 1g/t Au cut-off. Analytical results and other details for the 101 tonnes processed are detailed in Table 11:
TABLE 11: GOLD AND SILVER CONTENT OF SELECTIVELY MINED HIGH GRADE ORE
Lot Number
Dry Wt Gold Content Silver Content Processing Facility and gold recovery %
tonnes g/t oz/t g/t oz/t
1 26.000 66.35 2.13 57.40 1.84 Reminex pilot plant, ONA Group, Maroc. 90.17%
2 25.688 50.90 1.77 38.00 1.22 Mintek Laboratory, Randburg, South Africa. 79%
3 25.016 40.80 1.31 32.80 1.05 Mintek, as above. 79%
4 24.650 50.70 1.63 74.30 2.38 Mintek, as above. 79%
Total 101.354 53.41 1.71 50.52 1.62
TABLE 11: GOLD AND SILVER CONTENT OF SELECTIVELY MINED HIGH GRADE ORE
The results showed that, using selective mining techniques, it should have been possible to produce ore from the Kearney vein at a mill head grade markedly higher than the 7.52 g/t Au estimated in the 1995 reserve statement by ACA Howe. However, the author (Galantas 2013 & 2014) notes that this was unachievable in practice.
26
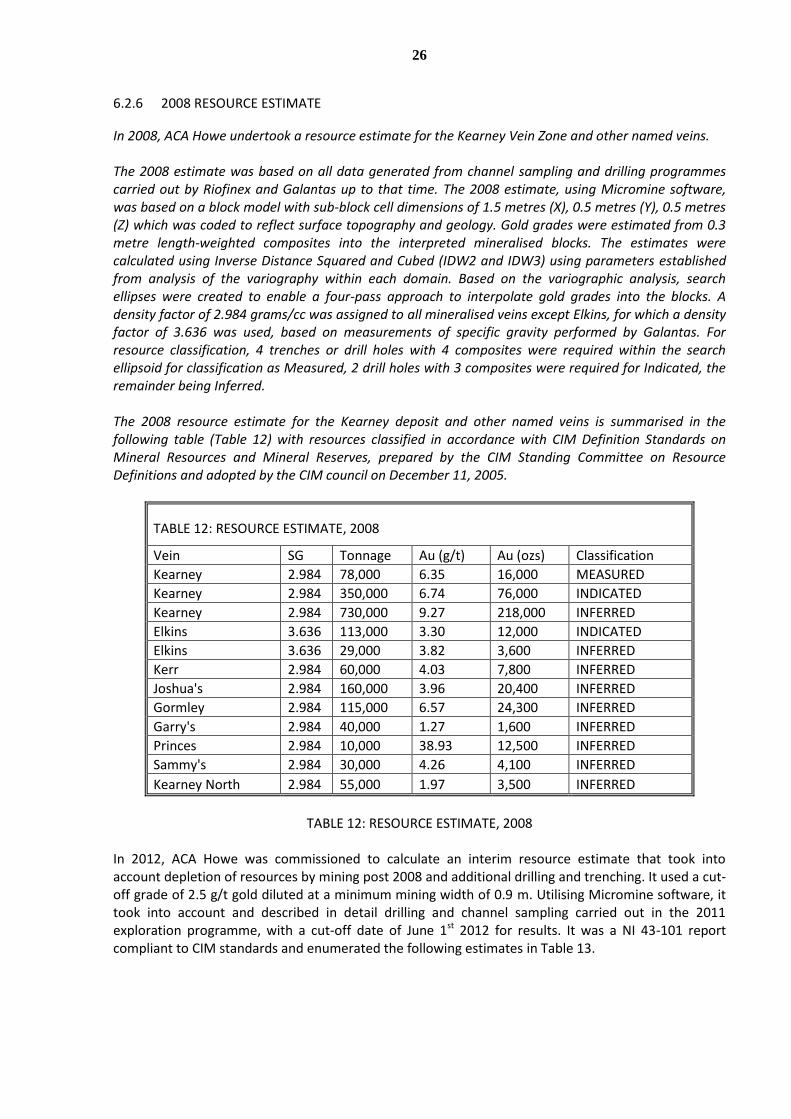
6.2.6 2008 RESOURCE ESTIMATE
In 2008, ACA Howe undertook a resource estimate for the Kearney Vein Zone and other named veins. The 2008 estimate was based on all data generated from channel sampling and drilling programmes carried out by Riofinex and Galantas up to that time. The 2008 estimate, using Micromine software, was based on a block model with sub-block cell dimensions of 1.5 metres (X), 0.5 metres (Y), 0.5 metres (Z) which was coded to reflect surface topography and geology. Gold grades were estimated from 0.3 metre length-weighted composites into the interpreted mineralised blocks. The estimates were calculated using Inverse Distance Squared and Cubed (IDW2 and IDW3) using parameters established from analysis of the variography within each domain. Based on the variographic analysis, search ellipses were created to enable a four-pass approach to interpolate gold grades into the blocks. A density factor of 2.984 grams/cc was assigned to all mineralised veins except Elkins, for which a density factor of 3.636 was used, based on measurements of specific gravity performed by Galantas. For resource classification, 4 trenches or drill holes with 4 composites were required within the search ellipsoid for classification as Measured, 2 drill holes with 3 composites were required for Indicated, the remainder being Inferred. The 2008 resource estimate for the Kearney deposit and other named veins is summarised in the following table (Table 12) with resources classified in accordance with CIM Definition Standards on Mineral Resources and Mineral Reserves, prepared by the CIM Standing Committee on Resource Definitions and adopted by the CIM council on December 11, 2005.
TABLE 12: RESOURCE ESTIMATE, 2008
Vein SG Tonnage Au (g/t) Au (ozs) Classification
Kearney 2.984 78,000 6.35 16,000 MEASURED
Kearney 2.984 350,000 6.74 76,000 INDICATED
Kearney 2.984 730,000 9.27 218,000 INFERRED
Elkins 3.636 113,000 3.30 12,000 INDICATED
Elkins 3.636 29,000 3.82 3,600 INFERRED
Kerr 2.984 60,000 4.03 7,800 INFERRED
Joshua's 2.984 160,000 3.96 20,400 INFERRED
Gormley 2.984 115,000 6.57 24,300 INFERRED
Garry's 2.984 40,000 1.27 1,600 INFERRED
Princes 2.984 10,000 38.93 12,500 INFERRED
Sammy's 2.984 30,000 4.26 4,100 INFERRED
Kearney North 2.984 55,000 1.97 3,500 INFERRED
TABLE 12: RESOURCE ESTIMATE, 2008
In 2012, ACA Howe was commissioned to calculate an interim resource estimate that took into account depletion of resources by mining post 2008 and additional drilling and trenching. It used a cut-off grade of 2.5 g/t gold diluted at a minimum mining width of 0.9 m. Utilising Micromine software, it took into account and described in detail drilling and channel sampling carried out in the 2011 exploration programme, with a cut-off date of June 1st 2012 for results. It was a NI 43-101 report compliant to CIM standards and enumerated the following estimates in Table 13.

27
TABLE 13: ACA HOWE 2012 RESOURCE ESTIMATE
ZONE CATEGORY CUT-OFF 2.5 g/t Au
TONNES Grade (Au g/t)
Au ozs
KEARNEY INDICATED 270,900 7.94 69,000
KEARNEY INFERRED 490,000 8.54 135,000
JOSHUA MEASURED 13,000 6.48 2,800
JOSHUA INDICATED 66,800 6.27 13,000
JOSHUA INFERRED 173,000 8.48 47,000
ELKINS INDICATED 68,500 4.24 9,000
ELKINS INFERRED 20,000 5.84 3,800
KERR MEASURED 2,250 6.75 500
KERR INDICATED 5,400 5.03 900
KERR INFERRED 26,000 4.58 4,000
GORMLEYS INFERRED 75,000 8.78 21,000
GARRY'S INFERRED 0 0 0
PRINCES INFERRED 10,000 38.11 13,000
SAMMY'S INFERRED 27,000 6.07 5,000
KEARNEY NORTH INFERRED 18,000 3.47 2,000
TOTAL MEASURED 15,250 6.52 3,300
INDICATED 411,600 7.01 92,000
INFERRED 839,000 8.53 231,000
TABLE 13: ACA HOWE 2012 RESOURCE ESTIMATE
6.3 OPEN PIT MINING, 2006-2012
Open pit mining (other than bulk sampling) commenced in 2006. By May 2012, mining was largely restricted to the northern end of the pit, mining in other parts of the pit having reached economic limits as dictated by stripping ratio, by the property boundary and road to the east, and by rock stockpiles to the west. The movement of the rock stockpile was prevented when OML’s planning permission to do so was quashed by judicial review, following procedural failings of Planning Service, DoE NI, sterilising surface access to the deeper part of the northern section of the Kearney open pit. 7 GEOLOGICAL SETTING AND MINERALISATION
The following review, from Howe 2012, and as amended, describes the geological setting and mineralisation. The geological setting and the gold mineralisation is described from a combination of information identified in References and Sources and from first hand observations and interpretations by ACA Howe (ACA Howe International Limited, 2003, 2005, 2006 and 2008). The location and the geological setting are shown in Figure 6. The veins of the Kearney swarm are depicted in Figure 5.
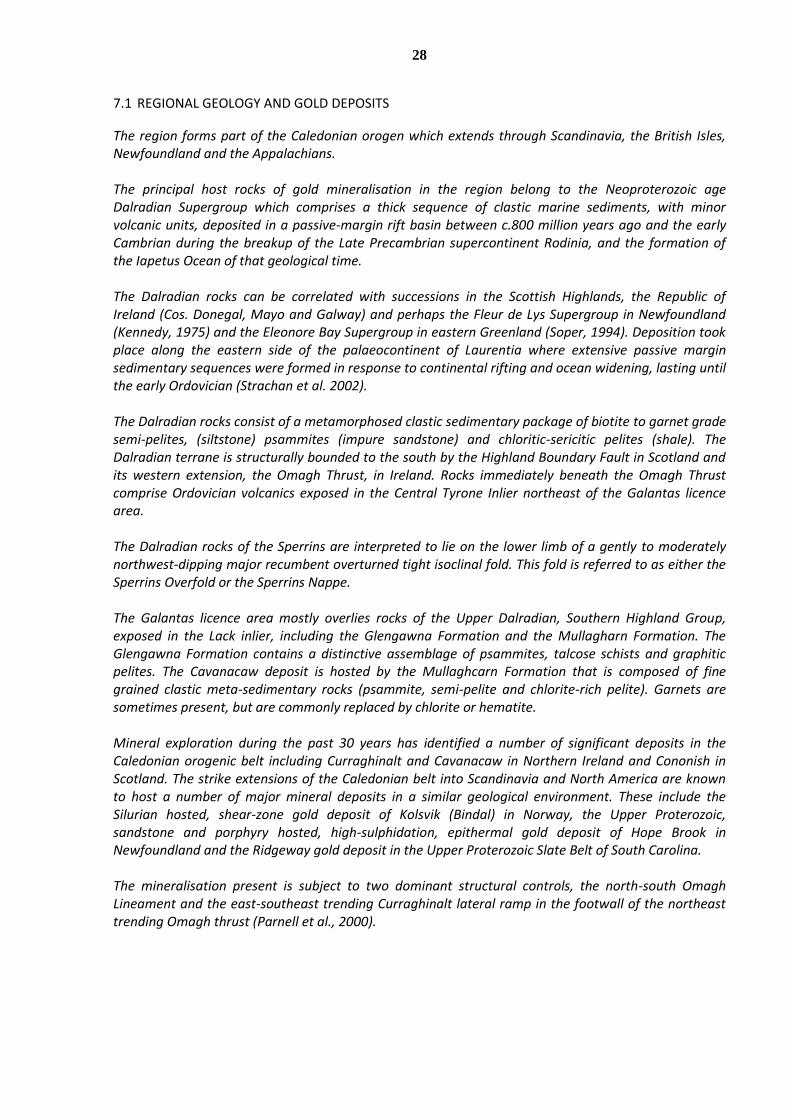
28
7.1 REGIONAL GEOLOGY AND GOLD DEPOSITS
The region forms part of the Caledonian orogen which extends through Scandinavia, the British Isles, Newfoundland and the Appalachians. The principal host rocks of gold mineralisation in the region belong to the Neoproterozoic age Dalradian Supergroup which comprises a thick sequence of clastic marine sediments, with minor volcanic units, deposited in a passive-margin rift basin between c.800 million years ago and the early Cambrian during the breakup of the Late Precambrian supercontinent Rodinia, and the formation of the Iapetus Ocean of that geological time. The Dalradian rocks can be correlated with successions in the Scottish Highlands, the Republic of Ireland (Cos. Donegal, Mayo and Galway) and perhaps the Fleur de Lys Supergroup in Newfoundland (Kennedy, 1975) and the Eleonore Bay Supergroup in eastern Greenland (Soper, 1994). Deposition took place along the eastern side of the palaeocontinent of Laurentia where extensive passive margin sedimentary sequences were formed in response to continental rifting and ocean widening, lasting until the early Ordovician (Strachan et al. 2002). The Dalradian rocks consist of a metamorphosed clastic sedimentary package of biotite to garnet grade semi-pelites, (siltstone) psammites (impure sandstone) and chloritic-sericitic pelites (shale). The Dalradian terrane is structurally bounded to the south by the Highland Boundary Fault in Scotland and its western extension, the Omagh Thrust, in Ireland. Rocks immediately beneath the Omagh Thrust comprise Ordovician volcanics exposed in the Central Tyrone Inlier northeast of the Galantas licence area. The Dalradian rocks of the Sperrins are interpreted to lie on the lower limb of a gently to moderately northwest-dipping major recumbent overturned tight isoclinal fold. This fold is referred to as either the Sperrins Overfold or the Sperrins Nappe. The Galantas licence area mostly overlies rocks of the Upper Dalradian, Southern Highland Group, exposed in the Lack inlier, including the Glengawna Formation and the Mullagharn Formation. The Glengawna Formation contains a distinctive assemblage of psammites, talcose schists and graphitic pelites. The Cavanacaw deposit is hosted by the Mullaghcarn Formation that is composed of fine grained clastic meta-sedimentary rocks (psammite, semi-pelite and chlorite-rich pelite). Garnets are sometimes present, but are commonly replaced by chlorite or hematite. Mineral exploration during the past 30 years has identified a number of significant deposits in the Caledonian orogenic belt including Curraghinalt and Cavanacaw in Northern Ireland and Cononish in Scotland. The strike extensions of the Caledonian belt into Scandinavia and North America are known to host a number of major mineral deposits in a similar geological environment. These include the Silurian hosted, shear-zone gold deposit of Kolsvik (Bindal) in Norway, the Upper Proterozoic, sandstone and porphyry hosted, high-sulphidation, epithermal gold deposit of Hope Brook in Newfoundland and the Ridgeway gold deposit in the Upper Proterozoic Slate Belt of South Carolina. The mineralisation present is subject to two dominant structural controls, the north-south Omagh Lineament and the east-southeast trending Curraghinalt lateral ramp in the footwall of the northeast trending Omagh thrust (Parnell et al., 2000).
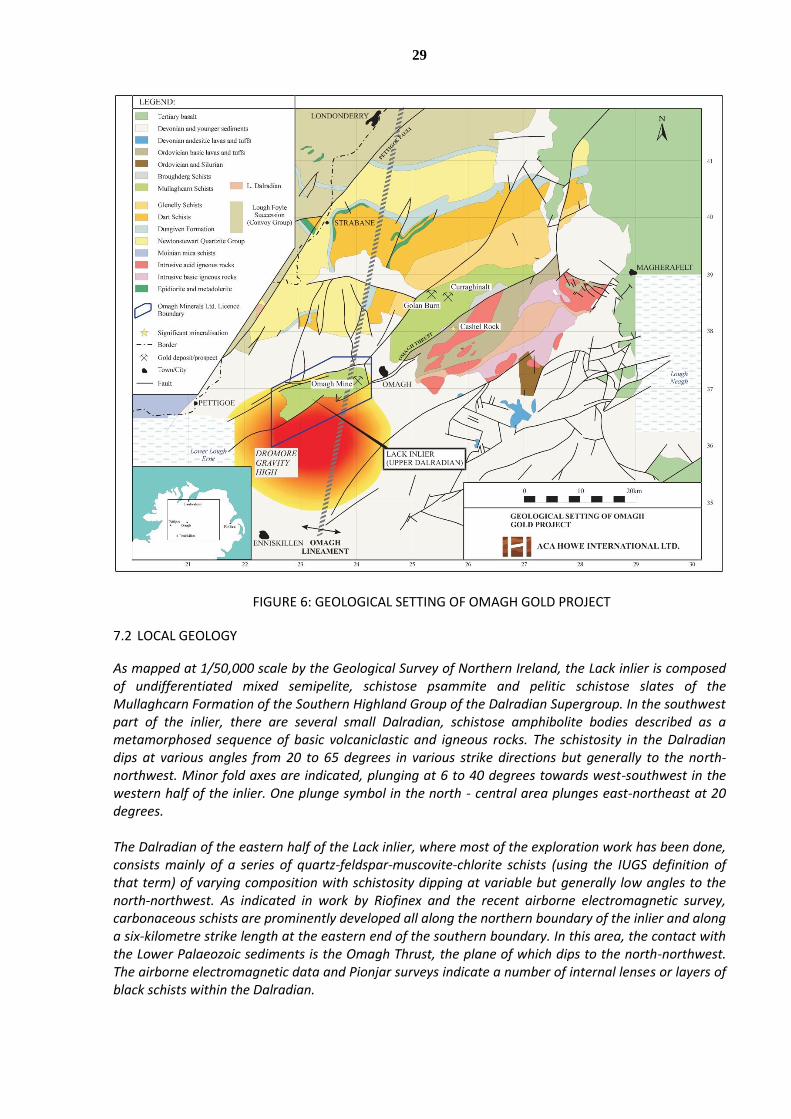
29
FIGURE 6: GEOLOGICAL SETTING OF OMAGH GOLD PROJECT
7.2 LOCAL GEOLOGY
As mapped at 1/50,000 scale by the Geological Survey of Northern Ireland, the Lack inlier is composed of undifferentiated mixed semipelite, schistose psammite and pelitic schistose slates of the Mullaghcarn Formation of the Southern Highland Group of the Dalradian Supergroup. In the southwest part of the inlier, there are several small Dalradian, schistose amphibolite bodies described as a metamorphosed sequence of basic volcaniclastic and igneous rocks. The schistosity in the Dalradian dips at various angles from 20 to 65 degrees in various strike directions but generally to the north-northwest. Minor fold axes are indicated, plunging at 6 to 40 degrees towards west-southwest in the western half of the inlier. One plunge symbol in the north - central area plunges east-northeast at 20 degrees. The Dalradian of the eastern half of the Lack inlier, where most of the exploration work has been done, consists mainly of a series of quartz-feldspar-muscovite-chlorite schists (using the IUGS definition of that term) of varying composition with schistosity dipping at variable but generally low angles to the north-northwest. As indicated in work by Riofinex and the recent airborne electromagnetic survey, carbonaceous schists are prominently developed all along the northern boundary of the inlier and along a six-kilometre strike length at the eastern end of the southern boundary. In this area, the contact with the Lower Palaeozoic sediments is the Omagh Thrust, the plane of which dips to the north-northwest. The airborne electromagnetic data and Pionjar surveys indicate a number of internal lenses or layers of black schists within the Dalradian.
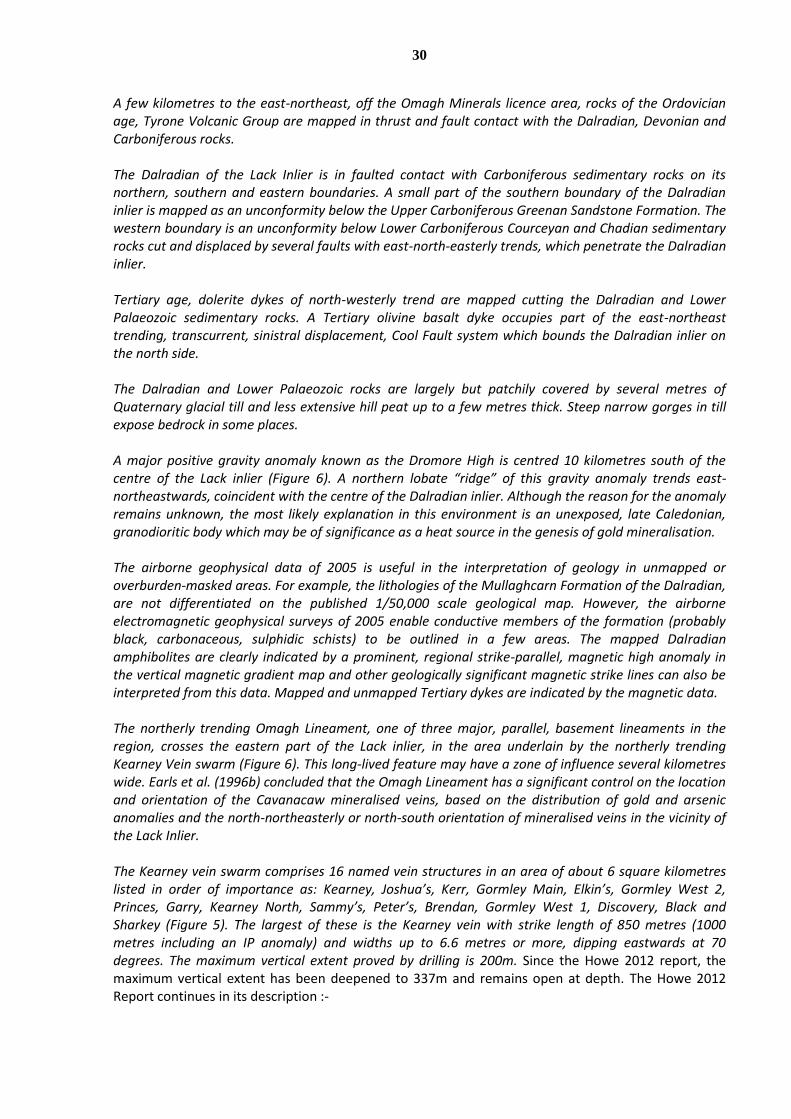
30
A few kilometres to the east-northeast, off the Omagh Minerals licence area, rocks of the Ordovician age, Tyrone Volcanic Group are mapped in thrust and fault contact with the Dalradian, Devonian and Carboniferous rocks. The Dalradian of the Lack Inlier is in faulted contact with Carboniferous sedimentary rocks on its northern, southern and eastern boundaries. A small part of the southern boundary of the Dalradian inlier is mapped as an unconformity below the Upper Carboniferous Greenan Sandstone Formation. The western boundary is an unconformity below Lower Carboniferous Courceyan and Chadian sedimentary rocks cut and displaced by several faults with east-north-easterly trends, which penetrate the Dalradian inlier. Tertiary age, dolerite dykes of north-westerly trend are mapped cutting the Dalradian and Lower Palaeozoic sedimentary rocks. A Tertiary olivine basalt dyke occupies part of the east-northeast trending, transcurrent, sinistral displacement, Cool Fault system which bounds the Dalradian inlier on the north side. The Dalradian and Lower Palaeozoic rocks are largely but patchily covered by several metres of Quaternary glacial till and less extensive hill peat up to a few metres thick. Steep narrow gorges in till expose bedrock in some places. A major positive gravity anomaly known as the Dromore High is centred 10 kilometres south of the centre of the Lack inlier (Figure 6). A northern lobate “ridge” of this gravity anomaly trends east-northeastwards, coincident with the centre of the Dalradian inlier. Although the reason for the anomaly remains unknown, the most likely explanation in this environment is an unexposed, late Caledonian, granodioritic body which may be of significance as a heat source in the genesis of gold mineralisation. The airborne geophysical data of 2005 is useful in the interpretation of geology in unmapped or overburden-masked areas. For example, the lithologies of the Mullaghcarn Formation of the Dalradian, are not differentiated on the published 1/50,000 scale geological map. However, the airborne electromagnetic geophysical surveys of 2005 enable conductive members of the formation (probably black, carbonaceous, sulphidic schists) to be outlined in a few areas. The mapped Dalradian amphibolites are clearly indicated by a prominent, regional strike-parallel, magnetic high anomaly in the vertical magnetic gradient map and other geologically significant magnetic strike lines can also be interpreted from this data. Mapped and unmapped Tertiary dykes are indicated by the magnetic data. The northerly trending Omagh Lineament, one of three major, parallel, basement lineaments in the region, crosses the eastern part of the Lack inlier, in the area underlain by the northerly trending Kearney Vein swarm (Figure 6). This long-lived feature may have a zone of influence several kilometres wide. Earls et al. (1996b) concluded that the Omagh Lineament has a significant control on the location and orientation of the Cavanacaw mineralised veins, based on the distribution of gold and arsenic anomalies and the north-northeasterly or north-south orientation of mineralised veins in the vicinity of the Lack Inlier. The Kearney vein swarm comprises 16 named vein structures in an area of about 6 square kilometres listed in order of importance as: Kearney, Joshua’s, Kerr, Gormley Main, Elkin’s, Gormley West 2, Princes, Garry, Kearney North, Sammy’s, Peter’s, Brendan, Gormley West 1, Discovery, Black and Sharkey (Figure 5). The largest of these is the Kearney vein with strike length of 850 metres (1000 metres including an IP anomaly) and widths up to 6.6 metres or more, dipping eastwards at 70 degrees. The maximum vertical extent proved by drilling is 200m. Since the Howe 2012 report, the maximum vertical extent has been deepened to 337m and remains open at depth. The Howe 2012 Report continues in its description :-
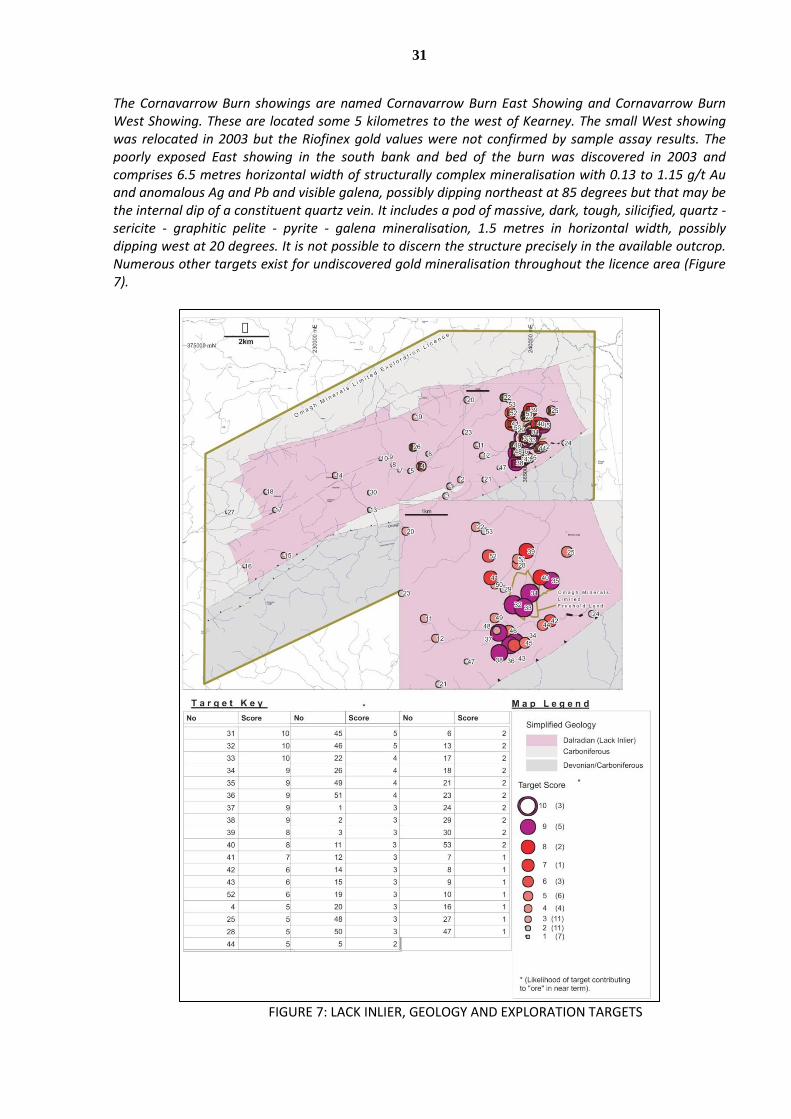
31
The Cornavarrow Burn showings are named Cornavarrow Burn East Showing and Cornavarrow Burn West Showing. These are located some 5 kilometres to the west of Kearney. The small West showing was relocated in 2003 but the Riofinex gold values were not confirmed by sample assay results. The poorly exposed East showing in the south bank and bed of the burn was discovered in 2003 and comprises 6.5 metres horizontal width of structurally complex mineralisation with 0.13 to 1.15 g/t Au and anomalous Ag and Pb and visible galena, possibly dipping northeast at 85 degrees but that may be the internal dip of a constituent quartz vein. It includes a pod of massive, dark, tough, silicified, quartz - sericite - graphitic pelite - pyrite - galena mineralisation, 1.5 metres in horizontal width, possibly dipping west at 20 degrees. It is not possible to discern the structure precisely in the available outcrop. Numerous other targets exist for undiscovered gold mineralisation throughout the licence area (Figure 7).
FIGURE 7: LACK INLIER, GEOLOGY AND EXPLORATION TARGETS
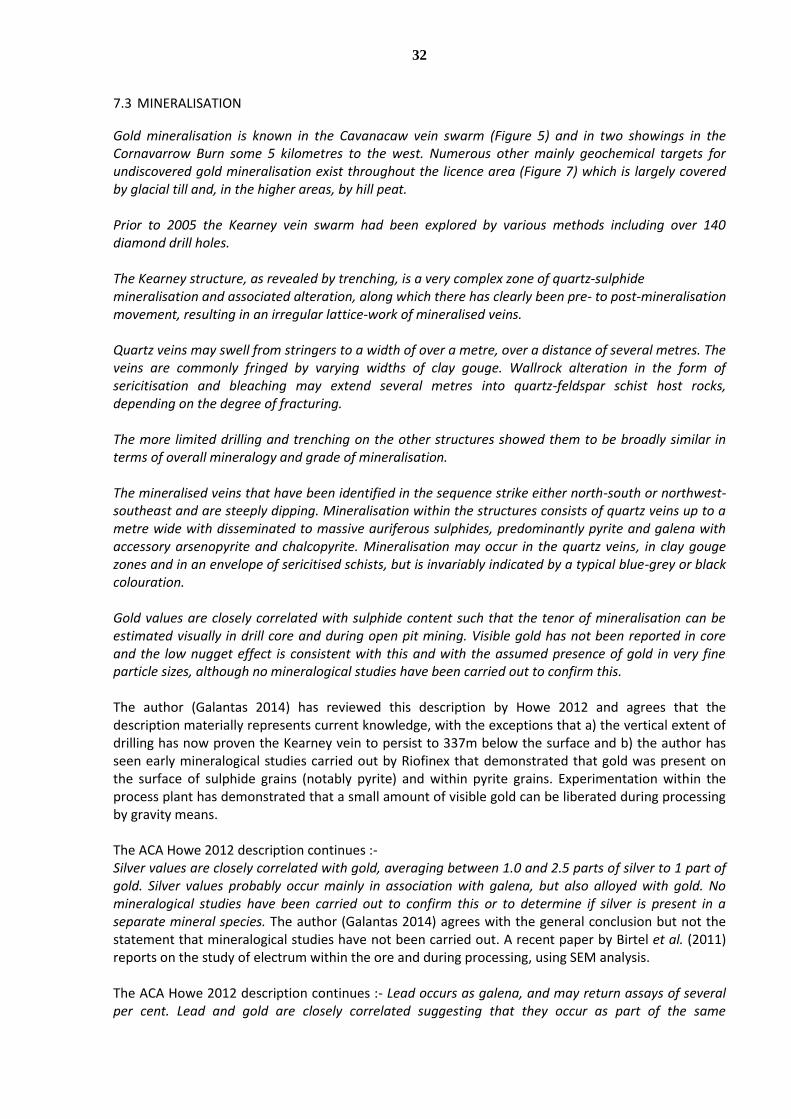
32
7.3 MINERALISATION
Gold mineralisation is known in the Cavanacaw vein swarm (Figure 5) and in two showings in the Cornavarrow Burn some 5 kilometres to the west. Numerous other mainly geochemical targets for undiscovered gold mineralisation exist throughout the licence area (Figure 7) which is largely covered by glacial till and, in the higher areas, by hill peat. Prior to 2005 the Kearney vein swarm had been explored by various methods including over 140 diamond drill holes. The Kearney structure, as revealed by trenching, is a very complex zone of quartz-sulphide mineralisation and associated alteration, along which there has clearly been pre- to post-mineralisation movement, resulting in an irregular lattice-work of mineralised veins. Quartz veins may swell from stringers to a width of over a metre, over a distance of several metres. The veins are commonly fringed by varying widths of clay gouge. Wallrock alteration in the form of sericitisation and bleaching may extend several metres into quartz-feldspar schist host rocks, depending on the degree of fracturing. The more limited drilling and trenching on the other structures showed them to be broadly similar in terms of overall mineralogy and grade of mineralisation. The mineralised veins that have been identified in the sequence strike either north-south or northwest-southeast and are steeply dipping. Mineralisation within the structures consists of quartz veins up to a metre wide with disseminated to massive auriferous sulphides, predominantly pyrite and galena with accessory arsenopyrite and chalcopyrite. Mineralisation may occur in the quartz veins, in clay gouge zones and in an envelope of sericitised schists, but is invariably indicated by a typical blue-grey or black colouration. Gold values are closely correlated with sulphide content such that the tenor of mineralisation can be estimated visually in drill core and during open pit mining. Visible gold has not been reported in core and the low nugget effect is consistent with this and with the assumed presence of gold in very fine particle sizes, although no mineralogical studies have been carried out to confirm this. The author (Galantas 2014) has reviewed this description by Howe 2012 and agrees that the description materially represents current knowledge, with the exceptions that a) the vertical extent of drilling has now proven the Kearney vein to persist to 337m below the surface and b) the author has seen early mineralogical studies carried out by Riofinex that demonstrated that gold was present on the surface of sulphide grains (notably pyrite) and within pyrite grains. Experimentation within the process plant has demonstrated that a small amount of visible gold can be liberated during processing by gravity means. The ACA Howe 2012 description continues :- Silver values are closely correlated with gold, averaging between 1.0 and 2.5 parts of silver to 1 part of gold. Silver values probably occur mainly in association with galena, but also alloyed with gold. No mineralogical studies have been carried out to confirm this or to determine if silver is present in a separate mineral species. The author (Galantas 2014) agrees with the general conclusion but not the statement that mineralogical studies have not been carried out. A recent paper by Birtel et al. (2011) reports on the study of electrum within the ore and during processing, using SEM analysis. The ACA Howe 2012 description continues :- Lead occurs as galena, and may return assays of several per cent. Lead and gold are closely correlated suggesting that they occur as part of the same
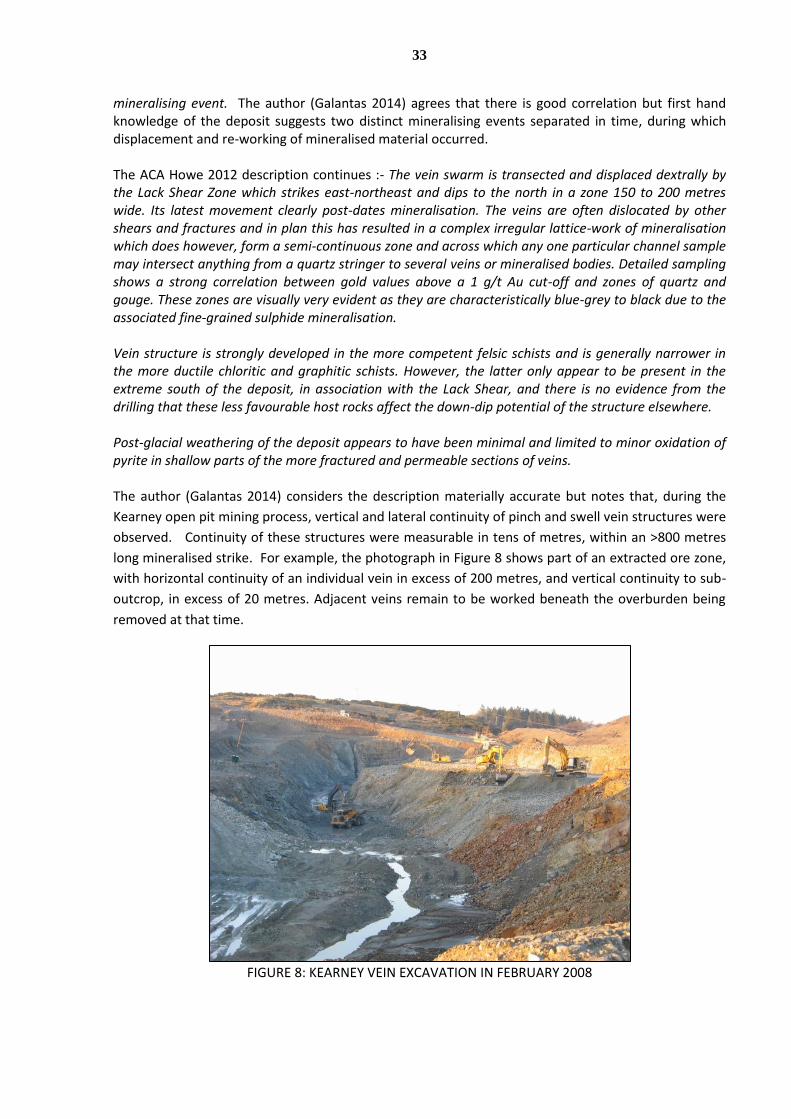
33
mineralising event. The author (Galantas 2014) agrees that there is good correlation but first hand knowledge of the deposit suggests two distinct mineralising events separated in time, during which displacement and re-working of mineralised material occurred. The ACA Howe 2012 description continues :- The vein swarm is transected and displaced dextrally by the Lack Shear Zone which strikes east-northeast and dips to the north in a zone 150 to 200 metres wide. Its latest movement clearly post-dates mineralisation. The veins are often dislocated by other shears and fractures and in plan this has resulted in a complex irregular lattice-work of mineralisation which does however, form a semi-continuous zone and across which any one particular channel sample may intersect anything from a quartz stringer to several veins or mineralised bodies. Detailed sampling shows a strong correlation between gold values above a 1 g/t Au cut-off and zones of quartz and gouge. These zones are visually very evident as they are characteristically blue-grey to black due to the associated fine-grained sulphide mineralisation. Vein structure is strongly developed in the more competent felsic schists and is generally narrower in the more ductile chloritic and graphitic schists. However, the latter only appear to be present in the extreme south of the deposit, in association with the Lack Shear, and there is no evidence from the drilling that these less favourable host rocks affect the down-dip potential of the structure elsewhere. Post-glacial weathering of the deposit appears to have been minimal and limited to minor oxidation of pyrite in shallow parts of the more fractured and permeable sections of veins. The author (Galantas 2014) considers the description materially accurate but notes that, during the
Kearney open pit mining process, vertical and lateral continuity of pinch and swell vein structures were
observed. Continuity of these structures were measurable in tens of metres, within an >800 metres
long mineralised strike. For example, the photograph in Figure 8 shows part of an extracted ore zone,
with horizontal continuity of an individual vein in excess of 200 metres, and vertical continuity to sub-
outcrop, in excess of 20 metres. Adjacent veins remain to be worked beneath the overburden being
removed at that time.
FIGURE 8: KEARNEY VEIN EXCAVATION IN FEBRUARY 2008
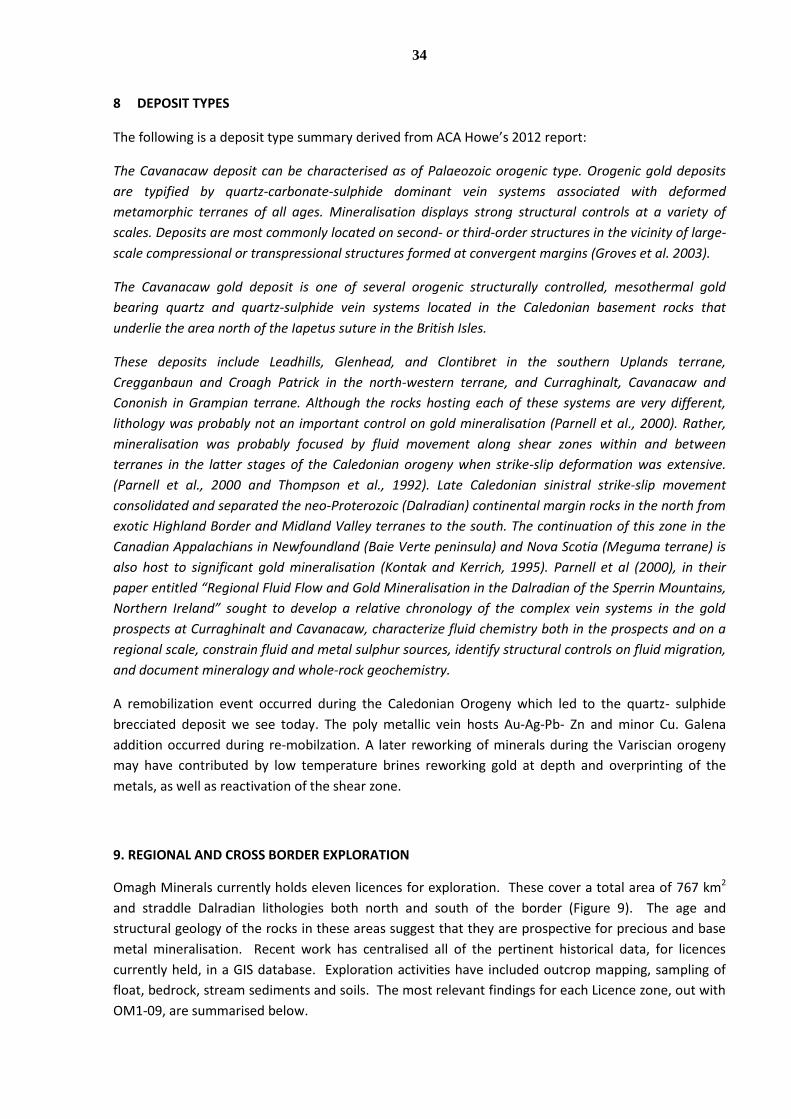
34
8 DEPOSIT TYPES
The following is a deposit type summary derived from ACA Howe’s 2012 report:
The Cavanacaw deposit can be characterised as of Palaeozoic orogenic type. Orogenic gold deposits
are typified by quartz-carbonate-sulphide dominant vein systems associated with deformed
metamorphic terranes of all ages. Mineralisation displays strong structural controls at a variety of
scales. Deposits are most commonly located on second- or third-order structures in the vicinity of large-
scale compressional or transpressional structures formed at convergent margins (Groves et al. 2003).
The Cavanacaw gold deposit is one of several orogenic structurally controlled, mesothermal gold
bearing quartz and quartz-sulphide vein systems located in the Caledonian basement rocks that
underlie the area north of the Iapetus suture in the British Isles.
These deposits include Leadhills, Glenhead, and Clontibret in the southern Uplands terrane,
Cregganbaun and Croagh Patrick in the north-western terrane, and Curraghinalt, Cavanacaw and
Cononish in Grampian terrane. Although the rocks hosting each of these systems are very different,
lithology was probably not an important control on gold mineralisation (Parnell et al., 2000). Rather,
mineralisation was probably focused by fluid movement along shear zones within and between
terranes in the latter stages of the Caledonian orogeny when strike-slip deformation was extensive.
(Parnell et al., 2000 and Thompson et al., 1992). Late Caledonian sinistral strike-slip movement
consolidated and separated the neo-Proterozoic (Dalradian) continental margin rocks in the north from
exotic Highland Border and Midland Valley terranes to the south. The continuation of this zone in the
Canadian Appalachians in Newfoundland (Baie Verte peninsula) and Nova Scotia (Meguma terrane) is
also host to significant gold mineralisation (Kontak and Kerrich, 1995). Parnell et al (2000), in their
paper entitled “Regional Fluid Flow and Gold Mineralisation in the Dalradian of the Sperrin Mountains,
Northern Ireland” sought to develop a relative chronology of the complex vein systems in the gold
prospects at Curraghinalt and Cavanacaw, characterize fluid chemistry both in the prospects and on a
regional scale, constrain fluid and metal sulphur sources, identify structural controls on fluid migration,
and document mineralogy and whole-rock geochemistry.
A remobilization event occurred during the Caledonian Orogeny which led to the quartz- sulphide
brecciated deposit we see today. The poly metallic vein hosts Au-Ag-Pb- Zn and minor Cu. Galena
addition occurred during re-mobilzation. A later reworking of minerals during the Variscian orogeny
may have contributed by low temperature brines reworking gold at depth and overprinting of the
metals, as well as reactivation of the shear zone.
9. REGIONAL AND CROSS BORDER EXPLORATION
Omagh Minerals currently holds eleven licences for exploration. These cover a total area of 767 km2
and straddle Dalradian lithologies both north and south of the border (Figure 9). The age and
structural geology of the rocks in these areas suggest that they are prospective for precious and base
metal mineralisation. Recent work has centralised all of the pertinent historical data, for licences
currently held, in a GIS database. Exploration activities have included outcrop mapping, sampling of
float, bedrock, stream sediments and soils. The most relevant findings for each Licence zone, out with
OM1-09, are summarised below.
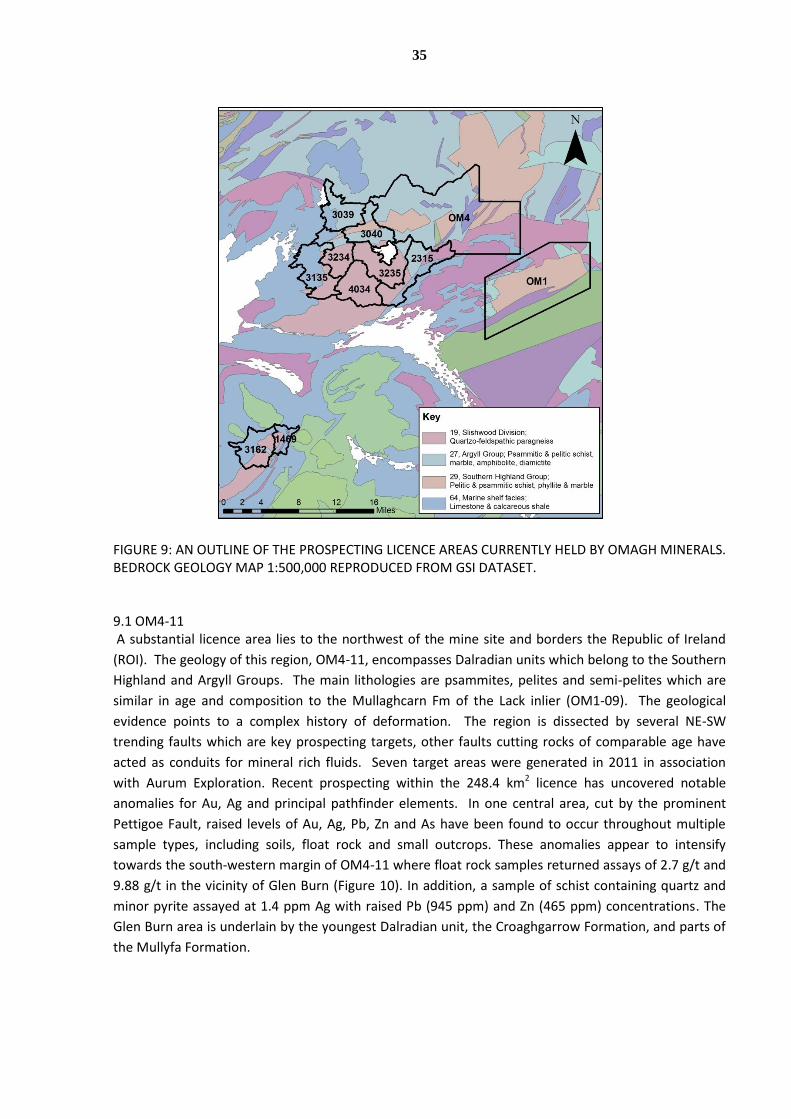
35
FIGURE 9: AN OUTLINE OF THE PROSPECTING LICENCE AREAS CURRENTLY HELD BY OMAGH MINERALS. BEDROCK GEOLOGY MAP 1:500,000 REPRODUCED FROM GSI DATASET. 9.1 OM4-11 A substantial licence area lies to the northwest of the mine site and borders the Republic of Ireland
(ROI). The geology of this region, OM4-11, encompasses Dalradian units which belong to the Southern
Highland and Argyll Groups. The main lithologies are psammites, pelites and semi-pelites which are
similar in age and composition to the Mullaghcarn Fm of the Lack inlier (OM1-09). The geological
evidence points to a complex history of deformation. The region is dissected by several NE-SW
trending faults which are key prospecting targets, other faults cutting rocks of comparable age have
acted as conduits for mineral rich fluids. Seven target areas were generated in 2011 in association
with Aurum Exploration. Recent prospecting within the 248.4 km2 licence has uncovered notable
anomalies for Au, Ag and principal pathfinder elements. In one central area, cut by the prominent
Pettigoe Fault, raised levels of Au, Ag, Pb, Zn and As have been found to occur throughout multiple
sample types, including soils, float rock and small outcrops. These anomalies appear to intensify
towards the south-western margin of OM4-11 where float rock samples returned assays of 2.7 g/t and
9.88 g/t in the vicinity of Glen Burn (Figure 10). In addition, a sample of schist containing quartz and
minor pyrite assayed at 1.4 ppm Ag with raised Pb (945 ppm) and Zn (465 ppm) concentrations. The
Glen Burn area is underlain by the youngest Dalradian unit, the Croaghgarrow Formation, and parts of
the Mullyfa Formation.
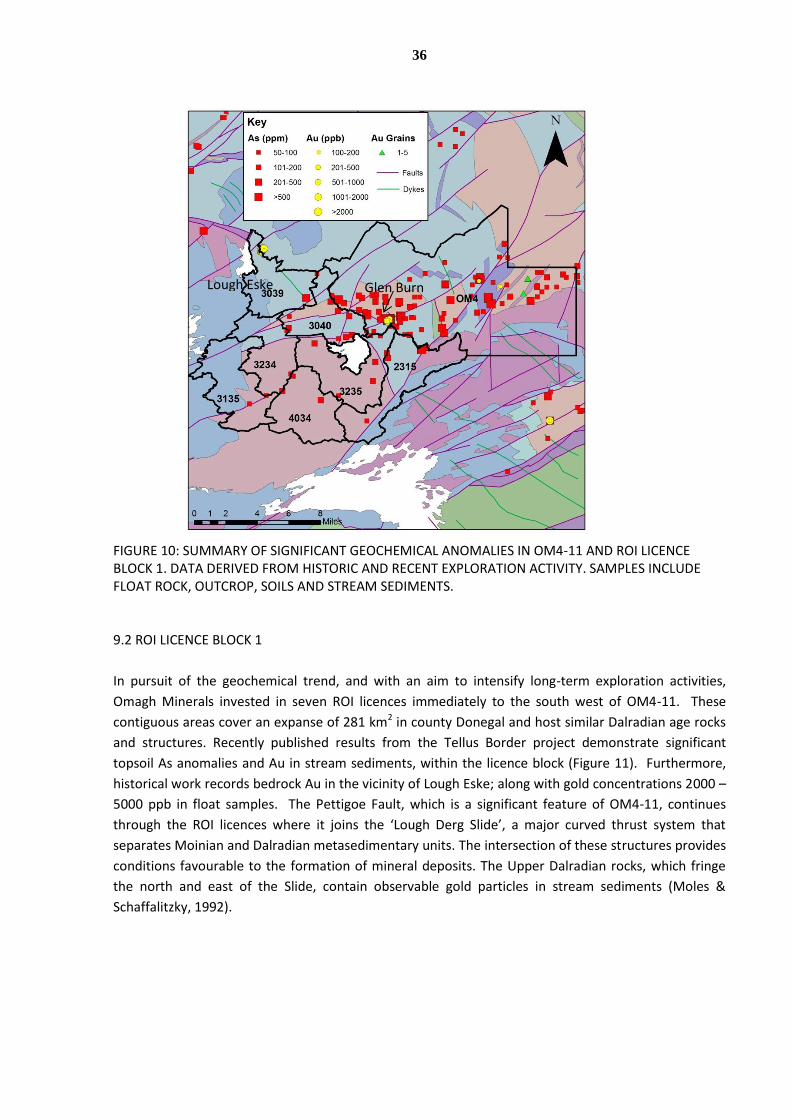
36
FIGURE 10: SUMMARY OF SIGNIFICANT GEOCHEMICAL ANOMALIES IN OM4-11 AND ROI LICENCE BLOCK 1. DATA DERIVED FROM HISTORIC AND RECENT EXPLORATION ACTIVITY. SAMPLES INCLUDE FLOAT ROCK, OUTCROP, SOILS AND STREAM SEDIMENTS. 9.2 ROI LICENCE BLOCK 1
In pursuit of the geochemical trend, and with an aim to intensify long-term exploration activities,
Omagh Minerals invested in seven ROI licences immediately to the south west of OM4-11. These
contiguous areas cover an expanse of 281 km2 in county Donegal and host similar Dalradian age rocks
and structures. Recently published results from the Tellus Border project demonstrate significant
topsoil As anomalies and Au in stream sediments, within the licence block (Figure 11). Furthermore,
historical work records bedrock Au in the vicinity of Lough Eske; along with gold concentrations 2000 –
5000 ppb in float samples. The Pettigoe Fault, which is a significant feature of OM4-11, continues
through the ROI licences where it joins the ‘Lough Derg Slide’, a major curved thrust system that
separates Moinian and Dalradian metasedimentary units. The intersection of these structures provides
conditions favourable to the formation of mineral deposits. The Upper Dalradian rocks, which fringe
the north and east of the Slide, contain observable gold particles in stream sediments (Moles &
Schaffalitzky, 1992).
Glen Burn Lough Eske
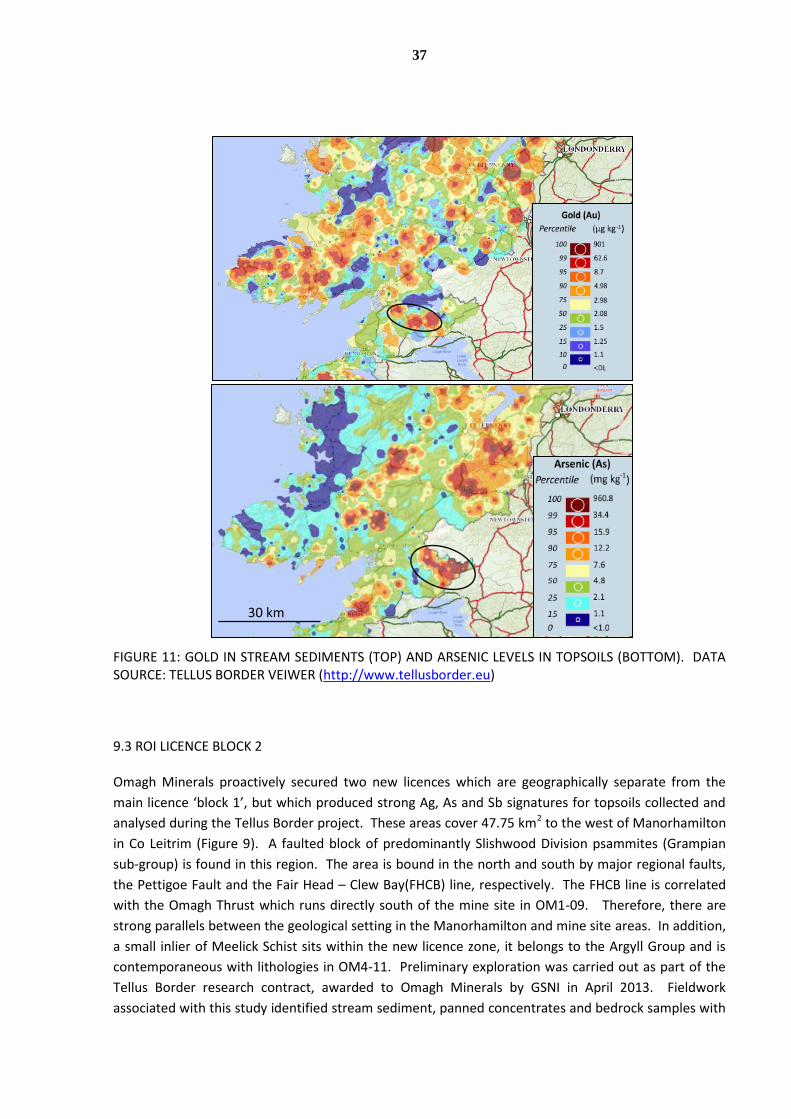
37
FIGURE 11: GOLD IN STREAM SEDIMENTS (TOP) AND ARSENIC LEVELS IN TOPSOILS (BOTTOM). DATA SOURCE: TELLUS BORDER VEIWER (http://www.tellusborder.eu) 9.3 ROI LICENCE BLOCK 2 Omagh Minerals proactively secured two new licences which are geographically separate from the
main licence ‘block 1’, but which produced strong Ag, As and Sb signatures for topsoils collected and
analysed during the Tellus Border project. These areas cover 47.75 km2 to the west of Manorhamilton
in Co Leitrim (Figure 9). A faulted block of predominantly Slishwood Division psammites (Grampian
sub-group) is found in this region. The area is bound in the north and south by major regional faults,
the Pettigoe Fault and the Fair Head – Clew Bay(FHCB) line, respectively. The FHCB line is correlated
with the Omagh Thrust which runs directly south of the mine site in OM1-09. Therefore, there are
strong parallels between the geological setting in the Manorhamilton and mine site areas. In addition,
a small inlier of Meelick Schist sits within the new licence zone, it belongs to the Argyll Group and is
contemporaneous with lithologies in OM4-11. Preliminary exploration was carried out as part of the
Tellus Border research contract, awarded to Omagh Minerals by GSNI in April 2013. Fieldwork
associated with this study identified stream sediment, panned concentrates and bedrock samples with
30 km
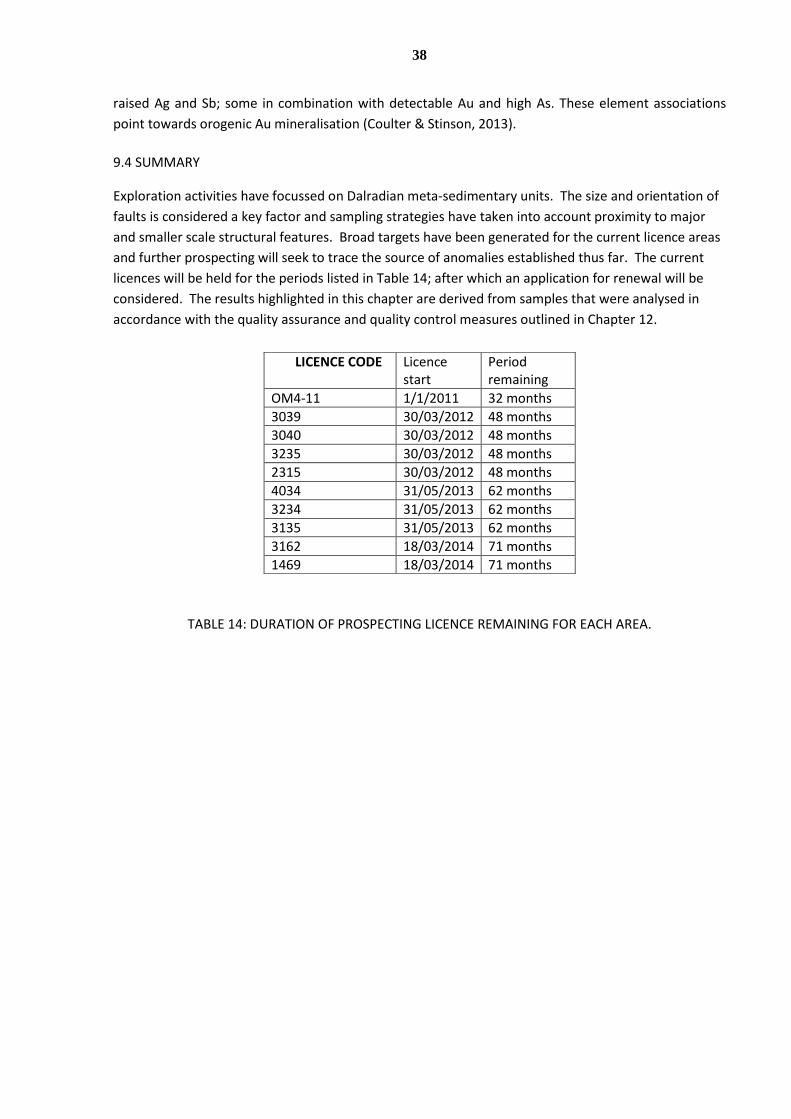
38
raised Ag and Sb; some in combination with detectable Au and high As. These element associations
point towards orogenic Au mineralisation (Coulter & Stinson, 2013).
9.4 SUMMARY
Exploration activities have focussed on Dalradian meta-sedimentary units. The size and orientation of
faults is considered a key factor and sampling strategies have taken into account proximity to major
and smaller scale structural features. Broad targets have been generated for the current licence areas
and further prospecting will seek to trace the source of anomalies established thus far. The current
licences will be held for the periods listed in Table 14; after which an application for renewal will be
considered. The results highlighted in this chapter are derived from samples that were analysed in
accordance with the quality assurance and quality control measures outlined in Chapter 12.
TABLE 14: DURATION OF PROSPECTING LICENCE REMAINING FOR EACH AREA.
LICENCE CODE Licence start
Period remaining
OM4-11 1/1/2011 32 months
3039 30/03/2012 48 months
3040 30/03/2012 48 months
3235 30/03/2012 48 months
2315 30/03/2012 48 months
4034 31/05/2013 62 months
3234 31/05/2013 62 months
3135 31/05/2013 62 months
3162 18/03/2014 71 months
1469 18/03/2014 71 months
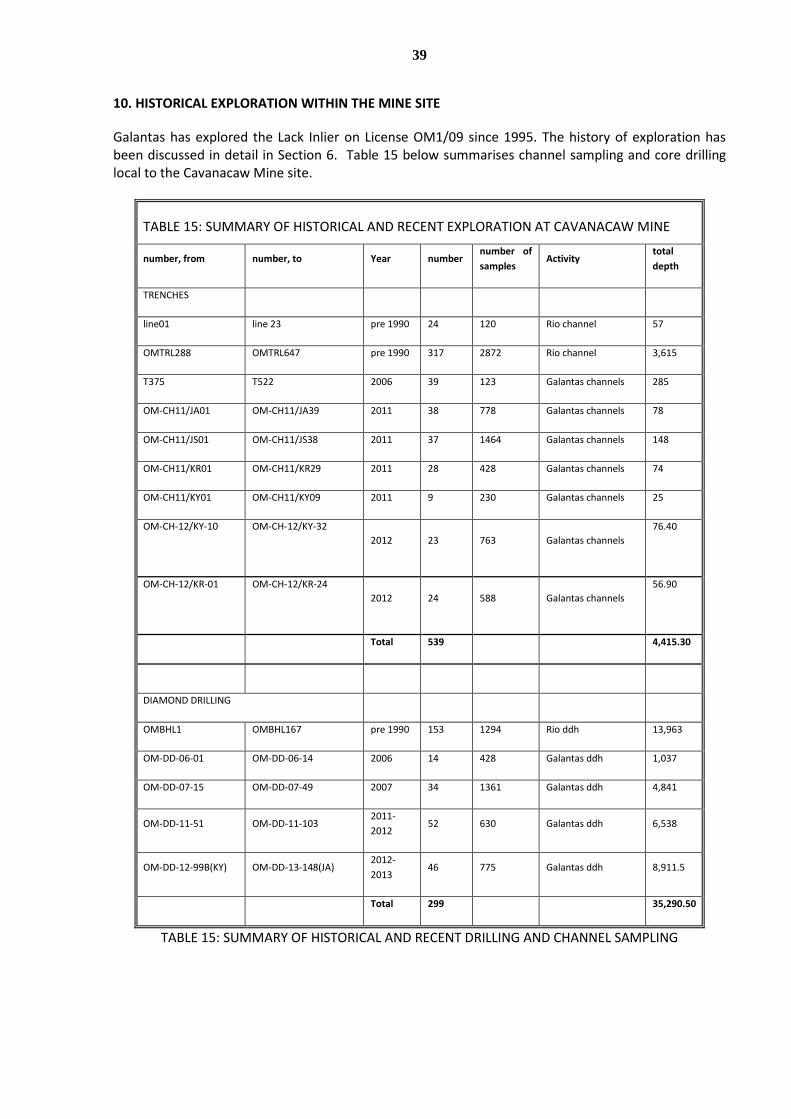
39
10. HISTORICAL EXPLORATION WITHIN THE MINE SITE
Galantas has explored the Lack Inlier on License OM1/09 since 1995. The history of exploration has been discussed in detail in Section 6. Table 15 below summarises channel sampling and core drilling local to the Cavanacaw Mine site.
TABLE 15: SUMMARY OF HISTORICAL AND RECENT EXPLORATION AT CAVANACAW MINE
number, from number, to Year number number of
samples Activity
total
depth
TRENCHES
line01 line 23 pre 1990 24 120 Rio channel 57
OMTRL288 OMTRL647 pre 1990 317 2872 Rio channel 3,615
T375 T522 2006 39 123 Galantas channels 285
OM-CH11/JA01 OM-CH11/JA39 2011 38 778 Galantas channels 78
OM-CH11/JS01 OM-CH11/JS38 2011 37 1464 Galantas channels 148
OM-CH11/KR01 OM-CH11/KR29 2011 28 428 Galantas channels 74
OM-CH11/KY01 OM-CH11/KY09 2011 9 230 Galantas channels 25
OM-CH-12/KY-10
OM-CH-12/KY-32
2012 23 763 Galantas channels
76.40
OM-CH-12/KR-01
OM-CH-12/KR-24
2012 24 588 Galantas channels
56.90
Total 539 4,415.30
DIAMOND DRILLING
OMBHL1 OMBHL167 pre 1990 153 1294 Rio ddh 13,963
OM-DD-06-01 OM-DD-06-14 2006 14 428 Galantas ddh 1,037
OM-DD-07-15 OM-DD-07-49 2007 34 1361 Galantas ddh 4,841
OM-DD-11-51 OM-DD-11-103 2011-
2012 52 630 Galantas ddh 6,538
OM-DD-12-99B(KY) OM-DD-13-148(JA) 2012-
2013 46 775 Galantas ddh 8,911.5
Total 299 35,290.50
TABLE 15: SUMMARY OF HISTORICAL AND RECENT DRILLING AND CHANNEL SAMPLING
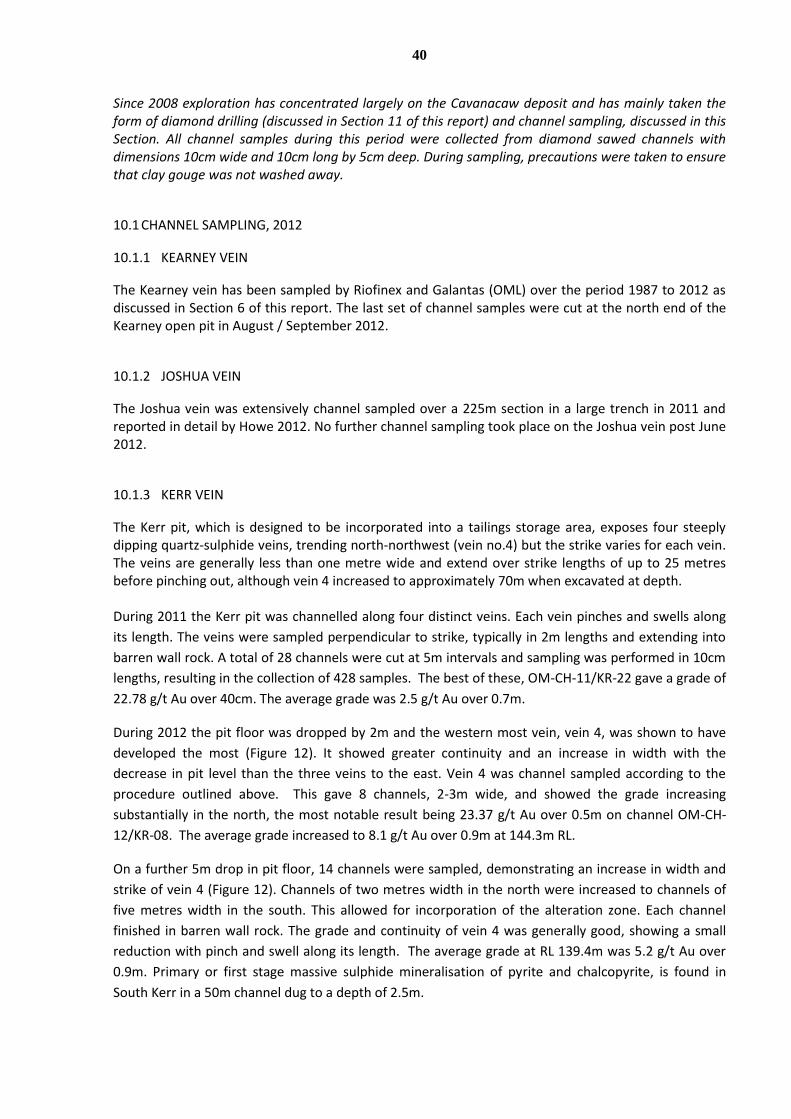
40
Since 2008 exploration has concentrated largely on the Cavanacaw deposit and has mainly taken the form of diamond drilling (discussed in Section 11 of this report) and channel sampling, discussed in this Section. All channel samples during this period were collected from diamond sawed channels with dimensions 10cm wide and 10cm long by 5cm deep. During sampling, precautions were taken to ensure that clay gouge was not washed away.
10.1 CHANNEL SAMPLING, 2012
10.1.1 KEARNEY VEIN
The Kearney vein has been sampled by Riofinex and Galantas (OML) over the period 1987 to 2012 as discussed in Section 6 of this report. The last set of channel samples were cut at the north end of the Kearney open pit in August / September 2012.
10.1.2 JOSHUA VEIN
The Joshua vein was extensively channel sampled over a 225m section in a large trench in 2011 and reported in detail by Howe 2012. No further channel sampling took place on the Joshua vein post June 2012.
10.1.3 KERR VEIN
The Kerr pit, which is designed to be incorporated into a tailings storage area, exposes four steeply dipping quartz-sulphide veins, trending north-northwest (vein no.4) but the strike varies for each vein. The veins are generally less than one metre wide and extend over strike lengths of up to 25 metres before pinching out, although vein 4 increased to approximately 70m when excavated at depth. During 2011 the Kerr pit was channelled along four distinct veins. Each vein pinches and swells along
its length. The veins were sampled perpendicular to strike, typically in 2m lengths and extending into
barren wall rock. A total of 28 channels were cut at 5m intervals and sampling was performed in 10cm
lengths, resulting in the collection of 428 samples. The best of these, OM-CH-11/KR-22 gave a grade of
22.78 g/t Au over 40cm. The average grade was 2.5 g/t Au over 0.7m.
During 2012 the pit floor was dropped by 2m and the western most vein, vein 4, was shown to have
developed the most (Figure 12). It showed greater continuity and an increase in width with the
decrease in pit level than the three veins to the east. Vein 4 was channel sampled according to the
procedure outlined above. This gave 8 channels, 2-3m wide, and showed the grade increasing
substantially in the north, the most notable result being 23.37 g/t Au over 0.5m on channel OM-CH-
12/KR-08. The average grade increased to 8.1 g/t Au over 0.9m at 144.3m RL.
On a further 5m drop in pit floor, 14 channels were sampled, demonstrating an increase in width and
strike of vein 4 (Figure 12). Channels of two metres width in the north were increased to channels of
five metres width in the south. This allowed for incorporation of the alteration zone. Each channel
finished in barren wall rock. The grade and continuity of vein 4 was generally good, showing a small
reduction with pinch and swell along its length. The average grade at RL 139.4m was 5.2 g/t Au over
0.9m. Primary or first stage massive sulphide mineralisation of pyrite and chalcopyrite, is found in
South Kerr in a 50m channel dug to a depth of 2.5m.
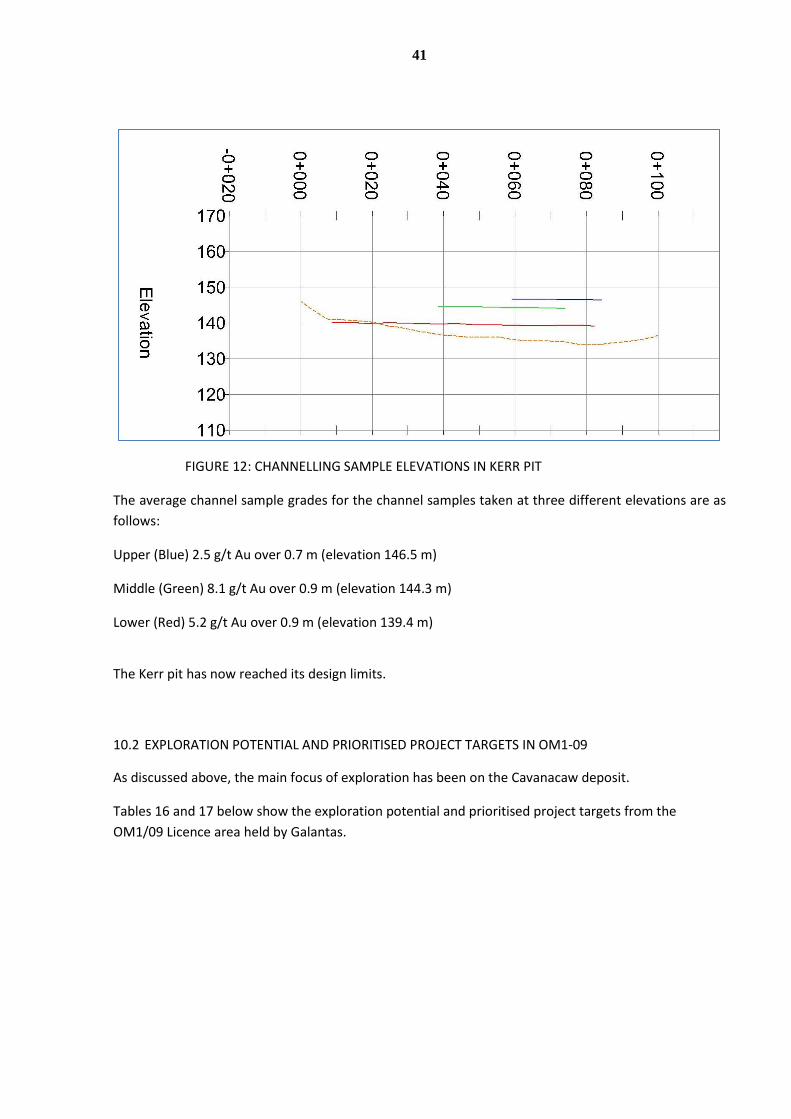
41
FIGURE 12: CHANNELLING SAMPLE ELEVATIONS IN KERR PIT
The average channel sample grades for the channel samples taken at three different elevations are as
follows:
Upper (Blue) 2.5 g/t Au over 0.7 m (elevation 146.5 m)
Middle (Green) 8.1 g/t Au over 0.9 m (elevation 144.3 m)
Lower (Red) 5.2 g/t Au over 0.9 m (elevation 139.4 m)
The Kerr pit has now reached its design limits.
10.2 EXPLORATION POTENTIAL AND PRIORITISED PROJECT TARGETS IN OM1-09
As discussed above, the main focus of exploration has been on the Cavanacaw deposit.
Tables 16 and 17 below show the exploration potential and prioritised project targets from the
OM1/09 Licence area held by Galantas.
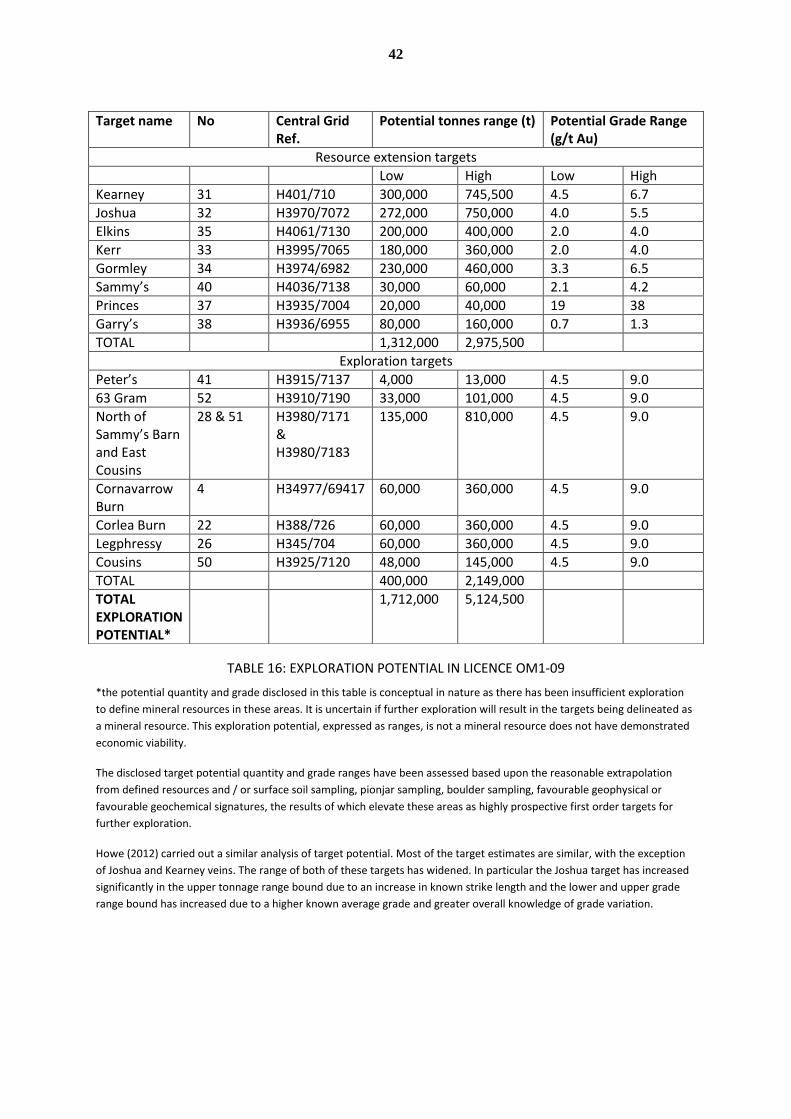
42
TABLE 16: EXPLORATION POTENTIAL IN LICENCE OM1-09
*the potential quantity and grade disclosed in this table is conceptual in nature as there has been insufficient exploration
to define mineral resources in these areas. It is uncertain if further exploration will result in the targets being delineated as
a mineral resource. This exploration potential, expressed as ranges, is not a mineral resource does not have demonstrated
economic viability.
The disclosed target potential quantity and grade ranges have been assessed based upon the reasonable extrapolation
from defined resources and / or surface soil sampling, pionjar sampling, boulder sampling, favourable geophysical or
favourable geochemical signatures, the results of which elevate these areas as highly prospective first order targets for
further exploration.
Howe (2012) carried out a similar analysis of target potential. Most of the target estimates are similar, with the exception
of Joshua and Kearney veins. The range of both of these targets has widened. In particular the Joshua target has increased
significantly in the upper tonnage range bound due to an increase in known strike length and the lower and upper grade
range bound has increased due to a higher known average grade and greater overall knowledge of grade variation.
Target name No Central Grid Ref.
Potential tonnes range (t) Potential Grade Range (g/t Au)
Resource extension targets
Low High Low High
Kearney 31 H401/710 300,000 745,500 4.5 6.7
Joshua 32 H3970/7072 272,000 750,000 4.0 5.5
Elkins 35 H4061/7130 200,000 400,000 2.0 4.0
Kerr 33 H3995/7065 180,000 360,000 2.0 4.0
Gormley 34 H3974/6982 230,000 460,000 3.3 6.5
Sammy’s 40 H4036/7138 30,000 60,000 2.1 4.2
Princes 37 H3935/7004 20,000 40,000 19 38
Garry’s 38 H3936/6955 80,000 160,000 0.7 1.3
TOTAL 1,312,000 2,975,500
Exploration targets
Peter’s 41 H3915/7137 4,000 13,000 4.5 9.0
63 Gram 52 H3910/7190 33,000 101,000 4.5 9.0
North of Sammy’s Barn and East Cousins
28 & 51 H3980/7171 & H3980/7183
135,000 810,000 4.5 9.0
Cornavarrow Burn
4 H34977/69417 60,000 360,000 4.5 9.0
Corlea Burn 22 H388/726 60,000 360,000 4.5 9.0
Legphressy 26 H345/704 60,000 360,000 4.5 9.0
Cousins 50 H3925/7120 48,000 145,000 4.5 9.0
TOTAL 400,000 2,149,000
TOTAL EXPLORATION POTENTIAL*
1,712,000 5,124,500
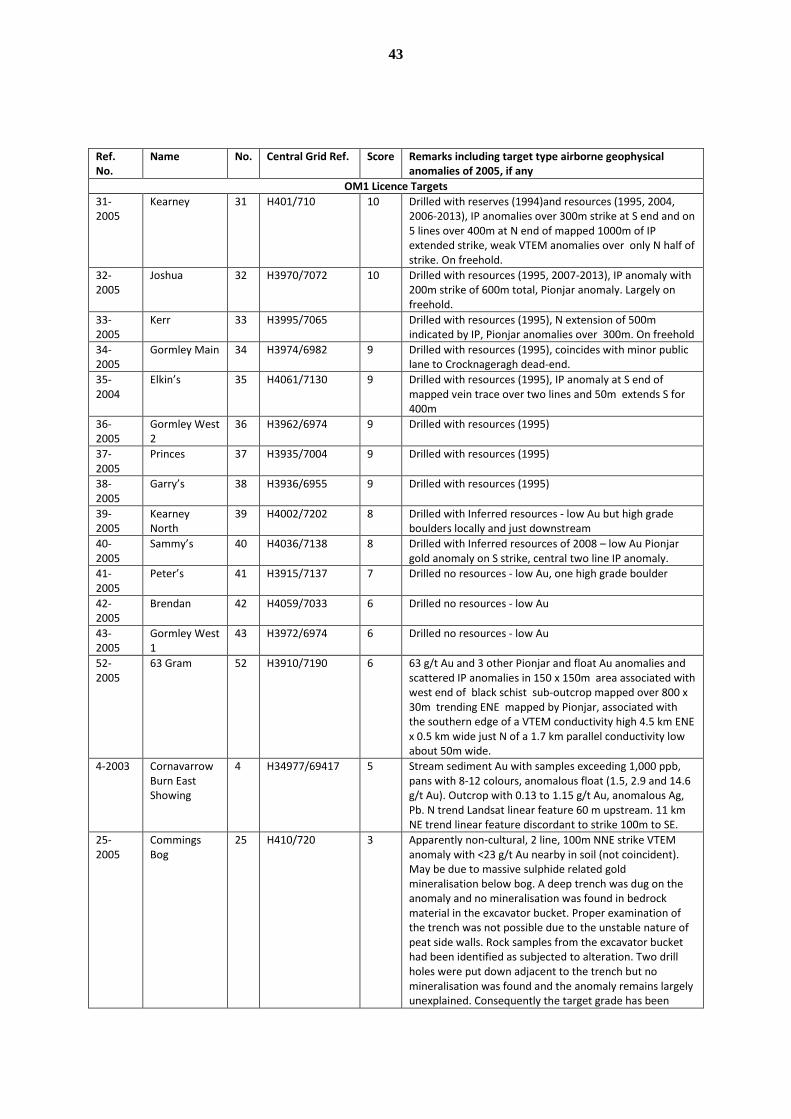
43
Ref. No.
Name No. Central Grid Ref. Score Remarks including target type airborne geophysical anomalies of 2005, if any
OM1 Licence Targets
31-2005
Kearney 31 H401/710 10 Drilled with reserves (1994)and resources (1995, 2004, 2006-2013), IP anomalies over 300m strike at S end and on 5 lines over 400m at N end of mapped 1000m of IP extended strike, weak VTEM anomalies over only N half of strike. On freehold.
32-2005
Joshua 32 H3970/7072 10 Drilled with resources (1995, 2007-2013), IP anomaly with 200m strike of 600m total, Pionjar anomaly. Largely on freehold.
33-2005
Kerr 33 H3995/7065 Drilled with resources (1995), N extension of 500m indicated by IP, Pionjar anomalies over 300m. On freehold
34-2005
Gormley Main 34 H3974/6982 9 Drilled with resources (1995), coincides with minor public lane to Crocknageragh dead-end.
35-2004
Elkin’s 35 H4061/7130 9 Drilled with resources (1995), IP anomaly at S end of mapped vein trace over two lines and 50m extends S for 400m
36-2005
Gormley West 2
36 H3962/6974 9 Drilled with resources (1995)
37-2005
Princes 37 H3935/7004 9 Drilled with resources (1995)
38-2005
Garry’s 38 H3936/6955 9 Drilled with resources (1995)
39-2005
Kearney North
39 H4002/7202 8 Drilled with Inferred resources - low Au but high grade boulders locally and just downstream
40-2005
Sammy’s 40 H4036/7138 8 Drilled with Inferred resources of 2008 – low Au Pionjar gold anomaly on S strike, central two line IP anomaly.
41-2005
Peter’s 41 H3915/7137 7 Drilled no resources - low Au, one high grade boulder
42-2005
Brendan 42 H4059/7033 6 Drilled no resources - low Au
43-2005
Gormley West 1
43 H3972/6974 6 Drilled no resources - low Au
52-2005
63 Gram 52 H3910/7190 6 63 g/t Au and 3 other Pionjar and float Au anomalies and scattered IP anomalies in 150 x 150m area associated with west end of black schist sub-outcrop mapped over 800 x 30m trending ENE mapped by Pionjar, associated with the southern edge of a VTEM conductivity high 4.5 km ENE x 0.5 km wide just N of a 1.7 km parallel conductivity low about 50m wide.
4-2003 Cornavarrow Burn East Showing
4 H34977/69417 5 Stream sediment Au with samples exceeding 1,000 ppb, pans with 8-12 colours, anomalous float (1.5, 2.9 and 14.6 g/t Au). Outcrop with 0.13 to 1.15 g/t Au, anomalous Ag, Pb. N trend Landsat linear feature 60 m upstream. 11 km NE trend linear feature discordant to strike 100m to SE.
25-2005
Commings Bog
25 H410/720 3 Apparently non-cultural, 2 line, 100m NNE strike VTEM anomaly with <23 g/t Au nearby in soil (not coincident). May be due to massive sulphide related gold mineralisation below bog. A deep trench was dug on the anomaly and no mineralisation was found in bedrock material in the excavator bucket. Proper examination of the trench was not possible due to the unstable nature of peat side walls. Rock samples from the excavator bucket had been identified as subjected to alteration. Two drill holes were put down adjacent to the trench but no mineralisation was found and the anomaly remains largely unexplained. Consequently the target grade has been

44
reduced from a 5 to a 3.
28-2005
North of Sammy’s Barn.
28 H3980/7171 5 Possible northward continuation (with 2-300m strike) of Kearney main structure on three VTEM lines to W of Kearney North structure. Possible source of gold rich boulders.
44-2005
Discovery 44 H4041/7023 5 Named vein, not drilled
45-2005
Black 45 H3998/6980 5 Named vein, not drilled
46-2005
Sharkey 46 H3959/7009 5 Named vein, not drilled. Good float boulder.
22-2003
Corlea Burn 22 H388/726 4 Target has been followed up by Riofinex. See Pionjar gold in till anomalies. May have been surveyed with IP. Source of gold anomalous float samples may be local structures related to NE trending Landsat linear features but could also be dispersion from the Kearney-Joshua etc float gold cluster. Weak but potentially significant VTEM anomalies on 2 lines in area 200 x 100 elongated WNW? 3 lines of fuzzy response similar to North of Sammy’s Barn, max 1km along flight line.
26-2005
Legphressy 26 H345/704 4 3 line VTEM with N trend Landsat linear break linkage to gold anomalies of 19-2003 – Unshinagh
49-2005
North Sharkey 49 H3925/7040 4 Pionjar Au anomaly and IP anomalies on six lines in area 200 x200m.
51-2005
East Cousins 51 H3980/7183 4 Four Pionjar Au anomalies and scattered IP anomalies on 7 lines in area 150m NE x 100m SE
1-2003 Aghadulla West Burn
1 H363/685 3 Stream sediment Au associated with N trending shears related to 4 mineral showings and to structures related to Landsat linear features.
2-2003 Aghadulla East Burn
2 H368/688 3 Stream sediment gold is probably locally derived from northerly trending shear structures related to the local, northerly trending Landsat linear features. Area of weak, subtle VTEM electromagnetic anomalies in the uppermost reaches of the Aghadulla East Burn.
3-2003 Aghadulla Main Burn below confluence
3 H3612/6805 3 Stream sediment gold is probably locally derived from northerly trending shear structures related to the local, northerly trending Landsat linear features.
11-2003
Upper Corradinna Bridge
11 H3755/7039 3 Followed up by Riofinex Pionjar sampling and possibly an IP survey. Gold may be derived from structures associated with local Landsat linear breaks. Prospecting results in stream bed were disappointing but bedrock source of local Pionjar gold anomaly may lie to NW covered by peat
12-2003
Upper Creevan Burn, western tributary
12 H3782/6991 3 Stream sediment and Pionjar Au may be derived from structures associated with four local Landsat linear features.
14-2003
Greenan Burn Upper
14 H310/690 3 Stream sediment gold near mineralised Aghaleague Fault structure with graphitic and calcite – dolomite veins containing fuchsite in western tributary, and three NNE Landsat linear breaks provide focus for float and outcrop prospecting. Access on land between the two burns may be problematical due to forestry established since 1981 fires.
15-2003
Viv Burn and Croneen Barr hill
15 H2862/6529 3 Gold colours, stream sediment Au, one sample >1,000 ppb, anomalous As and Pb. Landsat and airphoto linears.
19-2003
Unshinugh 19 H347/717 3 2003 target enhances 2005 VTEM anomaly Legphressy: Target 26-2005, as possible source of geochem anomaly
20-2003
Dressoge, upper Kilmore Burn
20 H371/725 3 Gold in stream sediments possibly derived from structures associated with Landsat linear feature, probably exposed in stream section immediately upstream of stream
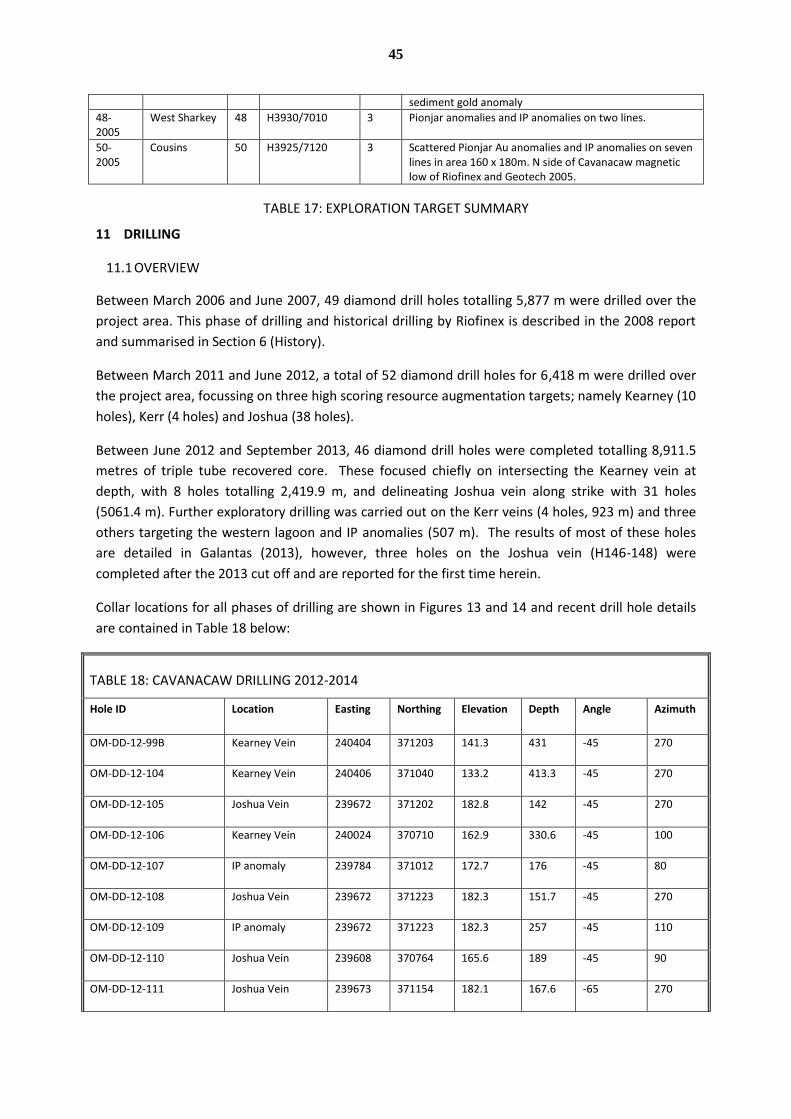
45
sediment gold anomaly
48-2005
West Sharkey 48 H3930/7010 3 Pionjar anomalies and IP anomalies on two lines.
50-2005
Cousins 50 H3925/7120 3 Scattered Pionjar Au anomalies and IP anomalies on seven lines in area 160 x 180m. N side of Cavanacaw magnetic low of Riofinex and Geotech 2005.
TABLE 17: EXPLORATION TARGET SUMMARY
11 DRILLING
11.1 OVERVIEW
Between March 2006 and June 2007, 49 diamond drill holes totalling 5,877 m were drilled over the
project area. This phase of drilling and historical drilling by Riofinex is described in the 2008 report
and summarised in Section 6 (History).
Between March 2011 and June 2012, a total of 52 diamond drill holes for 6,418 m were drilled over
the project area, focussing on three high scoring resource augmentation targets; namely Kearney (10
holes), Kerr (4 holes) and Joshua (38 holes).
Between June 2012 and September 2013, 46 diamond drill holes were completed totalling 8,911.5
metres of triple tube recovered core. These focused chiefly on intersecting the Kearney vein at
depth, with 8 holes totalling 2,419.9 m, and delineating Joshua vein along strike with 31 holes
(5061.4 m). Further exploratory drilling was carried out on the Kerr veins (4 holes, 923 m) and three
others targeting the western lagoon and IP anomalies (507 m). The results of most of these holes
are detailed in Galantas (2013), however, three holes on the Joshua vein (H146-148) were
completed after the 2013 cut off and are reported for the first time herein.
Collar locations for all phases of drilling are shown in Figures 13 and 14 and recent drill hole details
are contained in Table 18 below:
TABLE 18: CAVANACAW DRILLING 2012-2014
Hole ID Location Easting Northing Elevation Depth Angle Azimuth
OM-DD-12-99B Kearney Vein 240404 371203 141.3 431 -45 270
OM-DD-12-104 Kearney Vein 240406 371040 133.2 413.3 -45 270
OM-DD-12-105 Joshua Vein 239672 371202 182.8 142 -45 270
OM-DD-12-106 Kearney Vein 240024 370710 162.9 330.6 -45 100
OM-DD-12-107 IP anomaly 239784 371012 172.7 176 -45 80
OM-DD-12-108 Joshua Vein 239672 371223 182.3 151.7 -45 270
OM-DD-12-109 IP anomaly 239672 371223 182.3 257 -45 110
OM-DD-12-110 Joshua Vein 239608 370764 165.6 189 -45 90
OM-DD-12-111 Joshua Vein 239673 371154 182.1 167.6 -65 270
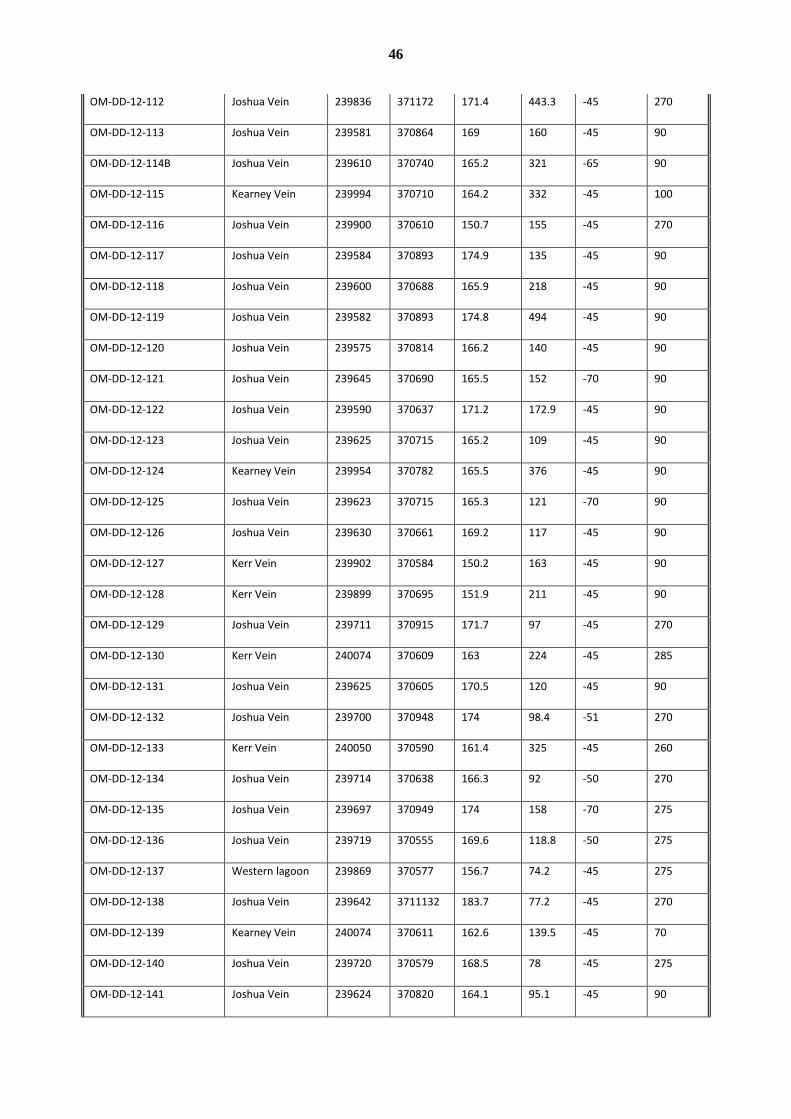
46
OM-DD-12-112 Joshua Vein 239836 371172 171.4 443.3 -45 270
OM-DD-12-113 Joshua Vein 239581 370864 169 160 -45 90
OM-DD-12-114B Joshua Vein 239610 370740 165.2 321 -65 90
OM-DD-12-115 Kearney Vein 239994 370710 164.2 332 -45 100
OM-DD-12-116 Joshua Vein 239900 370610 150.7 155 -45 270
OM-DD-12-117 Joshua Vein 239584 370893 174.9 135 -45 90
OM-DD-12-118 Joshua Vein 239600 370688 165.9 218 -45 90
OM-DD-12-119 Joshua Vein 239582 370893 174.8 494 -45 90
OM-DD-12-120 Joshua Vein 239575 370814 166.2 140 -45 90
OM-DD-12-121 Joshua Vein 239645 370690 165.5 152 -70 90
OM-DD-12-122 Joshua Vein 239590 370637 171.2 172.9 -45 90
OM-DD-12-123 Joshua Vein 239625 370715 165.2 109 -45 90
OM-DD-12-124 Kearney Vein 239954 370782 165.5 376 -45 90
OM-DD-12-125 Joshua Vein 239623 370715 165.3 121 -70 90
OM-DD-12-126 Joshua Vein 239630 370661 169.2 117 -45 90
OM-DD-12-127 Kerr Vein 239902 370584 150.2 163 -45 90
OM-DD-12-128 Kerr Vein 239899 370695 151.9 211 -45 90
OM-DD-12-129 Joshua Vein 239711 370915 171.7 97 -45 270
OM-DD-12-130 Kerr Vein 240074 370609 163 224 -45 285
OM-DD-12-131 Joshua Vein 239625 370605 170.5 120 -45 90
OM-DD-12-132 Joshua Vein 239700 370948 174 98.4 -51 270
OM-DD-12-133 Kerr Vein 240050 370590 161.4 325 -45 260
OM-DD-12-134 Joshua Vein 239714 370638 166.3 92 -50 270
OM-DD-12-135 Joshua Vein 239697 370949 174 158 -70 275
OM-DD-12-136 Joshua Vein 239719 370555 169.6 118.8 -50 275
OM-DD-12-137 Western lagoon 239869 370577 156.7 74.2 -45 275
OM-DD-12-138 Joshua Vein 239642 3711132 183.7 77.2 -45 270
OM-DD-12-139 Kearney Vein 240074 370611 162.6 139.5 -45 70
OM-DD-12-140 Joshua Vein 239720 370579 168.5 78 -45 275
OM-DD-12-141 Joshua Vein 239624 370820 164.1 95.1 -45 90
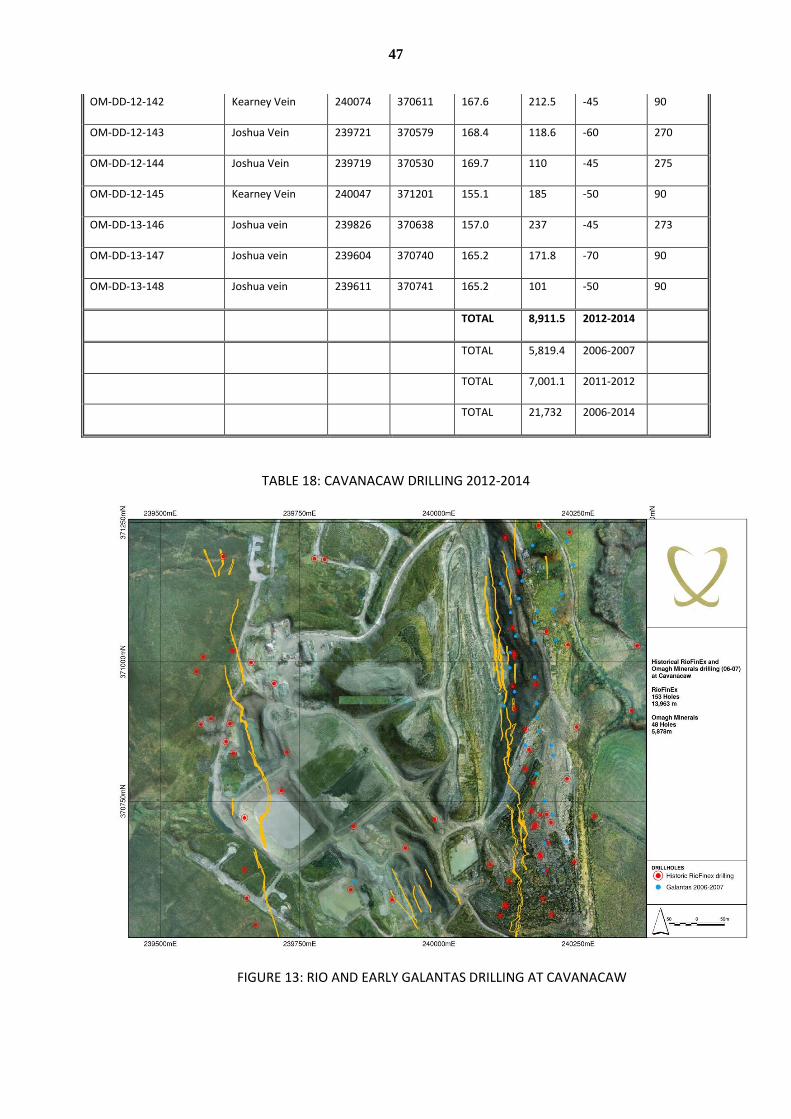
47
OM-DD-12-142 Kearney Vein 240074 370611 167.6 212.5 -45 90
OM-DD-12-143 Joshua Vein 239721 370579 168.4 118.6 -60 270
OM-DD-12-144 Joshua Vein 239719 370530 169.7 110 -45 275
OM-DD-12-145 Kearney Vein 240047 371201 155.1 185 -50 90
OM-DD-13-146 Joshua vein 239826 370638 157.0 237 -45 273
OM-DD-13-147 Joshua vein 239604 370740 165.2 171.8 -70 90
OM-DD-13-148 Joshua vein 239611 370741 165.2 101 -50 90
TOTAL 8,911.5 2012-2014
TOTAL 5,819.4 2006-2007
TOTAL 7,001.1 2011-2012
TOTAL 21,732 2006-2014
TABLE 18: CAVANACAW DRILLING 2012-2014
FIGURE 13: RIO AND EARLY GALANTAS DRILLING AT CAVANACAW
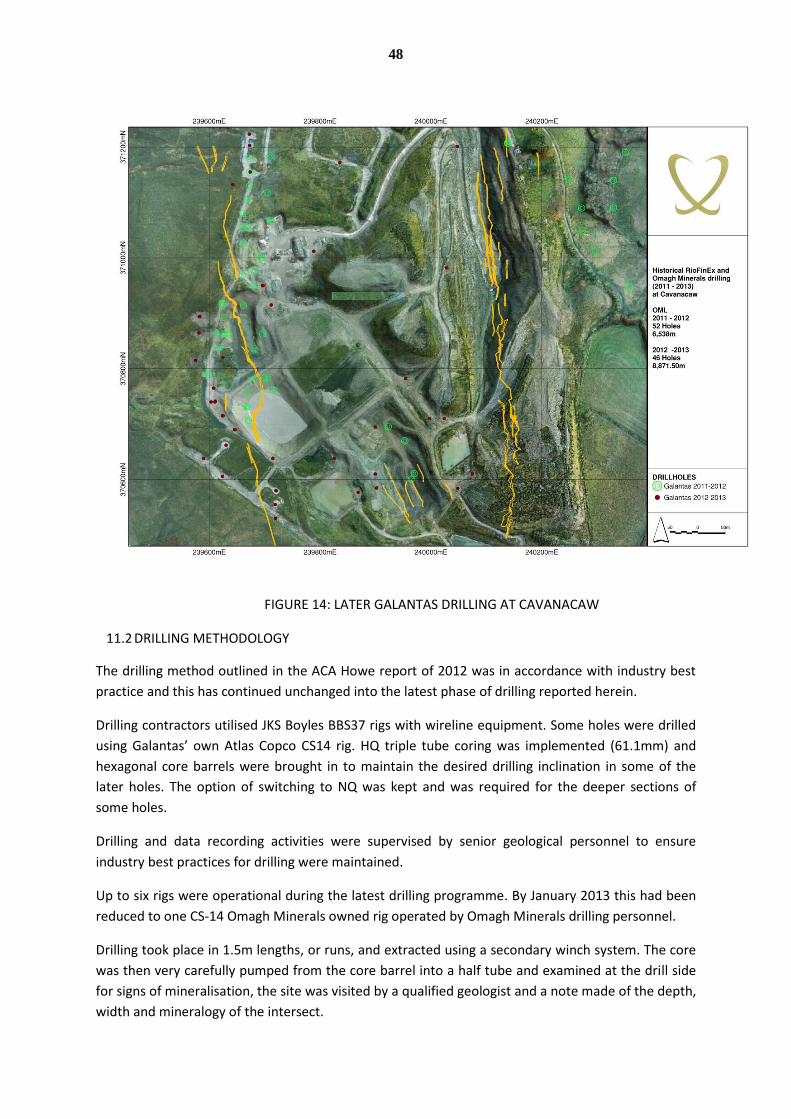
48
FIGURE 14: LATER GALANTAS DRILLING AT CAVANACAW
11.2 DRILLING METHODOLOGY
The drilling method outlined in the ACA Howe report of 2012 was in accordance with industry best
practice and this has continued unchanged into the latest phase of drilling reported herein.
Drilling contractors utilised JKS Boyles BBS37 rigs with wireline equipment. Some holes were drilled
using Galantas’ own Atlas Copco CS14 rig. HQ triple tube coring was implemented (61.1mm) and
hexagonal core barrels were brought in to maintain the desired drilling inclination in some of the
later holes. The option of switching to NQ was kept and was required for the deeper sections of
some holes.
Drilling and data recording activities were supervised by senior geological personnel to ensure
industry best practices for drilling were maintained.
Up to six rigs were operational during the latest drilling programme. By January 2013 this had been
reduced to one CS-14 Omagh Minerals owned rig operated by Omagh Minerals drilling personnel.
Drilling took place in 1.5m lengths, or runs, and extracted using a secondary winch system. The core
was then very carefully pumped from the core barrel into a half tube and examined at the drill side
for signs of mineralisation, the site was visited by a qualified geologist and a note made of the depth,
width and mineralogy of the intersect.
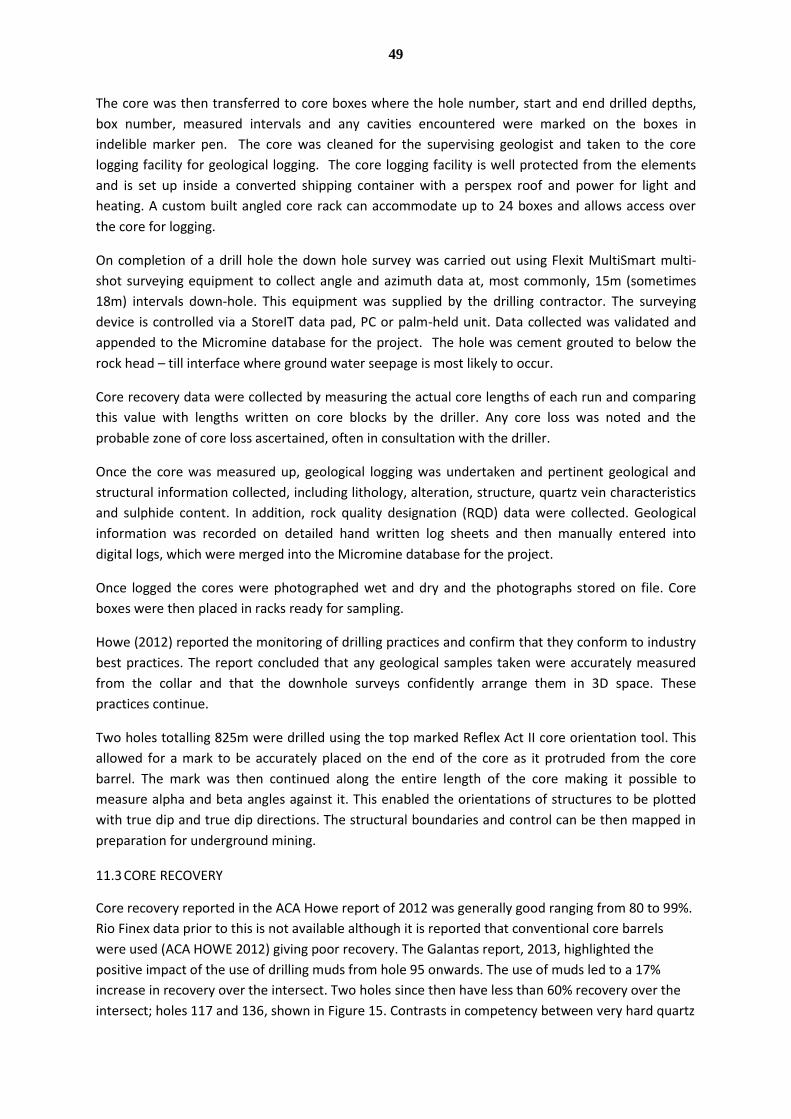
49
The core was then transferred to core boxes where the hole number, start and end drilled depths,
box number, measured intervals and any cavities encountered were marked on the boxes in
indelible marker pen. The core was cleaned for the supervising geologist and taken to the core
logging facility for geological logging. The core logging facility is well protected from the elements
and is set up inside a converted shipping container with a perspex roof and power for light and
heating. A custom built angled core rack can accommodate up to 24 boxes and allows access over
the core for logging.
On completion of a drill hole the down hole survey was carried out using Flexit MultiSmart multi-
shot surveying equipment to collect angle and azimuth data at, most commonly, 15m (sometimes
18m) intervals down-hole. This equipment was supplied by the drilling contractor. The surveying
device is controlled via a StoreIT data pad, PC or palm-held unit. Data collected was validated and
appended to the Micromine database for the project. The hole was cement grouted to below the
rock head – till interface where ground water seepage is most likely to occur.
Core recovery data were collected by measuring the actual core lengths of each run and comparing
this value with lengths written on core blocks by the driller. Any core loss was noted and the
probable zone of core loss ascertained, often in consultation with the driller.
Once the core was measured up, geological logging was undertaken and pertinent geological and
structural information collected, including lithology, alteration, structure, quartz vein characteristics
and sulphide content. In addition, rock quality designation (RQD) data were collected. Geological
information was recorded on detailed hand written log sheets and then manually entered into
digital logs, which were merged into the Micromine database for the project.
Once logged the cores were photographed wet and dry and the photographs stored on file. Core
boxes were then placed in racks ready for sampling.
Howe (2012) reported the monitoring of drilling practices and confirm that they conform to industry
best practices. The report concluded that any geological samples taken were accurately measured
from the collar and that the downhole surveys confidently arrange them in 3D space. These
practices continue.
Two holes totalling 825m were drilled using the top marked Reflex Act II core orientation tool. This
allowed for a mark to be accurately placed on the end of the core as it protruded from the core
barrel. The mark was then continued along the entire length of the core making it possible to
measure alpha and beta angles against it. This enabled the orientations of structures to be plotted
with true dip and true dip directions. The structural boundaries and control can be then mapped in
preparation for underground mining.
11.3 CORE RECOVERY
Core recovery reported in the ACA Howe report of 2012 was generally good ranging from 80 to 99%.
Rio Finex data prior to this is not available although it is reported that conventional core barrels
were used (ACA HOWE 2012) giving poor recovery. The Galantas report, 2013, highlighted the
positive impact of the use of drilling muds from hole 95 onwards. The use of muds led to a 17%
increase in recovery over the intersect. Two holes since then have less than 60% recovery over the
intersect; holes 117 and 136, shown in Figure 15. Contrasts in competency between very hard quartz
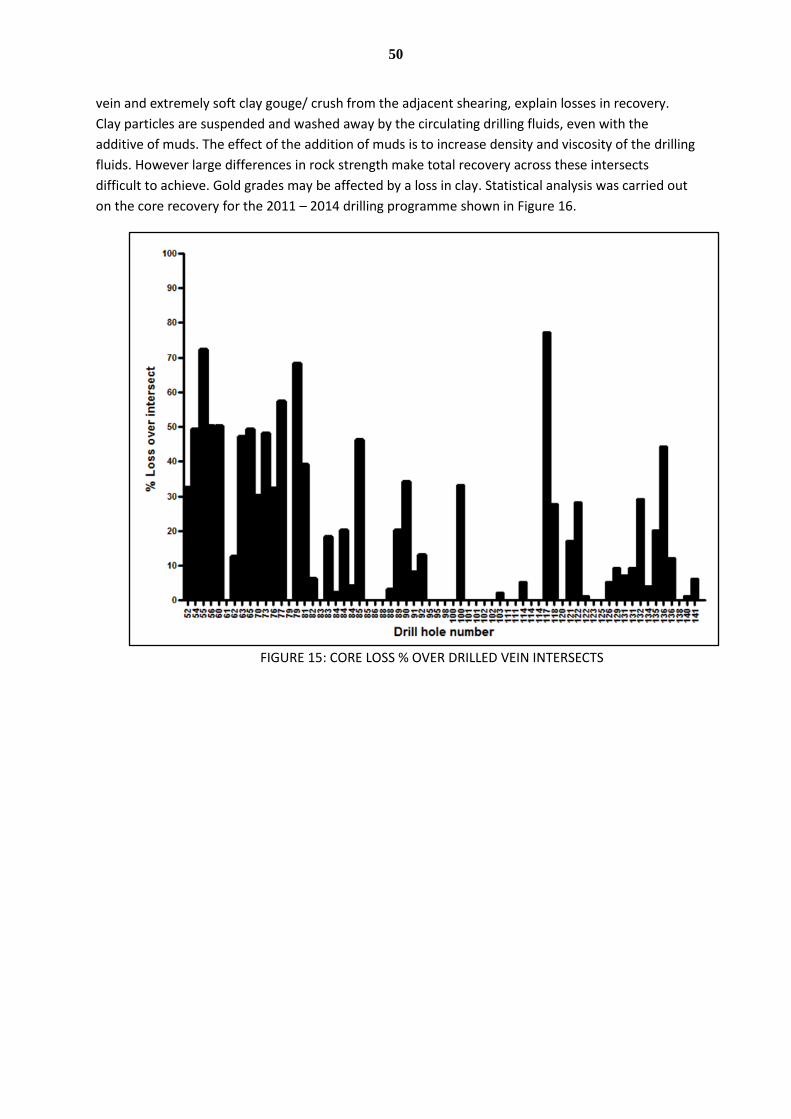
50
vein and extremely soft clay gouge/ crush from the adjacent shearing, explain losses in recovery.
Clay particles are suspended and washed away by the circulating drilling fluids, even with the
additive of muds. The effect of the addition of muds is to increase density and viscosity of the drilling
fluids. However large differences in rock strength make total recovery across these intersects
difficult to achieve. Gold grades may be affected by a loss in clay. Statistical analysis was carried out
on the core recovery for the 2011 – 2014 drilling programme shown in Figure 16.
FIGURE 15: CORE LOSS % OVER DRILLED VEIN INTERSECTS
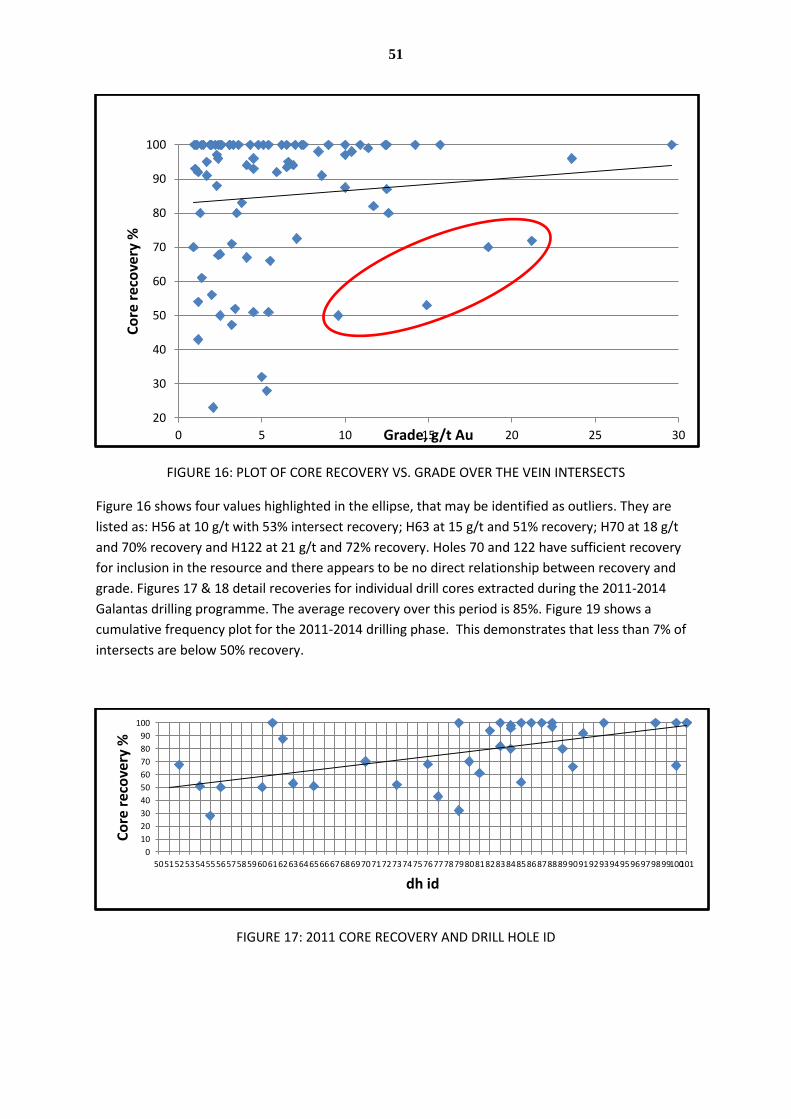
51
FIGURE 16: PLOT OF CORE RECOVERY VS. GRADE OVER THE VEIN INTERSECTS
Figure 16 shows four values highlighted in the ellipse, that may be identified as outliers. They are
listed as: H56 at 10 g/t with 53% intersect recovery; H63 at 15 g/t and 51% recovery; H70 at 18 g/t
and 70% recovery and H122 at 21 g/t and 72% recovery. Holes 70 and 122 have sufficient recovery
for inclusion in the resource and there appears to be no direct relationship between recovery and
grade. Figures 17 & 18 detail recoveries for individual drill cores extracted during the 2011-2014
Galantas drilling programme. The average recovery over this period is 85%. Figure 19 shows a
cumulative frequency plot for the 2011-2014 drilling phase. This demonstrates that less than 7% of
intersects are below 50% recovery.
FIGURE 17: 2011 CORE RECOVERY AND DRILL HOLE ID
20
30
40
50
60
70
80
90
100
0 5 10 15 20 25 30
Co
re r
eco
very
%
Grade, g/t Au
0
10
20
30
40
50
60
70
80
90
100
5051525354555657585960616263646566676869707172737475767778798081828384858687888990919293949596979899100101
Co
re r
eco
very
%
dh id

52
FIGURE 18: 2012-2014 CORE RECOVERY AND DRILL HOLE ID
FIGURE 19: DRILL CORE RECOVERY CUMULATIVE FREQUENCY PLOT
In conclusion, from 2011 to 2014, 51% of cores are shown to have intersect recovery of 95% or over;
correlation between recovery and grade is very low showing that recovery is independent of grade.
Therefore, Galantas deems the core results as adequate to include in resource estimation.
0
10
20
30
40
50
60
70
80
90
100
20 25 30 35 40 45 50 55 60 65 70 75 80 85 90 95 100
Cu
m f
req
%
Rec pct (%)
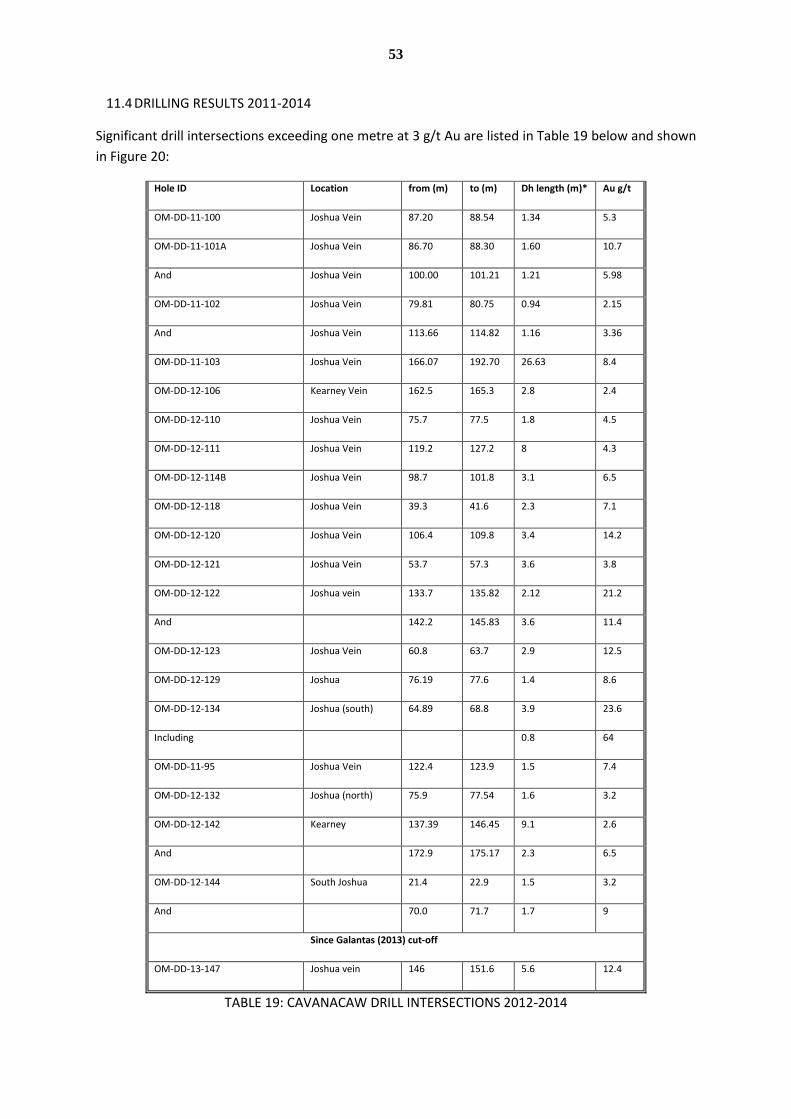
53
11.4 DRILLING RESULTS 2011-2014
Significant drill intersections exceeding one metre at 3 g/t Au are listed in Table 19 below and shown
in Figure 20:
Hole ID Location from (m) to (m) Dh length (m)* Au g/t
OM-DD-11-100 Joshua Vein 87.20 88.54 1.34 5.3
OM-DD-11-101A Joshua Vein 86.70 88.30 1.60 10.7
And Joshua Vein 100.00 101.21 1.21 5.98
OM-DD-11-102 Joshua Vein 79.81 80.75 0.94 2.15
And Joshua Vein 113.66 114.82 1.16 3.36
OM-DD-11-103 Joshua Vein 166.07 192.70 26.63 8.4
OM-DD-12-106 Kearney Vein 162.5 165.3 2.8 2.4
OM-DD-12-110 Joshua Vein 75.7 77.5 1.8 4.5
OM-DD-12-111 Joshua Vein 119.2 127.2 8 4.3
OM-DD-12-114B Joshua Vein 98.7 101.8 3.1 6.5
OM-DD-12-118 Joshua Vein 39.3 41.6 2.3 7.1
OM-DD-12-120 Joshua Vein 106.4 109.8 3.4 14.2
OM-DD-12-121 Joshua Vein 53.7 57.3 3.6 3.8
OM-DD-12-122 Joshua vein 133.7 135.82 2.12 21.2
And 142.2 145.83 3.6 11.4
OM-DD-12-123 Joshua Vein 60.8 63.7 2.9 12.5
OM-DD-12-129 Joshua 76.19 77.6 1.4 8.6
OM-DD-12-134 Joshua (south) 64.89 68.8 3.9 23.6
Including 0.8 64
OM-DD-11-95 Joshua Vein 122.4 123.9 1.5 7.4
OM-DD-12-132 Joshua (north) 75.9 77.54 1.6 3.2
OM-DD-12-142 Kearney 137.39 146.45 9.1 2.6
And 172.9 175.17 2.3 6.5
OM-DD-12-144 South Joshua 21.4 22.9 1.5 3.2
And 70.0 71.7 1.7 9
Since Galantas (2013) cut-off
OM-DD-13-147 Joshua vein 146 151.6 5.6 12.4
TABLE 19: CAVANACAW DRILL INTERSECTIONS 2012-2014
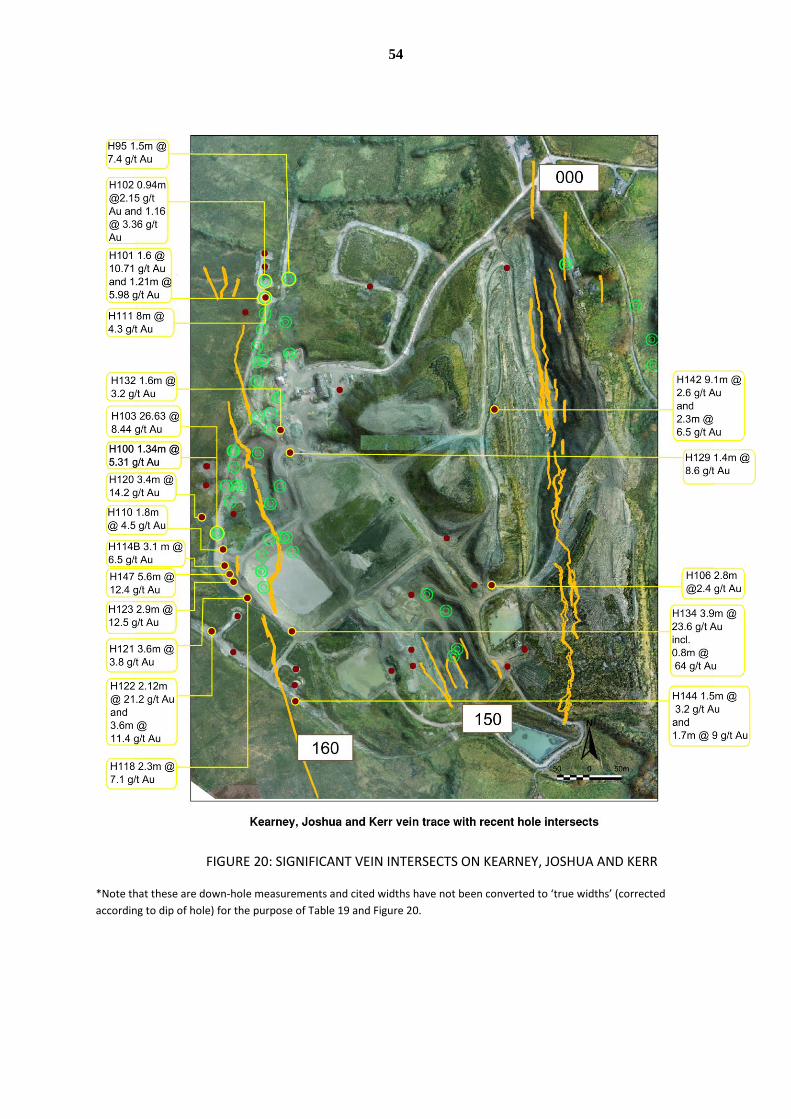
54
FIGURE 20: SIGNIFICANT VEIN INTERSECTS ON KEARNEY, JOSHUA AND KERR
*Note that these are down-hole measurements and cited widths have not been converted to ‘true widths’ (corrected
according to dip of hole) for the purpose of Table 19 and Figure 20.
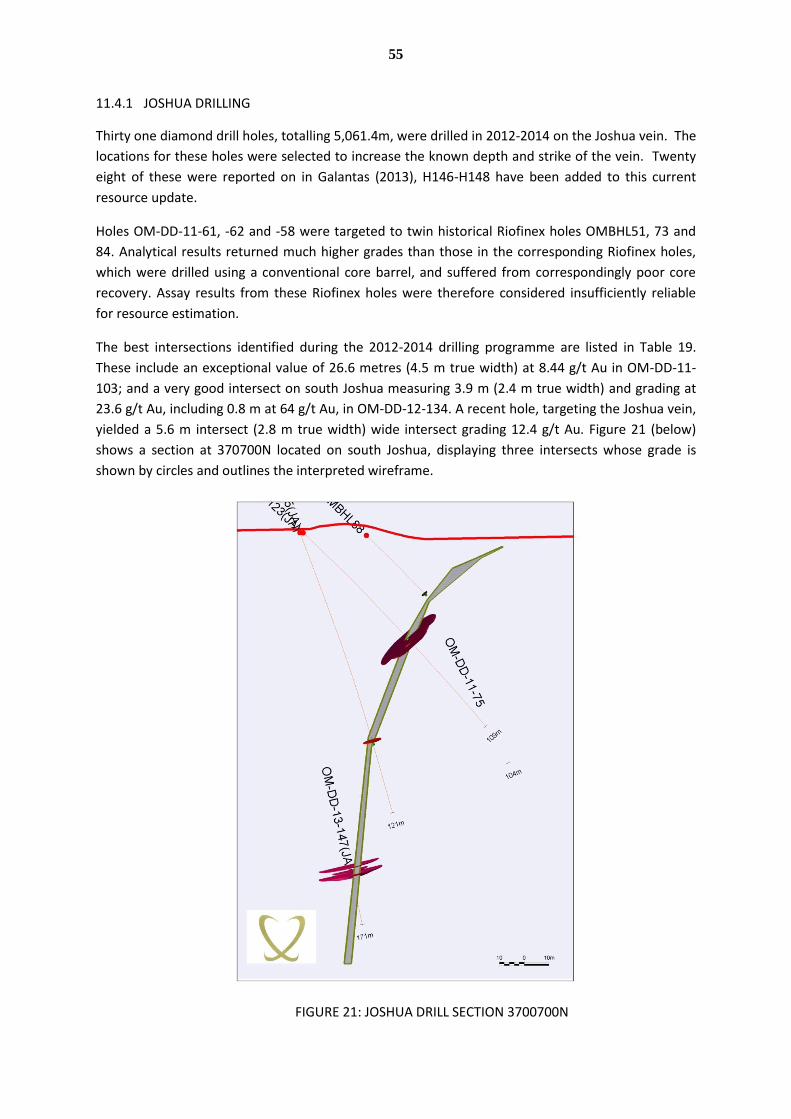
55
11.4.1 JOSHUA DRILLING
Thirty one diamond drill holes, totalling 5,061.4m, were drilled in 2012-2014 on the Joshua vein. The
locations for these holes were selected to increase the known depth and strike of the vein. Twenty
eight of these were reported on in Galantas (2013), H146-H148 have been added to this current
resource update.
Holes OM-DD-11-61, -62 and -58 were targeted to twin historical Riofinex holes OMBHL51, 73 and
84. Analytical results returned much higher grades than those in the corresponding Riofinex holes,
which were drilled using a conventional core barrel, and suffered from correspondingly poor core
recovery. Assay results from these Riofinex holes were therefore considered insufficiently reliable
for resource estimation.
The best intersections identified during the 2012-2014 drilling programme are listed in Table 19.
These include an exceptional value of 26.6 metres (4.5 m true width) at 8.44 g/t Au in OM-DD-11-
103; and a very good intersect on south Joshua measuring 3.9 m (2.4 m true width) and grading at
23.6 g/t Au, including 0.8 m at 64 g/t Au, in OM-DD-12-134. A recent hole, targeting the Joshua vein,
yielded a 5.6 m intersect (2.8 m true width) wide intersect grading 12.4 g/t Au. Figure 21 (below)
shows a section at 370700N located on south Joshua, displaying three intersects whose grade is
shown by circles and outlines the interpreted wireframe.
FIGURE 21: JOSHUA DRILL SECTION 3700700N
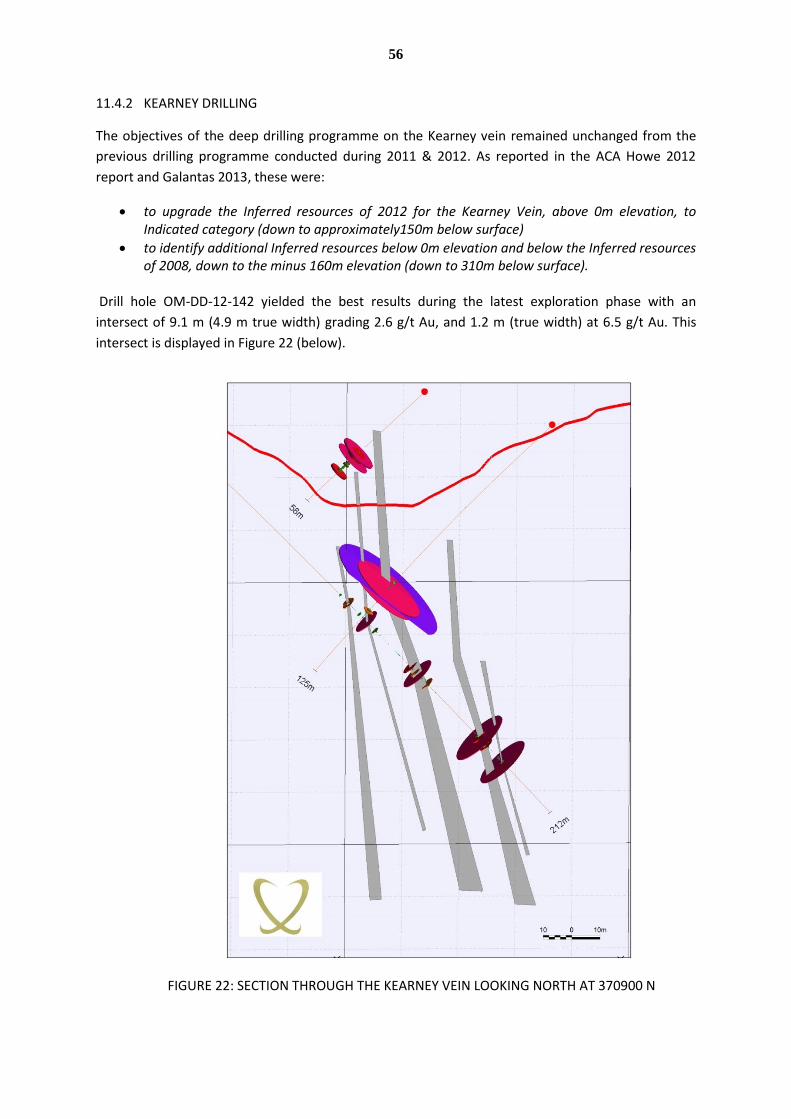
56
11.4.2 KEARNEY DRILLING
The objectives of the deep drilling programme on the Kearney vein remained unchanged from the
previous drilling programme conducted during 2011 & 2012. As reported in the ACA Howe 2012
report and Galantas 2013, these were:
to upgrade the Inferred resources of 2012 for the Kearney Vein, above 0m elevation, to Indicated category (down to approximately150m below surface)
to identify additional Inferred resources below 0m elevation and below the Inferred resources of 2008, down to the minus 160m elevation (down to 310m below surface).
Drill hole OM-DD-12-142 yielded the best results during the latest exploration phase with an
intersect of 9.1 m (4.9 m true width) grading 2.6 g/t Au, and 1.2 m (true width) at 6.5 g/t Au. This
intersect is displayed in Figure 22 (below).
FIGURE 22: SECTION THROUGH THE KEARNEY VEIN LOOKING NORTH AT 370900 N
57
11.4.3 KERR DRILLING
Four holes were drilled on Kerr totalling 923 metres (Galantas, 2013). The aim of these holes was to
improve understanding of the multi vein fan structure and to develop a potential resource.
The best of these intersected on drill hole OM-DD-12-127 at 4.6 g/t Au over 0.7 metres (true width).
12 SAMPLE PREPARATION, ANALYSES AND SECURITY
Geological due diligence requires that the quality of the assay data is controlled and analysed. In the
mining industry this is known as quality assurance and quality control (QA/QC) and involves the
minimizing of sampling error and the systematic monitoring of the samples accuracy and precision
(i.e. repeatability). The more uneven the mix of metals (heterogeneity) in the sampled material, the
more difficult it is to obtain a representative sample from which infer the nature and characteristics
of the whole geological object.
The following was reported in the 2012 report by ACA Howe and is a fair and accurate description of
the sampling procedure.
Exploration channel sampling activities were undertaken at the same time as drilling activities. All
sampling and sample preparation was undertaken by Galantas personnel, with the exception of the
Kearney pit channel sampling which was undertaken in 2006 by ACA Howe. Channel samples were
collected and sealed in plastic bags along with a sample ticket displaying the sample number. The
sample number for each sample was also written on the bag and entered in to the sample submission
sheet. Channel samples weighing 0.5-2.0kg were collected at 10cm intervals from logged intervals of
5cm or 10cm wide sawn channels and sealed in plastic bags along with a sample ticket. Each sample
number was then added to the sample submission sheet.
Channel samples were laid out in sequence order at the core shed and checked prior to being added
to sample batches of drill core and sent to the laboratory for analysis together with batches of drill
core. Channel locations were surveyed by site personnel during sampling and survey data were
merged with the Micromine exploration database.
Drill core from the 2006-2007 and 2011-2012 programmes were selectively sampled with sample
intervals based on mineralisation and lithology. Samples of wallrock were taken one metre either
side of the vein to allow for appropriate dilution to achieve minimum mining width.
Once samples were chosen, sample intervals were written on the core prior to core cutting. The core
was then orientated along the core axis and sawn in half with a circular diamond bench saw before
both halves of core were replaced in the box in the original orientation. When cutting was complete,
each interval was sampled with attention given to ensuring that an exact half of core was sampled
for each interval and that no contamination had occurred.
Core samples were then placed in clear, sturdy sample bags and a sample number ticket inserted.
The sample number was also marked directly on to the bag and a second ticket sealed within the bag
opening to ensure correct identification at the laboratory. Once bagged, all samples were laid out on
the floor in numerical order, checked, and bagged up in larger bags ready for dispatch. Core was

58
dispatched via courier or by Galantas personnel to OMAC laboratories, Galway, Republic of Ireland
along with two inventories of submitted samples.
Analysis of all samples generated from channels and drill core were undertaken by OMAC
Laboratories (OMAC) of Loughrea, Co Galway, Ireland. OMAC joined the Alex Stewart group in 1999
and operated as its principal exploration laboratory until 2011 when Alex Stewart was taken over by
ALS Minerals. OMAC is accredited to ISO 17025 by the Irish Accreditation Board (INAB). This standard
relates to competency requirements for testing and calibration laboratories. INAB is a member of the
International Accreditation Corporation (ILAC) and a signatory to the ILAC Mutual Recognition
Arrangement whose signatories include Canada, Australia, South Africa and many countries within
the EU.
OMAC participates in proficiency testing programmes and round robin programmes run in the
mineral analysis sector twice a year, run by Geostats of Perth, Western Australia and CANMET,
Canada. Geostats run a twice yearly round robin and in excess of 100 laboratories participate and
their performance is circulated to sponsoring mining houses. The Proficiency Testing Programme for
Mineral Analysis Laboratories (PTP-MAL) has been set up under the Canadian Certified Reference
Materials Project (CCRMP) run by CANMET and OMAC has been involved with this programme since
its inception and has received a maximum rating each year.
Samples are analysed for gold via Fire Assay and for a suite of 19 base metals (including lead,
arsenic, copper and zinc) via ICP . Sample preparation for both analyses comprises drying of samples,
jaw crushing to <2mm, riffle splitting of a 1kg sub-sample followed by homogenisation and
pulverisation to 100μ according to ALS procedure codes P1 and P5. This sample preparation method
is recommended by OMAC for gold bearing samples. All fractions during the sample preparation
stage are retained for reference or QA/QC activities.
The new analytical facility at ALS (formerly OMAC) laboratory in Loughrea, County Galway was
visited by Galantas personnel involved in the reporting of this document. At the laboratory, each
stage of sample progression was examined and discussed with senior ALS personnel.
Each sample is barcoded upon entering the lab and tracked with the code as it is passed through the
system to provide traceability. The preparation methods and protocols are based upon Gy’s
sampling theory. This is to reduce fundamental error of a representative sample. Homogeneity is
achieved according to the interest of the sample.
Gold fire assay uses a 30g crushed, split and pulverized sub sample fused with a lead oxide/
carbonate/ borax/ silica/ flux at 1,100 °C using silver as a carrier. Fusion producing lead buttons less
than 30 grams are rejected. Once de-slagging is achieved the buttons are cupellated at 950°C. Prills
are parted and then dissolved in Aqua Regia. The reading is done by flame atomic absorption down
to 0.01 ppm with a Varian Spectre AA 55 instrument. This procedure follows the ALS code Au-AA25.
Analysis of base metals following ALS procedure ME-ICPORE is now termed ICP-AES. A minimum
sample weight of 5 g is subjected to acid digestion, a highly oxidising reaction with HNO3, KCLO4 and
HBr with the final solution in dilute aqua regia and tested for 19 elements by ICP-AES. Elements
tested are: Ag (to 5ppm), As, Bi, Ca, Cd, Co, Cu, Fe, Hg, Mg, Mn, Mo, Ni, p, Pb, S, Sb, Ti and Zn.

59
Based upon the inspection by OML personnel the author is satisfied that the procedures in sample
preparation, fire assay, acid digestion, the machines used in final geochemical analysis and analytical
procedures, conform to industry best practices and so are suitable for reporting under NI 43-101.
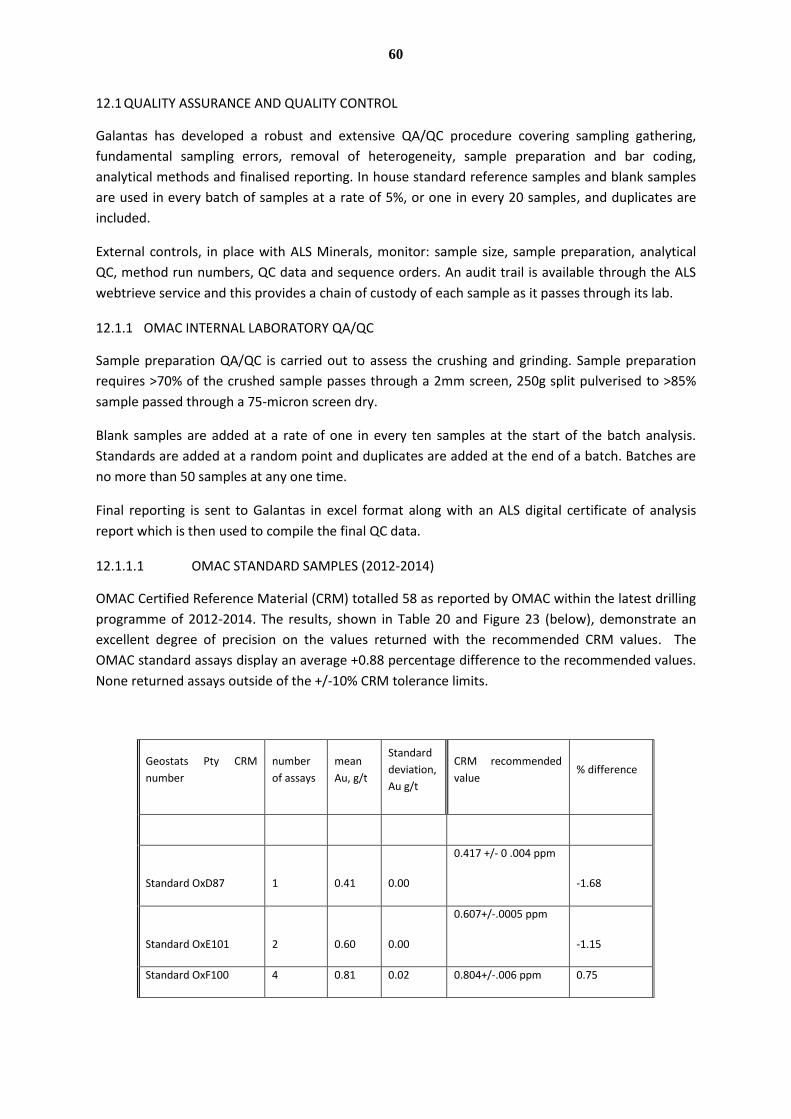
60
12.1 QUALITY ASSURANCE AND QUALITY CONTROL
Galantas has developed a robust and extensive QA/QC procedure covering sampling gathering,
fundamental sampling errors, removal of heterogeneity, sample preparation and bar coding,
analytical methods and finalised reporting. In house standard reference samples and blank samples
are used in every batch of samples at a rate of 5%, or one in every 20 samples, and duplicates are
included.
External controls, in place with ALS Minerals, monitor: sample size, sample preparation, analytical
QC, method run numbers, QC data and sequence orders. An audit trail is available through the ALS
webtrieve service and this provides a chain of custody of each sample as it passes through its lab.
12.1.1 OMAC INTERNAL LABORATORY QA/QC
Sample preparation QA/QC is carried out to assess the crushing and grinding. Sample preparation
requires >70% of the crushed sample passes through a 2mm screen, 250g split pulverised to >85%
sample passed through a 75-micron screen dry.
Blank samples are added at a rate of one in every ten samples at the start of the batch analysis.
Standards are added at a random point and duplicates are added at the end of a batch. Batches are
no more than 50 samples at any one time.
Final reporting is sent to Galantas in excel format along with an ALS digital certificate of analysis
report which is then used to compile the final QC data.
12.1.1.1 OMAC STANDARD SAMPLES (2012-2014)
OMAC Certified Reference Material (CRM) totalled 58 as reported by OMAC within the latest drilling
programme of 2012-2014. The results, shown in Table 20 and Figure 23 (below), demonstrate an
excellent degree of precision on the values returned with the recommended CRM values. The
OMAC standard assays display an average +0.88 percentage difference to the recommended values.
None returned assays outside of the +/-10% CRM tolerance limits.
Geostats Pty CRM
number
number
of assays
mean
Au, g/t
Standard
deviation,
Au g/t
CRM recommended
value % difference
Standard OxD87 1 0.41 0.00
0.417 +/- 0 .004 ppm
-1.68
Standard OxE101 2 0.60 0.00
0.607+/-.0005 ppm
-1.15
Standard OxF100 4 0.81 0.02 0.804+/-.006 ppm 0.75
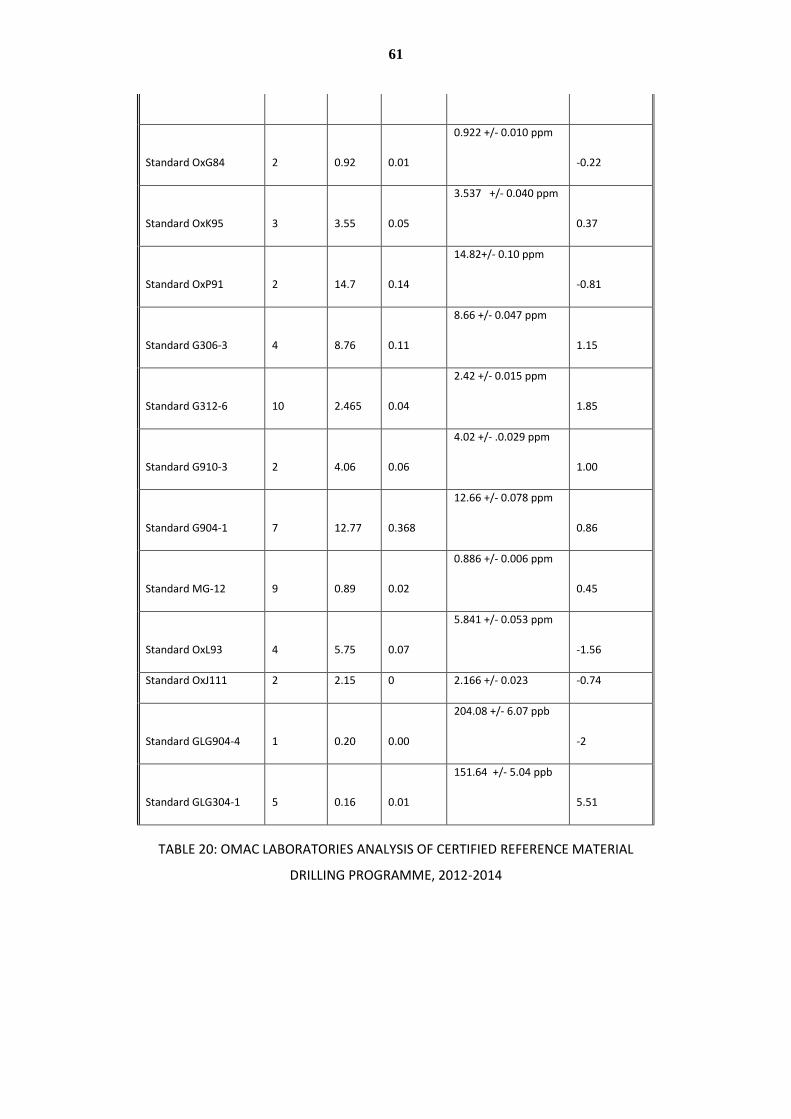
61
Standard OxG84 2 0.92 0.01
0.922 +/- 0.010 ppm
-0.22
Standard OxK95 3 3.55 0.05
3.537 +/- 0.040 ppm
0.37
Standard OxP91 2 14.7 0.14
14.82+/- 0.10 ppm
-0.81
Standard G306-3 4 8.76 0.11
8.66 +/- 0.047 ppm
1.15
Standard G312-6 10 2.465 0.04
2.42 +/- 0.015 ppm
1.85
Standard G910-3 2 4.06 0.06
4.02 +/- .0.029 ppm
1.00
Standard G904-1 7 12.77 0.368
12.66 +/- 0.078 ppm
0.86
Standard MG-12 9 0.89 0.02
0.886 +/- 0.006 ppm
0.45
Standard OxL93 4 5.75 0.07
5.841 +/- 0.053 ppm
-1.56
Standard OxJ111 2 2.15 0 2.166 +/- 0.023 -0.74
Standard GLG904-4 1 0.20 0.00
204.08 +/- 6.07 ppb
-2
Standard GLG304-1 5 0.16 0.01
151.64 +/- 5.04 ppb
5.51
TABLE 20: OMAC LABORATORIES ANALYSIS OF CERTIFIED REFERENCE MATERIAL
DRILLING PROGRAMME, 2012-2014
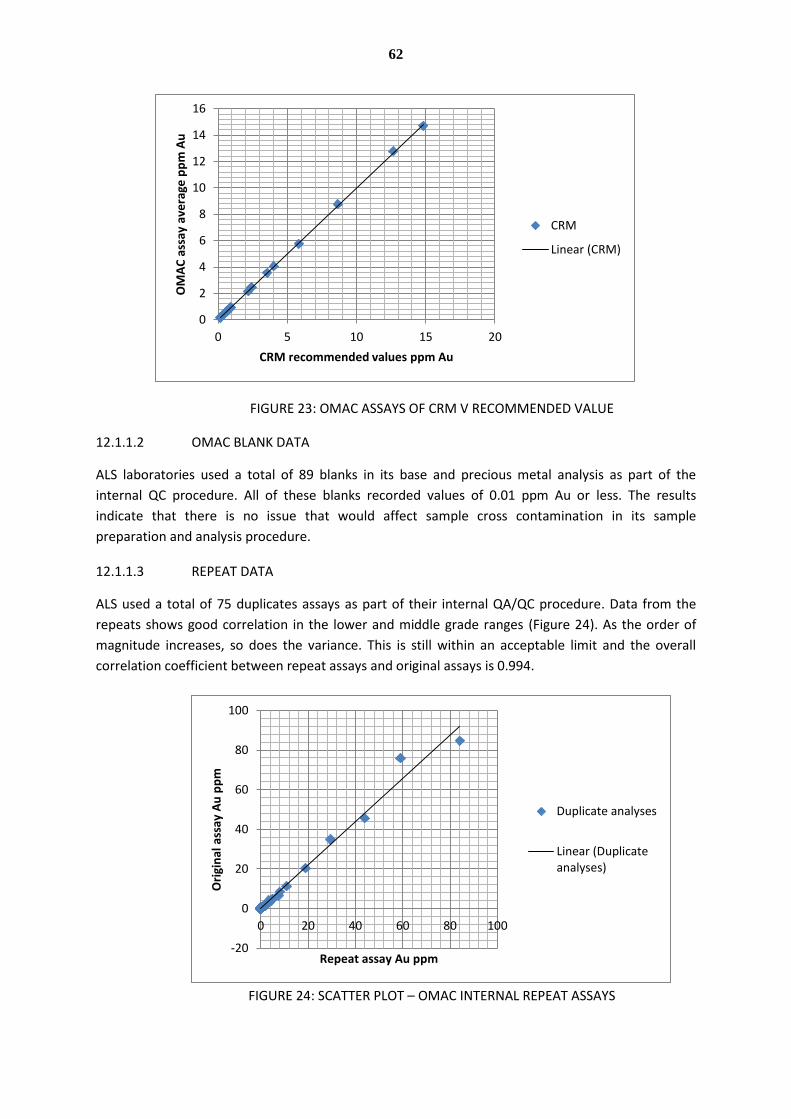
62
FIGURE 23: OMAC ASSAYS OF CRM V RECOMMENDED VALUE
12.1.1.2 OMAC BLANK DATA
ALS laboratories used a total of 89 blanks in its base and precious metal analysis as part of the
internal QC procedure. All of these blanks recorded values of 0.01 ppm Au or less. The results
indicate that there is no issue that would affect sample cross contamination in its sample
preparation and analysis procedure.
12.1.1.3 REPEAT DATA
ALS used a total of 75 duplicates assays as part of their internal QA/QC procedure. Data from the
repeats shows good correlation in the lower and middle grade ranges (Figure 24). As the order of
magnitude increases, so does the variance. This is still within an acceptable limit and the overall
correlation coefficient between repeat assays and original assays is 0.994.
FIGURE 24: SCATTER PLOT – OMAC INTERNAL REPEAT ASSAYS
0
2
4
6
8
10
12
14
16
0 5 10 15 20
OM
AC
ass
ay a
vera
ge p
pm
Au
CRM recommended values ppm Au
CRM
Linear (CRM)
-20
0
20
40
60
80
100
0 20 40 60 80 100
Ori
gin
al a
ssay
Au
pp
m
Repeat assay Au ppm
Duplicate analyses
Linear (Duplicateanalyses)
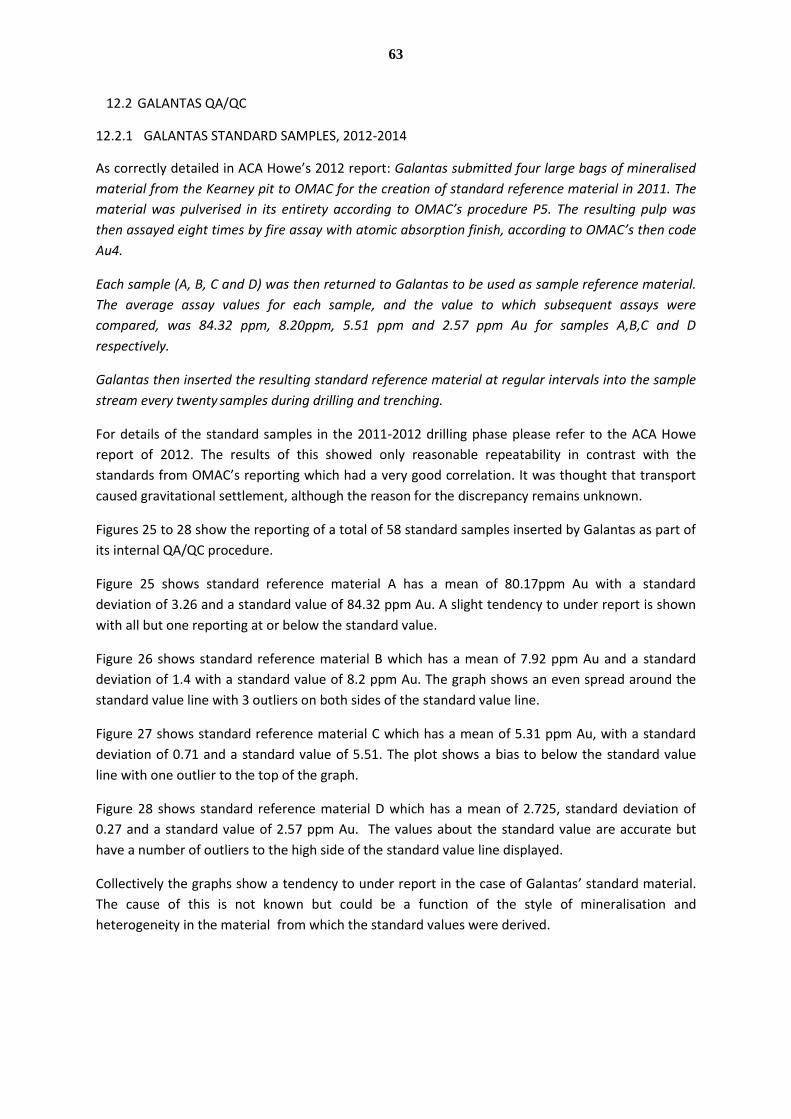
63
12.2 GALANTAS QA/QC
12.2.1 GALANTAS STANDARD SAMPLES, 2012-2014
As correctly detailed in ACA Howe’s 2012 report: Galantas submitted four large bags of mineralised
material from the Kearney pit to OMAC for the creation of standard reference material in 2011. The
material was pulverised in its entirety according to OMAC’s procedure P5. The resulting pulp was
then assayed eight times by fire assay with atomic absorption finish, according to OMAC’s then code
Au4.
Each sample (A, B, C and D) was then returned to Galantas to be used as sample reference material.
The average assay values for each sample, and the value to which subsequent assays were
compared, was 84.32 ppm, 8.20ppm, 5.51 ppm and 2.57 ppm Au for samples A,B,C and D
respectively.
Galantas then inserted the resulting standard reference material at regular intervals into the sample
stream every twenty samples during drilling and trenching.
For details of the standard samples in the 2011-2012 drilling phase please refer to the ACA Howe
report of 2012. The results of this showed only reasonable repeatability in contrast with the
standards from OMAC’s reporting which had a very good correlation. It was thought that transport
caused gravitational settlement, although the reason for the discrepancy remains unknown.
Figures 25 to 28 show the reporting of a total of 58 standard samples inserted by Galantas as part of
its internal QA/QC procedure.
Figure 25 shows standard reference material A has a mean of 80.17ppm Au with a standard
deviation of 3.26 and a standard value of 84.32 ppm Au. A slight tendency to under report is shown
with all but one reporting at or below the standard value.
Figure 26 shows standard reference material B which has a mean of 7.92 ppm Au and a standard
deviation of 1.4 with a standard value of 8.2 ppm Au. The graph shows an even spread around the
standard value line with 3 outliers on both sides of the standard value line.
Figure 27 shows standard reference material C which has a mean of 5.31 ppm Au, with a standard
deviation of 0.71 and a standard value of 5.51. The plot shows a bias to below the standard value
line with one outlier to the top of the graph.
Figure 28 shows standard reference material D which has a mean of 2.725, standard deviation of
0.27 and a standard value of 2.57 ppm Au. The values about the standard value are accurate but
have a number of outliers to the high side of the standard value line displayed.
Collectively the graphs show a tendency to under report in the case of Galantas’ standard material.
The cause of this is not known but could be a function of the style of mineralisation and
heterogeneity in the material from which the standard values were derived.
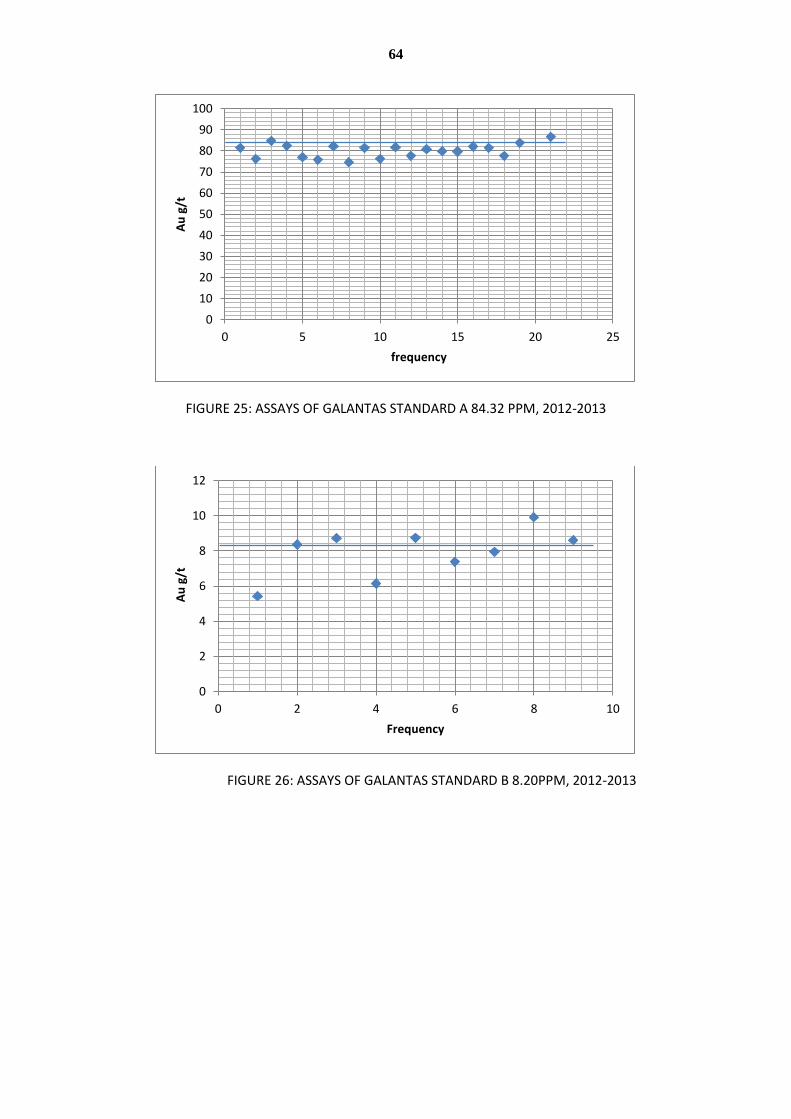
64
FIGURE 25: ASSAYS OF GALANTAS STANDARD A 84.32 PPM, 2012-2013
FIGURE 26: ASSAYS OF GALANTAS STANDARD B 8.20PPM, 2012-2013
0
10
20
30
40
50
60
70
80
90
100
0 5 10 15 20 25
Au
g/t
frequency
0
2
4
6
8
10
12
0 2 4 6 8 10
Au
g/t
Frequency
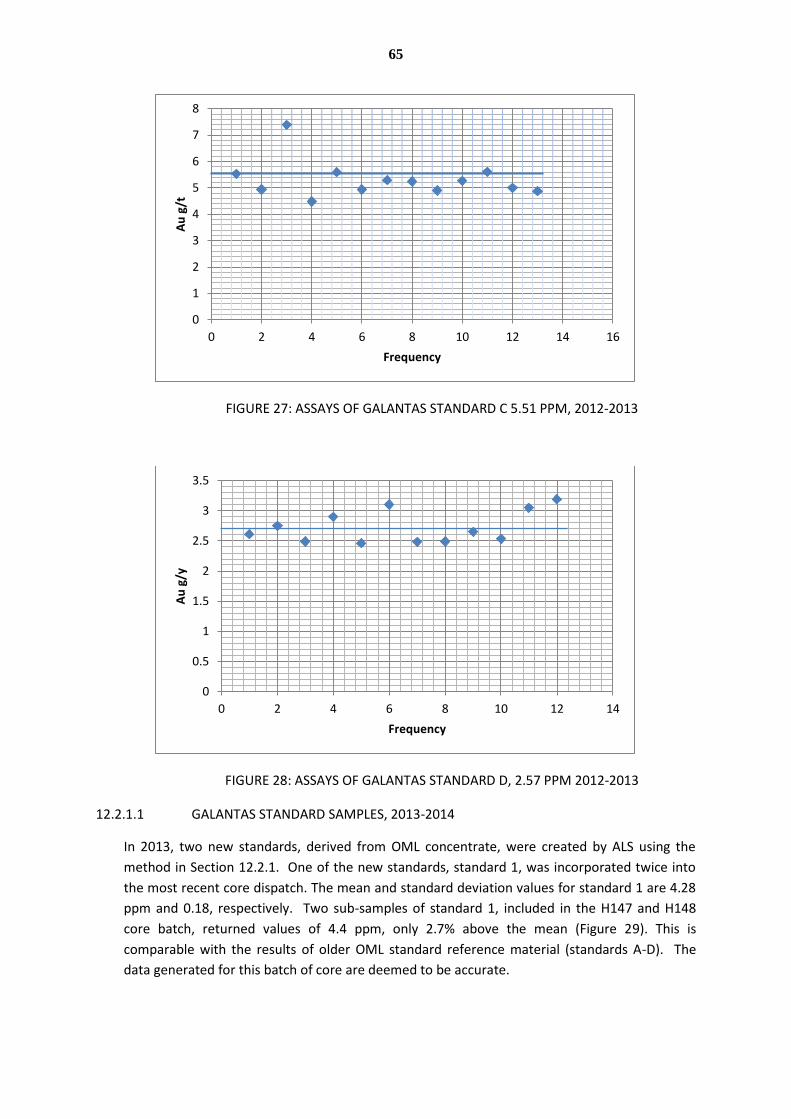
65
FIGURE 27: ASSAYS OF GALANTAS STANDARD C 5.51 PPM, 2012-2013
FIGURE 28: ASSAYS OF GALANTAS STANDARD D, 2.57 PPM 2012-2013
12.2.1.1 GALANTAS STANDARD SAMPLES, 2013-2014
In 2013, two new standards, derived from OML concentrate, were created by ALS using the
method in Section 12.2.1. One of the new standards, standard 1, was incorporated twice into
the most recent core dispatch. The mean and standard deviation values for standard 1 are 4.28
ppm and 0.18, respectively. Two sub-samples of standard 1, included in the H147 and H148
core batch, returned values of 4.4 ppm, only 2.7% above the mean (Figure 29). This is
comparable with the results of older OML standard reference material (standards A-D). The
data generated for this batch of core are deemed to be accurate.
0
1
2
3
4
5
6
7
8
0 2 4 6 8 10 12 14 16
Au
g/t
Frequency
0
0.5
1
1.5
2
2.5
3
3.5
0 2 4 6 8 10 12 14
Au
g/y
Frequency
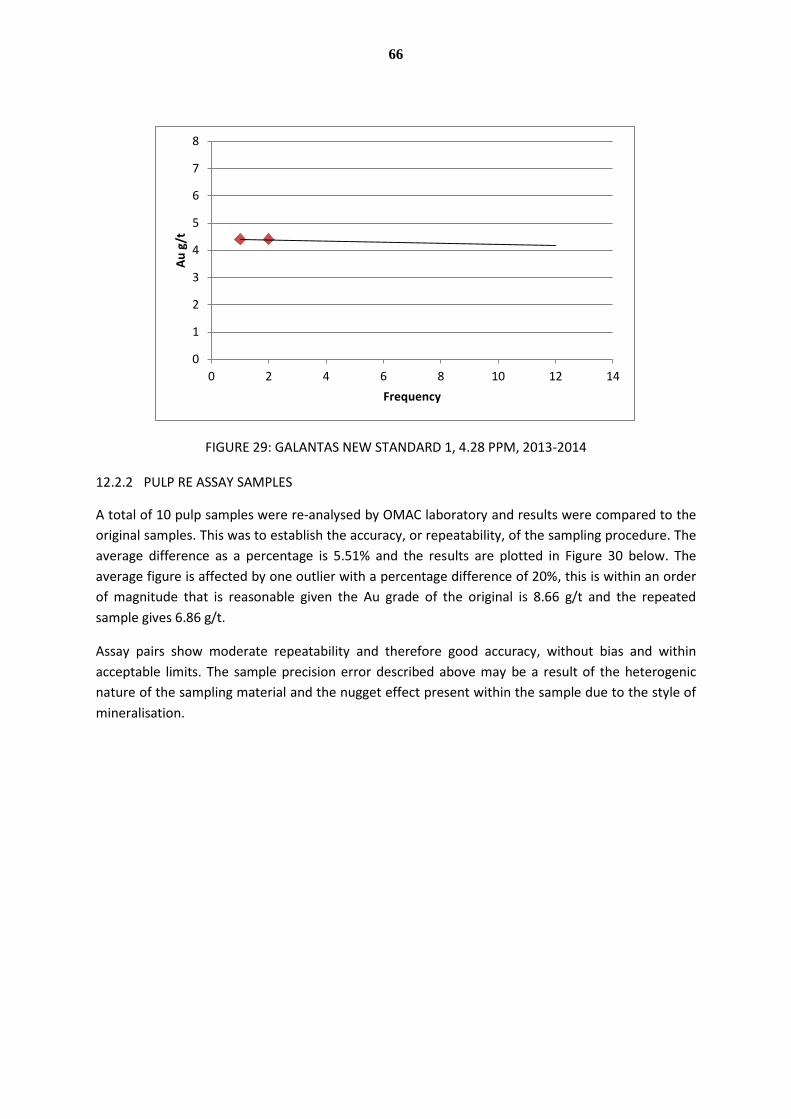
66
FIGURE 29: GALANTAS NEW STANDARD 1, 4.28 PPM, 2013-2014
12.2.2 PULP RE ASSAY SAMPLES
A total of 10 pulp samples were re-analysed by OMAC laboratory and results were compared to the
original samples. This was to establish the accuracy, or repeatability, of the sampling procedure. The
average difference as a percentage is 5.51% and the results are plotted in Figure 30 below. The
average figure is affected by one outlier with a percentage difference of 20%, this is within an order
of magnitude that is reasonable given the Au grade of the original is 8.66 g/t and the repeated
sample gives 6.86 g/t.
Assay pairs show moderate repeatability and therefore good accuracy, without bias and within
acceptable limits. The sample precision error described above may be a result of the heterogenic
nature of the sampling material and the nugget effect present within the sample due to the style of
mineralisation.
0
1
2
3
4
5
6
7
8
0 2 4 6 8 10 12 14
Au
g/t
Frequency
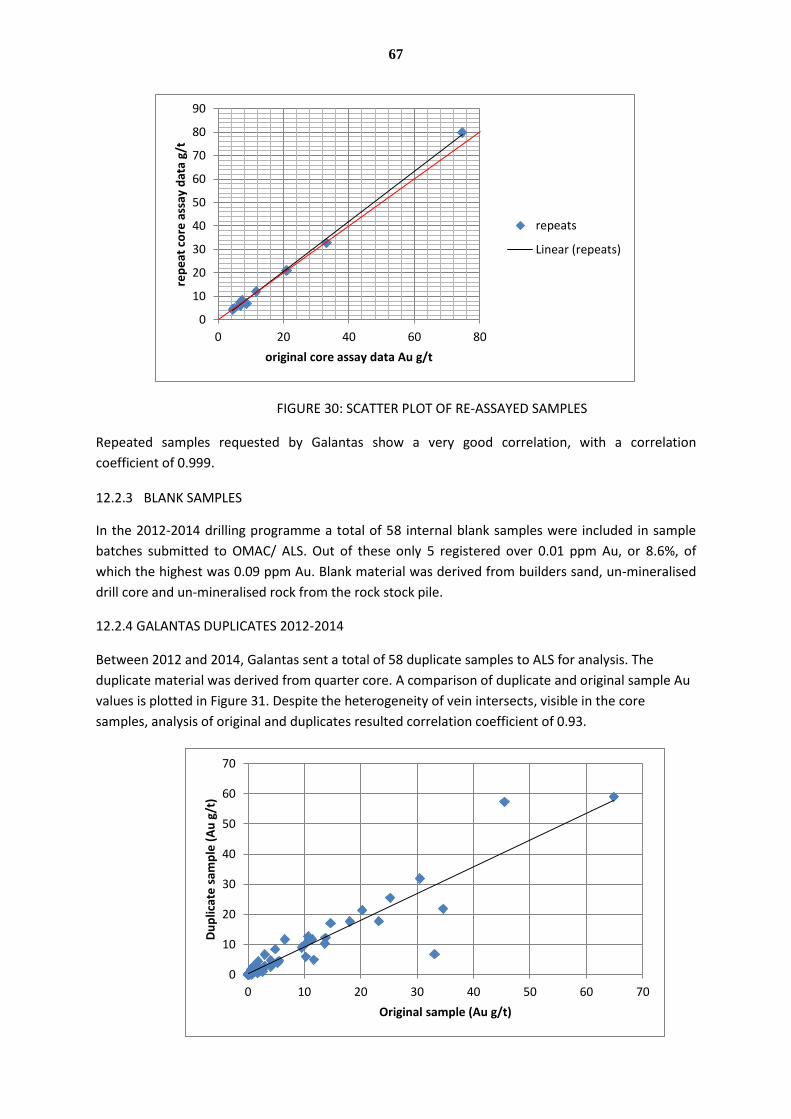
67
FIGURE 30: SCATTER PLOT OF RE-ASSAYED SAMPLES
Repeated samples requested by Galantas show a very good correlation, with a correlation
coefficient of 0.999.
12.2.3 BLANK SAMPLES
In the 2012-2014 drilling programme a total of 58 internal blank samples were included in sample
batches submitted to OMAC/ ALS. Out of these only 5 registered over 0.01 ppm Au, or 8.6%, of
which the highest was 0.09 ppm Au. Blank material was derived from builders sand, un-mineralised
drill core and un-mineralised rock from the rock stock pile.
12.2.4 GALANTAS DUPLICATES 2012-2014
Between 2012 and 2014, Galantas sent a total of 58 duplicate samples to ALS for analysis. The
duplicate material was derived from quarter core. A comparison of duplicate and original sample Au
values is plotted in Figure 31. Despite the heterogeneity of vein intersects, visible in the core
samples, analysis of original and duplicates resulted correlation coefficient of 0.93.
0
10
20
30
40
50
60
70
80
90
0 20 40 60 80
rep
eat
co
re a
ssay
dat
a g/
t
original core assay data Au g/t
repeats
Linear (repeats)
0
10
20
30
40
50
60
70
0 10 20 30 40 50 60 70
Du
plic
ate
sam
ple
(A
u g
/t)
Original sample (Au g/t)
68
FIGURE 31: SCATTER PLOT OF GALANTAS ORIGINAL AND DUPLICATE SAMPLE ANALYSES
12.3 QA/QC CONCLUSIONS
Past reporting by ACA Howe has identified the robust QAQC procedures in place, developed by
Galantas and ACA Howe. The quality of sample assays has been ensured through the monitoring of
sample preparation, accuracy, precision and bias via the use of external controls (standards, blanks
and repeats), and the review of internal laboratory controls (internal standards, blanks and repeats).
The results of this work indicate that sample preparation techniques used at ALS laboratories are
adequate to eliminate signs of cross contamination. Analytical machines used in the reading of
element abundance display a high level of accuracy and precision, without bias. It is therefore
concluded that the assay results from the drilling programme of 2012-2014 are representative of the
samples collected.
However, some sampling bias may exist as shown in the Galantas standard results that indicate a
tendency to under report, as shown in Figures 25 and 27.
13 DATA VERIFICATION
Galantas’ own personnel and identified third parties gathered and compiled the information used in
this report during the latest exploration phase.
In ACA Howe’s 2012 report the following was documented:
The authors carried out checks during site visits and confirmed best practice logging and processing
were being implemented, witnessed core cutting and sampling, verified channel sampling locations
and reviewed internal reports.
It is the view of the author that industry best practice, as well as development, is continuing in the
areas of exploration and geological understanding of the deposit.
During recent exploration, geological data, survey data, assay data, and bulk density data from
drilling and channel sampling activities were merged into the current Micromine database for the
project. Regular checks were performed on the database to ensure there were no errors in data
entry. The receipt of raw data from the laboratory and third parties, usually in the form of excel
spread sheets, allowed direct import in to Micromine, thus minimising any potential error arising
from manual data entry.
The data supplied to Galantas by ALS and third parties appear reliable in the light of checks carried
out by Galantas and the review of QA/QC practices.
In view of these checks, and the body of work previously submitted in the 2008 and 2012 reports,
the author is of the opinion that the data cited in this report are reliable and adequate for use in the
resource estimate.
69
14 MINERAL PROCESSING AND METALLURGICAL TESTING
Initial froth flotation test-work was carried out by Lakefield (1992). The plant that currently operates
is based upon the results of that test-work. Further tests on tailored reagents have been carried out
during operation of the plant, and improvements made. The plant is monitored for efficiency and
environmental control by an on-site laboratory.
An up-rated version of the existing plant has been designed in order to process ore from the
proposed underground mine, as discussed in Section 17 of this report. The author considers that no
additional test-work is required.
15 MINERAL RESOURCE ESTIMATES
15.1 RESOURCE ESTIMATION OVERVIEW
Galantas has prepared an updated estimate of mineral resources for the main Kearney vein zone and
Joshua vein, which have been the focus of historical and recent exploration. Other targets included
IP anomalies within the mine site, McCoombs vein and Kerr vein, the latter of which is interpreted as
a fan structure between two principal shear hosted vein structures. Historical targets include
Sammy’s vein, Elkins vein, Gormley vein, Garry’s vein and Princes vein.
Resource estimation methodologies, results, validations and comparisons with previous estimates
are discussed in this section of the report.
As part of this work, an updated project database was created, validated and used to visualise
exploration and resource data during interpretation and modelling prior to estimation. Mineralised
zones were interpreted and 3D wireframes created. Sample data were selected and statistical
analysis performed on raw sample data to assess its validity for use in resource estimation. Following
the generation of mineralised domains, raw sample data were composited in order to standardise
sample support. Further statistical and geostatistical analyses were performed on composite data to
assess grade characteristics and continuity.
Once the orientation and ranges of grade continuity were chosen, wireframe constrained block
models were created and grade interpolation into each block model was undertaken using the
inverse distance weighting algorithm. Upon completion of block estimation, the resulting block
models were validated and density values written to the block model prior to reporting (PERC) /CIM
compliant grade and tonnage estimates for the project.
15.2 SOFTWARE
Updated resources for the Omagh Project were estimated using MICROMINE version 14.0.4.
15.3 DATABASE COMPILATION
The following is extracted from the 2012 ACA Howe report.
Prior to recent exploration activities, historical Riofinex drilling data for the project were captured in
hard copy form and surface data captured and stored in DynoCADD software on site. In 2003, ACA
70
Howe compiled AutoCAD and GIS data for the project, including surface geochemical data, float
sample data, stream sediment sample data, Landsat imagery interpretation data and limited surface
mapping. This exploration data is discussed in detail in the ACA Howe 2003 and 2008 reports.
Prior to the partial re-estimation of resources over the Kearney vein in 2004, a MICROMINE resource
development database was created which contained collar, survey, geology and assay data from
historical Riofinex drilling data and pit channel sampling data for Kearney only. This database was
validated by ACA Howe and became the master database into which was merged all other available
Riofinex drilling data and recent drilling and channel sampling data collected by Galantas and ACA
Howe. Geological data for a total of 28 historical reverse circulation Riofinex drill holes are missing
from the drill logs, no reliable survey information for these holes is available and assay results from
these holes cannot be verified. Therefore, these holes are absent from the database.
Between 2006 and 2007, ACA Howe received all available hard copy drill logs for historical Riofinex
drilling on other veins, and manually entered geological, assay and survey data for each hole in to
Excel spreadsheets prior to merging this data into the master database. Co-ordinate data for these
holes were not included in the original drill hole logs and so were taken from ACA Howe GIS data held
for the project, where co-ordinate data were originally digitised from the 1:2,500 maps depicting
hole locations contained on the drill logs. Elevation data were taken from the OSNI digital
topographic data obtained by ACA Howe in 2007.
The information above is considered a reasonable description of the dataset gathering procedure
pre 2011.
During the drilling programme of 2011-2012 collar, assay, survey and geological data were recorded
in the Micromine on-going drilling database. The information was then transferred to ACA Howe for
the benefit of the 2012 report. ACA Howe employed their own validation checks on the data before
incorporating it into a master project used for the compilation of the 2012 report.
The 2012-2014 drill programme saw all collar, survey, assay and geological data added to the excel
master sheet of each dataset as raw data, before being processed into correct formats to allow
transfer onto the Micromine master project database. This database was a merging of the validated
master project from ACA Howe used in the reporting of the 2012 resource update and the Galantas
2012-2013 drill programme project.
After the cut-off date, the parent master project database was once again validated, using the
validation tools within Micromine. This process eliminated incorrect values from the files and
enhanced the consistency of the data. The resulting drill hole database contains all available
historical drilling and sampling data for the entire project and is considered without apparent error
and so robust for use in resource estimation.
Table 21 (below) summarises the data contained with the Omagh project database, used in resource
estimation. Appendix 2 contains details of all the drill holes completed and Appendix 3 provides an
overview of grade and vein width frequencies for Kearney, Joshua and Kerr.
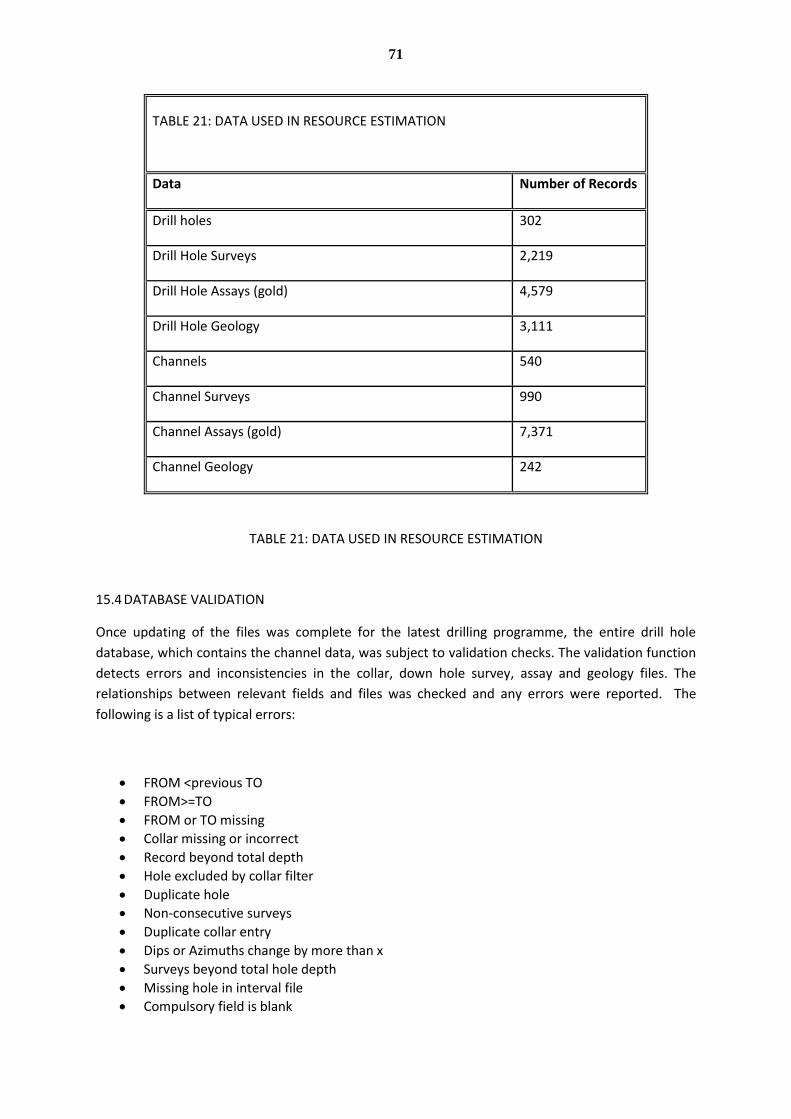
71
TABLE 21: DATA USED IN RESOURCE ESTIMATION
Data Number of Records
Drill holes 302
Drill Hole Surveys 2,219
Drill Hole Assays (gold) 4,579
Drill Hole Geology 3,111
Channels 540
Channel Surveys 990
Channel Assays (gold) 7,371
Channel Geology 242
TABLE 21: DATA USED IN RESOURCE ESTIMATION
15.4 DATABASE VALIDATION
Once updating of the files was complete for the latest drilling programme, the entire drill hole
database, which contains the channel data, was subject to validation checks. The validation function
detects errors and inconsistencies in the collar, down hole survey, assay and geology files. The
relationships between relevant fields and files was checked and any errors were reported. The
following is a list of typical errors:
FROM <previous TO
FROM>=TO
FROM or TO missing
Collar missing or incorrect
Record beyond total depth
Hole excluded by collar filter
Duplicate hole
Non-consecutive surveys
Duplicate collar entry
Dips or Azimuths change by more than x
Surveys beyond total hole depth
Missing hole in interval file
Compulsory field is blank
72
Total depth missing
Rate of Deviation
Sample length intervals (Micromine training manual version 2010(12.0))
Errors encountered were rectified by referring to the original source data.
15.5 COLLAR LOCATIONS
Collar co-ordinate adjustments were carried out by Howe 2012, with regards the historical Rio drill
holes, and is deemed thorough and robust. The corrections have been carried over in this report.
15.6 INTERPRETATION AND MODELLING
The following is taken from the Howe 2012 report:
Once the resource database was validated, all drill hole data and channel sampling data were viewed
interactively in MICROMINE software 2D and 3D environments to aid in the interpretation of geology
and mineralised zones in each area. Prior to conducting computerised interpretation of mineralised
zones, the following were reviewed:
Regional geological setting
Known geological controls on mineralisation
General continuity of mineralisation
Variability of assay grade within sampled veins
Topographic and pit DTM Data
The limits of mining within the Kearney pit have been recorded in four separate DTM surveys of the
area. The southern end of the pit is contained in DTM _PRE-2010 SURVEY(SOUTH KEARNEY) file. This
survey correlates to the DTM_OGL survey detailed in the ACA Howe report 2012 and has since been
back filled. Another survey in 2010 (DTM COASTWAY_ SURVEY_2010) is also in the south end of the
pit and extends the limit of the excavation in the area. The limit of maximum excavation in the main
pit area was surveyed in May 2012 and contained in the file DTM_ALL_SURFS (MAY-2012). The later
north extension and main pit back fill was surveyed in September 2012 which is recorded in DTM
COASTWAY 2012. A total of four surveys were used to confine maximum pit extent in the north,
south and maximum depth of the Kearney pit. A section at 370860N showing the pit level is shown
in Figure 32.
This resource update has used all four surveys in the measurement of depletion by mining for the
Kearney pit.
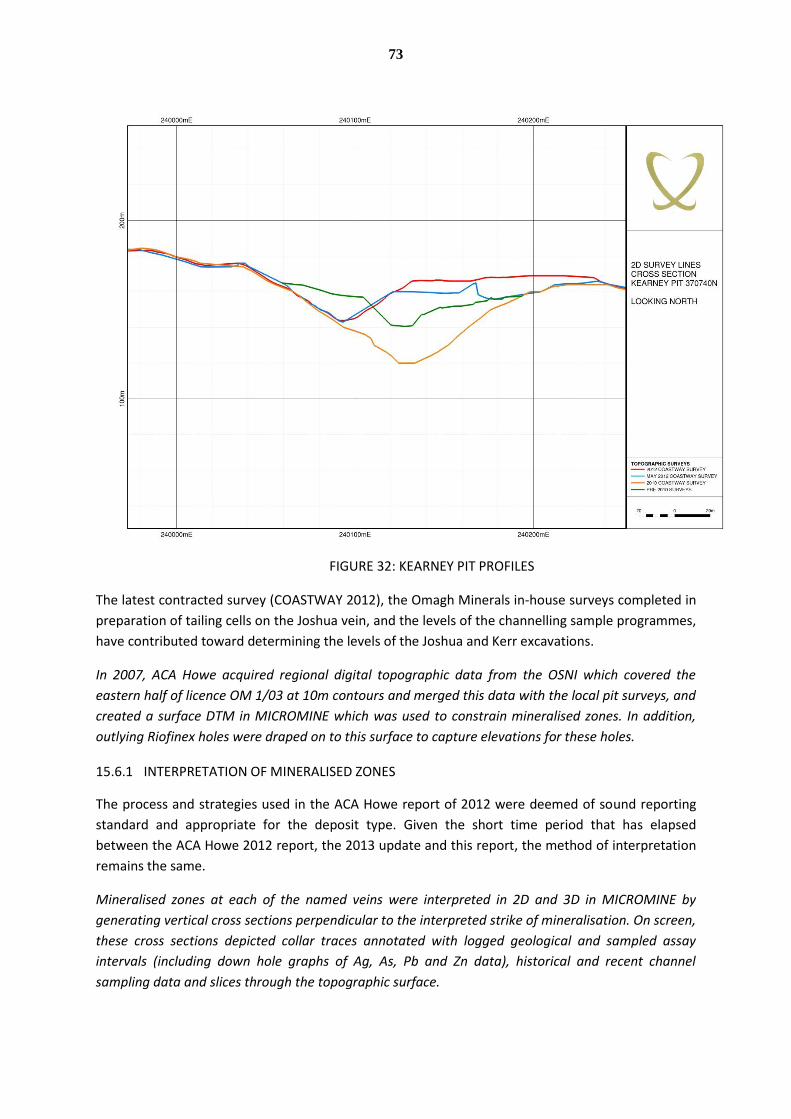
73
FIGURE 32: KEARNEY PIT PROFILES
The latest contracted survey (COASTWAY 2012), the Omagh Minerals in-house surveys completed in
preparation of tailing cells on the Joshua vein, and the levels of the channelling sample programmes,
have contributed toward determining the levels of the Joshua and Kerr excavations.
In 2007, ACA Howe acquired regional digital topographic data from the OSNI which covered the
eastern half of licence OM 1/03 at 10m contours and merged this data with the local pit surveys, and
created a surface DTM in MICROMINE which was used to constrain mineralised zones. In addition,
outlying Riofinex holes were draped on to this surface to capture elevations for these holes.
15.6.1 INTERPRETATION OF MINERALISED ZONES
The process and strategies used in the ACA Howe report of 2012 were deemed of sound reporting
standard and appropriate for the deposit type. Given the short time period that has elapsed
between the ACA Howe 2012 report, the 2013 update and this report, the method of interpretation
remains the same.
Mineralised zones at each of the named veins were interpreted in 2D and 3D in MICROMINE by
generating vertical cross sections perpendicular to the interpreted strike of mineralisation. On screen,
these cross sections depicted collar traces annotated with logged geological and sampled assay
intervals (including down hole graphs of Ag, As, Pb and Zn data), historical and recent channel
sampling data and slices through the topographic surface.
74
Only potentially mineralised core was sampled during recent drilling activities. Selective sampling of
veins and clay gouge essentially defines the mineralised zones in each hole and these assisted with
the sectional interpretation of the veins.
Section control files were developed for Kearney and Joshua to limit each section view from east to
west. Strings were created in each section window, constraining zones of mineralisation exhibiting
more than, or equal to, 2 g/t Au over a drilled length of more than, or equal to 0.9m. In short
sections the width may be reduced to 0.75 m. The criteria used to define mineralised zones were
generally adopted. However, in areas where gold assays greater than 2 g/t Au were returned from
drill hole intervals less than 0.9m, these were included and bulked out to a true width of 0.9m by the
inclusion of waste material, on condition that the weighted average gold grade of the drill hole
interval was greater than 2 g/t. This strategy was employed to ensure the inclusion of all potentially
mineable vein widths and care was taken not to over-dilute mineralised zones.
The following techniques were employed whilst interpreting mineralised zones:
Cross sections spaced 40m apart in the section control file were displayed interactively, with a clipping window of 20m (distance constraint to the north or south of the plane of the cross section). This is in keeping with the average drill spacing.
All interpreted strings were snapped (constrained) to corresponding drill hole intervals, and so constrained in the third dimension.
Where any interpreted mineralised zone did not extend from one cross section to the next, because of vein truncation, it was projected half way to the next section and terminated.
At Kearney and at each of the named veins, the interpretation was extended beyond the first and last cross sections by a distance of half the section spacing or 50m. At depth, the interpretation was extended by a distance of half the drill hole spacing in the z plane or 50m. The use of one or the other of these extent parameters is informed by the observed level of geological/grade continuity.
Within the pit environs, mineralised zones were defined by using both pit floor channel sampling and drill hole sampling to define the sub-surface continuity. Continuous vein zones, as interpreted on cross sections, were extended above the surface of the pits to include channel sampling data, constrained to the surface 2 ppm Au string. Because of mining and bulk sampling activity, historical surface channel sampling positions lie above the Kearney and Joshua pit floors, the wireframe therefore extends above the current surface. It is valid to include these “suspended” channel samples on condition that the resulting block model is constrained to the current topographic surface prior to reporting the updated estimate of resources. In contrast to the method adopted by Howe 2012; Joshua and Kearney drill intersects were strung to every individual historic channel for the purposes of the current report.
75
15.7 WIREFRAMING
Once interpreted strings were created to define mineralised zones, the strings were used to generate
three-dimensional solid wireframe domain models of each mineralised vein at Kearney and Joshua.
At Kearney, the vein zone is shown to be continuous over the drilled strike length of more than 800
m, however, individual veins within this zone, which can be mapped from one section to another, are
not as continuous. The continuity, orientation and geometry of any given mineralised vein may vary.
Vein continuity varies from between 30 m to 450 m along strike, influenced by either structural
disruption and offset, as observed in pit mapping, or gold grade criteria. Therefore, each
continuous/semi-continuous mineralised vein, interpreted in three dimensions and defined by grade
criteria, was considered an individual domain for estimation.
Some of the intersections north of the Kearney pit allow alternative interpretations of continuity and
branching. Where these exist, wireframe interpretation has been guided by the pattern of branching
in the pit, where veins can be seen to branch upwards and to the north.
Once each solid wireframe was created, it was visualised in 3D space and validated using
MICROMINE solid object validation functions to ensure wireframe surface continuity and generation
of solid model volume. Once validated, each wireframe was given a domain name so that the assay
database could be coded, and each assay flagged by the domain it informs.
A total of 32 domains were modelled by wireframe, 21 on Kearney Vein and 11 on Joshua Vein.
Details of each interpreted domain are contained in Table 22 below. Wireframe solids for all
domains are shown in Figure 33.
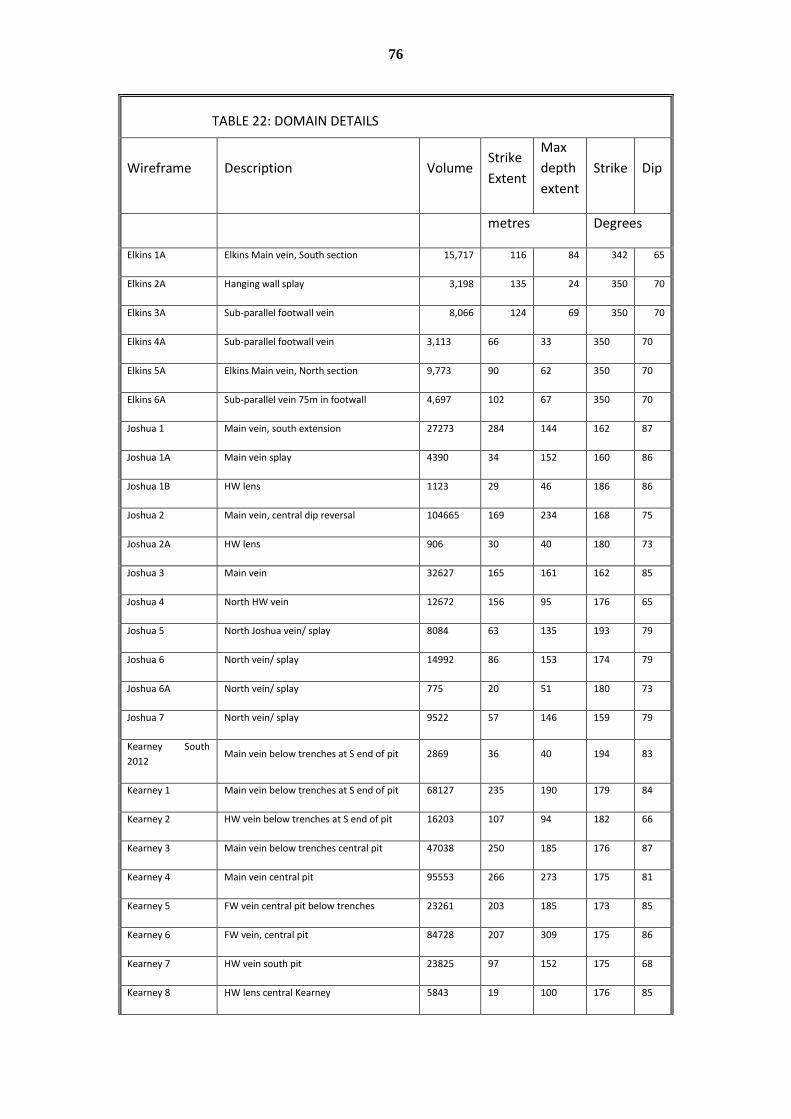
76
TABLE 22: DOMAIN DETAILS
Wireframe Description Volume Strike
Extent
Max
depth
extent
Strike Dip
metres Degrees
Elkins 1A Elkins Main vein, South section 15,717 116 84 342 65
Elkins 2A Hanging wall splay 3,198 135 24 350 70
Elkins 3A Sub-parallel footwall vein 8,066 124 69 350 70
Elkins 4A Sub-parallel footwall vein 3,113 66 33 350 70
Elkins 5A Elkins Main vein, North section 9,773 90 62 350 70
Elkins 6A Sub-parallel vein 75m in footwall 4,697 102 67 350 70
Joshua 1 Main vein, south extension 27273 284 144 162 87
Joshua 1A Main vein splay 4390 34 152 160 86
Joshua 1B HW lens 1123 29 46 186 86
Joshua 2 Main vein, central dip reversal 104665 169 234 168 75
Joshua 2A HW lens 906 30 40 180 73
Joshua 3 Main vein 32627 165 161 162 85
Joshua 4 North HW vein 12672 156 95 176 65
Joshua 5 North Joshua vein/ splay 8084 63 135 193 79
Joshua 6 North vein/ splay 14992 86 153 174 79
Joshua 6A North vein/ splay 775 20 51 180 73
Joshua 7 North vein/ splay 9522 57 146 159 79
Kearney South
2012 Main vein below trenches at S end of pit 2869 36 40 194 83
Kearney 1 Main vein below trenches at S end of pit 68127 235 190 179 84
Kearney 2 HW vein below trenches at S end of pit 16203 107 94 182 66
Kearney 3 Main vein below trenches central pit 47038 250 185 176 87
Kearney 4 Main vein central pit 95553 266 273 175 81
Kearney 5 FW vein central pit below trenches 23261 203 185 173 85
Kearney 6 FW vein, central pit 84728 207 309 175 86
Kearney 7 HW vein south pit 23825 97 152 175 68
Kearney 8 HW lens central Kearney 5843 19 100 176 85
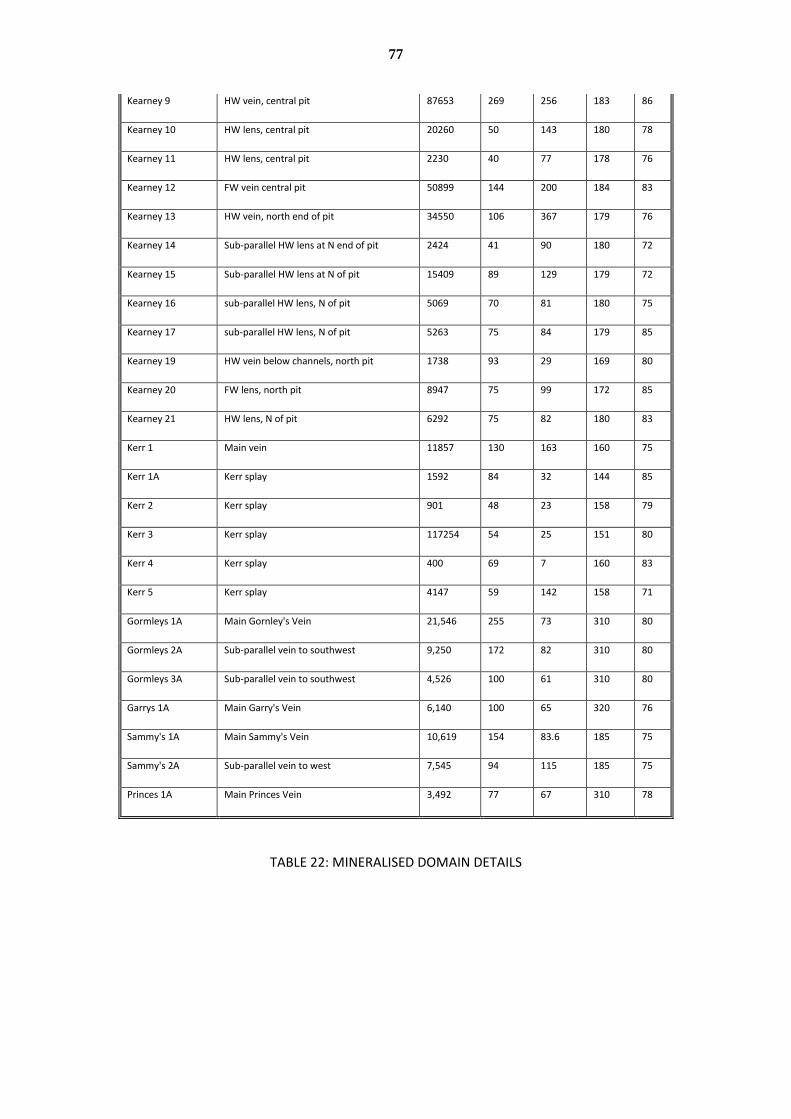
77
Kearney 9 HW vein, central pit 87653 269 256 183 86
Kearney 10 HW lens, central pit 20260 50 143 180 78
Kearney 11 HW lens, central pit 2230 40 77 178 76
Kearney 12 FW vein central pit 50899 144 200 184 83
Kearney 13 HW vein, north end of pit 34550 106 367 179 76
Kearney 14 Sub-parallel HW lens at N end of pit 2424 41 90 180 72
Kearney 15 Sub-parallel HW lens at N of pit 15409 89 129 179 72
Kearney 16 sub-parallel HW lens, N of pit 5069 70 81 180 75
Kearney 17 sub-parallel HW lens, N of pit 5263 75 84 179 85
Kearney 19 HW vein below channels, north pit 1738 93 29 169 80
Kearney 20 FW lens, north pit 8947 75 99 172 85
Kearney 21 HW lens, N of pit 6292 75 82 180 83
Kerr 1 Main vein 11857 130 163 160 75
Kerr 1A Kerr splay 1592 84 32 144 85
Kerr 2 Kerr splay 901 48 23 158 79
Kerr 3 Kerr splay 117254 54 25 151 80
Kerr 4 Kerr splay 400 69 7 160 83
Kerr 5 Kerr splay 4147 59 142 158 71
Gormleys 1A Main Gornley's Vein 21,546 255 73 310 80
Gormleys 2A Sub-parallel vein to southwest 9,250 172 82 310 80
Gormleys 3A Sub-parallel vein to southwest 4,526 100 61 310 80
Garrys 1A Main Garry's Vein 6,140 100 65 320 76
Sammy's 1A Main Sammy's Vein 10,619 154 83.6 185 75
Sammy's 2A Sub-parallel vein to west 7,545 94 115 185 75
Princes 1A Main Princes Vein 3,492 77 67 310 78
TABLE 22: MINERALISED DOMAIN DETAILS
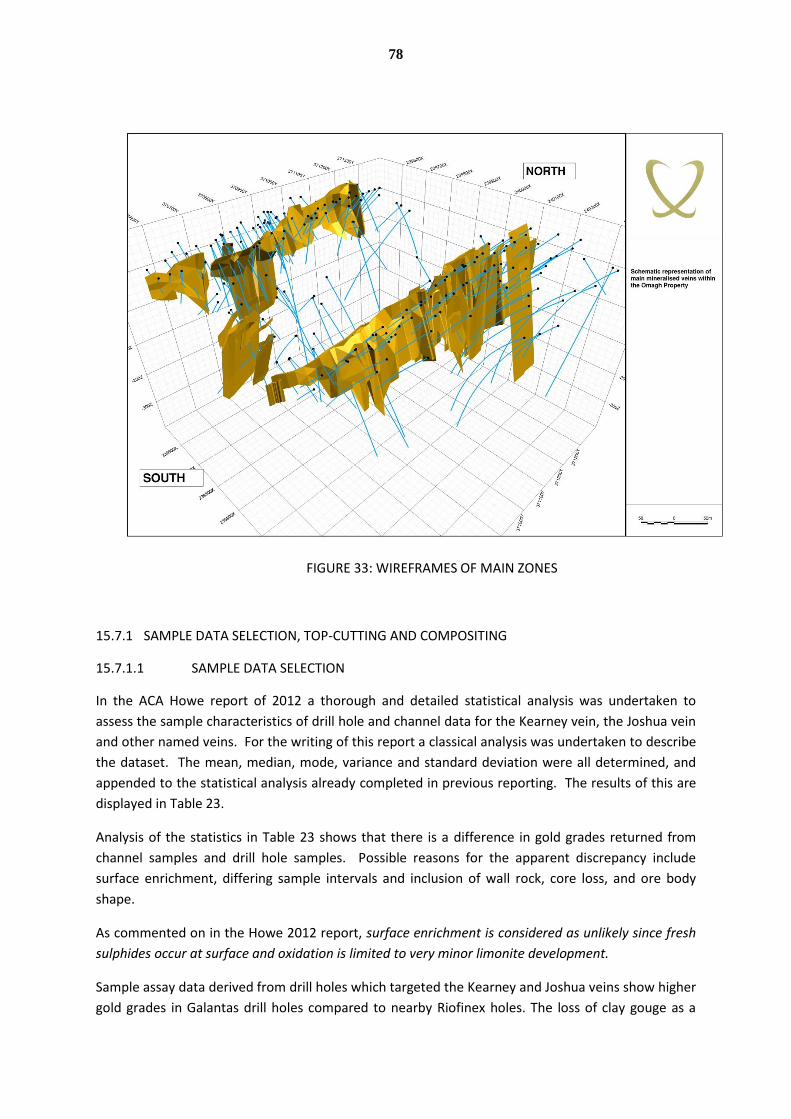
78
FIGURE 33: WIREFRAMES OF MAIN ZONES
15.7.1 SAMPLE DATA SELECTION, TOP-CUTTING AND COMPOSITING
15.7.1.1 SAMPLE DATA SELECTION
In the ACA Howe report of 2012 a thorough and detailed statistical analysis was undertaken to
assess the sample characteristics of drill hole and channel data for the Kearney vein, the Joshua vein
and other named veins. For the writing of this report a classical analysis was undertaken to describe
the dataset. The mean, median, mode, variance and standard deviation were all determined, and
appended to the statistical analysis already completed in previous reporting. The results of this are
displayed in Table 23.
Analysis of the statistics in Table 23 shows that there is a difference in gold grades returned from
channel samples and drill hole samples. Possible reasons for the apparent discrepancy include
surface enrichment, differing sample intervals and inclusion of wall rock, core loss, and ore body
shape.
As commented on in the Howe 2012 report, surface enrichment is considered as unlikely since fresh
sulphides occur at surface and oxidation is limited to very minor limonite development.
Sample assay data derived from drill holes which targeted the Kearney and Joshua veins show higher
gold grades in Galantas drill holes compared to nearby Riofinex holes. The loss of clay gouge as a
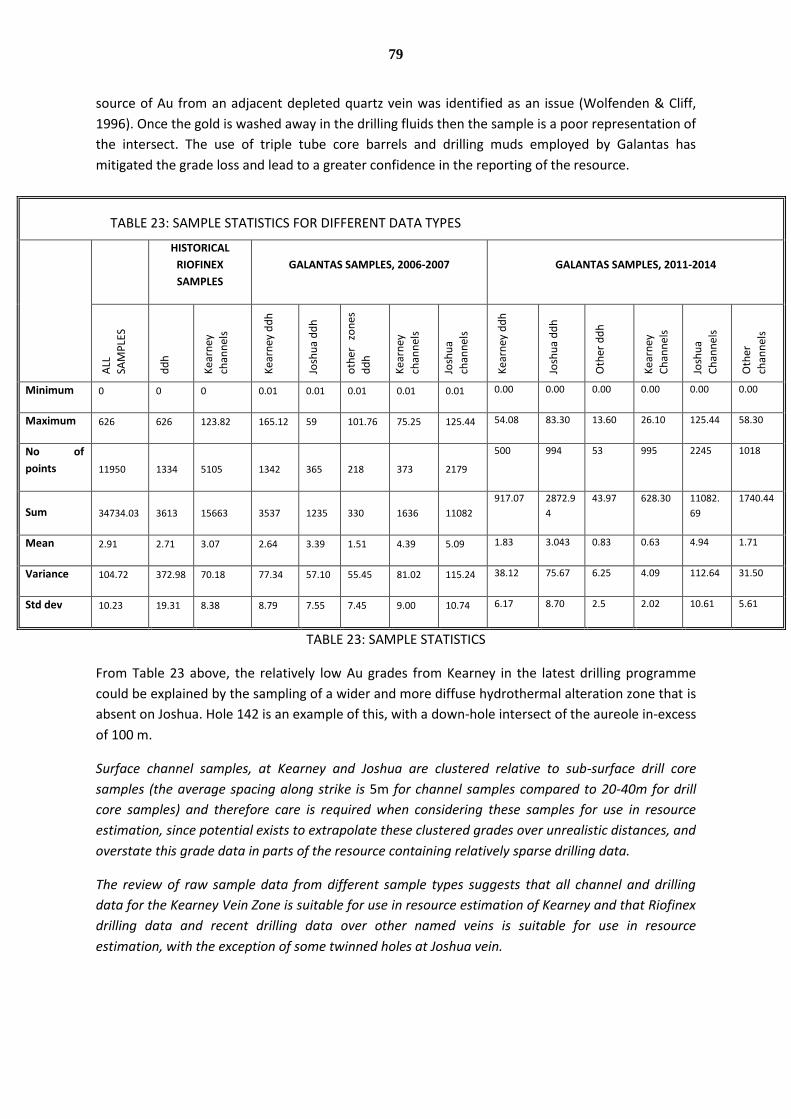
79
source of Au from an adjacent depleted quartz vein was identified as an issue (Wolfenden & Cliff,
1996). Once the gold is washed away in the drilling fluids then the sample is a poor representation of
the intersect. The use of triple tube core barrels and drilling muds employed by Galantas has
mitigated the grade loss and lead to a greater confidence in the reporting of the resource.
TABLE 23: SAMPLE STATISTICS
From Table 23 above, the relatively low Au grades from Kearney in the latest drilling programme
could be explained by the sampling of a wider and more diffuse hydrothermal alteration zone that is
absent on Joshua. Hole 142 is an example of this, with a down-hole intersect of the aureole in-excess
of 100 m.
Surface channel samples, at Kearney and Joshua are clustered relative to sub-surface drill core
samples (the average spacing along strike is 5m for channel samples compared to 20-40m for drill
core samples) and therefore care is required when considering these samples for use in resource
estimation, since potential exists to extrapolate these clustered grades over unrealistic distances, and
overstate this grade data in parts of the resource containing relatively sparse drilling data.
The review of raw sample data from different sample types suggests that all channel and drilling
data for the Kearney Vein Zone is suitable for use in resource estimation of Kearney and that Riofinex
drilling data and recent drilling data over other named veins is suitable for use in resource
estimation, with the exception of some twinned holes at Joshua vein.
TABLE 23: SAMPLE STATISTICS FOR DIFFERENT DATA TYPES
HISTORICAL
RIOFINEX
SAMPLES
GALANTAS SAMPLES, 2006-2007 GALANTAS SAMPLES, 2011-2014
ALL
SAM
PLE
S
dd
h
Kea
rney
chan
nel
s
Kea
rney
dd
h
Josh
ua
dd
h
oth
er
zon
es
dd
h
Kea
rney
chan
nel
s
Josh
ua
chan
nel
s
Kea
rney
dd
h
Josh
ua
dd
h
Oth
er d
dh
Kea
rney
Ch
ann
els
Josh
ua
Ch
ann
els
Dd
h
Oth
er
chan
nel
s
Minimum 0 0 0 0.01 0.01 0.01 0.01 0.01 0.00 0.00 0.00 0.00 0.00 0.00
Maximum 626 626 123.82 165.12 59 101.76 75.25 125.44 54.08 83.30 13.60 26.10 125.44 58.30
No of
points 11950 1334 5105 1342 365 218 373 2179
500 994 53 995 2245 1018
Sum 34734.03 3613 15663 3537 1235 330 1636 11082
917.07 2872.9
4
43.97 628.30 11082.
69
1740.44
Mean 2.91 2.71 3.07 2.64 3.39 1.51 4.39 5.09 1.83 3.043 0.83 0.63 4.94 1.71
Variance 104.72 372.98 70.18 77.34 57.10 55.45 81.02 115.24 38.12 75.67 6.25 4.09 112.64 31.50
Std dev 10.23 19.31 8.38 8.79 7.55 7.45 9.00 10.74 6.17 8.70 2.5 2.02 10.61 5.61
80
The above assessment of the dataset from ACA Howe 2012 is still deemed accurate and a fair
representation of the dataset and Galantas is in agreement with the conclusions of the 2012 ACA
Howe report.
The verified assay file was flagged so that each sample assay was assigned a domain in accordance to
where it was named in a wireframe. Classical statistical analysis was undertaken on assays within
each domain to investigate the statistical characteristics of each domain and to provide useful
information when considering top-cutting data prior to estimation.
15.7.1.2 TOP-CUTTING
Top-cutting is an important step in resource estimation, and particularly so for the estimation of
resources at Cavanacaw since extreme grades (>100ppm Au) have been reported both from sampled
drill core, and surface channel samples. Whilst extreme grades are real, they are not representative,
and occur as outliers that have the potential to over-estimate domain grade if left un-capped. There
are several domains that contain too few samples to reliably determine the top-cut grade on a
domain by domain basis, and in order to not over-cut the sample data, a top-cut value was
determined from all drilling data, and all channel data.
When considering an appropriate top-cut grade, the sample histograms for both drill and trench data
were reviewed in 2008 in order to see the grade at which the histogram tail deteriorates, i.e. where
grades become non-representative for each domain. In addition, sample data were sorted into
descending order and several top-cut values applied in order to see what affect the top-cut value had
on the coefficient of variation (CV), the measure of population variability, as well as the loss of metal
from the sample population. A top-cut value was chosen that resulted in a CV of close to 1-1.2 (the
desired CV for this type of vein hosted gold deposit), but that did not remove a significant amount of
metal from the deposit so as to underestimate resources.
Top-cut analysis performed in 2008 suggested an appropriate top-cut to be 75ppm Au, for both
trench data and drill data, which resulted in a CV of 1.4. On a domain by domain basis, any assays
greater than 75ppm Au were replaced with 75ppm Au. This resulted in the application of a top-cut
value to 8 out of 44 domains.
In view of the statistical similarities between 2008 and 2014 data, it was decided that retaining a top
cut of 75 ppm Au for use in the 2014 estimate was an appropriate measure. Accordingly, all assay
values exceeding 75 g/t Au were cut to 75 g/t Au.
15.7.1.3 COMPOSITING
Data compositing was undertaken on top cut sample assay data prior to geostatistical analysis and
interpolation, in order to standardise the sample database and so generate sample points of equal
support to be used in estimation. Historical and recent drill hole sampling was undertaken over
drilled intervals of between 0.10m and 3.0m, averaging 0.5m. A composite length of 0.3m was
chosen as compatible with a minimum mining width of 0.9m (3 composites). This compositing
strategy is the same as that used for the 2008, 2012 and 2013 resource estimates.
Raw drill hole samples within each mineralised zone were flagged by domain in the sample database
and composited to 0.3m intervals, starting at the drill hole collar and progressing downhole.
81
Compositing was stopped and restarted at domain boundaries and at the end of every hole. Though
isolated and rare, un-sampled intervals within the domain model were inserted into the sample
database and assigned a grade value of 0 prior to compositing. The minimum permitted composite
length was 0.1m, defined in order to capture the final grade interval downhole, commonly at the
edges of mineralised domains. In these instances, a final composite was created if the interval was
greater than 0.10m. If the final interval was less than 0.10m, a weighted average was calculated
from the final two composites. Channel sample data were composited in the same way.
15.7.2 GLOBAL REFERENCE ESTIMATE
Once the data had been subject to top cutting and was composited, the grade and tonnage of each
wireframe was measured to establish the global reference estimate. This is used to establish a
preliminary grade and tonnage and to cross check the later block model global estimates.
15.7.3 GEOSTATISTICS
The geostatistics detailed in this chapter have been carried out to interpret the assay data set in a
systematic way, to provide qualitative and quantitative insights and link these in three dimensions to
describe spatial continuity.
The geostatistical study completed in 2008 and maintained in the Howe 2012 report was deemed to
be sufficient and thorough, no additional samples greatly increased the specific populations of
domains used in the variogram modelling in the report. The author concludes that the validity of the
study is therefore intact for the purposes of this report. An excerpt of the original study is included
below.
The purpose of geostatistical analysis is to generate a series of semivariograms that describe the
orientations and ranges of grade continuity and that can be used as the input weighting mechanism
and search ellipse parameters for Kriging algorithms or to define the search ellipse parameters for
Inverse Distance Weighting interpolation of the Kearney deposit and other named veins. At Kearney,
geostatistical analysis was conducted on drilling data within those domains that contained enough
sample points for potentially meaningful analysis, and exhibited the greatest vein continuity, in an
attempt to define reliable search orientations and ranges that could be applied to these and other
vein domains within the deposit. Variographic analysis was undertaken for domains K3, K4 and K6.
For each domain, variograms were calculated and modelled for the composited gold data and
constrained by the domain. A range of omni variograms with variable lag distance was generated to
estimate the possibility of generating good directional variograms and to determine the optimum lag
distance to be employed. The optimum lag distance was determined to be between 25m and 40m,
which reflects the average drilling grid dimensions over the Kearney deposit.
Downhole experimental variograms were modelled to assess the short range grade variability, and to
determine the expected nugget effect. The nugget effect from all three domains was found to be very
low, due in part to the decrease in grade variability following compositing.
The experimental semivariograms models for the directions of maximum grade continuity were
attempted, and although the models for the first direction (main direction) appeared reliable and
were based on a significant number of sample points, the sample points captured in models for the
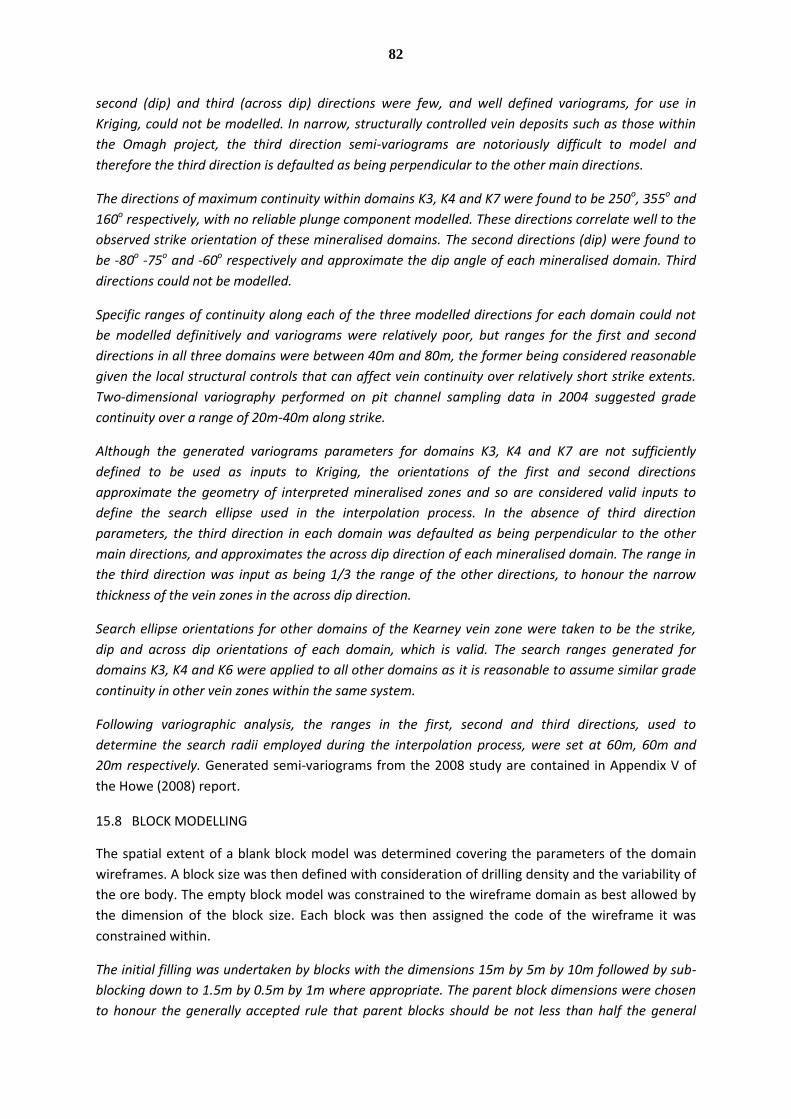
82
second (dip) and third (across dip) directions were few, and well defined variograms, for use in
Kriging, could not be modelled. In narrow, structurally controlled vein deposits such as those within
the Omagh project, the third direction semi-variograms are notoriously difficult to model and
therefore the third direction is defaulted as being perpendicular to the other main directions.
The directions of maximum continuity within domains K3, K4 and K7 were found to be 250o, 355o and
160o respectively, with no reliable plunge component modelled. These directions correlate well to the
observed strike orientation of these mineralised domains. The second directions (dip) were found to
be -80o -75o and -60o respectively and approximate the dip angle of each mineralised domain. Third
directions could not be modelled.
Specific ranges of continuity along each of the three modelled directions for each domain could not
be modelled definitively and variograms were relatively poor, but ranges for the first and second
directions in all three domains were between 40m and 80m, the former being considered reasonable
given the local structural controls that can affect vein continuity over relatively short strike extents.
Two-dimensional variography performed on pit channel sampling data in 2004 suggested grade
continuity over a range of 20m-40m along strike.
Although the generated variograms parameters for domains K3, K4 and K7 are not sufficiently
defined to be used as inputs to Kriging, the orientations of the first and second directions
approximate the geometry of interpreted mineralised zones and so are considered valid inputs to
define the search ellipse used in the interpolation process. In the absence of third direction
parameters, the third direction in each domain was defaulted as being perpendicular to the other
main directions, and approximates the across dip direction of each mineralised domain. The range in
the third direction was input as being 1/3 the range of the other directions, to honour the narrow
thickness of the vein zones in the across dip direction.
Search ellipse orientations for other domains of the Kearney vein zone were taken to be the strike,
dip and across dip orientations of each domain, which is valid. The search ranges generated for
domains K3, K4 and K6 were applied to all other domains as it is reasonable to assume similar grade
continuity in other vein zones within the same system.
Following variographic analysis, the ranges in the first, second and third directions, used to
determine the search radii employed during the interpolation process, were set at 60m, 60m and
20m respectively. Generated semi-variograms from the 2008 study are contained in Appendix V of
the Howe (2008) report.
15.8 BLOCK MODELLING
The spatial extent of a blank block model was determined covering the parameters of the domain
wireframes. A block size was then defined with consideration of drilling density and the variability of
the ore body. The empty block model was constrained to the wireframe domain as best allowed by
the dimension of the block size. Each block was then assigned the code of the wireframe it was
constrained within.
The initial filling was undertaken by blocks with the dimensions 15m by 5m by 10m followed by sub-
blocking down to 1.5m by 0.5m by 1m where appropriate. The parent block dimensions were chosen
to honour the generally accepted rule that parent blocks should be not less than half the general
83
exploration grid, which at Kearney is generally 40m by 40m, and in some areas 20m by 20m.
Therefore the y (strike) block dimension is 15m. The x block dimension of 5m honours the narrow
thickness of the vein zones and the z dimension of 10m is in line with proposed mining bench height.
Sub-blocking down to one tenth of parent block dimensions is required in order to maintain the
resolution of the mineralised envelopes so as to accurately honour wireframe volume.
Once blank block models had been created each was constrained by the DTM of the topographic
surface and combined limits of the Kearney pit. Those blocks above the DTM were deleted and those
remaining below were ready for interpolation. Block model characteristics for each model are
contained in Table 24 below.
2012-2014 BLANK BLOCK MODEL DETAILS
Model Dimension
Extent (Irish
Transverse
Mercator Grid Parent Block
Size (metres)
Minimum
sub-blocks
(metres)
Min Max
Kearney Eastings 240062 240221 5 0.5
Northings 370493 371360 15 1.5
RL -205 165 10 1
Joshua Eastings 239576 239778 5 0.5
Northings 370508 371203 15 1.5
RL -72 184 10 1
TABLE 24: 2012-2014 BLANK BLOCK MODEL DETAILS
15.9 GRADE INTERPOLATION
Gold grades were interpolated into the empty block model for each deposit using the Inverse
Distance Weighting (IDW) interpolation, raised to third power. Each block model was populated on a
domain-by-domain basis using composited, top-cut assay data. A closed interpolation approach was
adopted, whereby only composite assay data situated within each domain, were used to interpolate
the grade of blocks within that domain. This was done by filtering out all sample assays apart from
those in the relevant domain. Variographic analysis in 2008 was not thought to be robust enough to
define the input parameters required for a reliable kriged estimate of each domain at each deposit,
however the observed nugget effect, derived from down hole variograms, is considered reliable and
is found to be low for each of the domains investigated through variography (<10%). One of the main
advantages that kriging has over IDW interpolation is that the nugget effect, or grade variability over
very short distances, is factored in to the kriging algorithm whereas it is assumed to be zero when
using IDW. The presence of a very low nugget effect therefore validates the use of IDW as a reliable
interpolation method.
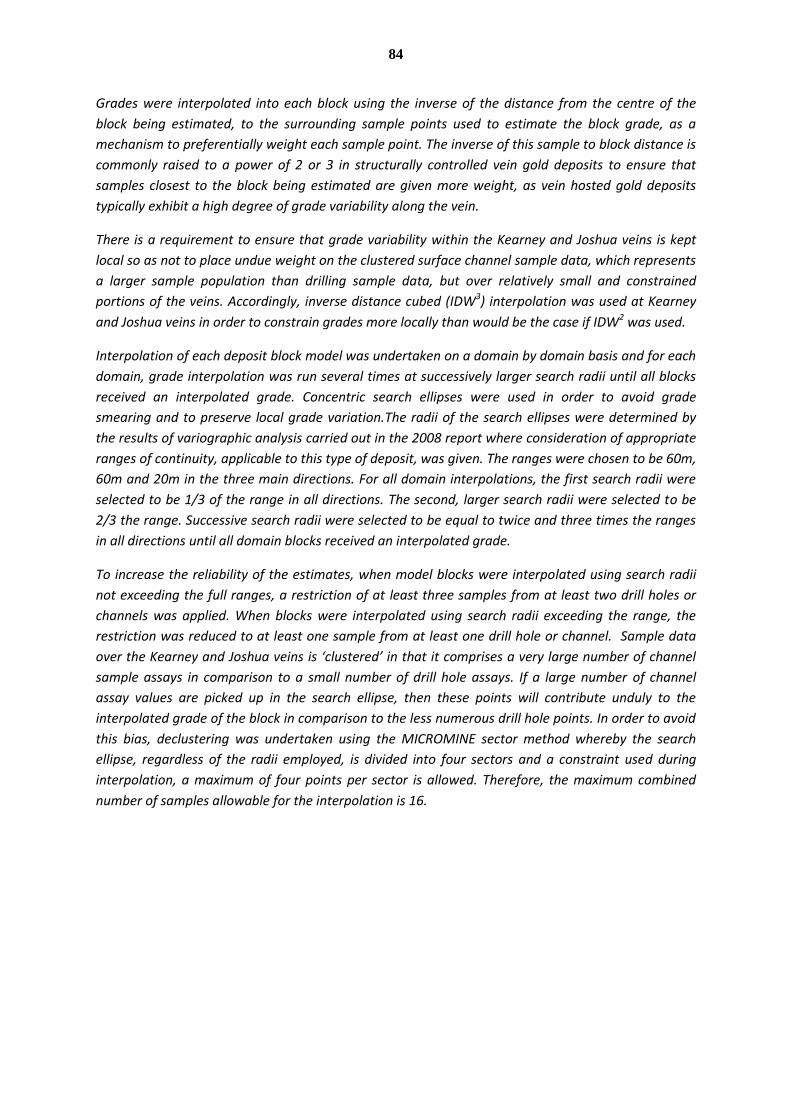
84
Grades were interpolated into each block using the inverse of the distance from the centre of the
block being estimated, to the surrounding sample points used to estimate the block grade, as a
mechanism to preferentially weight each sample point. The inverse of this sample to block distance is
commonly raised to a power of 2 or 3 in structurally controlled vein gold deposits to ensure that
samples closest to the block being estimated are given more weight, as vein hosted gold deposits
typically exhibit a high degree of grade variability along the vein.
There is a requirement to ensure that grade variability within the Kearney and Joshua veins is kept
local so as not to place undue weight on the clustered surface channel sample data, which represents
a larger sample population than drilling sample data, but over relatively small and constrained
portions of the veins. Accordingly, inverse distance cubed (IDW3) interpolation was used at Kearney
and Joshua veins in order to constrain grades more locally than would be the case if IDW2 was used.
Interpolation of each deposit block model was undertaken on a domain by domain basis and for each
domain, grade interpolation was run several times at successively larger search radii until all blocks
received an interpolated grade. Concentric search ellipses were used in order to avoid grade
smearing and to preserve local grade variation.The radii of the search ellipses were determined by
the results of variographic analysis carried out in the 2008 report where consideration of appropriate
ranges of continuity, applicable to this type of deposit, was given. The ranges were chosen to be 60m,
60m and 20m in the three main directions. For all domain interpolations, the first search radii were
selected to be 1/3 of the range in all directions. The second, larger search radii were selected to be
2/3 the range. Successive search radii were selected to be equal to twice and three times the ranges
in all directions until all domain blocks received an interpolated grade.
To increase the reliability of the estimates, when model blocks were interpolated using search radii
not exceeding the full ranges, a restriction of at least three samples from at least two drill holes or
channels was applied. When blocks were interpolated using search radii exceeding the range, the
restriction was reduced to at least one sample from at least one drill hole or channel. Sample data
over the Kearney and Joshua veins is ‘clustered’ in that it comprises a very large number of channel
sample assays in comparison to a small number of drill hole assays. If a large number of channel
assay values are picked up in the search ellipse, then these points will contribute unduly to the
interpolated grade of the block in comparison to the less numerous drill hole points. In order to avoid
this bias, declustering was undertaken using the MICROMINE sector method whereby the search
ellipse, regardless of the radii employed, is divided into four sectors and a constraint used during
interpolation, a maximum of four points per sector is allowed. Therefore, the maximum combined
number of samples allowable for the interpolation is 16.
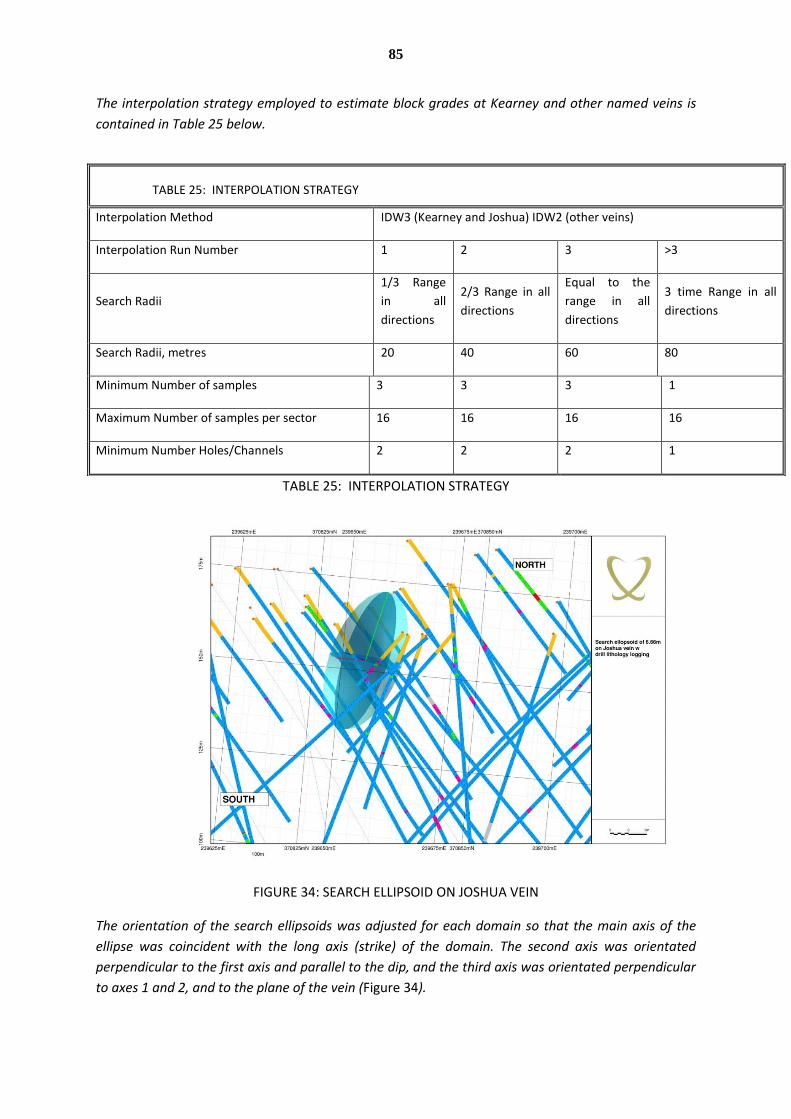
85
The interpolation strategy employed to estimate block grades at Kearney and other named veins is
contained in Table 25 below.
TABLE 25: INTERPOLATION STRATEGY
FIGURE 34: SEARCH ELLIPSOID ON JOSHUA VEIN
The orientation of the search ellipsoids was adjusted for each domain so that the main axis of the
ellipse was coincident with the long axis (strike) of the domain. The second axis was orientated
perpendicular to the first axis and parallel to the dip, and the third axis was orientated perpendicular
to axes 1 and 2, and to the plane of the vein (Figure 34).
TABLE 25: INTERPOLATION STRATEGY
Interpolation Method IDW3 (Kearney and Joshua) IDW2 (other veins)
Interpolation Run Number 1 2 3 >3
Search Radii
1/3 Range
in all
directions
2/3 Range in all
directions
Equal to the
range in all
directions
3 time Range in all
directions
Search Radii, metres 20 40 60 80
Minimum Number of samples 3 3 3 1
Maximum Number of samples per sector 16 16 16 16
Minimum Number Holes/Channels 2 2 2 1
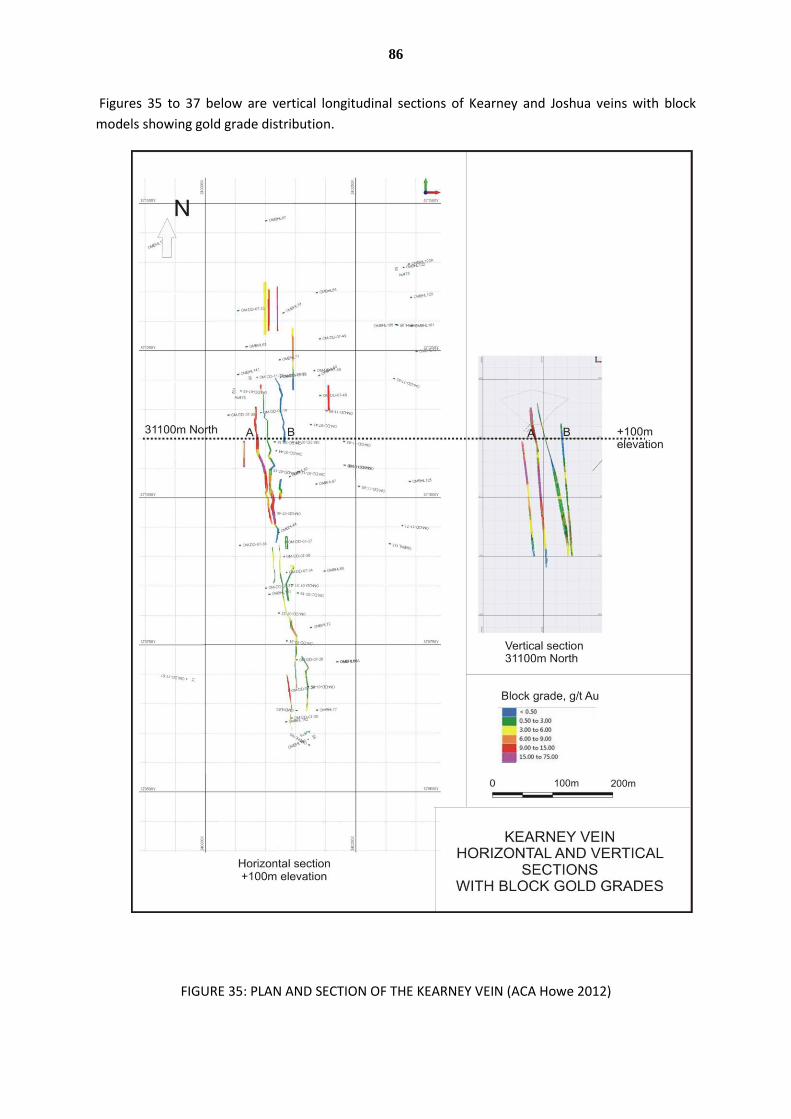
86
Figures 35 to 37 below are vertical longitudinal sections of Kearney and Joshua veins with block
models showing gold grade distribution.
FIGURE 35: PLAN AND SECTION OF THE KEARNEY VEIN (ACA Howe 2012)
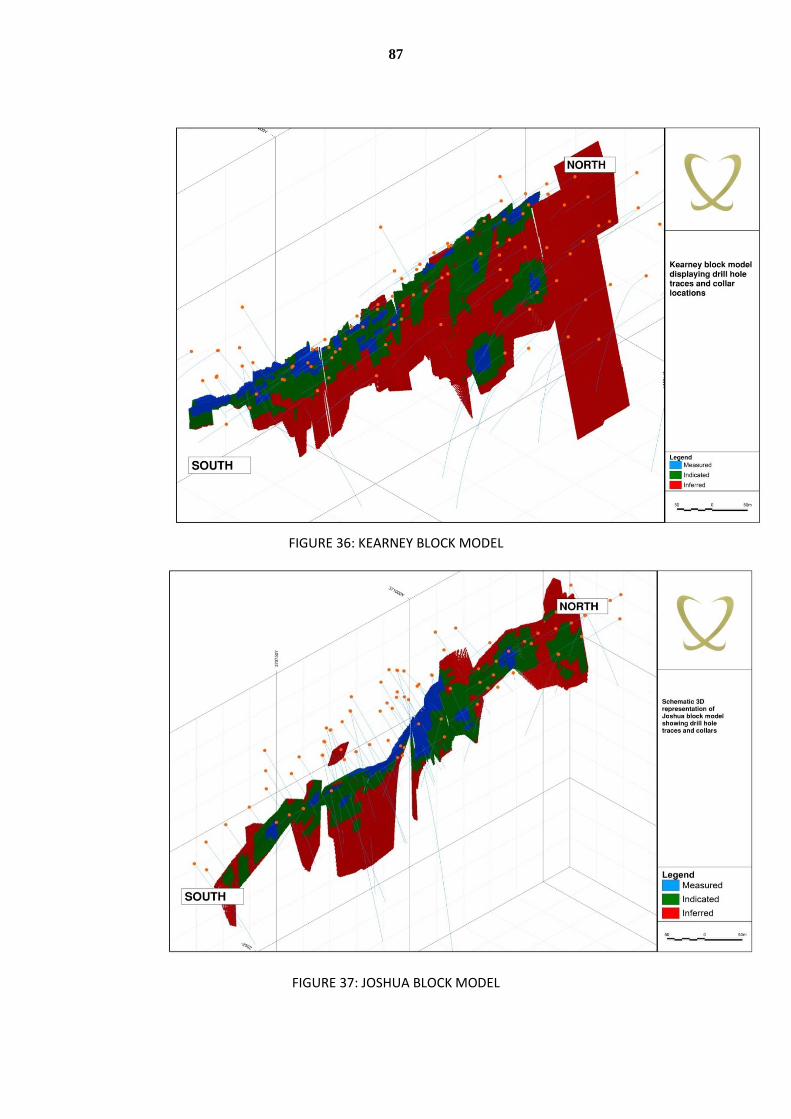
87
FIGURE 36: KEARNEY BLOCK MODEL
FIGURE 37: JOSHUA BLOCK MODEL
88
15.10 RESOURCE CLASSIFICATION
As reported in the ACA Howe 2012 report:
The CIM Definition Standards on Mineral Resources and Mineral Reserves, prepared by the CIM
Standing Committee on Resource Definitions and adopted by the CIM council on December 11, 2005,
provide standards for the classification of Mineral Resources and Mineral Reserve estimates into
various categories. The category to which a resource or reserve estimate is assigned depends on the
level of confidence in the geological information available on the mineral deposit, the quality and
quantity of data available, the level of detail of the technical and economic information which has
been generated about the deposit and the interpretation of that data and information. Under CIM
Definition Standards:
An “Inferred Mineral Resource” is that part of a Mineral Resource for which quantity and grade or quality can be estimated on the basis of geological evidence and limited sampling and reasonably assumed, but not verified, geological or grade continuity. The estimate is based on limited information and sampling gathered through appropriate techniques from locations such as outcrops, trenches, pits, workings and drill holes.
The CIM definition also cautions against using Inferred resources in higher level economic studies and where used in lower level studies , such as Scoping Studies, recommends specific cautionary language. This recommendation is reflected as a prohibition within section 2.3(1)b of NI 43-101.
Under the Pan-European Reporting Code (PERC), the definition of Inferred resources is very similar but permits qualified use of Inferred resources within economic studies and the definition is expanded as follows :- An ‘Inferred Mineral Resource’ is that part of a Mineral Resource for which quantity and grade or quality are estimated on the basis of limited geological evidence and sampling. Geological evidence is sufficient to imply but not verify geological and grade or quality continuity. An Inferred Resource has a lower level of confidence than that applying to an Indicated Mineral Resource and must not be converted to a Mineral Reserve. It is reasonably expected that the majority of Inferred Mineral Resources could be upgraded to Indicated Mineral Resources with continued exploration. Where Inferred Mineral resources are extrapolated beyond any sampled region containing data points, the proportion extrapolated must be described and disclosed. The 'Inferred' category is intended to cover situations where a mineral concentration or occurrence has been identified and limited measurements and sampling have been completed, but where the data are insufficient to allow the geological and/or grade or quality continuity to be confidently interpreted. Due to the uncertainty which may be attached to some Inferred Mineral Resources, it cannot be assumed, but normally would be expected, that a major part of an Inferred Mineral Resource will be upgraded to an Indicated or Measured Mineral Resource as a result of continued exploration. Confidence in the estimate is usually not sufficient to allow the appropriate application of technical and economic parameters or to enable a reliable evaluation of economic viability. For this reason, there is no direct link from an Inferred Resource to any category of Mineral Reserves (see Figure 1). It is accepted that mine design and mine planning may include a proportion of Inferred Mineral Resources. If this category is considered in mine design, planning and/or economic studies, the results of which are publicly reported, full disclosure and the effect on the results of the studies must be stated.
89
Inferred Mineral Resources may only be included in mine design, mine planning, and/or economic studies provided that there exists a mine plan and a statement of Mineral Reserves, which states that Inferred Mineral Resources have been used. Where a material amount of mining in the mine plan includes Inferred Mineral Resources, a comparison of the results with and without these Inferred Mineral Resources must be shown, and the rationale behind their inclusion must be explained. Modifying factors and assumptions that were applied to the Indicated and Measured Mineral Resources to determine the Mineral Reserves must be equally applied to the Inferred Mineral Resources if these are included within a mine plan, but the Inferred resource must nevertheless be reported as such, and not as a reserve. For the avoidance, of doubt, it is reiterated that caution should be exercised if this category is considered in technical and economic studies. At the discretion of the Competent Person, a Company may include all or part of its Inferred Mineral Resource for the purpose of internal planning, scoping or strategic studies. Any such reliance on Inferred Resources should be made clear in the report. In such circumstances, the results are not considered to be sufficiently reliable to ensure that all of the Inferred Mineral Resource will eventually become a Mineral Reserve. Any such reliance on Inferred Resources in a mine plan should be made clear in the report. Inferred Mineral Resources cannot be converted to Mineral Reserves, and must not be stated as part of the Mineral Reserve. Under CIM definition :-
An “Indicated Mineral Resource” is that part of a Mineral Resource for which quantity, grade or quality, densities, shape and physical characteristics can be estimated with a level of confidence sufficient to allow appropriate application of technical and economic parameters, to support mine planning and evaluation of the economic viability of the deposit. The estimate is based on detailed and reliable exploration and testing information gathered through appropriate techniques from locations such as outcrops, trenches, pits, workings and drill holes that are spaced closely enough for geological and grade continuity to be reasonably assumed.
PERC provides a similar definition :-
An Indicated Mineral Resource is that part of a Mineral Resource for which quantity, grade or
quality, densities, shape and physical characteristics are estimated with sufficient confidence to
allow the application of Modifying Factors in sufficient detail to support mine planning and
evaluation of the economic viability of the deposit.
Geological evidence is derived from adequately detailed and reliable exploration, sampling and
testing and is sufficient to assume geological and grade or quality continuity between points of
observation.
An Indicated Mineral Resource has a lower level of confidence than that applying to a Measured
Mineral Resource and may only be converted to a Probable Mineral Reserve.
The Indicated Mineral Resource has sufficient confidence to support generalised mine design, mine
planning, and/or economic studies.
An Indicated Mineral Resource requires that the nature, quality, amount and distribution of data are
such as to allow the Competent Person to confidently interpret the geological framework and to
assume geological continuity of mineralisation, with sampling at a pattern and spacing appropriate
to the geological characteristics and complexity of mineralisation.
90
Confidence in the estimate is sufficient to allow the application of technical and economic
parameters, and to enable an evaluation of economic viability. 'Grade or quality' is to be interpreted
broadly, to include all relevant chemical and mineralogical characteristics.
Under CIM definition :-
A ‘Measured Mineral Resource’ is that part of a Mineral Resource for which quantity, grade or quality, densities, shape, and physical characteristics are so well established that they can be estimated with confidence sufficient to allow the appropriate application of technical and economic parameters, to support production planning and evaluation of the economic viability of the deposit. The estimate is based on detailed and reliable exploration, sampling and testing information gathered through appropriate techniques from locations such as outcrops, trenches, pits, workings and drill holes that are spaced closely enough to confirm both geological and grade continuity.
A similar definition is used in the PERC code :-
A Measured Mineral Resource is that part of a Mineral Resource for which quantity, grade or
quality, densities, shape, and physical characteristics are estimated with confidence sufficient to
allow the application of Modifying Factors to support detailed mine planning and final evaluation
of the economic viability of the deposit. Geological evidence is derived from detailed and reliable
exploration, sampling and testing and is sufficient to confirm geological and grade or quality
continuity between points of observation.
A Measured Mineral Resource has a higher level of confidence than that applying to either an
Indicated Mineral Resource or an Inferred Mineral Resource. It may be converted to a Proved
Mineral Reserve or to a Probable Mineral Reserve.
The occurrence of mineral(s) of economic interest may be classified as a Measured Mineral
Resource when the nature, quality, amount and distribution of data are such as to leave no
reasonable doubt, in the opinion of the Competent Person determining the Mineral Resource, that
the tonnage, mineralogy, and grade or quality can be estimated to within close limits, and that
any variation from the estimate would be unlikely to significantly affect potential economic
viability.
This category requires a high level of confidence in, and understanding of, the geology,
mineralogy, mineability and amenability to processing of the mineral deposit.
Confidence in the estimate is sufficient to allow the appropriate application of technical and
economic parameters and to enable an evaluation of economic viability with a high level of
confidence.
Classification, or assigning a level of confidence to Mineral Resources has been undertaken in strict
adherence to the Pan-European Reporting Code, and follows the procedures described in Micromine
Training V 11.0 Module 22 - Resource Estimation (2011).
Classification of interpolated blocks is undertaken using the following criteria;
91
Interpolation criteria and estimate reliability based on sample density, search and interpolation parameters.
Assessment of the reliability of geological, sample, survey and bulk density data.
Assessment of geological/grade continuity over the various domains at each deposit.
Drilling exploration grid.
The interpolation strategy dictates the classification of blocks to some degree since the parameters
of each interpolation run result in a greater level of confidence in assigned block grade during the
first interpolation runs. Interpolation runs at search radii larger than the defined range, capturing
fewer points from fewer holes or channels results in a lower level of confidence in block grade, even
though the block estimates are reliably calculated from available sample points.
Blocks have been classified as “Measured” if the following criteria are fulfilled:
Blocks captured in the first interpolation run at distances equal to 1/3 of the range in all directions, and;
A minimum of four drill holes or channels must be captured.
These criteria determine that Measured blocks were generated for no more than 20 m vertical depth
below the Joshua, Kearney and Kerr detailed channel sampling. At Kearney, all these resources have
now been mined. At Joshua, Measured resources have been partially depleted, but remaining
resources extend for up to 18 metres below the present surface.
Indicated resources have been classified at the Kearney, Elkins, Joshua and Kerr deposits, which have
all been drill tested both historically and recently on a relatively dense exploration grid (variable
between 20m by 20m to 60m by 60m).
Blocks have been classified as “Indicated” if the following criteria are fulfilled:
Blocks in any domain that have been captured in the first and second interpolation runs at distances up to 2/3 of the range in all directions, and have not been classified as “Measured”.
A minimum of two drill holes or channels must be captured.
Inferred Resources have been classified at all deposits.
Blocks have been classified as “Inferred” if the following criteria are fulfilled:
Blocks in any domain at any deposit that have been captured in any run equal to, or exceeding the range in all directions, and have not been classified as either “Measured” or “Indicated” blocks.
15.11 DENSITY
In January 2008, Galantas undertook a density determination study of different ore types within the
Kearney pit, in order to calculate an average bulk density value for the deposit that could be used to
update the tonnage estimate. Five ore types were identified at the Kearney deposit and other named
veins; primary quartz/sulphide, secondary quartz/sulphide, high sulphide clay gouge, low sulphide
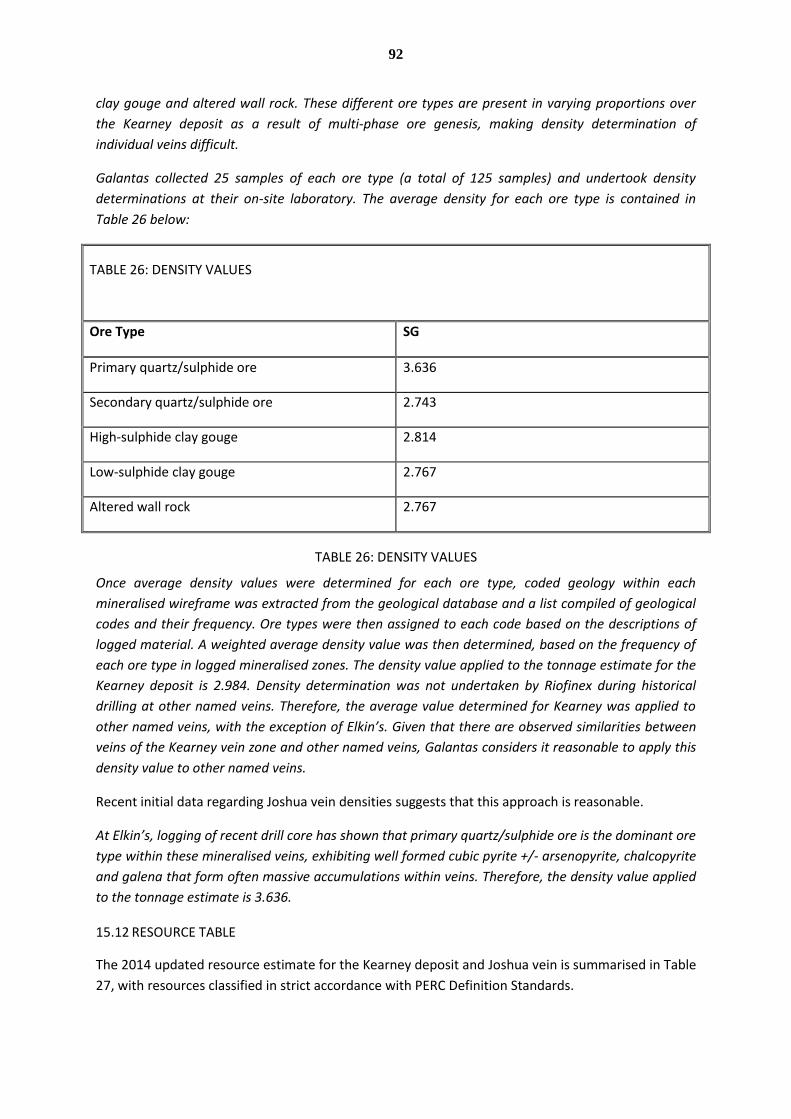
92
clay gouge and altered wall rock. These different ore types are present in varying proportions over
the Kearney deposit as a result of multi-phase ore genesis, making density determination of
individual veins difficult.
Galantas collected 25 samples of each ore type (a total of 125 samples) and undertook density
determinations at their on-site laboratory. The average density for each ore type is contained in
Table 26 below:
TABLE 26: DENSITY VALUES
Ore Type SG
Primary quartz/sulphide ore 3.636
Secondary quartz/sulphide ore 2.743
High-sulphide clay gouge 2.814
Low-sulphide clay gouge 2.767
Altered wall rock 2.767
TABLE 26: DENSITY VALUES
Once average density values were determined for each ore type, coded geology within each
mineralised wireframe was extracted from the geological database and a list compiled of geological
codes and their frequency. Ore types were then assigned to each code based on the descriptions of
logged material. A weighted average density value was then determined, based on the frequency of
each ore type in logged mineralised zones. The density value applied to the tonnage estimate for the
Kearney deposit is 2.984. Density determination was not undertaken by Riofinex during historical
drilling at other named veins. Therefore, the average value determined for Kearney was applied to
other named veins, with the exception of Elkin’s. Given that there are observed similarities between
veins of the Kearney vein zone and other named veins, Galantas considers it reasonable to apply this
density value to other named veins.
Recent initial data regarding Joshua vein densities suggests that this approach is reasonable.
At Elkin’s, logging of recent drill core has shown that primary quartz/sulphide ore is the dominant ore
type within these mineralised veins, exhibiting well formed cubic pyrite +/- arsenopyrite, chalcopyrite
and galena that form often massive accumulations within veins. Therefore, the density value applied
to the tonnage estimate is 3.636.
15.12 RESOURCE TABLE
The 2014 updated resource estimate for the Kearney deposit and Joshua vein is summarised in Table
27, with resources classified in strict accordance with PERC Definition Standards.
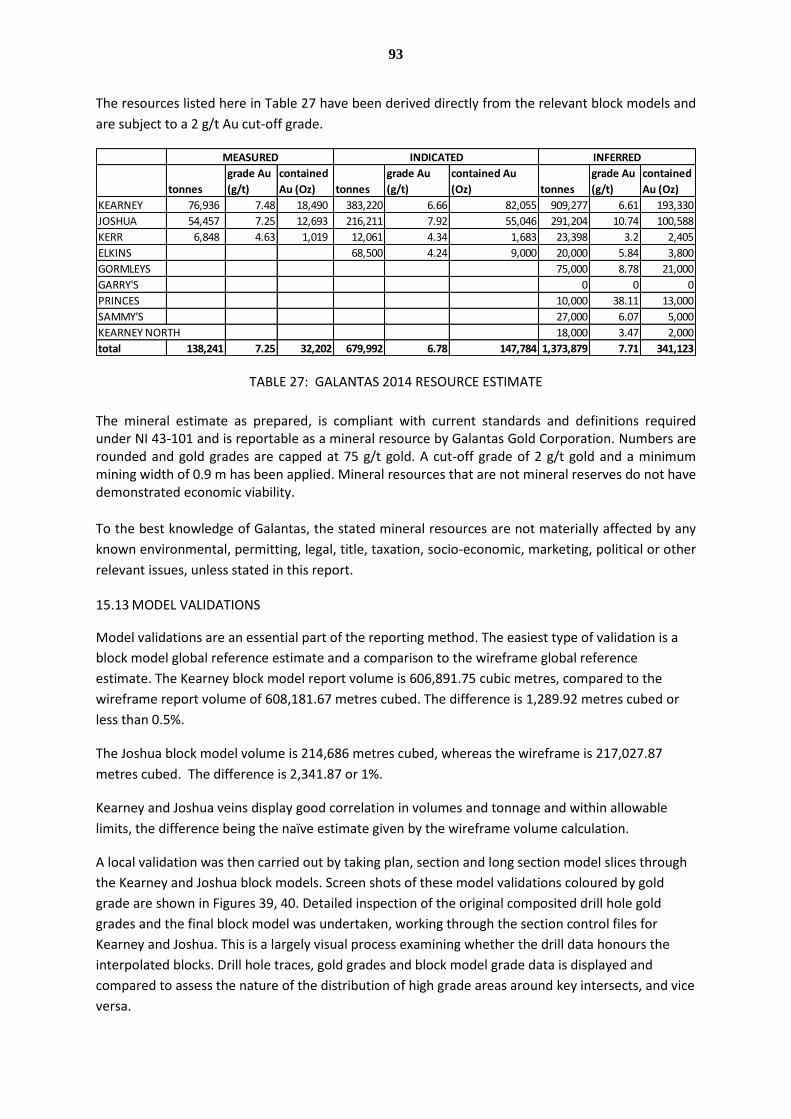
93
The resources listed here in Table 27 have been derived directly from the relevant block models and
are subject to a 2 g/t Au cut-off grade.
TABLE 27: GALANTAS 2014 RESOURCE ESTIMATE
The mineral estimate as prepared, is compliant with current standards and definitions required under NI 43-101 and is reportable as a mineral resource by Galantas Gold Corporation. Numbers are rounded and gold grades are capped at 75 g/t gold. A cut-off grade of 2 g/t gold and a minimum mining width of 0.9 m has been applied. Mineral resources that are not mineral reserves do not have demonstrated economic viability.
To the best knowledge of Galantas, the stated mineral resources are not materially affected by any
known environmental, permitting, legal, title, taxation, socio-economic, marketing, political or other
relevant issues, unless stated in this report.
15.13 MODEL VALIDATIONS
Model validations are an essential part of the reporting method. The easiest type of validation is a
block model global reference estimate and a comparison to the wireframe global reference
estimate. The Kearney block model report volume is 606,891.75 cubic metres, compared to the
wireframe report volume of 608,181.67 metres cubed. The difference is 1,289.92 metres cubed or
less than 0.5%.
The Joshua block model volume is 214,686 metres cubed, whereas the wireframe is 217,027.87
metres cubed. The difference is 2,341.87 or 1%.
Kearney and Joshua veins display good correlation in volumes and tonnage and within allowable
limits, the difference being the naïve estimate given by the wireframe volume calculation.
A local validation was then carried out by taking plan, section and long section model slices through
the Kearney and Joshua block models. Screen shots of these model validations coloured by gold
grade are shown in Figures 39, 40. Detailed inspection of the original composited drill hole gold
grades and the final block model was undertaken, working through the section control files for
Kearney and Joshua. This is a largely visual process examining whether the drill data honours the
interpolated blocks. Drill hole traces, gold grades and block model grade data is displayed and
compared to assess the nature of the distribution of high grade areas around key intersects, and vice
versa.
tonnes
grade Au
(g/t)
contained
Au (Oz) tonnes
grade Au
(g/t)
contained Au
(Oz) tonnes
grade Au
(g/t)
contained
Au (Oz)
KEARNEY 76,936 7.48 18,490 383,220 6.66 82,055 909,277 6.61 193,330
JOSHUA 54,457 7.25 12,693 216,211 7.92 55,046 291,204 10.74 100,588
KERR 6,848 4.63 1,019 12,061 4.34 1,683 23,398 3.2 2,405
ELKINS 68,500 4.24 9,000 20,000 5.84 3,800
GORMLEYS 75,000 8.78 21,000
GARRY'S 0 0 0
PRINCES 10,000 38.11 13,000
SAMMY'S 27,000 6.07 5,000
KEARNEY NORTH 18,000 3.47 2,000
total 138,241 7.25 32,202 679,992 6.78 147,784 1,373,879 7.71 341,123
MEASURED INDICATED INFERRED

94
Figures 38 and 39 show good correlation between composited grades and block limits, controlled by
the direction of drill strings. Some smoothing may be evident on sections where grades are
interpolated into blocks that were not sampled. This is unavoidable despite the estimation methods
used. The blocks in general do show a close correlation to the drill intersects, although some grade
smoothing does occur. It is the view of the author that the block grade values match the composited
grades used to interpolate the blocks. Therefore, the estimated grades in the blocks reliably
represent the original geological data.
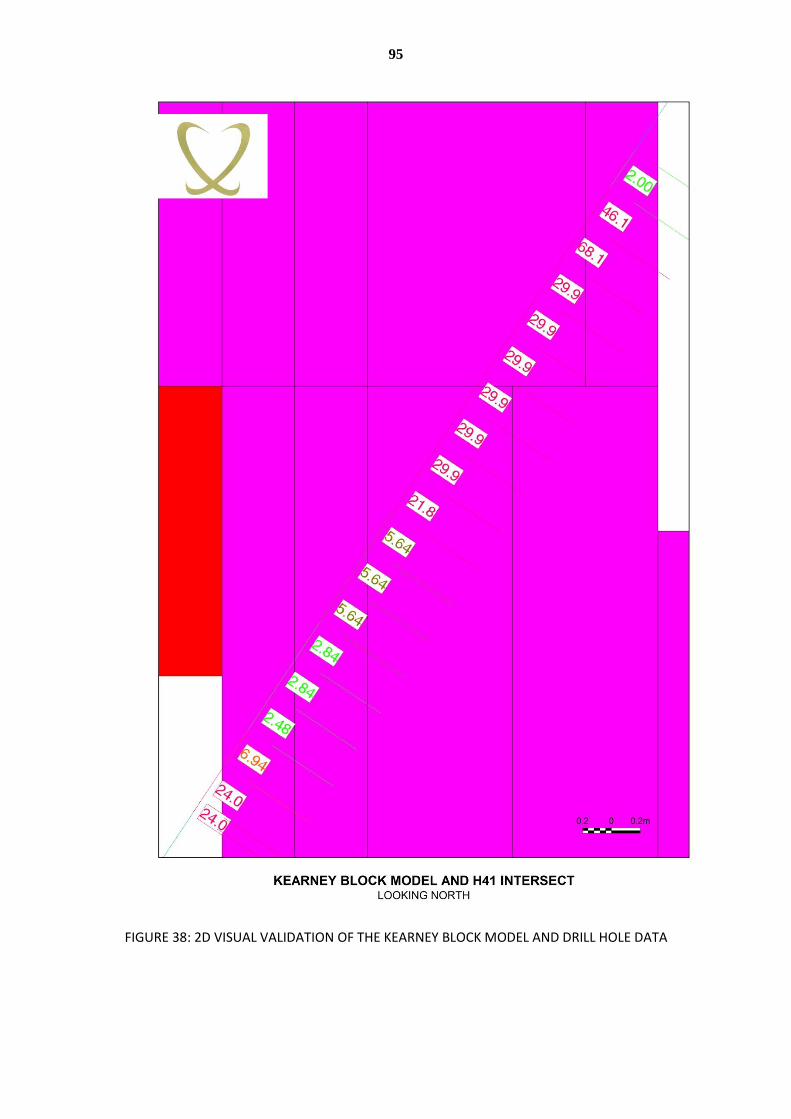
95
FIGURE 38: 2D VISUAL VALIDATION OF THE KEARNEY BLOCK MODEL AND DRILL HOLE DATA
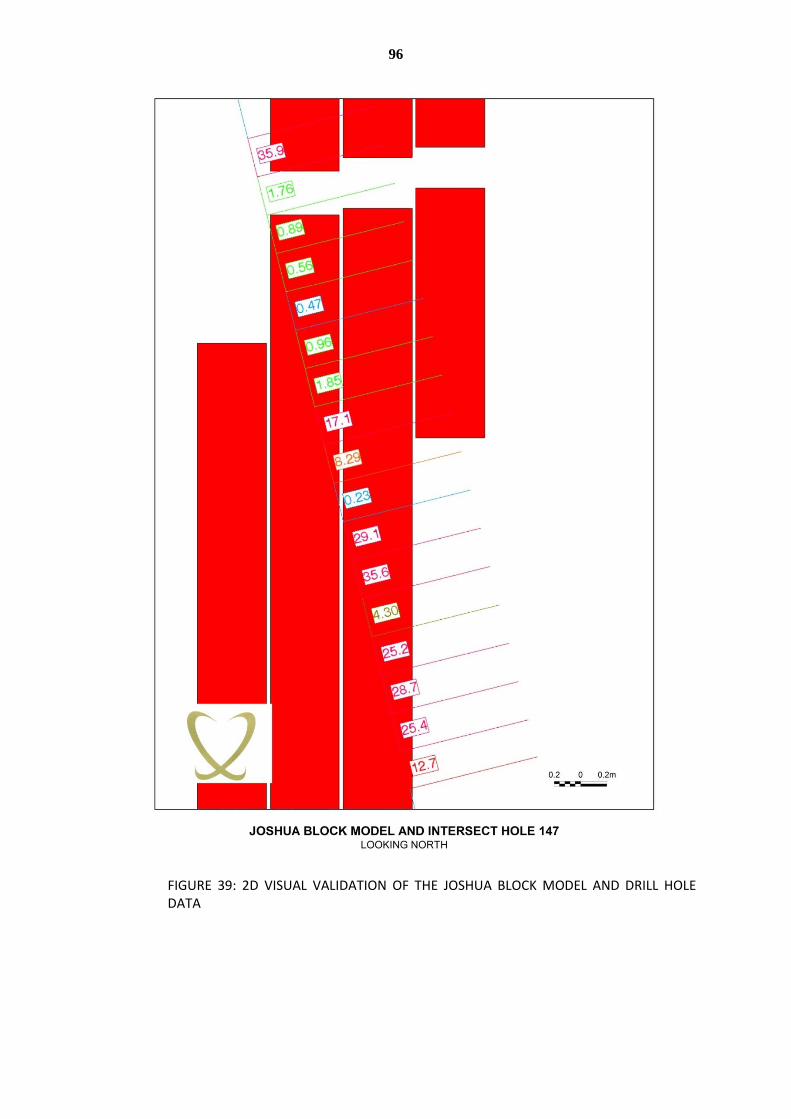
96
FIGURE 39: 2D VISUAL VALIDATION OF THE JOSHUA BLOCK MODEL AND DRILL HOLE DATA
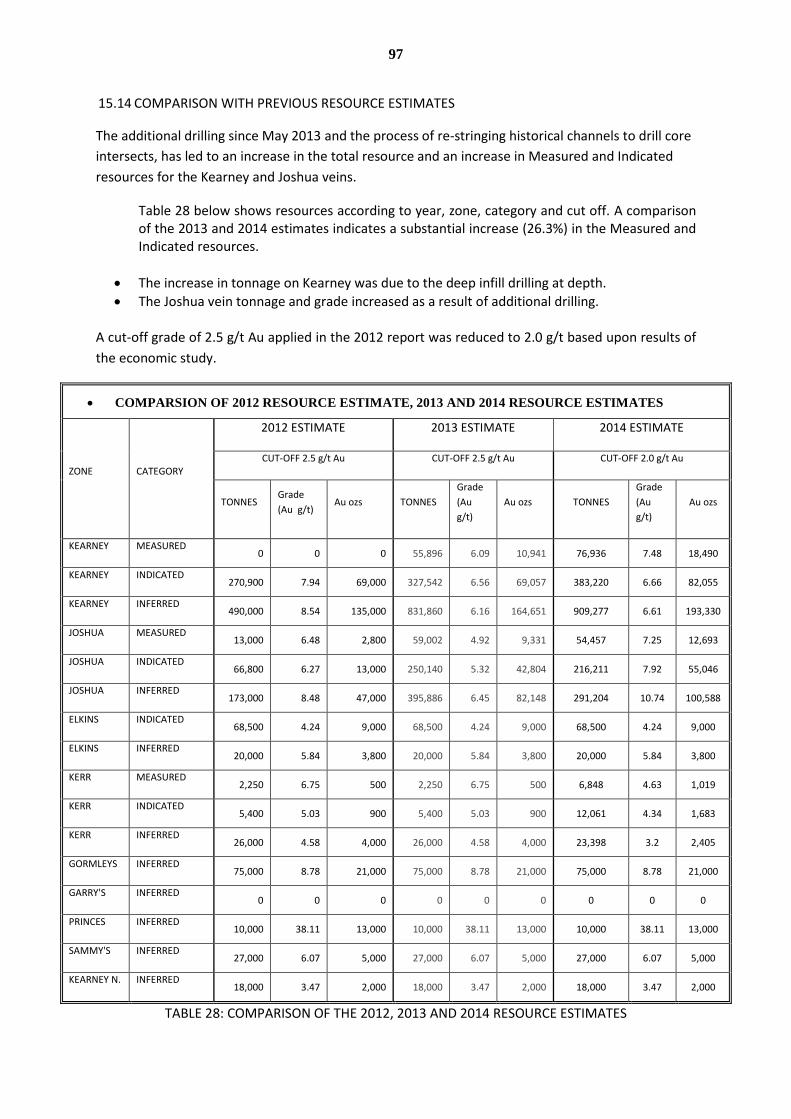
97
15.14 COMPARISON WITH PREVIOUS RESOURCE ESTIMATES
The additional drilling since May 2013 and the process of re-stringing historical channels to drill core
intersects, has led to an increase in the total resource and an increase in Measured and Indicated
resources for the Kearney and Joshua veins.
Table 28 below shows resources according to year, zone, category and cut off. A comparison of the 2013 and 2014 estimates indicates a substantial increase (26.3%) in the Measured and Indicated resources.
The increase in tonnage on Kearney was due to the deep infill drilling at depth.
The Joshua vein tonnage and grade increased as a result of additional drilling.
A cut-off grade of 2.5 g/t Au applied in the 2012 report was reduced to 2.0 g/t based upon results of
the economic study.
COMPARSION OF 2012 RESOURCE ESTIMATE, 2013 AND 2014 RESOURCE ESTIMATES
ZONE CATEGORY
2012 ESTIMATE 2013 ESTIMATE 2014 ESTIMATE
CUT-OFF 2.5 g/t Au CUT-OFF 2.5 g/t Au CUT-OFF 2.0 g/t Au
TONNES Grade
(Au g/t) Au ozs TONNES
Grade
(Au
g/t)
Au ozs TONNES
Grade
(Au
g/t)
Au ozs
KEARNEY MEASURED 0 0 0 55,896 6.09 10,941 76,936 7.48 18,490
KEARNEY INDICATED 270,900 7.94 69,000 327,542 6.56 69,057 383,220 6.66 82,055
KEARNEY INFERRED 490,000 8.54 135,000 831,860 6.16 164,651 909,277 6.61 193,330
JOSHUA MEASURED 13,000 6.48 2,800 59,002 4.92 9,331 54,457 7.25 12,693
JOSHUA INDICATED 66,800 6.27 13,000 250,140 5.32 42,804 216,211 7.92 55,046
JOSHUA INFERRED 173,000 8.48 47,000 395,886 6.45 82,148 291,204 10.74 100,588
ELKINS INDICATED 68,500 4.24 9,000 68,500 4.24 9,000 68,500 4.24 9,000
ELKINS INFERRED 20,000 5.84 3,800 20,000 5.84 3,800 20,000 5.84 3,800
KERR MEASURED 2,250 6.75 500 2,250 6.75 500 6,848 4.63 1,019
KERR INDICATED 5,400 5.03 900 5,400 5.03 900 12,061 4.34 1,683
KERR INFERRED 26,000 4.58 4,000 26,000 4.58 4,000 23,398 3.2 2,405
GORMLEYS INFERRED 75,000 8.78 21,000 75,000 8.78 21,000 75,000 8.78 21,000
GARRY'S INFERRED 0 0 0 0 0 0 0 0 0
PRINCES INFERRED 10,000 38.11 13,000 10,000 38.11 13,000 10,000 38.11 13,000
SAMMY'S INFERRED 27,000 6.07 5,000 27,000 6.07 5,000 27,000 6.07 5,000
KEARNEY N. INFERRED 18,000 3.47 2,000 18,000 3.47 2,000 18,000 3.47 2,000
TABLE 28: COMPARISON OF THE 2012, 2013 AND 2014 RESOURCE ESTIMATES

98
16 MINERAL RESERVE ESTIMATES
Mineral Reserve Estimates are not included in this report, in compliance with NI.43-101
requirements for independence.
Mineral Resource estimates used within the mining study are displayed in the table below (Table
29). This is further discussed in 17.14 – Mining Study and 17.17 – Inclusion of Inferred Resource.
Measured Indicated
Inferred
OREBODY Tonnes Grade Ounces Tonnes Grade Ounces
Tonnes Grade Ounces
KEARNEY 41,485 5.08 6,773 294,021 5.32 50,292
239,364 5.40 41,527
JOSHUA 51,581 4.89 8,112 232,753 5.27 39,450
86,044 6.91 19,109
93,066 4.97 14,886 526,774 5.30 89,742
325,408 5.80 60,635
TABLE 29: MINING STUDY MEASURED, INDICATED & INFERRED RESOURCE ESTIMATES SCHEDULED
Minerals Resources that are not Mineral Reserves do not have demonstrated economic viability.
17 MINING ECONOMIC STUDY
17.1 MINING OVERVIEW
Mining operations will progress from previous open pit mining to future underground mining.
All current surface infrastructure will remain in place and will be upgraded where necessary to meet
the operating parameters. New infrastructure is required to meet the specific needs of servicing an
underground mine.
The economic veins of the deposit will be extracted using a combination of Sublevel Longhole
Stoping and Shrinkage Stoping mining methods. Paste backfill will be utilized to maximize extraction
whilst increasing stability and will reduce the surface footprint required for tailings disposal.
Initial underground mining will concentrate on the Kearney and Joshua veins that form the majority
of the resource and reserves. Both areas will be accessed from a reinforced concrete adit that will be
constructed in the existing Kearney pit, leading to the main underground decline.
The main decline will branch to provide access to the ore bodies. Cross Cut accesses will link the
decline to the economic veins at 18m and 36m vertical intervals for Longhole and Shrinkage stopes
respectively. Sill drives will be mined providing initial ore production whilst further delineating the
veins.
The Joshua and Kearney ore bodies consist of multiple parallel veins of strike lengths of up to 850m.
Average width is reported as 1.5m with a planned mining width of 0.9m, although this can be
reduced to 0.75m over short distances. Sill drives will run in parallel and under strict geotechnical
parameters.
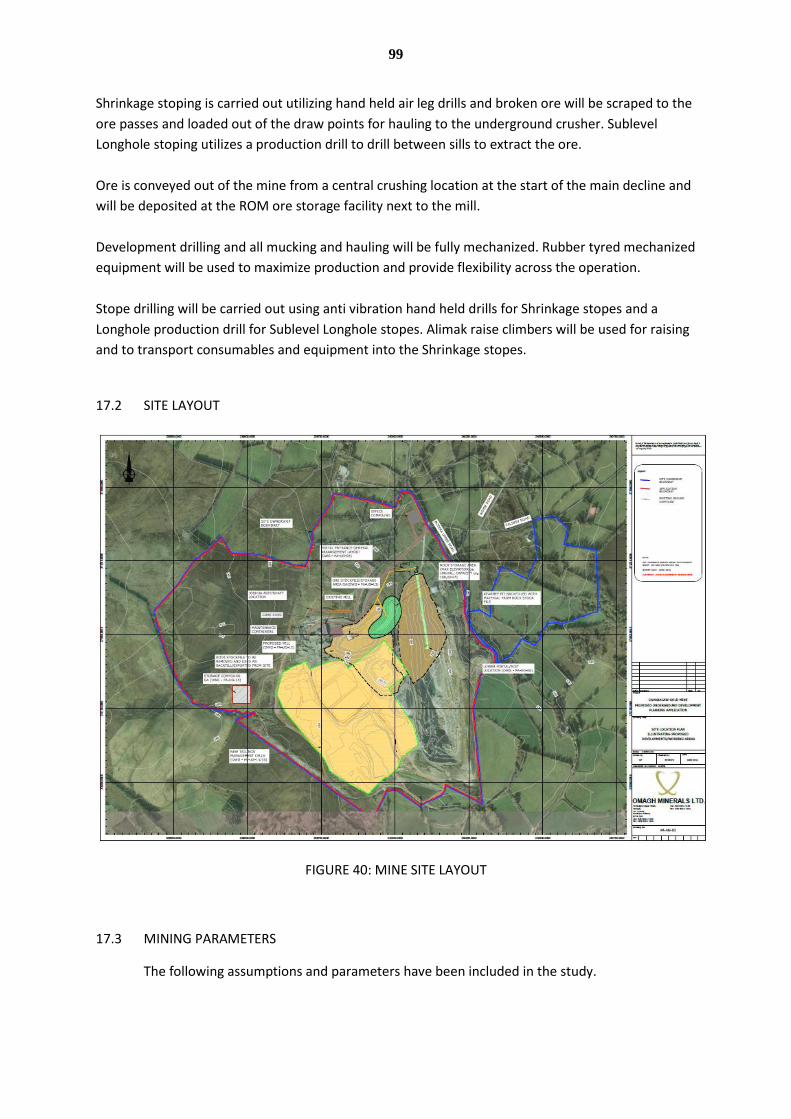
99
Shrinkage stoping is carried out utilizing hand held air leg drills and broken ore will be scraped to the
ore passes and loaded out of the draw points for hauling to the underground crusher. Sublevel
Longhole stoping utilizes a production drill to drill between sills to extract the ore.
Ore is conveyed out of the mine from a central crushing location at the start of the main decline and
will be deposited at the ROM ore storage facility next to the mill.
Development drilling and all mucking and hauling will be fully mechanized. Rubber tyred mechanized
equipment will be used to maximize production and provide flexibility across the operation.
Stope drilling will be carried out using anti vibration hand held drills for Shrinkage stopes and a
Longhole production drill for Sublevel Longhole stopes. Alimak raise climbers will be used for raising
and to transport consumables and equipment into the Shrinkage stopes.
17.2 SITE LAYOUT
FIGURE 40: MINE SITE LAYOUT
17.3 MINING PARAMETERS
The following assumptions and parameters have been included in the study.

100
Mine design, mining methods and mining equipment has been selected to produce 30,000 -
40,000 Au ounces per annum.
Mine production should ramp to 1250 tpd at full production.
Underground mining crews operate on three 8 hour shifts over 5 days per week.
Mine designs and strategies adhere to UK Mining Legislation and Health and Safety Laws.
Underground mine to be accessed via a reinforced concrete adit. This will be located in the
existing Kearney pit and allows backfilling of the existing excavation.
Installation of an underground crusher and conveyor system to haul ore and waste to the
surface stockpiles.
Development dimensions and profiles are as small as possible to minimise the amount of
waste generated.
Split face firing of ore development drives should be considered to maximise grade and
reduce additional dilution.
Capital works should be fit for purpose but minimised as much as possible to reduce pre-
production expenditure.
Early cash flow is required so mining schedule should reflect this by prioritising ore and
ramping up to full production as quickly as possible.
17.4 ADIT INSTALLATION
A steel re-enforced concrete adit will be constructed in the existing Kearney pit. This will form the
entrance from the surface to the underground mine. The Kearney pit will then be backfilled with
development waste, stockpiled surface waste and retreated tails, burying the adit and allowing the
surface to be rehabilitated.
17.4.1 KEARNEY PIT REHABILITATION
Rehabilitation work is required in the Kearney pit to stabilise the western wall prior to the
commencement of the construction works for the adit, lower portal and underground development.
The lower portal is a box structure that will be constructed in the same manner as the adit and will
be the point at which the underground development enters virgin rock.
The Kearney pit requires approximately 150,000m3 or 300,000t of waste fill to establish the floor for
the ramp. This includes a 15% compaction factor. The ramp, which will form the floor of the adit will
be graded to 1:-6 or 16.7%.
Once this floor has been established, ground support works will be required along the western wall.
An area of 2000m2 will be meshed and bolted to reduce the risk of rock fall before equipment and
personnel commence work on the lower portal and adit.
Ground support consists of double twisted hexagonal PVC costed mesh pinned to the face of the
wall using 1.8m resin grouted bolts. This provides additional support to the face as well as securing
the surface support.
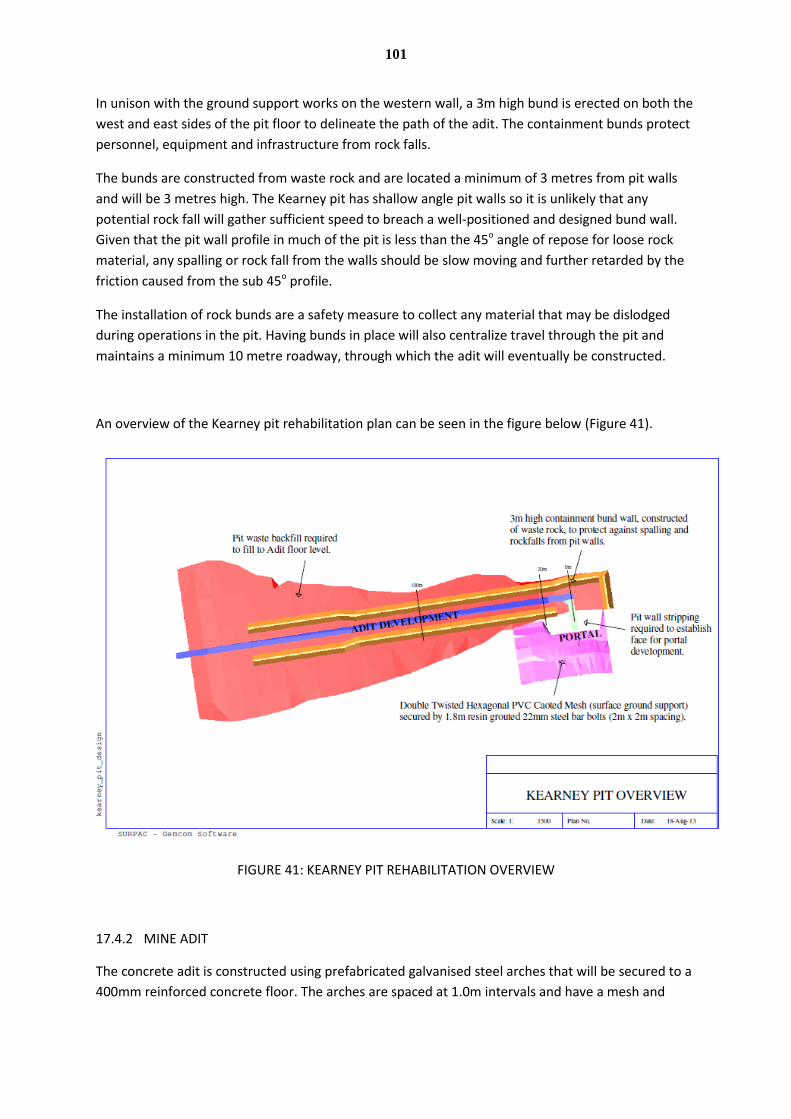
101
In unison with the ground support works on the western wall, a 3m high bund is erected on both the
west and east sides of the pit floor to delineate the path of the adit. The containment bunds protect
personnel, equipment and infrastructure from rock falls.
The bunds are constructed from waste rock and are located a minimum of 3 metres from pit walls
and will be 3 metres high. The Kearney pit has shallow angle pit walls so it is unlikely that any
potential rock fall will gather sufficient speed to breach a well-positioned and designed bund wall.
Given that the pit wall profile in much of the pit is less than the 45o angle of repose for loose rock
material, any spalling or rock fall from the walls should be slow moving and further retarded by the
friction caused from the sub 45o profile.
The installation of rock bunds are a safety measure to collect any material that may be dislodged
during operations in the pit. Having bunds in place will also centralize travel through the pit and
maintains a minimum 10 metre roadway, through which the adit will eventually be constructed.
An overview of the Kearney pit rehabilitation plan can be seen in the figure below (Figure 41).
FIGURE 41: KEARNEY PIT REHABILITATION OVERVIEW
17.4.2 MINE ADIT
The concrete adit is constructed using prefabricated galvanised steel arches that will be secured to a
400mm reinforced concrete floor. The arches are spaced at 1.0m intervals and have a mesh and
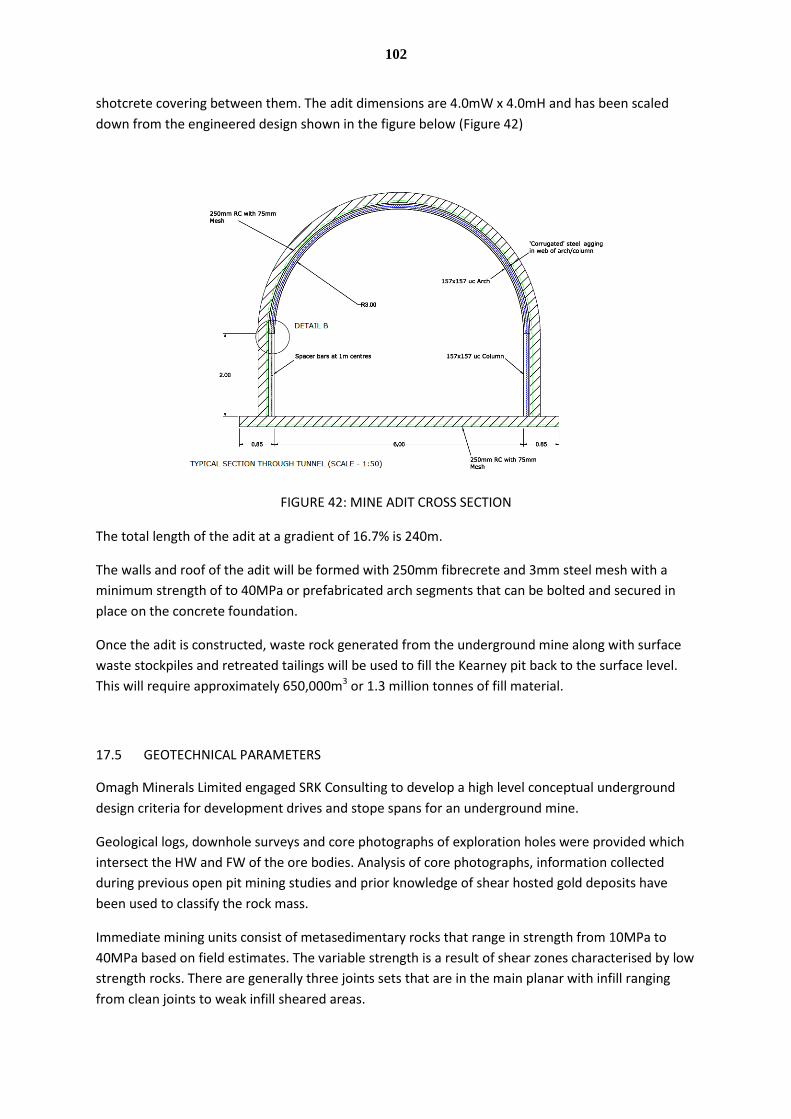
102
shotcrete covering between them. The adit dimensions are 4.0mW x 4.0mH and has been scaled
down from the engineered design shown in the figure below (Figure 42)
FIGURE 42: MINE ADIT CROSS SECTION
The total length of the adit at a gradient of 16.7% is 240m.
The walls and roof of the adit will be formed with 250mm fibrecrete and 3mm steel mesh with a
minimum strength of to 40MPa or prefabricated arch segments that can be bolted and secured in
place on the concrete foundation.
Once the adit is constructed, waste rock generated from the underground mine along with surface
waste stockpiles and retreated tailings will be used to fill the Kearney pit back to the surface level.
This will require approximately 650,000m3 or 1.3 million tonnes of fill material.
17.5 GEOTECHNICAL PARAMETERS
Omagh Minerals Limited engaged SRK Consulting to develop a high level conceptual underground
design criteria for development drives and stope spans for an underground mine.
Geological logs, downhole surveys and core photographs of exploration holes were provided which
intersect the HW and FW of the ore bodies. Analysis of core photographs, information collected
during previous open pit mining studies and prior knowledge of shear hosted gold deposits have
been used to classify the rock mass.
Immediate mining units consist of metasedimentary rocks that range in strength from 10MPa to
40MPa based on field estimates. The variable strength is a result of shear zones characterised by low
strength rocks. There are generally three joints sets that are in the main planar with infill ranging
from clean joints to weak infill sheared areas.
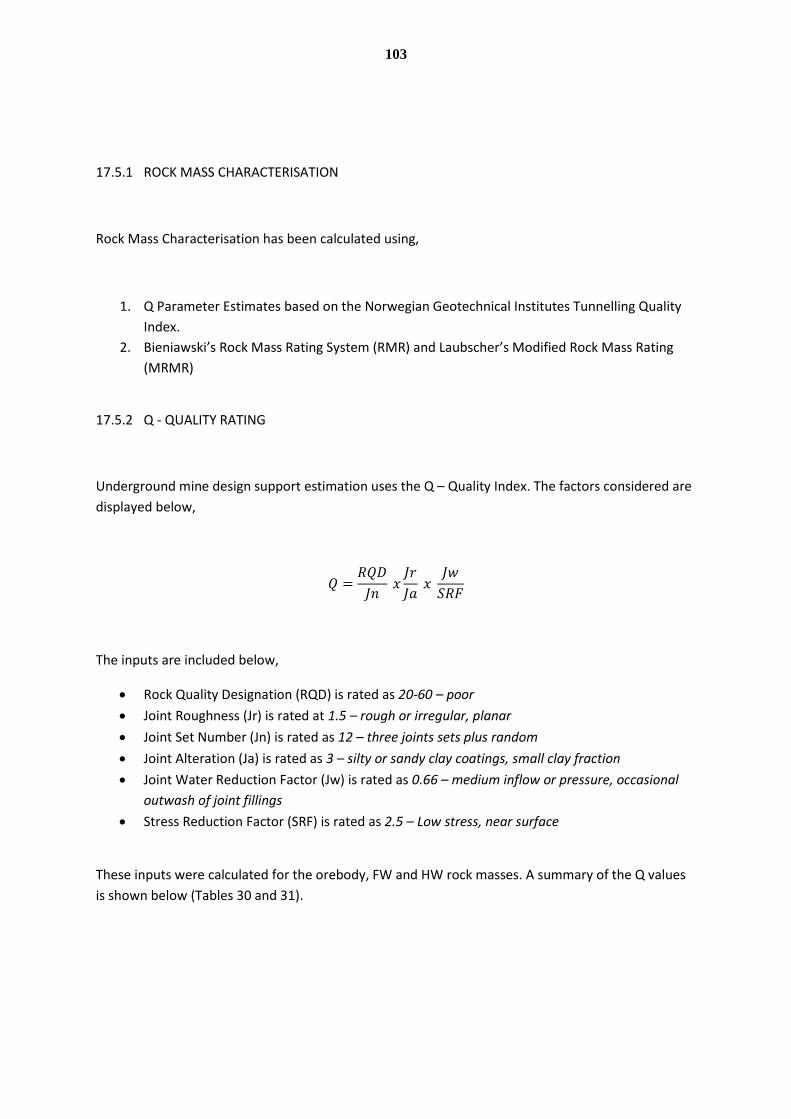
103
17.5.1 ROCK MASS CHARACTERISATION
Rock Mass Characterisation has been calculated using,
1. Q Parameter Estimates based on the Norwegian Geotechnical Institutes Tunnelling Quality
Index.
2. Bieniawski’s Rock Mass Rating System (RMR) and Laubscher’s Modified Rock Mass Rating
(MRMR)
17.5.2 Q - QUALITY RATING
Underground mine design support estimation uses the Q – Quality Index. The factors considered are
displayed below,
The inputs are included below,
Rock Quality Designation (RQD) is rated as 20-60 – poor
Joint Roughness (Jr) is rated at 1.5 – rough or irregular, planar
Joint Set Number (Jn) is rated as 12 – three joints sets plus random
Joint Alteration (Ja) is rated as 3 – silty or sandy clay coatings, small clay fraction
Joint Water Reduction Factor (Jw) is rated as 0.66 – medium inflow or pressure, occasional
outwash of joint fillings
Stress Reduction Factor (SRF) is rated as 2.5 – Low stress, near surface
These inputs were calculated for the orebody, FW and HW rock masses. A summary of the Q values
is shown below (Tables 30 and 31).
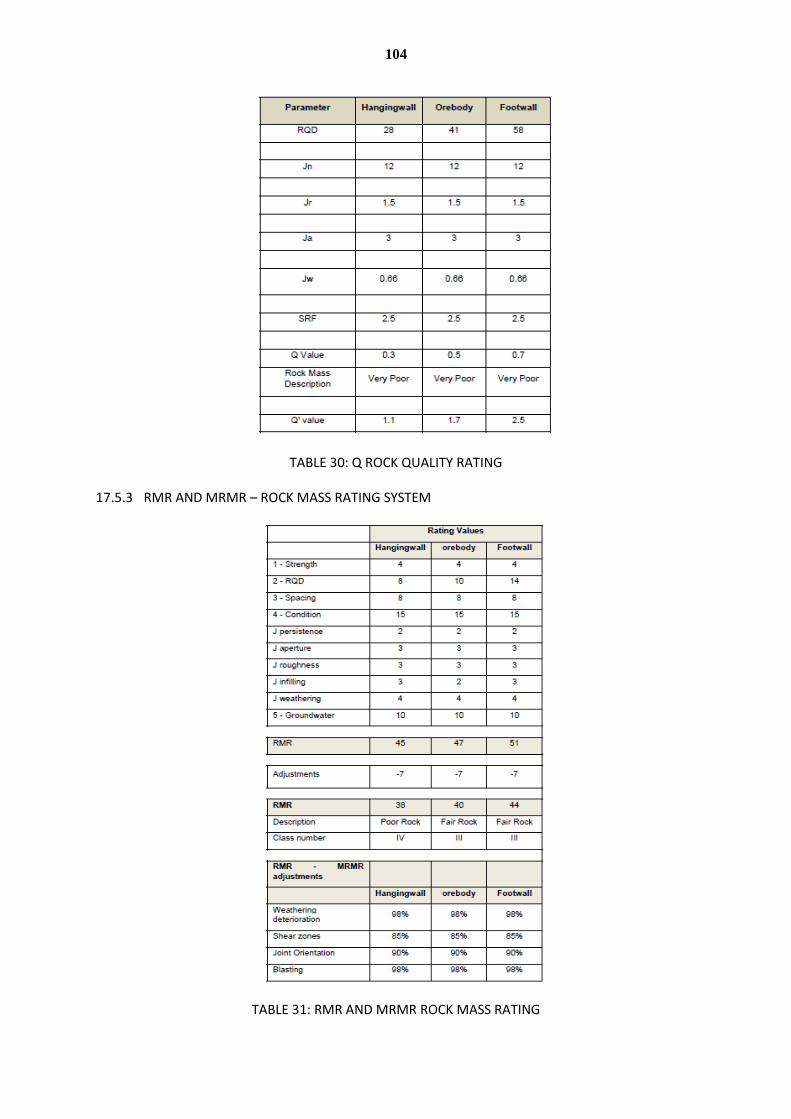
104
TABLE 30: Q ROCK QUALITY RATING
17.5.3 RMR AND MRMR – ROCK MASS RATING SYSTEM
TABLE 31: RMR AND MRMR ROCK MASS RATING
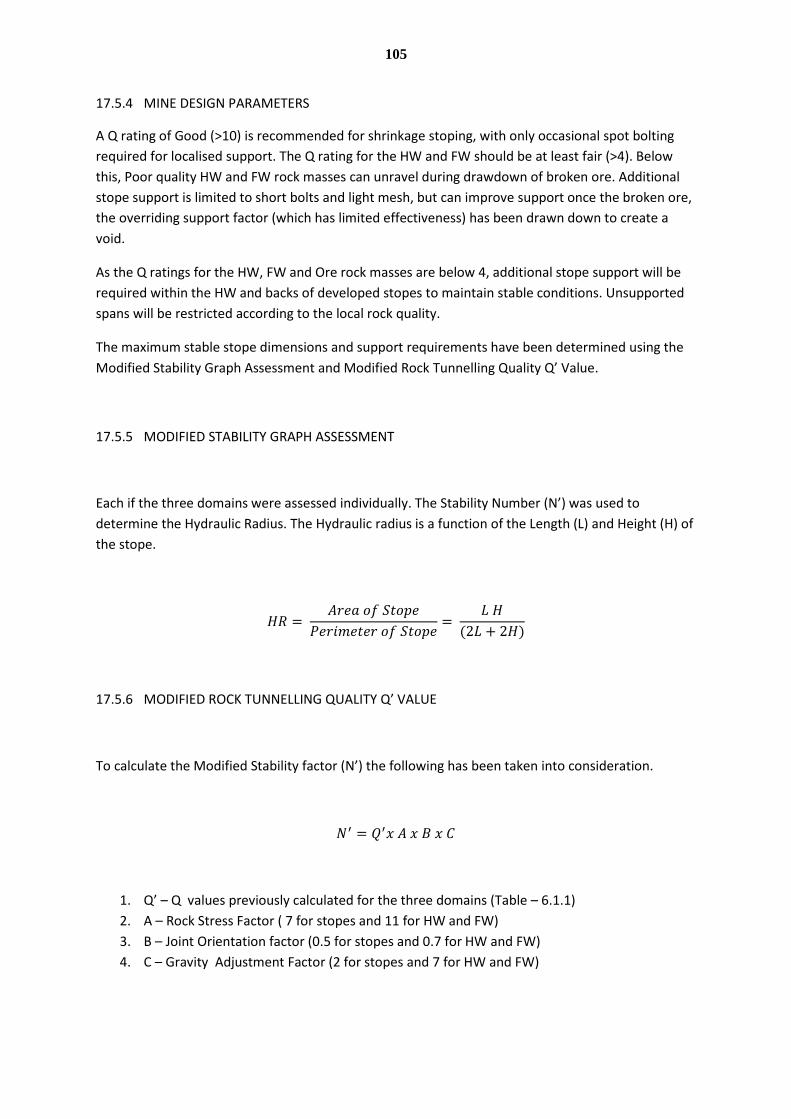
105
17.5.4 MINE DESIGN PARAMETERS
A Q rating of Good (>10) is recommended for shrinkage stoping, with only occasional spot bolting
required for localised support. The Q rating for the HW and FW should be at least fair (>4). Below
this, Poor quality HW and FW rock masses can unravel during drawdown of broken ore. Additional
stope support is limited to short bolts and light mesh, but can improve support once the broken ore,
the overriding support factor (which has limited effectiveness) has been drawn down to create a
void.
As the Q ratings for the HW, FW and Ore rock masses are below 4, additional stope support will be
required within the HW and backs of developed stopes to maintain stable conditions. Unsupported
spans will be restricted according to the local rock quality.
The maximum stable stope dimensions and support requirements have been determined using the
Modified Stability Graph Assessment and Modified Rock Tunnelling Quality Q’ Value.
17.5.5 MODIFIED STABILITY GRAPH ASSESSMENT
Each if the three domains were assessed individually. The Stability Number (N’) was used to
determine the Hydraulic Radius. The Hydraulic radius is a function of the Length (L) and Height (H) of
the stope.
17.5.6 MODIFIED ROCK TUNNELLING QUALITY Q’ VALUE
To calculate the Modified Stability factor (N’) the following has been taken into consideration.
1. Q’ – Q values previously calculated for the three domains (Table – 6.1.1)
2. A – Rock Stress Factor ( 7 for stopes and 11 for HW and FW)
3. B – Joint Orientation factor (0.5 for stopes and 0.7 for HW and FW)
4. C – Gravity Adjustment Factor (2 for stopes and 7 for HW and FW)
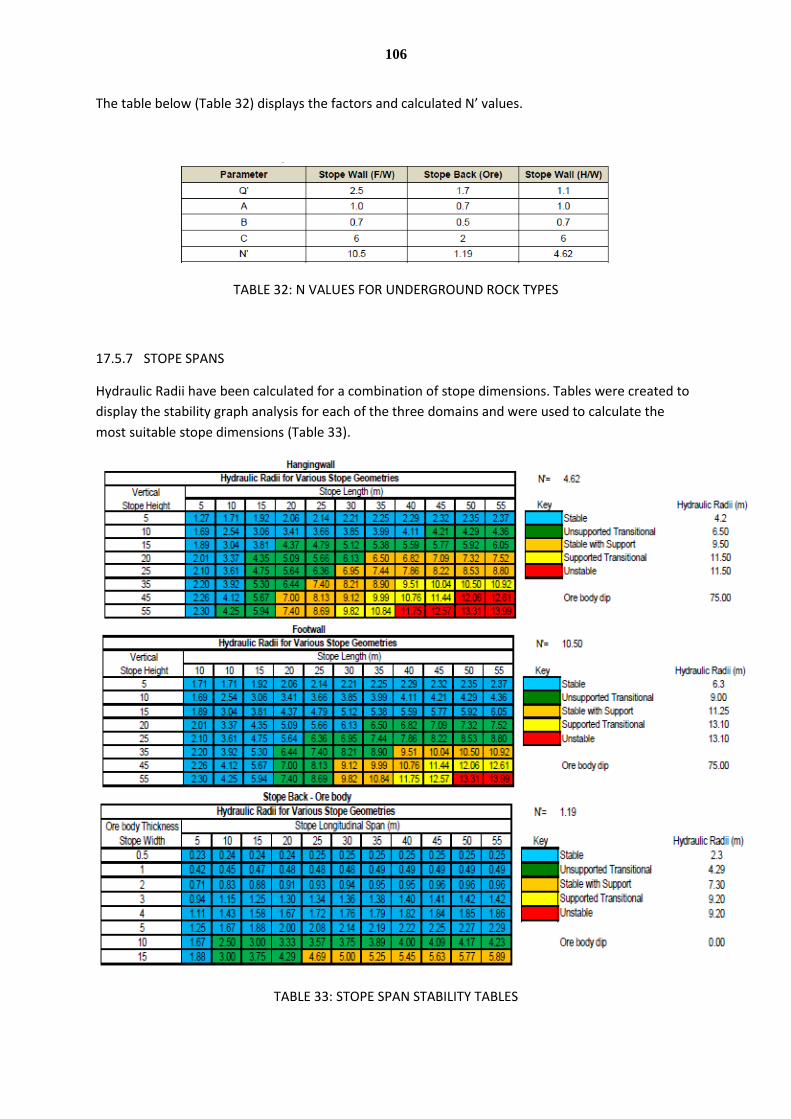
106
The table below (Table 32) displays the factors and calculated N’ values.
TABLE 32: N VALUES FOR UNDERGROUND ROCK TYPES
17.5.7 STOPE SPANS
Hydraulic Radii have been calculated for a combination of stope dimensions. Tables were created to
display the stability graph analysis for each of the three domains and were used to calculate the
most suitable stope dimensions (Table 33).
TABLE 33: STOPE SPAN STABILITY TABLES

107
Stope dimensions selected are 30m strike length and up to 35m in height between levels. The
maximum width is 3m for the purposes of this calculation. A stope with dimensions 30mL x 35mH x
3mW has the following classification by domain,
Stope Back – Stable (0.94)
HW – Stable with Support (8.21)
FW – Transitionally Unsupported (8.21)
The calculated requirement is for HW support only. However to reduce risk and further improve
safety, ground support will be installed in all three domains. This will further reduce the likelihood of
ground failure.
17.5.8 DEVELOPMENT
The main access decline, along will all capital development and infrastructure will be located in the
FW. From the Q Value analysis in 17.5.2 the FW domain has a higher Q rating but is still classed as
very poor. Ground support in the three domains will be tailored to the conditions encountered.
All development will be reduced to the minimum practical dimensions for the mining method used.
This is further discussed in Section 17.6.3 – Development Ground Support.
17.6 UNDERGROUND MINE LATERAL DEVELOPMENT
Underground lateral development will be completed using single boom jumbo mounted drills and
explosives.
17.6.1 LATERAL DEVELOPMENT ASSUMPTIONS
The assumptions used for Lateral Development calculations are listed in Table 34 and display the
two most common development profiles which account for 75% of the planned total development.
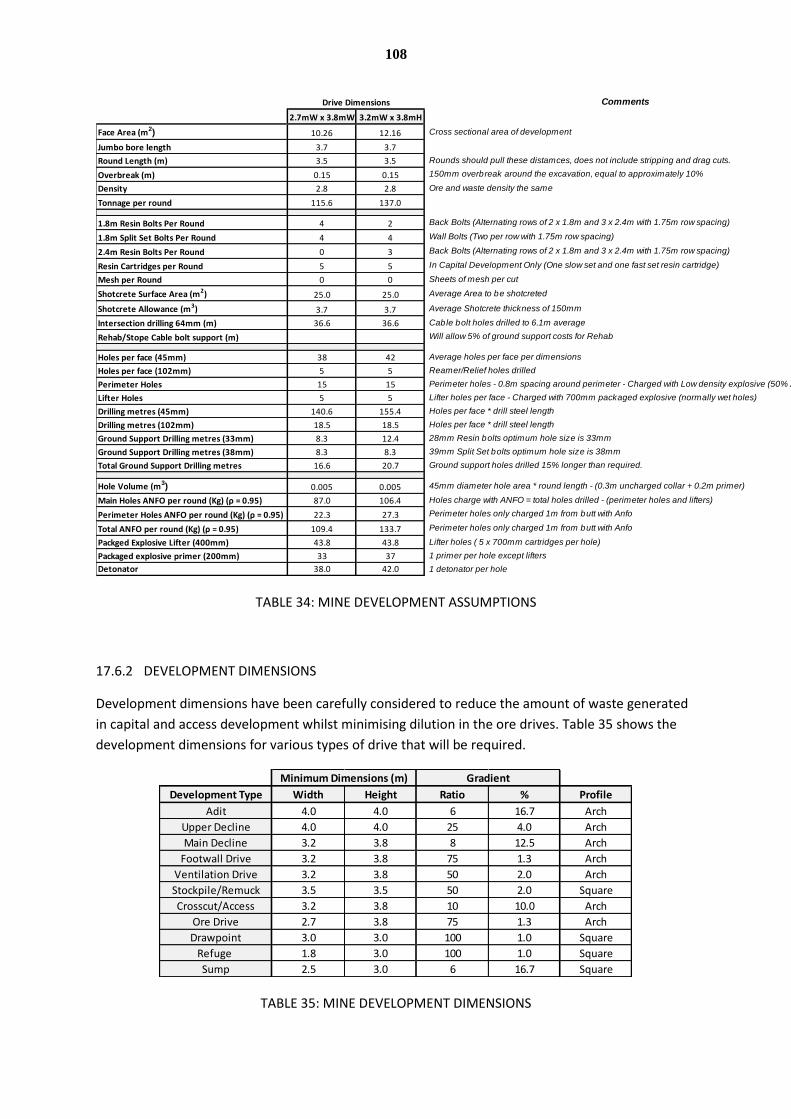
108
TABLE 34: MINE DEVELOPMENT ASSUMPTIONS
17.6.2 DEVELOPMENT DIMENSIONS
Development dimensions have been carefully considered to reduce the amount of waste generated
in capital and access development whilst minimising dilution in the ore drives. Table 35 shows the
development dimensions for various types of drive that will be required.
TABLE 35: MINE DEVELOPMENT DIMENSIONS
2.7mW x 3.8mW 3.2mW x 3.8mH
Face Area (m2) 10.26 12.16
Jumbo bore length 3.7 3.7
Round Length (m) 3.5 3.5
Overbreak (m) 0.15 0.15
Density 2.8 2.8
Tonnage per round 115.6 137.0
1.8m Resin Bolts Per Round 4 2
1.8m Split Set Bolts Per Round 4 4
2.4m Resin Bolts Per Round 0 3
Resin Cartridges per Round 5 5
Mesh per Round 0 0
Shotcrete Surface Area (m2) 25.0 25.0
Shotcrete Allowance (m3) 3.7 3.7
Intersection drilling 64mm (m) 36.6 36.6
Rehab/Stope Cable bolt support (m)
Holes per face (45mm) 38 42
Holes per face (102mm) 5 5
Perimeter Holes 15 15
Lifter Holes 5 5
Drilling metres (45mm) 140.6 155.4
Drilling metres (102mm) 18.5 18.5
Ground Support Drilling metres (33mm) 8.3 12.4
Ground Support Drilling metres (38mm) 8.3 8.3
Total Ground Support Drilling metres 16.6 20.7
Hole Volume (m3) 0.005 0.005
Main Holes ANFO per round (Kg) (ρ = 0.95) 87.0 106.4
Perimeter Holes ANFO per round (Kg) (ρ = 0.95) 22.3 27.3
Total ANFO per round (Kg) (ρ = 0.95) 109.4 133.7
Packged Explosive Lifter (400mm) 43.8 43.8
Packaged explosive primer (200mm) 33 37
Detonator 38.0 42.0
Perimeter holes - 0.8m spacing around perimeter - Charged with Low density explosive (50% ANFO)
Lifter holes per face - Charged with 700mm packaged explosive (normally wet holes)
Holes per face * drill steel length
Holes per face * drill steel length
45mm diameter hole area * round length - (0.3m uncharged collar + 0.2m primer)
Perimeter holes only charged 1m from butt with Anfo
Holes charge with ANFO = total holes drilled - (perimeter holes and lifters)
Perimeter holes only charged 1m from butt with Anfo
Lifter holes ( 5 x 700mm cartridges per hole)
1 primer per hole except lifters
1 detonator per hole
28mm Resin bolts optimum hole size is 33mm
39mm Split Set bolts optimum hole size is 38mm
Reamer/Relief holes drilled
Back Bolts (Alternating rows of 2 x 1.8m and 3 x 2.4m with 1.75m row spacing)
Back Bolts (Alternating rows of 2 x 1.8m and 3 x 2.4m with 1.75m row spacing)
Sheets of mesh per cut
Ground support holes drilled 15% longer than required.
Average Area to be shotcreted
Average Shotcrete thickness of 150mm
Cable bolt holes drilled to 6.1m average
Will allow 5% of ground support costs for Rehab
Average holes per face per dimensions
In Capital Development Only (One slow set and one fast set resin cartridge)
Wall Bolts (Two per row with 1.75m row spacing)
Drive Dimensions
Rounds should pull these distamces, does not include stripping and drag cuts.
150mm overbreak around the excavation, equal to approximately 10%
Ore and waste density the same
Comments
Cross sectional area of development
Development Type Width Height Ratio % Profile
Adit 4.0 4.0 6 16.7 Arch
Upper Decline 4.0 4.0 25 4.0 Arch
Main Decline 3.2 3.8 8 12.5 Arch
Footwall Drive 3.2 3.8 75 1.3 Arch
Ventilation Drive 3.2 3.8 50 2.0 Arch
Stockpile/Remuck 3.5 3.5 50 2.0 Square
Crosscut/Access 3.2 3.8 10 10.0 Arch
Ore Drive 2.7 3.8 75 1.3 Arch
Drawpoint 3.0 3.0 100 1.0 Square
Refuge 1.8 3.0 100 1.0 Square
Sump 2.5 3.0 6 16.7 Square
GradientMinimum Dimensions (m)

109
17.6.3 DEVELOPMENT GROUND SUPPORT
Development ground support will involve the use of the following recognised support techniques.
Fibrecrete
Galvanised Steel Friction Bolts (1.0m and 1.8m lengths)
Galvanised Steel Resin Grouted Bolts (1.8m and 2.4m lengths)
Galvanised Steel Welded Wire Mesh
The minimum standard for ‘supported ground’ in the underground mine combines surface support
reinforced with bolts. Therefore the ground will be deemed ‘unsupported’ if it does not have either
of the following:
Galvanised Steel Welded Wire Mesh secured with either Friction or Resin Bolts, or
Fibrecrete secured with either Friction or Resin Bolts.
The following table (Table 36) has been produced to reflect the anticipated ground support
requirements for the mine based on similar ground conditions and dimensions experienced in other
operating mines around the world.
TABLE 36: DEVELOPMENT GROUND SUPPORT REQUIREMENTS
17.6.4 RESIN GROUTED BOLTS
Resin grouted bolts are installed by inserting a fast setting resin cartridge into a drill hole and driving
a bolt through it. Once the resin mixes and sets to form an anchor at the toe of the hole the bolt can
be tensioned to increase its load bearing capacity. When coupled with a slow setting resin the bolt
can achieve much higher load bearing capacity.
The resin bolts selected will be installed with a fast set resin anchor at the toe of the hole which
allows the bolt to be almost immediately tensioned. A slower setting resin will be used in the
remainder of the hole which allows the bolt to be fully encapsulated and bond to the surface for
greater support and as such work particularly well in weaker rock types.
Development Type Width Height 2.4m Resin 1.8m Resin 1.8m Friction Depth (mm) (m3)
Upper Decline 4.0 4.0 3 2 4 150 4.5
Main Decline 3.2 3.8 3 2 4 150 3.7
Footwall Drive 3.2 3.8 3 2 4 150 3.7
Ventilation Drive 3.2 3.8 3 2 4 150 3.7
Stockpile/Remuck 3.5 3.5 3 2 4 150 4.7
Crosscut/Access 3.2 3.8 3 2 4 150 3.7
Ore Drive 2.7 3.8 0 0 8 75 1.9
Drawpoint 3.0 3.0 0 0 8 75 1.8
Refuge 1.8 3.0 0 0 0 150 4.0
Sump 2.5 3.5 0 4 4 75 1.7
Bolt Requirements Per 3.5m Round FibrecreteMin Dimensions (m)
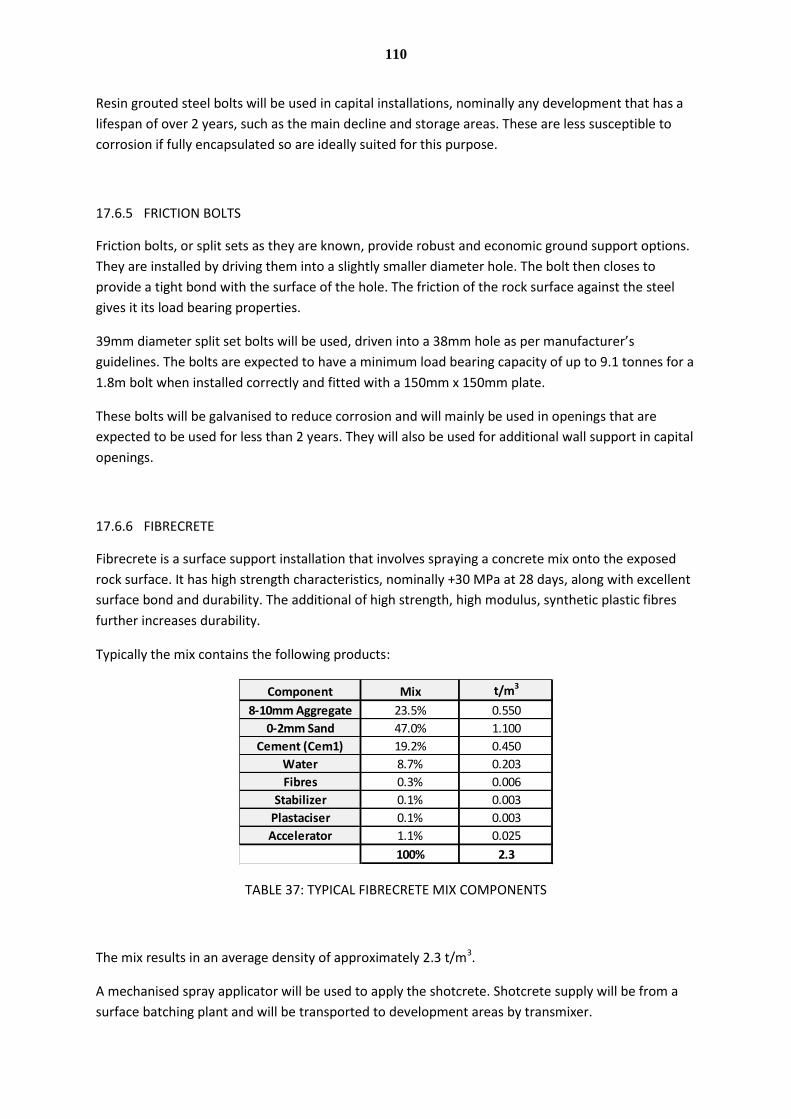
110
Resin grouted steel bolts will be used in capital installations, nominally any development that has a
lifespan of over 2 years, such as the main decline and storage areas. These are less susceptible to
corrosion if fully encapsulated so are ideally suited for this purpose.
17.6.5 FRICTION BOLTS
Friction bolts, or split sets as they are known, provide robust and economic ground support options.
They are installed by driving them into a slightly smaller diameter hole. The bolt then closes to
provide a tight bond with the surface of the hole. The friction of the rock surface against the steel
gives it its load bearing properties.
39mm diameter split set bolts will be used, driven into a 38mm hole as per manufacturer’s
guidelines. The bolts are expected to have a minimum load bearing capacity of up to 9.1 tonnes for a
1.8m bolt when installed correctly and fitted with a 150mm x 150mm plate.
These bolts will be galvanised to reduce corrosion and will mainly be used in openings that are
expected to be used for less than 2 years. They will also be used for additional wall support in capital
openings.
17.6.6 FIBRECRETE
Fibrecrete is a surface support installation that involves spraying a concrete mix onto the exposed
rock surface. It has high strength characteristics, nominally +30 MPa at 28 days, along with excellent
surface bond and durability. The additional of high strength, high modulus, synthetic plastic fibres
further increases durability.
Typically the mix contains the following products:
TABLE 37: TYPICAL FIBRECRETE MIX COMPONENTS
The mix results in an average density of approximately 2.3 t/m3.
A mechanised spray applicator will be used to apply the shotcrete. Shotcrete supply will be from a
surface batching plant and will be transported to development areas by transmixer.
Component Mix t/m3
8-10mm Aggregate 23.5% 0.550
0-2mm Sand 47.0% 1.100
Cement (Cem1) 19.2% 0.450
Water 8.7% 0.203
Fibres 0.3% 0.006
Stabilizer 0.1% 0.003
Plastaciser 0.1% 0.003
Accelerator 1.1% 0.025
100% 2.3
111
17.6.7 WELDED MESH
Welded mesh will be used in addition to Fibrecrete in areas that need additional surface support. It
will also be used for a contingency in times of fibrecrete supply disruption.
Areas of high heavy vehicle traffic, such as cross cut intersections and loading bays, may require
additional support or rehabilitation.
17.6.8 GROUND SUPPORT MANAGEMENT PLAN
A comprehensive Ground Support Management Plan (GCMP) will be considered prior to
commencement of mining operations. A GCMP is a detailed document, reviewed annually, which
outlines the various types of ground support used at the mine. It should be compiled by a qualified
Geotechnical Engineer and use empirical data to recommend the most effective types and patterns
of ground support for any given conditions encountered in the mine.
The GCMP can then be used as a reference document for all employees and supervisors so there is a
clear standard to be adhered too.
17.6.9 DEVELOPMENT DRILLING
Development drilling is completed using a single boom jumbo mounted drill rig, such as the Atlas
Copco T1D Boomer. Faces are drilled using a combination of 45mm blast holes and 102mm relief or
reamer holes.
The number of holes required per face range depending on the development dimensions but is
limited to a maximum burden and spacing of 1.0m. Perimeter holes have a reduced burden of 0.8m.
17.6.10 DEVELOPMENT CHARGING
Development charging is completed using a charging platform. The platform is coupled to an
interchangeable utility vehicle.
The charging platform consists of an operator basket, 350kg capacity ANFO kettle and pressure
regulator assembly. It allows ANFO to be air driven into the blast holes resulting in a density of
approximately 0.95kg/m3. Exploration drilling results indicate dry ground conditions so emulsion and
wet application explosives have been discounted at this stage.
Development powder factors range between 1.0 to 1.2 Kg/t.
ANFO charged holes are initiated using a high explosive emulsion cartridge coupled with a half
second delay detonator. This allows sequential blasting and is expected to reduce peak particle
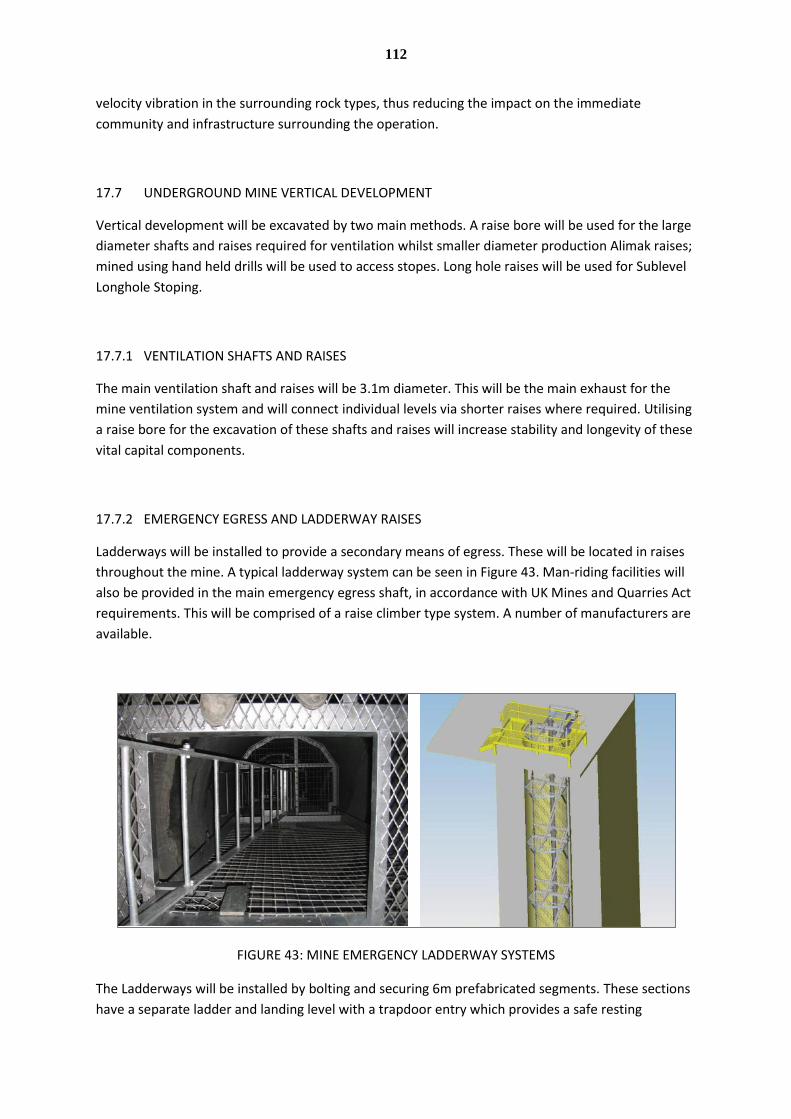
112
velocity vibration in the surrounding rock types, thus reducing the impact on the immediate
community and infrastructure surrounding the operation.
17.7 UNDERGROUND MINE VERTICAL DEVELOPMENT
Vertical development will be excavated by two main methods. A raise bore will be used for the large
diameter shafts and raises required for ventilation whilst smaller diameter production Alimak raises;
mined using hand held drills will be used to access stopes. Long hole raises will be used for Sublevel
Longhole Stoping.
17.7.1 VENTILATION SHAFTS AND RAISES
The main ventilation shaft and raises will be 3.1m diameter. This will be the main exhaust for the
mine ventilation system and will connect individual levels via shorter raises where required. Utilising
a raise bore for the excavation of these shafts and raises will increase stability and longevity of these
vital capital components.
17.7.2 EMERGENCY EGRESS AND LADDERWAY RAISES
Ladderways will be installed to provide a secondary means of egress. These will be located in raises
throughout the mine. A typical ladderway system can be seen in Figure 43. Man-riding facilities will
also be provided in the main emergency egress shaft, in accordance with UK Mines and Quarries Act
requirements. This will be comprised of a raise climber type system. A number of manufacturers are
available.
FIGURE 43: MINE EMERGENCY LADDERWAY SYSTEMS
The Ladderways will be installed by bolting and securing 6m prefabricated segments. These sections
have a separate ladder and landing level with a trapdoor entry which provides a safe resting

113
platform. Ladderway arrangements such as in Figure 43 (Left) will be used and will require
installation in a raise bored at a maximum of 70o to reduce the effort required to climb. This
arrangement allows installation in smaller diameter raises.
The Ladderways shown above in Figure 43 (Right) allow for installation in vertical raises due to the
ladder inclination of 60-70o within the segment.
The Ladderways are installed quickly and provide instant egress. They are inexpensive to maintain
and allow simultaneous evacuation for multiple personnel with minimal resistance and disruption to
air flows.
17.7.3 MAN WAYS AND ORE PASSES
Manways will be hand mined using air leg drills. These will be located at either end of a stoping block
and will be compartmentalised using timber to allow a ladder in one side and ore to pass in the
other. These will be 1.0m-1.2m square profile and will be drilled and blasted.
17.7.4 STOPING RAISES
A central raise will be located in each of the Shrinkage Stoping blocks and will be used for access to
the stoping round via an Alimak raise climber (Figure 44). These raises will be 1.5m square profile
and will allow vertical transport of men, equipment and consumables used in the stoping cycle.
FIGURE 44: ALIMAK RAISE CLIMBER
Longhole raises will be drilled to open slots for Sublevel Longhole Stopes. The Sublevel Longhole
Stope raises will be drilled using a production drill with 64-76mm blast holes and 102-152mm relief
holes.

114
17.8 UNDERGROUND MOBILE EQUIPMENT
Underground mobile equipment has been selected to operate safely within the development
dimensions specified in Section 17.6.2 whilst adhering to legislative requirements. Equipment has
also been selected to meet the production profile of the mine.
The mobile equipment requirements, along with delivery schedule, are displayed in Table 38.
TABLE 38: MOBILE MINING EQUIPMENT REQUIREMENTS
During Q1 of Year 1, equipment is ordered with current lead times of up to 12 weeks. The
equipment is required for commencement of mining operations in Q2, when surface works and
rehabilitation of the Kearney pit is completed.
17.9 VENTILATION
Ventilation requirements will change throughout the LOM. The primary system to be installed is
designed to satisfy the highest demand period during peak production of 225,000 tpa.
During initial development, fresh air from the surface will be ducted to the working face using an
110kW axial ventilation fan. Fumes will exhaust via the main decline and portal. This will provide
sufficient volume and flow to allow the initial decline development to progress up to 2km using low
loss ventilation duct.
Once the development reaches the 1105 RL, a 35m vent raise (1.5m diameter) will be raise bored to
assist the exhaust network. This can be fitted with a ladder & raise climber to provide an alternate
means of egress for the upper section of the mine.
Ventilation flows will be measured periodically to ensure that all working areas meet the legislative
requirements. Dust exposure and air contaminants will be internally and independently measured to
ensure compliance to prescribed HSE legislation.
Q1 Q2 Q3 Q4 Q1 Q2 Q3 Q4 Q1 Q2 Q3 Q4
Single Boom Jumbo Drill 1 1 1 1 4
Loader - 2m3 1 1 1 3
Truck- 8.5m3 1 1 2
Agitator Truck- 4.5m3 1 1
Explosive Charging Platform 1 1
Fibrecrete Spraymec 1 1
Utility Loader 1 1 2
Light Vehicles 2 3 5
YEAR 1 YEAR 2 YEAR 3TOTALMobile Equipment
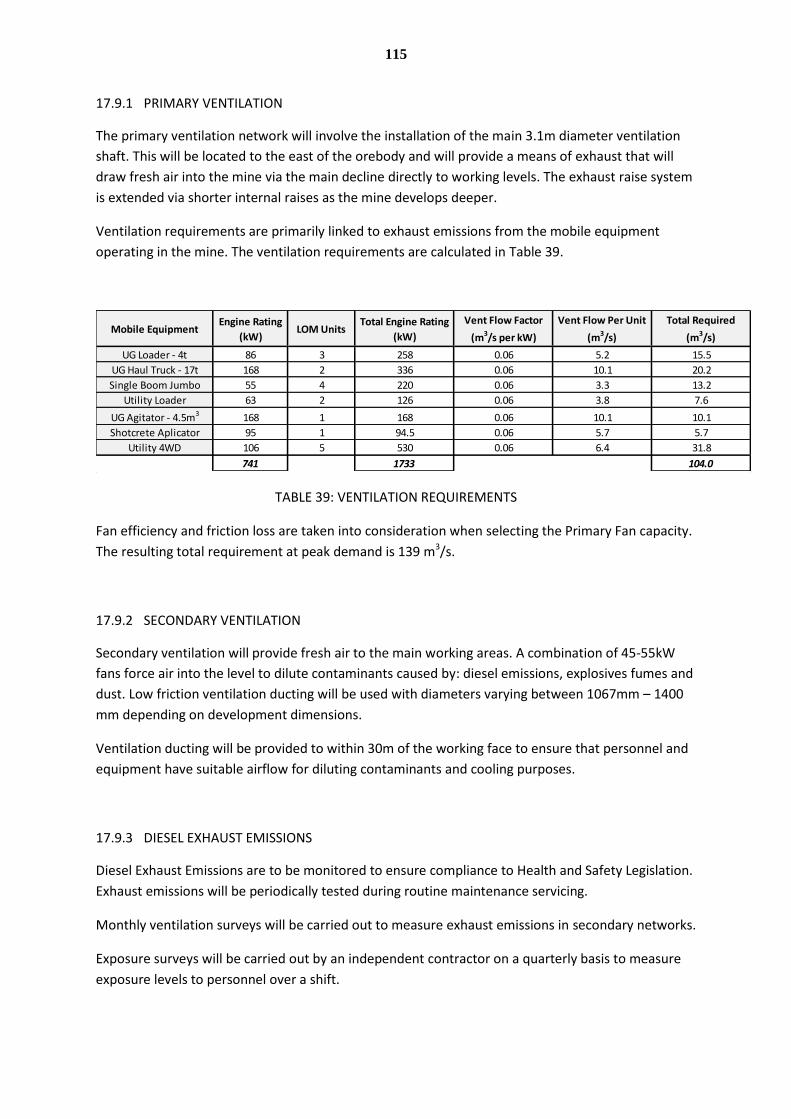
115
17.9.1 PRIMARY VENTILATION
The primary ventilation network will involve the installation of the main 3.1m diameter ventilation
shaft. This will be located to the east of the orebody and will provide a means of exhaust that will
draw fresh air into the mine via the main decline directly to working levels. The exhaust raise system
is extended via shorter internal raises as the mine develops deeper.
Ventilation requirements are primarily linked to exhaust emissions from the mobile equipment
operating in the mine. The ventilation requirements are calculated in Table 39.
TABLE 39: VENTILATION REQUIREMENTS
Fan efficiency and friction loss are taken into consideration when selecting the Primary Fan capacity.
The resulting total requirement at peak demand is 139 m3/s.
17.9.2 SECONDARY VENTILATION
Secondary ventilation will provide fresh air to the main working areas. A combination of 45-55kW
fans force air into the level to dilute contaminants caused by: diesel emissions, explosives fumes and
dust. Low friction ventilation ducting will be used with diameters varying between 1067mm – 1400
mm depending on development dimensions.
Ventilation ducting will be provided to within 30m of the working face to ensure that personnel and
equipment have suitable airflow for diluting contaminants and cooling purposes.
17.9.3 DIESEL EXHAUST EMISSIONS
Diesel Exhaust Emissions are to be monitored to ensure compliance to Health and Safety Legislation.
Exhaust emissions will be periodically tested during routine maintenance servicing.
Monthly ventilation surveys will be carried out to measure exhaust emissions in secondary networks.
Exposure surveys will be carried out by an independent contractor on a quarterly basis to measure
exposure levels to personnel over a shift.
Mobile EquipmentEngine Rating
(kW)LOM Units
Total Engine Rating
(kW)
Vent Flow Factor
(m3/s per kW)
Vent Flow Per Unit
(m3/s)
Total Required
(m3/s)
UG Loader - 4t 86 3 258 0.06 5.2 15.5
UG Haul Truck - 17t 168 2 336 0.06 10.1 20.2
Single Boom Jumbo 55 4 220 0.06 3.3 13.2
Utility Loader 63 2 126 0.06 3.8 7.6
UG Agitator - 4.5m3 168 1 168 0.06 10.1 10.1
Shotcrete Aplicator 95 1 94.5 0.06 5.7 5.7
Utility 4WD 106 5 530 0.06 6.4 31.8
741 1733 104.0
116
17.9.4 DUST
Dust is generated during mining activity. Key areas of dust generation are drilling, blasting, mucking,
crushing and conveying.
All drilling is wet to supress dust generation. Once blasted, development muck piles and drives are
watered to supress dust during subsequent movement of the material. Sprays are installed at stope
draw points whilst mucking and crushing and conveying will utilise fog sprays at transfer points.
Dust exposure is also to be independently monitored on a quarterly basis along with the diesel
exhaust emissions.
17.9.5 EXPLOSIVE FUMES
Explosive fumes will be diluted through primary and secondary ventilation flows. Standard clearance
times allow for fumes to clear and hand held monitors will be used during re-entry to the area to
monitor air quality.
17.10 STOPING
A range of mining methods were considered during the feasibility process. The two most suitable
methods to be considered for implementation are Shrinkage Stoping and Sub Level Longhole
Stoping. Both methods of ore extraction are to be used depending on the geometry of the ore veins.
The stopes once mined, will be back filled using development waste rock or a cemented paste
comprising of tailings that have been stockpiled from past mining activity. Both stoping methods will
be modernised to minimise traditional safety risks whilst maximising production.
Mine development will consist of a main decline mined in the FW of the orebody that will be used to
access the ore body via short crosscuts into the veins. Sill levels will be spaced at 18m intervals
which will allow 36m shrinkage stopes and Longhole stopes of up to 15m.
17.10.1 SUBLEVEL LONGHOLE STOPING (SLS)
Sublevel Longhole Stoping is the preferred mining method for ore extraction. SLS will be fully
mechanised to optimise safe production of ore. The sublevel benches will be determined by ground
conditions and could vary locally from 6.9-14.2m in length.
Due to limited geotechnical information on the various ore bodies and individual veins, the
Feasibility study has reduced all SLS heights to 10.7m.
Bench heights can be varied by increasing or decreasing the development for the stope to include
flat backing and floor benching. The development required to extract the veins in this fashion have
been included in the Feasibility Study design.
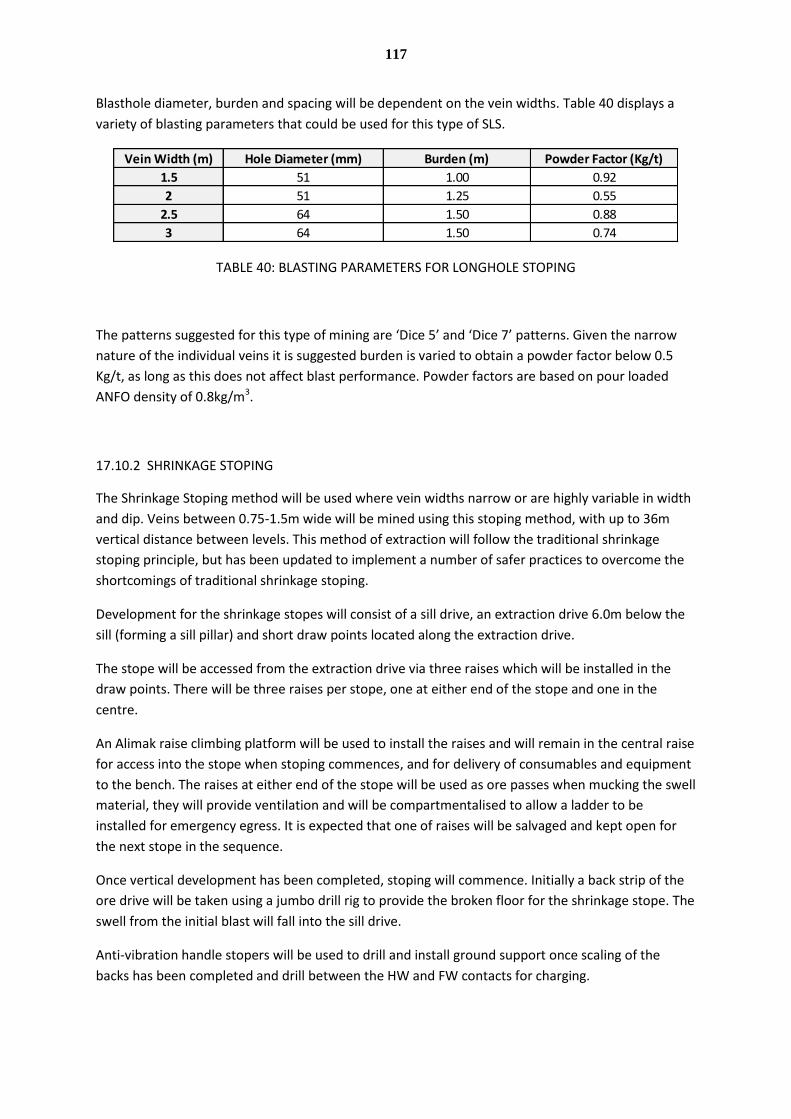
117
Blasthole diameter, burden and spacing will be dependent on the vein widths. Table 40 displays a
variety of blasting parameters that could be used for this type of SLS.
TABLE 40: BLASTING PARAMETERS FOR LONGHOLE STOPING
The patterns suggested for this type of mining are ‘Dice 5’ and ‘Dice 7’ patterns. Given the narrow
nature of the individual veins it is suggested burden is varied to obtain a powder factor below 0.5
Kg/t, as long as this does not affect blast performance. Powder factors are based on pour loaded
ANFO density of 0.8kg/m3.
17.10.2 SHRINKAGE STOPING
The Shrinkage Stoping method will be used where vein widths narrow or are highly variable in width
and dip. Veins between 0.75-1.5m wide will be mined using this stoping method, with up to 36m
vertical distance between levels. This method of extraction will follow the traditional shrinkage
stoping principle, but has been updated to implement a number of safer practices to overcome the
shortcomings of traditional shrinkage stoping.
Development for the shrinkage stopes will consist of a sill drive, an extraction drive 6.0m below the
sill (forming a sill pillar) and short draw points located along the extraction drive.
The stope will be accessed from the extraction drive via three raises which will be installed in the
draw points. There will be three raises per stope, one at either end of the stope and one in the
centre.
An Alimak raise climbing platform will be used to install the raises and will remain in the central raise
for access into the stope when stoping commences, and for delivery of consumables and equipment
to the bench. The raises at either end of the stope will be used as ore passes when mucking the swell
material, they will provide ventilation and will be compartmentalised to allow a ladder to be
installed for emergency egress. It is expected that one of raises will be salvaged and kept open for
the next stope in the sequence.
Once vertical development has been completed, stoping will commence. Initially a back strip of the
ore drive will be taken using a jumbo drill rig to provide the broken floor for the shrinkage stope. The
swell from the initial blast will fall into the sill drive.
Anti-vibration handle stopers will be used to drill and install ground support once scaling of the
backs has been completed and drill between the HW and FW contacts for charging.
Vein Width (m)
1.5
2
2.5
3
64 1.50
64 1.50
0.88
0.74
51 1.00
51 1.25
0.92
0.55
Hole Diameter (mm) Burden (m) Powder Factor (Kg/t)

118
The 38mm blast holes will be primed with a cartridge explosive and detonator and blow loaded with
ANFO. Once fired the broken ore will be scraped to the ore passes to provide a level working floor.
Ore will not be drawn from directly below the stope to ensure that there is no possibility of hang ups
or voids which would compromise the safety of personnel and equipment working of the shrinkage
floor.
The stoping cycle will continue until the upper limit of the stope. Once the stope has been fully
mined, ore will be scraped to the ore passes and into the draw point. Ore will be loaded into trucks
within the extraction drive and trucked to the underground crusher.
The stope will then be backfilled using a cemented paste delivered from a surface backfill plant that
mixes tailings and cement and is pumped to the stope. Once filled, the backfill will be allowed to
cure and then mining of the next stope in the sequence will continue.
17.11 BACKFILLING
Stopes will be backfilled using rough waste generated through development or a designed paste
mixture. The paste mixture will consist of tailings, stockpiled in storage facilities from previous
surface mining activity, and cement. Typically cement ratios will be between 6.5-13.0% depending
on the strength and curing times required.
An instantaneous fill rate of 50m3 /hr at 50% utilisation is required to meet the backfill capacity of
125,000m3 pa. This is geared to maintain ore production of 225,000 tpa.
The backfill plant will operate for 16 hours per day but will only fill for 12 hours of this to allow time
to commence pasting and to flush the system at the end of the shift. Therefore a maximum of 600m3
of paste will be delivered to stopes per day.
17.11.1 PASTE FILL PROCESS
Tailings generated from previous processing will be harvested and stockpiled at the paste plant.
Cement will be delivered to a silo and water will be pumped to a holding tank by the plant and a
flushing tank by the hopper.
A loader will feed the tailings hopper and this will be transferred to the mixing tank by conveyor
which can control the tonnage and moisture content.
A metered amount of cement and water will be added to the mixing tank to meet the required paste
specification.
The paste, once mixed, will be transferred into a paste pump which will push the paste into the
underground pipeline. A pump is required as the head is insufficient to move paste over the required
strike length.
Paste will be produced at 50m3/hr at 250 Pa yield stress at around 75% solids by weight.

119
17.11.2 PASTE RETICULATION
Paste will be pumped through a 250mm diameter schedule 40 steel pipeline located in the
ventilation shaft or through dedicated cased boreholes. At each level, a schedule 80 transfer pipe
will be located that can be used to divert the paste to the required level. Pressure sensors will be
located along the pipeline to give real time information to the paste plant control room.
Once paste is delivered to the fill level, the pipeline can be reduced to 200mm diameter. The final
100m of the paste line into the stope can be reduced from steel to PN16 HDPE piping to simplify
installation.
17.11.3 PASTE BACKFILL OF STOPES
Once a stope has been mined and has been cleared for backfilling, a paste barricade must be
created. This is an engineered retaining structure that is constructed at the brow of the open stope
and must retain the paste until it gains sufficient strength to be self-supporting.
17.11.4 BACKFILL BARRICADES
Paste barricades will be constructed using mesh, hessian lining and fibrecrete. Pinholes with rebar
will be installed in the walls and brow and steel wire will be used to secure the mesh between them.
A hessian lining will be used to help the fibrecrete bond to form a wall.
The diagram below (Figure 45) shows a typical paste wall, constructed of two layers of 3mm mesh
and 16mm rebar.
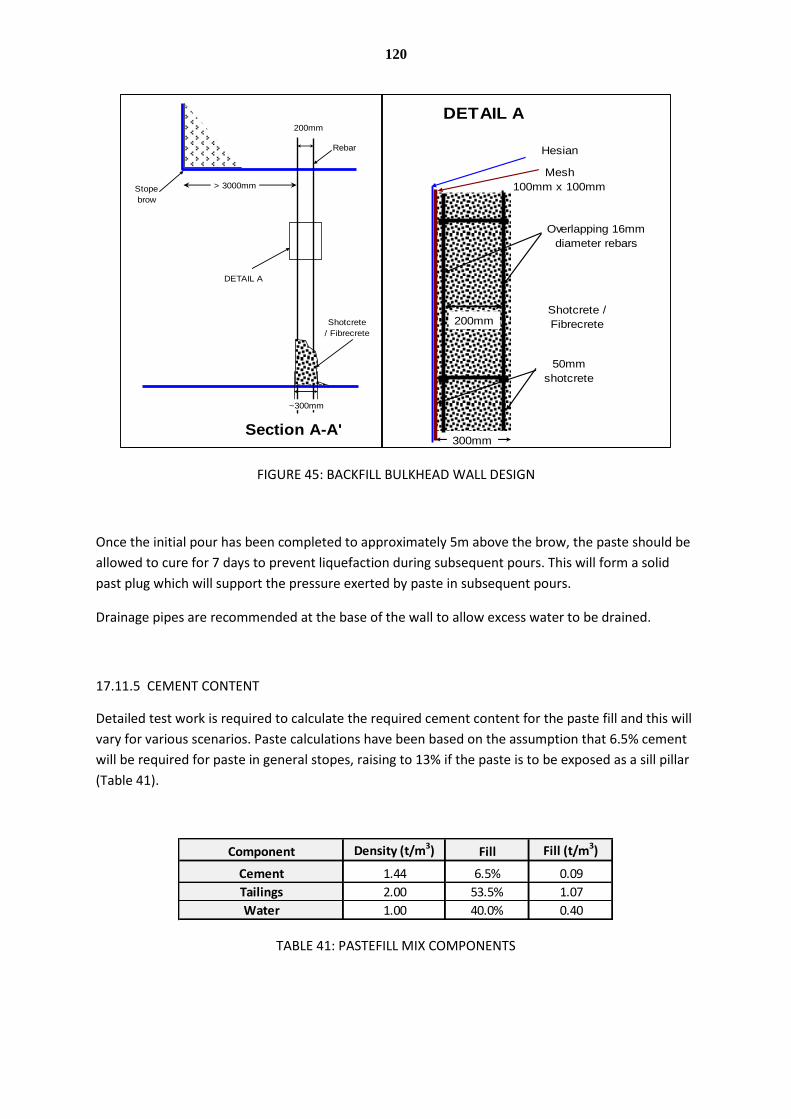
120
FIGURE 45: BACKFILL BULKHEAD WALL DESIGN
Once the initial pour has been completed to approximately 5m above the brow, the paste should be
allowed to cure for 7 days to prevent liquefaction during subsequent pours. This will form a solid
past plug which will support the pressure exerted by paste in subsequent pours.
Drainage pipes are recommended at the base of the wall to allow excess water to be drained.
17.11.5 CEMENT CONTENT
Detailed test work is required to calculate the required cement content for the paste fill and this will
vary for various scenarios. Paste calculations have been based on the assumption that 6.5% cement
will be required for paste in general stopes, raising to 13% if the paste is to be exposed as a sill pillar
(Table 41).
TABLE 41: PASTEFILL MIX COMPONENTS
Shotcrete
/ Fibrecrete
Section A-A'
Stope
brow
> 3000mm
200mm
DETAIL A
Rebar
DETAIL A
Mesh
100mm x 100mm
Overlapping 16mm
diameter rebars
Shotcrete /
Fibrecrete200mm
50mm
shotcrete
Hesian
5.5m
Overlap of connecting
rebars to be a
minimum of 500mm A
A'
750mm
600mm
600mm
5.5m
STAGE ONE
1. At least 16mm diameter rebar is installed 750mm into the sides, back and floor at
600mm centres. The first mat is started at >3000mm from the stable brow of the stope
(marked by geotechnical or production engineer).
2. Install 100mm x 100mm mesh screen with a hesian or a vent bag attached to it towards
the brow side to the rebar.
3. Additional rebar is then used to connect the rebar in the walls, back and floor. A minimum
overlap of the connecting rebar is 500mm.
STAGE TWO
1. The second mat is started approximately 200mm in front of the first mat.
2. Installation of the rebar follows the same construction criteria as the first mat. Additional
reinforcement between the mats is used to connect the two mats to increase the flexural
strength of the fill barricade.
Shotcrete wall is to cure for a minimum of 12 hours prior to the start of the stope paste pour.
NOTE
1. The area where the barricade is going to be constructed must be competent and free of
loose loose rocks. The area must be checked and marked by the Geotechnical or
Production (if no Geotech at site) Engineer.
2. The fibercrete mix design (as per current Darlot's ground control standard specification
of Jectcrete) will be substituted for the shotcrete design indicated in this standard.
3. The fibercrete as per point (2) above shall have a minimum compressive strength of 4
MPa or greater after 8 hours of curing time.
4. The construction of the fill barricade must be inspected by the paste fill supervisor prior to
fibercreting.
5. The first fill placement must not exceed a distance of 2m above the brow or 7.5m
measured from the floor of the stope. The first fill (covering 2m above the brow of the drive)
must be allowed to cure for a minimum of 24 hours before the final fill cycle is continued, or
the stope is filled to full height.
APPROVAL
Manager Mining
Tech. Suptd.
U.G. Manager
Geotech. Engr
Shotcrete Paste Barricade Design
Rev. 0, 20 January 2007
Design By: M. Wondrad Date: 20 / 01/ 07
No.: Rev 0, 20 Jan 2007
Ground ControlMake the area around the barricade safe
by scaling the loose and installing
additional support as required prior to
the construction of the barricade. Avoid
drilling and building the barricade into
loose ground.
Scale: As shown
~300mm
300mm
Component Density (t/m3) Fill Fill (t/m3)
Cement 1.44 6.5% 0.09
Tailings 2.00 53.5% 1.07
Water 1.00 40.0% 0.40

121
17.12 UNDERGROUND INFRASTRUCTURE
17.12.1 MINE POWER
Mine power will be supplied from surface diesel generators or mains power.
Electricity will be fed by 11kV cables to the underground sub stations and distribution boards and
reduced to 1kV for powering jumbo boxes, pumps and fans.
17.12.2 COMPRESSED AIR
A diesel compressor will be located on the surface and will feed the underground mine via 8’’
pipeline. Compressed airlines will be reduced to a 4’’ for the development drives.
17.12.3 MINE WATER
Mine water will be pumped underground from two holding tanks on the surface. These will be fed
from the raw water storage pit.
17.12.4 UNDERGROUND CRUSHER
An underground jaw crusher will be installed in a crushing chamber located at the start of the main
decline. Ore will be hauled by 17t articulated dump trucks that will dump onto an armoured face
conveyor or apron feeder which will provide continuous feed to the crusher.
Crushing capacity of 50tph is required in line with mine production rates. A 75kW Crusher will be
installed with >75% of material passing 50mm.
The crusher will direct feed onto the mine ore conveyors to the surface ROM storage shed.
17.12.5 ORE CONVEYORS
An ore conveyance system will be installed to convey ore from the underground crusher to the ROM
storage shed.
The conveyors will be 600mm wide and powered by a variable speed drive motor unit ranging from
7.5kW – 30kW depending on belt length.
Each belt will be equipped with primary and secondary belt scrapers, galvanised dust covers, impact
loading stations and safety monitoring devices including: belt tear/alignment, belt sequence,
blocked chute and audible visual alarms. Dust suppression will be installed at all transfer points.
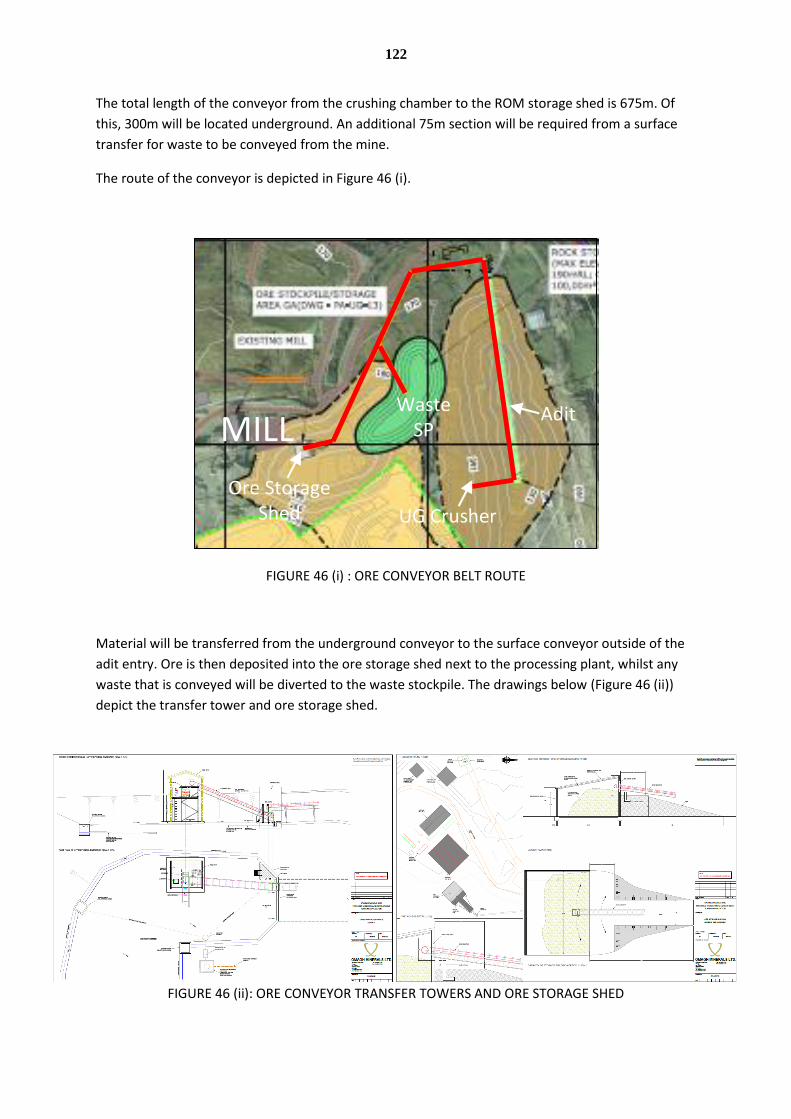
122
The total length of the conveyor from the crushing chamber to the ROM storage shed is 675m. Of
this, 300m will be located underground. An additional 75m section will be required from a surface
transfer for waste to be conveyed from the mine.
The route of the conveyor is depicted in Figure 46 (i).
FIGURE 46 (i) : ORE CONVEYOR BELT ROUTE
Material will be transferred from the underground conveyor to the surface conveyor outside of the
adit entry. Ore is then deposited into the ore storage shed next to the processing plant, whilst any
waste that is conveyed will be diverted to the waste stockpile. The drawings below (Figure 46 (ii))
depict the transfer tower and ore storage shed.
FIGURE 46 (ii): ORE CONVEYOR TRANSFER TOWERS AND ORE STORAGE SHED
UG Crusher
Adit
Ore StorageShed
MILLWaste
SP
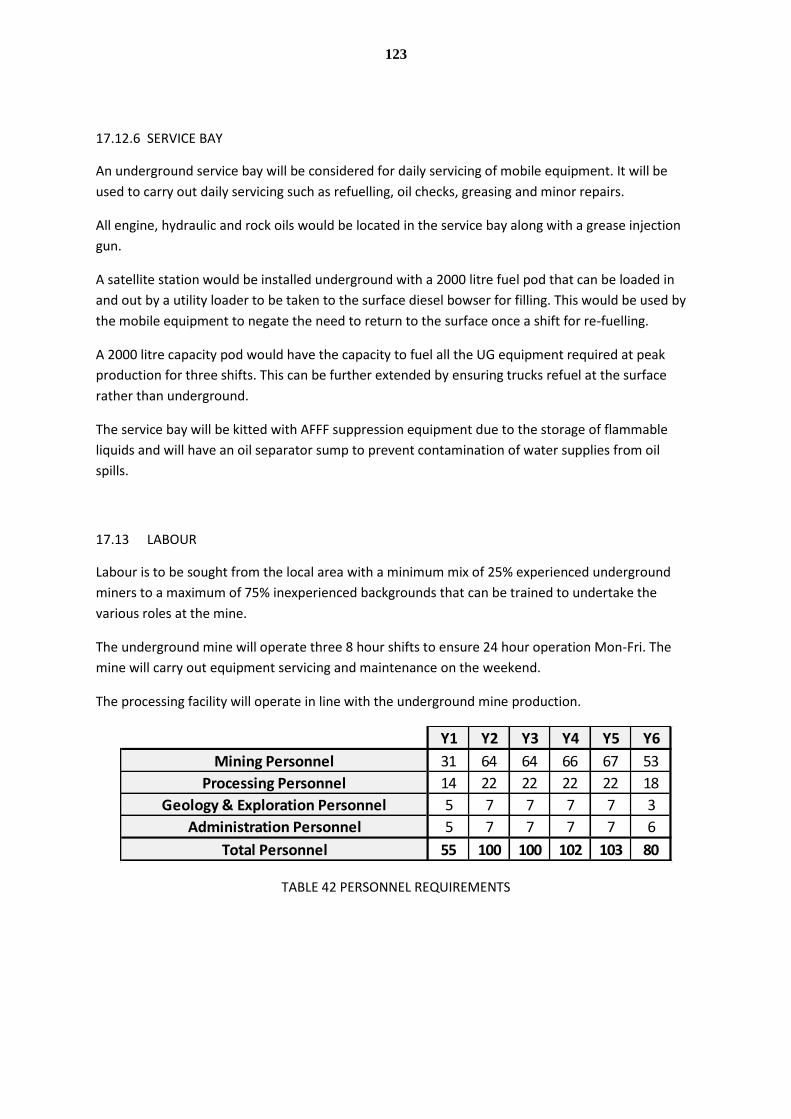
123
17.12.6 SERVICE BAY
An underground service bay will be considered for daily servicing of mobile equipment. It will be
used to carry out daily servicing such as refuelling, oil checks, greasing and minor repairs.
All engine, hydraulic and rock oils would be located in the service bay along with a grease injection
gun.
A satellite station would be installed underground with a 2000 litre fuel pod that can be loaded in
and out by a utility loader to be taken to the surface diesel bowser for filling. This would be used by
the mobile equipment to negate the need to return to the surface once a shift for re-fuelling.
A 2000 litre capacity pod would have the capacity to fuel all the UG equipment required at peak
production for three shifts. This can be further extended by ensuring trucks refuel at the surface
rather than underground.
The service bay will be kitted with AFFF suppression equipment due to the storage of flammable
liquids and will have an oil separator sump to prevent contamination of water supplies from oil
spills.
17.13 LABOUR
Labour is to be sought from the local area with a minimum mix of 25% experienced underground
miners to a maximum of 75% inexperienced backgrounds that can be trained to undertake the
various roles at the mine.
The underground mine will operate three 8 hour shifts to ensure 24 hour operation Mon-Fri. The
mine will carry out equipment servicing and maintenance on the weekend.
The processing facility will operate in line with the underground mine production.
TABLE 42 PERSONNEL REQUIREMENTS
Y1 Y2 Y3 Y4 Y5 Y6
Mining Personnel 31 64 64 66 67 53
Processing Personnel 14 22 22 22 22 18
Geology & Exploration Personnel 5 7 7 7 7 3
Administration Personnel 5 7 7 7 7 6
Total Personnel 55 100 100 102 103 80

124
17.14 MINING STUDY
The mining study has been estimated using the initial resource and utilising the most appropriate
mining methods to design and cost a Life of Mine (LOM) schedule and budget. The mining
parameters that have been considered are discussed below.
17.14.1 DILUTION
Dilution factors have been included in Mining Study calculations.
Reserve shapes may include both internal and external dilution.
Internal dilution is calculated within the reserve blocks from the Resource Model and is calculated as
a composite tonnage and grade for the reserve shape.
External dilution is added to the composite tonnage and grade for the reserve shape. It is a
percentage of the tonnes based on the method of mining added at zero grade. This increases the
tonnage for the mining shape, reduces the overall grade but ounces contained remain constant.
Table 43 displays the estimated external dilution factors for the different mining methods.
TABLE 43: DILUTION FACTORS APPLIED TO RESERVES
External dilution will be monitored and calculated as part of the stope reconciliation process. This is
achieved by using a cavity monitoring system (CMS) to give a detailed 3D image of the mined
volume. This is reconciled against the design volume and over break and under break is calculated.
These dilution factors will be periodically reviewed and if necessary updated to reflect the actual
value.
17.14.2 MINING RECOVERY
Mining recovery factors are included to take into account ore loss through mining activity. This
generally affects stopes more than development as material can accumulate on the HW and FW of
stopes or be left behind on the stope floor.
It is less likely to affect development as any ore accumulations on the floor would generally be
recovered through the stoping process.
Development Drives
Longhole Stoping
Shrinkage Stoping
External Dilution Factor
10%
20%
20%
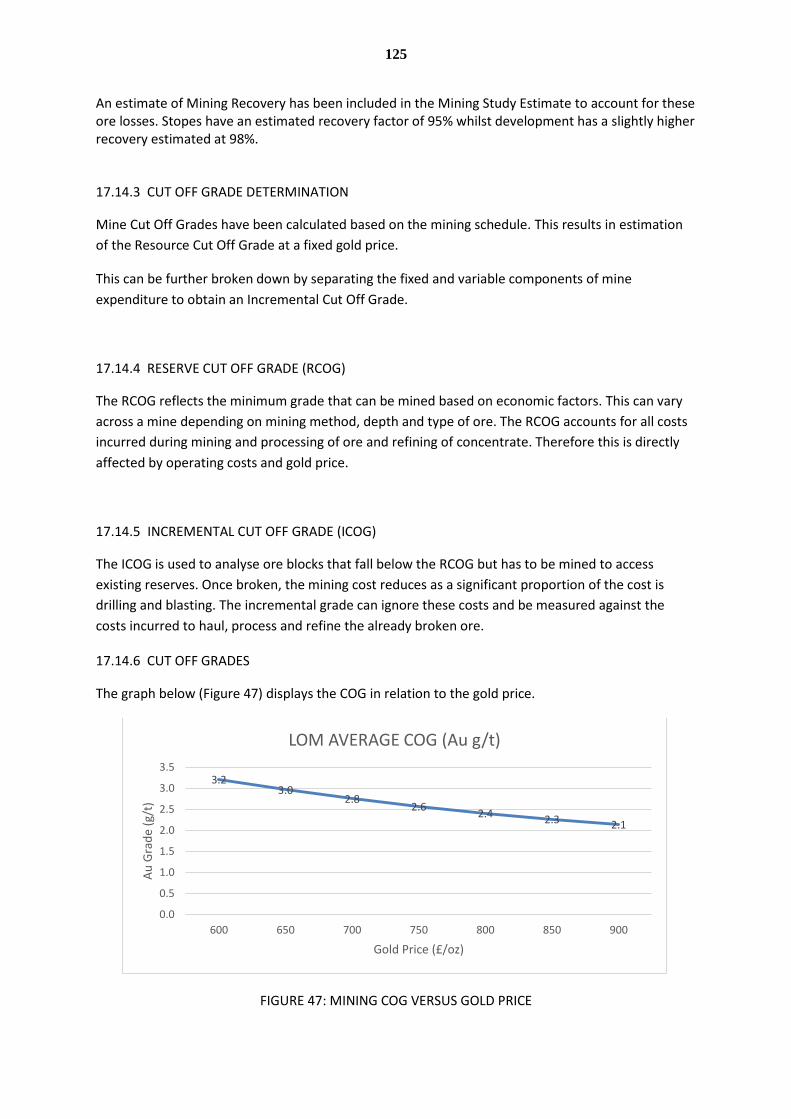
125
An estimate of Mining Recovery has been included in the Mining Study Estimate to account for these ore losses. Stopes have an estimated recovery factor of 95% whilst development has a slightly higher recovery estimated at 98%.
17.14.3 CUT OFF GRADE DETERMINATION
Mine Cut Off Grades have been calculated based on the mining schedule. This results in estimation
of the Resource Cut Off Grade at a fixed gold price.
This can be further broken down by separating the fixed and variable components of mine
expenditure to obtain an Incremental Cut Off Grade.
17.14.4 RESERVE CUT OFF GRADE (RCOG)
The RCOG reflects the minimum grade that can be mined based on economic factors. This can vary
across a mine depending on mining method, depth and type of ore. The RCOG accounts for all costs
incurred during mining and processing of ore and refining of concentrate. Therefore this is directly
affected by operating costs and gold price.
17.14.5 INCREMENTAL CUT OFF GRADE (ICOG)
The ICOG is used to analyse ore blocks that fall below the RCOG but has to be mined to access
existing reserves. Once broken, the mining cost reduces as a significant proportion of the cost is
drilling and blasting. The incremental grade can ignore these costs and be measured against the
costs incurred to haul, process and refine the already broken ore.
17.14.6 CUT OFF GRADES
The graph below (Figure 47) displays the COG in relation to the gold price.
FIGURE 47: MINING COG VERSUS GOLD PRICE
3.2 3.0
2.8 2.6
2.4 2.3 2.1
0.0
0.5
1.0
1.5
2.0
2.5
3.0
3.5
600 650 700 750 800 850 900
Au
Gra
de
(g/t
)
Gold Price (£/oz)
LOM AVERAGE COG (Au g/t)
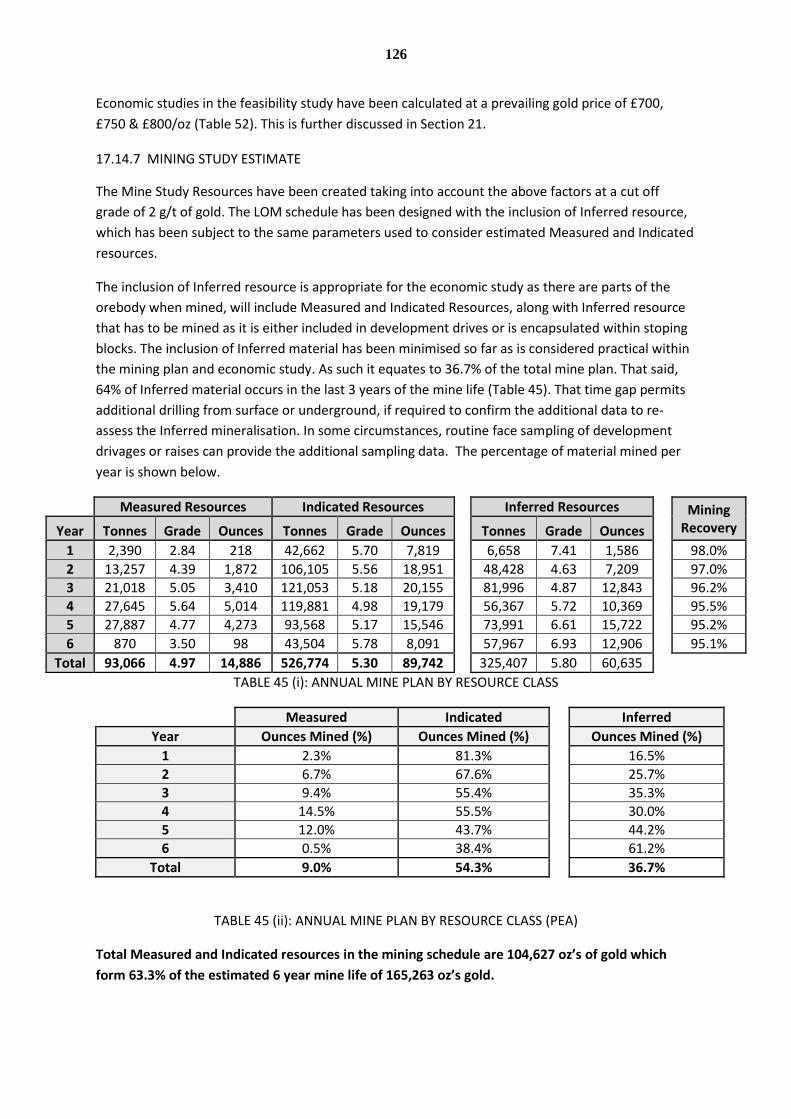
126
Economic studies in the feasibility study have been calculated at a prevailing gold price of £700,
£750 & £800/oz (Table 52). This is further discussed in Section 21.
17.14.7 MINING STUDY ESTIMATE
The Mine Study Resources have been created taking into account the above factors at a cut off
grade of 2 g/t of gold. The LOM schedule has been designed with the inclusion of Inferred resource,
which has been subject to the same parameters used to consider estimated Measured and Indicated
resources.
The inclusion of Inferred resource is appropriate for the economic study as there are parts of the
orebody when mined, will include Measured and Indicated Resources, along with Inferred resource
that has to be mined as it is either included in development drives or is encapsulated within stoping
blocks. The inclusion of Inferred material has been minimised so far as is considered practical within
the mining plan and economic study. As such it equates to 36.7% of the total mine plan. That said,
64% of Inferred material occurs in the last 3 years of the mine life (Table 45). That time gap permits
additional drilling from surface or underground, if required to confirm the additional data to re-
assess the Inferred mineralisation. In some circumstances, routine face sampling of development
drivages or raises can provide the additional sampling data. The percentage of material mined per
year is shown below.
Measured Resources Indicated Resources
Inferred Resources
Mining
Recovery Year Tonnes Grade Ounces Tonnes Grade Ounces
Tonnes Grade Ounces 1 2,390 2.84 218 42,662 5.70 7,819
6,658 7.41 1,586
98.0%
2 13,257 4.39 1,872 106,105 5.56 18,951
48,428 4.63 7,209
97.0%
3 21,018 5.05 3,410 121,053 5.18 20,155
81,996 4.87 12,843
96.2%
4 27,645 5.64 5,014 119,881 4.98 19,179
56,367 5.72 10,369
95.5%
5 27,887 4.77 4,273 93,568 5.17 15,546
73,991 6.61 15,722
95.2%
6 870 3.50 98 43,504 5.78 8,091
57,967 6.93 12,906
95.1%
Total 93,066 4.97 14,886 526,774 5.30 89,742
325,407 5.80 60,635 TABLE 45 (i): ANNUAL MINE PLAN BY RESOURCE CLASS
Measured Indicated
Inferred
Year Ounces Mined (%) Ounces Mined (%)
Ounces Mined (%)
1 2.3% 81.3%
16.5%
2 6.7% 67.6%
25.7%
3 9.4% 55.4%
35.3%
4 14.5% 55.5%
30.0%
5 12.0% 43.7%
44.2%
6 0.5% 38.4%
61.2%
Total 9.0% 54.3%
36.7%
TABLE 45 (ii): ANNUAL MINE PLAN BY RESOURCE CLASS (PEA)
Total Measured and Indicated resources in the mining schedule are 104,627 oz’s of gold which
form 63.3% of the estimated 6 year mine life of 165,263 oz’s gold.
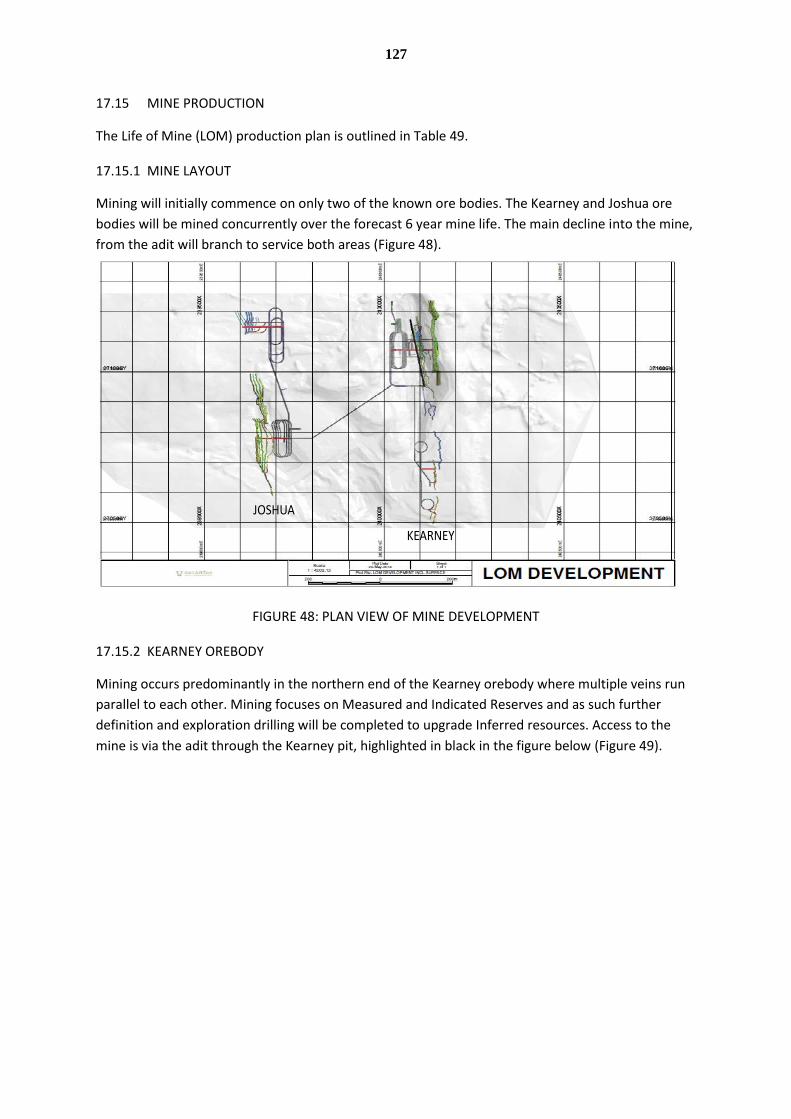
127
17.15 MINE PRODUCTION
The Life of Mine (LOM) production plan is outlined in Table 49.
17.15.1 MINE LAYOUT
Mining will initially commence on only two of the known ore bodies. The Kearney and Joshua ore
bodies will be mined concurrently over the forecast 6 year mine life. The main decline into the mine,
from the adit will branch to service both areas (Figure 48).
FIGURE 48: PLAN VIEW OF MINE DEVELOPMENT
17.15.2 KEARNEY OREBODY
Mining occurs predominantly in the northern end of the Kearney orebody where multiple veins run
parallel to each other. Mining focuses on Measured and Indicated Reserves and as such further
definition and exploration drilling will be completed to upgrade Inferred resources. Access to the
mine is via the adit through the Kearney pit, highlighted in black in the figure below (Figure 49).
JOSHUA
KEARNEY
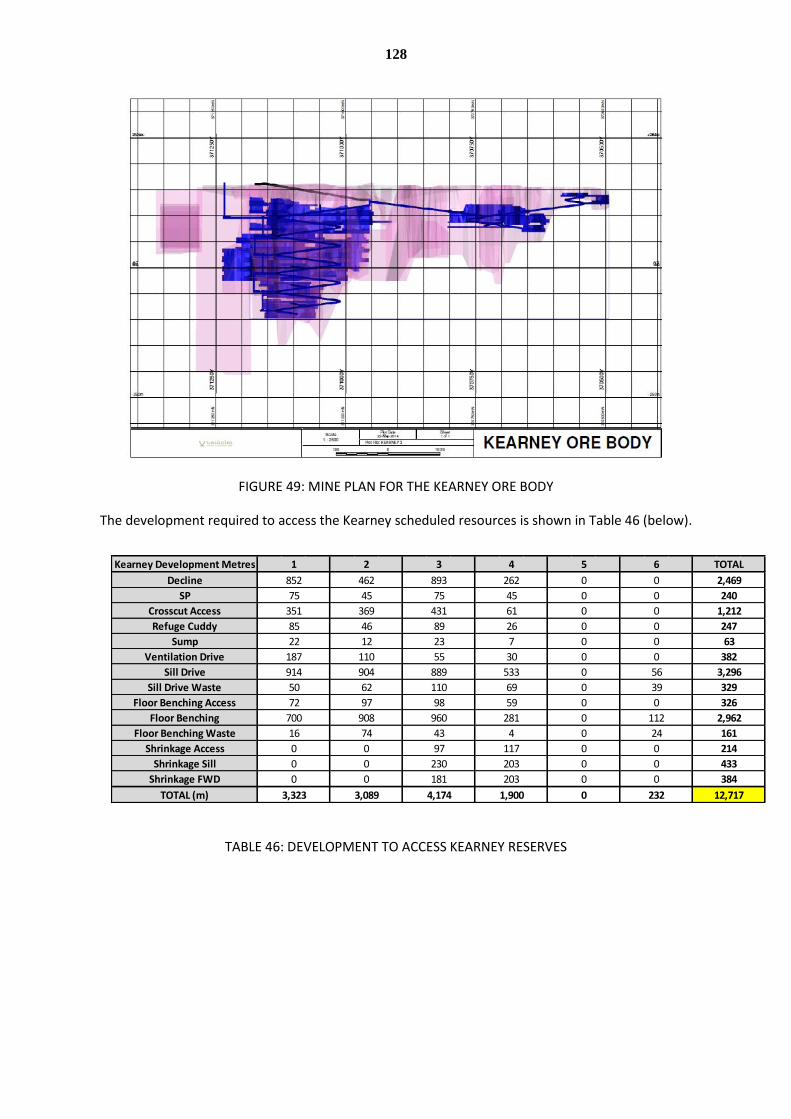
128
FIGURE 49: MINE PLAN FOR THE KEARNEY ORE BODY
The development required to access the Kearney scheduled resources is shown in Table 46 (below).
TABLE 46: DEVELOPMENT TO ACCESS KEARNEY RESERVES
Kearney Development Metres
Decline
SP
Crosscut Access
Refuge Cuddy
Sump
Ventilation Drive
Sill Drive
Sill Drive Waste
Floor Benching Access
Floor Benching
Floor Benching Waste
Shrinkage Access
Shrinkage Sill
Shrinkage FWD
TOTAL (m)
TOTAL
2,469
240
1,212
247
63
382
3,296
329
326
2,962
161
214
433
384
12,717
22 12 23 7 0
1 2 3 4 5
852 462 893 262 0
75 45
69 0
72
75 45 0
351 369 431 61 0
85 46 89 26 0
03,323 3,089 4,174 1,900
187 110 55 30 0
914 904 889 533 0
50 62
97 98 59 0
16
0 0 230 203 0
74 43 4 0
232
39
0
112
24
0
0
00 0 181 203 0
0 0 97 117 0
700 908 960 281 0
110
6
0
0
0
0
0
0
56
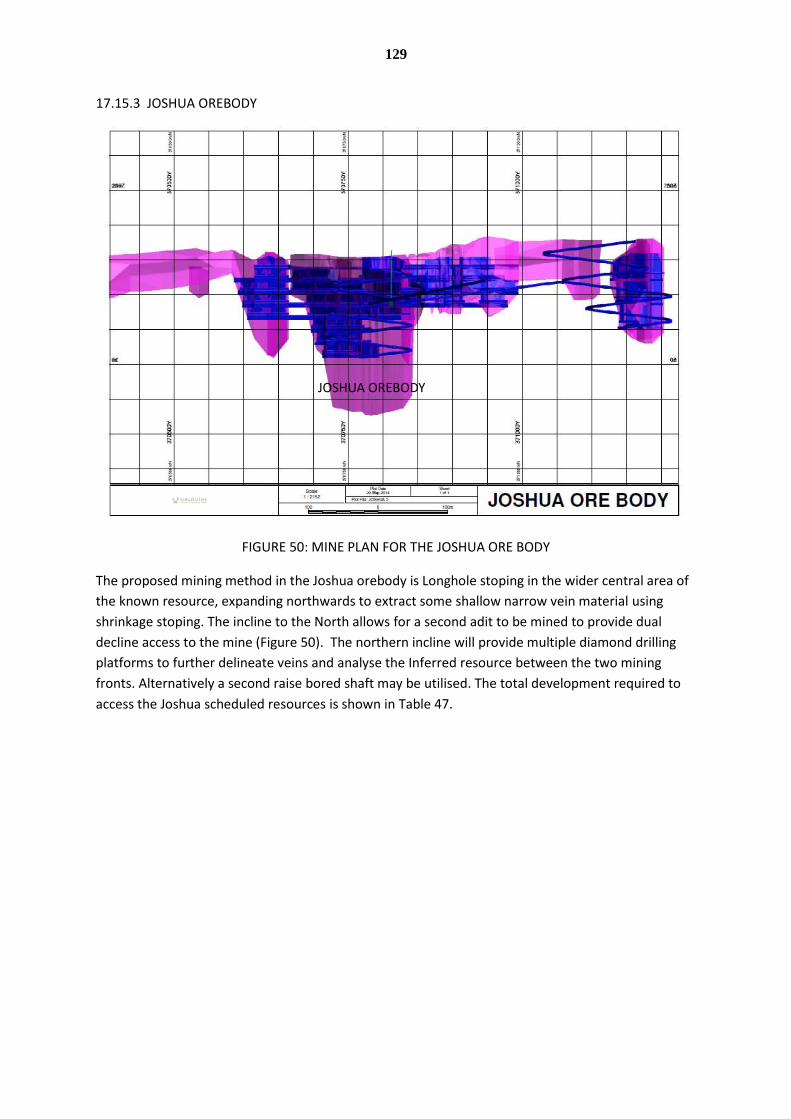
129
17.15.3 JOSHUA OREBODY
FIGURE 50: MINE PLAN FOR THE JOSHUA ORE BODY
The proposed mining method in the Joshua orebody is Longhole stoping in the wider central area of
the known resource, expanding northwards to extract some shallow narrow vein material using
shrinkage stoping. The incline to the North allows for a second adit to be mined to provide dual
decline access to the mine (Figure 50). The northern incline will provide multiple diamond drilling
platforms to further delineate veins and analyse the Inferred resource between the two mining
fronts. Alternatively a second raise bored shaft may be utilised. The total development required to
access the Joshua scheduled resources is shown in Table 47.
JOSHUA OREBODY
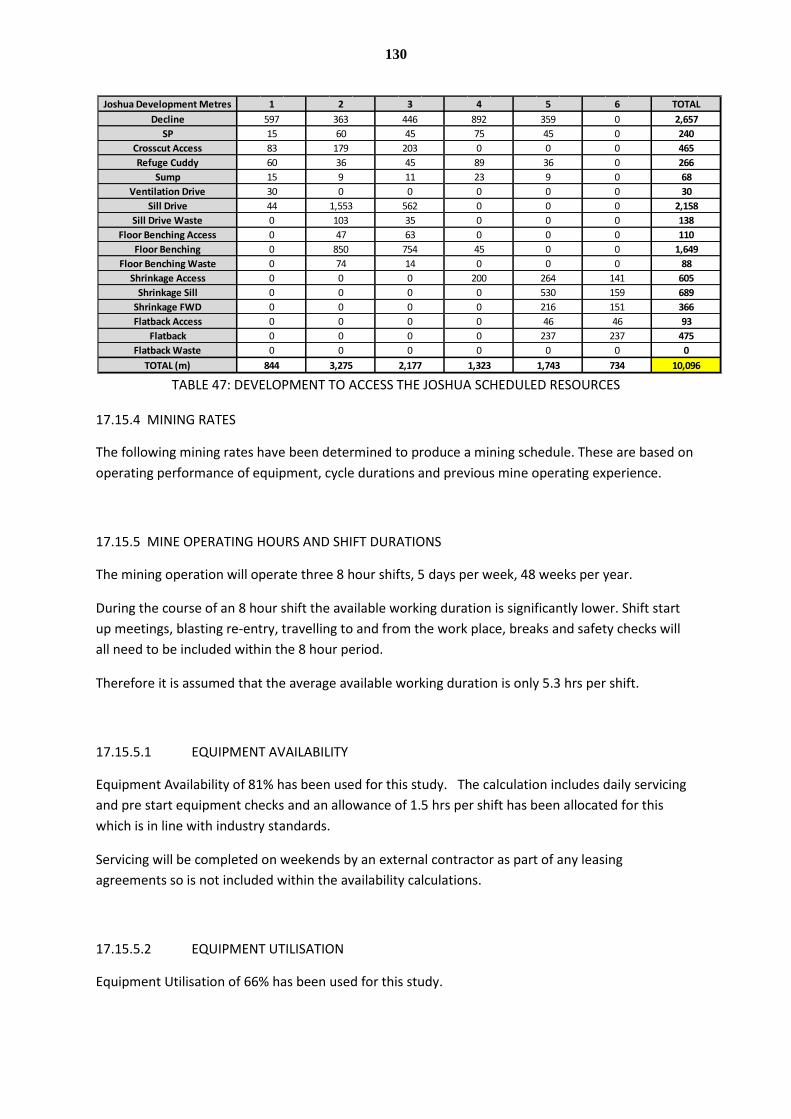
130
TABLE 47: DEVELOPMENT TO ACCESS THE JOSHUA SCHEDULED RESOURCES
17.15.4 MINING RATES
The following mining rates have been determined to produce a mining schedule. These are based on
operating performance of equipment, cycle durations and previous mine operating experience.
17.15.5 MINE OPERATING HOURS AND SHIFT DURATIONS
The mining operation will operate three 8 hour shifts, 5 days per week, 48 weeks per year.
During the course of an 8 hour shift the available working duration is significantly lower. Shift start
up meetings, blasting re-entry, travelling to and from the work place, breaks and safety checks will
all need to be included within the 8 hour period.
Therefore it is assumed that the average available working duration is only 5.3 hrs per shift.
17.15.5.1 EQUIPMENT AVAILABILITY
Equipment Availability of 81% has been used for this study. The calculation includes daily servicing
and pre start equipment checks and an allowance of 1.5 hrs per shift has been allocated for this
which is in line with industry standards.
Servicing will be completed on weekends by an external contractor as part of any leasing
agreements so is not included within the availability calculations.
17.15.5.2 EQUIPMENT UTILISATION
Equipment Utilisation of 66% has been used for this study.
Joshua Development Metres
Decline
SP
Crosscut Access
Refuge Cuddy
Sump
Ventilation Drive
Sill Drive
Sill Drive Waste
Floor Benching Access
Floor Benching
Floor Benching Waste
Shrinkage Access
Shrinkage Sill
Shrinkage FWD
Flatback Access
Flatback
Flatback Waste
TOTAL (m)
TOTAL
2,657
240
465
266
68
30
2,158
138
110
359
15 60 45 75 45
1 2 3 4 5
597 363 446 892
0
83 179 203 0 0
60 36 45 89 36
15 9 11 23 9
0
0 0 0 0 46
0 0 0 0 530
0 103 35 0
0
844 3,275 2,177 1,323 1,743
237
0 0 0 0 0
0 0 0 0
0 74 14 0 0
47 63 0 0
0 850 754 45 0
030 0
0 0 0 200 264
0 0
44 1,553 562 0
0
0
0
141
159
151
46
0 0 0 0 216
6
0
0
0
0
0
0
0
0
237
0
734 10,096
1,649
88
605
689
366
93
475
0
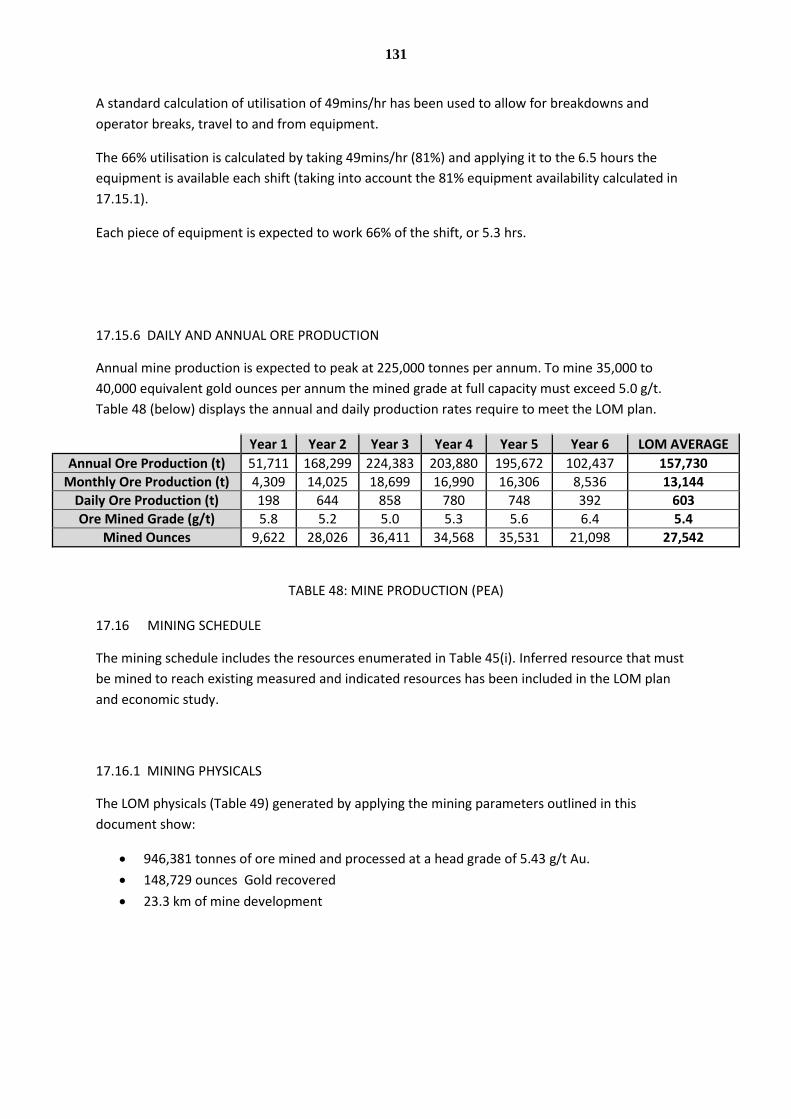
131
A standard calculation of utilisation of 49mins/hr has been used to allow for breakdowns and
operator breaks, travel to and from equipment.
The 66% utilisation is calculated by taking 49mins/hr (81%) and applying it to the 6.5 hours the
equipment is available each shift (taking into account the 81% equipment availability calculated in
17.15.1).
Each piece of equipment is expected to work 66% of the shift, or 5.3 hrs.
17.15.6 DAILY AND ANNUAL ORE PRODUCTION
Annual mine production is expected to peak at 225,000 tonnes per annum. To mine 35,000 to
40,000 equivalent gold ounces per annum the mined grade at full capacity must exceed 5.0 g/t.
Table 48 (below) displays the annual and daily production rates require to meet the LOM plan.
Year 1 Year 2 Year 3 Year 4 Year 5 Year 6 LOM AVERAGE
Annual Ore Production (t) 51,711 168,299 224,383 203,880 195,672 102,437 157,730
Monthly Ore Production (t) 4,309 14,025 18,699 16,990 16,306 8,536 13,144
Daily Ore Production (t) 198 644 858 780 748 392 603
Ore Mined Grade (g/t) 5.8 5.2 5.0 5.3 5.6 6.4 5.4
Mined Ounces 9,622 28,026 36,411 34,568 35,531 21,098 27,542
TABLE 48: MINE PRODUCTION (PEA)
17.16 MINING SCHEDULE
The mining schedule includes the resources enumerated in Table 45(i). Inferred resource that must
be mined to reach existing measured and indicated resources has been included in the LOM plan
and economic study.
17.16.1 MINING PHYSICALS
The LOM physicals (Table 49) generated by applying the mining parameters outlined in this
document show:
946,381 tonnes of ore mined and processed at a head grade of 5.43 g/t Au.
148,729 ounces Gold recovered
23.3 km of mine development
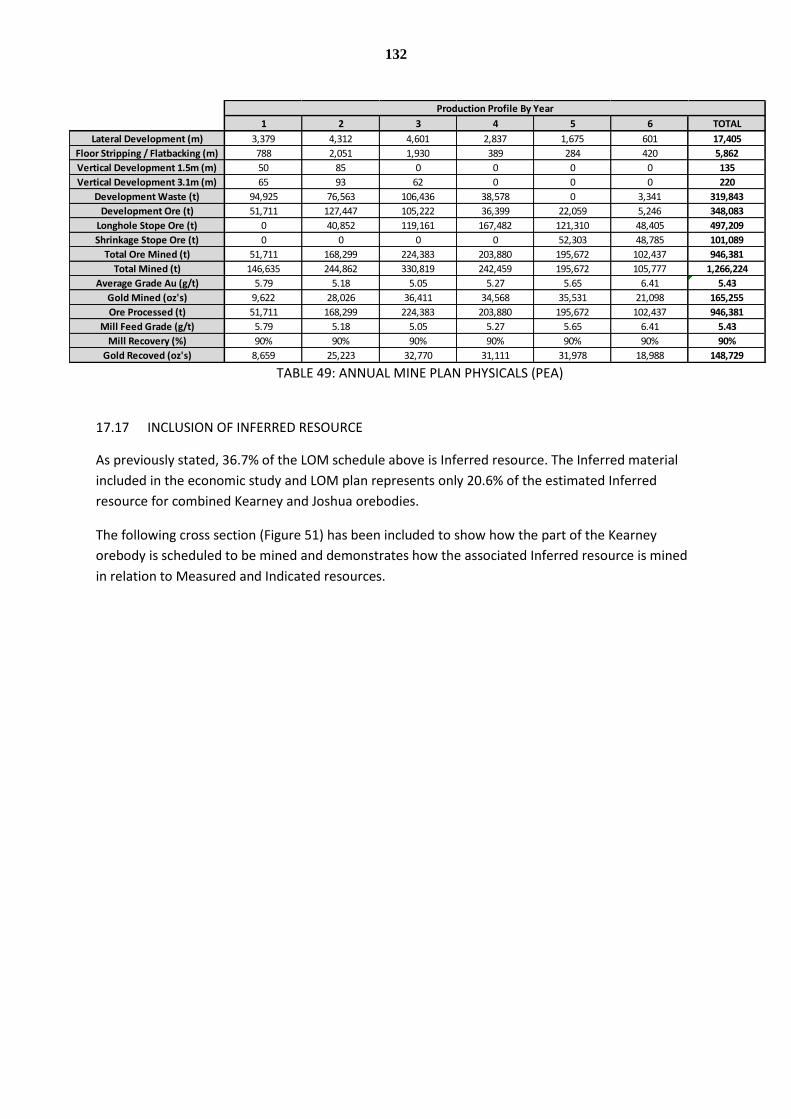
132
TABLE 49: ANNUAL MINE PLAN PHYSICALS (PEA)
17.17 INCLUSION OF INFERRED RESOURCE
As previously stated, 36.7% of the LOM schedule above is Inferred resource. The Inferred material
included in the economic study and LOM plan represents only 20.6% of the estimated Inferred
resource for combined Kearney and Joshua orebodies.
The following cross section (Figure 51) has been included to show how the part of the Kearney
orebody is scheduled to be mined and demonstrates how the associated Inferred resource is mined
in relation to Measured and Indicated resources.
1 2 3 4 5 6 TOTAL
Lateral Development (m) 3,379 4,312 4,601 2,837 1,675 601 17,405
Floor Stripping / Flatbacking (m) 788 2,051 1,930 389 284 420 5,862
Vertical Development 1.5m (m) 50 85 0 0 0 0 135
Vertical Development 3.1m (m) 65 93 62 0 0 0 220
Development Waste (t) 94,925 76,563 106,436 38,578 0 3,341 319,843
Development Ore (t) 51,711 127,447 105,222 36,399 22,059 5,246 348,083
Longhole Stope Ore (t) 0 40,852 119,161 167,482 121,310 48,405 497,209
Shrinkage Stope Ore (t) 0 0 0 0 52,303 48,785 101,089
Total Ore Mined (t) 51,711 168,299 224,383 203,880 195,672 102,437 946,381
Total Mined (t) 146,635 244,862 330,819 242,459 195,672 105,777 1,266,224
Average Grade Au (g/t) 5.79 5.18 5.05 5.27 5.65 6.41 5.43
Gold Mined (oz's) 9,622 28,026 36,411 34,568 35,531 21,098 165,255
Ore Processed (t) 51,711 168,299 224,383 203,880 195,672 102,437 946,381
Mill Feed Grade (g/t) 5.79 5.18 5.05 5.27 5.65 6.41 5.43
Mill Recovery (%) 90% 90% 90% 90% 90% 90% 90%
Gold Recoved (oz's) 8,659 25,223 32,770 31,111 31,978 18,988 148,729
Production Profile By Year
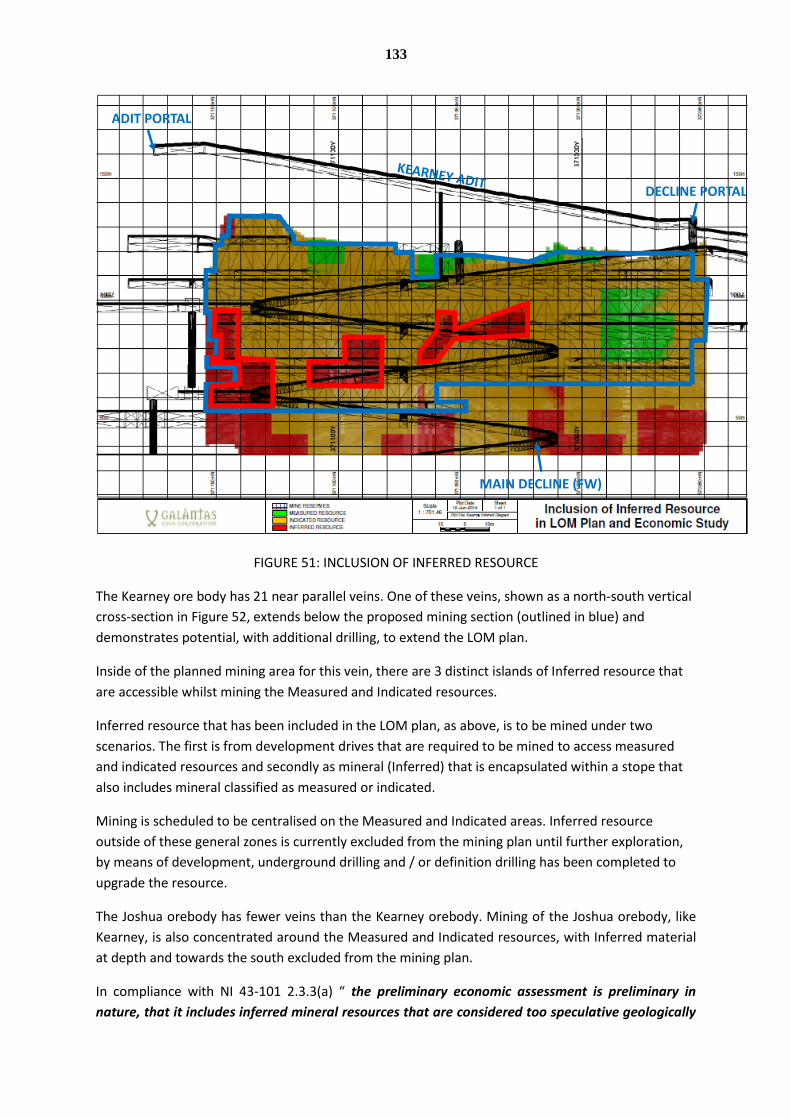
133
FIGURE 51: INCLUSION OF INFERRED RESOURCE
The Kearney ore body has 21 near parallel veins. One of these veins, shown as a north-south vertical
cross-section in Figure 52, extends below the proposed mining section (outlined in blue) and
demonstrates potential, with additional drilling, to extend the LOM plan.
Inside of the planned mining area for this vein, there are 3 distinct islands of Inferred resource that
are accessible whilst mining the Measured and Indicated resources.
Inferred resource that has been included in the LOM plan, as above, is to be mined under two
scenarios. The first is from development drives that are required to be mined to access measured
and indicated resources and secondly as mineral (Inferred) that is encapsulated within a stope that
also includes mineral classified as measured or indicated.
Mining is scheduled to be centralised on the Measured and Indicated areas. Inferred resource
outside of these general zones is currently excluded from the mining plan until further exploration,
by means of development, underground drilling and / or definition drilling has been completed to
upgrade the resource.
The Joshua orebody has fewer veins than the Kearney orebody. Mining of the Joshua orebody, like
Kearney, is also concentrated around the Measured and Indicated resources, with Inferred material
at depth and towards the south excluded from the mining plan.
In compliance with NI 43-101 2.3.3(a) “ the preliminary economic assessment is preliminary in
nature, that it includes inferred mineral resources that are considered too speculative geologically
MAIN DECLINE (FW)
ADIT PORTAL
DECLINE PORTAL
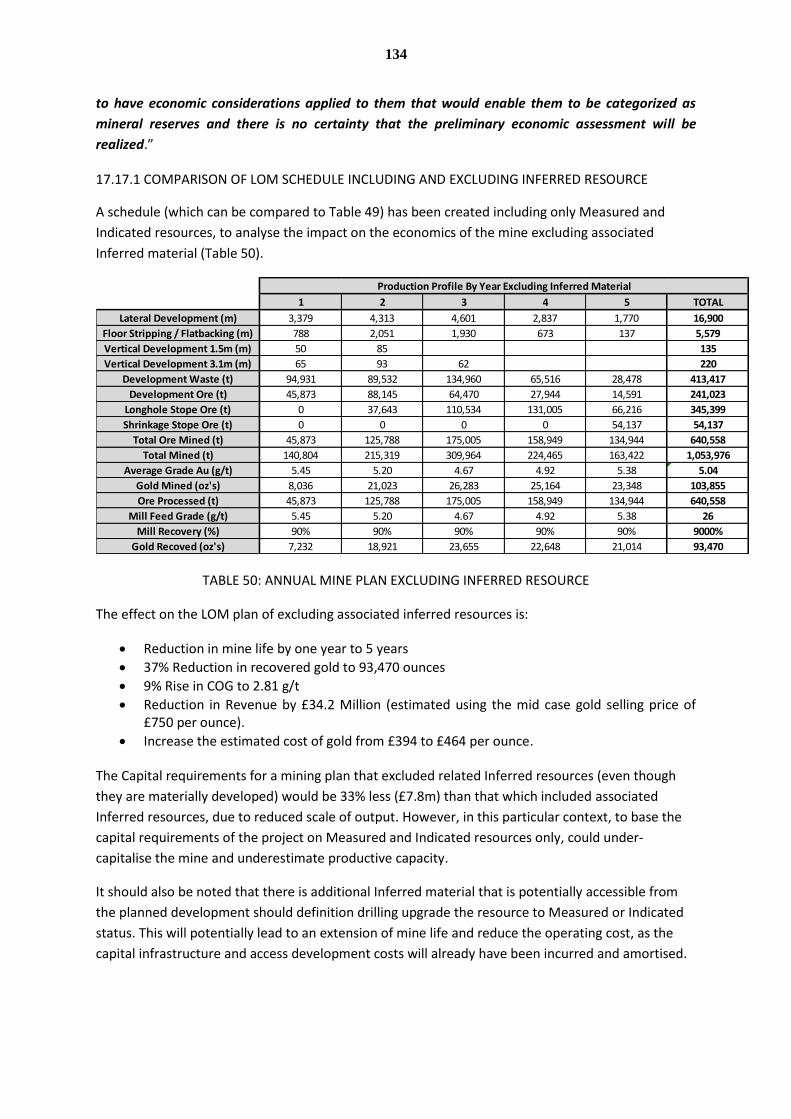
134
to have economic considerations applied to them that would enable them to be categorized as
mineral reserves and there is no certainty that the preliminary economic assessment will be
realized.”
17.17.1 COMPARISON OF LOM SCHEDULE INCLUDING AND EXCLUDING INFERRED RESOURCE
A schedule (which can be compared to Table 49) has been created including only Measured and
Indicated resources, to analyse the impact on the economics of the mine excluding associated
Inferred material (Table 50).
TABLE 50: ANNUAL MINE PLAN EXCLUDING INFERRED RESOURCE
The effect on the LOM plan of excluding associated inferred resources is:
Reduction in mine life by one year to 5 years
37% Reduction in recovered gold to 93,470 ounces
9% Rise in COG to 2.81 g/t
Reduction in Revenue by £34.2 Million (estimated using the mid case gold selling price of £750 per ounce).
Increase the estimated cost of gold from £394 to £464 per ounce.
The Capital requirements for a mining plan that excluded related Inferred resources (even though
they are materially developed) would be 33% less (£7.8m) than that which included associated
Inferred resources, due to reduced scale of output. However, in this particular context, to base the
capital requirements of the project on Measured and Indicated resources only, could under-
capitalise the mine and underestimate productive capacity.
It should also be noted that there is additional Inferred material that is potentially accessible from
the planned development should definition drilling upgrade the resource to Measured or Indicated
status. This will potentially lead to an extension of mine life and reduce the operating cost, as the
capital infrastructure and access development costs will already have been incurred and amortised.
1 2 3 4 5 TOTAL
Lateral Development (m) 3,379 4,313 4,601 2,837 1,770 16,900
Floor Stripping / Flatbacking (m) 788 2,051 1,930 673 137 5,579
Vertical Development 1.5m (m) 50 85 135
Vertical Development 3.1m (m) 65 93 62 220
Development Waste (t) 94,931 89,532 134,960 65,516 28,478 413,417
Development Ore (t) 45,873 88,145 64,470 27,944 14,591 241,023
Longhole Stope Ore (t) 0 37,643 110,534 131,005 66,216 345,399
Shrinkage Stope Ore (t) 0 0 0 0 54,137 54,137
Total Ore Mined (t) 45,873 125,788 175,005 158,949 134,944 640,558
Total Mined (t) 140,804 215,319 309,964 224,465 163,422 1,053,976
Average Grade Au (g/t) 5.45 5.20 4.67 4.92 5.38 5.04
Gold Mined (oz's) 8,036 21,023 26,283 25,164 23,348 103,855
Ore Processed (t) 45,873 125,788 175,005 158,949 134,944 640,558
Mill Feed Grade (g/t) 5.45 5.20 4.67 4.92 5.38 26
Mill Recovery (%) 90% 90% 90% 90% 90% 9000%
Gold Recoved (oz's) 7,232 18,921 23,655 22,648 21,014 93,470
Production Profile By Year Excluding Inferred Material

135
Under CIM / Canadian National Instrument 43-101 definitions the results of the detailed mining
study excluding inferred resources are expected to meet the criteria for definition as a Feasibility
Study.
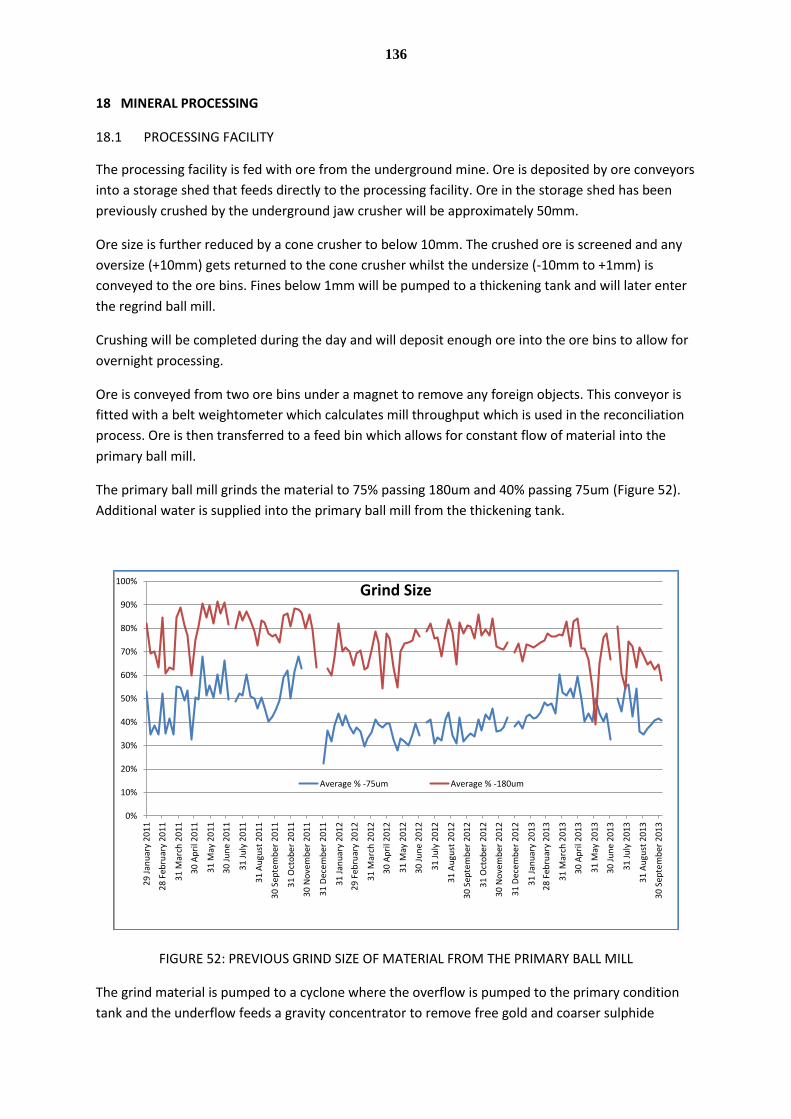
136
18 MINERAL PROCESSING
18.1 PROCESSING FACILITY
The processing facility is fed with ore from the underground mine. Ore is deposited by ore conveyors
into a storage shed that feeds directly to the processing facility. Ore in the storage shed has been
previously crushed by the underground jaw crusher will be approximately 50mm.
Ore size is further reduced by a cone crusher to below 10mm. The crushed ore is screened and any
oversize (+10mm) gets returned to the cone crusher whilst the undersize (-10mm to +1mm) is
conveyed to the ore bins. Fines below 1mm will be pumped to a thickening tank and will later enter
the regrind ball mill.
Crushing will be completed during the day and will deposit enough ore into the ore bins to allow for
overnight processing.
Ore is conveyed from two ore bins under a magnet to remove any foreign objects. This conveyor is
fitted with a belt weightometer which calculates mill throughput which is used in the reconciliation
process. Ore is then transferred to a feed bin which allows for constant flow of material into the
primary ball mill.
The primary ball mill grinds the material to 75% passing 180um and 40% passing 75um (Figure 52).
Additional water is supplied into the primary ball mill from the thickening tank.
FIGURE 52: PREVIOUS GRIND SIZE OF MATERIAL FROM THE PRIMARY BALL MILL
The grind material is pumped to a cyclone where the overflow is pumped to the primary condition
tank and the underflow feeds a gravity concentrator to remove free gold and coarser sulphide
0%
10%
20%
30%
40%
50%
60%
70%
80%
90%
100%
29
Jan
uar
y 2
01
1
28
Feb
ruar
y 2
01
1
31
Mar
ch 2
01
1
30
Ap
ril 2
01
1
31
May
20
11
30
Ju
ne
20
11
31
Ju
ly 2
01
1
31
Au
gust
20
11
30
Sep
tem
ber
20
11
31
Oct
ob
er
20
11
30
No
vem
ber
20
11
31
Dec
em
be
r 2
01
1
31
Jan
uar
y 2
01
2
29
Feb
ruar
y 2
01
2
31
Mar
ch 2
01
2
30
Ap
ril 2
01
2
31
May
20
12
30
Ju
ne
20
12
31
Ju
ly 2
01
2
31
Au
gust
20
12
30
Sep
tem
ber
20
12
31
Oct
ob
er
20
12
30
No
vem
ber
20
12
31
Dec
em
be
r 2
01
2
31
Jan
uar
y 2
01
3
28
Feb
ruar
y 2
01
3
31
Mar
ch 2
01
3
30
Ap
ril 2
01
3
31
May
20
13
30
Ju
ne
20
13
31
Ju
ly 2
01
3
31
Au
gust
20
13
30
Sep
tem
ber
20
13
Grind Size
Average % -75um Average % -180um

137
particles. The gravity concentrator sends concentrate to the holding tank whilst the overflow feeds
into a screw classifier. The screw classifier is used to regulate water within the plant and the
overflow and excess water from the screw classifier is sent to a thickener.
Underflow from the screw classifier is fed into the secondary ball mill for regrinding. The secondary
ball mill and the thickening tank both discharge into a second cyclone that sends overflow to the first
conditioning tank and underflow back into the secondary ball mill.
Copper Sulphate is added in the first conditioning tank to prepare the material for the float cells. The
material is pumped into a second conditioning tank in which xanthates are added to further assist
the froth flotation process.
The material is gravity fed into rougher banks below the second conditioning tank. Three inline
banks, each containing 8 rougher cells, are used to float the sulphide material which is collected in
the troughs and delivered to a two cleaner banks.
Remaining concentrate from the rougher banks is pumped through two scavenger banks, each
containing 6 cells. Concentrate that is not collected in the scavenger banks passes into a final gravity
separator before being lost to tails. The scavenged material is returned to the cleaner bank whilst
the gravity recovered concentrate is pumped to the concentrate holding tank.
Concentrate from the cleaner banks, containing four cells, is pumped directly to the concentrate
holding tank. A smaller scavenger tank is located at the end of the cleaner bank and is used to
retrieve any remaining material and return it to the initial cleaner bank. Excess water is pumped
back to the thickening tank.
Concentrate is to be filtered from the holding tank using two parallel filter presses which discharge
the final concentrate into the bagging area below.
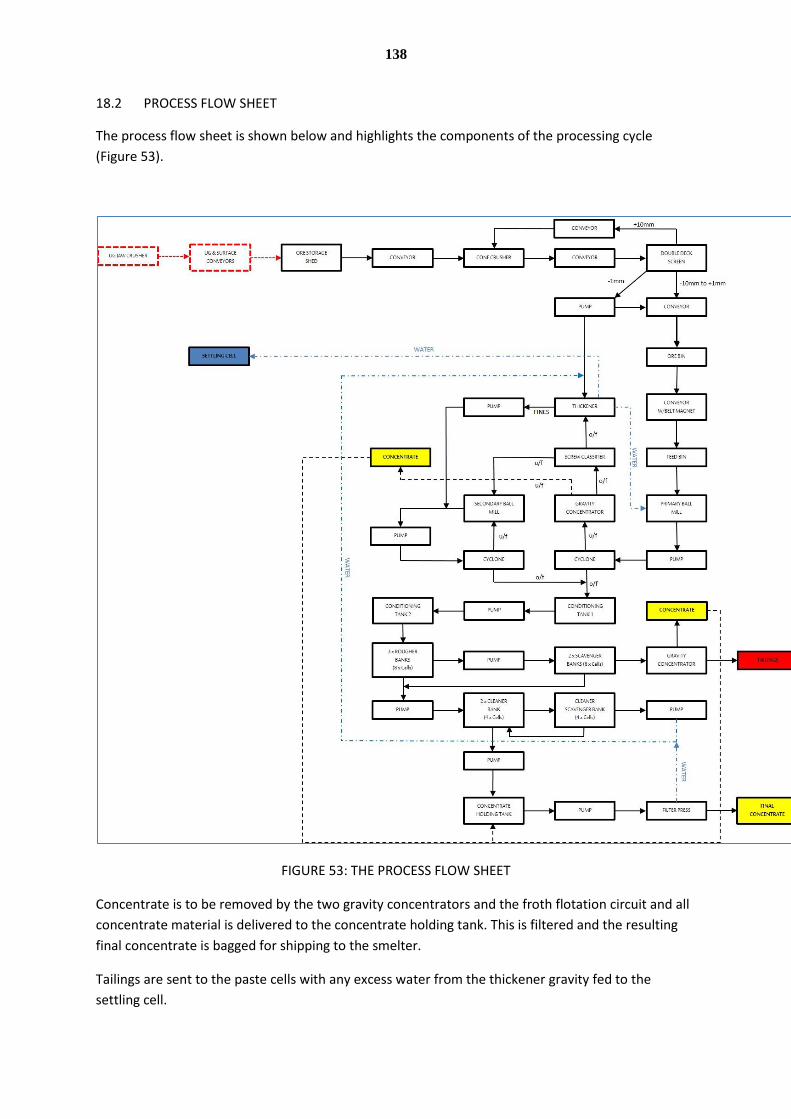
138
18.2 PROCESS FLOW SHEET
The process flow sheet is shown below and highlights the components of the processing cycle
(Figure 53).
FIGURE 53: THE PROCESS FLOW SHEET
Concentrate is to be removed by the two gravity concentrators and the froth flotation circuit and all
concentrate material is delivered to the concentrate holding tank. This is filtered and the resulting
final concentrate is bagged for shipping to the smelter.
Tailings are sent to the paste cells with any excess water from the thickener gravity fed to the
settling cell.
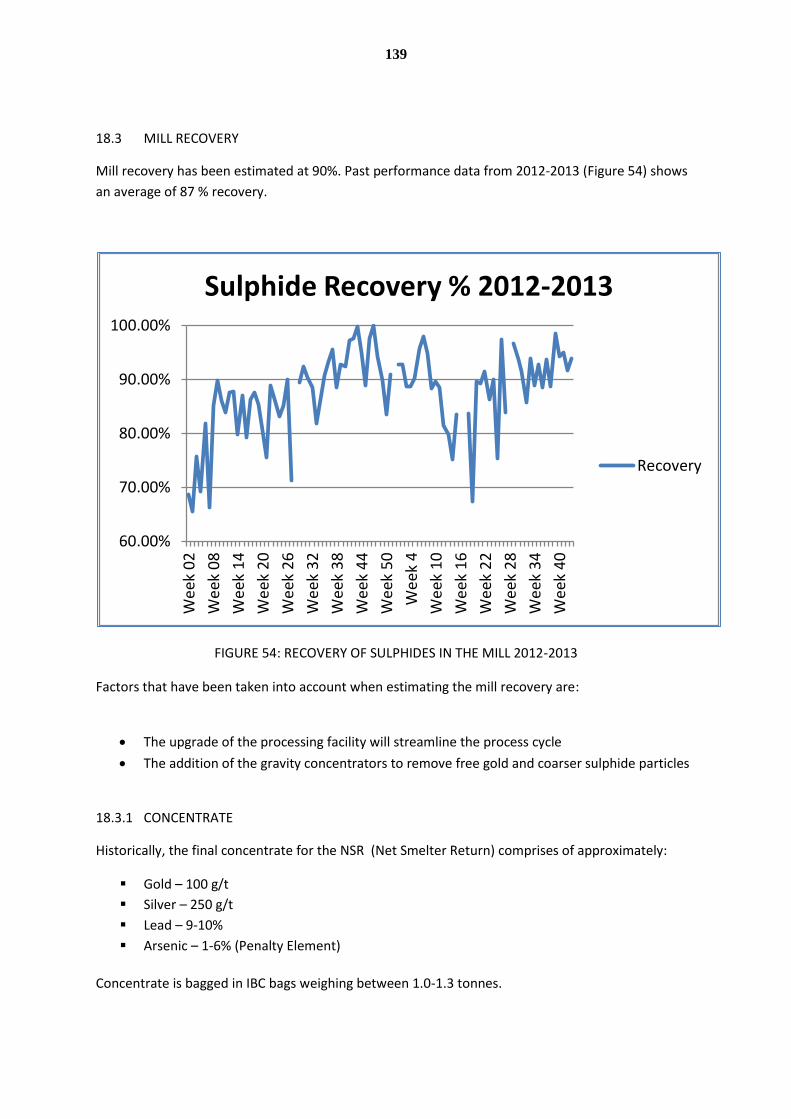
139
18.3 MILL RECOVERY
Mill recovery has been estimated at 90%. Past performance data from 2012-2013 (Figure 54) shows
an average of 87 % recovery.
FIGURE 54: RECOVERY OF SULPHIDES IN THE MILL 2012-2013
Factors that have been taken into account when estimating the mill recovery are:
The upgrade of the processing facility will streamline the process cycle
The addition of the gravity concentrators to remove free gold and coarser sulphide particles
18.3.1 CONCENTRATE
Historically, the final concentrate for the NSR (Net Smelter Return) comprises of approximately:
Gold – 100 g/t
Silver – 250 g/t
Lead – 9-10%
Arsenic – 1-6% (Penalty Element)
Concentrate is bagged in IBC bags weighing between 1.0-1.3 tonnes.
60.00%
70.00%
80.00%
90.00%
100.00%
We
ek 0
2
We
ek 0
8
We
ek 1
4
We
ek 2
0
We
ek 2
6
We
ek 3
2
We
ek 3
8
We
ek 4
4
We
ek 5
0
We
ek 4
We
ek 1
0
We
ek 1
6
We
ek 2
2
We
ek 2
8
We
ek 3
4
We
ek 4
0
Sulphide Recovery % 2012-2013
Recovery

140
Gold grade within the concentrate is expected to increase with the addition of the gravity
concentrators. These will remove free gold particles that are not captured during the flotation
process and were previously discharged to tails, or trapped within the mill.
18.3.2 REFINING
Concentrate is shipped from Belfast to a Canadian Smelter for refining. Bagged concentrate is loaded
into shipping containers with average shipment weight of 24 tonnes.
Metal prices received are 95% of the average price of the previous month for gold, silver and lead.
Refining charges and penalty charges for arsenic also apply.
Historical freight and refining charges average 15% of the gold price. This has been calculated by
converting revenue into equivalent gold ounces so all revenue calculations are based on 85% of the
forecast gold price to account for freight and refining.
18.3.3 TAILINGS
Tailings are discharged into the paste cells. Water from the paste cells settles and migrates through
the cleaning ponds to the final polishing pond. Tailing will then be harvested for paste fill to reduce
the surface imprint. The processing plant is supplied with re-cycled water from the polishing pond.
Surplus water enters the catchment drainage via a V notch weir arrangement, where volume and
water quality are routinely measured to ensure the standards regulated by the statutory authority
(Northern Ireland Environment Agency) are met. The author has examined two, in-depth recent
reports by the agency that attest to satisfaction of the Agency’s requirements (see paragraph 20.2).
19 CONTRACTS & MARKET STUDIES
19.1 OFF-TAKE AGREEMENT
Flotation concentrates are sold to Xstrata Glencore (Formerly Xstrata Corporation) under a life of
mine contract. The contract is well known to the author who considers the terms at the positive end
of industry norms. The contract includes a smelter payment based upon tonnage sold and pays 95%
of metal values for gold, silver and lead (the latter above certain cut-off percentage). It includes a
fixed price shipping charge and advance payment provisions.
19.2 GOLD PRICE IN US DOLLARS AND UK STERLING
The Gold concentrate output from the Omagh Mine, which also contains silver and lead credits, is
sold in US dollars (USD). Most of the value is accrued from the gold content. The following graph is
compiled from data published by the Bank of England of average monthly gold price in US$ and UK £
(Sterling) per troy ounce (Figure 55). The graph is from December 2010 to April 2014.
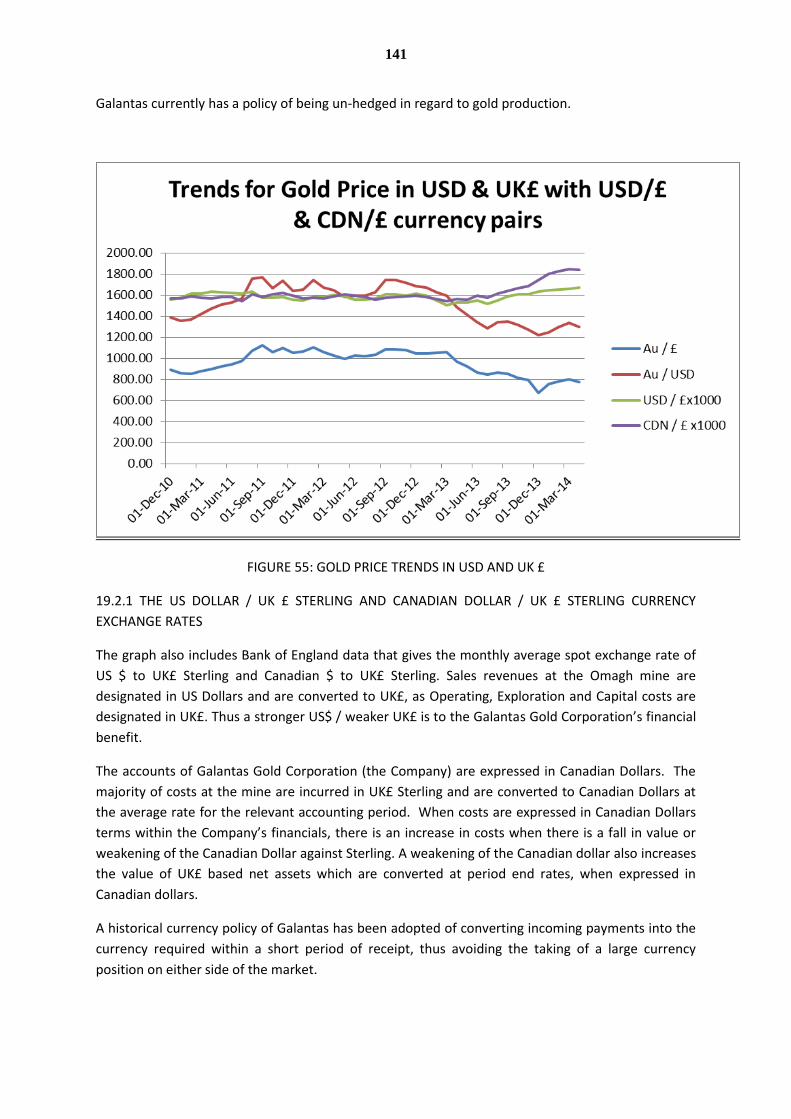
141
Galantas currently has a policy of being un-hedged in regard to gold production.
FIGURE 55: GOLD PRICE TRENDS IN USD AND UK £
19.2.1 THE US DOLLAR / UK £ STERLING AND CANADIAN DOLLAR / UK £ STERLING CURRENCY
EXCHANGE RATES
The graph also includes Bank of England data that gives the monthly average spot exchange rate of
US $ to UK£ Sterling and Canadian $ to UK£ Sterling. Sales revenues at the Omagh mine are
designated in US Dollars and are converted to UK£, as Operating, Exploration and Capital costs are
designated in UK£. Thus a stronger US$ / weaker UK£ is to the Galantas Gold Corporation’s financial
benefit.
The accounts of Galantas Gold Corporation (the Company) are expressed in Canadian Dollars. The
majority of costs at the mine are incurred in UK£ Sterling and are converted to Canadian Dollars at
the average rate for the relevant accounting period. When costs are expressed in Canadian Dollars
terms within the Company’s financials, there is an increase in costs when there is a fall in value or
weakening of the Canadian Dollar against Sterling. A weakening of the Canadian dollar also increases
the value of UK£ based net assets which are converted at period end rates, when expressed in
Canadian dollars.
A historical currency policy of Galantas has been adopted of converting incoming payments into the
currency required within a short period of receipt, thus avoiding the taking of a large currency
position on either side of the market.
142
Whilst it is recognised that the USD/UK£ currency pair can impact overall profitability of the project
and the CDN/UK£ currency pair can effect profit recognition, neither currency pair appear to suffer
the same amount of volatility as the gold price. The volatility of the gold price can effect project
profitability and for that reason three price scenarios have been examined for the project. To
accommodate the volatility of the USD / UK£ currency pair, the project has been assessed in gold
prices based in UK£. These prices are at a mid-price of £750 per ounce, an upper price of £800 per
ounce and a lower price of £700 per ounce.
An average gold price of £800 per ounce (an increase of 6.7% or £50 per ounce on the mid-price)
results in an 28% improvement in the financial outcome of the model.
An average gold price of £700 per ounce (a decrease of 6.7% or £50 per ounce on the mid-price)
results in an 28% decline in the financial outcome of the model.
The lowest average quarterly price from between December 2011 and March 2014 was £761.24 per
ounce, which was in the fourth quarter of 2013. Although Gold prices have hardened markedly since
that time, a forward looking average quarterly price for gold of £750 within the short term would
not seem unreasonable within the current context, with volatility on a month to month basis.
The main uses for gold are currently in Jewellery, Investment, Technology and Reserve Asset
Management. According to the World Gold Council, “After an exceptional 2013, gold demand made
a robust start to 2014 - virtually unchanged year-on-year at 1,074.5 tonnes. Jewellery demand
gained moderately, largely due to the environment of lower gold prices compared with Q1 2013 and
seasonal factors in many markets. Divergence was seen within the investment space: net ETFs flows
were zero, compared with 177t of outflows in Q1 2013, while bar and coin investment unsurprisingly
fell far below the record Q1 levels of demand seen a year ago. Central banks continued to purchase
gold for its diversification and risk management properties.”
One factor that may aid price stability is the report of an agreement (19th May 2014) between 21
European banks, including the European Central Bank to restrict sales of significant amounts of gold.
The agreement is effective 27 September 2014.
The main factors affecting gold price historically appear to be fiscal and international instabilities.
For the most part, future events are not easily forecast and the relative stability and purchasing
power of gold forms part of its investment attraction. Current instabilities include the United States
budget deficit / bond purchases, Euro zone deficits, bank instabilities and tensions within the Middle
East and Ukraine. A low interest rate environment is seen by several commentators to be supportive
of the price of gold and these commentators expect such conditions to persist globally with local
variations outside of the US.
143
20 ENVIRONMENTAL STUDIES, PERMITTING AND SOCIAL OR COMMUNITY IMPACT
20.1 PERMITTING
The underground mine, uprated processing plant and the export of a limited quantity of country
rock from the underground mine will require planning permits to be issued through the Planning
Service, Department of the Environment for Northern Ireland. OML submitted a detailed
Environmental Impact Assessment with a planning application on 6th July 2012. Since that date
neighbour and statutory consultations have taken place. Several statutory consultees have written
with comments encouraging approval. Notable are positive comments by Roads Service and Omagh
District Council. Consultations continue with statutory consultees and Galantas is confident any
remaining issues can be satisfactorily addressed to create a positive economic benefit for the local
community whilst preserving strong environmental control.
20.2 RECENT ENVIRONMENTAL STUDIES
Galantas notes two recent environmental studies on the operating mine site. The first of these
studies prove conclusively that the country rock found at the mine is not acid forming and that some
of the rocks are indicated to be potentially acid neutralising. The sampling was carried out by
independent, environmental monitoring company Pentland Macdonald Ltd of Belfast. They
undertook the collection of a representative set of 100 samples, with analysis taking place at the SGS
Minerals Services Ltd laboratory in Cornwall. This extensive study is consistent with the results of
earlier studies, which also showed no acid generation potential.
In a second report, a detailed Northern Ireland Environment Agency (NIEA) water study (June 2013)
has declared Galantas subsidiary, Omagh Minerals Ltd, operator of the Omagh gold-mine, fully
compliant with its water outlet requirements. The NIEA study, which is the second one of its type on
the gold-mine property with similar results, backs up routine sampling data with more detailed
continuously recorded information and also demonstrates that no acidic drainage from the mine
takes place.
The mine is subject to a wide range of environmental monitoring by regulatory agencies. Routine
sampling is carried out on behalf of Galantas by an independent sampling contractor and monitoring
takes place of noise, dust, surface water and ground water. There are no material adverse
environmental issues of which the author (having investigated the matter) is aware.
21 CAPITAL, OPERATING COSTS
Given that mining within the open pits has drawn to a close and stocked low grade material has
ceased being routinely worked, there have been substantive reductions in the labour force from 50
persons to 5. Operating costs have been substantially reduced through redundancies and costs are
expected to fall. No forward looking guidance has been offered on cost reduction.
Life Of Mine (LOM) Capital expenditure for the Underground Mine has been estimated as per the
table below (Table 51). It should be noted that potential Leasable Equipment capital expenditure
does not include costs associated with potential lease purchase arrangements which would spread
the expenditure over 4 years.
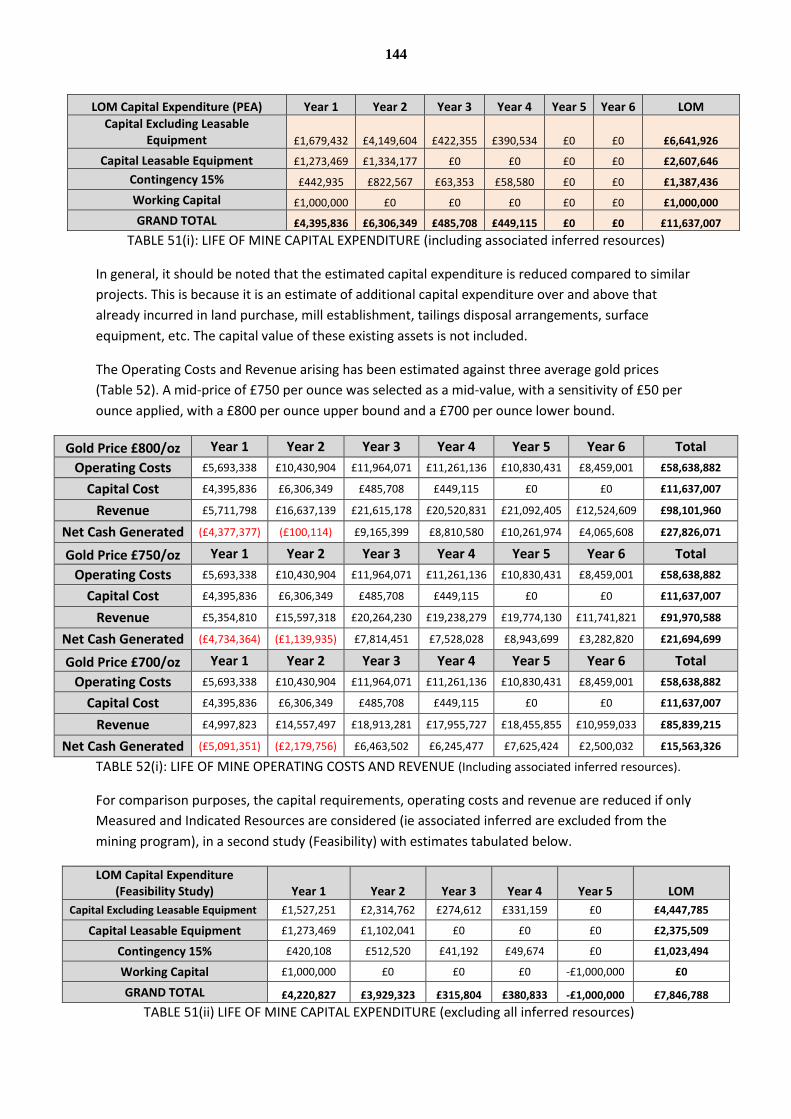
144
LOM Capital Expenditure (PEA) Year 1 Year 2 Year 3 Year 4 Year 5 Year 6 LOM
Capital Excluding Leasable Equipment £1,679,432 £4,149,604 £422,355 £390,534 £0 £0 £6,641,926
Capital Leasable Equipment £1,273,469 £1,334,177 £0 £0 £0 £0 £2,607,646
Contingency 15% £442,935 £822,567 £63,353 £58,580 £0 £0 £1,387,436
Working Capital £1,000,000 £0 £0 £0 £0 £0 £1,000,000
GRAND TOTAL £4,395,836 £6,306,349 £485,708 £449,115 £0 £0 £11,637,007
TABLE 51(i): LIFE OF MINE CAPITAL EXPENDITURE (including associated inferred resources)
In general, it should be noted that the estimated capital expenditure is reduced compared to similar
projects. This is because it is an estimate of additional capital expenditure over and above that
already incurred in land purchase, mill establishment, tailings disposal arrangements, surface
equipment, etc. The capital value of these existing assets is not included.
The Operating Costs and Revenue arising has been estimated against three average gold prices
(Table 52). A mid-price of £750 per ounce was selected as a mid-value, with a sensitivity of £50 per
ounce applied, with a £800 per ounce upper bound and a £700 per ounce lower bound.
Gold Price £800/oz Year 1 Year 2 Year 3 Year 4 Year 5 Year 6 Total
Operating Costs £5,693,338 £10,430,904 £11,964,071 £11,261,136 £10,830,431 £8,459,001 £58,638,882
Capital Cost £4,395,836 £6,306,349 £485,708 £449,115 £0 £0 £11,637,007
Revenue £5,711,798 £16,637,139 £21,615,178 £20,520,831 £21,092,405 £12,524,609 £98,101,960
Net Cash Generated (£4,377,377) (£100,114) £9,165,399 £8,810,580 £10,261,974 £4,065,608 £27,826,071
Gold Price £750/oz Year 1 Year 2 Year 3 Year 4 Year 5 Year 6 Total
Operating Costs £5,693,338 £10,430,904 £11,964,071 £11,261,136 £10,830,431 £8,459,001 £58,638,882
Capital Cost £4,395,836 £6,306,349 £485,708 £449,115 £0 £0 £11,637,007
Revenue £5,354,810 £15,597,318 £20,264,230 £19,238,279 £19,774,130 £11,741,821 £91,970,588
Net Cash Generated (£4,734,364) (£1,139,935) £7,814,451 £7,528,028 £8,943,699 £3,282,820 £21,694,699
Gold Price £700/oz Year 1 Year 2 Year 3 Year 4 Year 5 Year 6 Total
Operating Costs £5,693,338 £10,430,904 £11,964,071 £11,261,136 £10,830,431 £8,459,001 £58,638,882
Capital Cost £4,395,836 £6,306,349 £485,708 £449,115 £0 £0 £11,637,007
Revenue £4,997,823 £14,557,497 £18,913,281 £17,955,727 £18,455,855 £10,959,033 £85,839,215
Net Cash Generated (£5,091,351) (£2,179,756) £6,463,502 £6,245,477 £7,625,424 £2,500,032 £15,563,326
TABLE 52(i): LIFE OF MINE OPERATING COSTS AND REVENUE (Including associated inferred resources).
For comparison purposes, the capital requirements, operating costs and revenue are reduced if only
Measured and Indicated Resources are considered (ie associated inferred are excluded from the
mining program), in a second study (Feasibility) with estimates tabulated below.
LOM Capital Expenditure (Feasibility Study) Year 1 Year 2 Year 3 Year 4 Year 5 LOM
Capital Excluding Leasable Equipment £1,527,251 £2,314,762 £274,612 £331,159 £0 £4,447,785
Capital Leasable Equipment £1,273,469 £1,102,041 £0 £0 £0 £2,375,509
Contingency 15% £420,108 £512,520 £41,192 £49,674 £0 £1,023,494
Working Capital £1,000,000 £0 £0 £0 -£1,000,000 £0
GRAND TOTAL £4,220,827 £3,929,323 £315,804 £380,833 -£1,000,000 £7,846,788
TABLE 51(ii) LIFE OF MINE CAPITAL EXPENDITURE (excluding all inferred resources)
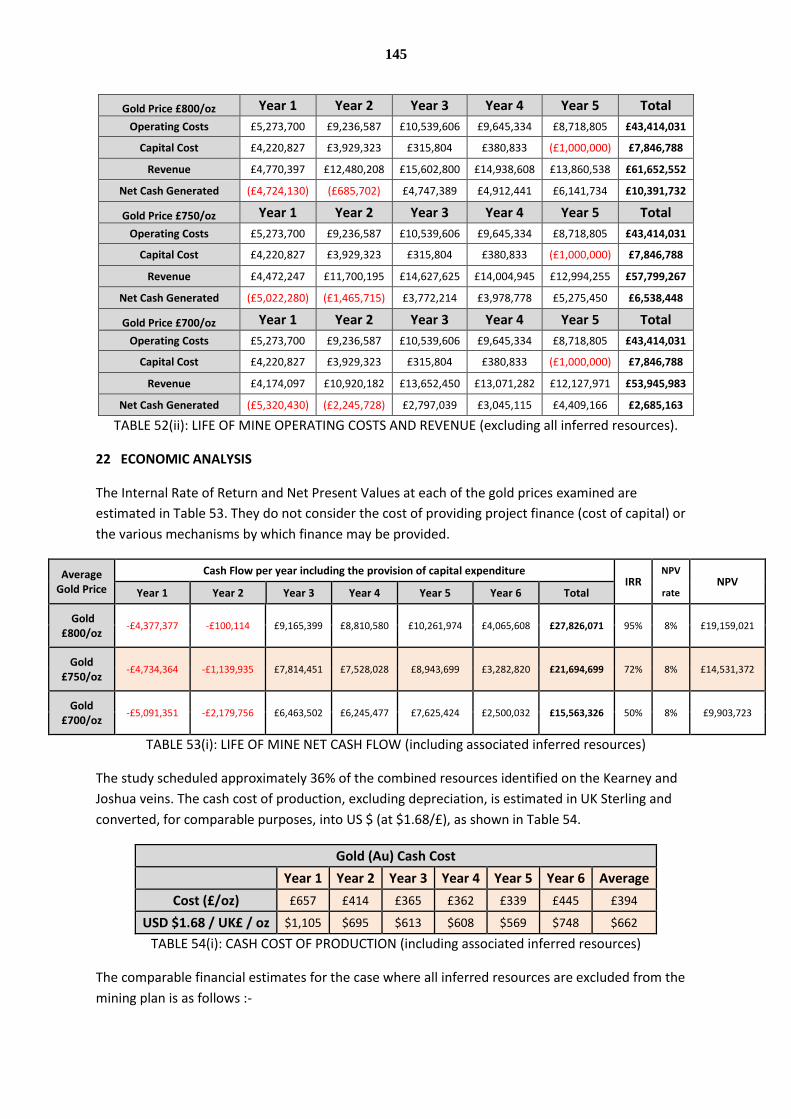
145
Gold Price £800/oz Year 1 Year 2 Year 3 Year 4 Year 5 Total
Operating Costs £5,273,700 £9,236,587 £10,539,606 £9,645,334 £8,718,805 £43,414,031
Capital Cost £4,220,827 £3,929,323 £315,804 £380,833 (£1,000,000) £7,846,788
Revenue £4,770,397 £12,480,208 £15,602,800 £14,938,608 £13,860,538 £61,652,552
Net Cash Generated (£4,724,130) (£685,702) £4,747,389 £4,912,441 £6,141,734 £10,391,732
Gold Price £750/oz Year 1 Year 2 Year 3 Year 4 Year 5 Total
Operating Costs £5,273,700 £9,236,587 £10,539,606 £9,645,334 £8,718,805 £43,414,031
Capital Cost £4,220,827 £3,929,323 £315,804 £380,833 (£1,000,000) £7,846,788
Revenue £4,472,247 £11,700,195 £14,627,625 £14,004,945 £12,994,255 £57,799,267
Net Cash Generated (£5,022,280) (£1,465,715) £3,772,214 £3,978,778 £5,275,450 £6,538,448
Gold Price £700/oz Year 1 Year 2 Year 3 Year 4 Year 5 Total
Operating Costs £5,273,700 £9,236,587 £10,539,606 £9,645,334 £8,718,805 £43,414,031
Capital Cost £4,220,827 £3,929,323 £315,804 £380,833 (£1,000,000) £7,846,788
Revenue £4,174,097 £10,920,182 £13,652,450 £13,071,282 £12,127,971 £53,945,983
Net Cash Generated (£5,320,430) (£2,245,728) £2,797,039 £3,045,115 £4,409,166 £2,685,163
TABLE 52(ii): LIFE OF MINE OPERATING COSTS AND REVENUE (excluding all inferred resources).
22 ECONOMIC ANALYSIS
The Internal Rate of Return and Net Present Values at each of the gold prices examined are
estimated in Table 53. They do not consider the cost of providing project finance (cost of capital) or
the various mechanisms by which finance may be provided.
Average Gold Price
Cash Flow per year including the provision of capital expenditure IRR
NPV NPV
Year 1 Year 2 Year 3 Year 4 Year 5 Year 6 Total rate
Gold £800/oz
-£4,377,377 -£100,114 £9,165,399 £8,810,580 £10,261,974 £4,065,608 £27,826,071 95% 8% £19,159,021
Gold £750/oz
-£4,734,364 -£1,139,935 £7,814,451 £7,528,028 £8,943,699 £3,282,820 £21,694,699 72% 8% £14,531,372
Gold £700/oz
-£5,091,351 -£2,179,756 £6,463,502 £6,245,477 £7,625,424 £2,500,032 £15,563,326 50% 8% £9,903,723
TABLE 53(i): LIFE OF MINE NET CASH FLOW (including associated inferred resources)
The study scheduled approximately 36% of the combined resources identified on the Kearney and
Joshua veins. The cash cost of production, excluding depreciation, is estimated in UK Sterling and
converted, for comparable purposes, into US $ (at $1.68/£), as shown in Table 54.
Gold (Au) Cash Cost
Year 1 Year 2 Year 3 Year 4 Year 5 Year 6 Average
Cost (£/oz) £657 £414 £365 £362 £339 £445 £394
USD $1.68 / UK£ / oz $1,105 $695 $613 $608 $569 $748 $662
TABLE 54(i): CASH COST OF PRODUCTION (including associated inferred resources)
The comparable financial estimates for the case where all inferred resources are excluded from the
mining plan is as follows :-
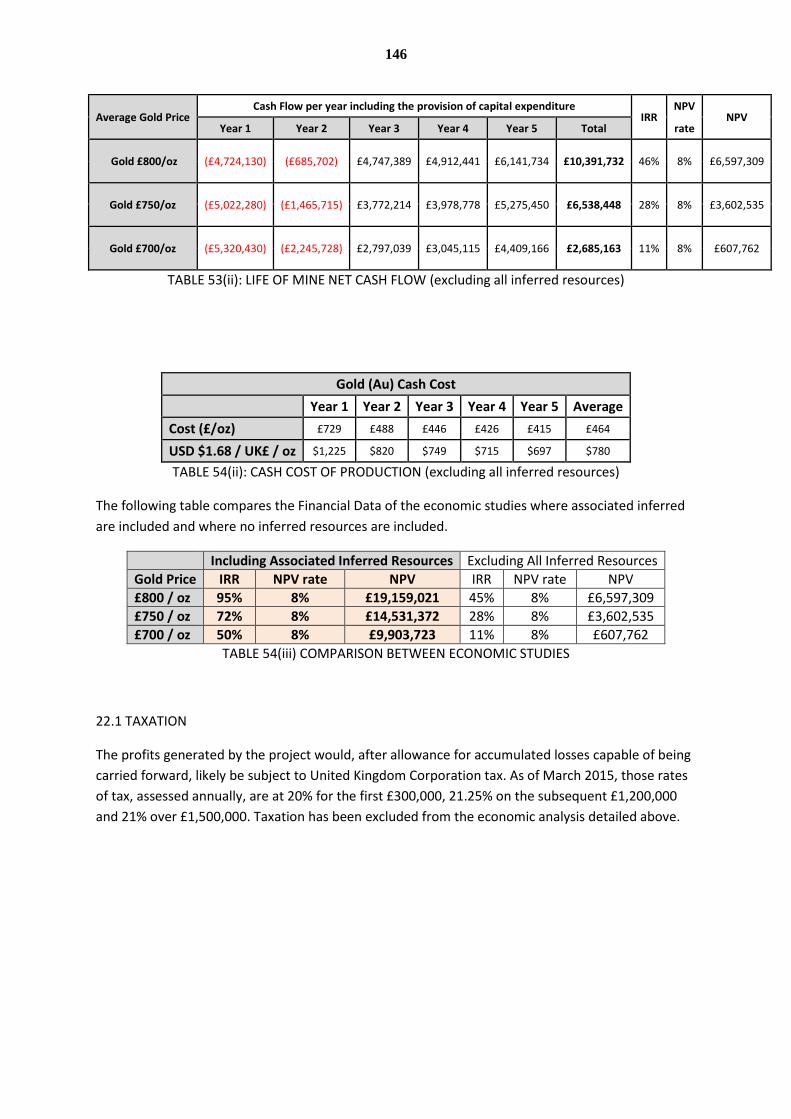
146
Average Gold Price Cash Flow per year including the provision of capital expenditure
IRR NPV
NPV Year 1 Year 2 Year 3 Year 4 Year 5 Total rate
Gold £800/oz (£4,724,130) (£685,702) £4,747,389 £4,912,441 £6,141,734 £10,391,732 46% 8% £6,597,309
Gold £750/oz (£5,022,280) (£1,465,715) £3,772,214 £3,978,778 £5,275,450 £6,538,448 28% 8% £3,602,535
Gold £700/oz (£5,320,430) (£2,245,728) £2,797,039 £3,045,115 £4,409,166 £2,685,163 11% 8% £607,762
TABLE 53(ii): LIFE OF MINE NET CASH FLOW (excluding all inferred resources)
Gold (Au) Cash Cost
Year 1 Year 2 Year 3 Year 4 Year 5 Average
Cost (£/oz) £729 £488 £446 £426 £415 £464
USD $1.68 / UK£ / oz $1,225 $820 $749 $715 $697 $780
TABLE 54(ii): CASH COST OF PRODUCTION (excluding all inferred resources)
The following table compares the Financial Data of the economic studies where associated inferred
are included and where no inferred resources are included.
Including Associated Inferred Resources Excluding All Inferred Resources
Gold Price IRR NPV rate NPV IRR NPV rate NPV
£800 / oz 95% 8% £19,159,021 45% 8% £6,597,309
£750 / oz 72% 8% £14,531,372 28% 8% £3,602,535
£700 / oz 50% 8% £9,903,723 11% 8% £607,762
TABLE 54(iii) COMPARISON BETWEEN ECONOMIC STUDIES
22.1 TAXATION
The profits generated by the project would, after allowance for accumulated losses capable of being
carried forward, likely be subject to United Kingdom Corporation tax. As of March 2015, those rates
of tax, assessed annually, are at 20% for the first £300,000, 21.25% on the subsequent £1,200,000
and 21% over £1,500,000. Taxation has been excluded from the economic analysis detailed above.

147
23 ADJACENT PROPERTIES
The following information is based upon Howe 2012 and has been amended.
The ground to the northeast of MR 1/08, comprising DG1/08, DG 2/08, DG 3/11 and DG4/11, is held
by Dalradian Resources Inc.
The principal deposit lying within the Dalradian Resources licences is the Curraghinalt gold deposit
located approximately 23 kilometres NE of Cavanacaw (see Figure 4). The Curraghinalt deposit
contains mesothermal gold mineralisation, with gold disseminated in a swarm of quartz-sulphide
veins hosted by the Dalradian-aged Mullagharn formation and is underlain by the Omagh thrust, a
stratigraphic and structural setting similar to that of the Cavanacaw deposit. The Curraghinalt veins
dip 60-70 degrees north, and strike west-northwest which is in contrast to the predominant
northerly trend of the Cavanacaw veins. The phases of mineralisation appear to be different, with an
increased amount of copper mineralisation present and a reduced amount of lead mineralisation.
An NI 43-101 compliant resource estimate for the Curraghinalt deposit was prepared by Micon
International Limited, and filed on SEDAR on January 13th 2012, as a report entitled “An Updated
Mineral Resource Estimate for the Curraghinalt Gold Deposit, Tyrone Project, Co Tyrone and County
Londonderry, Northern Ireland”, in which CIM compliant Measured and Indicated Resources of 1.13
million tonnes at 13.00 g/t Au and Inferred Resources of 5.45 million tonnes at 12.74 g/t Au,
effective at November 30th, 2011 were reported. An increased resource estimate was announced on
April 16th 2014. Measured resources were estimated at 15,100 ounces, Indicated resources 989,000
ounces and inferred resources 2,487,700 ounces. The author (Galantas 2014) has not verified this
information and it is not necessarily indicative of the mineralisation on the Galantas property.
A number of copper-gold occurrences are hosted by Ordovician volcanic rocks of the Tyrone Inlier,
located to the southeast of Curraghinalt and covered by the Dalradian Resources licence DG2/08.
These occurrences are less relevant to the Omagh Minerals ground since no rocks of this age or type
are known to occur.
24 OTHER RELEVANT DATA AND INFORMATION
None
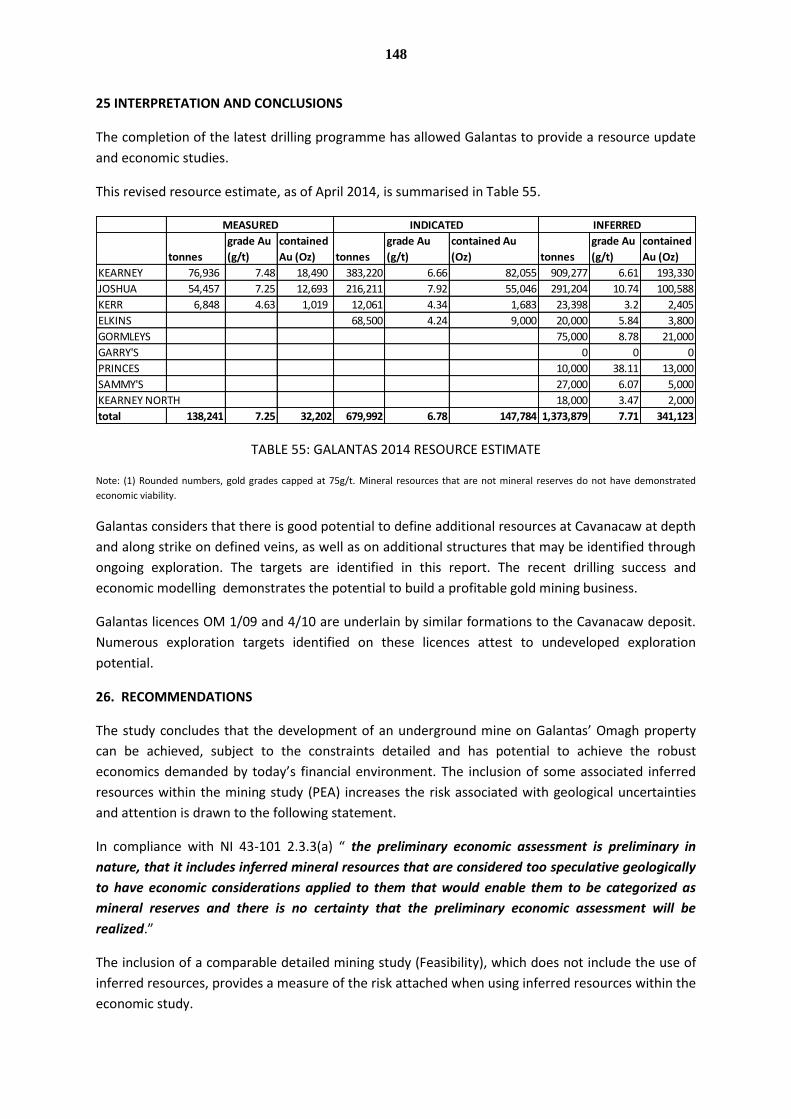
148
25 INTERPRETATION AND CONCLUSIONS
The completion of the latest drilling programme has allowed Galantas to provide a resource update
and economic studies.
This revised resource estimate, as of April 2014, is summarised in Table 55.
TABLE 55: GALANTAS 2014 RESOURCE ESTIMATE
Note: (1) Rounded numbers, gold grades capped at 75g/t. Mineral resources that are not mineral reserves do not have demonstrated
economic viability.
Galantas considers that there is good potential to define additional resources at Cavanacaw at depth
and along strike on defined veins, as well as on additional structures that may be identified through
ongoing exploration. The targets are identified in this report. The recent drilling success and
economic modelling demonstrates the potential to build a profitable gold mining business.
Galantas licences OM 1/09 and 4/10 are underlain by similar formations to the Cavanacaw deposit.
Numerous exploration targets identified on these licences attest to undeveloped exploration
potential.
26. RECOMMENDATIONS
The study concludes that the development of an underground mine on Galantas’ Omagh property
can be achieved, subject to the constraints detailed and has potential to achieve the robust
economics demanded by today’s financial environment. The inclusion of some associated inferred
resources within the mining study (PEA) increases the risk associated with geological uncertainties
and attention is drawn to the following statement.
In compliance with NI 43-101 2.3.3(a) “ the preliminary economic assessment is preliminary in
nature, that it includes inferred mineral resources that are considered too speculative geologically
to have economic considerations applied to them that would enable them to be categorized as
mineral reserves and there is no certainty that the preliminary economic assessment will be
realized.”
The inclusion of a comparable detailed mining study (Feasibility), which does not include the use of
inferred resources, provides a measure of the risk attached when using inferred resources within the
economic study.
tonnes
grade Au
(g/t)
contained
Au (Oz) tonnes
grade Au
(g/t)
contained Au
(Oz) tonnes
grade Au
(g/t)
contained
Au (Oz)
KEARNEY 76,936 7.48 18,490 383,220 6.66 82,055 909,277 6.61 193,330
JOSHUA 54,457 7.25 12,693 216,211 7.92 55,046 291,204 10.74 100,588
KERR 6,848 4.63 1,019 12,061 4.34 1,683 23,398 3.2 2,405
ELKINS 68,500 4.24 9,000 20,000 5.84 3,800
GORMLEYS 75,000 8.78 21,000
GARRY'S 0 0 0
PRINCES 10,000 38.11 13,000
SAMMY'S 27,000 6.07 5,000
KEARNEY NORTH 18,000 3.47 2,000
total 138,241 7.25 32,202 679,992 6.78 147,784 1,373,879 7.71 341,123
MEASURED INDICATED INFERRED

149
27. REFERENCES
Abzalov, M. 2011. Sampling Errors and Control of Assay Data Quality in Exploration and Mining
geology. In Application and Experience of Quality Control, InTECH, Vienna, Austria, p.611-
644.
ACA Howe International Limited, 21st July 2003. Geological report on the Omagh gold deposits and
the exploration potential of the Lack gold licence, County Tyrone, Northern Ireland for
European Gold Resources Inc. Report No. 851a, April 15, 2003. Revised: July 21, 2003.
ACA Howe International Limited, March 2004A. Exploration report on the outlying areas of the
Omagh Minerals Limited gold licence, County Tyrone, Northern Ireland, for European Gold
Resources Inc.
ACA Howe International Limited, 20th August 2004B. Letter to The Directors, European Gold
Resources, on the subject of reserves and resources of the Omagh gold project.
ACA Howe International Limited, December 2005. Technical Review of the Gold Mining and
Exploration Interests of the Omagh Gold Project of Galantas Gold Corporation in Northern
Ireland. Filed on SEDAR.
ACA Howe International Limited, October 2006. Report on Channel Sampling and Mapping Activities
undertaken over the Kearney Vein, Omagh Mine, County Tyrone, Northern Ireland.
ACA Howe International Limited, May 2008. Technical Report on the Omagh Gold Project, Counties
Tyrone and Fermanagh, Northern Ireland, for Galantas Gold Corporation. Filed on SEDAR.
ACA Howe International Limited, August 2012. Technical report on the Omagh Gold Project, counties
Tyrone and Fermanagh, Northern Ireland, for Galantas Gold Corporation. Filed on SEDAR.
ALS Minerals Geochemistry Schedule of Services Fees EUR 2013 .pdf
Canadian Institute of Mining Metallurgy and Petroleum, 2005. The CIM Definition Standards on
Mineral Resources and Mineral Reserves.
Cliff, D.C., and Wolfenden, M. 1992. The Lack gold deposit, Northern Ireland, in Bowden, A.A., Earls
G., O’Connor, P.G., and Pyne. J.F., eds., The Irish minerals industry 1980-1990: Dublin, Irish
Association for Economic Geology, p. 65–75.
Clifford, J.A., Earls, G., Meldrum, A.H., and Moore, N. 1992. Gold in the Sperrin Mountains, Northern
Ireland: An exploration case history, in Bowden A.A., Earls G., O’Connor, P.G., and Pyne. J.F.,
eds., The Irish Minerals Industry 1980-1990: Dublin, Irish Association for Economic Geology,
p. 77–87.
Coulter, S. Galantas Internal Quarterly Reports, 2012 (Q1, Q2, Q3, Q4) & 2013(Q1)
Coulter, S, and Stinson, J. 2013. A preliminary prospectivity map for the Tellus Border region, final
project report. http://www.tellusborder.eu/Research.

150
Earls, G., Clifford, J.A., and Meldrum, A.H. 1989. The Curraghinalt gold deposit, County Tyrone,
Northern Ireland: Institution of Mining and Metallurgy Transactions, sec. B, v. 98, p. 50–51.
Earls, G., Hutton, D.W.H., Wilkinson, J., Moles, N., Parnell, J., Fallick, A., and Boyce, A. 1996. The gold
metallogeny of northwest Northern Ireland: Geological Survey of Northern Ireland Technical
Report 96/6, 107 p
Galantas Gold Corporation website - http://www.galantas.com
Galantas Gold Corporation, July 2005. Technical Report on the Kearney Northern Extension Trench.
(Galantas Internal Report by J.McFarlane)
Galantas Gold Corporation, November 2005. Galantas internal documents listing equipment
specifications, prices and quotations (Folder entitled Galantas Gold Flotation Plant and
Quarry November 2005)
Galantas Gold Corporation, 1st December 2005A. MEMORANDUM To: Roland Phelps – CEO, Galantas
Gold Corporation. Subject: Omagh mine reserve and resource expansion program for 2006-
07. From: M. J. Lavigne, Director, Vice President Exploration and Development.
Galantas Gold Corporation, 1st December 2005B. MEMORANDUM To: Roland Phelps – CEO, Galantas
Gold Corporation. Subject: Gold Resource Discovery program for 2006-07. From: M. J.
Lavigne, Director, Vice President Exploration and Development.
Galantas Gold Corporation, 5th December 2005. Omagh Technical Report: An update of mining,
processing methodology, tailings disposal and costs.
Galantas Gold Corporation, 30th December 2005A. Mining Strategy at Kearney Pit. (Informal report
by L J Gunter.)
Galantas Gold Corporation, 30th December 2005B. Kearney Orebody Mining Schematic –
Longitudinal Projection. (Filename: KearneyVLPschematicOzAuandPitPhasesPicture1.png)
Galantas Gold Corporation, 2006. Report on the Exploration of the Commings Bog Anomaly
(Galantas Internal Report)
Galantas Gold Corporation, February 2006. Kearney South – Channel Sampling Extension. (Galantas
Internal Report by J.McFarlane).
Galantas Gold Corporation, 2007. The Geology of the Cavanacaw Gold Mine. Galantas Internal
PowerPoint slide presentation, by A. Crystal, IGES, University of Wales, Aberystwyth.
Galantas Gold Corporation, March 2007. Technical Report on the Geological Exploration of
McCombs vein (Galantas Internal Report by J. McFarlane)
Galantas Gold Corporation, July 2007. Technical Report on the Geological Exploration of a vein in the
Eastern Lagoon. (Galantas Internal Report by A. Crystal)
Galantas Gold Corporation, August 2007. Sampling of a vein exposed in the western face of the pit.
(Galantas Internal Report by J. McFarlane and A. Crystal)
151
Galantas Gold Corporation (Phelps, R and Mawson, M.) 2013. Technical report on the Omagh Gold
Project county Tyrone Northern Ireland. Filed on Sedar.
GeoMem, 13th September 2007, Quotation document relating to the FlexIt Survey Tool System.
Geotech Airborne Limited, August 2005. Report on a helicopter borne time domain electromagnetic
geophysical survey, Omagh property, Northern Ireland. For Galantas Gold Corporation.
(Includes an airborne magnetometer survey.)
Issaks, E.H, Srivastava, R. M. 1989.An Introduction to Applied Geosatistics. Oxford University Press.
Lusty P. A. J., A. G. Gunn, P. M. McDonnell, B. C. Chacksfield, M. R. Cooper and G. Earls. 2009. Gold
potential of the Dalradian rocks of north-west Northern Ireland: prospectivity analysis using
Tellus data. British Geological Survey Internal Report OR/08/039. 74 pp.
McFarlane, J.A.S., and Eves, J. 2008. Density Assessment Methodology Report, Galantas Gold
Corporation, Internal Report.
McFarlane, J.A.S., M. R. Cooper and D. M. Chew, 2009. New geological and geophysical insights into
the Dalradian Lack Inlier, Northern Ireland: Implications for lithostratigraphy and gold
mineralisation. Irish Association for Economic geology, Annual Review 2009, pp 57-59,
including a new geological map.
Micromine training manual version 2010(12.0)
Micromine Pty Ltd, 2011, Micromine Training V 11.0 Module 22– Resource Estimation.
OMAC Analytical Laboratory Website – www.omaclabs.com
Omagh Minerals Limited, 12th September 1998. Notes re reserves in Kearney structure. (Includes
tabulated calculation of tonnes per vertical metre at different cut-off grades in 10m strike
blocks.)Parnell, J, Earls, G, et al., 2000. Regional Fluid Flow and Gold Mineralisation in the
Dalradian of the Sperrin Mountains, Northern Ireland, Econ. Geol., vol. 95, pp 1389-1416
Woodham, C., Finlay, S., and Holman, R. 1989. Gold exploration in the Dalradian of Northern Ireland:
Institution of Mining and Metallurgy Transactions, sec. B, v. 98, p. 63–65.

152
28. CERTIFICATE
a) Roland Phelps Galantas Gold Corporation
36 Toronto Street
– Suite 1000,
Toronto,
Ontario Canada M5C 2C5
b) I, Roland Phelps, C.Eng., B.Sc. (Hons), MIMMM as co-author of this report entitled “Technical Report on the Omagh Gold Project”, prepared for Galantas Gold Corporation and dated 26
th July 2014, make
the following statements :
c) I was admitted to the degree of Bachelor of Science (Honours) in Mining Geology Combined, from the University Of Leeds, England on 22
nd July 1976.
I was elected a Member of the Institution of Mining and Metallurgy on 15th
May 1980.
I was elected a Member of the Institution Of Mining Engineers on 23rd
January 1980.
I am a Chartered Engineer and Registrant of the Engineering Council (Registrant No. 316051) and a
Member of the Institution of Materials, Mining and Metallurgy.
I have practiced as a geologist and mining engineer in Minerals Exploration, Resource Development
and Mine Development for over 30 years.
I am a “Qualified Person” for the purposes of National Instrument 43-101.
d) I have visited the property routinely since 2000 and at least 20 days specifically during the period covered by this report.
e) I acknowledge the assistance of M. Mawson B.Sc (Hons), FGS., (Exploration Geologist, Omagh Minerals Ltd), Dr. S. Coulter B.Sc(Hons), M.Sc, PhD, FGS (Senior Geologist, Omagh Minerals Ltd), and G. Harris BEng (Hons), ACSM, GradIMMM (Mining Consultant) in the preparation of this report but solely act as “Qualified Person” for the whole of this technical report.
f) I am not independent of the Issuer.
g) I have had routine involvement with the property since 2000, in a technical and managerial capacity.
h) I have read, and consider the report compliant with PERC and with National Instrument 43-101 and Form 43-101 F1.
i) I consider that, at the effective date of the technical report, to the best of my knowledge and belief, the technical report contains all material scientific and technical information that is required to be disclosed to make the technical report not misleading.
j) I consent to the filing of the Technical Report with any stock exchange and other regulatory authority and any publication by them for regulatory purposes, including electronic publication in the public company files on their website accessible by the public.
Roland Phelps, C.Eng MIMMM, President & CEO, Galantas Gold Corporation
Dated: 26th
July 2014

153
APPENDICES
APPENDIX 1: COMPARISON OF CIM AND PERC CODES
A simplified table comparing CIM and PERC codes, with the differences for each highlighted.
CIM Code Defined Term
Equivalent PERC Code Defined Term
Measured Mineral Resource
Measured Mineral Resource
Indicated Mineral Resource
Indicated Mineral Resource
Inferred Mineral Resource
Inferred Mineral Resource
Proven Reserve – by defined economic study which does not include the use of inferred resources within the mine plan. (NI.43-101 requires independence under certain circumstances.)
Proven Reserve – by defined economic study which permits the restricted inclusion of inferred resources within the mine plan where qualified
Probable Reserve – by defined economic study which does not include use of inferred resources within the mine plan. (NI.43-101 requires independence under certain circumstances.)
Probable Reserve – by defined economic study which permits the restricted inclusion of inferred resources within the mine plan where qualified
The above table is included as the requirement to satisfy NI 43-101 Part 7.1(2).
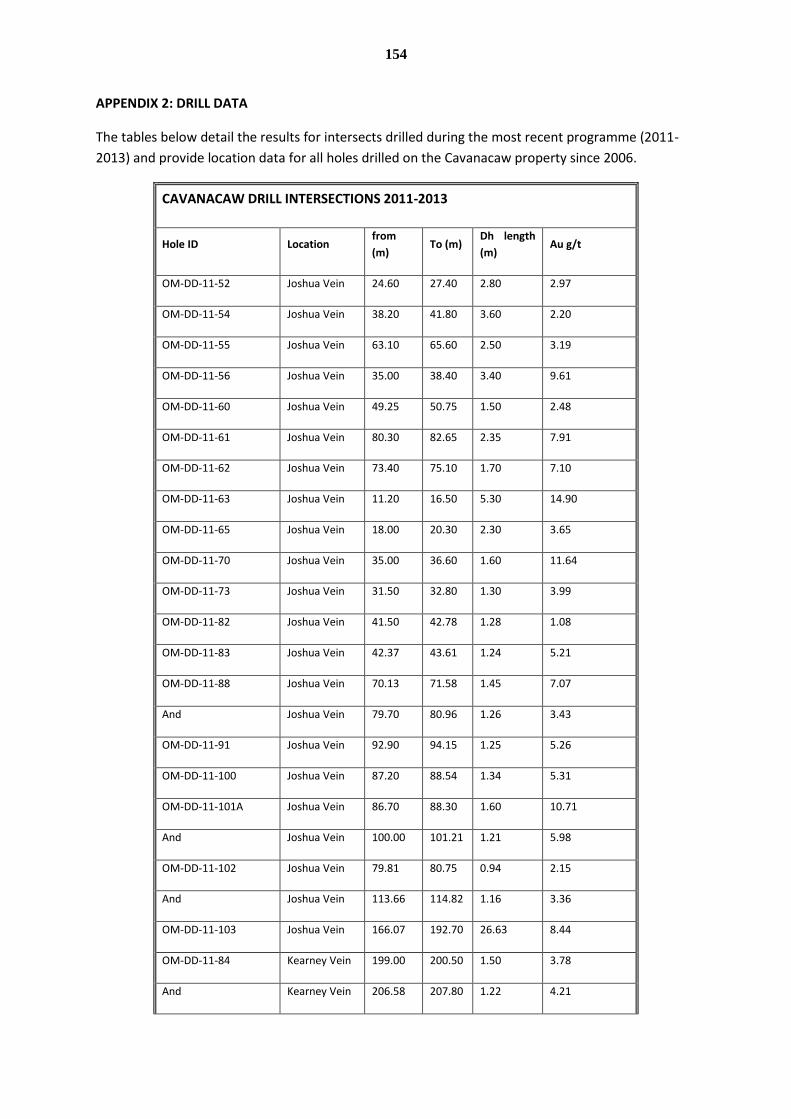
154
APPENDIX 2: DRILL DATA
The tables below detail the results for intersects drilled during the most recent programme (2011-
2013) and provide location data for all holes drilled on the Cavanacaw property since 2006.
CAVANACAW DRILL INTERSECTIONS 2011-2013
Hole ID Location from
(m) To (m)
Dh length
(m) Au g/t
OM-DD-11-52 Joshua Vein 24.60 27.40 2.80 2.97
OM-DD-11-54 Joshua Vein 38.20 41.80 3.60 2.20
OM-DD-11-55 Joshua Vein 63.10 65.60 2.50 3.19
OM-DD-11-56 Joshua Vein 35.00 38.40 3.40 9.61
OM-DD-11-60 Joshua Vein 49.25 50.75 1.50 2.48
OM-DD-11-61 Joshua Vein 80.30 82.65 2.35 7.91
OM-DD-11-62 Joshua Vein 73.40 75.10 1.70 7.10
OM-DD-11-63 Joshua Vein 11.20 16.50 5.30 14.90
OM-DD-11-65 Joshua Vein 18.00 20.30 2.30 3.65
OM-DD-11-70 Joshua Vein 35.00 36.60 1.60 11.64
OM-DD-11-73 Joshua Vein 31.50 32.80 1.30 3.99
OM-DD-11-82 Joshua Vein 41.50 42.78 1.28 1.08
OM-DD-11-83 Joshua Vein 42.37 43.61 1.24 5.21
OM-DD-11-88 Joshua Vein 70.13 71.58 1.45 7.07
And Joshua Vein 79.70 80.96 1.26 3.43
OM-DD-11-91 Joshua Vein 92.90 94.15 1.25 5.26
OM-DD-11-100 Joshua Vein 87.20 88.54 1.34 5.31
OM-DD-11-101A Joshua Vein 86.70 88.30 1.60 10.71
And Joshua Vein 100.00 101.21 1.21 5.98
OM-DD-11-102 Joshua Vein 79.81 80.75 0.94 2.15
And Joshua Vein 113.66 114.82 1.16 3.36
OM-DD-11-103 Joshua Vein 166.07 192.70 26.63 8.44
OM-DD-11-84 Kearney Vein 199.00 200.50 1.50 3.78
And Kearney Vein 206.58 207.80 1.22 4.21
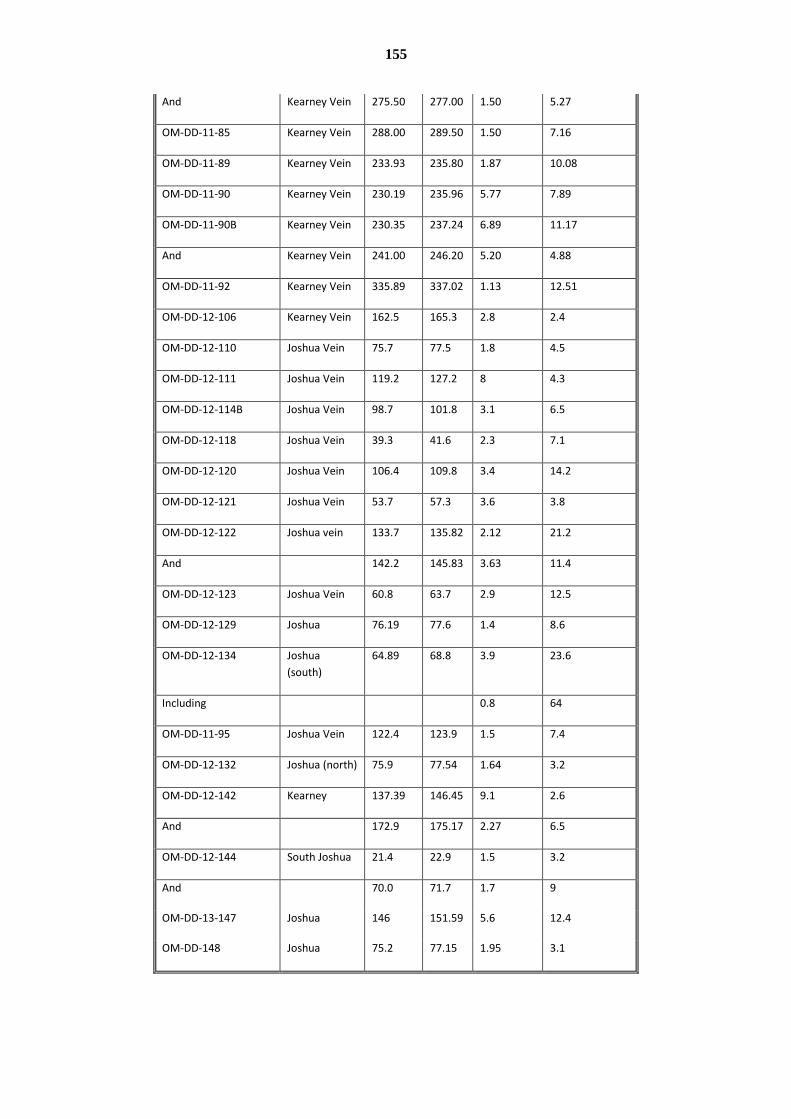
155
And Kearney Vein 275.50 277.00 1.50 5.27
OM-DD-11-85 Kearney Vein 288.00 289.50 1.50 7.16
OM-DD-11-89 Kearney Vein 233.93 235.80 1.87 10.08
OM-DD-11-90 Kearney Vein 230.19 235.96 5.77 7.89
OM-DD-11-90B Kearney Vein 230.35 237.24 6.89 11.17
And Kearney Vein 241.00 246.20 5.20 4.88
OM-DD-11-92 Kearney Vein 335.89 337.02 1.13 12.51
OM-DD-12-106 Kearney Vein 162.5 165.3 2.8 2.4
OM-DD-12-110 Joshua Vein 75.7 77.5 1.8 4.5
OM-DD-12-111 Joshua Vein 119.2 127.2 8 4.3
OM-DD-12-114B Joshua Vein 98.7 101.8 3.1 6.5
OM-DD-12-118 Joshua Vein 39.3 41.6 2.3 7.1
OM-DD-12-120 Joshua Vein 106.4 109.8 3.4 14.2
OM-DD-12-121 Joshua Vein 53.7 57.3 3.6 3.8
OM-DD-12-122 Joshua vein 133.7 135.82 2.12 21.2
And 142.2 145.83 3.63 11.4
OM-DD-12-123 Joshua Vein 60.8 63.7 2.9 12.5
OM-DD-12-129 Joshua 76.19 77.6 1.4 8.6
OM-DD-12-134 Joshua
(south)
64.89 68.8 3.9 23.6
Including 0.8 64
OM-DD-11-95 Joshua Vein 122.4 123.9 1.5 7.4
OM-DD-12-132 Joshua (north) 75.9 77.54 1.64 3.2
OM-DD-12-142 Kearney 137.39 146.45 9.1 2.6
And 172.9 175.17 2.27 6.5
OM-DD-12-144 South Joshua 21.4 22.9 1.5 3.2
And 70.0 71.7 1.7 9
OM-DD-13-147 Joshua 146 151.59 5.6 12.4
OM-DD-148 Joshua 75.2 77.15 1.95 3.1
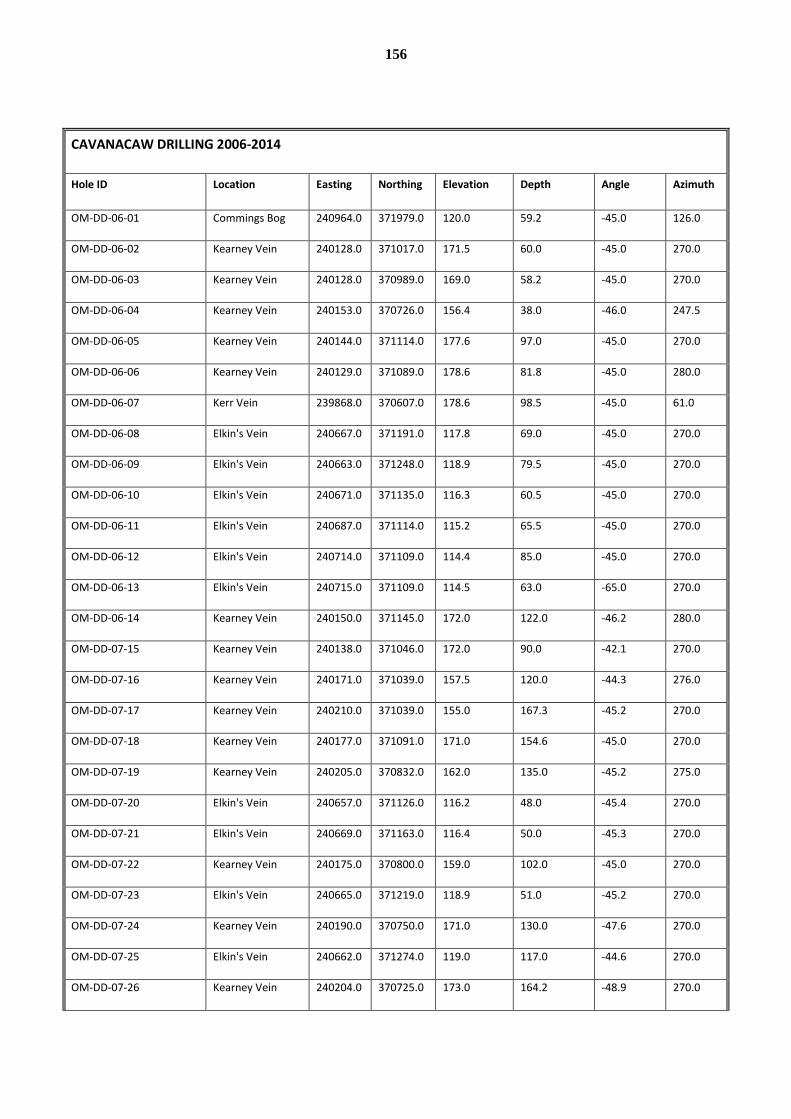
156
CAVANACAW DRILLING 2006-2014
Hole ID Location Easting Northing Elevation Depth Angle Azimuth
OM-DD-06-01 Commings Bog 240964.0 371979.0 120.0 59.2 -45.0 126.0
OM-DD-06-02 Kearney Vein 240128.0 371017.0 171.5 60.0 -45.0 270.0
OM-DD-06-03 Kearney Vein 240128.0 370989.0 169.0 58.2 -45.0 270.0
OM-DD-06-04 Kearney Vein 240153.0 370726.0 156.4 38.0 -46.0 247.5
OM-DD-06-05 Kearney Vein 240144.0 371114.0 177.6 97.0 -45.0 270.0
OM-DD-06-06 Kearney Vein 240129.0 371089.0 178.6 81.8 -45.0 280.0
OM-DD-06-07 Kerr Vein 239868.0 370607.0 178.6 98.5 -45.0 61.0
OM-DD-06-08 Elkin's Vein 240667.0 371191.0 117.8 69.0 -45.0 270.0
OM-DD-06-09 Elkin's Vein 240663.0 371248.0 118.9 79.5 -45.0 270.0
OM-DD-06-10 Elkin's Vein 240671.0 371135.0 116.3 60.5 -45.0 270.0
OM-DD-06-11 Elkin's Vein 240687.0 371114.0 115.2 65.5 -45.0 270.0
OM-DD-06-12 Elkin's Vein 240714.0 371109.0 114.4 85.0 -45.0 270.0
OM-DD-06-13 Elkin's Vein 240715.0 371109.0 114.5 63.0 -65.0 270.0
OM-DD-06-14 Kearney Vein 240150.0 371145.0 172.0 122.0 -46.2 280.0
OM-DD-07-15 Kearney Vein 240138.0 371046.0 172.0 90.0 -42.1 270.0
OM-DD-07-16 Kearney Vein 240171.0 371039.0 157.5 120.0 -44.3 276.0
OM-DD-07-17 Kearney Vein 240210.0 371039.0 155.0 167.3 -45.2 270.0
OM-DD-07-18 Kearney Vein 240177.0 371091.0 171.0 154.6 -45.0 270.0
OM-DD-07-19 Kearney Vein 240205.0 370832.0 162.0 135.0 -45.2 275.0
OM-DD-07-20 Elkin's Vein 240657.0 371126.0 116.2 48.0 -45.4 270.0
OM-DD-07-21 Elkin's Vein 240669.0 371163.0 116.4 50.0 -45.3 270.0
OM-DD-07-22 Kearney Vein 240175.0 370800.0 159.0 102.0 -45.0 270.0
OM-DD-07-23 Elkin's Vein 240665.0 371219.0 118.9 51.0 -45.2 270.0
OM-DD-07-24 Kearney Vein 240190.0 370750.0 171.0 130.0 -47.6 270.0
OM-DD-07-25 Elkin's Vein 240662.0 371274.0 119.0 117.0 -44.6 270.0
OM-DD-07-26 Kearney Vein 240204.0 370725.0 173.0 164.2 -48.9 270.0

157
OM-DD-07-27 Elkin's Vein 240688.0 371162.0 115.7 76.0 -45.1 270.0
OM-DD-07-28 Kearney Vein 240190.0 370675.0 167.0 101.4 -50.3 270.0
OM-DD-07-29 Elkin's Vein 240700.0 371219.0 117.7 111.0 -45.0 270.0
OM-DD-07-30 Kearney Vein 240188.0 370626.0 162.0 116.2 -50.3 270.0
OM-DD-07-31 Kearney Vein 240202.0 370850.0 161.0 143.4 -45.0 270.0
OM-DD-07-32 Kearney Vein 240155.0 370850.0 163.0 110.0 -45.3 267.0
OM-DD-07-33 Kearney Vein 240114.0 371322.0 161.0 120.0 -44.8 268.0
OM-DD-07-34 Kearney Vein 240180.0 370875.0 161.0 167.0 -49.2 271.0
Hole ID Location Easting Northing Elevation Depth Angle
Azimuth
OM-DD-07-36 Kearney Vein 240176.0 370900.0 165.0 140.0 -48.8 275.0
OM-DD-07-37 Kearney Vein 240176.0 370925.0 159.0 131.5 -50.0 270.0
OM-DD-07-38 Kearney Vein 240117.0 370921.0 169.0 104.0 -45.0 270.0
OM-DD-07-39 Kearney Vein 240111.0 371141.0 179.0 110.0 -45.0 270.0
OM-DD-07-40 Kearney Vein 240172.0 370973.0 167.0 125.4 -45.0 270.0
OM-DD-07-41 Kearney Vein 240221.0 371122.0 175.0 281.7 -50.1 270.0
OM-DD-07-42 Kearney Vein 240136.0 370946.0 167.0 68.0 -45.1 270.0
OM-DD-07-43 Kearney Vein 240125.0 371175.0 177.0 102.0 -45.3 274.0
OM-DD-07-44 Kearney Vein 240172.0 371072.0 169.0 125.0 -45.2 270.0
OM-DD-07-45 Kearney Vein 240229.0 370678.0 159.0 144.2 -44.7 270.0
OM-DD-07-46 Kearney Vein 240241.0 371174.0 153.0 329.0 -44.5 270.0
OM-DD-07-47 Kearney Vein 240206.0 371093.0 166.0 243.0 -44.0 270.0
OM-DD-07-48 Kearney Vein 240229.0 371217.0 165.0 258.5 -45.5 270.0
OM-DD-07-49 Kearney Vein 240250.0 371275.0 165.0 252.0 -45.0 270.0
OM-DD-11-51 Joshua Vein 239661.7 370914.5 173.4 59.2 -45.0 99.8
OM-DD-11-52 Joshua Vein 239624.4 370917.6 175.3 50.0 -45.0 107.5
OM-DD-11-53 Joshua Vein 239623.2 370917.9 175.3 100.4 -70.0 117.0
OM-DD-11-54 Joshua Vein 239624.7 370892.6 172.8 52.0 -45.0 95.5
OM-DD-11-55 Joshua Vein 239626.8 370863.0 167.6 71.0 -45.0 95.0
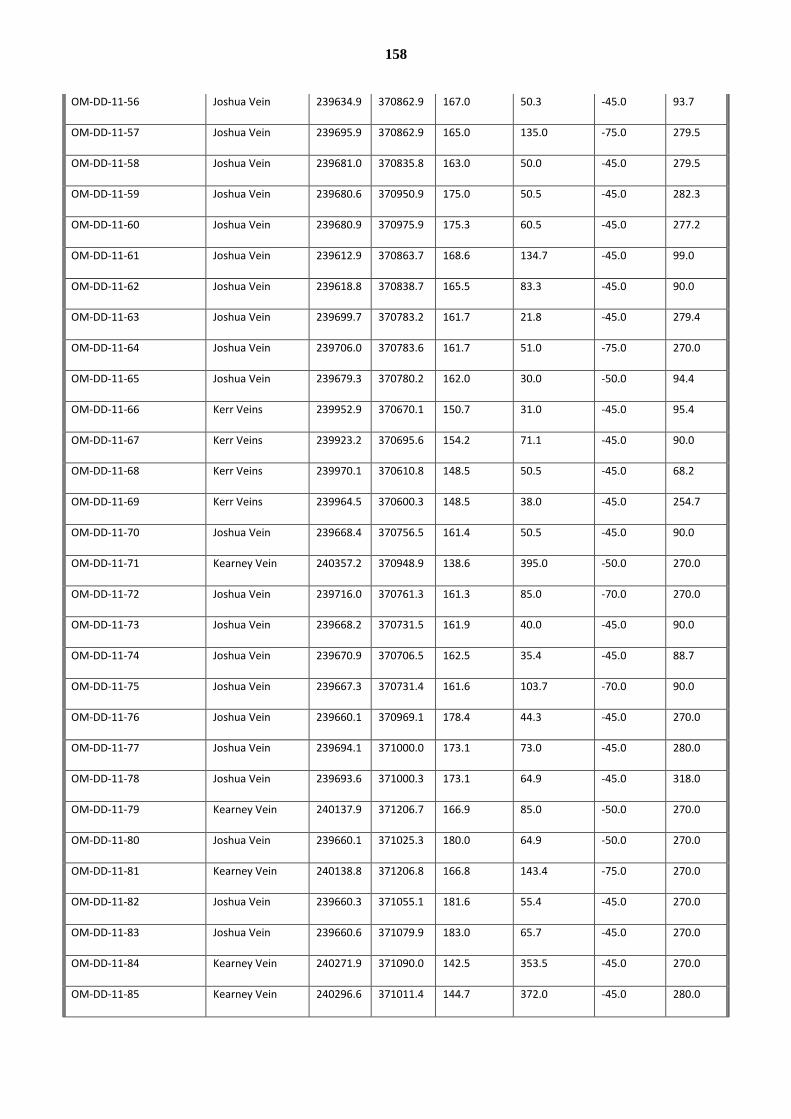
158
OM-DD-11-56 Joshua Vein 239634.9 370862.9 167.0 50.3 -45.0 93.7
OM-DD-11-57 Joshua Vein 239695.9 370862.9 165.0 135.0 -75.0 279.5
OM-DD-11-58 Joshua Vein 239681.0 370835.8 163.0 50.0 -45.0 279.5
OM-DD-11-59 Joshua Vein 239680.6 370950.9 175.0 50.5 -45.0 282.3
OM-DD-11-60 Joshua Vein 239680.9 370975.9 175.3 60.5 -45.0 277.2
OM-DD-11-61 Joshua Vein 239612.9 370863.7 168.6 134.7 -45.0 99.0
OM-DD-11-62 Joshua Vein 239618.8 370838.7 165.5 83.3 -45.0 90.0
OM-DD-11-63 Joshua Vein 239699.7 370783.2 161.7 21.8 -45.0 279.4
OM-DD-11-64 Joshua Vein 239706.0 370783.6 161.7 51.0 -75.0 270.0
OM-DD-11-65 Joshua Vein 239679.3 370780.2 162.0 30.0 -50.0 94.4
OM-DD-11-66 Kerr Veins 239952.9 370670.1 150.7 31.0 -45.0 95.4
OM-DD-11-67 Kerr Veins 239923.2 370695.6 154.2 71.1 -45.0 90.0
OM-DD-11-68 Kerr Veins 239970.1 370610.8 148.5 50.5 -45.0 68.2
OM-DD-11-69 Kerr Veins 239964.5 370600.3 148.5 38.0 -45.0 254.7
OM-DD-11-70 Joshua Vein 239668.4 370756.5 161.4 50.5 -45.0 90.0
OM-DD-11-71 Kearney Vein 240357.2 370948.9 138.6 395.0 -50.0 270.0
OM-DD-11-72 Joshua Vein 239716.0 370761.3 161.3 85.0 -70.0 270.0
OM-DD-11-73 Joshua Vein 239668.2 370731.5 161.9 40.0 -45.0 90.0
OM-DD-11-74 Joshua Vein 239670.9 370706.5 162.5 35.4 -45.0 88.7
OM-DD-11-75 Joshua Vein 239667.3 370731.4 161.6 103.7 -70.0 90.0
OM-DD-11-76 Joshua Vein 239660.1 370969.1 178.4 44.3 -45.0 270.0
OM-DD-11-77 Joshua Vein 239694.1 371000.0 173.1 73.0 -45.0 280.0
OM-DD-11-78 Joshua Vein 239693.6 371000.3 173.1 64.9 -45.0 318.0
OM-DD-11-79 Kearney Vein 240137.9 371206.7 166.9 85.0 -50.0 270.0
OM-DD-11-80 Joshua Vein 239660.1 371025.3 180.0 64.9 -50.0 270.0
OM-DD-11-81 Kearney Vein 240138.8 371206.8 166.8 143.4 -75.0 270.0
OM-DD-11-82 Joshua Vein 239660.3 371055.1 181.6 55.4 -45.0 270.0
OM-DD-11-83 Joshua Vein 239660.6 371079.9 183.0 65.7 -45.0 270.0
OM-DD-11-84 Kearney Vein 240271.9 371090.0 142.5 353.5 -45.0 270.0
OM-DD-11-85 Kearney Vein 240296.6 371011.4 144.7 372.0 -45.0 280.0
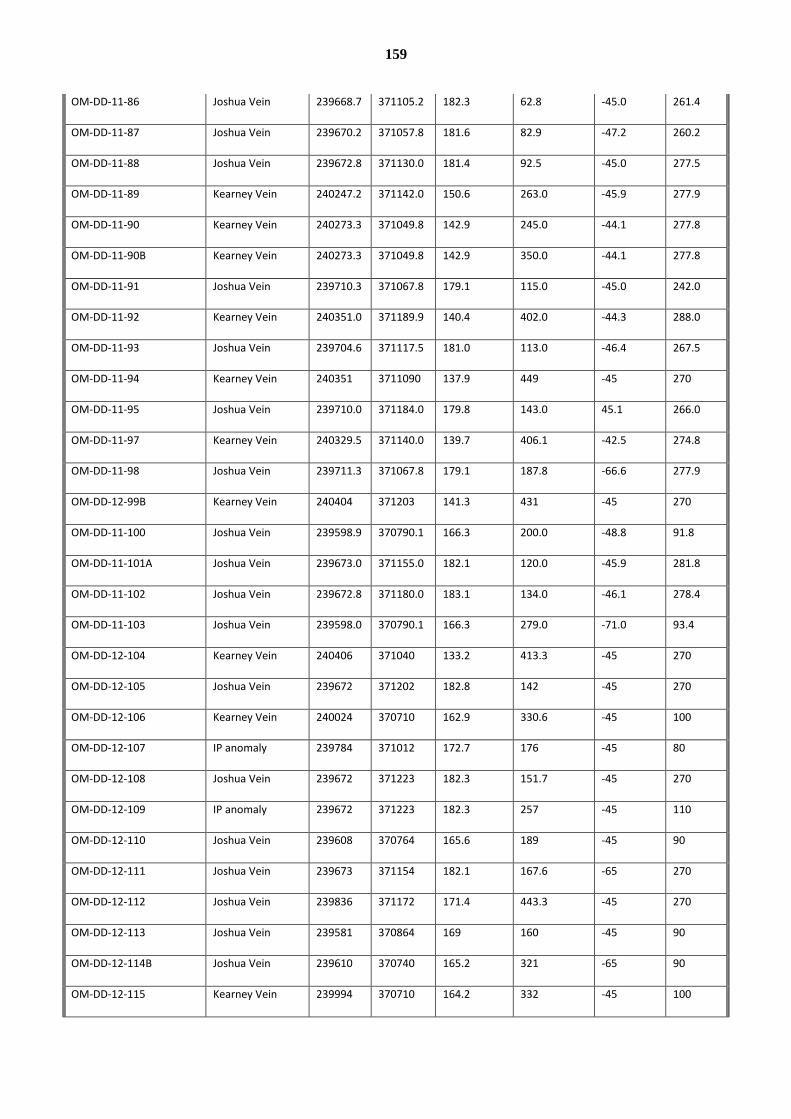
159
OM-DD-11-86 Joshua Vein 239668.7 371105.2 182.3 62.8 -45.0 261.4
OM-DD-11-87 Joshua Vein 239670.2 371057.8 181.6 82.9 -47.2 260.2
OM-DD-11-88 Joshua Vein 239672.8 371130.0 181.4 92.5 -45.0 277.5
OM-DD-11-89 Kearney Vein 240247.2 371142.0 150.6 263.0 -45.9 277.9
OM-DD-11-90 Kearney Vein 240273.3 371049.8 142.9 245.0 -44.1 277.8
OM-DD-11-90B Kearney Vein 240273.3 371049.8 142.9 350.0 -44.1 277.8
OM-DD-11-91 Joshua Vein 239710.3 371067.8 179.1 115.0 -45.0 242.0
OM-DD-11-92 Kearney Vein 240351.0 371189.9 140.4 402.0 -44.3 288.0
OM-DD-11-93 Joshua Vein 239704.6 371117.5 181.0 113.0 -46.4 267.5
OM-DD-11-94 Kearney Vein 240351 3711090 137.9 449 -45 270
OM-DD-11-95 Joshua Vein 239710.0 371184.0 179.8 143.0 45.1 266.0
OM-DD-11-97 Kearney Vein 240329.5 371140.0 139.7 406.1 -42.5 274.8
OM-DD-11-98 Joshua Vein 239711.3 371067.8 179.1 187.8 -66.6 277.9
OM-DD-12-99B Kearney Vein 240404 371203 141.3 431 -45 270
OM-DD-11-100 Joshua Vein 239598.9 370790.1 166.3 200.0 -48.8 91.8
OM-DD-11-101A Joshua Vein 239673.0 371155.0 182.1 120.0 -45.9 281.8
OM-DD-11-102 Joshua Vein 239672.8 371180.0 183.1 134.0 -46.1 278.4
OM-DD-11-103 Joshua Vein 239598.0 370790.1 166.3 279.0 -71.0 93.4
OM-DD-12-104 Kearney Vein 240406 371040 133.2 413.3 -45 270
OM-DD-12-105 Joshua Vein 239672 371202 182.8 142 -45 270
OM-DD-12-106 Kearney Vein 240024 370710 162.9 330.6 -45 100
OM-DD-12-107 IP anomaly 239784 371012 172.7 176 -45 80
OM-DD-12-108 Joshua Vein 239672 371223 182.3 151.7 -45 270
OM-DD-12-109 IP anomaly 239672 371223 182.3 257 -45 110
OM-DD-12-110 Joshua Vein 239608 370764 165.6 189 -45 90
OM-DD-12-111 Joshua Vein 239673 371154 182.1 167.6 -65 270
OM-DD-12-112 Joshua Vein 239836 371172 171.4 443.3 -45 270
OM-DD-12-113 Joshua Vein 239581 370864 169 160 -45 90
OM-DD-12-114B Joshua Vein 239610 370740 165.2 321 -65 90
OM-DD-12-115 Kearney Vein 239994 370710 164.2 332 -45 100
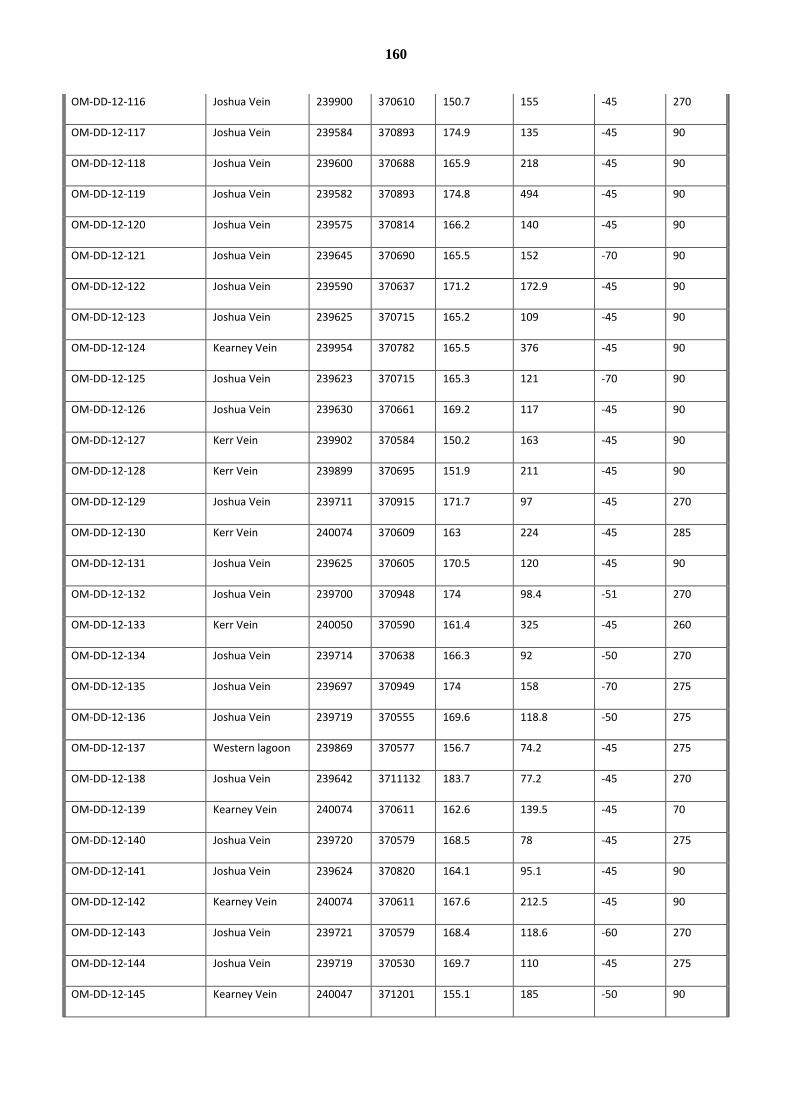
160
OM-DD-12-116 Joshua Vein 239900 370610 150.7 155 -45 270
OM-DD-12-117 Joshua Vein 239584 370893 174.9 135 -45 90
OM-DD-12-118 Joshua Vein 239600 370688 165.9 218 -45 90
OM-DD-12-119 Joshua Vein 239582 370893 174.8 494 -45 90
OM-DD-12-120 Joshua Vein 239575 370814 166.2 140 -45 90
OM-DD-12-121 Joshua Vein 239645 370690 165.5 152 -70 90
OM-DD-12-122 Joshua Vein 239590 370637 171.2 172.9 -45 90
OM-DD-12-123 Joshua Vein 239625 370715 165.2 109 -45 90
OM-DD-12-124 Kearney Vein 239954 370782 165.5 376 -45 90
OM-DD-12-125 Joshua Vein 239623 370715 165.3 121 -70 90
OM-DD-12-126 Joshua Vein 239630 370661 169.2 117 -45 90
OM-DD-12-127 Kerr Vein 239902 370584 150.2 163 -45 90
OM-DD-12-128 Kerr Vein 239899 370695 151.9 211 -45 90
OM-DD-12-129 Joshua Vein 239711 370915 171.7 97 -45 270
OM-DD-12-130 Kerr Vein 240074 370609 163 224 -45 285
OM-DD-12-131 Joshua Vein 239625 370605 170.5 120 -45 90
OM-DD-12-132 Joshua Vein 239700 370948 174 98.4 -51 270
OM-DD-12-133 Kerr Vein 240050 370590 161.4 325 -45 260
OM-DD-12-134 Joshua Vein 239714 370638 166.3 92 -50 270
OM-DD-12-135 Joshua Vein 239697 370949 174 158 -70 275
OM-DD-12-136 Joshua Vein 239719 370555 169.6 118.8 -50 275
OM-DD-12-137 Western lagoon 239869 370577 156.7 74.2 -45 275
OM-DD-12-138 Joshua Vein 239642 3711132 183.7 77.2 -45 270
OM-DD-12-139 Kearney Vein 240074 370611 162.6 139.5 -45 70
OM-DD-12-140 Joshua Vein 239720 370579 168.5 78 -45 275
OM-DD-12-141 Joshua Vein 239624 370820 164.1 95.1 -45 90
OM-DD-12-142 Kearney Vein 240074 370611 167.6 212.5 -45 90
OM-DD-12-143 Joshua Vein 239721 370579 168.4 118.6 -60 270
OM-DD-12-144 Joshua Vein 239719 370530 169.7 110 -45 275
OM-DD-12-145 Kearney Vein 240047 371201 155.1 185 -50 90

161
OM-DD-13-146 Joshua vein 239826 370638 157 237 -45 273
OM-DD-13-147 Joshua vein 239604 370740 165.2 171.8 -70 90
OM-DD-13-148 Joshua vein 239611 370741 165.2 101 -50 90
TOTAL 5819.4 2006-2007
TOTAL 7001.1 2011-2012
TOTAL 8911.5 2012-2014
TOTAL 21732 2006-2014
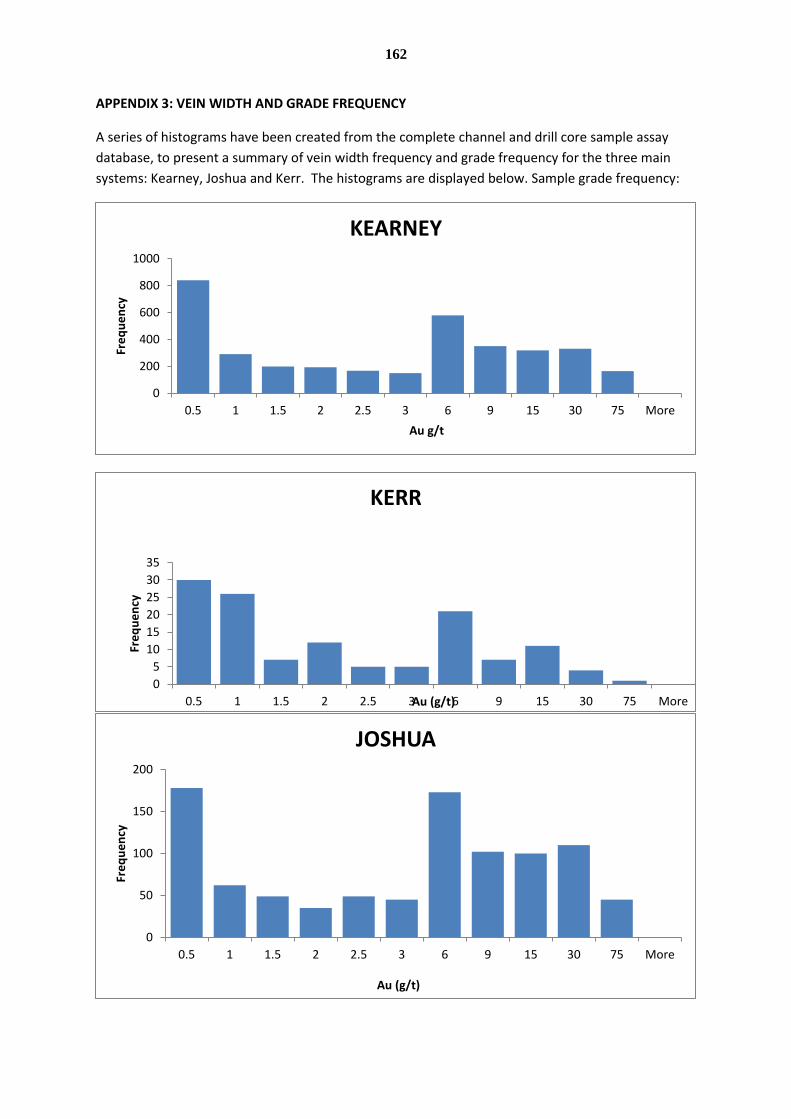
162
APPENDIX 3: VEIN WIDTH AND GRADE FREQUENCY
A series of histograms have been created from the complete channel and drill core sample assay
database, to present a summary of vein width frequency and grade frequency for the three main
systems: Kearney, Joshua and Kerr. The histograms are displayed below. Sample grade frequency:
0
200
400
600
800
1000
0.5 1 1.5 2 2.5 3 6 9 15 30 75 More
Fre
qu
en
cy
Au g/t
KEARNEY
0
5
10
15
20
25
30
35
0.5 1 1.5 2 2.5 3 6 9 15 30 75 More
Fre
qu
en
cy
Au (g/t)
KERR
0
50
100
150
200
0.5 1 1.5 2 2.5 3 6 9 15 30 75 More
Fre
qu
en
cy
Au (g/t)
JOSHUA
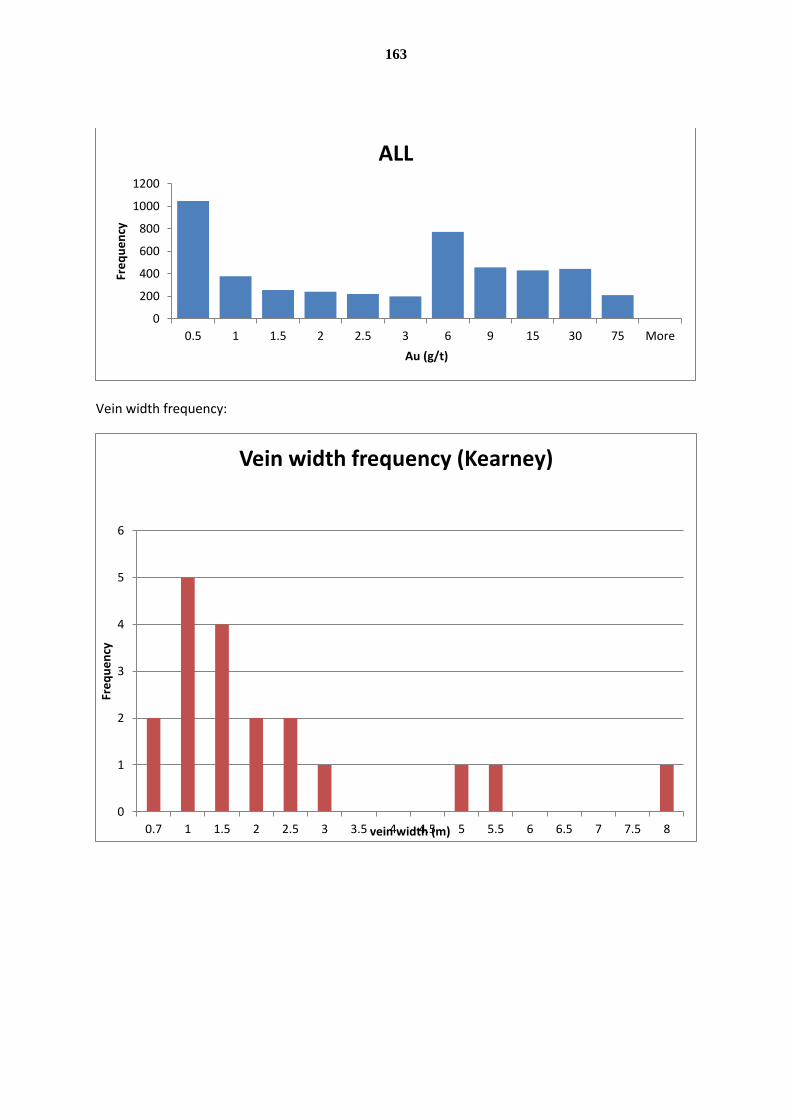
163
Vein width frequency:
0
200
400
600
800
1000
1200
0.5 1 1.5 2 2.5 3 6 9 15 30 75 More
Fre
qu
en
cy
Au (g/t)
ALL
0
1
2
3
4
5
6
0.7 1 1.5 2 2.5 3 3.5 4 4.5 5 5.5 6 6.5 7 7.5 8
Fre
qu
en
cy
vein width (m)
Vein width frequency (Kearney)
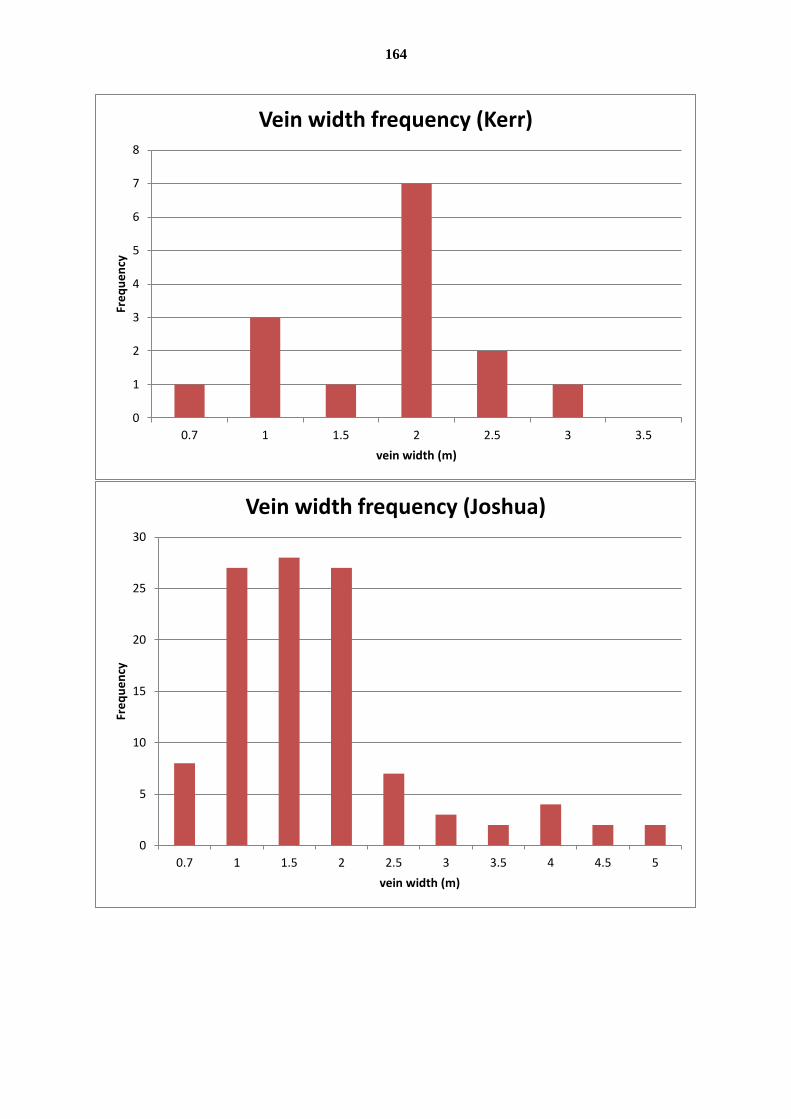
164
0
1
2
3
4
5
6
7
8
0.7 1 1.5 2 2.5 3 3.5
Fre
qu
en
cy
vein width (m)
Vein width frequency (Kerr)
0
5
10
15
20
25
30
0.7 1 1.5 2 2.5 3 3.5 4 4.5 5
Fre
qu
en
cy
vein width (m)
Vein width frequency (Joshua)