australian electricity market reforms and ... · overview 2. current market participants 3. utility...
TRANSCRIPT

Australian ElectricityMarket Reforms andBusiness Cases
PwC Australia
www.pwc.com.au

PwC
Relevant Experience
Short CV
Mark Coughlin – Partner
Mark Coughlin is a leader of the Australian and Asian energy andutilities practice . Mark has almost 30 years experience working in andadvising utility and infrastructure businesses in Australia andinternationally. His experience includes Commercial Management,CEO and CFO roles in large Australian utility corporations. Theseroles encompass all strategy, regulatory, operational and financialmanagement elements of utilities businesses.
Mark advised on asset valuations, corporate operating models,systems implementations and process design during the Australianmarket liberalization in the 1990s. While being an industry CFO withOrigin Energy’s network business, he was a major sponsor andparticipant in end to end reform programs such as improving safetyand risk management. National President and Chairman in 2005/06of CPA Australia
Key experience:
• Strategy
• Operational management
• Risk assessment
Industry:
• Energy (electricity, gas and oil)
• Utilities
Relevant project experience
• Advisor to major Australian electricity retailers on:
review of wholesale trading risk management processes andcontrols
development of new operating model for merged retailerand generator
• Advisor to Queensland and Victorian governments on marketdesign and regulatory development during the marketliberalization, as well as review of network business efficiency andeffectiveness
• Provided specialist advice to energy companies with smart gridstrategic options analysis
• Assisted major energy companies with regulatory strategy andsubmission support projects
• Provided risk assessment services to network companies acrosstheir entire assets

PwC
Outline
3
1. Overview2. Current market
participants3. Utility of the future
Overview of thecurrent Australianelectricity markets
Brief description ofmajor Australianmarket participants
Overview of PwC’srecent thoughtleadership

PwC
Overview
4

PwC
Overview of the current major Australianelectricity markets
Australian markets are vertically separated
Note, there are several markets in Australia, but the most relevant is theNational Electricity Market (NEM) that covers East and South Australia.
5
GeneratorTransmission and
DistributionRetail

PwC
Australian Energy Market
6
The NEM represents ~89% of the total Australian electricity market by
generating capacity
StartingDate
Regions
Suppliedoutput
Generatingcapacity
Tradedvalue
Customers
Began operation as awholesale spot market forelectricity in Dec 1988
QLD, NSW (incl.
ACT), SA, Vic, Tas,ACT
~200 TWh/year(2013)
48,321 MW(2013)
A$12.2 billion(2012-13)
9.3 million
National Electricity Market(NEM)
Western Australian Energy Market(WAEM)
Region
Suppliedoutput
Generatingcapacity
Customers
Western Australia
~ 18 TWh/year(2010)
6,300 MW(2010)
~ 2 million
StartingDate
2006
Source: Australian Energy Regulator statistics;

PwC
Overview of the National Electricity Market (1/3)
7
Snapshot of the National Electricity Market
Participating jurisdictions QLD, NSW, Vic, SA, Tas, ACT
Installed capacity 48 321 MW
Number of generators 317
Number of customers 9.3 million
Turnover (2012-13) A$12.2 billion
Total energy generated (2012-13)
199 TWh
Maximum historical demand 35 551 MW (2009)
0
20,000
40,000
60,000
FY09 FY10 FY11 FY12 FY13 FY14(YTD)
Capacity Peak Demand
NEM Market Capacity and Demand (MW)
Source: Australian Energy Regulator statistics

PwC
Overview of the National Electricity Market (2/3)
8
0
50
100
150
200
250
2009A 2010A 2011A 2012A 2013E 2014(YTD)
Total annual energy consumption in the NEM (TWh)
Source: Australian Energy Regulator statistics, based on generated energy per financial year
2009 2010 2011 2012 2013

PwC
Overview of the National Electricity Market (3/3)
9
• Although black and brown coalaccount for only 55% of registeredgeneration capacity they supply75% of output
• Coal fired generation declined 7%in 2012-13
• Hydro generation increased by36% in 2012-13
• Government subsidies led to arapid increase in solar PVgeneration over the past 5 years,but installed capacity is stillresidual (2300 MW in 2012-13)
0
10
20
30
40
50
60
Black coal Browncoal
Gas Hydro Wind Liquid Other
Capacity Output
Registered generation by fuel source (% of total generation)
Source: Australian Energy Regulator statistics, data as at 01 April 2014

PwC
Features of Australian retail electricity market
10
Price
• Victoria and SA do not regulate retail electricity prices.
• Queensland committed to removing electricity retail price regulation by Jul 2015 and TAS by Jul 2014.
• Retail electricity prices in 2013-2014 have stabilized in most jurisdictions.
• Gas retail prices tended to rise more strongly for gas than electricity in 2013-2014 due to international demandfor LNG exports.
• Rising costs of energy networks (electricity poles and wires, and gas pipelines) were the main driver of risingenergy retail prices over the past 5 years in many jurisdictions.
Regulation• In retail the transition to national regulation of retail energy markets is continuing with 4 jurisdictions (TAS,
ACT, SA, & NSW) implementing the National Energy Retail Law.
Demand &Generation
• Reverse in the rising trend for electricity demand causing surplus generation capacity and decreasing appetitefor new generation builds and network expansion.
• Unlikely need for new generation capacity in the next 10 years.
• Decrease in electricity demand for 2013-14 due to:
• Customers responding to higher electricity costs by reducing energy use and by adopting energyefficiency measures
• Subdued economic growth and weaker energy demand from the manufacturing sector
• Rise in solar PV generation
RetailCompetition
• Retail sector experienced a slight increase in market depth in 2013-14 with small private retailers (mostly newentrants) gaining market share
• 3 retailers (AGL Energy, Origin Energy and EnergyAustralia jointly supplied 77% of small electricity customersand 85% of small gas customers in 2012-13 (NEM).

PwC
Market design
Four main aspects to the design of the market
11
A competitive spot market for generators to sell their electricity to retailers atprices in 30 minute increments and for five regions. Generators bid into themarket, and are dispatched based on the lowest price bid, in the order of thosewho bid the lowest to highest. The price is set at the highest dispatched price.
Wholesalemarkets
A framework that provides generators with access to monopoly transmissionand distribution lines, and therefore the end-user, on a non-discriminatorybasis. Revenue/Prices are set periodically by a regulator.
Networkaccess
A competitive market where retailers package the costs of production and sellto end-users. The degree of competition varies between different Australianstates, ranging from very to little competition.
Retailmarkets
Standards that relate to energy security, reliability and customer service,varying in each jurisdiction.
Servicestandards

PwC
Roles, institutions & governance
12
Retail – 23 businesses, with the majority of market shareowned by three retailers. Many of the businesses areintegrated generators and retailers.
Network – 5 transmission businesses, 13 distributionbusinesses and 3 interconnectors that link the NEM together.
Generators – 32 generators, with the majority being bothgenerators and retailers.
Economic Regulation and compliance – Applies the NER byeconomic regulation of the network businesses, and complianceof the entire energy sector with legislation and rules. TheAustralian Energy Regulator, overall, is responsible for this.Some state regulators also have a role.
Rule maker – A body that interprets and applies the NEL toderive the NER to create the NEM, and the development of it.The Australian Energy Market Commission is responsible forthis.
Policy – Primarily the COAG Energy Council, a body thatrepresents energy Ministers from Australian State and FederalGovernment.
Market operation and planning – Operates the NEM’s electricitymarkets and systems, and assists in transmission networkplanning.
Businesses that participate in the NEM Institutions that Govern the NEM
Legislation that create the NEM:
• Primarily the National Electricity Law (NEL), which provides high level guidance andis implemented by the National Electricity Rules (NER); and
• Supported by additional legislation, such as the National Electricity Retail Law and theAustralian Energy Market Commission Establishment Act 2004

PwC
Financial / physical hedging framework
Electricity derivatives can be traded on Australian financialmarkets to assist in managing wholesale market risk
• Financial products can be traded Over-The-Counter or through adedicated exchange.
• Products include options, futures contracts and swaps
• Governed by Australian financial market laws and regulations
• Electricity generators and retailers often trade
• Most liquidity is found for products 18 to 24 months in the future
13

PwC
Current market participants
14

PwC
EnergyAustralia – Company Overview
15
0.0%
3.0%
6.0%
9.0%
12.0%
15.0%
18.0%
0
2,000
4,000
6,000
8,000
10,000
12,000
2010A 2011A 2012A 2013A
Revenue
Margin
EnergyAus Revenue (A$m), EBITDA Margin (%)
0.0%
2.5%
5.0%
7.5%
10.0%
12.5%
15.0%
17.5%
20.0%
2009A 2010A
EnergyAus Return on Equity (%)
Source: CLP Group Reports, EnergyAustralia Annual Report
• Standard & Poor’s downgraded EnergyAus rating due to suppressed prices in the wholesale market, resulting froman over-supply of generation and falling demand
• Retail operations remain weak due to existing duplication of customer relations system since the acquisition of theNSW retail business in 2011, resulting in a higher opex
Acquisition by CLP Group
2009 2010 2010 2011 2012 2013

PwC
EnergyAustralia – Company Overview (cont’d)
16
EnergyAustralia significant generation assets
PlantOrigin
OwnershipCapacity Type Fuel
Yallourn 100% 1480 MW Coal-fired Brown coal
Mount Piper 100% 1400 MW Coal-fired Coal
Wallerawang 100% 1000 MW Coal-fired Coal
Hallett 100% 203 MW Open Cycle Gas Turbine Natural Gas
EcogenGentrader
Rights966 MW Open Cycle Gas Turbine Natural Gas
Tallawarra 420 MWCombined Cycle GasTurbine
Natural Gas
Wilga Park 16 MW Open Cycle Gas Turbine Natural Gas
Waterloo 111 MW Wind Farm Wind
CathedralRocks
Joint-venture 66 MW Wind Farm Wind
Number of households andbusiness accounts (million)
2.8
5,656
Total generation capacity(MW)
3.1
Percentage of renewablegeneration (%)
Source: EnergyAustralia – 2013 reports

PwC
EnergyAustralia – Company Overview (cont’d)
17
Current
• EnergyAustralia has become one of the largest vertically-integrated energy companies in Australia, through bothmajor acquisitions and organic growth.
• EnergyAustralia is overhauling its customer service IT system .
Future
Short term
• Continue to improve customer systems and migrate customers from the old system onto the new platform and toextract efficiencies including reduction in bad debts.
• Optimise the generation portfolio in line with prevailing market dynamics.
• Pursue low-cost direct sales including growth in the digital channel.
• Transform the IT as well as human resources functions.
• Focus on a vertically integrated business as the best model to effectively balance the market risk associated with thesupply of energy and meeting consumer demand for energy.
Medium term
• Leverage the strong retail presence and provide an innovative and differentiated experience for customer segments.
• Improve core efficiency and be at the forefront of digital and technological capability.
• Provide flexible fuel and lower cost generation balanced to the needs of mass market customers.
Company Strategy

PwC
Emergence of rapidly growing ‘disruptors’
18
• Owned by Infratil – a NZ listed utility and transport owner and operator
• Taking advantage of poor customer service of major retailers – customer numbersgrowing at 10% per annum over past 3 years
• Has unique product in ‘Direct Connect Australia’
• Largely a retail and ‘cost to serve’ and ‘trading/contracting’ play with almost allgeneration being purchased from the market
• Currently under strategic review
• Private equity owned – TPG
• Acquired assets from a failed investment bank ‘Babcock and Brown’
• Generators in SA (35% of output) and Victoria
• Retailer in WAEM with 50% market share
• Expanding retail offering in NEM targeting growth in Victoria, SA Qld and NSW
• Our hypothesis is TPG looking to exit in 24 months
Lumo Energy
Alinta Energy

PwC
Emergence of rapidly growing ‘disruptors’
19
• Small investment by global player GDF Suez – 30% owned by Mitsui
• GDF acquired as part of global acquisition of International Power (UK)
• Owns and operates 3540 MW of renewable (wind turbine), gas-fired and brown coal-fired generating plants in Victoria, South Australia and Western Australia.
• Rapidly growing retailer ‘Simply Energy’
• Long brown coal generation play – renewable energy policy opportunity/risks to value
• Some ISPs now bundling internet/content and gas and electricity
• Data plays becoming likely with liberalisation of smart meter market
• Virtual power plant pilots in place with a number of network businesses
• Solar PV businesses have grown over last 5 years and are moving from equipment toenergy services
• Major retailers are looking at how they can ‘own the home’ and offer a full range ofhome services
GDF Suez
Other disruptors

PwC
Utility of the future
20

PwC
Transformation of the electricity sectorThe foundation of the electricity marketplace is shifting with multipleglobal trends reshaping the power sector
•Distributed generation and and disconnections from the grid viaself-generation are a threat to the electricity utility business model
•Changing fuel price relativities is altering behaviour
•Solar PV, electric vehicles, battery storage, energy efficiency,demand-side management and smart grid technology head the list
•New technologies have the potential to compete with utility-provided services and impact traditional utility business models
•Policy-makers have difficult task of balancing supply availability,affordability, proximity and environmental impact
•Changing approach to economic regulation / revenue setting
•Broad reforms to market design /planning /governance framework
•Customers are becoming more mobile, social and digitallyinterconnected
•Data analytics and agile strategy will become core competencies
Changing tasksand roles ofregulators
Impact of thenew energycustomer
Influence oftechnologies on
the energysupply chain
Disruptions toelectricity
supplychannels
21
PwC
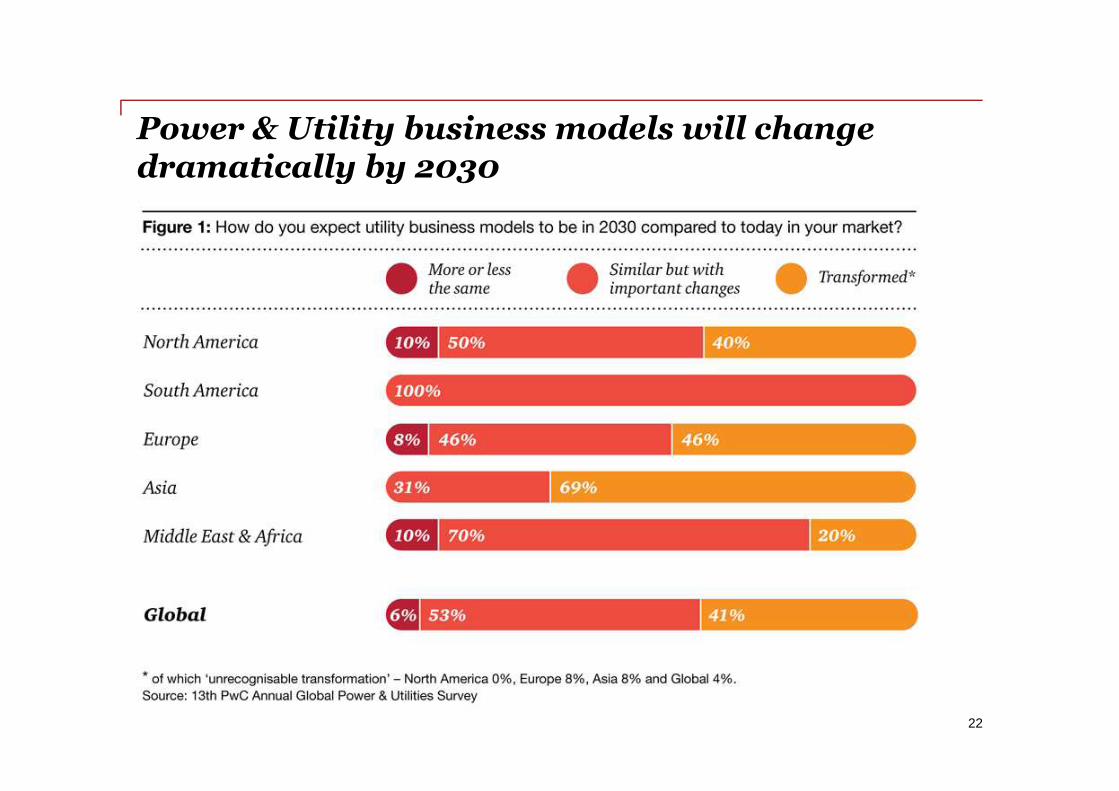
Power & Utility business models will changedramatically by 2030
22

PwC
Five customer value drivers for the future utilitymarket
Customers are looking to take control– they will look to manage their energyfar more effectively than they can today
Power generation and networks will betransformed - those that innovate willprotect and increase value and defendagainst tech disruption
Role of the utility will transform into aservice company that enables ‘energysolutions’ and in many cases ‘homesolutions’
Data will play a dominant role in thefuture energy value chain – new valuewill be found within utility customerand network data
Governments and regulators mustreshape energy/related servicesmarkets to keep pace with customerand ‘energy enabler’ needs
“We needenablers
notsuppliers”
23

PwC
Providers of distributed generation servicesCustomer focus is a core strategy
24

PwC
On the mind of new energy entrepreneurs…
Why can’t I buymy energy locally?What's the addedvalue of the utility?Let’s change thebusiness model
The look and feelof products can beimproved, energyhas always beenboring
We haveimproved ourfootprint, let’snow help ourclients
The biggestissue isflexibility, weneed to developstorage options
The home of thefuture is an energyplant, let’s createnew financingmodels (egguarantees,ESCO’s)
25
vandebron
Google IKEA
bam
Younicos

PwC
Example: IKEA
• 37% of energy use of Ikea already covered by solar panels and wind energy• Additional investment in 49 wind mills in the US (announced April 2014)• Sale of solar panels to clients (UK)• “IKEA wants to help you to live a more sustainable life at home”
26

PwC
Create options for the future – build out agile and innovative businessesoptimising the use of new and emerging technologies
Creating value from the vast amount of data collected and created – utilise thebest possible data management and analytics tools to support decisions
Stable long term government policy and establishment of a deregulated and opennational electricity supply and services market
New customer-centric corporate strategies - develop excellent customerunderstanding, with emphasis on emerging power of analytics/socialytics
Improving productivity and asset management – have a clinical focus on assetvalue and manage assets via customer-centric frameworks
Developing and continually refining agile and lean operating and business modelsfocused entirely on executing customer and other strategies
The keys to transforming today’s utilities intotomorrow’s ‘Energy Enablers’
27

The deregulation and disaggregationAustralian energy markets hasgreatly enhanced the capacity of theAustralian economy.
The market continues and willcontinue to reform as conditions andparticipants change…
© 2014 PricewaterhouseCoopers. All rights reserved.PwC refers to the Australian member firm, and may sometimes refer to the PwC network.Each member firm is a separate legal entity. Please see www.pwc.com/structure for further details.
Liability limited by a scheme approved under Professional Standards Legislation