australian food industry - australian natural...
TRANSCRIPT

abare research report 06. 23
abarewww.abareconomics.com
inno
v atio
n in
eco
nom
ics
australian food industryperformance and competitiveness
christopher short, courtney chester and peter berry
december 2006

ii
© Commonwealth of Australia 2006
This work is copyright. The Copyright Act 1968 permits fair dealing for study, research, news reporting, criticism or review. Selected passages, tables or diagrams may be reproduced for such purposes provided acknowledgment of the source is included. Major extracts or the entire document may not be reproduced by any process without the written permission of the Executive Director, ABARE.
ISSN 1037-8286ISBN 1 920925 78 3
Short, C., Chester, C. and Berry, P. 2006, Australian Food Industry: Performance and Competitiveness, ABARE Research Report 06.23 Prepared for the Australian Government Department of Agriculture, Fisheries and Forestry, Canberra, December.
Australian Bureau of Agricultural and Resource Economics
GPO Box 1563 Canberra 2601Telephone +61 2 6272 2000 Facsimile +61 2 6272 2001
Internet www.abareconomics.com
ABARE is a professionally independent government economic research agency.
ABARE project 3077

iii
australian food industry abare research report 06.23
foreword
The Australian food industry is a major component of the Australian economy, generating export income of $24 billion in 2004-05. Globally, food manufac-turing is a highly signifi cant sector, with food sales worldwide estimated at around US$4 trillion and packaged foods alone valued at around US$1.9 trillion in 2002.
A key trend in world food markets is increasing globalisation, driven by large multinational food manufacturers and supermarket chains that have the ability to source their input requirements from many different countries. The increased compe-tition associated with globalisation is putting greater pressure for change on both Australia’s domestic and export oriented food sectors.
This report provides an overview of the evolving nature of the Australian food industry and identifi es key competitive forces that are shaping both the world and Australian food industries. The analysis contained in this report is intended for use in private and public policy making process aimed at positioning the Australian food industry in an increasingly competitive world market for food.
The Department of Agriculture, Fisheries and Forestry commissioned ABARE to undertake this analysis of current and emerging trends in the food industry.
Phillip GlydeExecutive DirectorDecember 2006

iv
australian food industry abare research report 06.23
acknowledgments
The authors would like to thank Lisa Elliston, Terry Sheales, Benjamin Buetre, Jammie Penm and Don Gunasekera for their comments and assistance in the preparation of this report.

v
australian food industry abare research report 06.23
contents
summary 1
1 food industry overview 7
food manufacturing sector in Australia 7domestic food consumption and expenditure 10food exports 11food industry productivity 14research and development expenditure 16market concentration 19supply chain: Australian food manufacturing industry 22
2 global food trends 24
food consumption 24changing consumer preferences 27
3 industry location and trade 28
trade policy infl uences 29the economics of processed food production 30other trade considerations 33global food trade 34
4 australia’s export performance: revealed comparative advantage analysis 36
revealed comparative advantage analysis 36revealed comparative advantage over time 41revealed comparative advantage, by product groups 43identifying growth opportunities 46
appendixesA largest fi fty food and beverage corporations 51
B input–output industry classifi cations for diagrams B1–B10 53
C products in which Australia has a comparative advantage 64

vi
australian food industry abare research report 06.23
references 69
boxes1 types of research and development expenditure 172 gravity models 343 revealed comparative advantage 37
fi guresA industry value added, Australian manufacturing industry 7B food, beverage and tobacco manufacturing share of
Australian GDP 8C state shares in Australian food, beverage and tobacco
manufacturing, 2002-03 8D Australian manufacturing industry value added, by state 9E food, beverage and tobacco industry value added,
by subsector 9F Australian manufactured exports, by category 11G Australian food export shares 12H Australian food exports, by state 13I Australian food exports, by destination region, 2004 13J trends in full time manufacturing sector employment in
Australia 15K manufacturing R&D expenditure in Australia, by subsector 16L manufacturing R&D expenditure in Australia, by state 18M food manufacturing R&D expenditure in Australia,
by subsector 18N Australia’s largest fi fty food and beverage corporations 19O assets and revenue of the largest fi fty food and beverage
corporations in Australia, 2002 21P food budget as a share of household expenditure 25Q food groups as a share of food budget 25R export destinations, by GDP and distance from Australia 35S revealed comparative advantage and export levels, 2004 38T changes in Australian comparative advantage, by level of
transformation 43U revealed comparative advantage indexes for meat, dairy,
fruit and vegetable products 44

vii
australian food industry abare research report 06.23
V revealed comparative advantage indexes for processed fl our product, oils and confectionery 45
W revealed comparative advantage indexes for beverages 45X Australian and world food export growth, by product,
1994–2004 46Y Australia’s strong food export performers, 1994–2004 48Z proportions of Australia’s exports, by performance,
1994–2004 48
tables1 weekly Australian household expenditure 102 apparent per person consumption of selected foods,
Australia 103 productivity growth rates for Australian manufacturing
industries 144 full time employment in Australia, by sector 155 features of the largest fi fty food and beverage corporations
in Australia, 2002 206 revenue shares of Australia’s largest fi fty food and beverage
corporations in individual subsectors, 2002 217 global food sales, 2002 248 annual average growth in packaged food sales,
by income groups 259 retail sales and growth of selected food items, by income
groups, 2002 2610 tariff escalation in developing countries 2911 tariff escalation – selected countries and products 3012 food trade shares, by region, 2004 3413 description of product groupings 3914 comparative advantage value share, by category, 2004 4015 selected products and revealed comparative advantage
indexes, 2004 4116 count of product lines with revealed comparative advantage
by transformation process 4217 Australian exports, by transformation process 4218 proportions of Australia’s exports, by transformation, 2004 5019 largest fi fty food and beverage corporations 51

viii
australian food industry abare research report 06.23

1
australian food industry abare research report 06.23
summary
food manufacturing in Australia
> Since the late 1970s the value of output from Australia’s manufacturing sector as a whole has declined as a proportion of gross domestic product (GDP). Within the sector, food manufacturing accounts for about 20 per cent of output, and remains one of Australia’s largest manufacturing industries. Growth in the value of output from the food industry averaged around 2.0 per cent a year over the past ten years, slightly higher than the 1.9 per cent a year average for the manufacturing sector as a whole.
> Geographically, the distribution of food manufacturing in Australia closely resembles the distribution of population, with the bulk of the industry located along the east coast, predominantly in Victoria and New South Wales. Between 1998-99 and 2002-03, most of the growth in the industry was concentrated in New South Wales.
> Within food manufacturing, the most solid growth over the past fi ve years has been in wine, beer and malt, and soft drinks, cordial and syrup. Although not the largest food category overall, between 1997-98 and 2003-04 the value of wine production almost doubled, to $1.7 billion (in 2005-06 dollars). The other beverage categories and meat also had large absolute increases in value added, of about $300 million (in 2005-06 dollars) each. Meat prod-ucts were the largest single product category in terms of value added, worth $3.4 billion (in 2005-06 dollars) in 2003-04.
domestic consumption
> In Australia, consumer expenditure on food is relatively insensitive to changes in income, with expenditure changing by smaller proportions than the changes in household income. Not surprisingly, total household expenditure on food and nonalcoholic beverages increased by only about 3 per cent in real terms between 1988-89 and 2003-04, equivalent to an average growth rate of 0.2 per cent a year. Consumption expenditure increased most signifi cantly for poultry, seafood and fresh fruit and vegetables, and shifted away from meat, eggs, grains and sugar. The overall trend in expenditures suggests that, since 1948-49, consumers may have been including higher proportions of high value foodstuffs such as seafood in their diets.

2
australian food industry abare research report 06.23
food exports
> Between 1995-96 and 2004-05, total food exports (that is, minimally, substantially and elaborately transformed food products) increased by $4 billion to $24 billion (in 2005-06 dollars), at an average growth rate of around 2 per cent a year. Food exports (excluding bulk commodities) have been dominated by substantially and elaborately transformed products. Meat products have been the main export category, although there have also been large increases in wine and dairy exports.
> Despite Queensland being only the third largest producer of manufactured food products in Australia, the state had the largest exports, with shipments valued at more than $5 billion (in 2005-06 dollars) in the substantially and elaborately transformed categories in 2004-05. The main export commodities from Queensland were meat ($3 billion) and sugar ($1 billion).
> In 2004, Asia was the biggest market for Australian food exports (US$7.0 billion). The composition of exports differed signifi cantly between regions — for example, while the European export market was worth only about US$1.5 billion in 2004, it was the largest export market for Australian wines.
employment and productivity in the food industry
> High labor and multifactor productivity growth in food manufacturing has contributed to output growth in the sector, enabling employment to remain relatively unchanged over the past twenty years. On a year to year basis, employment levels fl uctuate, refl ecting fl uctuating incomes in the food industry. These fl uctuations are associated with primary product supplies being affected by major climatic events, such as droughts, fl ooding and severe storms, or through impacts on the value of sales caused by exchange rate movements or sudden shifts in consumption patterns.
research and development expenditure
> Research and development (R&D) are closely linked with the location of production centres, which is refl ected in the distribution of R&D expenditure between states. Most of the $50 million (in 2005-06 dollars) increase in food, beverage and manufacturing research and development expenditure between 1997-98 and 2003-04 occurred in Victoria, and close to 70 per cent of total R&D expenditure was in New South Wales and Victoria. R&D expenditure tended to be undertaken by fi rms with 200 or more employees, and mostly (88 per cent) covered labor costs and other current expenditure (not including capital).

3
australian food industry abare research report 06.23
market concentration
> The global food industry is dominated by large, multinational fi rms, and the Australian market refl ects that trend. In 2003, about 75 per cent of industry revenues in Australia were generated by fi fty fi rms, more than half of which were foreign owned or publicly listed companies. However, the market shares of the largest fi fty fi rms varied widely in individual food categories — from 95 per cent for milk and cream processing to 7 per cent for seafood.
> Almost half of the largest fi fty fi rms were foreign owned companies. These fi rms generated about 45 per cent of domestic revenue in the fi ve years to 2002. There were about nine fi rms in each of publicly listed companies, coop-eratives and privately owned companies, which generated 30 per cent, 14 per cent and 10 per cent respectively of domestic revenue.
supply chain
> In 2001-02, inputs (in value terms) into food manufacturing comprised raw agricultural products (32 per cent), major services (26 per cent), labor (17 per cent), food products (13 per cent) and other industrial inputs (12 per cent). Output from the industry was consumed by households (43 per cent), exported (22 per cent), used as inputs by other industries (33 per cent) or through changes in inventories (2 per cent).
> The meat products industry, including beef and dairy cattle, sheep meat, poultry and pigs, was the largest industry examined. In 2001-02, the industry had a total supply value of around $15 billion (in 2001-02 dollar values). Agricultural goods were the main input (57 per cent), followed by major services and labor. Within the major services inputs, transport and storage, wholesale trade and business services were the main services provided. Of the buyers of meat products, industries consumed the largest proportion of output (37 per cent), followed by exports (32 per cent) and household consumption (25 per cent).
global food trends
> Food sales worldwide in 2002 are estimated to have been worth more than US$4 trillion (in 2002 dollars), with processed products (packaged foods and beverages) making up more than 70 per cent of this amount. Packaged foods alone were worth approximately US$1.9 trillion (in 2002 dollars).
> A key trend in food consumption is that the rate of growth of consumption per person, albeit from a low base, is higher for low and middle income countries. As incomes rise, the rate of growth in food consumption per person tends to decline.

4
australian food industry abare research report 06.23
> The composition of food consumed also changes as incomes increase, with changes to the proportion of different foods in consumer diets. Consumption of fi sh, dairy and meat products all increase as incomes rise, while there are declines in the proportions of cereals, oils and fats, and fruits and vegetables.
> The responsiveness of household consumption to income changes also varies with level of income, with signifi cant differences in both the magnitude and range of income responsiveness for different food categories. Per person consumption of food in high income countries tends to have relatively low responsiveness to income changes and narrow ranges of responsiveness between different categories, whereas the inverse holds for developing coun-tries.
changing consumer preferences
> Refl ecting the difference in income growth rates between high and low income countries, the opportunities for the food industry to expand volumes sold within domestic food markets tend to decline as incomes increase. In high income countries, which also tend to have low or declining population growth, fi rms tend to increase their market share through product differentiation.
> The types of foods likely to be developed include products that can be sold on the basis of specifi c sensory appeal (color and fl avor enhancement), desired nutritional content, relevant health benefi ts, food safety, origin of production and processing practices or greater convenience.
industry location and trade
> The global food processing industry is dominated by a relatively small number of fi rms. These fi rms operate food processing facilities across countries and are responsible for most of the investment in such o perations. Despite a relatively high concentration in ownership of branded products and production facilities, the existence and location of food processing industries is strongly infl uenced by the costs of manufacturing and distribution within a region or country.
> The various economic forces at work in the market for inputs (raw materials, labor and capital investment) mean there is no reason to expect that countries that have a comparative advantage in producing agricultural goods used as raw inputs to food manufacturing will be advantaged in producing manufac-tured foods for export to other countries.
> The economic characteristics of food manufacturing have a signifi cant role in determining where processing plants are located internationally. Access to

5
australian food industry abare research report 06.23
investment funds and new technologies are two of the most important inputs to the production of elaborately transformed foods as most manufacturing proc-esses are capital intensive.
> The location of manufactured food production is not necessarily dependent on the availability of the natural resource endowments required to produce raw material inputs. This is because raw product inputs such as refi ned sugars, starches and grains are relatively nonperishable and easily transportable without loss of nutritional value or quality.
> Another factor affecting food trade is the cost of the trading activities. Trade related costs include such things as transport charges, cost of coordinating deliveries for managing supply chains with multiple inputs from a variety of regions, and communication and transactions costs (such as cost of meeting legal and regulatory requirements). Together, these factors can result in a decline in trade, the further the fi nal market is from the country where the goods are produced. In this regard, Australia performs well compared with other trading nations given Australia’s distance from its major trading partners.
> The value of internationally traded food products is increasing at an average rate of 2.4 per cent a year. However, this trade is highly regionalised — with most trade occurring intraregionally. That is, exports and imports of food prod-ucts occur predominantly within Asia, within the European Union and within the North American Free Trade Area rather than across regions.
> These trade fl ow patterns provide an indication that the desire to locate processing facilities close to fi nal markets exerts a strong infl uence on the loca-tion of food processing industries across countries.
Australia’s export performance
> Comparative advantage is a fundamental economic driver in determining the long run export performance of an industry. By engaging in trade, countries that specialise in producing goods in which they are relatively effi cient will maximise their economic benefi ts.
> For Australia, the composition of food exports is such that 95 per cent of the value of exports occurs in the bulk, and minimally or substantially transformed product categories. Only a small percentage of Australia’s food exports are represented by elaborately transformed products such as confectionery products.
> Analysis of the rate of growth of food exports relative to the growth in world trade on a product line basis indicates that over 75 per cent of the value of

6
australian food industry abare research report 06.23
total food exports is in products in which the Australian share of export markets is increasing. In addition, 35 per cent of total exports are occurring in prod-ucts for which the rate of annual growth in trade exceeds that of the growth in world trade for food products in total. That is, 35 per cent of Australian food product exports are being shipped to growing world markets and are increasing their share of world trade at the same time.
> Conversely, only a small share — 6 per cent — of exported product lines are in markets for which both trade is declining and Australia is losing market share.

7
food industry overview
In this chapter, changes and trends in Australia’s food manufacturing sector are examined in terms of production, domestic consumption and changes in food exports. The performance of the food manufacturing sector compared with the manufacturing sector as a whole is also considered by looking at productivity estimates, changes in employment and investment in research and development. Market concentration and the presence of multinational food fi rms in Australia are considered. At the end of the chapter, a series of supply chain fi gures are provided that highlight the key inputs for individual food subsectors and trends in food consumption.
food manufacturing sector in AustraliaFood manufacturing has consistently been a major component of Australia’s manu-facturing sector and the industry has achieved strong growth in output over recent years. Between 1996-97 and 2002-03, industry output (as measured by income from sales and services) grew at an average rate of 4 per cent a year in real terms (that is, net of infl ation).
When considering the contribution of the food manufacturing industry to the Australian economy, it is important that comparisons are undertaken using value added by the industry rather than industry turnover. In real terms (2005-06 dollars) the value added from food manufacturing increased by more than $3 billion between 1995-96 and 2004-05 (fi gure A; ABS 1999b, 2006b). This made it the largest value added industry in Australian manufacturing, at $20 billion in 2004-05.
The average growth rate for the food manufacturing industry over the period 1995-96 to 2004-05 was about 2 per cent a year. This was
industry value added, Australian manufacturing industry in 2005-06 dollarsfig A
80
60
40
20
$b
2004-051995-96
other manufacturing
machinery and equipment
metal products
nonmetallic mineral products
petroleum, coal, chemical, etcprinting, publishing, recorded mediawood, paper products
textile, clothing, footwear
food, beverage, tobacco
1

8
australian food industry abare research report 06.23
slightly higher than the annual growth rate for the manufacturing sector as a whole over the same period, but lower than some other industries in manufac-turing, including nonmetallic minerals, printing, publishing and recorded media, and machinery and equipment, which grew on average by around 5 per cent, 3 per cent and 2.5 per cent a year respectively. Only textile, clothing, footwear and leather manufacturing declined in terms of value adding during this period — by about $2.4 billion (in 2005-06 dollars).
Over the 25 years to 2004-05, the share of the food manufacturing sector in Australia’s GDP declined slightly (fi gure B; ABS 2006a). At the same time, the share of the manufacturing sector as a whole declined from 17 per cent in 1977-78 to 11 per cent in 2004-05. Although the contributions to GDP of both the manufacturing sector and the food manufacturing industry have declined, food manufacturing remains important, producing about 19 per cent of the manufacturing sector’s contribution to GDP in 2004-05 (fi gure B).
The food manufacturing industry is concentrated along the eastern coast of Australia, with more than 80 per cent located in New South Wales, Victoria and
Queensland (fi gure C; ABS 2006d). The distribution of food manufacturing between the states shown in fi gure C closely resembled the distribution of population at June 2003.
As a proportion of state manufac-turing industries, between 1998-99 and 2002-03 the food manufacturing sector increased in value added terms in New South Wales, Victoria and Western Australia, and remained constant in Tasmania and South Australia (fi gure D; ABS 2006d). The value added in food manufacturing declined in Queensland and the two
food, beverage and tobacco (FBT) manufacturing share of Australian GDP
figB
%
1980-81
1986-87
1992-93
1998-99
2004-05
5
10
15
20
FBT share of GDP
manufacturing share of GDP
FBT share of of manufacturing
The Northern Territory and ACT had shares of 0.2 per cent.

9
australian food industry abare research report 06.23
territories. Almost all of the $1.8 billion (in 2005-06 dollars) increase during this period occurred in New South Wales ($1.6 billion). The food industry maintained a share of more than 20 per cent of the total manufacturing sector value added in New South Wales, Queensland, South Australia and Tasmania.
Within the food manufacturing industry, the largest individual subsectors in 2003-04 were ‘other food’ products (20 per cent), meat products (19 per cent), wine (10 per cent) dairy products (9 per cent) and bakery products (9 per cent) (fi gure E; ABS 1999b, 2006b). ‘Other food’ products included sugar, confectionery, seafood processing, prepared animal and bird feed and food not elsewhere specifi ed. Confectionery and food not elsewhere specifi ed repre-sented most of the category, with about two-thirds of its value.
Value added in the wine industry increased the most during this period, almost doubling from $900 million to $1.7 billion (in 2005-06 dollars). Apart from fl our mill and cereal foods, bakery products and dairy products, the other categories also increased.
Australian food, beverage and tobacco industry value added, by subsector
fig E
15
10
5
2005-06$b
wine
beer and malt
soft drink, cordial and syrup
other food
bakery products
flour mill and cereal food
oil and fat
fruit and vegetable processing
dairy products
meat products
2003-041997-98
10
australian food industry abare research report 06.23
domestic food consumption and expenditure
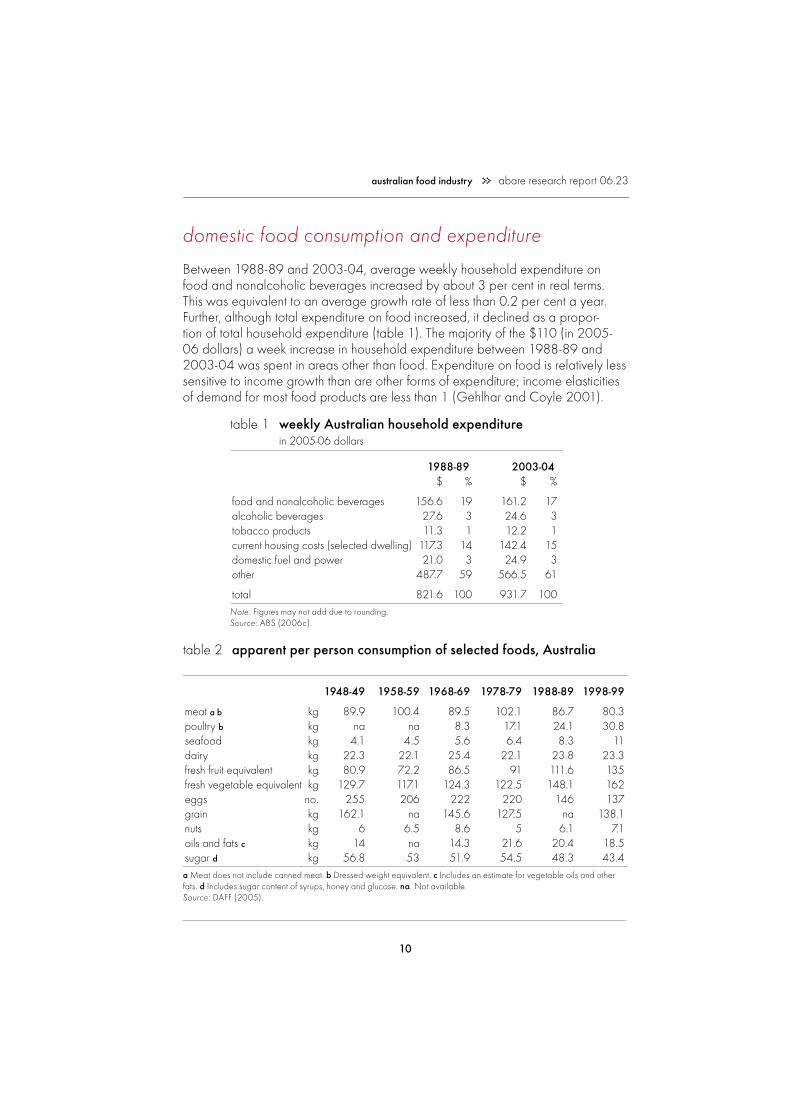
Between 1988-89 and 2003-04, average weekly household expenditure on food and nonalcoholic beverages increased by about 3 per cent in real terms. This was equivalent to an average growth rate of less than 0.2 per cent a year. Further, although total expenditure on food increased, it declined as a propor-tion of total household expenditure (table 1). The majority of the $110 (in 2005-06 dollars) a week increase in household expenditure between 1988-89 and 2003-04 was spent in areas other than food. Expenditure on food is relatively less sensitive to income growth than are other forms of expenditure; income elasticities of demand for most food products are less than 1 (Gehlhar and Coyle 2001).
table 2 apparent per person consumption of selected foods, Australia
1948-49 1958-59 1968-69 1978-79 1988-89 1998-99
meat a b kg 89.9 100.4 89.5 102.1 86.7 80.3poultry b kg na na 8.3 17.1 24.1 30.8seafood kg 4.1 4.5 5.6 6.4 8.3 11dairy kg 22.3 22.1 25.4 22.1 23.8 23.3fresh fruit equivalent kg 80.9 72.2 86.5 91 111.6 135fresh vegetable equivalent kg 129.7 117.1 124.3 122.5 148.1 162eggs no. 255 206 222 220 146 137grain kg 162.1 na 145.6 127.5 na 138.1nuts kg 6 6.5 8.6 5 6.1 7.1oils and fats c kg 14 na 14.3 21.6 20.4 18.5sugar d kg 56.8 53 51.9 54.5 48.3 43.4a Meat does not include canned meat. b Dressed weight equivalent. c Includes an estimate for vegetable oils and other fats. d Includes sugar content of syrups, honey and glucose. na. Not available.Source: DAFF (2005).
table 1 weekly Australian household expenditure in 2005-06 dollars
1988-89 2003-04 $ % $ %
food and nonalcoholic beverages 156.6 19 161.2 17alcoholic beverages 27.6 3 24.6 3tobacco products 11.3 1 12.2 1current housing costs (selected dwelling) 117.3 14 142.4 15domestic fuel and power 21.0 3 24.9 3other 487.7 59 566.5 61
total 821.6 100 931.7 100Note: Figures may not add due to rounding. Source: ABS (2006c).

11
australian food industry abare research report 06.23
Long term food preferences have also been changing in Australia (table 2). Consump-tion has shifted away from meat, eggs, grains and sugar, and increased for poultry, seafood, and fresh fruit and vegetables. Consumption of dairy products has remained relatively stable since 1948-49. The trend suggests that consumers may be including a higher proportion of high value foodstuffs in their diets, such as seafood, and fresh fruit and vegetables.
With stable household expenditure on food, growth of the food manufacturing sector is closely linked to domestic population growth and growth in overseas demand for Australian food products.
food exportsExports of manufactured food items have consistently accounted for a large proportion of total exports of manufactures. Between 1996-97 and 2003-04, food manufacturing exports increased by $4.5 billion which was second in size to metal product manufacturing ($8.3 billion) in 2005-06 dollars (fi gure F; ABS 1998, 2006b). Apart from textiles, clothing, footwear and leather (down by $350 million), all of the other industries had slight increases during this period.
Minimally transformed food products have declined as a proportion of total food exports since the mid-1990s (fi gure G; DAFF 2005), as have many individual food subgroups (seafood, dairy, fruit and vegetables, oil and fat, fl our mill and cereal food and bakery products).
The only subsectors to increase their percentage share of food exports were meat products, and beverages and malt. The value of exports in most subsectors increased in real terms. Between 1990-91 and 2004-05, the largest increase was in meat products ($3.5 billion in 2005-06 dollars). Seafood, which fell by $4.9 billion (in 2005-06 dollars), was the only subsector to record a reduced value of exports.

12
australian food industry abare research report 06.23
The increases (in 2005-06 dollars) in the other subsectors of Australian manufac-tured exports were:
> beverages and malt ($2.5 billion)
> dairy products ($1.5 billion)
> other food ($745 million)
> fl our, mill and cereal products ($153 million)
> oil and fat ($86 million)
> bakery products ($64 million)
> fruit and vegetables ($43 million).
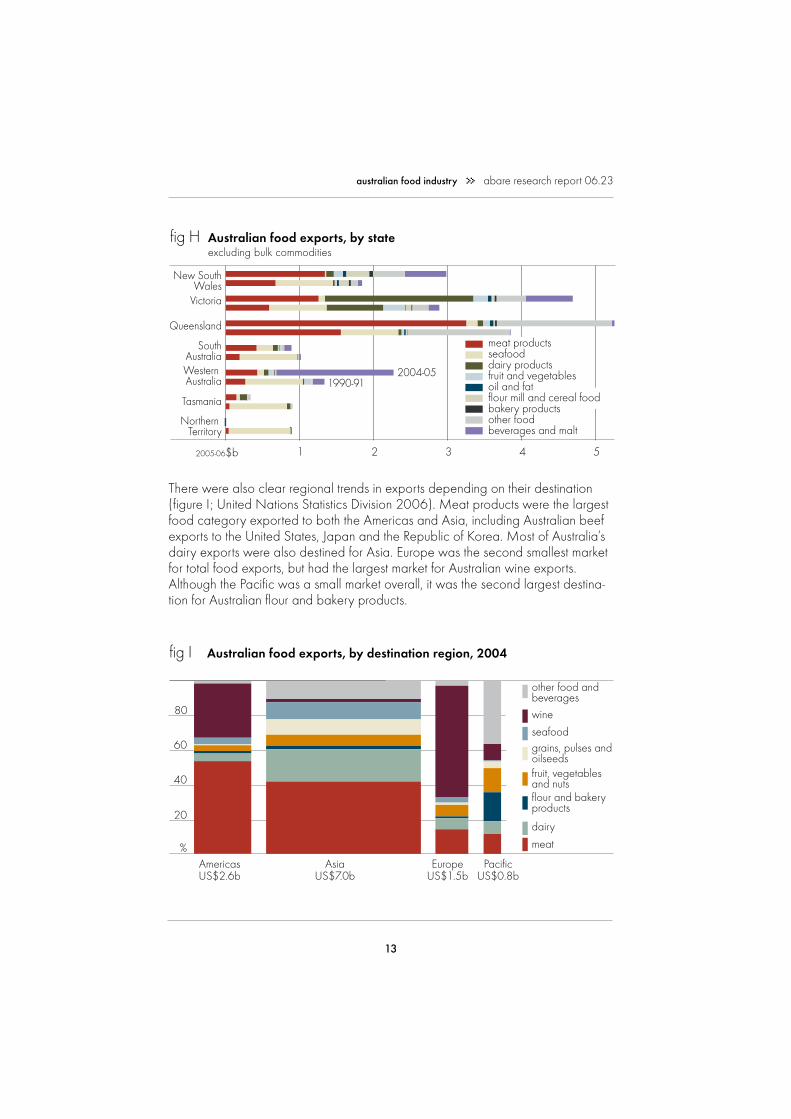
In 2004-05, meat exports were the largest category in most states, particularly in Queensland (fi gure H; DAFF 2005). Most of the other export categories were relatively small, with the exception of beverages and malt from South Australia, Victoria and New South Wales, dairy products from Victoria and sugar from Queensland (in the other food category). Sugar exports by value from Queens-land were more than 96 per cent of national sugar exports in 2004-05.
Although being only the third largest state in terms of value added to food produc-tion, Queensland had the highest value of food exports, and the largest share of national exports in two categories (meat $3 billion and sugar $1 billion in 2005-06 dollars). Other exports from Queensland included seafood ($151 million), fruit and vegetables ($94 million), dairy ($75 million) and oil and fat ($46 million).
Australian food export shares excluding bulk commodities
figG
%
1992-93
1995-96
1998-99
2001-02
2004-05
20
40
60
80
minimally transformed beverages and maltother foodbakery productsflour mill and cereal foodoil and fatfruit, vegetablesdairyseafoodmeat
13
australian food industry abare research report 06.23
There were also clear regional trends in exports depending on their destination (fi gure I; United Nations Statistics Division 2006). Meat products were the largest food category exported to both the Americas and Asia, including Australian beef exports to the United States, Japan and the Republic of Korea. Most of Australia’s dairy exports were also destined for Asia. Europe was the second smallest market for total food exports, but had the largest market for Australian wine exports. Although the Pacifi c was a small market overall, it was the second largest destina-tion for Australian fl our and bakery products.
Australian food exports, by state excluding bulk commodities
fig H
543212005-06$b
2004-051990-91
New SouthWales
Victoria
Queensland
SouthAustraliaWestern Australia
Tasmania
Northern Territory beverages and malt
other foodbakery productsflour mill and cereal foodoil and fatfruit and vegetablesdairy productsseafoodmeat products
20
60
40
80
Australian food exports, by destination region, 2004fig I
AmericasUS$2.6b
AsiaUS$7.0b
EuropeUS$1.5b
PacificUS$0.8b
other food and beverageswine
seafoodgrains, pulses and oilseedsfruit, vegetables and nutsflour and bakery products
dairy
meat%

14
australian food industry abare research report 06.23
The competitiveness of the Australian food production industry, in both domestic and export markets, has been affected by productivity growth and investment in research and development. In the following sections, changes in productivity and employment in food manufacturing relative to manufacturing as a whole and the wider economy, and trends in research and development are examined.
food industry productivityProductivity growth in an industry is important for maintaining competitive perform-ance. The simplest defi nition of productivity growth describes it as being the change in the ratio of the quantity of outputs to the quantity of inputs. Total factor productivity growth refers to the relationship between all production inputs and outputs. Labor productivity growth is the increase in output for each unit of labor input. Maintaining the ability to compete in the marketplace when the terms of trade faced by an industry are declining requires productivity to increase at a rate at least equal to that of the decline in the terms of trade.
Between 1993-94 and 2000-01, multifactor productivity in the food manufac-turing industry increased at an average rate of 0.8 per cent a year, well above the multifactor productivity growth in the manufacturing sector, but below the national average (all industries) (table 3). This productivity growth could be regarded as one of the factors behind the 4 per cent annual growth in the value of the output of the industry discussed above.
table 3 productivity growth rates for Australian manufacturing industries average annual growth
1973-74 1984-85 1993-94 to 1984-85 to 1993-94 to 2000-01 % % %
labor productivityfood, beverage and tobacco 3.6 1.9 2.2total manufacturing 3.6 1.9 1.8
national average (all industries) 3.4 3.1 2.9
multifactor productivity afood, beverage and tobacco 1.3 0.7 0.8total manufacturing 2.0 0.3 0.6
national average (all industries) 2.0 1.7 0.9a Productivity attributable to labor and capital combinedSource: Productivity Commission (2003).
15
australian food industry abare research report 06.23
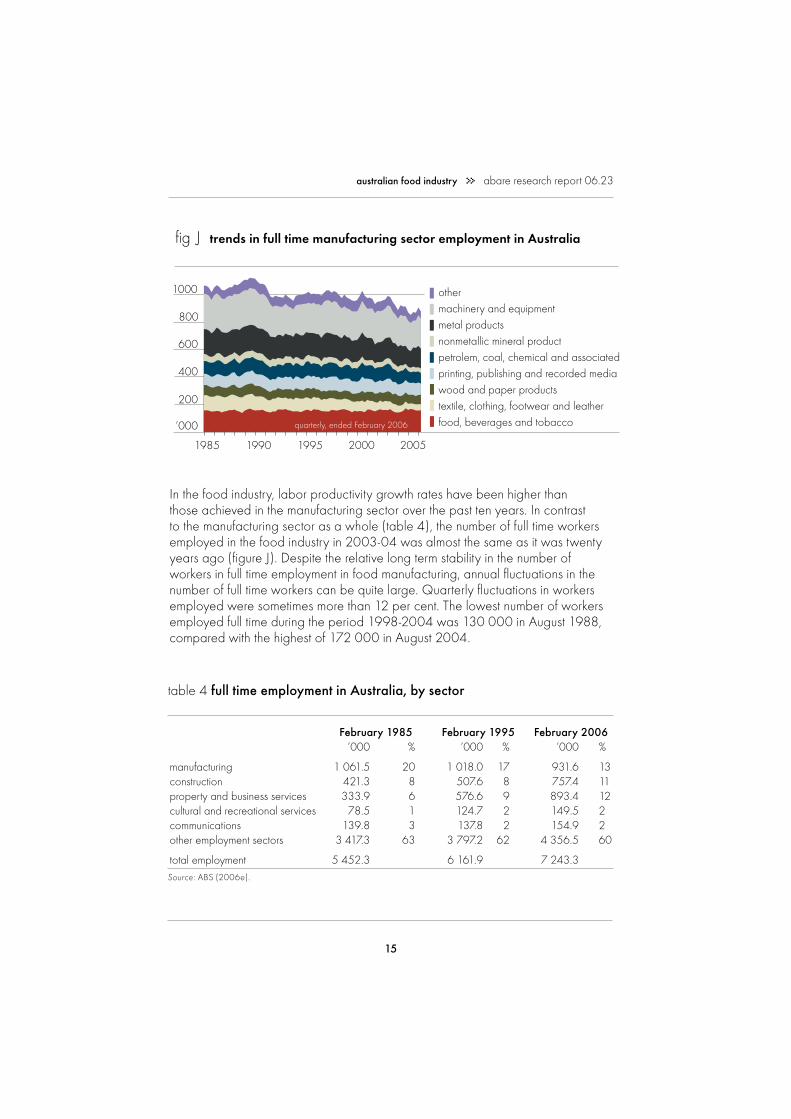
In the food industry, labor productivity growth rates have been higher than those achieved in the manufacturing sector over the past ten years. In contrast to the manufacturing sector as a whole (table 4), the number of full time workers employed in the food industry in 2003-04 was almost the same as it was twenty years ago (fi gure J). Despite the relative long term stability in the number of workers in full time employment in food manufacturing, annual fl uctuations in the number of full time workers can be quite large. Quarterly fl uctuations in workers employed were sometimes more than 12 per cent. The lowest number of workers employed full time during the period 1998-2004 was 130 000 in August 1988, compared with the highest of 172 000 in August 2004.
trends in full time manufacturing sector employment in Australiafig J
1985 1990 1995 20052000
200
‘000
600
400
800
1000 othermachinery and equipmentmetal productsnonmetallic mineral productpetrolem, coal, chemical and associatedprinting, publishing and recorded mediawood and paper productstextile, clothing, footwear and leatherfood, beverages and tobaccoquarterly, ended February 2006
table 4 full time employment in Australia, by sector
February 1985 February 1995 February 2006 ‘000 % ‘000 % ‘000 %
manufacturing 1 061.5 20 1 018.0 17 931.6 13construction 421.3 8 507.6 8 757.4 11property and business services 333.9 6 576.6 9 893.4 12cultural and recreational services 78.5 1 124.7 2 149.5 2communications 139.8 3 137.8 2 154.9 2other employment sectors 3 417.3 63 3 797.2 62 4 356.5 60
total employment 5 452.3 6 161.9 7 243.3Source: ABS (2006e).

16
australian food industry abare research report 06.23
Over the long term, increased productivity in the food manufacturing industry has allowed output to increase, while using fewer resources (such as labor). This helps to improve the competitiveness of the industry.
research and development expenditureProductivity growth is closely linked to the development and adoption of more effi -cient technology (including products and processes), often a product of research and development. Research and development is defi ned as ‘the systematic investigation or experimentation involving innovation or technical risk’ (ABS 2005, p. 41). The outcome of research and development will be a new or improved product, process, material, device or service, and includes the modifi cation of existing processes or products. Work ceases to be research and development once it is no longer experimental (ABS 2005).
Between 1997-98 and 2003-04, spending on research and development increased by $50 million (in 2005-06 dollar terms) in the food manufacturing sector, although it declined as a share of the total research and development expenditure within the manufacturing industry (fi gure K; ABS 1999a; 2005). Despite the overall increase in research and development expenditure over this period, there was year to year variation of up to $36 million. This may refl ect the fi xed, ‘lumpy’ nature of most research and development expenditure, such as upgrades of equipment or facilities.

17
australian food industry abare research report 06.23
Spending classifi ed as ‘research and development expenditure’ in ABS (2005) statistics is separated into three separate categories: capital expenditure, labor costs and other current expenditure (box 1). Of the $274 million spent on research and development in the food manufacturing sector in 2003-04, 12 per cent was spent on capital expenditure, 45 per cent on labor costs and 43 per cent on other current expenditure.
Firms with a thousand or more employees were responsible for 45 per cent of the expenditure on research and development in the food manufacturing sector in 2003-04. A further 30 per cent was undertaken by fi rms with 200–999 employees. Firms in the categories with 50–99 and 100–199 employees each spent 7 per cent, while fi rms with fewer than 50 employees spent 9 per cent.
Research and development expenditure in the food manufacturing industry has not been as large as in some of the other manufacturing industries, although total spending increased in most states (fi gure L; ABS 1999a, 2005). Tasmania and the two territories were the only regions of Australia to record a decline in food manufacturing research and development expenditure between 1997-98 and
box 1 types of research and development expenditure
Capital expenditure includes the acquisition of fi xed tangible assets, such as land, buildings, vehicles, plant, machinery and equipment attributable to research and development.
Labor costs include wages and salaries; overtime earnings; penalty payments; shift allowances; employer contributions into superannuation; fringe benefi ts and payroll taxes; severance, termination and redundancy payments; workers’ compensation premiums/costs; provisions for employee entitlements; salaries and fees of direc-tors and executives; retainers and commissions of persons who received a retainer; bonuses; annual and other types of paid leave.
Other current expenditure includes materials, fuels and other inputs; rent, leasing and hiring expenses; repair and maintenance expenses; payments to outside organisations for use of specialised testing facilities or for analytical work, engi-neering or other specialised services in support of R&D projects carried out by the business; commission and consultant expenses for research projects carried out by the business (except direct labor costs); software for own account produced as part of R&D; and the proportion of expenditure on general services and overheads (ABS 2005).

18
australian food industry abare research report 06.23
2003-04. The largest increases in state spending during this period (in 2005-06 dollars) were in Victoria ($38.6 million), followed by South Australia ($19.1 million), Queensland ($18.7 million) and New South Wales ($13.1 million). Western Australia had a small increase in expenditure. Almost 70 per cent of the national research and development expenditure in the food manufacturing sector occurred in New South Wales and Victoria in 2003-04.
manufacturing R&D expenditure in Australia, by state fig L
1.40.8 1.21.00.60.40.2$b
New SouthWales
Victoria
Queensland
SouthAustralia
Western Australia
other
1997-98 2003-04
all machineryother manufacturingmetal productspetroleum, coal, chemical and associated productfood, beverages and tobacco
food manufacturing R&D expenditure in Australia, by subsectorfigM
%
1997-98
1999-2000
2001-02
2003-04
20
40
60
80
$224m $257m $221m $230m $256m $251m $268m
Au
beverage and malt
other food
bakery products
flour mill and cereal food
fruit and vegetable
dairy products
meat products
‘Machinery’ includes: motor vehicle and parts, plus other transport equipment; photographic and scientifi c equipment; electronic equipment and electrical equipment and appliances; and industrial machinery and equipment. ‘Other manufac-turing’ includes: textile, clothing, footwear and leather; wood and paper products; printing, publishing and recorded media; nonmetallic mineral products; and other manufacturing.

19
australian food industry abare research report 06.23
Although meat products, dairy products and fl our mill and cereal food were the largest single subsectors of research and development spending, the ‘other food’ category had the strongest growth in R&D spending between 1997-98 and 2003-04, and was the major spending category by the end of the period (DAFF 2005). The ‘other food’ category includes sugar, confectionery, prepared animal and bird feed and seafood. Research and development spending gradually increased in beverages and malt, but spending on R&D for bakery products and fruit and vegetables declined overall during 1997-98 and 2003-04 (fi gure M).
market concentrationSubsectors of the food manufacturing industry worldwide tend to be dominated by large, multinational fi rms. This is also the case in the Australian market, where the largest fi fty food and beverage corporations produced close to three-quarters of the domestic industry’s revenue ($44 billion) in 2003 (IBISWorld 2003). The next largest ten corporations only accounted for an additional 2 per cent of industry revenue. A list of the largest fi fty fi rms shown in fi gure N can be found in appendix A. At the retail level, 100 companies accounted for more than 75 per cent of packaged food sales (AC Nielsen 2004).
Selected features of the largest fi fty food and beverage corporations are shown in table 5. Foreign owned corporations made up almost half of the largest fi fty, and produced 47 per cent of domestic revenue. They were also the type of company that generated the highest average return on shareholder funds during the fi ve years to 2002. Most of the activi-ties of foreign owned corporations in Australia tend to be confi ned to Australia, with only 3 per cent of their total revenue generated from offshore investments.
Publicly listed companies generated close to 30 per cent of total local revenue, but had lower returns to shareholders than foreign owned companies. They operated almost as much offshore as onshore, with 44 per cent of their total revenue gener-ated from overseas investment.
Australia’s largest 50 food and beverage corporations
figN
10 20revenue from domestic market
30 40 502005-06$b
10
no.
20
30
40
50 top 50 $44b
top 10 $20b
top 20 $30b
top 30 $37b
top 40 $41b

20
australian food industry abare research report 06.23
The smallest two company categories, cooperative and private companies, had smaller shares of sector revenues — 14.4 per cent and 10 per cent respectively. Returns to cooperative shareholders were in between the two categories above, at 11.6 per cent. Neither cooperative nor private companies generated revenue from offshore investments (IBISWorld 2003).
Similar to the distribution of food manufacturing production, the largest fi fty food and beverage corporations were based in New South Wales and Victoria, followed by Queensland, South Australia and Western Australia.
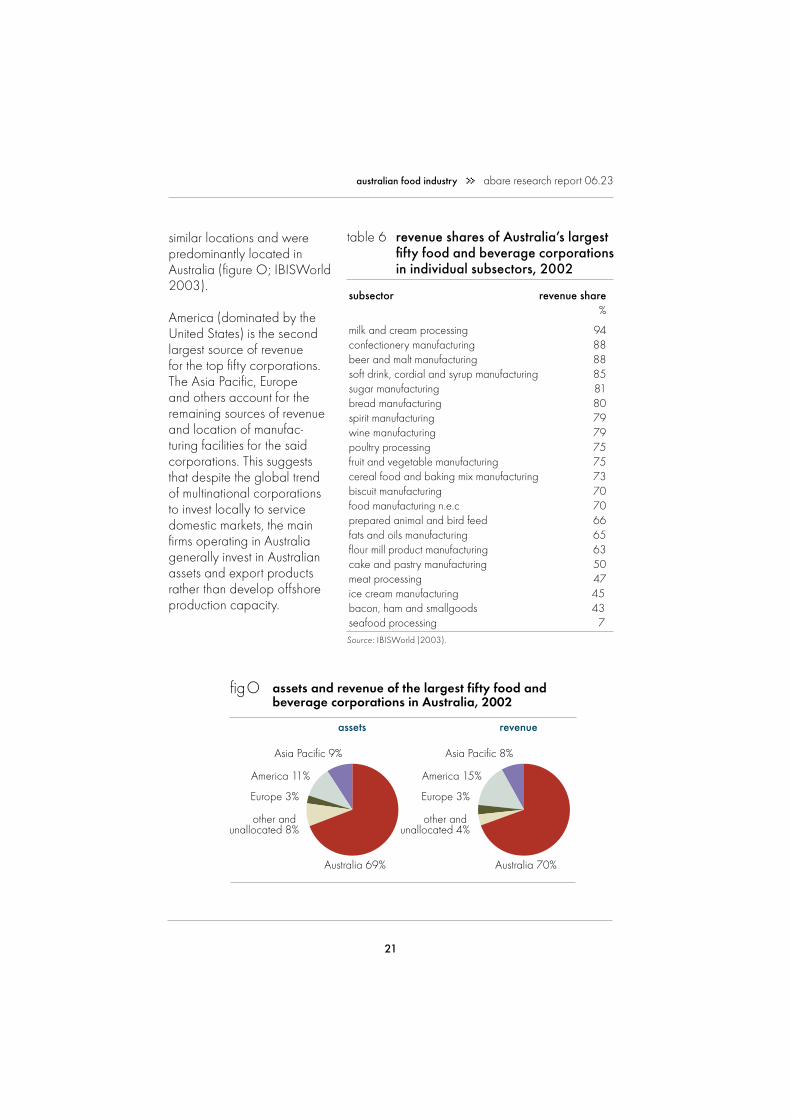
Although the largest fi fty food and beverage corporations in Australia account for a large proportion of food manufacturing revenues in 2002, their revenue shares vary considerably between different subsectors (from 7 per cent in the case of sea food processing to 94 per cent in the case of milk and cream processing) (table 6).
The assets (manufacturing facilities and logistics operations) and main sources of revenue of the largest fi fty food and beverage corporations in Australia are in
table 5 features of the largest fi fty food and beverage corporations in Australia, 2002
return on weighted number total share australian share shareholder of fi rms revenue of total revenue of total funds after tax fi ve years to 2002 no. $b % $b % %by ownershipforeign 24 21.19 39 20.59 46.9 13.8listed 9 22.56 42 12.59 28.7 9.0cooperative 9 6.32 12 6.32 14.4 11.6private 8 4.38 8 4.38 10 na
total 50 54.45 100 43.89 100 11.1
by locationNew South Wales 25 30.03 55 22.07 50 11Victoria 15 17.07 31 14.63 33 12Queensland 7 5.46 10 5.45 12 11South Australia 2 1.48 3 1.33 3 14Western Australia 1 0.41 1 0.41 1 10
total 50 54.45 100 43.89 100 11.1Source: IBISWorld (2003).
21
australian food industry abare research report 06.23
similar locations and were predominantly located in Australia (fi gure O; IBISWorld 2003).
America (dominated by the United States) is the second largest source of revenue for the top fi fty corporations. The Asia Pacifi c, Europe and others account for the remaining sources of revenue and location of manufac-turing facilities for the said corporations. This suggests that despite the global trend of multinational corporations to invest locally to service domestic markets, the main fi rms operating in Australia generally invest in Australian assets and export products rather than develop offshore production capacity.
table 6 revenue shares of Australia’s largest fi fty food and beverage corporations in individual subsectors, 2002
subsector revenue share %
milk and cream processing 94confectionery manufacturing 88beer and malt manufacturing 88soft drink, cordial and syrup manufacturing 85sugar manufacturing 81bread manufacturing 80spirit manufacturing 79wine manufacturing 79poultry processing 75fruit and vegetable manufacturing 75cereal food and baking mix manufacturing 73biscuit manufacturing 70food manufacturing n.e.c 70prepared animal and bird feed 66fats and oils manufacturing 65fl our mill product manufacturing 63cake and pastry manufacturing 50meat processing 47ice cream manufacturing 45bacon, ham and smallgoods 43seafood processing 7Source: IBISWorld (2003).
22
australian food industry abare research report 06.23
supply chain: Australian food manufacturing industry
In this section the 2001-02 cost structure of the Australian food manufacturing sector supply chain as well as the industries where the fi nal products are consumed are examined using the latest available input–output data (2001-02) from the Australian Bureau of Statistics. An analysis of the cost structure of the food manu-facturing sector and the distribution of products or outputs across users provides information on the important inputs to the sector and identifi es the principal buyers of the sector’s outputs. Average values of inputs and outputs for different food subsectors, as well as the industry as a whole, are presented in appendix B, diagrams B1–B10.
Given that the dollar values will have changed since 2001-02, the discussion that follows will be based primarily on the shares involved.
Inputs to each subsector included agricultural goods, food industry goods, other major goods (such as plastic, glass and sheet metal) and major services (such as utilities, transport and business services). In 2001-02, raw agricultural inputs accounted for 32 per cent of total inputs, while major services accounted for 26 per cent, labor 17 per cent, food industry goods 13 per cent and other major goods 12 per cent (appendix B, diagram B1).
The total value of inputs to the food processing industry also includes the value of imported goods in each subsector and the gross industry value added (gross oper-ating surplus and net taxes). Total intermediate inputs from local sources made up an average of 79 per cent of the value of processing outputs in 2001-02. Industry gross value comprised 11 per cent of the value of output and imports were 10 per cent. Within the food processing subsectors, however, there was considerable variation in the proportions of the three different sources of input value. In contrast, wages as a proportion of total value of inputs were around 17 per cent, across most of the subsectors.
The fi nal output table for each industry subsector provides the value of household consumption, exports, industry use and change in inventories. The export values refl ect the exports from a particular food processing subsector, not the total exports of a particular food or commodity. For example, meat and meat product exports do not include meat exported as bakery products (such as ravioli). For this reason, they should not be interpreted as the total exports of a single commodity (for example, meat) as nonprocessed exports and exports from other processed food categories will not be included.

23
australian food industry abare research report 06.23
Household consumption refl ects direct purchases of end use products from retail outlets. It does not include food prepared outside the home, which is captured in the accommodation, cafes and restaurants consumption category. Other industry use refl ects the use of processed food or food byproducts in other industries. Food used in the retail sector refl ects food used in retail production processes (for example, bakeries and salad bars) and loss, damage and wastage at the retail level.
For outputs, most food (in 2001-02 dollar terms) was consumed by households (43 per cent), exported (22 per cent) or used by industries (33 per cent), with the remainder representing changes in inventories in 2001-02 (appendix B, B1). Of the output used by industries, the processed food industry, together with accom-modation, cafes and restaurants, and the retail industry tended to dominate, with shares of 32 per cent, 30 per cent and 19 per cent respectively. Of the output used in the larger two categories (in 2001-02 dollar terms), the majority was consumed by households, although smaller amounts were used within the industry or exported (appendix B, B1). Generally the shares of food product users varied considerably between the individual food products (see appendix B, diagrams B2–B10).

24
global food trends
Global food sales, including food sales through retail stores and food service establishments, were estimated to be worth more than US$4 trillion in 2002 (table 7). Within global food sales, processed products, including packaged food and beverages made up approximately 78 per cent of estimated global sales (Regmi and Gehlhar 2005b). Packaged food alone accounted for 48 per cent of total food sales, while beverages accounted for over 29 per cent. Fresh food was the smallest subcategory, at 22 per cent of total food sales.
food consumption A key trend in food consumption is that the rate of growth per person over time is higher for lower income countries, refl ecting growth from a relatively low level. The rate of growth declines as incomes rise and as nutritional needs are increas-ingly satisfi ed. Together with increases in consumption of non-food items such as services, this results in a smaller share of expenditure on food in the household budget as income increases. For low income countries, the average share of the household budget spent on food in the late 1990s was 47 per cent, while for high income countries the share was 13 per cent (fi gure P; Regmi and Gehlhar 2001).
The type of food consumed also varied between the different income regions. Cereal consumption represented 28 per cent of total food consumption for low income countries but only 16 per cent for high income countries. There were also small differences (3 per cent each) in the proportions of oils and fats and fruit and vegetables consumed in high income countries relative to low income countries (fi gure Q; Regmi and Gehlhar 2001). Expenditure on other food and fi sh was slightly higher in the higher income regions, as were the differences in the amount spent on dairy products (6 per cent) and meat
table 7 global food sales, 2002 in 2002 US dollars
retail food stores service total US$b US$b US$b
fresh food 531 382 913processed products 1 762 1 420 3 182packaged food 1 148 828 1 976beverages 614 592 1 206– alcoholic drinks 316 422 729– hot drinks 53 12 65– soft drinks 245 167 412
total food 2 293 1 803 4 096Source: Regmi and Gehlhar (2005b).
2

25
australian food industry abare research report 06.23
products (7 per cent) (fi gure Q; Regmi and Gehlhar 2001). The breakdown of per person expenditure on food products for each of the different income groups shown in fi gures P and Q highlights the potential for growth in the value of food markets in low income and middle income countries.
Although the changes in the types of food consumed were not large for most food categories across income groups, the change in the proportion of the food budget spent on nonpackaged food compared with packaged food was signifi cant (table 8). For low income countries, only 16 per cent of food purchased during the late
Expenditure in 2002 by income group (based on per person gross national income in US dollars): low income: ≤US$760; middle income: US$761–9360; high income: ≥ US$9361 (World Bank 2000).
table 8 annual average growth in packaged food sales, by income groups a
per person growth in retail packaged expenditure food sales GDP per on food per person person 2002 1996–2002 2000A$ A$ %
high income ≥15 912 1 800 2.5upper middle income 5 145–15 911 548 6.7lower middle income 5 144–1 298 263 28.1low income ≤1 297 116 11.9a World Bank classifi cation.Source: Regmi and Gehlhar (2005).

26
1990s was packaged, while for upper middle income and high income countries, more than 50 per cent of food expenditure was on packaged foods (Regmi and Gehlhar 2005). More than 60 per cent of global packaged food sales were consumed in high income countries, such as Japan, the United States and the Euro-pean Union. Growth in retail sales of packaged food, however, was much larger for lower middle income and low income countries.
There was also a notable difference in the responsiveness of per person consump-tion to changes in the price of food across different income groups. Low income countries tended to have much higher consumption responses to changes in food prices, particularly for fi sh, dairy and meat products (Regmi and Gehlhar 2001). The responsiveness of consumption to changes in prices in high income countries was less than half that of low income countries for almost every food commodity.
Within each income bracket, the range of price elasticities of demand for food was estimated to decline as incomes increased (Regmi and Gehlhar 2001). As a result, changes in food prices result in larger changes in per person consumption in low income countries than in high income countries. For example, if all food prices increased by a given percentage, low income countries like Viet Nam would expe-rience higher rates of decline in consumption than would high income countries such as Australia, particularly for foods such as dairy or meat products that have high income elasticities of demand.
table 9 retail sales and growth of selected food items, by income groups, 2002 in 2002 Australian dollars
breakfast ready dried dairy oils/fats cereals meals food productshigh incomeFrance A$m 4 218 1 188 5 376 1 995 27 088annual growth rate 1998–2003 % 1.3 5.0 4.8 1.5 3.8
upper middle incomeKorea, Rep. of A$m 1 438 259 44 7 237 4 795annual growth rate 1998–2003 % 4.9 9.2 5.0 4.6 4.1
lower middle incomePhilippines A$m 905 42 55 561 1 050annual growth rate 1998–2003 % 8.0 12.0 4.8 12.0 11.0
low incomeViet Nam A$m 377 0.37 177 287annual growth rate 1998–2003 % 14.7 182.0 30.6 10.6Source: Gehlhar and Regmi (2005).
australian food industry abare research report 06.24

27
australian food industry abare research report 06.23
As incomes increase, the size (value of retail sales) of the food market in a country also increases, despite the declining proportion of income spent on food. Expendi-ture on food and annual growth rates of retail sales in the median income countries from four different income country groups (high income, upper middle income, lower middle income and low income) are shown in table 9. Although the size of food markets increases with income, the rate of growth in consumption declines.
changing consumer preferences
Increasing incomes in low income or lower middle income countries are often accompanied by high rates of urbanisation. Higher disposable incomes enable urban residents to diversify their food consumption, while increased employment opportunities often reduce the amount of time available for food preparation at home. Both these factors are likely to contribute to diversifi ed diets, which may include higher shares of processed food products, such as dairy products, precut fi sh and meat, processed fruit and vegetables and ready made meals.
Food markets in high income countries are already dominated by processed food products and have some potential for further growth. However, market expan-sion in developed countries tends to be limited by low rates of both per person consumption growth and population growth. Most expansion, therefore, occurs as a result of product differentiation.
Product differentiation involves the development or promotion of high value food products with attributes beyond the provision of sustenance. The types of food likely to be developed include products with specifi c sensory appeal (color and fl avor enhancement); desired nutritional content; relevant health benefi ts; food safety guar-antees; origin of production; processing practices; or greater convenience.
Within the food manufacturing industry, Australia is both a source of exports and destination for imports of manufactured food products. The Australian market has characteristics that are common to high income markets — low population growth and a declining proportion of household income being spent on food products. For domestic producers to expand their market shares, they need to differentiate their products and develop new export markets. Foreign demand and barriers to trade will infl uence the opportunities for exports, as will Australia’s relative compar-ative advantage in supplying processed foods.
28
industry location and trade
The global food processing industry is dominated by a relatively small number of fi rms (Bolling and Gehlhar 2005). These fi rms operate food processing facilities across countries and are responsible for most of the investment in new processing facilities.
Despite the relatively small concentration in ownership of branded products and production facilities, the existence and location of food processing industries is strongly infl uenced by the costs of both manufactured food production and distribu-tion within a region or country.
When countries are exposed to trade, both the production of goods and the resulting international trade patterns will be determined by their comparative advantage. It is expected that countries will specialise in producing the goods that they are relatively suited to produce — and this in turn is determined by the relative endowment of various factors of production. These can include natural resources (like arable land), skilled and semiskilled labor as well as capital. In particular, it is expected that countries will specialise in producing the goods that rely heavily on the factors that they have in relative abundance.
Although consumption of manufactured foods has grown over the past three decades, and is increasing rapidly, only a small proportion of global food sales are traded products (Regmi and Gehlhar 2005b). In 2002, only 6 per cent of processed food products were traded, compared with 16 per cent of bulk agricul-tural commodities (Regmi and Gehlhar 2005a). Although consumer demand for processed food continues to grow globally, growth in trade has generally stalled since the mid-1990s (Regmi et al. 2005).
It is important to recognise that trade in processed food products is infl uenced by trade policies and the economics of food manufacturing.
The transformation of bulk (or raw) agricultural commodities into prepared food products is classifi ed by the degree of processing and inputs involved. This distinc-tion is refl ected in the Australian data published annually by the Australian Govern-ment Department of Agriculture, Fisheries and Forestry in Australian Food Statistics (DAFF 2005). In that publication, processed foods, such as fl our or frozen vegeta-bles, are classifi ed as ‘minimally transformed’ and animal and vegetable oils, pasta
3

29
and chocolate are classifi ed as ‘substantially transformed’. Manufactured foods are included in the elaborately transformed data and include items such as cakes and pastries or stuffed pasta. That is, elaborately transformed foods are those where various raw and processed agricultural products (such as sugars, salts, fl ours, sweeteners etc) are combined to produce a highly transformed product.
For the purposes of the analysis undertaken here, traded food products are classi-fi ed as:
> bulk commodities, such as grains and fresh fi sh
> minimally transformed products, such as meat cuts, fl our; oils
> substantially transformed products, such as preserved and frozen products
> elaborately transformed products, such as confectionery.
trade policy infl uencesAcross the range of trade policies on agricultural produce, tariffs generally, but not always, appear to increase with the level of processing. Tariff escalation (where trade restrictions increase with the level of processing) affects trade and food production patterns by restricting opportunities to export processed food. As a result, opportunities for processed food industries to develop in countries facing tariff escalation are limited, while domestic industries in countries with escalating tariffs are encouraged. Tariff escalation occurs in both developed and developing countries, with the rate of increase being relatively high for vegetable oils, beefs, eggs and cereal prod-ucts (Regmi et al. 2005).
The average tariff level across a range of food processing items in developing countries is presented in table 10. However, considerable care is required when examining average tariff levels. Averages may be strongly infl uenced by very high tariffs in only a limited number of markets and may not be representative of tariffs affecting the tariff lines most
australian food industry abare research report 06.24
table 10 tariff escalation in developing countries a
applied bound average tariff average tariff % %
processing levelfully processed products 21 53horticultural products 17 47semiprocessed products 11 45primary products 11 45a Includes Argentina, Brazil, Chile, Columbia, Costa Rica, Domin-ican Republic, Ecuador, Egypt, El Salvador, Guatemala, Honduras, India, Indonesia, Jamaica, Mexico, Morocco, Nicaragua, Pakistan, Panama, Philippines, South Africa, Thailand, Trinidad and Tobago, Turkey, Uruguay and VenezuelaSource: Regmi et al. (2005), based on AMAD (2003) data.

30
australian food industry abare research report 06.23
traded. Further, tariff levels within particular food types may be unchanged across the level of processing, or even decline.
Average tariff levels on cocoa, meat and sugar products are presented in table 11, demonstrating both increasing and decreasing tariff rates as the degree of processing increases.
In addition to tariff escala-tion, other trade measures such as countervailing duties and antidumping measures have been increasingly used on processed food products over recent years. Of the total 76 antidumping and
countervailing duties present worldwide on agricultural products in 2002, 43 were on processed food products and only one was on a basic agricultural commodity, the remainder relating to semiprocessed and horticultural products (Gehlhar and Regmi 2005).
the economics of processed food productionThe extent to which a country is involved in food processing will be strongly infl uenced by the input requirements of the food industry, as well as the relative abundance of those inputs domestically. That is, any country can be involved in food processing given the availability of the necessary inputs, access to capital and technology.
The production of manufactured foods requires inputs such as:
> capital in the form of manufacturing and distribution facilities (including access to relevant technologies)
table 11 tariff escalation – selected countries and products a
average tariffs
European Unitedprocessing chain Canada Union Japan States % % % %cocoacocoa beans 0 0 0 0cocoa paste 0 10 8 0cocoa butter 0 8 0 0cocoa powder 6 27 19 16chocolate and products 57 18 21 15
beef, pork and poultrymeat: fresh or frozen 54 40 41 7meat preparations 50 37 91 3
sugarsugar 5 61 198 24sugar confectionery 9 20 16 11a 2000-02 total export value.Source: Regmi et al. (2005), based on AMAD (2003) data.

31
australian food industry abare research report 06.23
> raw agricultural inputs
> operating inputs such as labor, energy, packaging, marketing, etc
> transport services.
Capital and access to technologies are two of the most important inputs in the production of elaborately transformed foods as most manufacturing processes are capital intensive. Being capital intensive means that it is possible to locate produc-tion facilities in relatively high labor cost countries.
Further, raw inputs, such as refi ned sugars, starches and grains, are relatively nonper-ishable and easily transported without loss of nutritional value or quality. The location of manufactured food production that requires these inputs is not dependent on natural resource endowments. Examples of processed products that rely on transport-able inputs include breakfast cereals, confectionery, beer or soft drinks.
Many elaborately transformed products, such as breakfast cereals, beers and confectionaries, have a long shelf life. Nonetheless, timeliness of delivery to the retail or food service industries is an important business consideration. Being located close to the fi nal market minimises distribution costs and assists in managing customer inventories. Locating production facilities close to the relevant market can also result in output being tailored to local or regional tastes.
As a result of these factors, there is substantial scope to produce elaborately transformed goods in many countries around the world. That is, there is no reason, based on economic principles, to expect that countries that have a comparative advantage in producing agricultural goods that are raw inputs will also have a comparative advantage in producing manufactured foods for export to other countries. For example, beer can be brewed anywhere. The inputs used in beer production (malt, hops and grains) are widely traded. There are globally recog-nised licensing agreements for the use of brands and specifi c brewing technolo-gies. To minimise transport costs, a beer of Australian origin is brewed in Canada, where it is sold and exported to the United States under its Australian name (Regmi et al. 2005).
Moving further back along the food processing classifi cation to minimally and substantially transformed foods leads to further consideration of the cost of storage and transporting raw agricultural inputs to processing plants. In this case, there is often colocation between the processing plant and the production of the agri-cultural good, and this occurs primarily because many agricultural goods are perishable. The effective cost of the raw input increases rapidly between the time

32
australian food industry abare research report 06.23
of harvesting and the time of processing because of the spoilage associated with both the time and distance traveled and the increased handling and cold storage logistics. Transport costs have a linear relationship to the distance between the processing facility and the growing region. The impact of spoilage on production costs, however, increases more rapidly, as the ability to convert fresh produce to a quality specifi c processed product decreases more and more quickly the longer the time elapsed between harvesting and processing.
Except where there may be specifi c country advantages with large scale broa-dacre farming for grains or livestock, there is little reason to expect that countries such as Australia have any natural advantage in supplying manufactured food items precisely because of the interaction between perishability, transport costs and access to internationally cost competitive raw inputs.
In the case of vegetables, the colocation of processing facilities with vegetable growing regions in countries around the world results in the lowest transport costs — and occurs primarily because vegetables are perishable. At the same time, transport costs of delivering processed vegetables are also reduced by locating the processing plants close to the fi nal markets. Overall, production costs of the delivered product are minimised by colocating processing plants where vegeta-bles can be sourced competitively, and as close as possible to large or expanding markets (Apted et al. 2006).
The cost advantages of locating processing facilities in producing areas also creates an incentive to locate these processing facilities in the countries with the lowest vegetable production costs. This is balanced against the incentive to locate production facilities close to the fi nal market. The latter effect increases the dispersion of processing facilities internationally, while the former could lead to a concentration of processing within certain regions.
Although the value of internationally traded fresh and processed vegetable prod-ucts increased at a rate of 5.2 per cent a year between 1989 and 2001, this trade was highly regionalised — most trade occurred intraregionally. That is, exports and imports of fresh and processed products occurred predominantly within Asia, within the European Union and within the North American Free Trade Area rather than across regions (Huang 2004). These trade fl ow patterns suggest that the desire to locate processing facilities close to fi nal markets is exerting a strong infl uence on the location of vegetable processing industries across countries.
Investment in food processing facilities is associated with having suffi ciently large demand to satisfy the minimum processing plant sizes in order to achieve

33
australian food industry abare research report 06.23
economically effi cient production outcomes. The opportunity for investment in new facilities is also strongest in countries where food consumption is growing strongly in response to factors such as rising incomes, population growth and changing life-styles. Refl ecting this dynamic, recent investment in food processing internationally has been occurring in developing countries such as China, India, the Philippines and South Africa (Regmi and Gehlhar 2005b).
other trade considerationsThe volume of trade is dependent on consumer preferences both locally in the producing countries and abroad in the countries consuming the imports. The volume of trade is also dependent on the size of the importing market as well as that of the exporting country.
In general, the larger the economy of the importing country, the larger the demand for the imported product. Similarly, the larger the economy of the exporting country, the more likely it is that the exporting industry is relatively large, as it will typically be servicing a large domestic market as well. Operating in a large domestic market may mean that food processors have access to a larger pool of semiskilled and skilled labor, a large service sector supporting the exporting industry and access to effective infrastructure. These factors act to improve the competitiveness of the exporting sector through providing cost effective inputs to the production and transport of exports.
A key determinant of the volume of trade in food manufactures is the cost of conducting trading activities. Trade costs include transport, trade barriers (such as tariffs and nontariff barriers), information costs, contract enforcement costs, various transaction costs, such as legal and regulatory costs or currency and language barriers, and fi nally local distribution costs in the fi nal market (Anderson and van Wincoop 2004).
Over the past thirty years, there has been signifi cant research effort into examining the idea that trade between any two countries is proportional to the product of the economic size of both the importing and exporting country (as measured by gross domestic product, for example) and inversely proportional to the distance between the two countries. Models incorporating these relationships are known as ‘gravity models’ (see box 2).

34
australian food industry abare research report 06.23
global food trade
Turning specifi cally to food products, international trade and the effect of distance, as discussed above, are highly regionalised — with most trade occurring intraregionally.
On a broader food basis, the regionalisation of bilateral trade is also apparent — see table 12 in which data on trade in food products between countries clas-sifi ed according to location (Americas, Europe and Asia) are summarised. Data from the United Nations Comtrade Database used here included trade information for around 150 countries, and accounted for 664 product classifi cations (at the 6 digit harmonised code level).
The highest regional concen-tration in food trade occurred in Europe, where 80 per cent of all exports were to other European countries. In Asia, 65 per cent of food exports by countries were to other Asian countries. Refl ecting the relative proximity of the west coast of north America to Asia, some 30 per cent of food exports from countries in the Americas went to Asia. However, the majority of trade was still intraregional.
table 12 food trade shares, by region, 2004
importing region
other Americas Asia Europe regions a % % % %exporting regionAmericas 43 30 21 6Asia 13 65 16 7Europe 7 9 80 4Other regions a 28 50 16 4a Includes African and Pacifi c nations.Source: United Nations Statistics Division (2006).
box 2: gravity models
In gravity models, distance can be considered as a proxy for a variety of trade costs (Head 2003), such as:
> transport costs of shipping products by road, rail, ship or air
> time elapsed during shipment — for perishable goods, this includes the prob-ability of surviving intact (avoiding spoilage of organic products, damage or loss from weather events or mishandling, and loss of market where the intended buyer becomes unwilling or unable to make payment)
continued

35
australian food industry abare research report 06.23
box 2: gravity models continued
> coordination costs associated with managing supply chains that have multiple inputs sourced from a variety of regions
> communication costs, where electronic communication may provide an imperfect substitute for personal contact between managers, processors and customers
> search and transaction costs, where distance may be inversely correlated with the costs of searching for trading opportunities and the establishment of trust between potential trading partners and
> cultural effects, where the greater the geographic distance, the greater the likely cultural ‘distances’ that may inhibit communication or result in clashes of business and negotiating styles.
The size of the distance effect appears to be signifi cant. Although the distance effect depends on the product being traded, an analysis undertaken by Disdier and Head (2005) suggested that for every doubling of distance, the value of trade declines by 90 per cent on average. That is, commerce declines dramatically with distance.
A recent study of Australia’s aggregate trade performance found that the impact of distance on all exports was such that the value of exports declined by only 50 per cent for every doubling of distance (Battersby and Ewing 2005). This suggests that Australia is performing signifi cantly better than might be expected since, on average, the geographic distribution of Australia’s exports is much wider than could be expected based on the size of Australia’s economy and its distance from trading partners.
In fi gure R the relationship between distance, the size of the trading partner’s economy and food exports is shown. As expected, because of Australia’s geographic isolation, very few trading partners are near Australia. However, although the number of trading partners increases with the distance from Australia, the ratio of exports to GDP declines. This suggests that the size of distance effect reported in Battersby and Ewing (2005) for general manufacturing goods also applies to food trade.

36
australia’s export performance: revealed comparative advan-tage analysis
The export of food products (excluding unprocessed items such as grains, live animal and seafood) from Australia has grown at an average of 3.5 per cent a year since 1994, around 1 percentage point higher than the growth in total world trade in food products.
There are fundamental economic drivers that tend to result in countries special-ising in the production and export of products for which they have a comparative advantage. Provided that technology is able to be directly acquired and located with relative ease, comparative advantage between countries and regions typically results from differences in the relative supply of inputs, such as labor or natural endowments. Industries that rely on a relative abundance of factors of production in a particular country or region are generally considered to have a comparative advantage in the products they produce. By engaging in trade, coun-tries that specialise in producing goods at which they are relatively effi cient will maximise their economic wellbeing by importing the goods that they are relatively less effi cient at producing.
In Australia’s case, the relatively scarce resource tends to be labor, including unskilled, semiskilled and skilled workers. Relatively abundant resources include natural endowments (such as agricultural land) and capital. Australia can therefore be expected to have a comparative advantage in products that are relatively more land and capital intensive than those of their trading partners.
In this chapter, the performance of Australia’s food manufacturing industry is exam-ined by assessing the extent to which the composition of food exports refl ects likely comparative advantage.
revealed comparative advantage analysisBy examining the extent to which an exporting country captures world market share for a particular product relative to the degree to which it captures export
4

37
australian food industry abare research report 06.23
market share for all traded goods, an inference can be made as to whether or not the country is specialised in producing that product, and hence the revealed comparative advantage (see box 3).
An RCA greater than 100 signifi es a revealed comparative advantage for the particular item; an RCA less than 100 signifi es a comparative disadvantage. The analysis can be conducted either at the individual good level (if data are available) or at an aggregated level. For example, total Australian exports of food products (from bulk products through to elaborately transformed products) represent around 3 per cent of world food trade and total Australian merchandise exports amount to approximately 1 per cent of total world trade. The RCA index for Australian exports of food products of 300 indicates that, in aggregate and as expected, Australia has a revealed comparative advantage in producing food products.
However, an analysis conducted at such an aggregate level overlooks the extent to which exports of individual foods are products in which Australia may have a revealed comparative advantage or whether this advantage is in bulk or trans-formed food products.
The RCA index is an imperfect measure of comparative advantage because it embodies not only the fundamental economic factors (such as relative factor endowments) affecting relative effi ciency but also government policies and institu-tions that may distort markets, either domestically or internationally. As the produc-
box 3 revealed comparative advantage
The revealed comparative advantage (RCA) index used in this analysis relies on the level of exports for food (for human consumption) and is defi ned as:
RCA=100*[ ]where: X = exports; k = commodity or product; i = country (Australia in this case); and w = world.
Thus RCA = country i’s share of world trade in product k
country i’s share of world merchandise trade
Xjk Xi
Xwk Xw
/

38
australian food industry abare research report 06.23
tion of food and agricultural products in general in Australia has been only lightly assisted by government, any distortion in the measure will arise from distortions in production or trade from the policies of other countries. That is, if current interna-tional trade policies and trade arrangements encourage exports by other coun-tries, or result in lower exports of food products from Australia, the RCA indexes for Australia may be understated. On the other hand, if such policies lead to reduced production or trade by other countries that would not occur in the absence of those policies, RCA indexes for Australia may be overstated.
For this analysis, the trade data have been taken from the Comtrade Trade Statistics Database (2006) at the Harmonised System (HS1992) six digit level. The list of the 570 food product lines considered here is presented in appendix C. Although trade records in HS1992 begin in 1988, substantial coverage (100 countries or more) does not begin until 1994. Hence the changes in revealed comparative advantage for Australia are considered over the eleven year period 1994 to 2004.
Further, in line with the discussion in chapter 2, food product lines have been grouped into four levels of food processing:
> bulk
> minimally transformed
> substantially transformed
> elaborately transformed.
This refl ects both the defi nitions of processed and manufacturing foods presented in chapter 2 and allows for comparison with the annual data presented in Australian Food Statistics. The broad groupings of harmonised system codes, their descriptions and the processing classifi cation are presented in table 13.
A snapshot of the assessment of the revealed comparative advantage of Australian food products in 2004 is presented in fi gure S. All products with an RCA index greater than 100 are
comparative advantage and export levels, 2004
figS
10
100
1000
10 000 bulk commoditiessubstantially transformedelaborately transformedminimal transformation
revealed comparative advantage
10 100 1000 10000
expo
rt va
lue (U
S$m
) log
scal
e
revealed comparative advantage (log scale)

39
australian food industry abare research report 06.23
table 13 description of product groupings a
HS code – 4 digit HS code – 4 digit
bulk commoditiesfi sh (fresh or chilled) 0302 rice 1006crustaceans, etc 0306, 0307 sorghum 1007eggs 0407 other grains (eg millet) 1008vegetables (fresh) 0719–0799 soya beans 1201wheat 1001 peanuts 1202rye 1002 copra 1203barley 1003 oilseeds 1204–1207oats 1004 other (eg seaweed) 1210, 1211, 1801corn 1005 pulses (eg lupins) 1214
minimally transformedfresh, chilled meats other meats (eg beef, lamb etc) 0201–0206 (eg kangaroo, tripe) 0208, 0401, 0504poultry 0207 milk and cream 0401–0401seafood – frozen 0303, 0304 food nec (eg honey) 0408, 0409other seafood – cooked, processed fruit, frozen, or preserved 0305–0307 nuts and vegetables 0711–0814, 1105other spices fl our (inc. groats (eg coffee, cloves etc) 0901–0910 and rolled grains) 1101–1104, 1208malt 1107 gum, plant extracts 1301, 1302animal fat 1502, 1503, 1506 fi sh oils and fats 1504–1507sugars (raw and refi ned) 1701, 1703 cocoa powder, paste 1802–1806
substantially transformedbacon, ham and 0209–0210, 0504 seafood – smoked, dried etc 0305–0307 smallgoods, 1601–1603 seafood – preserved 1603–1605 dairy products (eg yoghurt, cheese) 0402–0406frozen vegetables 0710 dried vegetables 0712–1713preserved vegetables 2001–2005 dried fruits 0801, 0804, 0806, 0813starch (from grains, potato etc) 1108 thickeners 1302vegetable oils 1507–1508, 1510–1518 soft drink, cordial and syrup 1702, 2201, 2202chocolate, cocoa preparations 1806 fl our preparations 1901pasta 1902 tapioca 1903other grain preparations 1904 extracts, essences and broths 2101–2106vinegar 2209 proteins, gelatins 3501, 3502
elaborately transformedsugar confectionery 1704, 1806 stuffed pasta 1902biscuits 1905 cakes and pastries 1905bread 1905 beer, wine & spirits 2203–2208
a The Harmonised System (HS) provides a nomenclature for classifying internationally traded goods. The defi nitions of HS commodity groupings up to the 6 digit level are established by the World Customs Organisation (www.wcoomd.org).

40
australian food industry abare research report 06.23
table14 comparative advantage value share, by category, 2004
level of processing RCA>100 RCA<=100
% %
bulk 97 3minimally transformed 96 4substantially transformed 93 7elaborately transformed 90 10elaborately transformed (not including wine) 44 56
regarded as products in which Australia had a revealed comparative advantage in 2004. The positive relationship between the level of exports and the increasing value of the RCA index refl ects the nature of the index used, in that the larger the share of total domestic exports of a particular category, the more likely it is that a country has ‘specialised’ in producing that good because of a revealed compara-tive advantage.
Of the 497 product lines (at the HS six digit level) exported from Australia in 2004, 158 are classifi ed as products in which Australia has a revealed compara-tive advantage in that year (see appendix C for a full listing of these 158 product lines). At around $22 billion, these product lines accounted for 95 per cent of the value of exports in 2004. The total value of exports classifi ed as being products in which Australia does not have a revealed comparative advantage was still signifi -cant, however, at approximately $1.1 billion in 2004.
Although elaborately transformed products had the smallest total share of the exported products that were considered to have an RCA value greater than 100, they still accounted for 90 per cent of the value of exports in the elaborately transformed category (table 14). If wine was not included, however, the share of elabo-rately transformed products that had an RCA value greater than 100 fell to 44 per cent for the year 2004.
Of the 159 product lines in which Australia is classifi ed in this report as having a revealed comparative advantage, 28 are bulk commodities, 65 minimally trans-formed, 57 substantially transformed and 8 elaborately transformed.
The top fi ve exports in value terms in each category are reported in table 15 and the top eight are included for the elaborately transformed category. Together, exports in these 23 product lines accounted for 76 per cent of the total value of food exports in 2004.

41
australian food industry abare research report 06.23
revealed comparative advantage over time
For Australia, the number of food product lines that are exported between 1994 and 2004 in which Australia is assessed to have a revealed comparative advan-tage has remained relatively stable at around 150–160 items (table 16). That said, however, there are periods when the number of products in which Australia
table 15 selected products and RCA indexes, 2004
export value RCA 2004 $m
bulkH0-100190 – wheat except durum wheat, and meslin 4 091 1 681H0-100300 – barley a 1 298 2 861H0-080290 – nuts edible, fresh or dried, nes 148 1 593H0-080510 – oranges, fresh or dried 113 290H0-100110 – durum wheat 95 465
minimally transformedH0-020230 – bovine cuts boneless, frozen 2 430 2 539H0-020130 – bovine cuts boneless, fresh or chilled 2 036 1 942H0-020442 – sheep cuts, bone in, frozen 368 2 223H0-020422 – sheep cuts, bone in, fresh or chilled 320 3 353H0-030621 – rock lobster and other sea crawfi sh not frozen 236
substantially transformedH0-040690 – cheese except fresh, grated, processed or blue-veined 494 318H0-040210 – milk powder < 1.5% fat 413 817H0-040221 – milk and cream powder unsweetened < 1.5% fat 390 621H0-040630 – cheese processed, not grated or powdered 217 969H0-210690 – food preparations nes 200 105
elaborately transformedH-220421 – grape wines nes, fortifi ed wine or must, pack < 2L 2 470 1 210H-220429 – grape wines, alcoholic grape must nes 176 684H-180631 – chocolate, cocoa preps, block, slab, bar, fi lled, >2kg 107 409H-180690 – chocolate/cocoa food preparations nes 106 141H-220410 – grape wines, sparkling 65 138H-170410 – chewing gum containing sugar, except medicinal 19 185H-220600 – fermented beverages nes (eg cider, perry, mead, etc) 11 178H-190510 – crispbread 10 278a Includes barley for feed.

42
australian food industry abare research report 06.23
can be classifi ed in this report as having a revealed comparative advantage can increase or decrease in response to market opportunities.
In the period 1994–2004, the value of exports in bulk, substantially trans-formed and elaborately transformed products grew moderately strongly (table 17). The strong growth in exports in elaborately transformed products was largely a refl ection of the strong export growth of the Australian wine sector over the period. The value of minimally trans-formed products generally declined over the period, although the sudden increase in export values in 2004 returned the sector to the levels experienced ten years earlier.
Change in the revealed comparative advantage of different sectors can also be examined over time (fi gure T). Although there is variation in the RCA indexes across the classifi cations over time, at the level of aggrega-tion used, all groups of food exported exhibited a revealed comparative
table 16 count of Australian product lines with revealed comparative advantage, by transformation process
bulk minimally substantially elaborately transformed transformed transformed no. no. no. no.
1994 31 59 53 51994 31 59 53 51995 35 66 56 61996 30 67 54 91997 32 72 54 81998 31 68 54 61999 32 66 56 92000 36 73 62 82001 37 78 56 102002 32 68 54 102003 27 64 56 82004 28 65 57 8
table 17 Australian exports, by transformation process in 2005 dollars
bulk minimally substantially elaborately transformed transformed transformed $m $m $m $m
1994 3 773 8 116 2 766 8391995 3 190 7 928 2 761 9301996 6 856 7 190 3 332 1 1551997 6 632 7 613 3 296 1 2651998 4 682 5 444 3 001 1 2671999 4 589 5 895 3 177 1 5712000 4 542 6 031 3 468 1 7162001 4 345 6 187 3 345 1 8152002 4 776 5 970 3 281 2 2102003 3 473 6 143 2 997 2 5732004 6 258 7 924 3 692 3 172
annual % % % % growth a 2.7 < 0.1 6.9 13.0a Annual growth in export value 1994–2004.

43
australian food industry abare research report 06.23
advantage in 1994–2004. The variation in revealed comparative advantage that occurs appears to coincide with changes in exports, particularly in the bulk and minimally transformed sectors. Not surprisingly, large drops in revealed comparative advantage for bulk products coin-cide with the droughts in 1994-95 and 2002-03.
Individual sectors that are large rela-tive to the chosen level of aggrega-tion, or sectors experiencing strong export growth can signifi cantly infl u-ence the determination of whether a group of commodities exhibits revealed comparative advantage. For example, in the elaborately transformed sector, wine accounted for 33 per cent of Australian exports from this sector in 1988. By 2004, wine products accounted for 84 per cent of elaborately transformed food exports. Considering only those products in which Australia has a revealed comparative advantage, wine accounted for 92 per cent of the value of exported products in 2004.
For elaborately transformed products, the RCA index over time was recalculated to exclude wine products (fi gure T). This resulted in a much lower level for the index — with the index being less than 100 in four of the eleven years.
revealed comparative advantage, by product groupsThe majority of the food products that are classifi ed as minimally or substantially transformed are meat, dairy, fruit and vegetables. The RCA indexes between 1994 and 2004 are presented in fi gure U.
Meat (whole carcasses and specifi c cuts or portions from cattle, sheep, pigs and other animals) accounted for a large share of exports in the minimally and substan-tially transformed products during the period examined. For example, in 2004, 55 per cent of the value of minimally and substantially transformed products exported was classifi ed as meat. With an RCA index well in excess of 100 over this period, it is clear Australia has a revealed comparative advantage in these products. Examination of the RCA indexes at the fi ner product lines within meat, such as

44
australian food industry abare research report 06.23
carcasses or cuts for beef, sheep, lambs and pigs, were all revealed to have a revealed comparative advantage.
Similarly, dairy products (including milk, cream, milk and cream powders, ice cream, cheeses, whey and yogurt) also had a large export share and at the aggregated product level the RCA indexes were all greater than 100. These prod-ucts accounted for 20 per cent of the export value of minimally and substantially transformed products in 2004.
On the other hand, both poultry products and processed meats such as bacon, ham and other smallgoods are products in which Australia appeared to have a revealed comparative disadvantage.
Processed vegetables and fruit and nuts were generally not shown as having a revealed comparative advantage. Processed fruits and nuts as a whole did not appear to have a revealed comparative advantage for virtually any of the period examined. Processed vegetables have declined in terms of revealed comparative advantage since the end of the 1990s.
The economic characteristics of processing vegetables and fruits in particular, where there is a relatively high labor input required for harvesting and processing, are likely to mean that any revealed comparative advantage that Australia exhibits in these type of products may be only temporary in nature. For example, this may occur when there is a large harvest and raw crop materials are available at rela-tively low cost.
revealed comparative advantage indexes for meat, dairy, fruit and vegetable products in Australia
figU
RCA index, log scale
19981995 2001 2004
10
100
1000
fruits and nutsvegetables
dairy product n.e.c.icecream
milk and cream
bacon, ham and smallgoodspoultry
meat
Milk and cream includes milk and cream powders as well as liquid products. Dairy products nes includes cheeses, yogurt, buttermilk and whey products.

45
australian food industry abare research report 06.23
RCA indexes for elaborately transformed products like biscuits, confectionery and beverages are presented in fi gures V and W.
Biscuit products are estimated to have exhibited a revealed comparative disadvan-tage in every year from 1994 to 2004. Similarly, the inference for beverage prod-ucts, such as soft drinks and cordials, is that Australia does not have a revealed comparative advantage in these products.
Where inputs for elaborately transformed products are easily transported, manu-facturers prefer to locate their manufacturing plants closer to the fi nal market where local requirements can be accom-modated and managing delivery may be easier. This preference will be maintained as long as the fi nal market is of suffi cient size to exploit any economies of size of processing plants.
Australia appears to have had a revealed comparative advantage in fl our and, until recently, in cereal foods and baking mixes (fi gure V). In the case of fl our, this result is likely to be a refl ection of the comparative advantage of grain production and
revealed comparative advantage indexes for processed flour product, oils and confectionery in Australia
figV
RCA index, log scale
19981995 2001 2004
10
100
1000 flour mill productsconfectionerycereal food and baking mixfood n.e.c. (eg spices, coffee)oil and fatsbiscuit
46
australian food industry abare research report 06.23
the capital intensive nature of the milling process offsetting any competitive disad-vantages associated with the cost of transporting fl our to overseas markets.
identifying growth opportunitiesRefl ecting the economic incentives associated with profi t opportunities and changing cost structures within an economy, the sectors that are considered to have a revealed comparative advantage in the 1994–2004 period are likely to attract resources to them and increase output. In contrast, fi rms operating in sectors in which Australia does not have a revealed comparative advantage are likely to experience more diffi cu lty in attracting investment to expand their market. Over the medium to long term, it can be expected that sectors in which Australia does not have a revealed comparative advantage may well move away from the export market, and their shares of the domestic market may contract, especially when there is competition from imports.
For sectors in which Australia has a revealed comparative advantage, there may be opportunities for Australian exporters to expand their markets. However, such expansion would by no means be certain. For example, if growth in the global market is slow or the market is shrinking, revealed comparative advantage may not refl ect increased exports or a larger market share. Key opportunities are likely to be in sectors where Australia has a comparative advantage and the growth of world exports in those sectors is higher and continuing. Sectors where opportuni-ties will be limited are likely to be those where world trade is contracting.
Average annual growth rates between 1994 and 2004 for both world trade and Australian exports across all product lines are plotted in fi gure X.
The vertical line in this fi gure is the average world growth (2.4 per cent) a year in real terms (net of infl ation) in the value of total food trade from 1994 to 2004. Any point plotted to the right of this line means that world exports in that product line are growing faster than the world average for all items.
The second (inclined) line plots points where the growth rate of Australian exports in food exports matches the world growth rate. Any points plotted above this line are product lines in which Australia’s exports are growing faster than world exports. These product lines are considered to be gaining market share in the world market.

47
australian food industry abare research report 06.23
Given the structure of fi gure X, it becomes apparent that any point in area 1 indi-cates a product line in which:
> world growth is above average and
> Australian export growth is greater than world growth and Australia is gaining market share.
Similarly, any point in area 4 of fi gure X indicates a product where:
> Australian export growth is less than world growth and
> world growth in exports is above the average for the sector as a whole.
In the latter case, the world market for the product is growing faster than Australian fi rms are increasing their exports of products.
Restricting attention only to those products in which Australia has been previously estimated to show a revealed comparative advantage in the period 1994–2004 results in the information provided in fi gure Y.
The 159 product lines that demonstrate a revealed comparative advantage accounted for 95 per cent of the total value of Australia’s food exports in 2004. Australia’s share of world trade has been increasing in 100 of those lines. That is, the growth in exports of 100 food product lines from Australia was greater than the growth in total world trade for each of those products in 2004. These product lines
Australia and world food export growth,by product, 1994–2004
figX
–20% –15% –10% –5% 0% 5% 10% 15% 20%world growth rate
average world growth
Australian growth= world growth
area 2 area 1
area 4area 3–40
–30
–20
–10
%
10
20
30
40
Austr
alia
n gr
owth
rate
bulk commoditiessubstantially transformedelaborately transformedminimally transformed
Includes product lines that Australia exported for at least 10 of the 11 years between 1994 and 2004.

48
australian food industry abare research report 06.23
accounted for 78 per cent of the value of exports for goods with a revealed compar-ative advantage, and 75 per cent of total food exports in value terms in 2004.
There were 41 products in area 1 (excluding wine), which accounted for 27 per cent of the value of exports that are shown to have a revealed comparative advantage (fi gure Z), around US$3.5 billion in 2004. Around 74 per cent of the value of exports in area 1 is in minimally transformed product lines, and a further 16 per cent of the value of exports is substantially transformed lines. Meat domi-
Australia’s strong food export performers,1994–2004
figY
–20% –15% –10% –5% 0% 5% 10% 15% 20%world growth rate
average world growth
Australian growth= world growth
area 2 area 1
area 4area 3–40
–30
–20
–10
%
10
20
30
40
Austr
alia
n gr
owth
rate
bulk commoditiessubstantially transformedelaborately transformedminimally transformed
proportions of Australia's exports, by performance, 1994–2004figZ
world growth rate
average world growth
Australian growth= world growth
area 2 area 1
area 4area 3
49% 27%
7% 17%

49
australian food industry abare research report 06.23
nated the minimally transformed exports (90 per cent). Although bulk transformed food exports in area 1 were much smaller, they had a wider range of product lines, and included high proportions of dairy products, sugar, seafood and fruits and nuts.
Products in area 2 are also increasing their share of world trade; however, they are competing in market segments where there is relatively slow growth or even a shrinking world market. Around 49 per cent of the value of food product exports in which Australia has a revealed comparative advantage is accounted for by these products, approximately US$6.5 billion in 2004. Around 66 per cent of the value of exports in area 2 were in bulk product lines (grains and pulses), with smaller amounts in the substantially transformed (19 per cent) and minimally transformed (14 per cent) categories in 2004.
In area 3 of fi gure Z, only 7 per cent of Australia’s food exports in value terms are in product lines where Australia has a revealed comparative advantage, which was just below US$1 billion in 2004. In the case of these product lines the market is growing relatively slowly or shrinking and Australia’s market share is diminishing.
The product lines in area 4 were worth about US$2.3 billion in 2004, or 17 per cent of the value of exports of commodities in which Australia was shown to have a revealed comparative advantage. Most of the product lines in this area are minimally transformed meat products (74 per cent). Substantially transformed products made up about 20 per cent of area 4, with the remainder of the product lines being from the bulk category. The growth in these product markets was lower in Australia than for the rest of the world. These product lines may represent an opportunity for Australian markets to expand and increase exports.
A word of caution is required on the revealed comparative advantage analysis presented above. The analysis is undertaken at the product level and should not be taken to infer the opportunities for any individual fi rm. At the individual fi rm level, it may be possible that exports are increasing even though they are operating in product lines for which it is assessed that Australia does not appear to have a revealed comparative advantage, or one in which the world market is shrinking. For example, a fi rm may be exploiting recent technological developments that signifi cantly reduce costs, and thus increasing the relative effi ciency of producing a product. Or the fi rm may be able to exploit certain scarce labor skills either at the management level or at the plant level that are unique to that fi rm.

50
australian food industry abare research report 06.23
Although elaborately transformed products account for only 3 per cent of the products in area 1, those products accounted for 49 per cent of the elaborately transformed products that were shown to have a revealed comparative advan-tage; the remaining 51 per cent were in area 2 (table 18). Across the minimally or substantially transformed products, the overwhelming majority of their exports were in areas 1 and 2.
table 18 proportions of Australia’s exports, by transformation, 2004
area 1 area 2 area 3 area 4 % % % %
bulk 6 92 1 2minimal transformation 45 15 10 30substantially transformed 21 46 15 18elaborately transformed 49 51 0 0
total 27 49 7 17

51
appendix
large food processing fi rms in australia’s domestic market, 2002
table 19 largest fi fty food and beverage corporations
exports as a total revenue local production food exports percentage of enterprise 2002 2002 2002 local production $b $b $b %
1 Fosters Group 5.16 2.79 0.56 202 Burns Philip/Goodman 4.82 2.13 0.14 73 Coca Cola Amatil 3.83 1.92 0.1 54 Southcorp 2.82 1.18 0.42 365 Australia Meat Holdings 2.71 2.71 1.8 666 Nestle 2.4 2.26 0.11 57 Murray Goulburn 2.01 2.01 1.3 588 George Weston 1.75 1.53 0.06 49 Lion Nathan 1.71 1.22 0.02 210 Cadbury Schweppes 1.59 1.51 0.08 511 Ridley 1.42 0.55 0.08 1512 Dairy Farmers 1.35 1.35 0.05 413 Effem/Mars 1.34 1.34 0.4 3014 Inghams Enterprises 1.22 1.22 0.01 115 Cargill Meat 1.14 1.14 0.11 1016 National Foods 1.11 1.11 0.08 717 Bonlac Foods 1.05 1.05 0.39 3718 Unilever, food only 0.89 0.89 0.07 819 BRL Hardy 0.87 0.72 0.36 5020 Nippon Meat 0.83 0.83 0.75 9021 Ricegrowers Co-op 0.79 0.79 0.48 6422 Simplot 0.74 0.74 0.04 523 Arnott/Campbell 0.73 0.73 0.14 1924 Parmalat Australia 0.68 0.68 0.03 425 Diageo Australia 0.68 0.68 0.03 426 Kraft Foods 0.67 0.67 0.19 2827 Bartter Enterprises 0.66 0.66 0.01 1
A
continued...

52
australian food industry abare research report 06.23
table 19 largest fi fty food and beverage corporations continued
exports as a total revenue local production food exports percentage of enterprise 2002 2002 2002 local production $b $b $b %
28 CSR Sugar 0.64 0.64 0.03 429 Orlando Wyndham 0.61 0.61 0.28 4630 Teys Bros 0.6 0.6 0.6 10031 Manildra Group 0.54 0.54 0.05 1032 Consolidated Meat (CPH) 0.54 0.54 0.43 8033 Kellogg 0.51 0.51 0.08 1634 Heinz Watties 0.49 0.49 0.05 1035 Berri 0.49 0.49 0.04 836 Smiths Snackfoods 0.46 0.46 0 037 SPC Ardmona 0.45 0.45 0.18 4038 Finasucre 0.42 0.42 0 039 Peters and Brownes 0.41 0.41 0.04 1040 Golden Circle 0.4 0.4 0.04 941 Riverina 0.39 0.39 0.14 3542 Bunge Industrial 0.37 0.37 0 043 Warrnambool 0.31 0.31 0.03 1044 Baiada Poultry 0.29 0.29 0 045 Snack Foods 0.28 0.28 0 046 Tatura Milk 0.27 0.27 0.17 3747 Mackay Sugar 0.26 0.26 0.01 448 McCain Foods 0.26 0.26 0.01 449 Sanitarium Health 0.25 0.25 0.04 1650 Hamsdale 0.25 0.25 0 0
total 54.46 43.9 10.03
51 Sara Lee Coffee 0.25 0.2552 Castle Bacon 0.24 0.2453 Bega Co-op 0.19 0.1954 Green’s Foods 0.16 0.1655 Norco 0.16 0.16Source: IBISWorld (2003).

53
appendix
food manufacturing sector: cost structure and product distribution
diagamsB1 food proccessing, 2001-02 54
B2 meat and meat products processing, 2001-02 55
B3 dairy products, 2001-02 56
B4 fruit and vegetable products, 2001-02 57
B5 fl our mill products and cereal foods, 2001-02 58
B6 bakery products 2001-02 59
B7 confectionery and soft drinks, 2001-02 60
B8 beer and malt, 2001-02 61
B9 wine, spirits and tobacco, 2001-02 62
B10 oils and fats, 2001-02 63
B

54
australian food industry abare research report 06.23
B1 food processing, 2001-02
Agricultural goodsBeef cattle 5520 31%Dairy cattle 3448 20%Other agriculture 3289 19%Grains 2554 14%Sheep 1148 7%Poultry 970 6%Pigs 686 4% Total 17615
Major services Transport and storage 3761 26%Wholesale trade 2959 20%Business services 2296 16%Banking, fi nance and insurance 879 6%Utilities (elec, gas, water) 859 6%Accommodation, cafes etc 842 6%Scientifi c and technical research 618 4%Mechanical repairs 554 4%Property services 457 3%Communication 411 3%Other services 397 3%Retail trade 387 3%Construction services 133 1%Government administration 126 1%Total 14679
Own use (food industry goods) Meat products 1408 19%Other food products 1258 17%Flour mill products and cereal foods 906 12%Dairy products 806 11%Fruit and vegetable products 721 10%Bakery products 620 8%Oils and fats 549 7%Confectionery and soft drinks 482 6%Wine, spirits and tobacco 469 6%Beer and malt 267 4%Total 7486
Other major goods Paper containers and products 1686 25%Other goods 1553 23%Plastic products 1490 22%Sheet metal products 679 10%Commercial fi shing 647 10%Glass products 423 6%Oil and gas 296 4%Total 6774
Usage in other industriesOwn use (processed food industry) 7486 32% –other food products 1726 –bakery products 1058 –meat products 925 –fruit and vegetables 713 –fl our mill products 703 –dairy products 642 –wine, spirits and tobacco 534 –confectionery and soft drinks 505 –oils and fats 431 –beer and malt 249Accommodation, cafes and restaurants 7071 30%Retail trade 4413 19%Other industries 2456 10%Sheep and cattle (beef and dairy) 590 2%Pigs and poultry 472 2%Wholesale trade 295 1%Construction 251 1%Business services 232 1%Scientifi c and technical research 163 1%Commercial fi shing 152 1%Government adminstration 89 0%
Total industry uses 23670
Total inputs Agricultural goods 17615 32%Major services 14679 26%Wages 9248 17%Own use 7486 13%Other major goods 6774 12%Total 55802
Industry gross value-added Gross operating surplus 6648Net taxes (on production) 846Total 7494
Total inputs 55802 79%Industry gross value added 7494 11%Imports within category 7303 10%
Total supply 70592
Household consumption 31130 43%Total industry uses 23670 33%Exports 16221 22%Change in inventories 1359 2%
Total consumption 72379
Usage in other industriesOwn use (processed food industry) 7486 32%–other food products 1726–bakery products 1058–meat products 925–fruit and vegetables 713–fl our mill products 703–dairy products 642–wine, spirits and tobacco 534–confectionery and soft drinks 505–oils and fats 431–beer and malt 249Accommodation, cafes and restaurants 7071 30%Retail trade 4413 19%Other industries 2456 10%Sheep and cattle (beef and dairy) 590 2%Pigs and poultry 472 2%Wholesale trade 295 1%Construction 251 1%Business services 232 1%Scientifi c and technical research 163 1%Commercial fi shing 152 1%Government adminstration 89 0%
Total industry uses 23670
Household consumption 31130 43%Total industry uses 23670 33%Exports 16221 22%Change in inventories 1359 2%
Total consumption 72379
$m $m $m
inputs outputs

55
australian food industry abare research report 06.23
B2 meat and meat products processing, 2001-02
> Meat and meat products was the largest subsector in 2001-02.
> Agricultural goods (including three of the top four individual inputs, beef cattle, poultry and sheep) were the largest input category, making up 52 per cent of total inputs.
> Direct household consumption was, at 25 per cent, the lowest of all the subsectors examined, refl ecting that meat and animal products such as fats and leather are consumed in a wide variety of other industries.
> Labor value share was similar to the food processing industry average.
Agricultural goodsBeef cattle 5520 66%Sheep 1148 14%Poultry 955 11%Pigs 686 8%Other agriculture 4 0%Total 8313
Services Transport and storage 994 38%Wholesale trade 315 12%Property services 275 11%Business services 282 11%Utilities (elec, gas, water) 222 9%Other services 202 8%Communication 85 3%Mechanical repairs 74 3%Banking, fi nance and insurance 73 3%Scientifi c and technical research 60 2%Construction services 10 0%Total 2592
Major goods Paper containers and products 240 49%Other goods 188 38%Plastic products 61 12%Total 489
Major food industry goodsOther food products 212 100%Total 212
Usage in other industries Retail trade 2250 36%Other industries 1770 28%Food industry 1408 23% –own-use (meat processing) 728 –other food 345 –bakery products 230 –oils and other foods 51 –fruit and vegetables 46 –fl our mill products 3 –wine, spirits and tobacco 3 –dairy products 2 Accommodation, cafes and restaurants 655 10%Leather and leather products 170 3%
Total industry uses 6253
Total inputs Agricultural goods 8313 57%Services 2592 18%Wages 2273 16%Own use 728 5%Major goods 489 3%Major food industry goods 212 1%Total 14607
Industry gross value-addedGross operating surplus 149Net taxes (on production) 157Total 306
Total inputs 14607 96%Industry gross value added 306 2%Imports within category 298 2%
Total supply 15189
Total industry uses 6253 37% Exports 5465 32%Household consumption 4245 25%Change in inventories 968 6%
Total consumption 16931
Usage in other industriesRetail trade 2250 36%Other industries 1770 28%Food industry 1408 23% –own-use (meat processing) 728 –other food 345 –bakery products 230 –oils and other foods 51 –fruit and vegetables 46 –fl our mill products 3 –wine, spirits and tobacco 3 –dairy products 2 Accommodation, cafes and restaurants 655 10%Leather and leather products 170 3%
Total industry uses 6253
Total industry uses 6253 37% Exports 5465 32%Household consumption 4245 25%Change in inventories 968 6%
Total consumption 16931
$m $m $m
inputs outputs

56
australian food industry abare research report 06.23
B3 dairy products, 2001-02
> The dairy subsector had a number of similarities to meat and meat products, including a high level of agricultural inputs, high proportion of inputs as a proportion of the industry’s value, close to average labor intensity and high exports.
> The second largest individual input was wholesale trade (12 per cent), followed by plastic products (4 per cent).
> Competing imports as a proportion of the industry’s value (7 per cent) was higher than meat products, but lower than the sector average.
Agricultural goodsDairy cattle 3448 100%Other agriculture 13 0%Total 3461
Services Wholesale trade 942 57%Transport and storage 308 19%Business services 120 7%Other services 80 5%Utilities (elec, gas, water) 67 4%Banking, fi nance and insurance 45 3%Communication 40 2%Scientifi c and technical research 20 1%Property services 18 1%Total 1640
Other major goods Plastic products 333 45%Paper containers and products 179 24%Other goods 154 21%Sheet metal products 78 10%Total 744
Major food industry goods Other food products 93 65%Bakery products 50 35%Total 143
Usage in other industries Food industry 806 35% –own-use (dairy products) 514 –confectionery and soft drinks 97 –bakery products 76 –other foods 62 –fl our mill products 20 –oils and fats 13 –fruit and vegetables 13 –meat and meat processing 8 –wine, spirits and tobacco 3 Accommodation, cafes and restaurants 655 29%Retail trade 361 16%Other industries 340 15%Business services 63 3%Scientifi c and technical research 52 2%
Total industry uses 2277
Total inputs Agricultural goods 3461 46%Services 1640 22%Other major goods 744 10%Wages 985 13%Own use 514 7%Major food industry goods 143 2%Total 7487
Industry gross value added Gross operating surplus 1131 Net taxes (on production) 83 Total 1214
Total inputs 7487 77%Industry gross value added 1214 13%Imports within category 690 7%
Total supply 9375
Household consumption 4175 43%Exports 3174 33%Total industry uses 2277 24%Change in inventories 38 0%
Total consumption 9665
Usage in other industriesFood industry 806 35% –own-use (dairy products) 514 –confectionery and soft drinks 97 –bakery products 76 –other foods 62 –fl our mill products 20 –oils and fats 13 –fruit and vegetables 13 –meat and meat processing 8 –wine, spirits and tobacco 3Accommodation, cafes and restaurants 655 29%Retail trade 361 16%Other industries 340 15%Business services 63 3%Scientifi c and technicalresearch 52 2%
Total industry uses 2277
Household consumption 4175 43%Exports 3174 33%Total industry uses 2277 24%Change in inventories 38 0%
Total consumption 9665
$m $m $m
inputs outputs

57
australian food industry abare research report 06.23
B4 fruit and vegetable products, 2001-02
> Fruit and vegetable products as inputs accounted for 16 per cent of total inputs, but were not the largest component of costs.
> Packaging costs for paper, plastic, glass and metal accounted for 18 per cent, while whole sale trade accounted for 8 per cent of total costs.
> Direct household consumption was a relatively high proportion of delivered output at 61 per cent.
> Almost 80 per cent of the other industry use occurred in the food and accommodation, cafes and restaurant industries.
Services Wholesale trade 232 25%Business services 216 24%Transport and storage 216 24%Other services 65 7%Utilities (elec, gas, water) 63 7%Scientifi c and technical research 52 6%Mechanical repairs 39 4%Banking, fi nance and insurance 35 4%Total 918
Other major goods Paper containers and products 136 26%Plastic products 130 25%Other products 92 17%Glass products 87 16%Sheet metal products 85 16%Total 530
Agricultural goods Other agriculture 468 98%Grains 11 2%Total 479
Major food industry goodsOther food products 121 47%Flour mill products and cereal foods 92 36%Meat products 46 18%total 259
Usage in other industries Food industry 721 52% –own-use (fruit and vegetables) 454 –fl our mill products 90 –bakery products 68 –wine, spirits and tobacco 41 –confectionery and soft drinks 40 –other food 14 –dairy products 7 –meat and meat processing 4 –beer and malt 2 –oils and other foods 1 Accommodation, cafes and restaurants 385 28%Retail trade 197 14%Other industries 89 6%
Total industry uses 1392
Total inputs Major services 918 32%Wages 631 22%Other major goods 136 5%Agricultural goods 468 16%Own use 454 16%Major food industry goods 259 9%Total 2866
Industry gross value added Gross operating surplus 543 Net taxes (on production) 46 Total 589
Total inputs 2866 64%Imports within category 900 20%Industry gross value added 589 13%
Total supply 4759
Household consumption 2719 61%Exports 1392 31%Total industry uses 488 11%Change in inventories –109 –2%
Total consumption 4489
Usage in other industriesFood industry 721 52% –own-use (fruit and vegetables) 454 –fl our mill products 90 –bakery products 68 –wine, spirits and tobacco 41 –confectionery and soft drinks 40 –other food 14 –dairy products 7 –meat and meat processing 4 –beer and malt 2 –oils and other foods 1Accommodation, cafes and restaurants 385 28%Retail trade 197 14%Other industries 89 6%
Total industry uses 1392
Household consumption 2719 61%Exports 1392 31%Total industry uses 488 11%Change in inventories –109 –2%
Total consumption 4489
$m $m $m
inputs outputs

58
australian food industry abare research report 06.23
B5 fl our mill products and cereal foods, 2001-02
> The top four individual inputs were grains (28 per cent), transport and storage (11 per cent), business services (5 per cent), wholesale trade (5 per cent). The major input sectors were major services and primary agricultural goods.
> Use in other industries was the highest of all the subsectors analysed, largely due to its use in accommodation, cafes and restaurants and the food industry.
Major services Transport and storage 265 27%Business services 180 18%Wholesale trade 167 17%Other major services 101 10%Utilities (elec, gas, water) 69 7%Communication 64 6%Banking, fi nance and insurance 62 6%Mechanical repairs 50 5%Scientifi c and technical research 42 4%Total 1000
Primary goods (agricultural) Grains 971 99%Other agriculture 7 1%Total 978
Major food industry goods Other food products 113 36%Confectionery and soft drinks 93 29%Fruit and vegetables 90 28%Dairy products 20 6%Total 316
Other major goods Other major goods 141 46%Paper containers and products 111 36%Plastic products 54 18%Total 306
Usage in other industries Food industry 906 52% –own use (fl our mill products) 393 –bakery products 290 –fruit and vegetables 92 –other food 88 –meat products 19 –confectionery and soft drinks 16 –oils and fats 3 –dairy products 2 –wine, spirits and tobacco 2 –beer and malt 1 Accommodation, cafes and restaurants 527 30%Retail trade 193 11%Other industries 108 6%
Total industry uses 1734
Inputs Major services 1000 29%Primary goods (agricultural) 978 29%Wages 430 13%Own use 393 11%Major food industry goods 316 9%Other major goods 306 9%Total 3423
Industry gross value added Gross operating surplus 164 Net taxes (on production) 53 Total 217
Inputs 3423 85%Industry gross value added 217 5%Imports within category 262 8%
Total supply 3900
Total industry uses 1734 43% Exports 1536 38%Household consumption 769 8%Change in inventories –56 –1%
Total consumption 4010
Usage in other industries Food industry 906 52%–own use (fl our mill products) 393 –bakery products 290 –fruit and vegetables 92 –other food 88 –meat products 19 –confectionery and soft drinks 16 –oils and fats 3 –dairy products 2 –wine, spirits and tobacco 2 –beer and malt 1 Accommodation, cafes and restaurants 527 30%Retail trade 193 11%Other industries 108 6%
Total industry uses 1734
Total industry uses 1734 43%Exports 1536 38%Household consumption 769 8%Change in inventories –56 –1%
Total consumption 4010
$m $m $m
inputs outputs

59
australian food industry abare research report 06.23
B6 bakery products 2001-02
> The three largest individual inputs for bakery products were all products from food industries, which was the largest input category (30 per cent). Transport and storage were smaller than was the average for the food manufacturing sector. Wages were much larger than the industry average (36 per cent).
> Household use of bakery products was high (54 per cent), and exports were the lowest of all the subsectors (4 per cent).
Major food industry goodsFlour mill products 290 32%Meat products 230 25%Other foods 145 16%Dairy products 76 8%Confectionery and soft drinks 67 7%Fruit and vegetables 68 7%Oils and fats 31 3%Total 907
Major services Other services 137 22%Wholesale trade 112 18%Transport and storage 104 17%Business services 73 12%Retail trade 70 11%Mechanical and other repairs 52 8%Utilities (elec, gas, water) 39 6%Scientifi c and technical research 38 6% Total 625
Other major goods Other products 95 47%Plastic products 59 29%Paper containers and products 50 25%Total 204
Primary goods (agricultural) Other agriculture 34 71%Poultry 9 19%Grains 5 10%Total 48
Usage in other industries Food industry 620 31% –other food products 292 –own-use (bakery products) 151 –confectionery 88 –dairy products 50 –meat and meat products 36 –wine, spirits and tobacco 2 –fl our mill products 1 Accommodation, cafes and restaurants 571 28%Retail trade 493 24%Other industries 343 17%
Total industry uses 2027
Total inputs Wages 1097 36%Major food industry goods 907 30%Major services 625 21%Other major goods 204 7%Own use 151 5%Primary goods (agricultural) 48 2%Total 3032
Industry gross value added Gross operating surplus 429 Net taxes (on production) 65 Total 494
Total inputs 3032 79%Industry gross value added 494 13%Imports within category 302 8% Total supply 3826
Total industry uses 3007 54% Exports 2027 37%Household consumption 274 5%Change in inventories 224 4%
Total consumption 5531
Usage in other industriesFood industry 620 31% –other food products 292 –own-use (bakery products) 151 –confectionery 88 –dairy products 50 –meat and meat products 36 –wine, spirits and tobacco 2 –fl our mill products 1 Accommodation, cafes and restaurants 571 28%Retail trade 493 24%Other industries 343 17%
Total industry uses 2027
Total industry uses 3007 54% Exports 2027 37%Household consumption 274 5%Change in inventories 224 4%
Total consumption 5531
$m $m $m
inputs outputs

60
australian food industry abare research report 06.23
B7 confectionery and soft drinks, 2001-02
> None of the largest four individual inputs to confectionery and soft drinks were agricul-tural products or major food industry goods. Plastic products (8 per cent), sheet metal (7 per cent), business services (6 per cent) and accommodation, café, and restaurants (6 per cent) were the largest individual inputs.
> Competing imports were higher than the food manufacturing sector average at 18 per cent.
> Household consumption was higher than the average at 73 per cent, and both exports and use in other industries were low.
> Within the other industries category of output, the food, retail trade and accommodation, cafes and restaurant industries accounted for more than 93 per cent of other industry use.
Major services Business services 227 18%Accommodation, cafes and restaurants 225 18%Transport and storage 216 17%Wholesale trade 164 13%Mechanical repairs 105 8%Other services 107 8%Scientifi c and technical research 59 5%Utilities (elec, gas, water) 58 5%Communication services 35 3%Banking, fi nance and insurance 32 3%Retail trade 32 3%Total 1260
Other major goods Plastic products 323 33%Sheet metal products 260 27%Other products 161 17%Paper containers and products 122 13%Glass products 107 11%Total 973
Major food industry goods Dairy products 97 30%Bakery products 88 27%Other food products 85 26%Fruit and vegetables 40 12%Flour mill products 16 5%Total 326
Primary goods (agricultural)Other agriculture 116 91%Grains 11 9%Total 127
Usage in other industries Food industry 482 40% –own-use (confectionery and soft drinks) 179 –fl our mill products 93 –other food products 80 –bakery products 67 –fruit and vegetables 16 –dairy products 15 –meat and meat products 15 –oils and fats 12 –wine, spirits and tobacco 5 Retail trade 392 32%Accommodation, cafes and restaurants 265 22%Other industries 77 6%
Total industry uses 1216
Total inputs Major services 1260 33%Other major goods 973 25%Wages 966 25%Major food industry goods 326 9%Own use 179 5%Primary goods (agricultural) 127 3%Total 3831
Industry gross value added Gross operating surplus 828 Net taxes (on production) 72 Total 900
Total inputs 3831 67%Industry gross value added 900 16%Imports within category 1027 18%
Total suppy 5760
Total industry uses 4687 73% Exports 1216 19%Household consumption 446 7%Change in inventories 53 1%
Total consumption 16931
Usage in other industries Food industry 482 40% –own-use (confectionery and soft drinks) 179 –fl our mill products 93 –other food products 80 –bakery products 67 –fruit and vegetables 16 –dairy products 15 –meat and meat products 15 –oils and fats 12 –wine, spirits and tobacco 5Retail trade 392 32%Accommodation, cafes and restaurants 265 22%Other industries 77 6%
Total industry uses 1216
Total industry uses 4687 73%Exports 1216 19%Household consumption 446 7%Change in inventories 53 1%
Total consumption 16931
$m $m $m
inputs outputs

61
australian food industry abare research report 06.23
B8 beer and malt, 2001-02
> Major services were the largest input sector, although grains were the largest individual input (21 per cent).
> Imports within the category were low (4 per cent).
> Household consumption was high (63 per cent), and exports were low (8 per cent).
> Accommodation, cafes and restaurants were the major source of industry use (71 per cent).
Major services Transport and storage 289 24%Wholesale trade 259 21%Banking, fi nance and insurance 206 17%Accommodation, cafes and restaurants 190 15%Business services 112 9%Utilities (elec, gas, water) 94 8%Other services 52 4%Mechanical repairs 24 2%Scientifi c and technical research 2 0%Total 1228
Primary goods (agricultural) Grains 621 98%Other agriculture 10 2%Total 631
Other major goods Sheet metal products 152 34%Paper containers and products 118 26%Other products 112 25%Glass products 49 11%Plastic products 19 4%Total 450
Major food industry goods Other food products 10 100%Total 10
Usage in other industries Accommodation, cafes and restaurants 646 71%Food industry 267 29% –own use (beer and malt) 239 –other foods 18 –wine, spirits and tobacco 6 –soft drinks, syrups and cordials 2 –dairy products 1 –fl our mill and cereal 1 Other industries 2 0%
Total industry uses 915
Total inputs Major services 1228 42%Primary goods (agricultural) 631 22%Other major goods 450 15%Wages 357 12%Own use 239 8%Major food industry goods 10 0%Total 2915
Industry gross value added Gross operating surplus 306 Net taxes (on production) 30 Total 336
Total inputs 2915 86%Industry gross value addded 336 10%Imports within category 152 4%
Total supply 3405
Total industry uses 2162 63% Exports 915 27%Household consumption 280 8%Change in inventories 54 2%
Total consumption 3411
Usage in other industriesAccommodation, cafes and restaurants 646 71%Food industry 267 29% –own use (beer and malt) 239 –other foods 18 –wine, spirits and tobacco 6 –soft drinks, syrups and cordials 2 –dairy products 1 –fl our mill and cereal 1Other industries 2 0%
Total industry uses 915
Total industry uses 2162 63%Exports 915 27%Household consumption 280 8%Change in inventories 54 2%
Total consumption 3411
$m $m $m
inputs outputs
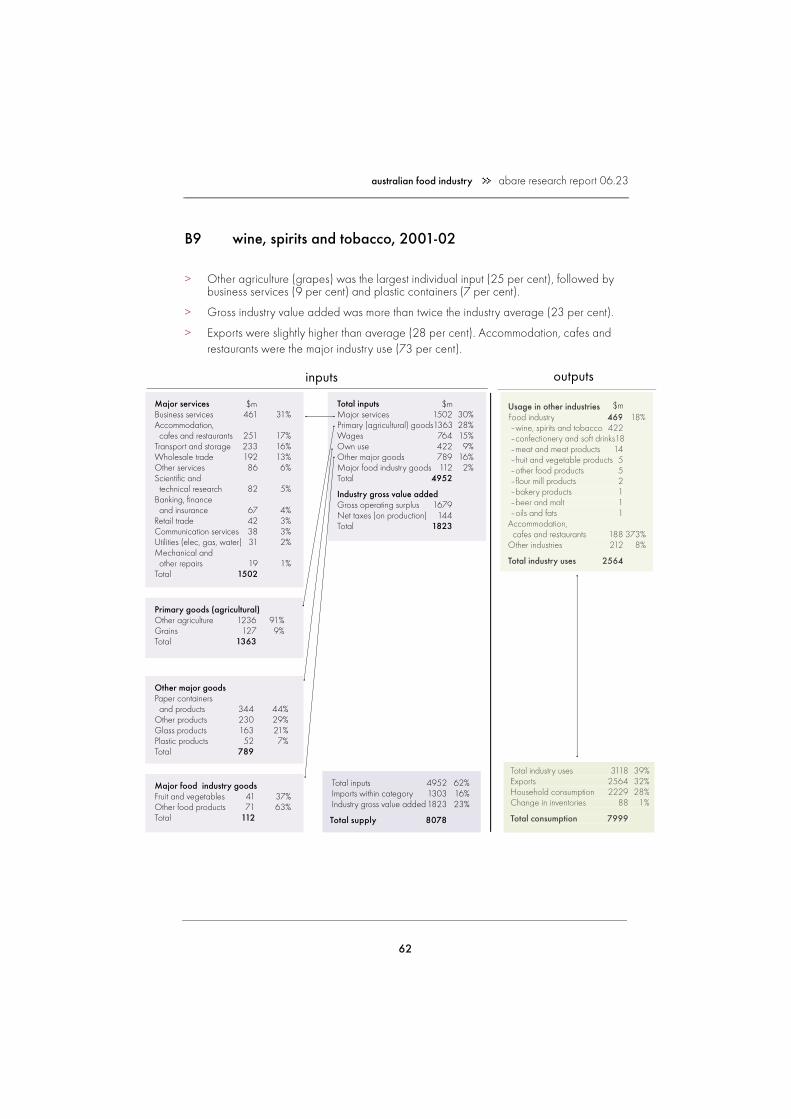
62
australian food industry abare research report 06.23
B9 wine, spirits and tobacco, 2001-02
> Other agriculture (grapes) was the largest individual input (25 per cent), followed by business services (9 per cent) and plastic containers (7 per cent).
> Gross industry value added was more than twice the industry average (23 per cent).
> Exports were slightly higher than average (28 per cent). Accommodation, cafes and restaurants were the major industry use (73 per cent).
Major services Business services 461 31%Accommodation, cafes and restaurants 251 17%Transport and storage 233 16%Wholesale trade 192 13%Other services 86 6%Scientifi c and technical research 82 5%Banking, fi nance and insurance 67 4%Retail trade 42 3%Communication services 38 3%Utilities (elec, gas, water) 31 2%Mechanical and other repairs 19 1%Total 1502
Primary goods (agricultural) Other agriculture 1236 91%Grains 127 9%Total 1363
Other major goods Paper containers and products 344 44%Other products 230 29%Glass products 163 21%Plastic products 52 7%Total 789
Major food industry goodsFruit and vegetables 41 37%Other food products 71 63%Total 112
Usage in other industries Food industry 469 18% –wine, spirits and tobacco 422 –confectionery and soft drinks 18 –meat and meat products 14 –fruit and vegetable products 5 –other food products 5 –fl our mill products 2 –bakery products 1 –beer and malt 1 –oils and fats 1 Accommodation, cafes and restaurants 188 373%Other industries 212 8%
Total industry uses 2564
Total inputs Major services 1502 30%Primary (agricultural) goods 1363 28%Wages 764 15%Own use 422 9%Other major goods 789 16%Major food industry goods 112 2%Total 4952
Industry gross value added Gross operating surplus 1679 Net taxes (on production) 144 Total 1823
Total inputs 4952 62%Imports within category 1303 16%Industry gross value added 1823 23%
Total supply 8078
Total industry uses 3118 39% Exports 2564 32%Household consumption 2229 28%Change in inventories 88 1%
Total consumption 7999
Usage in other industries Food industry 469 18%–wine, spirits and tobacco 422–confectionery and soft drinks 18–meat and meat products 14–fruit and vegetable products 5–other food products 5–fl our mill products 2–bakery products 1–beer and malt 1–oils and fats 1Accommodation, cafes and restaurants 188 373%Other industries 212 8%
Total industry uses 2564
Total industry uses 3118 39% Exports 2564 32%Household consumption 2229 28%Change in inventories 88 1%
Total consumption 7999
$m $m $m
inputs outputs

63
australian food industry abare research report 06.23
B10 oils and fats, 2001-02
> Oil and other foods input proportions were similar to the food manufacturing industry average, apart from competing imports, which were high (23 per cent).
> Of the outputs, industry use was high (49 per cent), and exports were low (9 per cent).
Major services Transport and storage 118 35%Other services 63 18%Wholesale trade 62 18%Business services 40 12%Banking, fi nance and insurance 29 8%Utilities (elec, gas, water) 26 8%Scientifi c and technical research 4 1%Total 342
Primary goods (agricultural)Grains 148 93%Other agriculture 12 8%Total 160
Other major goods Other major products 119 47%Plastic products 80 32%Paper containers and products 54 21%Total 253
Major food industry goodsMeat products 51 50%Other products 50 98%Total 101
Usage in other industries Food industry 549 74% –own use (oil and fats) 330 –other foods 164 –bakery products 31 –fl our mill products and cereal 16 –fruit and vegetables 7 –confectionery and soft drinks 1 –retail trade 80 11% –other industries 78 10%Accomodation, cafes and restaurants 39 5%
Total industry uses 746
Total inputs Major services 342 29%Own use 330 28%Other major goods 253 22%Primary (agricultural) goods 12 1%Wages 122 11%Major food industry goods 101 9%Total 1160
Industry gross value added Gross operating surplus 203 Net taxes (on production) 31 Total 234
Total inputs 1160 58%Industry gross value addded 234 12%Imports within category 473 23%
Total supply 2016
Total industry uses 723 47% Exports 746 49%Household consumption 145 9%Change in inventories –83 –5%
Total consumption 1531
Usage in other industriesFood industry 549 74% –own use (oil and fats) 330 –other foods 164 –bakery products 31 –fl our mill products and cereal 16 –fruit and vegetables 7 –confectionery and soft drinks 1 –retail trade 80 11% –other industries 78 10%Accomodation, cafes and restaurants 39 5%
Total industry uses 746
Total industry uses 723 47% Exports 746 49%Household consumption 145 9%Change in inventories –83 –5%
Total consumption 1531
$m $m $m
inputs outputs

64
appendix
products in which Australia had a revealed comparative advantage in 2004
The following 159 product codes are products in which Australia was identifi ed to possess a comparative advantage in 2004 — as identifi ed in 2004, grouped by the level of processing.
commodity classifi cation list
HS code a description RCA Area1
bulkH0-030232 tuna(yellow fi n) fresh or chilled, whole 764 Area 1H0-030239 tuna nes, fresh or chilled, whole 848 Area 1H0-030791 aquatic invertebrates nes, fresh or chilled, live 918 Area 1H0-080211 almonds in shell fresh or dried 277 Area 1H0-080290 nuts edible, fresh or dried, nes 1593 Area 1H0-080510 oranges, fresh or dried 290 Area 1H0-080520 mandarin, clementine & citrus hybrids, fresh or dried 145 Area 1H0-080610 Grapes, fresh 191 Area 1H0-080920 Cherries, fresh 150 Area 1H0-080930 Peaches, nectarines, fresh 104 Area 1H0-080940 Plums, sloes, fresh 227 Area 1H0-081040 Cranberries, bilberries, similar fruits, fresh 233 Area 1H0-100110 Durum wheat 465 Area 1H0-100300 Barley 2861 Area 1H0-120220 Ground-nuts shelled, not roasted or cooked 211 Area 1H0-100190 Wheat except durum wheat, and meslin 1681 Area 2H0-100400 Oats 835 Area 2H0-100810 Buckwheat 210 Area 2H0-030624 Crabs, not frozen 267 Area 3H0-070310 Onions and shallots, fresh or chilled 120 Area 3H0-070410 Caulifl owers and headed broccoli, fresh or chilled 186 Area 3H0-070920 Asparagus, fresh or chilled 346 Area 3H0-070940 Celery, other than celeriac, fresh or chilled 112 Area 3H0-080450 Guavas, mangoes and mangosteens, fresh or dried 136 Area 3H0-080590 Citrus fruits, fresh or dried, nes 168 Area 3H0-100700 Grain sorghum 196 Area 3
C

65
australian food industry abare research report 06.23
commodity classifi cation list
H0-100820 Millet 297 Area 3H0-070610 Carrots and turnips, fresh or chilled 482 Area 4
minimally transformed H0-020220 Bovine cuts bone in, frozen 2595 Area 1 H0-020230 Bovine cuts boneless, frozen 2539 Area 1 H0-020311 Swine carcasses and half carcasses, fresh or chilled 292 Area 1 H0-020321 Swine carcasses and half carcasses, frozen 126 Area 1 H0-020322 Hams, shoulders and cuts, of swine, bone in, frozen 115 Area 1 H0-020422 Sheep cuts, bone in, fresh or chilled 3353 Area 1 H0-020430 Lamb carcasses and half carcasses, frozen 1637 Area 1 H0-020442 Sheep cuts, bone in, frozen 2223 Area 1 H0-020450 Goat meat, fresh, chilled or frozen 4466 Area 1 H0-020610 Bovine edible offal, fresh or chilled 1286 Area 1 H0-020621 Bovine tongues, frozen 4059 Area 1 H0-020622 Bovine livers, frozen 1737 Area 1 H0-020629 Bovine edible offal, frozen except livers and tongues 2851 Area 1 H0-020890 Meat and edible offal nes fresh, chilled or frozen 679 Area 1 H0-030349 Tunas nes, frozen, whole 1661 Area 1 H0-030799 Aquatic invertebrates nes, frozen or preserved 724 Area 1 H0-040110 Milk not concentrated nor sweetened < 1% fat 136 Area 1 H0-040130 Milk and cream not concentrated nor sweetened < 6% fat 273 Area 1 H0-090122 Coffee, roasted, decaffeinated 134 Area 1 H0-090140 Coffee substitutes containing coffee 181 Area 1 H0-091091 Mixtures of spices 120 Area 1 H0-110100 Wheat or meslin fl our 349 Area 1 H0-110210 Rye fl our 145 Area 1 H0-110220 Maize (corn) fl our 124 Area 1 H0-110290 Cereal fl our except wheat, meslin, rye, maize, rice 557 Area 1 H0-110319 Cereal groats or meal except wheat, maize, rice, oats 504 Area 1 H0-110412 Oats, rolled or fl aked grains 852 Area 1 H0-110419 Cereals, rolled or fl aked grains nes 101 Area 1 H0-110429 Cereals, hulled, pearled, sliced or kibbled nes 125 Area 1 H0-110610 Flour or meal of dried legumes 139 Area 1 H0-110710 Malt, not roasted 794 Area 1 H0-110720 Malt, roasted 689 Area 1 H0-150300 Lard stearin, oleostearin & oils, natural tallow oil 1800 Area 1 H0-151410 Canola, rape, colza or mustard oil, crude 387 Area 1 H0-020410 Lamb carcasses and half carcasses, fresh or chilled 208 Area 2 H0-020421 Sheep carcasses and half carcasses, fresh or chilled 2091 Area 2 H0-020441 Sheep carcasses and half carcasses, frozen 4167 Area 2 H0-020641 Swine livers, frozen 163 Area 2H0-020690 Sheep, goat, ass, mule, hinnie edible offal, frozen 3957 Area 2

66
australian food industry abare research report 06.23
commodity classifi cation list
H0-110311 Wheat meal 467 Area 2 H0-150200 Bovine, sheep and goat fats, raw or rendered 1554 Area 2 H0-020210 Bovine carcasses and half carcasses, frozen 107 Area 3 H0-020443 Sheep cuts, boneless, frozen 2501 Area 3 H0-020500 Horse, ass, mule, hinnie meat, fresh, chilled or froze 173 Area 3 H0-020680 Sheep, goat, ass, mule, hinnie offal, fresh or chilled 619 Area 3 H0-030376 Eels, frozen, whole 134 Area 3 H0-030611 Rock lobster and other sea crawfi sh, frozen 3630 Area 3 H0-030613 Shrimps and prawns, frozen 165 Area 3 H0-030621 Rock lobster and other sea crawfi sh not frozen 4938 Area 3 H0-030729 Scallops other than live, fresh or chilled 445 Area 3 H0-040120 Milk not concentrated nor sweetened 1-6% fat 137 Area 3 H0-080620 Grapes, dried 168 Area 3 H0-090920 Coriander seeds 371 Area 3 H0-100620 Rice, husked (brown) 310 Area 3 H0-110230 Rice fl our 394 Area 3 H0-120890 Flour or meal of oil seed, fruit, except mustard, soy 227 Area 3 H0-121020 Hop cones, ground, powdered or pelleted and lupulin 165 Area 3 H0-130213 Hop extract 143 Area 3 H0-150410 Fish-liver oils, fractions, not chemically modifi ed 158 Area 3 H0-170310 Cane molasses 603 Area 3 H0-020130 Bovine cuts boneless, fresh or chilled 1942 Area 4 H0-020423 Sheep cuts, boneless, fresh or chilled 3183 Area 4 H0-040900 Honey, natural 270 Area 4 H0-110422 Oats, hulled, pearled, sliced or kibbled 243 Area 4 H0-120810 Soya bean fl our or meal 109 Area 4
substantially transformed H0-030559 Dried fi sh, other than cod, not smoked 223 Area 1 H0-040221 Milk and cream powder unsweetened < 1.5% fat 621 Area 1 H0-040229 Milk and cream powder sweetened < 1.5% fat 2576 Area 1 H0-040291 Milk and cream unsweetened, concentrated 157 Area 1 H0-040299 Milk and cream nes sweetened or concentrated 359 Area 1 H0-040410 Whey 558 Area 1 H0-040610 Fresh cheese, unfermented whey cheese, curd 469 Area 1 H0-040620 Cheese, grated or powdered, of all kinds 120 Area 1 H0-040630 Cheese processed, not grated or powdered 969 Area 1 H0-040690 Cheese except fresh, grated, processed or blue-veined 318 Area 1 H0-071332 Beans, small red (Adzuki) dried, shelled 450 Area 1 H0-071339 Beans dried, shelled, nes 523 Area 1 H0-071340 Lentils dried, shelled 1197 Area 1 H0-071350 Broad beans and horse beans dried, shelled 2427 Area 1H0-150600 Animal fats, oils, fractions not chemically modifi ed nes 353 Area 1

67
australian food industry abare research report 06.23
commodity classifi cation list
H0-150600 Animal fats, oils, fractions not chemically modifi ed nes 353 Area 1 H0-160242 Swine shoulders & cuts thereof, prepared or preserved 220 Area 1 H0-160250 Bovine meat, offal nes, not livers, prepared/preserve 396 Area 1 H0-170210 Lactose and lactose syrup 137 Area 1 H0-170290 Sugar nes, invert sugar, caramel and artifi cial honey 220 Area 1 H0-200710 Homogenised jams, jellies, etc 187 Area 1 H0-200950 Tomato juice not fermented or spirited 181 Area 1 H0-210420 Homogenised composite food preparations 165 Area 1 H0-210610 Protein concentrates and textured protein substances 166 Area 1 H0-210690 Food preparations nes 105 Area 1 H0-040500 Butter and other fats and oils derived from milk 333 Area 2 H0-071010 Potatoes, frozen, uncooked steamed or boiled 203 Area 2 H0-071331 Urd, mung, black or green gram beans dried shelled 771 Area 2 H0-151610 Animal fats, oils, fractions, hydrogenated, esterifi ed 133 Area 2 H0-151710 Margarine, except liquid margarine 410 Area 2 H0-200791 Citrus based jams jellies marmalade, etc. 371 Area 2 H0-200870 Peaches, otherwise prepared or preserved 142 Area 2 H0-200960 Grape juice or must not fermented or spirited 196 Area 2 H0-021020 Bovine meat salted, dried or smoked 350 Area 3 H0-040210 Milk powder < 1.5% fat 817 Area 3 H0-040390 Buttermilk, curdled milk, cream, kephir, etc. 239 Area 3 H0-040490 Natural milk products nes 102 Area 3 H0-050400 Guts, bladders and stomachs of animals except fi sh 267 Area 3 H0-071310 Peas dried, shelled 528 Area 3 H0-071320 Chickpeas, dried, shelled 1625 Area 3 H0-071390 Leguminous vegetables dried, shelled 161 Area 3 H0-110811 Wheat, starch 612 Area 3 H0-110900 Wheat gluten 1367 Area 3 H0-160290 Meat, meat offal and blood, prepared or preserved, nes 453 Area 3 H0-160590 Molluscs and shellfi sh nes, prepared or preserved 437 Area 3 H0-190410 Cereal foods obtained by swelling, roasting of cereal 142 Area 3 H0-200490 Vegetables nes and mixtures, prepared, frozen 108 Area 3 H0-200600 Fruits, nuts, fruit-peel, etc preserved by sugar 218 Area 3 H0-200840 Pears, otherwise prepared or preserved 908 Area 3 H0-200892 Fruit mixtures, otherwise prepared or preserved 282 Area 3 H0-200990 Mixtures of juices not fermented or spirited 400 Area 3 H0-210410 Soups and broths and preparations thereof 144 Area 3 H0-210500 Ice cream and other edible ice 166 Area 3 H0-021090 Meat and edible meat offal cured, fl ours, meals nes 106 Area 4 H0-200980 Single fruit, veg juice nes, not fermented or spirited 151 Area 4 H0-210220 Yeasts, inactive, dead unicellular organisms nes 117 Area 4 H0-210230 Baking powders, prepared 282 Area 4H0-210390 Sauces nes, mixed condiments, mixed seasoning 153 Area 4

68
australian food industry abare research report 06.23
commodity classifi cation list
elaborately transformed H0-170410 Chewing gum containing sugar, except medicinal 185 Area 1 H0-180690 Chocolate/cocoa food preparations nes 141 Area 1 H0-190510 Crispbread 278 Area 1 H0-220410 Grape wines, sparkling 138 Area 1 H0-220421 Grape wines nes, fortifi ed wine or must, pack < 2L 1210 Area 1 H0-220429 Grape wines, alcoholic grape must nes 684 Area 1 H0-220600 Fermented beverages nes (eg cider, perry, mead, etc) 178 Area 1 H0-220720 Ethyl alcohol and other spirits, denatured 129 Area 1 H0-180631 Chocolate, cocoa preps, block, slab, bar, fi lled, >2kg 409 Area 2a Areas as defi ned in fi gure X. Source: UNSD (2006).

69
australian food industry abare research report 06.23
references
ABS (Australian Bureau of Statistics) 1993, Australian and New Zealand Standard Industrial Classifi cation 1993, cat. no. 1292.0, Canberra
—— 1998, Manufacturing Industry, Australia, 1996-97, cat. no. 8221.0, Canberra.
—— 1999a, Research and Experimental Development, Businesses, Australia, 1997-98, cat. no.8104.0, Canberra
—— 1999b, Manufacturing Industry, Australia, 1997-98, cat. no. 8221.0, Canberra.
—— 2001, Input–Output Tables 1996-97, cat. no. 5209.0, Canberra
—— 2005, Research and Experimental Development, Businesses, Australia, 2003-04, cat. no.8104.0, Canberra
—— 2006a, ‘Table 9: Industry gross value added’, Australian System of National Accounts, cat. no. 520409, Canberra.
—— 2006b, Manufacturing Industry, Australia, 2003-04, cat. no.8221.0, Canberra.
—— 2006c, Household Expenditure Survey, Australia, 2003-04, cat. no. 6530.0, Canberra.
—— 2006d, Year Book Australia 2006, cat. no.1301.0, Canberra.
—— 2006e, Labor Force Australia Detailed, Quarterly, May 2006, cat. no. 6291.0.55.003, Canberra.
—— 2006f, Australian National Accounts: Input–Output Tables – Electronic Publica-tion, 2001-02, Preliminary, cat. no. 5209.0.55.001, Canberra.
AC Nielsen 2004, AC Nielsen Grocery Report 2004, Sydney (www.acnielsen.com.au).
Agricultural Market Access Database (AMAD), 2003. (http://www.amad.org).
Anderson, J.E. and van Wincoop, E. 2004, ‘Trade costs’, Journal of Economic Literature, vol. 42, pp. 691–751.
Apted, S., Berry, P., Short, C., Topp, V., Mazur, K., and Mellor, T.2006, Interna-tional Competitiveness of the Australian Vegetable Production Sector, ABARE eReport 06.4, Canberra, April.
Atkins, P. and Bowler, I. 2001, Food in Society, Oxford University Press, New York.
Battersby, B. and Ewing, R. 2005, International Trade Performance: The Gravity
70
australian food industry abare research report 06.23
of Australia’s Remoteness, Treasury Working Paper 2005-03, Canberra (www.treasury.gov.au)
Bolling, C. and Gehlhar, M. 2005, ‘Global food manufacturing reorients to meet new demands’, in Regmi, A. and Gehlhar, M. (eds) 2005, New Directions in Global Food Markets, Agriculture Information Bulletin no. 794, Economic Research Service, Washington DC (www.ers.usda.gov).
DAFF (Australian Government Department of Agriculture, Fisheries and Forestry) 2005, Australian Food Statistics 2005, Canberra.
Disdier, A. and Head, K. 2005, The Puzzling Persistence of the Distance Effect on Bilateral Trade, Centro Studi Luca d’Agliano Working Paper no. 18, November.
Gehlhar, M. and Coyle, W. 2001, ‘Global food consumption and impacts on trade patterns’, in Regmi, A. (ed.), Changing Structure of Global Food Consump-tion and Trade, Agriculture and Trade Report WRS-01-1, Economic Research Service, Washington DC (www.ers.usda.gov).
Head, K. 2003, Gravity for Beginners, University of Columbia, Vancouver, work in progress (strategy.sauder.ubc.ca/head).
Huang, S.W. 2004, Global Trade Patterns in Fruits and Vegetables, Agriculture and Trade report no. WRS-04-06, Economic Research Service, US Department of Agriculture, Washington DC.
IBISWorld Pty Ltd 2003, Australia’s Food and Beverage Manufacturing Participa-tion in the Global Food Chain, Melbourne.
Productivity Commission 2003, Trends in Australian Manufacturing, Commission Research Paper, AusInfo, Canberra.
Regmi, A and Gehlhar, M. 2001 ‘Consumer preferences and concerns shape global food trade’, Food Review, vol. 24, issue 2, pp. 2–8.
—— and —— 2005a, ‘Processed food trade pressured by evolving global supply chains’, in Amber Waves, United States Department of Agriculture, Washington DC.
—— and —— (eds) 2005b, New Directions in Global Food Markets, Agriculture Information Bulletin no. 794, Economic Research Service, Washington DC (www.ers.usda.gov).
——, ——,Wainio, J., Vollrath, T., Johnston, P. and Kathuria, N. 2005, Market Access for High-Value Foods, Agricultural Economic Report no. 840, US Department of Agriculture, Washington DC.
United Nations Statistics Division 2006, UN Commodity Trade Statistics Database (UN Comtrade), New York (unstats.un.org/unsd/comtrade/).
World Bank 2000, World Development Report 2000, Oxford University Press, Oxford (www.worldbank.org).

71
Agricultural Production Systems Research Unit
Asia Pacifi c Economic Cooperation Secretariat
AusAid
Australian Centre for International Agricultural Research
Australian Greenhouse Offi ce
Australian Government Department of the Environment and Heritage
Australian Government Department of Industry, Tourism and Resources
Australian Government Department of Prime Minister and Cabinet
Australian Government Department of Transport and Regional Services
Australian Wool Innovation Limited
CRC – Plant Biosecurity
CSIRO (Commonwealth Scientifi c and Industrial Research Organisation)
Dairy Australia
Department of Business, Economic and RegionalDevelopment, Northern Territory
Department of Premier and Cabinet, Western Australia
Department of Primary Industries, New South Wales
Department of Primary Industries, Victoria
East Gippsland Horticultural Group
Fisheries Research and Development Corporation
Fisheries Resources Research Fund
Forest and Wood Products Research and Development Corporation
Grains Research and Development Corporation
Grape and Wine Research and Development Corporation
GHD Services
Independent Pricing and Regulatory Tribunal
International Food Policy Research Institute
Land and Water Australia
Meat and Livestock Australia
Minerals Council of Australia
Ministry for the Environment, New Zealand
National Australia Bank
Newcastle Port Corporation
NSW Sugar
Rio Tinto
Rural Industries Research and Development Corporation
Snowy Mountains Engineering Corporation
University of Queensland
US Environmental Protection Agency
Wheat Export Authority
Woolmark Company
RESEARCH FUNDING ABARE relies on fi nancial support from external organ isations to complete its research program. As at the date of this publication, the following organisa-tions had provided fi nancial support for ABARE’s research program in 2005-06 and 2006-07. We gratefully acknowledge this assistance. 10.06