australian wine: production, sales and inventory 2019–20
TRANSCRIPT
Australian Wine: Production, Sales and Inventory 2019–20March 2021
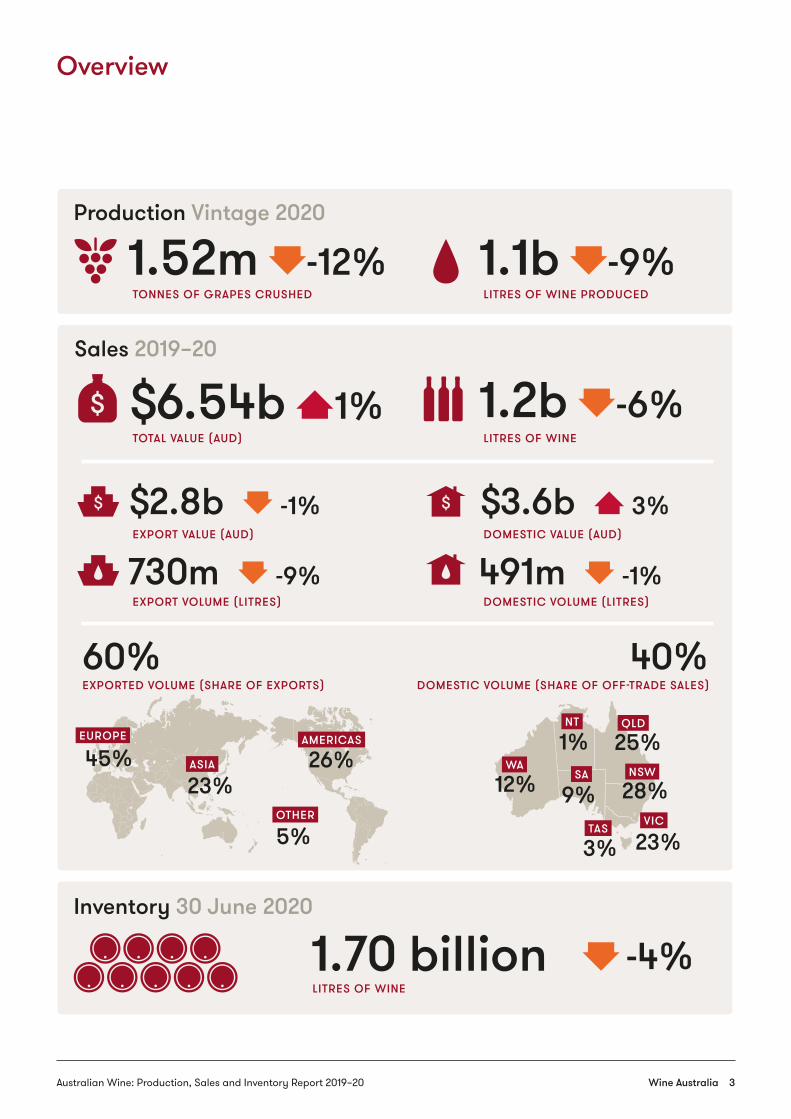
SummaryThe Australian winegrape crush in 2020 was 1.52 million tonnes, the lowest since 2007 and 13 per cent below the 10-year average of 1.75 million tonnes.
Total Australian wine production in 2019–20 was just under 1.1 billion litres, or 121 million 9-litre case equivalents.
The extraction rate to wine was above the 10-year average at 717 litres per tonne, but production was still 10 per cent below the 10-year average and the lowest since 2007.
Reds made up 55 per cent of production compared with 57 per cent in 2018–19.
The total sales volume of Australian wine in 2019–20 was just over 1.2 billion litres (136 million 9-litre cases), a reduction of 6 per cent compared with 2018–19 and 60 million litres more than production.
Sales exceeded production in 2019–20 for the third year in a row, contributing to a lower stocks-to-sales ratio and rising winegrape and wine prices.
Inventory of Australian wine as at 30 June 2020 is estimated to be 1.7 billion litres, a decline of 4 per cent compared with the previous year.
Since February 2020, the Australian wine sector has experienced two major and totally unexpected events: the COVID-19 pandemic and the introduction of tariffs on Australian wine imports by the Chinese government. While the pandemic did not have a significant overall effect on wine sales during the 2019–20 reporting period, longer term economic downturns in major wine-consuming nations could dampen global demand substantially in the next few years.
The imposition by the Chinese government of temporary deposit tariffs of between 101 per cent and 212 per cent on Australian bottled wine in November 2020 have had the effect of more-or-less completely halting wine exports to that market. Australia’s ability to find new markets for the extra wine, in the context of a potential increase in global supply and softening in demand, will underpin its success in the next 12–24 months.
A challenge for the sector going forward will be balancing supply with the demand opportunities. For the past two years, the white share of total sales has exceeded its share of production, causing its stock-to-sales ratio to fall to its lowest level in 10 years, and putting upward pressure on white winegrape and wine prices.
Wine Australia 2Australian Wine: Production, Sales and Inventory Report 2019–20
Wine Australia
Australian Wine:Production, sales and inventory 2019–20
1.52m -12% 1.1b -9%
-4%1.70 billion
Production Vintage 2020
Sales 2019–20
Inventory 30 June 2020
730m -9% 491m -1%
$2.8b -1% $3.6b 3%
© Wine Australia 2021 • For more information please visit: www.wineaustralia.com
$6.54b 1%
60% 40%
1.2b -6%
TONNES OF GRAPES CRUSHED
LITRES OF WINE
TOTAL VALUE (AUD)
LITRES OF WINE PRODUCED
EXPORT VOLUME (LITRES) DOMESTIC VOLUME (LITRES)
EXPORT VALUE (AUD) DOMESTIC VALUE (AUD)
LITRES OF WINE
EXPORTED VOLUME (SHARE OF EXPORTS) DOMESTIC VOLUME (SHARE OF OFF-TRADE SALES)
12% 9%
1% 25%
28%
23%3%
WA
NT
SA
TASVIC
NSW
QLD
5%
45%EUROPE
ASIA
AMERICAS
OTHER
23%26%
Overview
Wine Australia 3Australian Wine: Production, Sales and Inventory Report 2019–20
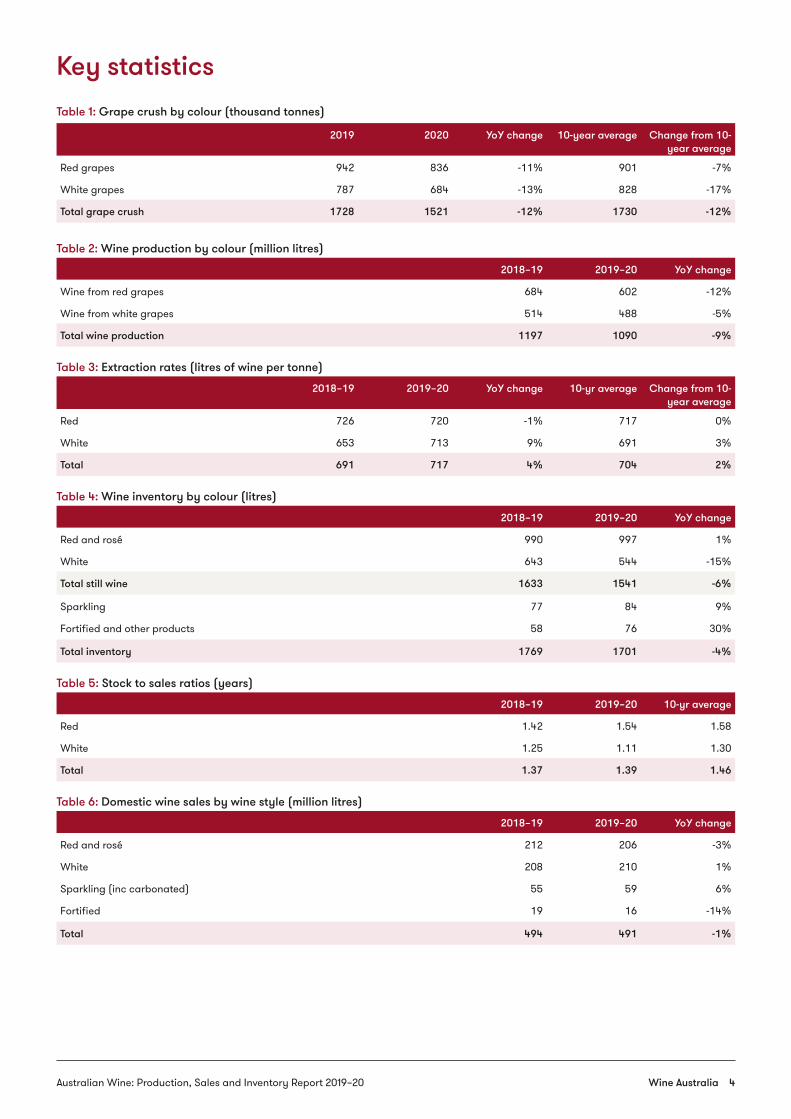
Key statisticsTable 1: Grape crush by colour (thousand tonnes)
2019 2020 YoY change 10-year average Change from 10-year average
Red grapes 942 836 -11% 901 -7%
White grapes 787 684 -13% 828 -17%
Total grape crush 1728 1521 -12% 1730 -12%
Table 2: Wine production by colour (million litres)
2018–19 2019–20 YoY change
Wine from red grapes 684 602 -12%
Wine from white grapes 514 488 -5%
Total wine production 1197 1090 -9%
Table 3: Extraction rates (litres of wine per tonne)
2018–19 2019–20 YoY change 10-yr average Change from 10-year average
Red 726 720 -1% 717 0%
White 653 713 9% 691 3%
Total 691 717 4% 704 2%
Table 4: Wine inventory by colour (litres)
2018–19 2019–20 YoY change
Red and rosé 990 997 1%
White 643 544 -15%
Total still wine 1633 1541 -6%
Sparkling 77 84 9%
Fortified and other products 58 76 30%
Total inventory 1769 1701 -4%
Table 5: Stock to sales ratios (years)
2018–19 2019–20 10-yr average
Red 1.42 1.54 1.58
White 1.25 1.11 1.30
Total 1.37 1.39 1.46
Table 6: Domestic wine sales by wine style (million litres)
2018–19 2019–20 YoY change
Red and rosé 212 206 -3%
White 208 210 1%
Sparkling (inc carbonated) 55 59 6%
Fortified 19 16 -14%
Total 494 491 -1%
Wine Australia 4Australian Wine: Production, Sales and Inventory Report 2019–20
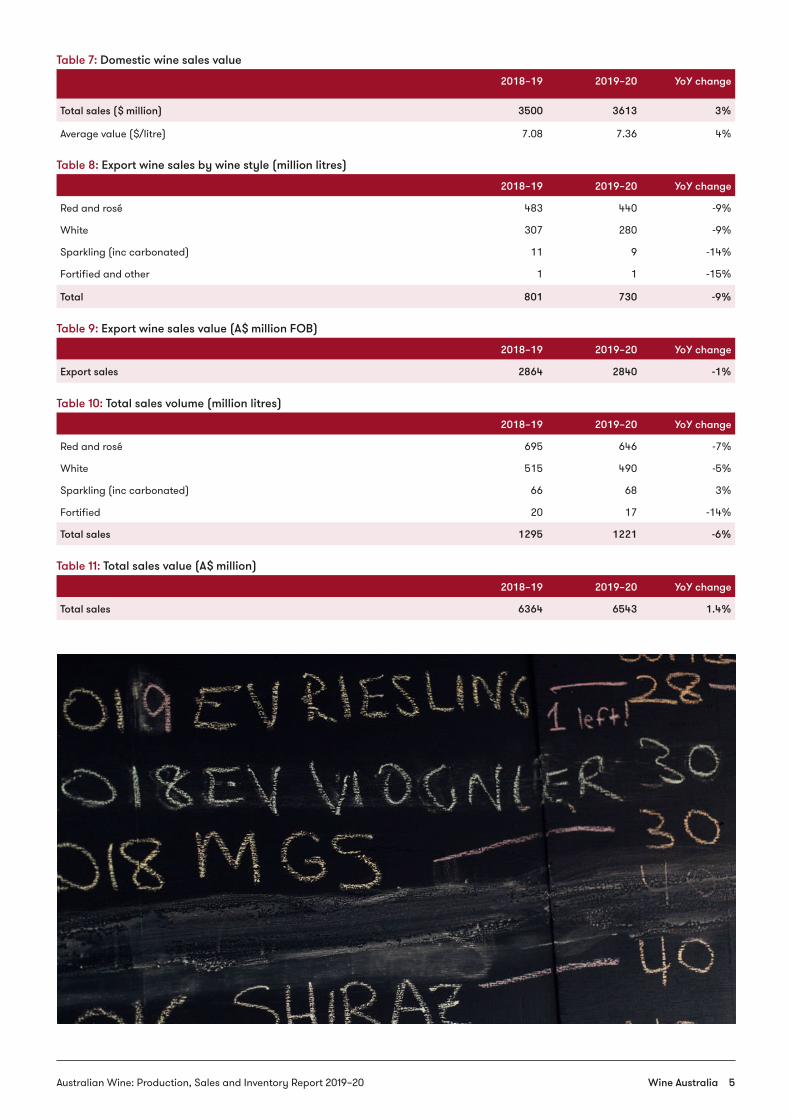
Table 7: Domestic wine sales value
2018–19 2019–20 YoY change
Total sales ($ million) 3500 3613 3%
Average value ($/litre) 7.08 7.36 4%
Table 8: Export wine sales by wine style (million litres)
2018–19 2019–20 YoY change
Red and rosé 483 440 -9%
White 307 280 -9%
Sparkling (inc carbonated) 11 9 -14%
Fortified and other 1 1 -15%
Total 801 730 -9%
Table 9: Export wine sales value (A$ million FOB)
2018–19 2019–20 YoY change
Export sales 2864 2840 -1%
Table 10: Total sales volume (million litres)
2018–19 2019–20 YoY change
Red and rosé 695 646 -7%
White 515 490 -5%
Sparkling (inc carbonated) 66 68 3%
Fortified 20 17 -14%
Total sales 1295 1221 -6%
Table 11: Total sales value (A$ million)
2018–19 2019–20 YoY change
Total sales 6364 6543 1.4%
Wine Australia 5Australian Wine: Production, Sales and Inventory Report 2019–20
2008–0
9
2009–10
2010
–11
2011–
12
2012–
13
2013
–14
2014
–15
2015
–16
2016
–17
2019
–20
2018
–19
2017–
18
Cru
sh (m
illio
n to
nnes
)Yield (t/ha)
Calc. yield
10 year average crush (1.73 million tonnnes)
0
0.2
0.4
0.6
0.8
1.0
1.2
1.4
1.6
1.8
2.0
Red White
0
2
4
6
8
10
12
14
16
Production
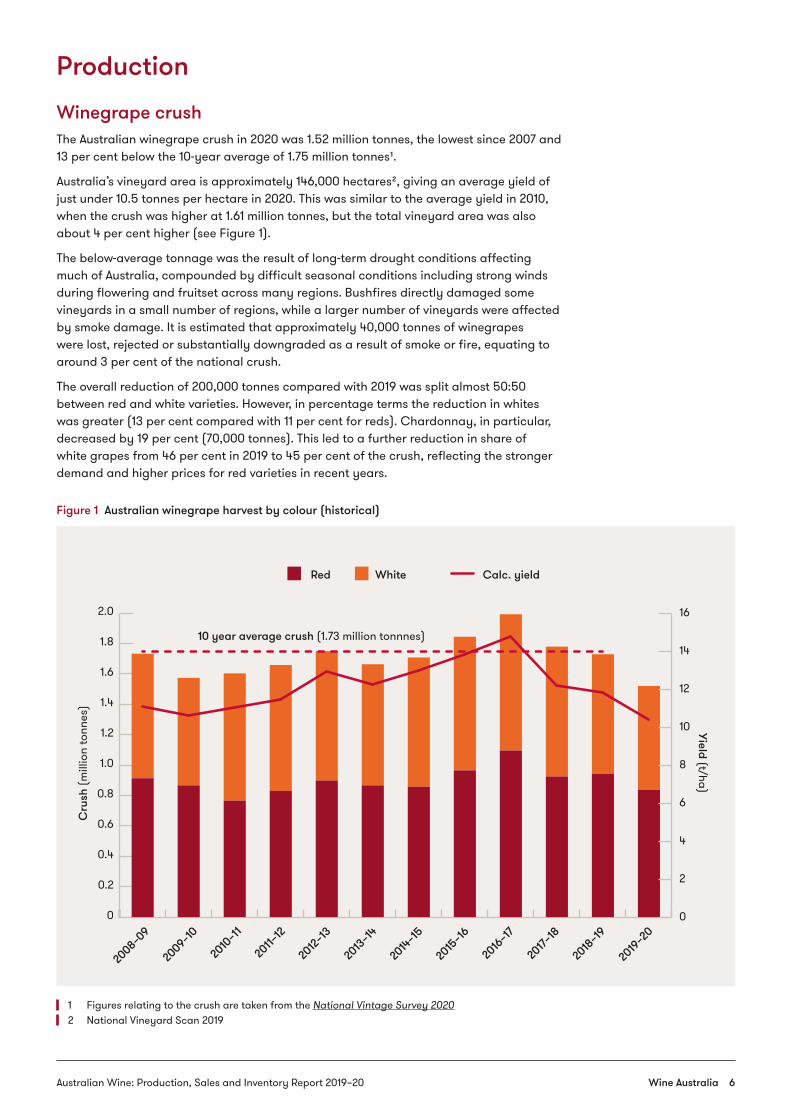
Winegrape crushThe Australian winegrape crush in 2020 was 1.52 million tonnes, the lowest since 2007 and 13 per cent below the 10-year average of 1.75 million tonnes1.
Australia’s vineyard area is approximately 146,000 hectares2, giving an average yield of just under 10.5 tonnes per hectare in 2020. This was similar to the average yield in 2010, when the crush was higher at 1.61 million tonnes, but the total vineyard area was also about 4 per cent higher (see Figure 1).
The below-average tonnage was the result of long-term drought conditions affecting much of Australia, compounded by difficult seasonal conditions including strong winds during flowering and fruitset across many regions. Bushfires directly damaged some vineyards in a small number of regions, while a larger number of vineyards were affected by smoke damage. It is estimated that approximately 40,000 tonnes of winegrapes were lost, rejected or substantially downgraded as a result of smoke or fire, equating to around 3 per cent of the national crush.
The overall reduction of 200,000 tonnes compared with 2019 was split almost 50:50 between red and white varieties. However, in percentage terms the reduction in whites was greater (13 per cent compared with 11 per cent for reds). Chardonnay, in particular, decreased by 19 per cent (70,000 tonnes). This led to a further reduction in share of white grapes from 46 per cent in 2019 to 45 per cent of the crush, reflecting the stronger demand and higher prices for red varieties in recent years.
Figure 1 Australian winegrape harvest by colour (historical)
1 Figures relating to the crush are taken from the National Vintage Survey 20202 National Vineyard Scan 2019
Wine Australia 6Australian Wine: Production, Sales and Inventory Report 2019–20
Wine productionTotal Australian wine production in 2019–20 was just under 1.1 billion litres, or 121 million 9-litre case equivalents3. This is 10 per cent below the 10-year average (1.2 billion litres) and 9 per cent below the previous year’s production.
Wine from red grapes accounted for 602 million litres or 67 million 9-litre cases, 55 per cent of total production4. The extraction rate for reds fell slightly compared with the previous year, exacerbating the decrease in crush.
On the other hand, the extraction rate for white grapes increased by 9 per cent to 713 litres per tonne, 3 per cent higher than the 10-year average. This saw white production decline by only 5 per cent and its share of wine production increase to 45 per cent compared with 43 per cent the previous year. This may indicate demand swinging back towards white wine, leading to less diversion of white juice to other products including juice, concentrate, wine-based beverages and non-alcoholic or reduced alcohol ‘wine’ products.
Sparkling wine production5 in 2019–20 is estimated to be 60 million litres, of which 85 per cent was white. Fortified wine production (also from earlier vintage grapes) is estimated to be 24 million litres, of which 60 per cent was white. Sparkling and fortified volumes are not included in the total wine production figures as the base wine would have been included in the 2019 or earlier figures.
It is estimated that a total of 72 million litres of ‘other products’6 was made from the 2020 crush in addition to wine. This is not included in the total wine production estimate.
The global contextThe global harvest in 2020 is 26.3 billion litres, according to preliminary OIV estimates. This is 1 per cent above the 2019 harvest but 2 per cent below the 5-year average. Overall, an additional 1.02 billion litres of wine were produced in 2020 compared with the previous year.
The northern hemisphere harvests are estimated to have come in around the 5-year average, while southern hemisphere producers generally had smaller crops than in 2019. Australia’s share of global production fell to 4 per cent, putting it in sixth place just below Argentina with 4.1 per cent, while Chile fell to eighth place with a reduction of 14 per cent and a share of 3.9 per cent.
3 Estimate based on the annual Wine Production, Sales and Inventory Survey – see Explanatory notes on page 19
4 Note that red grapes that are made into white wine (including Pinot Noir) are included with ‘wine from red grapes’, so the actual share of red wine may be lower than reported.
5 Bottled and bulk fermented sparkling wine that underwent second fermentation in the 2019-20 financial year
6 Juice, concentrate, wine products and wine-based beverages. Estimate is of the total volume including other ingredients.
Wine Australia 7Australian Wine: Production, Sales and Inventory Report 2019–20
Sales
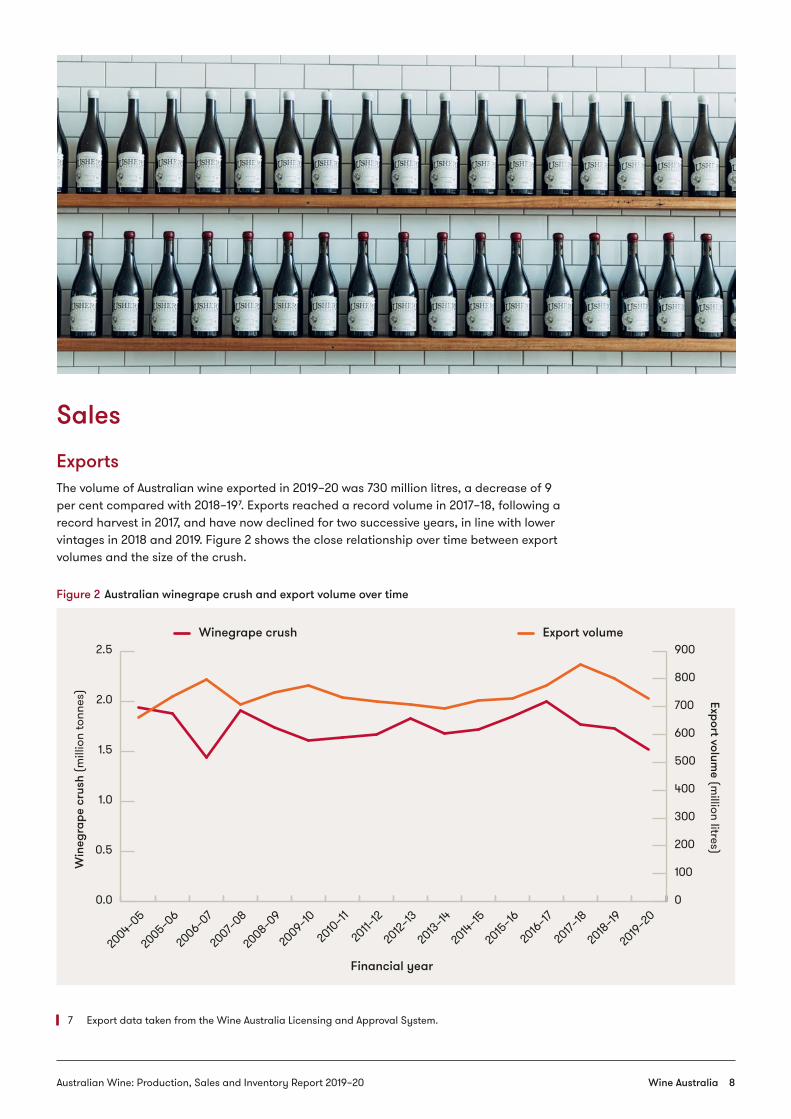
ExportsThe volume of Australian wine exported in 2019–20 was 730 million litres, a decrease of 9 per cent compared with 2018–197. Exports reached a record volume in 2017–18, following a record harvest in 2017, and have now declined for two successive years, in line with lower vintages in 2018 and 2019. Figure 2 shows the close relationship over time between export volumes and the size of the crush.
Figure 2 Australian winegrape crush and export volume over time
7 Export data taken from the Wine Australia Licensing and Approval System.
2008–0
9
2009–10
2010
–11
2011–
12
2004–0
5
2005–0
6
2006–0
7
2007–
08
2012–
13
2013–14
2014–15
2015
–16
2016–17
2019–2
0
2018
–19
2017–
18
Win
egra
pe c
rush
(mill
ion
tonn
es)
Export volume (m
illion litres)
0.0
0.5
1.0
1.5
2.0
2.5
0
100
200
300
400
500
600
700
800
900Winegrape crush
Financial year
Export volume
Wine Australia 8Australian Wine: Production, Sales and Inventory Report 2019–20
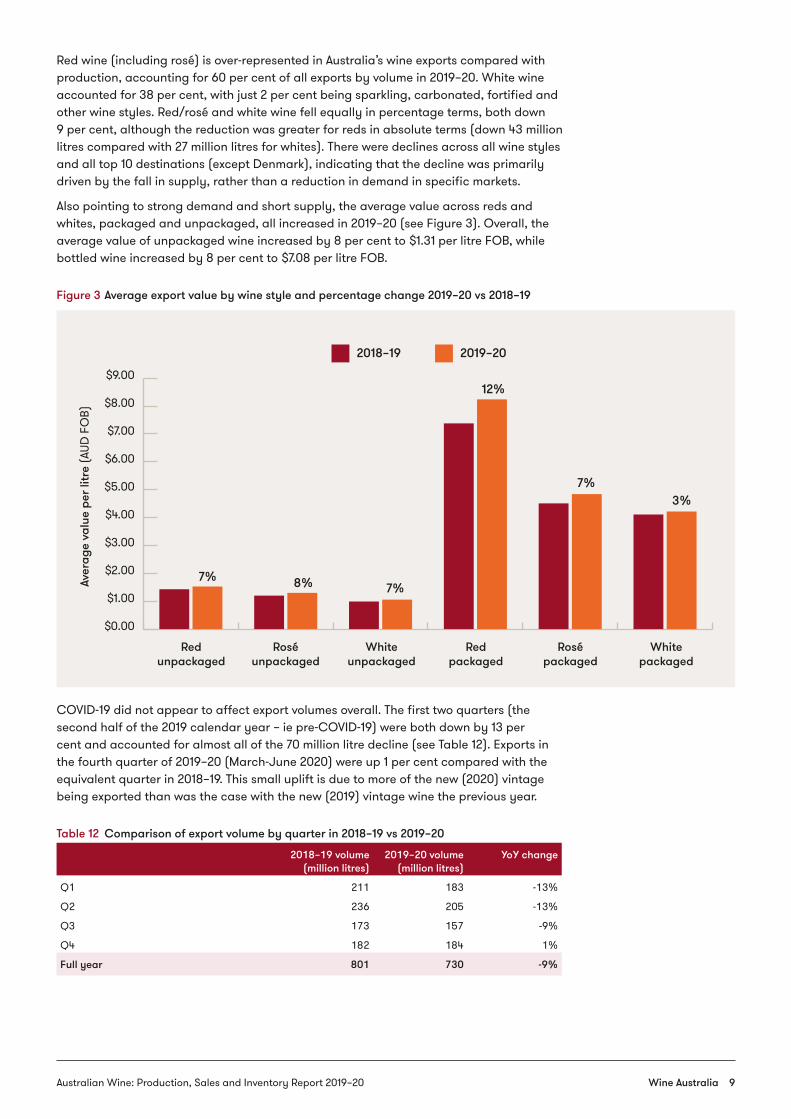
Red wine (including rosé) is over-represented in Australia’s wine exports compared with production, accounting for 60 per cent of all exports by volume in 2019–20. White wine accounted for 38 per cent, with just 2 per cent being sparkling, carbonated, fortified and other wine styles. Red/rosé and white wine fell equally in percentage terms, both down 9 per cent, although the reduction was greater for reds in absolute terms (down 43 million litres compared with 27 million litres for whites). There were declines across all wine styles and all top 10 destinations (except Denmark), indicating that the decline was primarily driven by the fall in supply, rather than a reduction in demand in specific markets.
Also pointing to strong demand and short supply, the average value across reds and whites, packaged and unpackaged, all increased in 2019–20 (see Figure 3). Overall, the average value of unpackaged wine increased by 8 per cent to $1.31 per litre FOB, while bottled wine increased by 8 per cent to $7.08 per litre FOB.
Figure 3 Average export value by wine style and percentage change 2019–20 vs 2018–19
COVID-19 did not appear to affect export volumes overall. The first two quarters (the second half of the 2019 calendar year – ie pre-COVID-19) were both down by 13 per cent and accounted for almost all of the 70 million litre decline (see Table 12). Exports in the fourth quarter of 2019–20 (March-June 2020) were up 1 per cent compared with the equivalent quarter in 2018–19. This small uplift is due to more of the new (2020) vintage being exported than was the case with the new (2019) vintage wine the previous year.
Table 12 Comparison of export volume by quarter in 2018–19 vs 2019–20
2018–19 volume (million litres)
2019–20 volume (million litres)
YoY change
Q1 211 183 -13%
Q2 236 205 -13%
Q3 173 157 -9%
Q4 182 184 1%
Full year 801 730 -9%
Redunpackaged
Roséunpackaged
Whiteunpackaged
Redpackaged
Rosépackaged
Whitepackaged
Aver
age
valu
e pe
r litr
e (A
UD F
OB)
2018–19
7% 8% 7%
12%
7%3%
2019–20
$0.00
$1.00
$2.00
$3.00
$4.00
$5.00
$6.00
$7.00
$8.00
$9.00
Wine Australia 9Australian Wine: Production, Sales and Inventory Report 2019–20
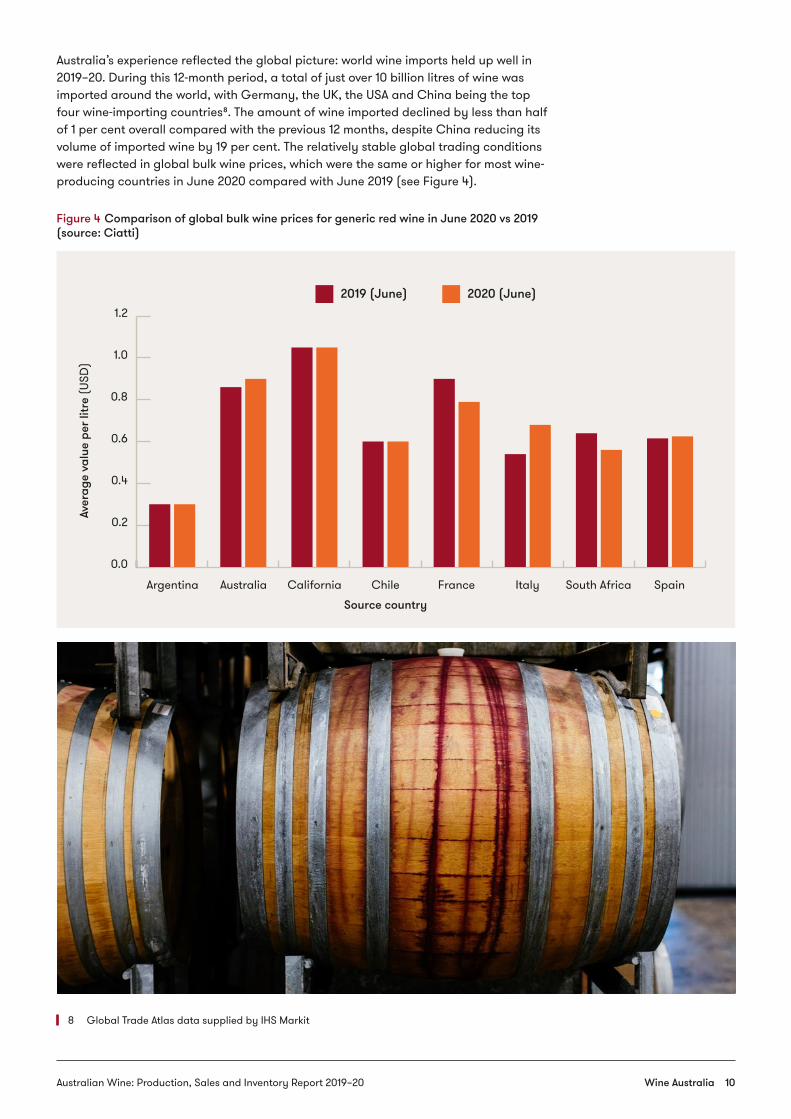
Australia’s experience reflected the global picture: world wine imports held up well in 2019–20. During this 12-month period, a total of just over 10 billion litres of wine was imported around the world, with Germany, the UK, the USA and China being the top four wine-importing countries8. The amount of wine imported declined by less than half of 1 per cent overall compared with the previous 12 months, despite China reducing its volume of imported wine by 19 per cent. The relatively stable global trading conditions were reflected in global bulk wine prices, which were the same or higher for most wine-producing countries in June 2020 compared with June 2019 (see Figure 4).
Figure 4 Comparison of global bulk wine prices for generic red wine in June 2020 vs 2019 (source: Ciatti)
8 Global Trade Atlas data supplied by IHS Markit
Argentina Australia California Chile
Source country
France Italy South Africa Spain
Aver
age
valu
e pe
r litr
e (U
SD)
2019 (June) 2020 (June)
0.0
0.2
0.4
0.6
0.8
1.0
1.2
Wine Australia 10Australian Wine: Production, Sales and Inventory Report 2019–20
Domestic salesThe Australian domestic wine market is the largest single market for Australian wine, accounting for more than one-third of all Australian wine sales by volume.
The results of the Wine Production, Sales and Inventory Survey 2020 indicate that the volume of Australian wine sold domestically in 2019–20 declined by one per cent from 494 million litres to 491 million litres. This is consistent with long-term trends of volume decline in mature wine markets over the past five or so years and lines up with the IWSR-reported 1 per cent decline in consumption of Australian wine on the domestic market in 2019. Any specific effect of COVID-19 on overall consumption cannot be determined but would be limited in 2019-20 because the pandemic and associated social restrictions did not start in Australia until late March 2020.
The domestic market is made up of four main channels:
• on-trade (restaurants, hotels, pubs and clubs)• off-trade retail (‘big box’ retailers including their website sales, independent retail
shops including Aldi)• off-trade direct-to-consumer (wine clubs, cellar door, wineries’ own websites), and• off-trade third party online retailers
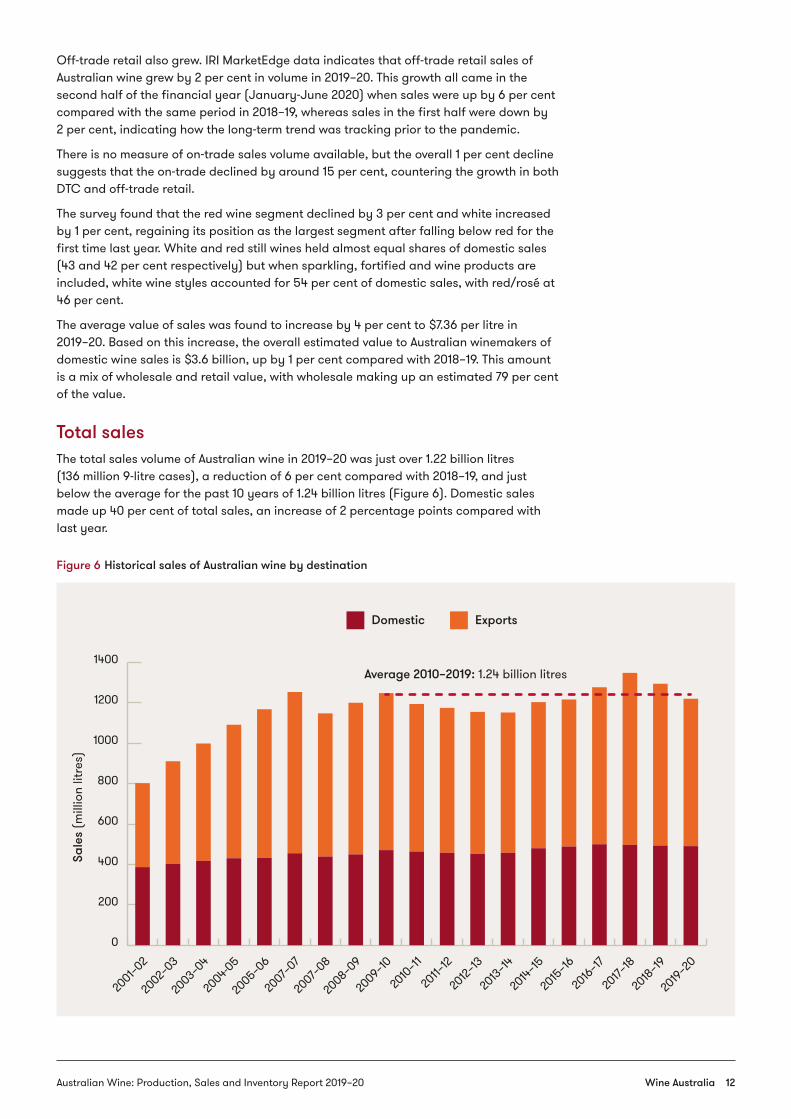
Each channel’s approximate share of the market9 is illustrated in Figure 5 below:
Figure 5 Domestic market share by sales channel
Imported wine accounts for an estimated 17 per cent of the total domestic market by volume10 and is concentrated in the off-trade retail and on-trade channels.
While not affecting overall consumption volumes significantly, COVID-19 caused substantial disruption to sales channels, starting near the end of quarter 3 of 2019–20 with the first widespread lockdowns in Australia. Overall, the effects are likely to become more apparent in the 2020-21 financial year, as there is a lag between changes in consumer behaviour and changes in winery sales figures, except in the case of DTC, where the winery sells directly to the consumer. The Wine Australia Wine Direct to Consumer Survey 2020 found that sales volume for DTC increased by 5 per cent in 2019–20, driven by substantial increases in wine club and e-commerce channels.
9 Shares are based on estimates and modelling drawn from a number of sources as there is very limited data available on DTC and on-trade sales volumes in Australia. Estimates do not take into account the impact of COVID-19 on sales channels.
10 IWSR 2019
Off-trade retail 74%
Off-trade direct to consumer 8%
Off-trade third party online retailers 1%
Approximate market share by
sales channel(volume)
On-trade 17%
Wine Australia 11Australian Wine: Production, Sales and Inventory Report 2019–20
Off-trade retail also grew. IRI MarketEdge data indicates that off-trade retail sales of Australian wine grew by 2 per cent in volume in 2019–20. This growth all came in the second half of the financial year (January-June 2020) when sales were up by 6 per cent compared with the same period in 2018–19, whereas sales in the first half were down by 2 per cent, indicating how the long-term trend was tracking prior to the pandemic.
There is no measure of on-trade sales volume available, but the overall 1 per cent decline suggests that the on-trade declined by around 15 per cent, countering the growth in both DTC and off-trade retail.
The survey found that the red wine segment declined by 3 per cent and white increased by 1 per cent, regaining its position as the largest segment after falling below red for the first time last year. White and red still wines held almost equal shares of domestic sales (43 and 42 per cent respectively) but when sparkling, fortified and wine products are included, white wine styles accounted for 54 per cent of domestic sales, with red/rosé at 46 per cent.
The average value of sales was found to increase by 4 per cent to $7.36 per litre in 2019–20. Based on this increase, the overall estimated value to Australian winemakers of domestic wine sales is $3.6 billion, up by 1 per cent compared with 2018–19. This amount is a mix of wholesale and retail value, with wholesale making up an estimated 79 per cent of the value.
Total salesThe total sales volume of Australian wine in 2019–20 was just over 1.22 billion litres (136 million 9-litre cases), a reduction of 6 per cent compared with 2018–19, and just below the average for the past 10 years of 1.24 billion litres (Figure 6). Domestic sales made up 40 per cent of total sales, an increase of 2 percentage points compared with last year.
Figure 6 Historical sales of Australian wine by destination
2008–0
9
2007–
08
2007–
07
2005–0
6
2002–
03
2003–0
4
2004-05
2001–0
2
2009–10
2010
–11
2011–
12
2012–
13
2013–14
2014–15
2015
–16
2016–17
2018
–19
2019–2
0
2017–
18
Sale
s (m
illio
n lit
res)
0
200
400
600
800
1000
1200
1400
Domestic Exports
Average 2010–2019: 1.24 billion litres
Wine Australia 12Australian Wine: Production, Sales and Inventory Report 2019–20
Red and rosé wine accounted for 53 per cent of total sales, and declined by 7 per cent, while white wine plus sparkling and fortified11 accounted for 47 per cent and declined by 4 per cent.
Fluctuations in total sales over the past 10 years have been driven by exports, with domestic sales remaining within 5 per cent of the average every year.
Sparkling wine sales (including carbonated) grew by 3 per cent year-on-year, reversing last year’s 4 per cent decline. The increase was driven by domestic sales, which increased by 4 million litres, while exports of sparkling wine declined by around 2 million litres.
The combined revenue to Australian wine producers from export and domestic sales is estimated to be $6.54 billion, an increase of 1.4 per cent compared with the previous year. The increase represents an extra $90 million for the sector, despite the reduction in production and sales volumes.
11 According to the Wine Production, Sales and Inventory Survey 2020, 85 per cent of sparkling wine and 60 per cent of fortified wine produced was white.
Wine Australia 13Australian Wine: Production, Sales and Inventory Report 2019–20
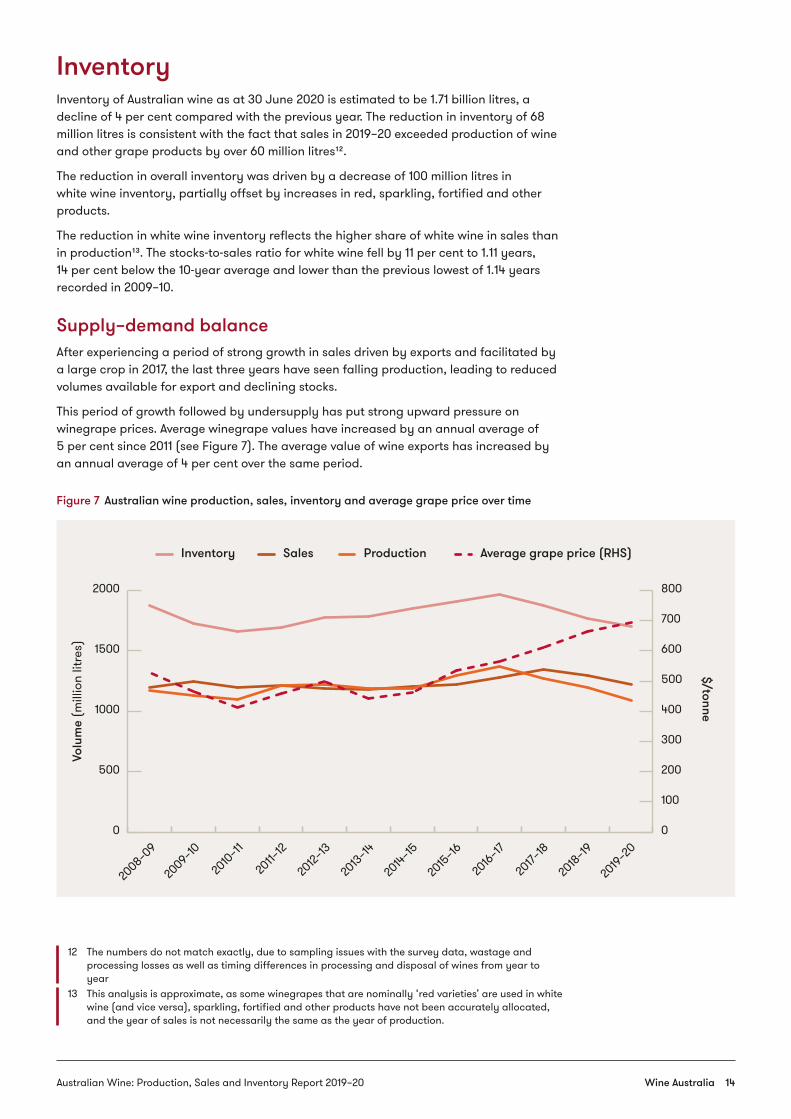
InventoryInventory of Australian wine as at 30 June 2020 is estimated to be 1.71 billion litres, a decline of 4 per cent compared with the previous year. The reduction in inventory of 68 million litres is consistent with the fact that sales in 2019–20 exceeded production of wine and other grape products by over 60 million litres12.
The reduction in overall inventory was driven by a decrease of 100 million litres in white wine inventory, partially offset by increases in red, sparkling, fortified and other products.
The reduction in white wine inventory reflects the higher share of white wine in sales than in production13. The stocks-to-sales ratio for white wine fell by 11 per cent to 1.11 years, 14 per cent below the 10-year average and lower than the previous lowest of 1.14 years recorded in 2009–10.
Supply–demand balanceAfter experiencing a period of strong growth in sales driven by exports and facilitated by a large crop in 2017, the last three years have seen falling production, leading to reduced volumes available for export and declining stocks.
This period of growth followed by undersupply has put strong upward pressure on winegrape prices. Average winegrape values have increased by an annual average of 5 per cent since 2011 (see Figure 7). The average value of wine exports has increased by an annual average of 4 per cent over the same period.
Figure 7 Australian wine production, sales, inventory and average grape price over time
12 The numbers do not match exactly, due to sampling issues with the survey data, wastage and processing losses as well as timing differences in processing and disposal of wines from year to year
13 This analysis is approximate, as some winegrapes that are nominally ‘red varieties’ are used in white wine (and vice versa), sparkling, fortified and other products have not been accurately allocated, and the year of sales is not necessarily the same as the year of production.
2008–0
9
2009–10
2010
–11
2011–
12
2012–
13
2013–14
2014–15
2015
–16
2016–17
2018
–19
2019–2
0
2017–
18
Volu
me
(mill
ion
litre
s)$/tonne
0
500
1000
1500
2000
0
100
200
300
400
500
600
700
800
Inventory Sales Production Average grape price (RHS)
Wine Australia 14Australian Wine: Production, Sales and Inventory Report 2019–20
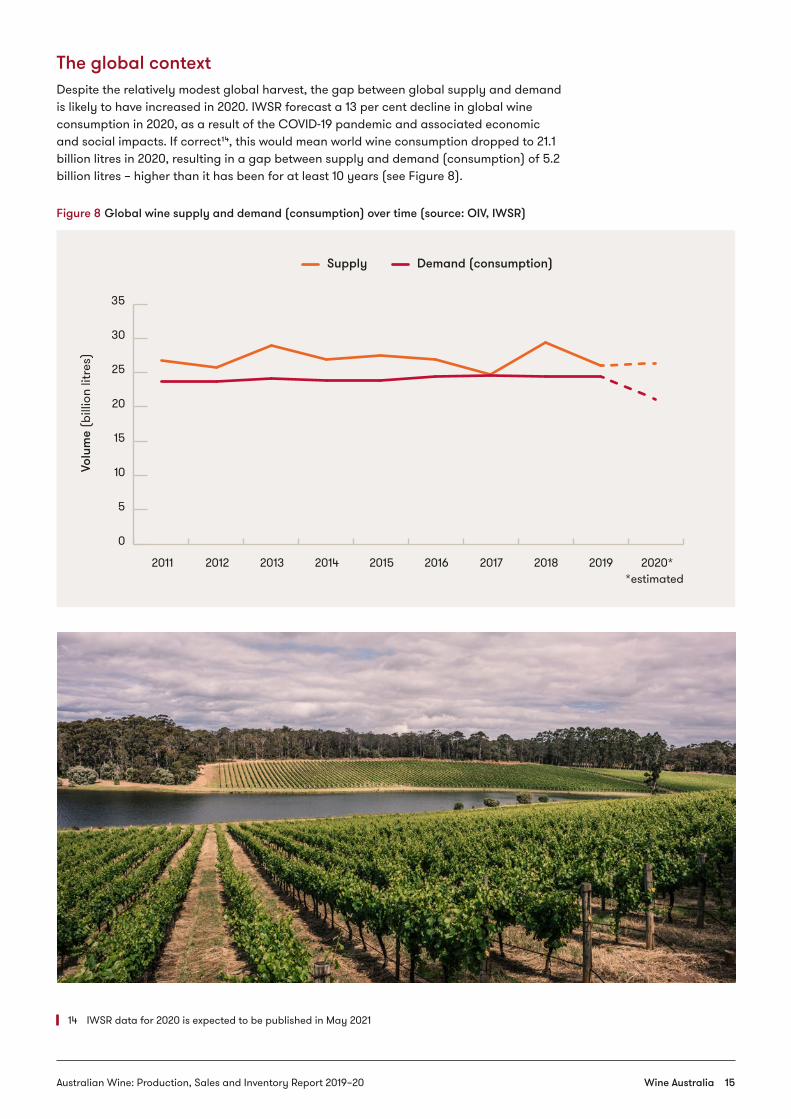
The global contextDespite the relatively modest global harvest, the gap between global supply and demand is likely to have increased in 2020. IWSR forecast a 13 per cent decline in global wine consumption in 2020, as a result of the COVID-19 pandemic and associated economic and social impacts. If correct14, this would mean world wine consumption dropped to 21.1 billion litres in 2020, resulting in a gap between supply and demand (consumption) of 5.2 billion litres – higher than it has been for at least 10 years (see Figure 8).
Figure 8 Global wine supply and demand (consumption) over time (source: OIV, IWSR)
14 IWSR data for 2020 is expected to be published in May 2021
2011 2012 2013 2014 2015 2016 2017 2018 2019 2020**estimated
Volu
me
(bill
ion
litre
s)
0
5
10
15
20
25
30
35
Supply Demand (consumption)
Wine Australia 15Australian Wine: Production, Sales and Inventory Report 2019–20
Outlook
Market conditionsSince the publication of the 2018–19 Wine Production Sales and Inventory report in February 2020, the Australian wine sector has experienced two major and totally unexpected events: the COVID-19 pandemic and the introduction of interim tariffs on Australian wine imports by the Chinese government.
So far (March 2021), the COVID-19 pandemic has not had a significant overall effect on wine sales. Wine consumption appears to have remained fairly stable in most markets, although there have been changes in channels – particularly a shift to purchasing online and in off-trade retail while the on-trade has been partly or completely closed. Those wineries with a greater exposure to the on-trade were impacted more significantly. Increased domestic tourism has largely made up for the loss of international tourists, although different wine regions are affected differently in this respect. Stimulus and support packages have supported employment and limited economic impacts in the short term. However, longer term economic downturns in major wine-consuming nations could dampen global demand substantially in the next few years. GlobalData predicts that the 2-year combined GDP growth rate over the 2020 and 2021 calendar years will be negative in 8 of the top 10 wine-consuming countries, with only China (5.3 per cent) and USA (0.3 per cent) expected to grow.
Exports of Australian wine to China were already declining in volume, due to a shortage of supply and overall reduction in China’s demand for imported wine, before the imposition by the Chinese government of temporary deposit tariffs of between 107.1 per cent and 212.1 per cent on Australian wine in containers of up to 2 litres in November 2020.15 These tariffs have had the effect of more-or-less completely halting wine exports to that market. In the year ended December 2020, Australia’s wine export volume to China declined by 39 million litres compared with 2019, with 60 per cent of the decline coming in the last two months. In December alone, exports fell from nearly 17 million litres in 2019 to less than half a million litres in 2020.
Australia’s ability to find new markets for the lost volume to China, in the context of a potential increase in global supply and softening in demand, will underpin its success in the next 12–24 months.
Despite being Australia’s top export market by value, China accounted for just 10 per cent of Australia’s wine sales volume at its peak in 2019, compared with the USA (18 per cent), the UK (30 per cent), and Australia (38 per cent).
Prospects for increasing exports to the UK and USA are positive. Australian wine dominates in the off-trade and has benefitted from the channel shift in both countries as a result of the pandemic. In the year ended December 2020, sales of Australian wine increased by 9 per cent in volume in the UK off-trade market, and by 6 per cent in the USA off-trade.
There has also been growth in Australian wine exports to a number of South Asian markets including Malaysia, South Korea and Taiwan, and European markets including Norway, Denmark, Russia and Ireland.
The Australian domestic market is experiencing long-term declining consumption due to cultural and demographic changes, as well as increased competition from imports and alternative beverages. It is not likely to be able to absorb additional volumes of Australian wine in the short-to-medium term. While there is theoretically an opportunity to displace imported wine with more Australian wine, imported wine is predominantly white and sparkling wine and therefore not directly substitutable with the red wine no longer going to China.
15 On 26 March 2021 MOFCOM confirmed that these tariffs (now set at between 116.2 and 218.4 per cent) would remain in place for five years. Read more about the tariffs.
Wine Australia 16Australian Wine: Production, Sales and Inventory Report 2019–20
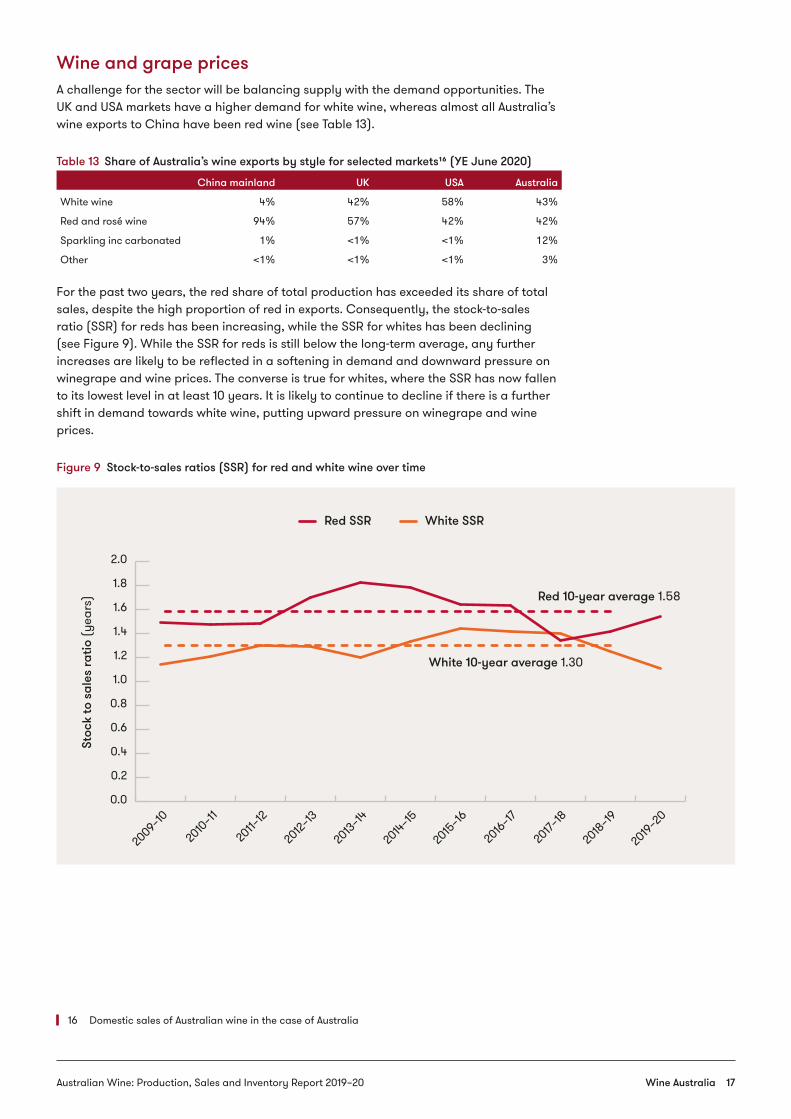
Wine and grape pricesA challenge for the sector will be balancing supply with the demand opportunities. The UK and USA markets have a higher demand for white wine, whereas almost all Australia’s wine exports to China have been red wine (see Table 13).
Table 13 Share of Australia’s wine exports by style for selected markets16 (YE June 2020)
China mainland UK USA Australia
White wine 4% 42% 58% 43%
Red and rosé wine 94% 57% 42% 42%
Sparkling inc carbonated 1% <1% <1% 12%
Other <1% <1% <1% 3%
For the past two years, the red share of total production has exceeded its share of total sales, despite the high proportion of red in exports. Consequently, the stock-to-sales ratio (SSR) for reds has been increasing, while the SSR for whites has been declining (see Figure 9). While the SSR for reds is still below the long-term average, any further increases are likely to be reflected in a softening in demand and downward pressure on winegrape and wine prices. The converse is true for whites, where the SSR has now fallen to its lowest level in at least 10 years. It is likely to continue to decline if there is a further shift in demand towards white wine, putting upward pressure on winegrape and wine prices.
Figure 9 Stock-to-sales ratios (SSR) for red and white wine over time
16 Domestic sales of Australian wine in the case of Australia
Stoc
k to
sal
es ra
tio (y
ears
)
0.0
0.2
0.4
0.6
0.8
1.0
1.2
1.4
1.6
1.8
2.0
Red SSR
Red 10-year average 1.58
White 10-year average 1.30
White SSR
2009–10
2010
–11
2011–
12
2012–
13
2013–14
2014–15
2015
–16
2016–17
2018
–19
2019–2
0
2017–
18
Wine Australia 17Australian Wine: Production, Sales and Inventory Report 2019–20
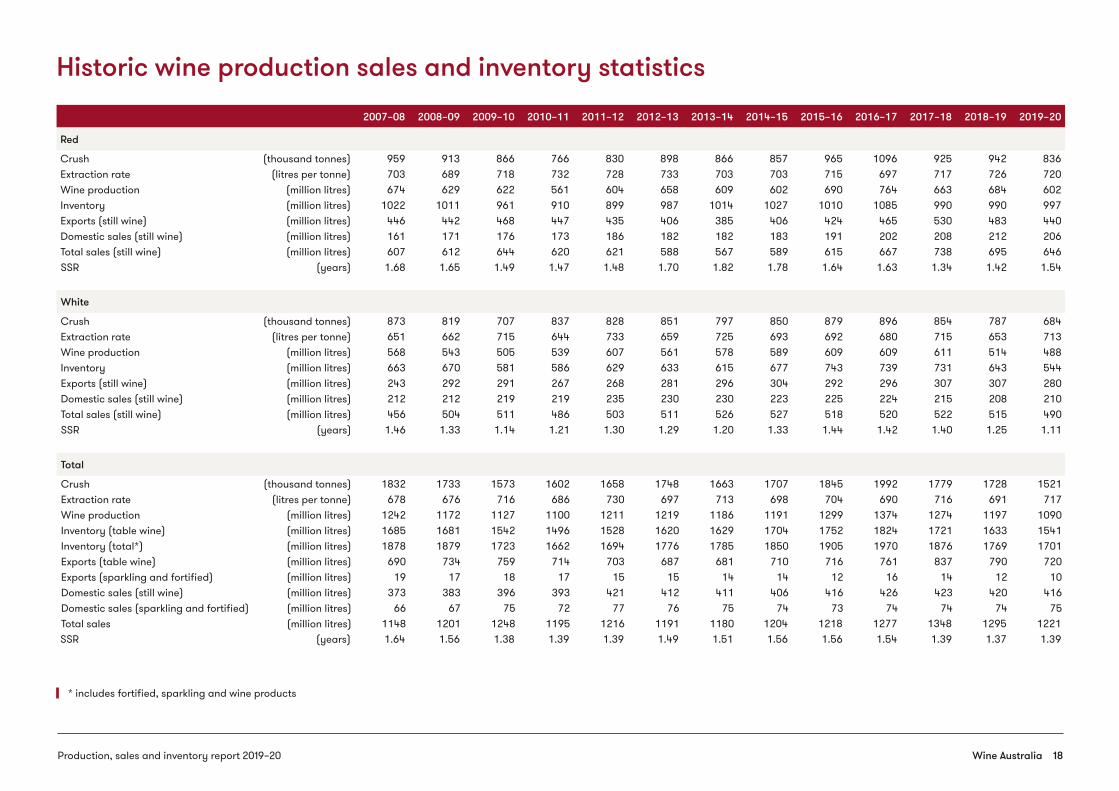
Historic wine production sales and inventory statistics
2007–08 2008–09 2009–10 2010–11 2011–12 2012–13 2013–14 2014–15 2015–16 2016–17 2017–18 2018–19 2019–20
Red
Crush (thousand tonnes) 959 913 866 766 830 898 866 857 965 1096 925 942 836Extraction rate (litres per tonne) 703 689 718 732 728 733 703 703 715 697 717 726 720Wine production (million litres) 674 629 622 561 604 658 609 602 690 764 663 684 602Inventory (million litres) 1022 1011 961 910 899 987 1014 1027 1010 1085 990 990 997Exports (still wine) (million litres) 446 442 468 447 435 406 385 406 424 465 530 483 440Domestic sales (still wine) (million litres) 161 171 176 173 186 182 182 183 191 202 208 212 206Total sales (still wine) (million litres) 607 612 644 620 621 588 567 589 615 667 738 695 646SSR (years) 1.68 1.65 1.49 1.47 1.48 1.70 1.82 1.78 1.64 1.63 1.34 1.42 1.54
White
Crush (thousand tonnes) 873 819 707 837 828 851 797 850 879 896 854 787 684Extraction rate (litres per tonne) 651 662 715 644 733 659 725 693 692 680 715 653 713Wine production (million litres) 568 543 505 539 607 561 578 589 609 609 611 514 488Inventory (million litres) 663 670 581 586 629 633 615 677 743 739 731 643 544Exports (still wine) (million litres) 243 292 291 267 268 281 296 304 292 296 307 307 280Domestic sales (still wine) (million litres) 212 212 219 219 235 230 230 223 225 224 215 208 210Total sales (still wine) (million litres) 456 504 511 486 503 511 526 527 518 520 522 515 490SSR (years) 1.46 1.33 1.14 1.21 1.30 1.29 1.20 1.33 1.44 1.42 1.40 1.25 1.11
Total
Crush (thousand tonnes) 1832 1733 1573 1602 1658 1748 1663 1707 1845 1992 1779 1728 1521Extraction rate (litres per tonne) 678 676 716 686 730 697 713 698 704 690 716 691 717Wine production (million litres) 1242 1172 1127 1100 1211 1219 1186 1191 1299 1374 1274 1197 1090Inventory (table wine) (million litres) 1685 1681 1542 1496 1528 1620 1629 1704 1752 1824 1721 1633 1541Inventory (total*) (million litres) 1878 1879 1723 1662 1694 1776 1785 1850 1905 1970 1876 1769 1701Exports (table wine) (million litres) 690 734 759 714 703 687 681 710 716 761 837 790 720Exports (sparkling and fortified) (million litres) 19 17 18 17 15 15 14 14 12 16 14 12 10Domestic sales (still wine) (million litres) 373 383 396 393 421 412 411 406 416 426 423 420 416Domestic sales (sparkling and fortified) (million litres) 66 67 75 72 77 76 75 74 73 74 74 74 75Total sales (million litres) 1148 1201 1248 1195 1216 1191 1180 1204 1218 1277 1348 1295 1221SSR (years) 1.64 1.56 1.38 1.39 1.39 1.49 1.51 1.56 1.56 1.54 1.39 1.37 1.39
* includes fortified, sparkling and wine products
Wine Australia 18Production, sales and inventory report 2019–20
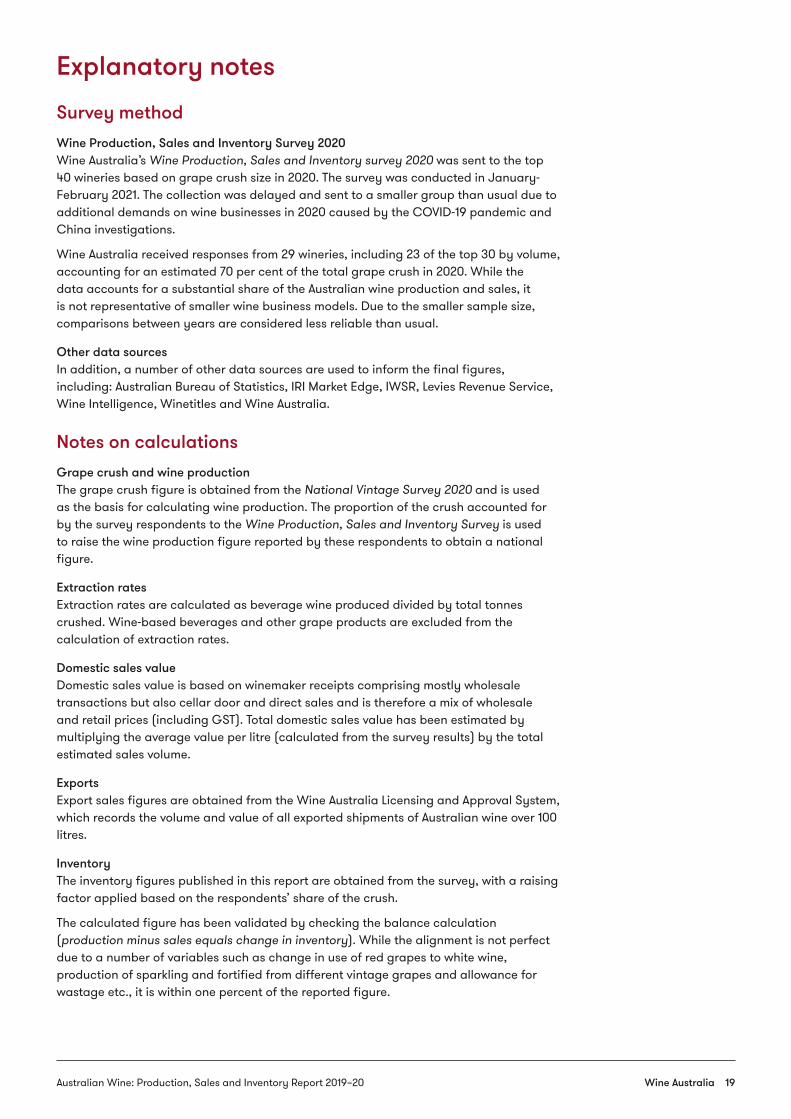
Explanatory notes
Survey methodWine Production, Sales and Inventory Survey 2020Wine Australia’s Wine Production, Sales and Inventory survey 2020 was sent to the top 40 wineries based on grape crush size in 2020. The survey was conducted in January-February 2021. The collection was delayed and sent to a smaller group than usual due to additional demands on wine businesses in 2020 caused by the COVID-19 pandemic and China investigations.
Wine Australia received responses from 29 wineries, including 23 of the top 30 by volume, accounting for an estimated 70 per cent of the total grape crush in 2020. While the data accounts for a substantial share of the Australian wine production and sales, it is not representative of smaller wine business models. Due to the smaller sample size, comparisons between years are considered less reliable than usual.
Other data sourcesIn addition, a number of other data sources are used to inform the final figures, including: Australian Bureau of Statistics, IRI Market Edge, IWSR, Levies Revenue Service, Wine Intelligence, Winetitles and Wine Australia.
Notes on calculationsGrape crush and wine productionThe grape crush figure is obtained from the National Vintage Survey 2020 and is used as the basis for calculating wine production. The proportion of the crush accounted for by the survey respondents to the Wine Production, Sales and Inventory Survey is used to raise the wine production figure reported by these respondents to obtain a national figure.
Extraction ratesExtraction rates are calculated as beverage wine produced divided by total tonnes crushed. Wine-based beverages and other grape products are excluded from the calculation of extraction rates.
Domestic sales valueDomestic sales value is based on winemaker receipts comprising mostly wholesale transactions but also cellar door and direct sales and is therefore a mix of wholesale and retail prices (including GST). Total domestic sales value has been estimated by multiplying the average value per litre (calculated from the survey results) by the total estimated sales volume.
ExportsExport sales figures are obtained from the Wine Australia Licensing and Approval System, which records the volume and value of all exported shipments of Australian wine over 100 litres.
InventoryThe inventory figures published in this report are obtained from the survey, with a raising factor applied based on the respondents’ share of the crush.
The calculated figure has been validated by checking the balance calculation (production minus sales equals change in inventory). While the alignment is not perfect due to a number of variables such as change in use of red grapes to white wine, production of sparkling and fortified from different vintage grapes and allowance for wastage etc., it is within one percent of the reported figure.
Wine Australia 19Australian Wine: Production, Sales and Inventory Report 2019–20
Disclaimer and copyrightWhile Wine Australia makes every effort to ensure the accuracy and currency of information within this report, we accept no responsibility for information that may later prove to be misrepresented or inaccurate, or reliance placed on that information by readers.
Provisions of the Copyright Act 1968 apply to the contents of this publication, all other rights reserved. For further copyright authorisation please visit www.wineaustralia.com.
Further information on this report as well as reports from previous years can be obtained from the Market Insights team at Wine Australia on 08 8228 2000 or [email protected].
Wine Australia 20Australian Wine: Production, Sales and Inventory Report 2019–20