automated cytologic screening system (cybest model 4): an integrated image cytometry system
TRANSCRIPT

Automated cytologic screening system (CYBEST model 4):
an integrated image cytometry system
Noboru Tanaka, Hideo Ikeda, Tetsuo Ueno, Akio Mukawa, Sadakazu Watanabe, Kozo Okamoto, Sugao
Hosoi, and Sho Tsunekawa
In 1967 we began developing an automated cytologic screening system for uterine cancer. The CYBEST
protype was developed in 1972, and current developments have taken us to CYBEST model 4 developed in
1981 with a new desk-size design.
1. Introduction
In 1967 we began developing an automated cytologicscreening system for uterine cancer with the followingphilosophy and goals: (1) The specimens must bePapanicolaou-stained smears to allow final assessmentof the specimens by direct microscopic observation; (2)an image analysis system is the appropriate tool forautomated evaluation of such specimens; (3) a falsepositive rate of 20% for screened specimens is accept-able, but the false negative rate must not exceed therate experienced with manual screening; (4) high-speed operation is required (no more than 6 min; ifpossible, <3 min) for the assessment of each specimen;(5) the diagnostic logic must be flexibly programmableso that additional parameters can be added and correc-tions can be made easily; (6) pretreatment of cell sam-ples for dispersion and monolayer smearing shall bealso automated. 1 2
After fundamental studies of feature extraction, fea-ture evaluation using the "ambiguity differential func-tion," 1,2 hardware and software needed for cell imagesegmentation, autofocusing devices, and related top-ics, the CYBEST (cyto-biologic electronic screeningsystem) prototype was developed in 1972. The CY-
Noboru Tanaka is with Biomedical Research Laboratories, Pa-thology & Cytology Center, Koenji Minami 1-34-5, Suginami-ku,
Tokyo 166, Japan; H. Ikeda and T. Ueno are with Chiba Cancer
Center Research Institute, Nitona 666-2, Chiba, Japan; A. Mukawa
is with Kanazawa Medical University, Pathology Department, Ja-
pan; and the other authors are with Toshiba Nasu Works, Research& Development Center, Japan.
Received 17 November 1986.0003-6935/87/163301-07$02.00/0.© 1987 Optical Society of America.
BEST model 2 followed in 1974, using an autochange-able two-step flying-spot scanning device with acoarse-scan (4-,gm spot) mode and fine-scan (1-/imspot) mode.2 The model 2 is now being used on anexperimental basis for practical mass screening foruterine cancer in the Kanazawa district of Japan byMukawa's group. 3 4 Following the successful develop-ment of software-controlled automated shade correc-tion for the video system, CYBEST model 3 was devel-oped in 1978 with a one-step fine-resolution televisionscanning device. With additional mechanical im-provements for rapid processing, the time required forfinal automated assessment by the model 3 was re-duced to 3 min/cell spread.5 Embracing conspicuousrecent progress in electronics engineering and comput-er technology, a further improvement of the CYBESTsystem was undertaken. Employing the microcom-puter, CYBEST model 4 was developed in 1981 with anew desk-size design (Fig. 1).
11. Outline of the CYBEST model 4
A. Characteristics of the model 4
The features of the CYBEST model 4 are shown inFig. 2. This is a desk-sized machine with a dual-illumination system: a strobe light is synchronizedwith the video scan and is used for scanning cell im-ages, and a halogen lamp is used for direct opticalobservation. A Chalnicon camera is incorporated atthe bottom of the scanning microscope. The strobe-light passes through the 20X objective lens and focuseson the cells. One scan area is digitized with a 512 X 512pixel resolution (1 pixel corresponds to 1 gim). Themachine scans a smear area of 30 X 15 mm. Othermechanical components [e.g., a rapid autochanger ofsmear slides accommodating four magazines (i.e., slidecartridges) each containing 50 slides; rapid autofocus-ing device] are similar to those in CYBEST model 3.5
15 August 1987 / Vol. 26, No. 16 / APPLIED OPTICS 3301

OUTLINE OF ClBES'- MODEL 4
1.35 x 1.40 x 0.89 (0.69) m
2. Microcomputer: Floppy disk - 250 kB/drive
3. Microscope system:
Fig. 1. CYBEST model 4: From left side, microcomputer unit foroperational control, image analysis, and memory.
A total of 200 smear specimens can be processed se-quentially in one operation, over a period of 10 h.
CYBEST model 35 evaluates four parameters-nu-clear size (cell size), N/C (i.e., nuclear/cytoplasmic)ratio, nuclear optical density, and nuclear shape,-anduses these to grade cytologic atypia. In the model 4,intranuclear chromatinic configuration (chromatinpattern) is employed also, so that five parameters areused to calculate cytologic atypia grades (Fig. 3).
B. High-Speed Operation
Through high-speed processing, the instrument iscapable of very rapid (real-time) segmentation of cellimages and texture analysis (Fig. 4). Input of a singlecell image requires only 10 ms. Morphometric calcu-lation of cell texture and grading of cytologic atypiasfor a single cell (using functions of diagnostic logic)takes 40 ms. One scanning field of 512 X 512 gm iscaptured in image memory within 80 ms. The totalscan area of 30 X 15 mm in a smear specimen is dividedinto 1800 scanning fields. Thus, the time required forthe scanning of one specimen is 2.5 min. Additionaltime is needed for fast autofocusing, slide autochang-ing, calculation of atypia grades, etc. The time re-quired for the final assessment and data printout is -3mm/specimen.
Objective lens 20 XAutofocus adjustmentChalnicon TV cameraDual illumination: 1. Strobe light
2. Halogen lamp
4. Four slide cartridges each containing 50 slides. 200 slide samplessequentially processed in one operation
5. Hardware, software, and diagnostic logic (similar to Model 3)
6. Cell diameter: 12 - 64 glmNuclear diameter: 8 - 24 gmOptical density: Cytoplasm: 15 - 25 in 64 gray levels
Nucleus: 30 - 35 in 64 gray levels
7. Optional equipment: Manual microscopic observation, imagedisplay, image analysis, data display, 10-Cell System
8. Three minutes per specimen for final assessment
Fig. 2. Description of CYBEST model 4.
1. Nuclear size (cell size)
2. N/C ratio
3. Nuclear optical density
4. Nuclear shape
5. Chromatin pattern
Fig. 3. List of measured and computed cytologic parameters.
PROcEwssiNG PEEb YBEST Model 4
10 ms (0.01 s) for 1 cell
40 ms (0.04 s) for 1 scan area (512 x 51 2-m)
80 ms (0.08 s) including calculation of cell atypica grade
Total scan area: 30 x 15-mm with 1,800 scan fields
0.08 sec x 1,800 fields/slide = 2.4 min
2.4 min plus time for calculation of atypical rankingof specimen and autofocus adjustment
Final throughput : 3 minutes/specimen
Fig. 4. High-speed processing by CYBEST model 4.
C. Diagnostic Logic
The diagnostic logic is divided into two categories:grading of atypia in the individual cells, and atypiagrade ranking for the smear specimens as a whole. Asshown in Fig. 5, the individual parameters are weight-ed according to their diagnostic importance. The val-ue of the weighting coefficient for each parameter wasdecided by a simulation test. Each cell is classifiedinto one of 19 ranks ranging from -1 to +1, with + 1 thehighest grade (definitely malignant) and -1, the low-est grade (definitely benign). Values close to 0 indi-cate borderline atypicality between normal and suspi-cious, including malignant.
3302 APPLIED OPTICS / Vol. 26, No. 16 / 15 August 1987
1. Desk size:
DIAGNOSTIC LOGIC
Cytologic atypical grading:
i =1 i W ia i
W(N/C, NA, ND, NS, CR)
1 - 5 : weight
a 1 - 5 : value of feature
: atypical grade
Atypical grade of sample:
Statistical - distribution of tLinear discrimination function
( + 1.0 -- 0.0 -- -1.0)Fig. 5. Weighting coefficients for diagnostic logic module.
CoRSE SCANiDr 15 11L 9 9 11 1 040 30 31 23 13 O 10 11
10 10 119239 3 44 38 31-2 14 11 19 9 13 24 36 46 52 49 40 29 19 11 109 10 17 29- 42 444-36- 21-- 13 - 109 10 2 8 J3 75 44 31 18 1 2 109 13 2- 37 49 55- 57- 54 43 -31- 1-9 13-119 14 26 40 50 56 58 45 38 23 14 10
12 18 31 42 -53 57 55 7- 39 -34--26. 13-
13 21 32 42 51 H 34 27 26 26 2716
I12 191 2 9 3 8 4 5-45 34 2 2 1 8
I I 15 2 m 23 31 2 9 1 7 20 1910 11 14 20 21 18 13- 11 -10 -10 -14---17 1710 9 11 12 13 11 11 10 10 10 11 13 139 10 10 9 10- 11 10 10 10-- 10- -- 11-- 10 10
10 8 9 9 13 11 9. 10 9 9 10 9 11
HISTOGRAM OF NDS0 0 0 04 24 13 117
148 93 ! 67 624%3 188 41 44j7 0 123 2931 43 44 410 0 0 0
9 1010 910 1011-- 13-10 1110- 9.-
9 911 11.
12 1113 - 1-314 1114 1111 1)10 1111 11
0 0 a_- -0 - -87 116 15 88 81 9063. 0 101 22 40.159 ---- -
130 0 101 47 141 88130 164 39- 143- 0 - 87 ---- ---- - --192 56 49 92 27 0
FSS.X. .Y. C N DEISr S-LVL PHAI -- -
322 626 30 14 55 54 9
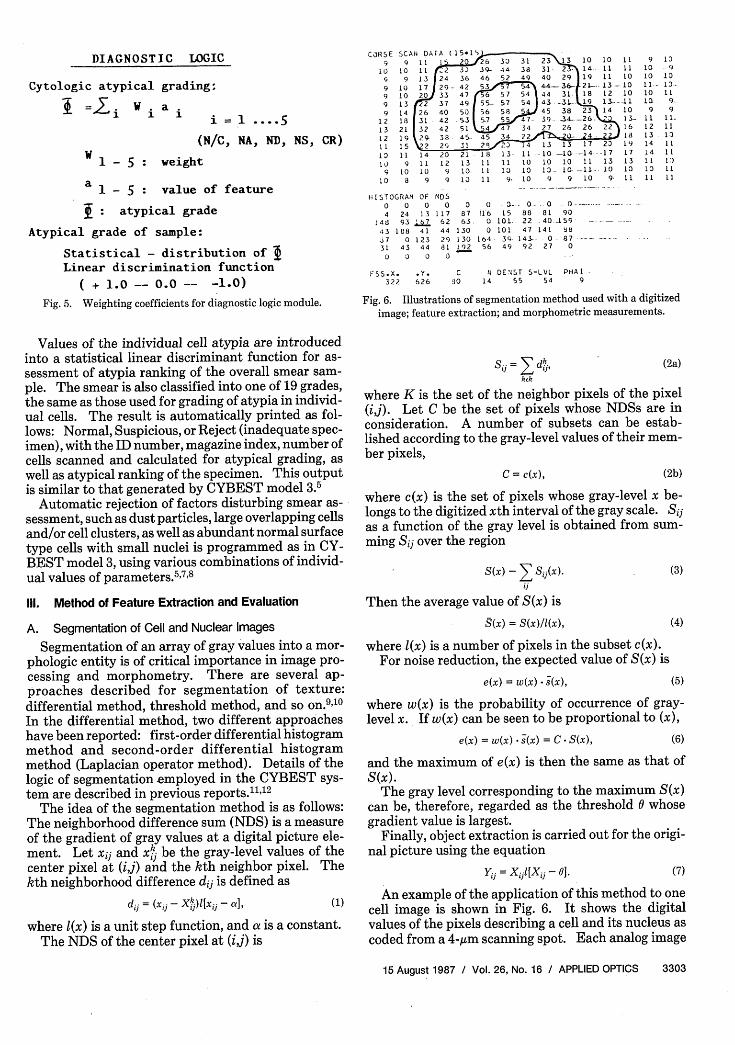
Fig. 6. Illustrations of segmentation method used with a digitized
image; feature extraction; and morphometric measurements.
Values of the individual cell atypia are introducedinto a statistical linear discriminant function for as-sessment of atypia ranking of the overall smear sam-ple. The smear is also classified into one of 19 grades,the same as those used for grading of atypia in individ-ual cells. The result is automatically printed as fol-lows: Normal, Suspicious, or Reject (inadequate spec-imen), with the ID number, magazine index, number ofcells scanned and calculated for atypical grading, aswell as atypical ranking of the specimen. This outputis similar to that generated by CYBEST model 3.5
Automatic rejection of factors disturbing smear as-sessment, such as dust particles, large overlapping cellsand/or cell clusters, as well as abundant normal surfacetype cells with small nuclei is programmed as in CY-BEST model 3, using various combinations of individ-ual values of parameters.57 8
111. Method of Feature Extraction and Evaluation
A. Segmentation of Cell and Nuclear Images
Segmentation of an array of gray values into a mor-phologic entity is of critical importance in image pro-cessing and morphometry. There are several ap-proaches described for segmentation of texture:differential method, threshold method, and so on.9 10
In the differential method, two different approacheshave been reported: first-order differential histogrammethod and second-order differential histogrammethod (Laplacian operator method). Details of thelogic of segmentation employed in the CYBEST sys-tem are described in previous reports.11"12
The idea of the segmentation method is as follows:The neighborhood difference sum (NDS) is a measureof the gradient of gray values at a digital picture ele-ment. Let xij and xik be the gray-level values of thecenter pixel at (ij) and the kth neighbor pixel. Thekth neighborhood difference dij is defined as
dij = (Xij -Xk)[Xij - a], (1)
where 1(x) is a unit step function, and a is a constant.The NDS of the center pixel at (ij) is
Sij = Eks,kfk
(2a)
where K is the set of the neighbor pixels of the pixel(ij). Let C be the set of pixels whose NDSs are inconsideration. A number of subsets can be estab-lished according to the gray-level values of their mem-ber pixels,
C = c(x), (2b)
where c(x) is the set of pixels whose gray-level x be-longs to the digitized xth interval of the gray scale. Si]as a function of the gray level is obtained from sum-ming Sij over the region
S(x) - E Sij(x).ii
Then the average value of S(x) is
3(x) = S(x)/I(x),
(3)
(4)
where 1(x) is a number of pixels in the subset c(x).For noise reduction, the expected value of S(x) is
e(x) = w(x) s(x), (5)
where w(x) is the probability of occurrence of gray-level x. If w(x) can be seen to be proportional to (x),
e(x) = w(x) -s(x) = C S(x), (6)
and the maximum of e(x) is then the same as that ofS(x).
The gray level corresponding to the maximum S(x)can be, therefore, regarded as the threshold 0 whosegradient value is largest.
Finally, object extraction is carried out for the origi-nal picture using the equation
Y = Xiil[Xii - 01. (7)
An example of the application of this method to onecell image is shown in Fig. 6. It shows the digitalvalues of the pixels describing a cell and its nucleus ascoded from a 4-,gm scanning spot. Each analog image
15 August 1987 / Vol. 26, No. 16 / APPLIED OPTICS 3303

DISTRIBUTION OF NUCLEAR DENSITY( 4 an/picture element )
Usual Histogra
Ii iii,10 20 30 40 SO
Density
--- C-LEVEL 18 N-LEVEL 42 ---- o - A.. - .. o - He - s - - - - w - @ - is - - - - - - . - - - - ^ - - - - - - - - - - - - ^ - 6 - - - - @ -
l - X t @ -l In @|;--- . Do l . l, @ @* ! _ .... , .......... z. .............
' .::'::'::',"::::. .;: '_ _
....... ................. . .................. ._, . @ I, l*-- *- .. --.- |:.| :.
.. ........... ..........
.. .................... .
* X ,, .,,"::::,::::::::::':':._ | | a, i x
Second Order Differential Histogram
1 I 1 I 1 1 I I III11
............................ ........................... x
............... ,..,,....*... , r@..............@,,.,,..,..@.
I
-.....-............... . l |
_ Lo .¢l.@* ................................ 6|.X. - . I,. | 4 4 |. , |##§ ;4.--.i,,@- | . ...... l A||.....
z#t-.- .. *||*- ...... | e§ * t
A, ,..,...."--__ .
,, ,e-e @ 4 s I
A... @@......e.* *-..|@.@.. .... ,l I
: . ^www__.,,,,,,t,, I
i U , ..... Zs_,*...,@, I. : t | I .. ,..,___..,,, |* LL Ho, . I
0@ 2, 6 ,,,,.,,_.,,,,,,,, L| a- ............ . tlu*�X -§ 1
@ @ ... ...... 1s41.|@ ............. a__ | | *.-@04@§sl I. 4s,,, T
* ' ' , ' __. I_
, . .-. IA..._@_.- ...... _ _ __ .... ; _ . _ .. ____._
30 40 50
Fig. 7. Histogram of nuclear optical densities.
density was divided into 64 gray steps (0 = white, 63 =black).
Figure 7 shows the histogram of the pixel opticaldensities. 1 The upper graph presents the histogramanalyzed by the usual (first-order) differential meth-od. It is not possible to obtain from this figure the areaof depression that defines the threshold values for thecell border and nuclear rim, since only one peak ispresent near gray values 13 and 14. The lower graph ofFig. 7 uses the second-order differential method andshows modal expected values of average differentialnear levels 17 and 40. This indicates that these can beused as the threshold value of the cytoplasm and thenucleus, respectively, to differentiate them from thebackground. The threshold value of the cytoplasmwas selected from the histogram from density levels 15to 29 (maximum '17), and the threshold value of thenucleus was chosen from density of 30 to 5 (maximumpeak around 40).11
The lower chart in Fig. 6 represents the NDS histo-gram for the image. The maximum value betweengray values 15 and 29 is 167 (at gray value 23). In theupper digitized figure, the pixels with a gray value closeto 23 are enclosed by a line that indicates the cellmargin. In the same way, from the histogram in Fig. 6,the maximum value between gray values 30 and 50 is192, which corresponds to gray value 55. In the digi-tized feature, pixels near 55 are enclosed by a lineindicating the nuclear rim. By totaling the number ofpixels within each frame, the areas of cytoplasm andnucleus can be measured. Thus, the N/C ratio can beautomatically calculated. The sum of all gray valueswithin the nuclear frame is divided by the number ofnuclear pixels to derive the mean nuclear optical densi-ty.
The above-mentioned differential histogram andthreshold method were applied also to a digitized im-age acquired by fine scanning (Fig. 8, with resolution of1 gm/pixel), and the result is shown in Fig. 711 Thescanning region of the image is 51 X 51 picture ele-ments, which is -1/4 of the image scanned with the 4-gim/picture element of Fig. 6. The threshold values of
Pattern of the Cell Fig 1. Segmented by DifferentialHistogram (1 jm/picture elememt)
Fig. 8. Fine-scan image display with 1,um/pixel.
the cytoplasm and the nucleus were 18 and 42, respec-tively, and although these values are one to two levelshigher than that of the 4-gum scanning spot, it can besaid that detection of finely contrasting areas of lightand dark is rather excellent.
By this technology, cell size, nuclear size, N/C ratio,and nuclear optical density can be measured rapidly.
B. Evaluation of Nuclear Shape
The principle of the method for evaluation of nucle-ar shape (i.e., measure of the irregularity grading of thenuclear shape) is that the length of the nuclear rim isshorter for round (regular) nuclei than for irregularnuclei with the same nuclear area, as shown below:
1 = 2 ns(s = nuclear shape), f = L/2 ns, SIL.
Thus, nuclear shape can be indicated as numericalvalues.
C. Evaluation of Intranuclear Configuration
Intranuclear configuration refers to the chromatinpattern; i.e., clumping of the chromatin granules. Asdescribed in Fig. 9, chromatin pattern is shown as thenumber of blocks.
D. Cytomorphometric Display System
Besides the routine automated screening practice,CYBEST model 4 has additional useful functions suchas a bar-code reader, which reads the individual speci-men identification number and sequential magazineindex. In addition, morphometric data can be dis-played numerically on the CRT and/or in print. Theimage of any cell detected in the optical field of theincorporated microscope can be transferred into theCRT by switching the light direction and illuminationlamp from the optical microscope to the video system.When an operator uses a light pen to point to a targetcell on the CRT monitor, the system displays the mor-phometric measurement data, such as cell and nuclear
3304 APPLIED OPTICS / Vol. 26, No. 16 / 15 August 1987
,III
t 50
I
-400' .
-
,, , 300f-
g200 -
5 100
X o _O
II!0 10 17 20
Dens i ty
..... . . .. . .--l'..... .......
; .......|.; ....; 1
A~ ~~~~~... . ._ .A' _ .. .. _.

CYBEST 10 MOST MALIGNANT CELL REVIEW
SHEAR ID = 123456001 DATE 82/02/05
PRESCREENING RESULT SUSPICIOUS RANK = 1.0
MAX ------ 7'
.I2
3l ~ 4
mlII-LU-
EVALUATION OF CHROMATIN FEATURE
1. Number of chromatin2. Mean area of chromatin
Fig. 9. Chromatin pattern feature extraction.
Fig. 10. Light-pen system: display of morphometric data andatypical grading on CRT monitor screen.
size, N/C ratio, cytoplasmic and nuclear optical ab-sorption, cell and nuclear shape and intranuclear con-figuration (block number), atypia grade ranking, andcytological assessment (normal or suspicious) in addi-tion to the cell image, as shown in Fig. 10. The data are
CELL-NO. POSITION
STAGE TV
X Y X
1 1000 1000 99
2 1001 1001 98
3 1002 1002 97
4 1003 1003 96
6 1004 1004 95
6 1005 1005 94
7 1006 1006 93
8 1007 1007 92
9 1008 1008 91
10 1009 1009 90
CELL DATA
NA CA N/C ND CD SHAPE CTGRY CHRO
r99
98
97
96
95
94
93
92
91
90
132 218 0.60 33 17 15.0 33
199 455 0.43 38 13 17.0 33
113 260 0.43 36 14 19.0 33
174 422 0.41 41 16 19.0 33
112 271 0.41 43 14 22.0 33
284 775 0.36 31 13 17.0 31
294 875 0.33 32 14 18.0 31
184 675 0.27 33 12 16.0 31
120 0 0.00 30 15 14.0 31
79 0 0.00 34 16 13.0 31
14
1 3
12
1 1
10
9
7
6
5s
CELL FORWARD / BACKWARD / EXIT (FB,E) ? E
Fig.11. Ten-cell system recalls 10 atypia cells in the order from thehighest atypical rank down.
CYBEST CELL JUDGE (LIGHT PEN)
SLIDE-NO 10 CELL-NO 1
STAGE ( X=1000 T=1000 Z-1000) 1
TV ( X=100 Y-100)
JUDGE NORMAL( 22 ) I
(1) BACK GROUND DENSITY = 6 I
(2) CYTOPLASMIC DENSITY - 18
(3) NUCLEAR DENSITY - 40 1
(4) CYTOPLASMIC AREA = 500 1
(5) NUCLEAR AREA - 64 I..........
(6) NA/CA RATIO = 0.13
17) NUCLEAR SHAPE - 14.0 1
(8) CHROMATIN = 3 I
I -HCE C LA.................
(-*NUCLEUS .=CYTOPLASMA ............--
Fig. 12. Printout from the floppy disk.
obtainable in a hardcopy format and can also be savedon a floppy disk.
IV. Review of 1 0-Cell System
After completion of screening, we can invoke the 10-cell system. Ten cells can be called out automaticallyinto the microscopic optical field or CRT monitor inthe order of highest atypical rank. All the measure-ment data and atypical grades, as well as the finalassessment (normal or suspicious) are displayed andare also on a printout (Fig. 11). This program, usedwith the morphometric display system, is especiallyvaluable for confirmation of the machine assessmentby direct visual observation. By connection with asmall business computer, the data are transferred to afloppy disk and can be retrieved at any time (Fig. 12).
V. Preliminary Field Test Data
A preliminary field test was carried out using 100cases, half of which were cytologically malignant.They were satisfactory smears with a sufficient num-ber of cells, with good. cell dispersion, and with nodoubt as to benign or malignant classification by man-ual observation. The data are shown in Table I. Thesame data set was tested in two separate trials; the falsenegative rate was 0% in each. The false positive ratewas 28% and 27% in the first and second trials, respec-tively. These results satisfied our initial goal for sensi-
15 August 1987 / Vol. 26, No. 16 / APPLIED OPTICS 3305
Us ; f s
ii

Table I. Field Test of CYBEST model 4 (CYB 200)
False (-) False (+)
First trial 0/50 (0%) 12/42 (28%)Second 0/50 (0%) 11/40 (27%)
ATP rank 0.0 0% 8/42 (19%)as nonmalig. 5/42 (12%)
Table II. CYBEST model 4: Feld Test
CYBEST M-4Samples \Normal Suspicious Reject Total
Normal 441 174 9 624(27.9%)
Suspicious 4 137 0 141& malignant (2.8%)No counta 22 0 0 22Total 467 311 9 787
a No count: very few atypical cells <0.01%.
tivity and specificity. When the atypical rank 0 wascategorized as normal, the false positive rate convertedto 19% and 12% for the first and second trials, respec-tively (Table I). However, we have no intention ofchanging the provided program, since reliable sensitiv-ity must be maintained. An experimental practicalfield test was also tried using 787 samples (624 nonma-lignant cases, and 141 malignant and suspicious ordysplastic cases). False positive cases were 174(27.9%), and nine cases were rejected. There were fourfalse negative cases (2.8%), none of which showed defi-nite malignancy. Twenty-two nonmalignant caseswere omitted from statistical evaluation, because theyhad a very few (<5) atypical cells in the smear speci-mens. The data are shown in Table II.
We are currently performing experimental masspopulation screening on more than 10,000 specimensand comparing the data with manual cytological as-sessment of the machine-processed smear specimens.All these specimens were made by the automated celldispersion and monolayer smearing system of the CY-BEST CDMS model 2 (Fig. 13) instrument, which wasmodified from the prototype'3 developed in 1981, andwhich will be described in another paper.
VI. Discussion and Summary
Automation for cancer cytology using pattern recog-nition technology has been studied by various researchgroups.'4' 9 From our research of more than 16 yr forthe development of an automated cytologic screeningsystem for uterine cancer, the CYBEST model 4 hasresulted. This instrument approaches practical appli-cation for mass population cytologic screening. It hasthe size of a business desk and consists of an easy-to-operate system. It contains four slide magazines, eachholding 50 smear slides. The system can process 200samples sequentially in a single operation, requiringabout three minutes per specimen. Therefore, in -10h, 200 samples can be screened. These functional
Fig. 13. Automated cell dispersion and monolayer smearing ma-chine using autosyringing.
specifications are essentially the same as those of Mod-el 3.5
The technical aspects of cytological image detectionusing a segmentation method and a morphometric pro-cedure and the logic of cytological assessment havebeen reported previously.- 9 1",12 Recent remarkableadvances in automated equipment for clinical labora-tories have affected laboratory work around the world.Most of those advances take the form of robot ma-chines, which substitute for human hands. They arenot capable of assessment or thinking.
Indeed, cytology automation is a real application foran automated system that has a function of assessmentbased on the image data accumulated by the system(i.e., artificial intelligence or cybernetics). There arestill problems to be solved, both in software and hard-ware, for improvement of the CYBEST system.20
The authors are indebted to Norman J. Pressman,Research Scientist, Central Research & DevelopmentDepartment, E. I. du Pont de Nemours & Company,Inc., Wilmington, DE, for his contributions to thispaper.
The material in this paper was presented in part asthe Maurice Goldblatt Award Memorial Lecture at theNinth Congress of the International Academy of Cy-tology, 26-29 May 1986, Brussels, Belgium.
This research was supported in part by a grant fromthe Committee on Cytology Automation for Cancer,and the Project Research Foundation of StrategyAgainst Cancer, sponsored by the Ministry of Healthand Welfare, Japan.
References1. N. Tanaka et al., "Fundamental Study for Approaching the
Automation of Cytological Diagnosis of Cancer and a New Auto-mated Apparatus," Jpn. J. Clin. Pathol. 22, 757 (1973), in Japa-nese.
2. N. Tanaka, H. Ikeda, T. Ueno, Y. Imasato, S. Watanabe, and R.Kashida, "Fundamental Study of Automatic Cytologic Cyto-screening for Uterine Cancer. I: Feature Evaluation for Pat-tern Recognition System," Acta Cytol. 21, 72 (1977).
3306 APPLIED OPTICS / Vol. 26, No. 16 / 15 August 1987
AM-i Lj

3. A. Mukawa, N. Tanaka, H. Ikeda, and T. Ueno, "A Practical
Evaluation of the CYBEST in the Use of Mass-Screening on
Epidermoid Carcinoma of the Uterine Cervix," in The Automa-
tion of Cancer Cytology and Cell Image Analysis, N. J. Press-man and G. L. Wied, Eds. (Tutorials of Cytology, Chicago, 1979),
pp. 193-199.4. N. Tanaka, H. Ikeda, T. Ueno, A. Mukawa, and K. Kamitsuma,
"Field Test and Experimental Use of CYBEST model 2 for
Practical Gynecological Mass Screening," Anal. Quant. Cytol.1,
122 (1979).5. N. Tanaka et al., "CYBEST Model 3: Automated Cytologic
Screening System for Uterine Cancer Utilizing Image Analysis
Processing," Anal. Quant. Cytol. 4, 279 (1982).
6. N. Tanaka, H. Ikeda, T. Ueno, S. Watanabe, Y. Imasato, and R.
Kashida, "Fundamental Study of Automatic Cytoscreening for
Uterine Cancer. III: New System of Automated Apparatus
CYBEST Utilizing the Pattern Recognition System," Acta Cy-
tol. 21, 85 (1977).7. N. Tanaka, H. Ikeda, T. Ueno, S. Watanabe, Y. Imasato, and S.
Tsunekawa, "Fundamental Study of Automatic Cytoscreeningfor Uterine Cancer. IV: Sampling Requirements for CYBEST
and Simulation Test of Cell Dispersion," Acta Cytol. 21, 531
(1977).8. N. Tanaka, H. Ikeda, T. Ueno, S. Watanabe, Y. Imasato, and R.
Kashida, "Fundamental Study of Automatic Cytoscreening forUterine Cancer. V: Data Analysis for Improvement of CY-
BEST," Acta Cytol. 21, 536 (1977).
9. S. Watanabe, H. Numagami, T. Yoneyama, and H. Genchi, "A
Method for Objective Extraction of Cell Images," in Proceed-
ings, National Conference of IECE, Tokyo (1972), p. 102 (in
Japanese).10. J. S. Waszka, R. N. Nagel, and A. Rosenfeld, A technique for
Facilitation Threshold Selection for Objective ExtractionFrom Digital Picture, TR-243 (U. Maryland Computer ScienceCenter, May 1973).
11. N. Tanaka, H. Ikeda, T. Ueno, Y. Imasato, and S. Watanabe,
"Fundamental Study of Automatic Cytoscreening for Uterine
Cancer. II: Segmentation of Cells and Computer Simulation,"
Acta Cytol. 21, 79 (1977).
12. S. Watanabe, Y. Imasato, H. Genchi, N. Tanaka, and R. Ka-
shida, "A PAP Smear Prescreening System: CYBEST," in
Digital Processing of Biomedical Images, K. Preston, Jr. and M.Onoe, Eds. (Plenum, New York, 1976), pp. 227-241.
13. R. C. Bostrom, H. S. Sawyer, and W. E. Tolles, "Instrumentation
for Automatically Prescreening Cytological Smears," Proc. IRE
47, 1895 (1959).14. J. M. S. Prewitt and M. L. Mendelsohn, "The Analysis of Cell
Images," Ann. N.Y. Acad. Sci. 128, 1035 (1966).
15. G. L. Wied, P. H. Bartels, G. F. Bahr, and D. G. Oldfield,
"Taxonomic Intra-Cellular Analytic System (TICAS) for Cell
Identification," Acta Cytol. 12, 180 (1968).
16. A. Rosenfeld, Picture Processing by Computer (Academic, New
York, 1969).17. G. L. Wied, M. Bibbo, G. F. Bahr, and P. H. Bartels, "Computer-
ized Micro-Dissection of Cellular Image," Acta Cytol. 14, 418
(1970).18. G. L. Wied and G. F. Bahr, Eds., "Automated Cytology. A
Symposium by Correspondence," Acta Cytol. 15, 1, 87, 422
(1971).19. G. L. Wied, G. F. Bahr, and P. H. Bartels, Eds., The Automation
of Uterine Cancer Cytology (Tutorials of Cytology, Chicago,
1976).20. N. J. Pressman and G. L. Wied, Eds., The Automation of Cancer
Cytology and Cell Image Analysis (Tutorials of Cytology, Chi-cago, 1979).
.
MEMBER SOCIETIES
The American Physical SocietyOptical Society of AmericaAcoustical Society of AmericaThe Society of RheologyAmerican Association of Physics TeachersAmerican Crystallographic AssociationAmerican Astronomical SocietyAmerican Association of Physicists in MedicineAmerican Vacuum SocietyAmerican Geophysical Union
AFFILIATED SOCIETIESAmerican Institute of Aeronautics and AstronauticsAmerican Meteorological SocietyAmerican Nuclear SocietvAmerican Society for MetalsDivision of Physical Chemistry of ACSElectron Microscopy Society of AmericaEngineering Information, Inc.The Geological Society of AmericaInstrument Society of AmericaInternational Association of Mathematical PhysicsMaterials Research SocietyNuclear and Plasma Sciences Society of IEEEThe Philosophical Society of WashingtonPhysics Club of ChicagoPhysics Club of MilwaukeePhysics Club of RichmondPhysics Section of AAASSociety for Applied SpectroscopySociety of Photo-optical
Instrumentation Engineers
GOVERNING BOARD 1987-1988Hans Frauenfelder, Chairman Herwig KogelnikOrson L. Anderson James A. KrumhanslHenry H. Barschall Arlo U. LandoltRobert S. Bauer David LazarusPeter M. Bell Harry LustigRobert T. Beyer James S. MurdayPeter B. Boyce James A. PurdyRobert Beck Clark Jarus W. QuinnEsther M. Conwell Robert ResnickWilliam L. Duax Joseph M. ReynoldsFrederick H. Fisher Edward N. SickafusVal L. Fitch F. Dow SmithKenneth W. Ford-ex officio A. F. Spilhaus, Jr.Judy R. Franz Murray StrasbergRoderick M. Grant-ex officio Nagalingam SuntharalingamRobert G. Greenler Martin WaltWilliam W. Havens, Jr. Jack M. WilsonDonald F. Holcomb Kurt F. WissbrunMary K. Hudson
15 August 1987 / Vol. 26, No. 16 / APPLIED OPTICS 3307