automatic detection of larynx cancer from contrast ... · automatic detection of larynx cancer from...
TRANSCRIPT

Automatic detection of larynx cancer from contrast-enhanced
magnetic resonance images
Trushali Doshi*a, John Soraghan
a, Derek Grose
b, Kenneth MacKenzie
b, Lykourgos Petropoulakis
a
aDepartment of Electronic & Electrical Engineering, University of Strathclyde, Glasgow, UK;
bBeatson Oncology Centre and Royal Infirmary, NHS Greater Glasgow and Clyde, Glasgow, UK
ABSTRACT
Detection of larynx cancer from medical imaging is important for the quantification and for the definition of target
volumes in radiotherapy treatment planning (RTP). Magnetic resonance imaging (MRI) is being increasingly used in
RTP due to its high resolution and excellent soft tissue contrast. Manually detecting larynx cancer from sequential MRI
is time consuming and subjective. The large diversity of cancer in terms of geometry, non-distinct boundaries combined
with the presence of normal anatomical regions close to the cancer regions necessitates the development of automatic
and robust algorithms for this task. A new automatic algorithm for the detection of larynx cancer from 2D gadolinium-
enhanced T1-weighted (T1+Gd) MRI to assist clinicians in RTP is presented. The algorithm employs edge detection
using spatial neighborhood information of pixels and incorporates this information in a fuzzy c-means clustering process
to robustly separate different tissues types. Furthermore, it utilizes the information of the expected cancerous location for
cancer regions labeling. Comparison of this automatic detection system with manual clinical detection on real T1+Gd
axial MRI slices of 2 patients (24 MRI slices) with visible larynx cancer yields an average dice similarity coefficient of
0.78±0.04 and average root mean square error of 1.82±0.28 mm. Preliminary results show that this fully automatic
system can assist clinicians in RTP by obtaining quantifiable and non-subjective repeatable detection results in a
particular time-efficient and unbiased fashion.
Keywords: Automatic detection, contrast-enhanced MRI, edge detection in spatial fuzzy c-means clustering, head and
neck cancer, larynx cancer, radiotherapy treatment planning, throat detection
1. INTRODUCTION
Larynx cancer or cancer of the voice box is one of the common sites of the cancer in the head and neck region. Organ
preservation strategies such as radiation therapy and/or chemotherapy are the treatment of choice for the patients with
locally advanced laryngeal tumours1. Cross sectional imaging with magnetic resonance imaging (MRI), computed
tomography (CT) allows assessment of the larynx and other anatomical structures relevant to the tumour. It also provides
a means of explaining the typical patterns of tumour spread2. Detection of laryngeal cancer from cross-sectional imaging
is a fundamental task for staging, optimizing radiation dose and for further quantification of cancerous regions. Manually
detecting or outlining of the cancer from complex anatomical regions such as the larynx from a number of sequential
medical images is time consuming and therefore expensive. Furthermore, it has been shown that the manual procedure
results in significant inter- and intra-observer variations for gross tumour delineation3. Consequently, the development of
an automatic system to detect laryngeal cancer from medical imaging which can assist clinicians to obtain more accurate,
quantifiable and repeatable outcomes is highly desirable.
Positron emission tomography (PET), CT and co-registered PET/CT images have been used to automatically or
semi-automatically segment primary head and neck cancer. Nine PET image segmentation techniques for laryngeal
cancer were compared by Zaidi et al.4. This comparison validated that cancer segmentation obtained using spatial
wavelet-based fuzzy c-means clustering (FCM-SW) technique was more accurate when compared to the cancer
specimens acquired after surgery. FCM-SW integrates PET wavelet transformed image as a regularization term in the
standard FCM5 to take into consideration tumour heterogeneity. Semi-automatic head and neck cancer volume analysis
from CT was performed by Street et al.6. This system takes an input bounding box around the cancer region and uses a
multistage level set (MLS) to determine the final contours. Yu et al7 performed a quantitative texture analysis of co-
registered PET/CT images to differentiate tumour and normal tissues.
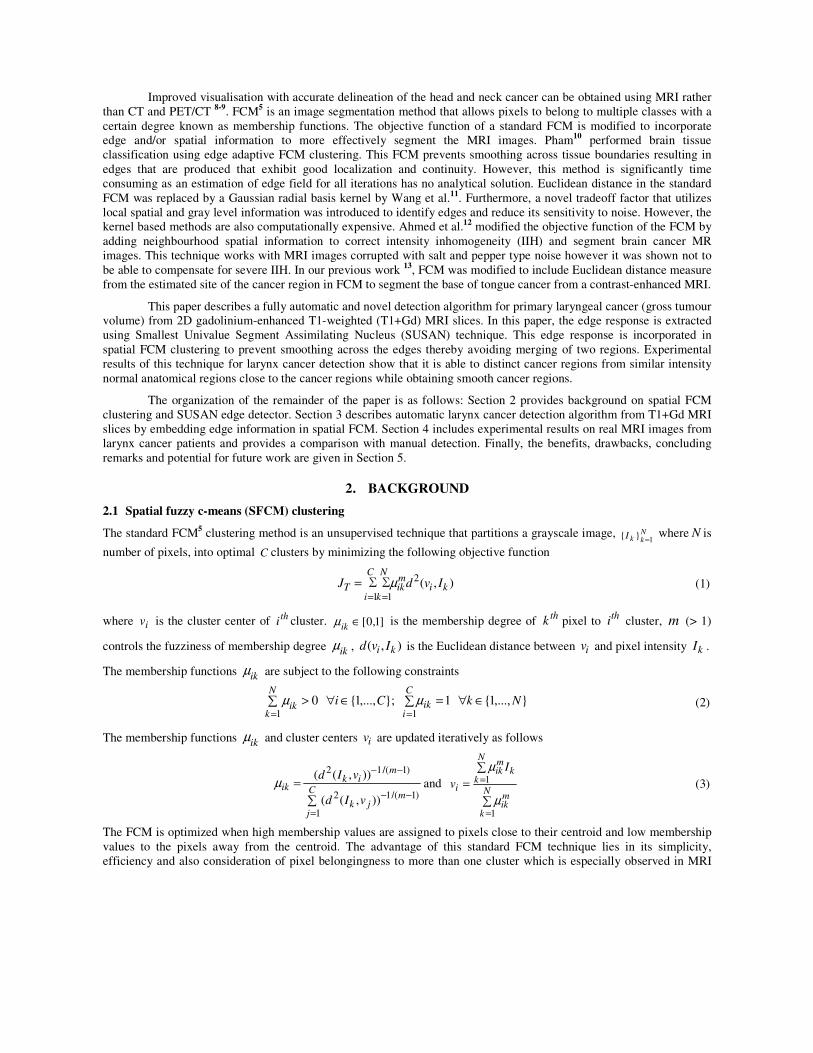
Improved visualisation with accurate delineation of the head and neck cancer can be obtained using MRI rather
than CT and PET/CT 8-9
. FCM5 is an image segmentation method that allows pixels to belong to multiple classes with a
certain degree known as membership functions. The objective function of a standard FCM is modified to incorporate
edge and/or spatial information to more effectively segment the MRI images. Pham10
performed brain tissue
classification using edge adaptive FCM clustering. This FCM prevents smoothing across tissue boundaries resulting in
edges that are produced that exhibit good localization and continuity. However, this method is significantly time
consuming as an estimation of edge field for all iterations has no analytical solution. Euclidean distance in the standard
FCM was replaced by a Gaussian radial basis kernel by Wang et al.11
. Furthermore, a novel tradeoff factor that utilizes
local spatial and gray level information was introduced to identify edges and reduce its sensitivity to noise. However, the
kernel based methods are also computationally expensive. Ahmed et al.12 modified the objective function of the FCM by
adding neighbourhood spatial information to correct intensity inhomogeneity (IIH) and segment brain cancer MR
images. This technique works with MRI images corrupted with salt and pepper type noise however it was shown not to
be able to compensate for severe IIH. In our previous work 13
, FCM was modified to include Euclidean distance measure
from the estimated site of the cancer region in FCM to segment the base of tongue cancer from a contrast-enhanced MRI.
This paper describes a fully automatic and novel detection algorithm for primary laryngeal cancer (gross tumour
volume) from 2D gadolinium-enhanced T1-weighted (T1+Gd) MRI slices. In this paper, the edge response is extracted
using Smallest Univalue Segment Assimilating Nucleus (SUSAN) technique. This edge response is incorporated in
spatial FCM clustering to prevent smoothing across the edges thereby avoiding merging of two regions. Experimental
results of this technique for larynx cancer detection show that it is able to distinct cancer regions from similar intensity
normal anatomical regions close to the cancer regions while obtaining smooth cancer regions.
The organization of the remainder of the paper is as follows: Section 2 provides background on spatial FCM
clustering and SUSAN edge detector. Section 3 describes automatic larynx cancer detection algorithm from T1+Gd MRI
slices by embedding edge information in spatial FCM. Section 4 includes experimental results on real MRI images from
larynx cancer patients and provides a comparison with manual detection. Finally, the benefits, drawbacks, concluding
remarks and potential for future work are given in Section 5.
2. BACKGROUND
2.1 Spatial fuzzy c-means (SFCM) clustering
The standard FCM5 clustering method is an unsupervised technique that partitions a grayscale image, N
kkI1
}{=
where N is
number of pixels, into optimal C clusters by minimizing the following objective function
∑∑ ),(1 1
2C
i
N
kki
mikT IvdJ
= =
= µ (1)
where iv is the cluster center of thi cluster. ]1,0[∈
ikµ is the membership degree of
thk pixel to
thi cluster, m (> 1)
controls the fuzziness of membership degree ikµ , ),( ki Ivd is the Euclidean distance between iv
and pixel intensity kI .
The membership functions ikµ are subject to the following constraints
};,...,1{01
CiN
kik ∈∀>∑
=
µ },...,1{11
NkC
iik ∈∀=∑
=
µ (2)
The membership functions ikµ and cluster centers iv are updated iteratively as follows
∑
=
=
−−
−−
C
j
mjk
mik
ik
vId
vId
1
)1/(12
)1/(12
)),((
)),((µ and
∑
∑=
=
=
N
k
mik
N
kk
mik
i
I
v
1
1
µ
µ
(3)
The FCM is optimized when high membership values are assigned to pixels close to their centroid and low membership
values to the pixels away from the centroid. The advantage of this standard FCM technique lies in its simplicity,
efficiency and also consideration of pixel belongingness to more than one cluster which is especially observed in MRI

images. However, in this technique, the membership function is dependent solely on the distance between the individual
pixel and cluster center, thus it is sensitive to noise14
.
In order to reduce its sensitivity to noise and subsequently to produce homogenous regions, the standard FCM
algorithm was modified to incorporate local spatial information directly into fuzzy membership functions by Chuang14
as
∑
=
=
C
1j
qjk
pjk
qik
pik'
ik
h
h
µ
µµ
(4)
where p and q are the control parameters. The spatial function ikh is used to compensate the membership value of noisy
pixel by adding membership values of its neighboring pixel and is defined as
∑= ∈Wnl ilikh µ (5)
where nW is the local window centered at pixel k . In this method, the membership of the pixels near the edges is also
compensated and thus, incorrect cluster labels may be assigned to the pixels near the edges leading to incorrect edges.
2.2 SUSAN edge detection
The Smallest Univalue Segment Assimilating Nucleus (SUSAN) algorithm proposed by Smith et al.15
may be used to
obtain the edge image from the grayscale image. For edge detection, the SUSAN method considers a circular
neighbourhood around each pixel in the image. The pixels from the neighbourhood whose brightness are approximately
the same as the brightness of the center pixel (nucleus) (Fig. 1(a)) form the area. This area is called the USAN (Univalue
Segment Assimilating Nucleus). The value of this USAN area determines if the pixel belongs to the edge or not. The
smaller value of USAN area gives larger edge response15
.
The brightness of the neighbourhood pixels to the nucleus (center pixel of the circular mask) is considered using
the following 6
)()(
),(
−−
=T
rIrI
o
o
errc (6)
where or is the position of the center pixel, r is the position of any pixel in the circular mask, (.)I represents intensity of
the pixel and T is intensity difference threshold. The parameter T denotes the smallest contrast for detecting edges and is
decided based on maximum amount of noise in the image15
. The power of exponential in (6) controls the shape of
intensity comparison function (Fig. 1(b)). The power of 6 in (6) is chosen to reduce false negatives and positives in edge
detection15
.
The USAN area is computed as
∑=r
oo rrcrn ),()( (7)
The edge image is then created as follows
<−
=otherwise
g)r(nif)r(ng)r(E o
odg 00 (8)
where g is set to 43 /nmax ,where maxn represents the maximum area of circular mask, for optimal noise rejection15
.
(a) (b)
Fig.1 (a) SUSAN edge detection (b) The intensity comparison function (x - axis – intensity difference T ), exponential
power controls the shape of the function (power: Inf – square function, power: 6 – Gaussian type function)
power: Inf
power: 6

Characteristics of SUSAN method such as better edge localization, less sensitive to scale of the operator, robust
to noise, single response to edge points makes it very useful for edge detection16
.
3. AUTOMATIC LARYNX CANCER DETECTION ALGORITHM
The proposed automatic larynx cancer detection algorithm comprises three steps i) pre-processing of the MRI slices to
reduce data size and contrast enhancement ii) detection of the suspected cancer regions cluster by SFCM with edge
information clustering and iii) refining the detected cluster using morphological filtering and knowledge of the expected
cancer positions.
3.1 Pre-processing: Data size reduction and contrast enhancement
A typical T1+Gd MRI image with larynx cancer is shown in Fig. 2(a). It is observed that the cancer regions, due to
gadolinium contrast agent, appears bright (have high intensity values) compared to the most of the healthy regions. The
data size of the MRI image is reduced automatically by cropping the region of interest (ROI) using our technique
described in13
. A reduced data size reduces the computational time and complexity of the algorithm. The detected ROI
regions usually have low contrast (intensity difference) between different regions. The contrast between different regions
may be enhanced using a background brightness preserving histogram equalization (BBPHE) technique17
. In BBPHE,
the image is decomposed into sub-images based on background and non-background levels. The histogram of each sub-
image is equalized independently and then combined into the final output image. This technique improves contrast while
preserving background brightness. In this work, ROI was divided into two sub-images based on first local minima of
ROI histogram. Fig. 2(b) shows ROI with improved contrast between different non-background regions while the background region is not enhanced.
3.2 SFCM clustering with edge information
The cluster with suspected cancer regions is obtained using SFCM clustering with edge information from pre-processed
ROI. In this, the edge response obtained from (8) is added to the objective function of standard FCM as
∑∑∑∑
1 1
2
1 1
2C
i
N
kdg
mik
C
i
N
kki
mikST )k,i(E)I,v(dJ
= == =
+= µµ (9)
The purpose of adding )k,i(Edg to the objective function is to assign low membership value to the pixels near the edges
of the regions which can subsequently separate different regions even if they are close to each other.
STJ in (9) can be minimized under the same constraint of ikµ as in (2). Consequently a membership functions ik
µ is a
local minimum only if the following conditions are satisfied
∑ +
+=
=
−−
−−
C
j
)m/(dgjk
)m/(dgik
ik
))k,i(E)v,I(d(
))k,i(E)v,I(d(
1
12
12
µ and
∑
∑
=
=
=
N
k
mik
N
kk
mik
i
I
v
1
1
µ
µ
(10)
Furthermore, ikµ in (10) is updated using (4) to reduce noisy pixels. Due to edge information in SFCM, fine details such
as edges are preserved while homogenous but noisy regions generate smooth clusters.
Using this SFCM with edge information, contrast-enhanced ROI is divided into five clusters (Fig. 3(a)) based
on number of tissue types (fatty tissues, cancer tissues, larynx tissues, muscles) and background present in the ROI.
(a) (b)
Fig. 2 (a) Typical MRI slice with larynx cancer region (b) pre-processed ROI (contrast enhancement can be observed)
Throat
region Cancer
region
Healthy
region

Utilizing the knowledge that gadolinium-enhanced cancer pixels occupy the higher end of T1-histogram2; cluster with
highest cluster center value (Fig. 3(a)) )C( ent is selected as the cluster with suspected cancer regions. Fig. 3(b) shows
the selected cluster.
3.3 Post-processing steps
The false positives are reduced using morphological open operation18
with a disk shape structuring element. This
operation removes small regions from the detected cluster.
SFCM with edge information divide image into different clusters based on intensity and edge information. If
different tissues have same or overlapping gray-level (intensity) distribution (e.g. larynx tissues and larynx cancer
tissues), this method fail to separate them into different clusters. Therefore, additional information about spatial location
of expected cancerous regions is utilized. It has been observed, that cancerous regions are close to the throat regions. Thus, the throat region is detected using our method that was described in 13. In this method a Hessian matrix of each low
intensity pixels is calculated and Eigen values of this matrix are analyzed for the pixels of the throat region. The region
with largest repeated eigenvalues is chosen as the throat region. An example of detected throat region is demonstrated in
Fig. 4(a). The regions close to the throat region are classified as the cancer regions. Fig. 4(b) shows the detected cancer
region. The boundary of the cancer regions is obtained using Canny edge detector. Fig. 4(c) exhibits the edge of the
detected cancer region on original MRI slice.
4. EXPERIMENTAL RESULTS
4.1 Real MRI dataset
MRI slices of 2 patients with laryngeal cancer were obtained before any treatment such as surgery or radiotherapy using
1.5Tesla MRI scanner from Beatson Oncology Centre, Gartnavel Hospital, Glasgow, of resolution 384x384. The slices
were obtained as contiguous axial T1-weighted scans with TE/TR = 20/750, slice thickness = 3mm, spacing in between
slices = 3.3mm after intravenous injection of 0.1ml/kg of gadolinium. Only cancer containing T1+Gd MRI slices from
these two patients were selected to validate the proposed algorithm. Thus, the algorithm was tested on 24 (17 from
Patient1 and 7 from Patient2) axial T1+Gd MRI slices. Some typical T1+Gd MRI slices used to validate the algorithm
are shown in Fig. 5. Each MRI slice is processed separately using the proposed algorithm.
(a)
(b)
Fig. 3 (a) Five clusters of ROI with cluster center values (b) cluster with suspected cancer regions
(a) (b) (c)
Fig. 4 (a) Detected throat region (red region) (b) detected cancer region (c) boundary of cancer region (red boundary) on
original MRI slice.

Fig. 5: Few typical T1+Gd MRI slices used to validate the algorithm
4.2 Manual detection procedure
The results of this automatic method were compared to the results obtained from conventional manual approach. To
obtain manual results one clinician mouse traced the cancer regions on all 24 axial MRI slices using built–in Matlab
GUI. The clinician was provided with no prior information on patients either clinical or radiological. The clinician has
expertise in upper gastrointestinal radiotherapy.
4.2.1 Evaluation parameters
In order to evaluate automatic detection results in terms of accuracy and robustness against the manual results, two
quantitative measures were used.
i) Region based evaluation Here, dice similarity co-efficient
19 (DSC) which shows spatial region agreement between two binary images was used as
a region based evaluation metric. The DSC is defined as
BA
BABADSC
+
∩=
)(2),( (11)
where A represents the cancer region obtained from manual outline and B , the cancer region obtained from automatic
outline, ∩ represents the intersection of two regions, and BA + represents the sum of areas of two regions. DSC of 1
indicate perfect overlap and 0 indicate no overlap between A and B .
ii) Boundary based evaluation Root mean square error (RMSE) was evaluated by computing the corresponding distances from the sampled points on
the algorithm detected boundary to the manual detected boundary. The RMSE over N sample points is given as
22
1
)1()1(1
ii
N
iii yyxx
NRMSE −+∑ −=
=
(12)
where ),( ii yx is a sample point on the algorithm detected boundary and )1,1( ii yx is corresponding point to ),( ii yx on
manually detected cancer boundary. The RMSE gives the distance measure between automatic and manual boundaries.
Lower values of RMSE; ensure the better compliance of the results between two methods.
4.3 Validation with manual results
Fig. 6 shows qualitative comparison of automatic (black) and manual (red) outlines of cancer regions from 6 T1+Gd
MRI slices from 2 patients. The first 3 MRI slices of Fig. 6 ((a), (b), (c)), that corresponds to normal difficult case in
larynx cancer, shows good agreement. The variation between automatic and manual detection results can be observed in
last three MRI slices in Fig. 6 ((d), (e), (f)). Generally, manual outline tend to be more regular with convex boundaries
and leave margin around the cancer regions. Particularly, in Fig. 6(d), the variation is due to inclusion of the throat region in manual results and exclusion of the throat region in automatic results. There is no particular guideline as to
include or exclude throat region in the cancer detection results. In Fig. 6(e), automatic detection underestimated the
cancer region and in Fig. 6(f) it overestimated the cancer region as parameters such as number of clusters are fixed of all
images. However, all six outlines of the automatic system shows that automatic system can go into concavity and yield
more accurate shape of the cancer regions than manual. This, accuracy can be attributed to the new method that include
robust edge detection in SFCM clustering and thus, eliminate all pixels at the edges that do not satisfy edge criterion.

(a) (b)
(c) (d) (e)
(f)
Fig. 6: Examples of larynx cancer detection using the proposed system, superimposed with manual detection (black outline –
automatic system, red outline – manual). MRI slices are cropped near the cancer regions for better visibility.
Fig. 7(a) demonstrates the DSC value for each MRI slice for 2 patients. It can be noticed that DSC value is
greater than 0.7 for 20 MRI slices, which indicate good agreement. The average DSC value for 2 Patients is 0.78 with
0.74 for Patient1 and 0.82 for Patient2.
The RMSE value for all MRI slices is demonstrated in Fig. 7(b). The RMSE value varies in the range of
0.89mm-3.96mm with average RMSE of 1.82mm.
Higher values of DSC can be observed for the middle slices than extreme slices, as in middle slices cancer
regions are large and exhibit distinct boundary. The large value of RMSE in some slices is due to shape variation in
automatic and manual outlines. Another reason for low DSC and high RMSE especially for Patient1 is due to non-
homogenous cancer regions particularly at the boundary of the cancer regions. The SFCM with edge information assign
low membership value to the pixels in the non-homogenous regions thus, underestimating the cancer region.
4.4 Comparison with SFCM clustering
The additional edge information was robustly integrated into SFCM as described in Section 3.2 to effectively separate
regions. The performance of SFCM with edge information with SFCM described in Section 2.1 is shown in Fig. 8. Fig.
8(a) shows contrast enhanced image that is given as input to SFCM and SFCM with edge information. The cluster
obtained from SFCM is shown is Fig. 8(b). It is observed that the SFCM algorithm produces smooth regions, but
membership value of edge pixels are compensated similar to noisy pixels which leads to incorrect edges. Thus, the
SFCM fails to disconnect regions (for example, region1 and region2 in Fig 8(b)). Fig. 8(c) shows the cluster obtained
using SFCM with edge information. Due to consideration of difference in intensity of pixel and its neighbors, edge pixels are assigned true membership value and thus, belong to appropriate cluster. Consequently two regions can be easily
detached using thresholding technique. Fig. 8(d) and Fig. 8(e) shows comparison results in detail. It can be noticed that
region1 and region2 are now separated (Fig. 8(e)) using SFCM with edge information. The manual outline of region1
(red outline) is demonstrated in Fig. 8(f) with outline obtained from proposed technique (black outline). It can be
observed from Fig. 8(f) that manual outline and outline obtained from proposed technique are comparable. Thus, this
modified SFCM technique can separate different regions even in the presence of weak edges.
(a) (b)
Fig. 7: (a) Dice similarity coefficient (DSC) (b) Root mean square error (RMSE) in mm for MRI slices of 2 patients with
larynx cancer

(a) (b) (c) (d)
(e)
(f)
Fig. 8: Comparison of SFCM with SFCM including edge information (a) ROI with increased contrast, (b) and (c) detected
cluster with SFCM and SFCM with edge information respectively, (d) and (e) zoom in of the red border region shown in (b)
and (c) respectively. In (e) two regions are separated (f) outline of region1 from proposed system (black) and manual outline
(red)
5. DISCUSSION AND CONCLUSIONS
5.1 Discussion
Automatic detection of larynx cancers from large amount of contrast-enhanced MRI slices is difficult due to complex
anatomy of larynx, geometric variation of cancer regions, overlapping intensity of cancer and healthy regions, various
contrast uptakes, signal variation in MRI and intrinsic partial volume effect of MRI. The method described in this paper
can robustly overcome these challenges and can detect cancer regions by combining intensity and edge information with
specific knowledge of expected cancer position. Pre-processing step before clustering improve intensity difference
among different tissues, thus, allowing easy classification of different tissues into different clusters based on intensity
feature. The SFCM with edge information consider difference in brightness and membership degree of pixel and its
neighbors thus, effectively assign expected membership values to the pixels while reducing noise and producing smooth
regions.
The main advantage of this approach is that it does not require any prior shape and appearance model or any manual interaction. This technique does not utilize any patient specific information and can be easily modified to detect
different types of tumours13
. Comparison of proposed SFCM including edge information with spatial FCM demonstrate
that using proposed FCM, two regions can be easily separated, instead of using complex post-processing steps. The
limitation of current method is that it cannot detect small cancer regions.
The aim of this work was to perform initial validation of the proposed system on real dataset and results
demonstrated that automatic larynx cancer detection algorithm provide reliable results when compared with manual
detection results on real MRI data set. Overall this study emphasized that this system will help clinicians in defining an
accurate primary larynx cancer (gross tumour volume) by employing axial T1+Gd MRI slices. However, clinicians’
approval for larynx cancer outline, using all clinical and diagnostic information, remains vital.
5.2 Conclusions
In this paper, an automatic larynx cancer detection method from MRI was presented. The novelty of the proposed method lies in the step that includes robust edge detection technique in spatial FCM clustering to separate different
regions. Furthermore, knowledge of the expected cancer position helped to discard other regions from the cancer region
detected cluster. Preliminary results obtained using the proposed approach on small dataset showed that it achieves
consistent results when compared to the manual results. For the future work, use of additional information from
contiguous MRI slices should be included to enhance the performance of the proposed algorithm. Further, this automatic
system should be tested in clinical environment to assist clinicians for robust cancer region detection for improved radiotherapy treatment.
ACKNOWLEDGEMENTS
Authors would like to acknowledge the Beatson Cancer Charity for their financial support with this study, the Beatson Oncology Centre, Gartnavel Hospital, Glasgow for providing real MRI data sets and Clinician for manual results.
region2
region1

REFERENCES
[1] Lefebvre, J. L., “Current clinical outcomes demand new treatment options for SCCHN”, Ann Oncol 16 (6), vi7-
vi12, (2005)
[2] Watkinson, J. and Gilbert, R., [Stell and Maran’s Textbook of Head and Neck Surgery and Oncology], Fifth
Edition, London, UK: Hodder Arnold, 69-70, (2012)
[3] Riegel, A.C., Berson, A.M., Destian, S., et al. “Variability of gross tumor volume delineation in head-and- neck
cancer using CT and PET/CT fusion”. Int J Radiat Oncol Biol Phys, 65(3), 726–32, (2006) [4] Zaidi, H., Abdoli, M., Fuentes, C., Naqa, I., “Comparative methods for PET image segmentation in
pharyngolaryngeal squamous cell carcinoma,” Eur J Nucl Med Mol Imaging, 39(5), 881–891 (2012)
[5] Bezdek. J., [Pattern Recognition with Fuzzy Objective Function Algorithms], Plenum Press, New York, (1981)
[6] Street, E., Hadjiiskia L., Sahiner B., Gujar S., Ibrahim M., Mukherji S., and Chan H., “Automated volume
analysis of head and neck lesions on CT scans using 3D level set segmentation”, Med Phys., 34(11), 4399– 4408, (2007)
[7] Yu, H., Caldwell, C., Mah, K., and Mozeg, D., “Coregistered FDG PET/CT-Based Textural Characterization of
Head and Neck Cancer for Radiation Treatment Planning” IEEE Transactions on Medical Imaging, 28(3), 374-
383, (2009)
[8] Maroldi, R., Battaglia, G., Farina, D., Maculotti, P., Chiesa, A., “Tumours of the oropharynx and oral cavity:
perineural spread and bone invasion”, JBR-BTR, 82, 294–300, (1999)
[9] Ahmed, M., Schmidt, M., Sohaib, A., et al., “The value of magnetic resonance imaging in target volume
delineation of base of tongue tumors – a study using flexible surface coil”, Radiother Oncol, 94(2), 161–167,
(2010)
[10] Pham, D., “Unsupervised Tissue Classification in Medical Images using Edge-Adaptive Clustering”, Proc.
IEEE EMBC, Cancun, Mexico, 634-637, (2003)
[11] Wang, X., Lin, X., and Yuan, Z., “An Edge Sensing Fuzzy Local Information C-Means Clustering Algorithm for Image Segmentation”, Proc. ICIC, 230-240, (2014)
[12] Ahmed, M., Yamany, S., Mohamed, N., Farag, A., and Moriarty, T. “A Modified Fuzzy C-Means Algorithm for
Bias Field Estimation and Segmentation of MRI Data.” IEEE Transaction on Medical Imaging, 21(9), 539-552,
(2002)
[13] Doshi, T., Soraghan, J., Petropoulakis, L., Grose, D., and MacKenzie, K. “Modified Fuzzy C-means Clustering
for Extraction of Tongue Base Tumor from MRI data” , Proc. European Conference of Signal Processing,
EUSIPCO, Lisbon, Portugal, 2460 – 2464, (2014)
[14] Chuang, K., Hzeng, H., Chen, S, Wu, J. and Chen, T., “Fuzzy c-means clustering with spatial information for
image segmentation.” Computerized Medical Imaging and Graphics, 30(1), 9-15, (2006)
[15] Smith, S. and Brady, J., “SUSAN—A new approach to low level image processing”. International Journal of
Computer Vision, 23(1), 45–78, (1997)
[16] Xingfang, Y., Yumei, H. and Yan, L., “An improved SUSAN corner detection algorithm based on adaptive
threshold” Proc. ICSPS, V2-613-V2-616, (2010)
[17] Tan, T., Sim, K., and Tso, C., “Image enhancement using background brightness preserving histogram
equalization”, IEEE Electronics Letters, 48(3), 155 – 157, (2012)
[18] Sternberg, S., “Grayscale morphology”, Computer Vision, Graphics Image Processing, 35(3), 333-355, (1986)
[19] Dice, L., “Measures of the amount of ecological association between species.” Ecology, 26(3), 297-302, (1945)