automatic modelling of credit risk through internal ... · “automatic modelling of credit risk...
TRANSCRIPT

“Automatic modelling of credit risk through internal ratings:
An application of advanced statistical models and Machine Learning techniques”
Raquel Flórez-LópezDepartment of Economics and Business Administration
University of León (SPAIN)E-mail: [email protected]
(For additional information or comments, please contact the author)
CreditCredit ResearchResearch CentreCentreCreditCredit ScoringScoring andand CreditCredit Control IXControl IX
7-9 September 2005The University of Edinburgh Management School

OverviewOverview
1. Introduction
2. Researches on external credit rating determinants
3. A proposal for modelling rating determinants3.1. Feature Selection3.2. Multivariate analyses3.3. Models’ evaluation3.4. Bayesian hybrid proposal
4. Empirical application4.1. Data and sample4.2. Feature selection4.3. Multivariate models: results and comparisons
5. Conclusions
IntroductionIntroduction
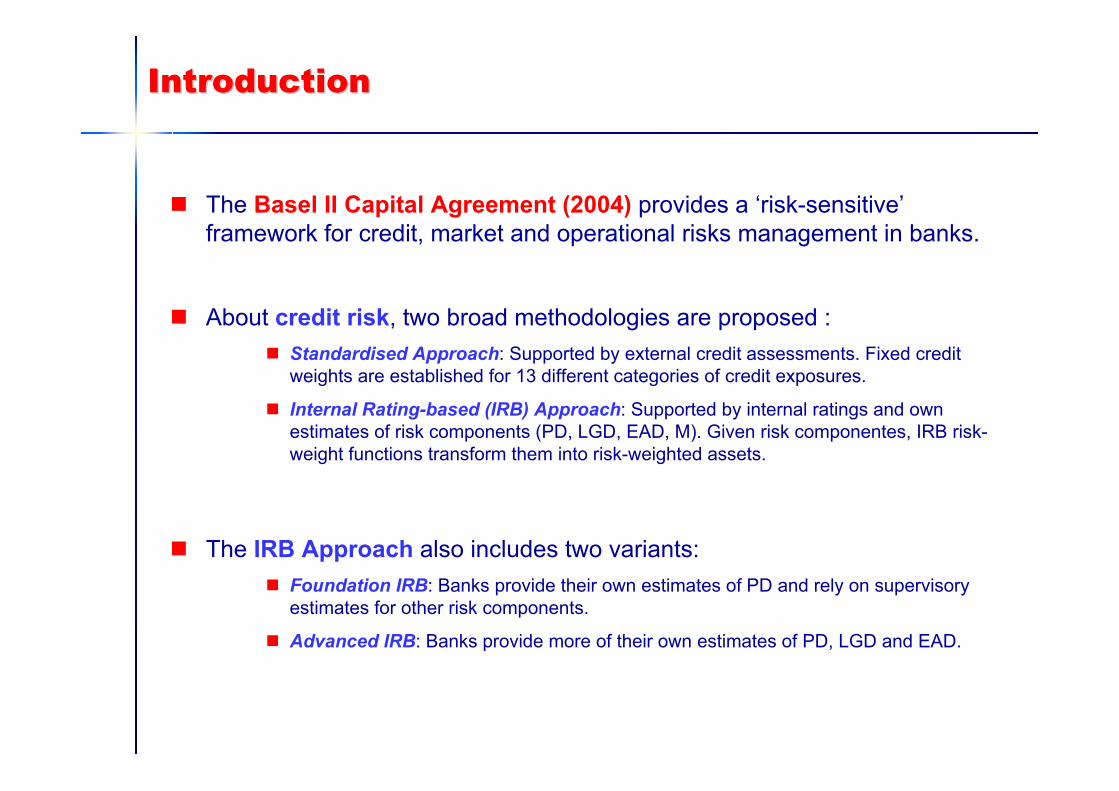
The Basel II Capital Agreement (2004) provides a ‘risk-sensitive’ framework for credit, market and operational risks management in banks.
About credit risk, two broad methodologies are proposed :Standardised Approach: Supported by external credit assessments. Fixed creditweights are established for 13 different categories of credit exposures.
Internal Rating-based (IRB) Approach: Supported by internal ratings and ownestimates of risk components (PD, LGD, EAD, M). Given risk componentes, IRB risk-weight functions transform them into risk-weighted assets.
The IRB Approach also includes two variants:Foundation IRB: Banks provide their own estimates of PD and rely on supervisoryestimates for other risk components.
Advanced IRB: Banks provide more of their own estimates of PD, LGD and EAD.
IntroductionIntroduction
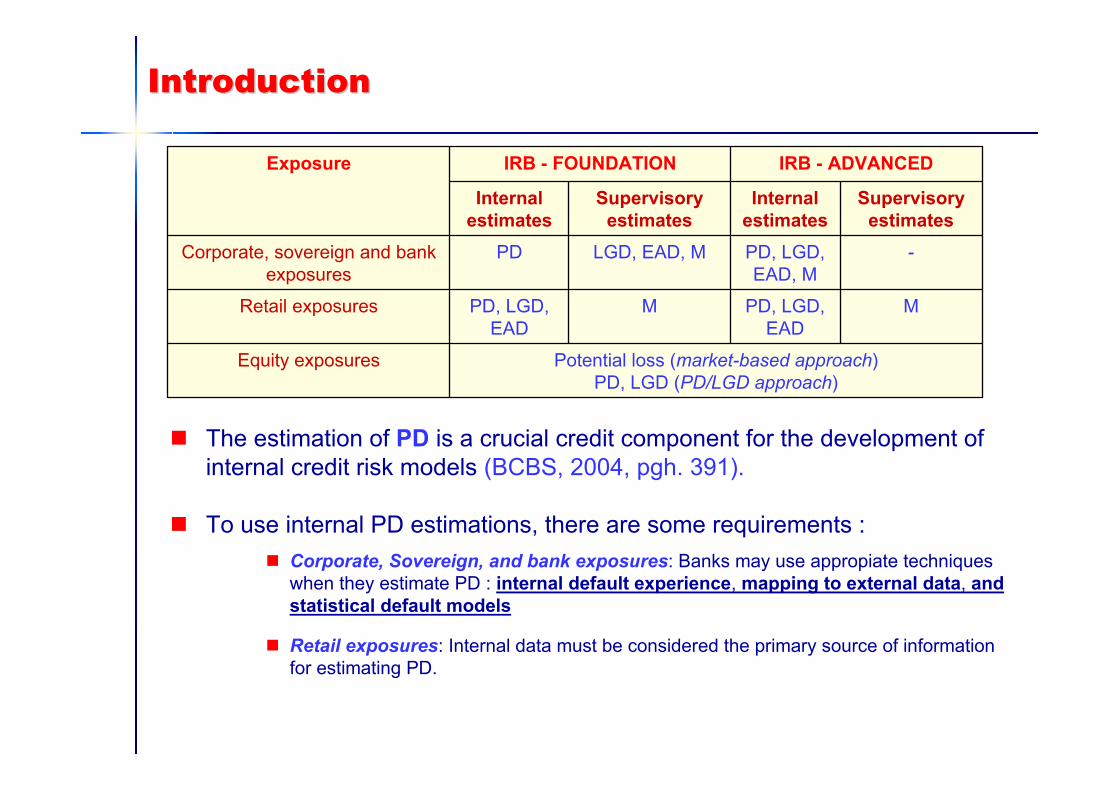
Potential loss (market-based approach)PD, LGD (PD/LGD approach)
Equity exposures
MPD, LGD, EAD
MPD, LGD, EAD
Retail exposures
-PD, LGD, EAD, M
LGD, EAD, MPDCorporate, sovereign and bank exposures
Supervisory estimates
Internal estimates
Supervisory estimates
Internal estimates
IRB - ADVANCEDIRB - FOUNDATIONExposure
The estimation of PD is a crucial credit component for the development ofinternal credit risk models (BCBS, 2004, pgh. 391).
To use internal PD estimations, there are some requirements :Corporate, Sovereign, and bank exposures: Banks may use appropiate techniqueswhen they estimate PD : internal default experience, mapping to external data, andstatistical default models
Retail exposures: Internal data must be considered the primary source of informationfor estimating PD.

IntroductionIntroduction
PD estimates for Corporate, Sovereign and Bank Exposures: (BCBS, 2004; Martin-Marin and Trujillo-Ponce, 2004):
INTERNAL DEFAULT EXPERIENCE:Description: Historical database on banks’ clients. Advantages: It provides a specialised PD estimation.Limitations: A large database is required. Historical records are usually not complete.
MAPPING TO EXTERNAL DATA:Description: Banks map their internal grades to the scale used by an external credit
assessment institution. Defaults rates for the external grades are attributedto the banks’ grades.
Advantages: Easy implementation. Banks benefit of external agencies’ experience.Limitations: Small number of external qualified companies. Mapping must be based on a
comparison of internal and external rating criteria.
STATISTICAL DEFAULT MODELS:Description: Banks are allowed to use a simple average of default-probabilities for
individual borrowers in a given grade, drawn from statistical default predicionmodels.
Advantages & Limitations: Directly derived of the selected default modelsThis alternative really supports previous approaches.
SHORT-TERM
SOLUTION

IntroductionIntroduction
Mapping to External Data:
– Multiple concordance points between IRB and external ratingsdeterminants (BCBS, 1999, 2000; Brunner et al., 2000; Crouhy et al., 2001; Grunert et al., 2005).
– Many recent literature attempts to understand rating determinants forindustrial companies and banks (Blume et al., 1998; Tabakis and Vinci, 2002; Estrella et al., 1999; Amato and Furfine, 2004; Altman and Rijken, 2004).
– Scarce analysis on insurance fims, BUT…
Insurance firms are key agents on financial markets.
The more insurers expands their business, the more important becomes the evaluationof their creditworthiness by independent agencies (Chorafas, 2004).
The importance and specificity of the insurance industry affects external ratingprocesses (Buckley, 1997).
New regulatory environments affect insurance firms, particularly in the European Union: SOLVENCY II Project.

IntroductionIntroduction
The Solvency II (2002-2003; 2003-2006) project proposes advancedmeasures in order to deep reform the solvency system of Europeaninsurance companies (KPMG 2003, IMSDG, 2005).
External ratings (financial strength ratings) are considered for assistingsupervisors in prudential supervision.
Nevertheless, their potential assistance is conditioned to thecomprehensibility of methodologies and ratings determinants employed by external rating agencies.
Considering both Basel II and Solvency II requirements, it is convenienta better understanding of the insurance rating process by modelling
financial strength rating determinants
OverviewOverview
1. Introduction
2. Researches on external credit rating determinants
3. A proposal for modelling rating determinants3.1. Feature Selection3.2. Multivariate analyses3.3. Models’ evaluation3.4. Bayesian hybrid proposal
4. Empirical application4.1. Data and sample4.2. Feature selection4.3. Multivariate models: results and comparisons
5. Conclusions

Researches on external credit rating Researches on external credit rating determinants: a literature reviewdeterminants: a literature review
Industrial corporations and banks:– Explanatory variables: Profitability, capitalization, liquidity, interest coverage, debt
status, and industry indicators.
– Techniques: Linear regression, MDA, multinomial logit, ordered logit, probit, orderedprobit, rule-based systems, neural networks, other Machine Learning techniques.
Blume et al (1998), US large and small corporations; ordered probit; accounting andmarket data; predictive accuracy: 57%, 97% (±1 notch).
Estrella et al. (1999), US banks; logit model; capital ratios.
Tabakis and Vinci (2002), European banks; ordered-probit; profitabitlity, efficiency, capital adequacy, liquidity, loan intensity ratios; adjusted-R2:59.41%.
Amato and Furfine (2004), US corporations; ordered probit; business risk, financial riskand macroeconomical indicators; predictive accuracy: 53%.
Altman and Rijken (2004), US corporations; logit and ordered logit; financial ratios, market data, size and age information; pseudo-R2: 21-23%.
Researches on external credit rating Researches on external credit rating determinants: a literature reviewdeterminants: a literature review
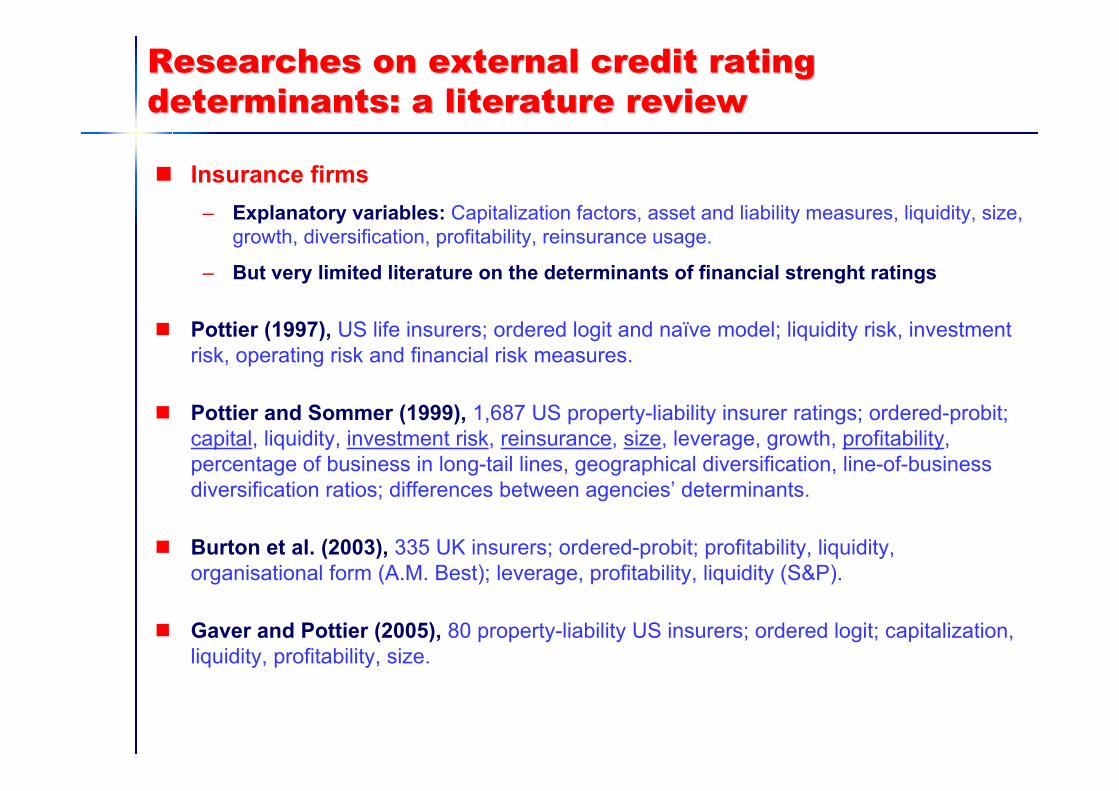
Insurance firms– Explanatory variables: Capitalization factors, asset and liability measures, liquidity, size,
growth, diversification, profitability, reinsurance usage.
– But very limited literature on the determinants of financial strenght ratings
Pottier (1997), US life insurers; ordered logit and naïve model; liquidity risk, investmentrisk, operating risk and financial risk measures.
Pottier and Sommer (1999), 1,687 US property-liability insurer ratings; ordered-probit; capital, liquidity, investment risk, reinsurance, size, leverage, growth, profitability, percentage of business in long-tail lines, geographical diversification, line-of-businessdiversification ratios; differences between agencies’ determinants.
Burton et al. (2003), 335 UK insurers; ordered-probit; profitability, liquidity, organisational form (A.M. Best); leverage, profitability, liquidity (S&P).
Gaver and Pottier (2005), 80 property-liability US insurers; ordered logit; capitalization, liquidity, profitability, size.
Researches on external credit rating Researches on external credit rating determinants: a literature reviewdeterminants: a literature review
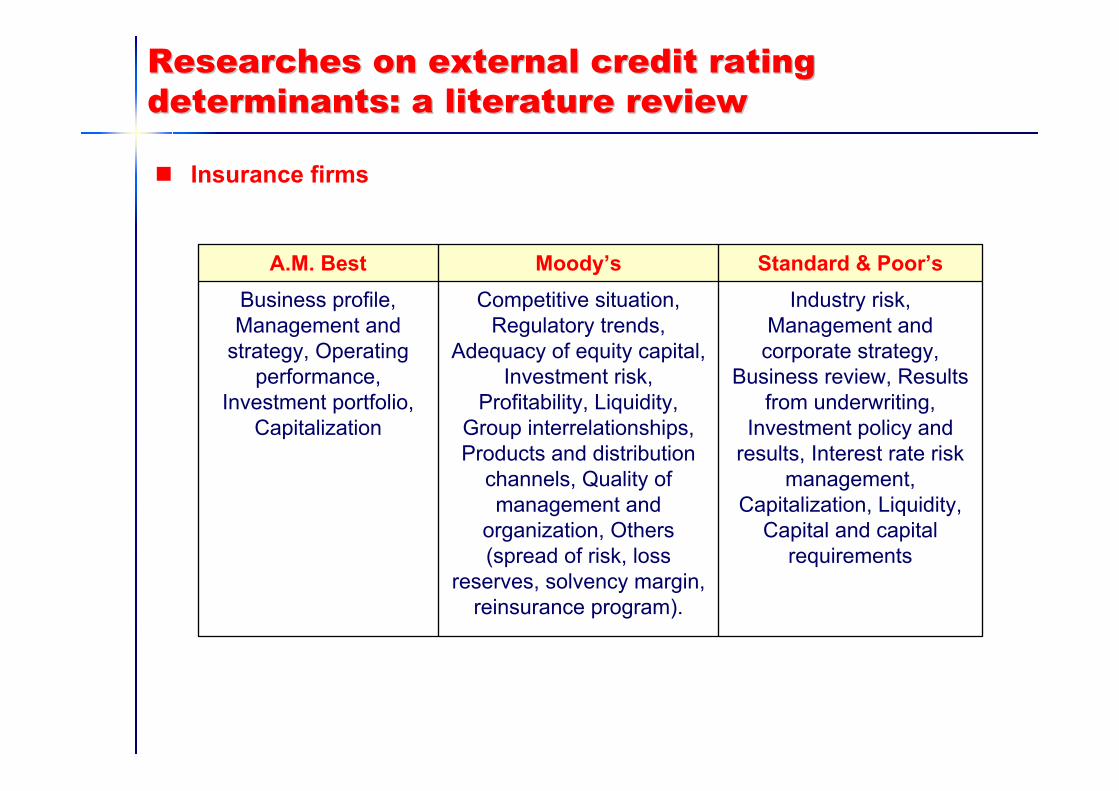
Insurance firms
Industry risk, Management and
corporate strategy, Business review, Results
from underwriting, Investment policy and
results, Interest rate risk management,
Capitalization, Liquidity, Capital and capital
requirements
Competitive situation, Regulatory trends,
Adequacy of equity capital, Investment risk,
Profitability, Liquidity, Group interrelationships, Products and distribution
channels, Quality of management and
organization, Others (spread of risk, loss
reserves, solvency margin, reinsurance program).
Business profile, Management and
strategy, Operating performance,
Investment portfolio, Capitalization
Standard & Poor’sMoody’sA.M. Best
OverviewOverview
1. Introduction
2. Researches on external credit rating determinants
3. A proposal for modelling rating determinants3.1. Feature Selection3.2. Multivariate analyses3.3. Models’ evaluation3.4. Bayesian hybrid proposal
4. Empirical application4.1. Data and sample4.2. Feature selection4.3. Multivariate models: results and comparisons
5. Conclusions

A proposal for modelling rating determinantsA proposal for modelling rating determinants
A four-stage model:
DATA
Stage 1. FEATURE SELECTION
Stage 2. MULTIVARIATE ANALYSIS
Stage 3. MODELS’ EVALUATION
Stage 4. BAYESIAN HYBRID PROPOSAL
Filter approach(RELIEF-F, WACSA)
Wrapper aproach(Gibbs sampler appl.)
Embedded approach(NCU, OBS, Partial der.)
MDA Multilogit and orderedlogit
Decision trees (C4.5, CART univariate and oblique)
Classification matrices, boostrapping .632E and .632+E variants
A proposal for modelling rating determinantsA proposal for modelling rating determinants
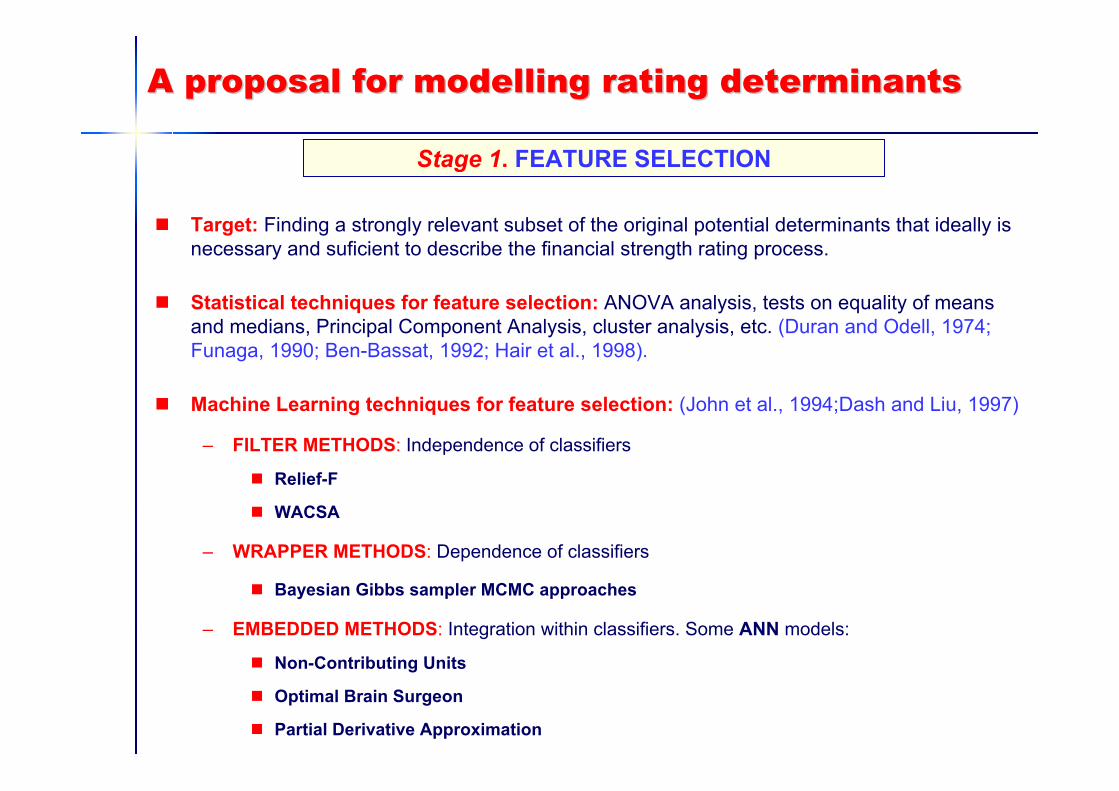
Target: Finding a strongly relevant subset of the original potential determinants that ideally isnecessary and suficient to describe the financial strength rating process.
Statistical techniques for feature selection: ANOVA analysis, tests on equality of meansand medians, Principal Component Analysis, cluster analysis, etc. (Duran and Odell, 1974; Funaga, 1990; Ben-Bassat, 1992; Hair et al., 1998).
Machine Learning techniques for feature selection: (John et al., 1994;Dash and Liu, 1997)
– FILTER METHODS: Independence of classifiers
Relief-F
WACSA
– WRAPPER METHODS: Dependence of classifiers
Bayesian Gibbs sampler MCMC approaches
– EMBEDDED METHODS: Integration within classifiers. Some ANN models:
Non-Contributing Units
Optimal Brain Surgeon
Partial Derivative Approximation
Stage 1. FEATURE SELECTION
A proposal for modelling rating determinantsA proposal for modelling rating determinants
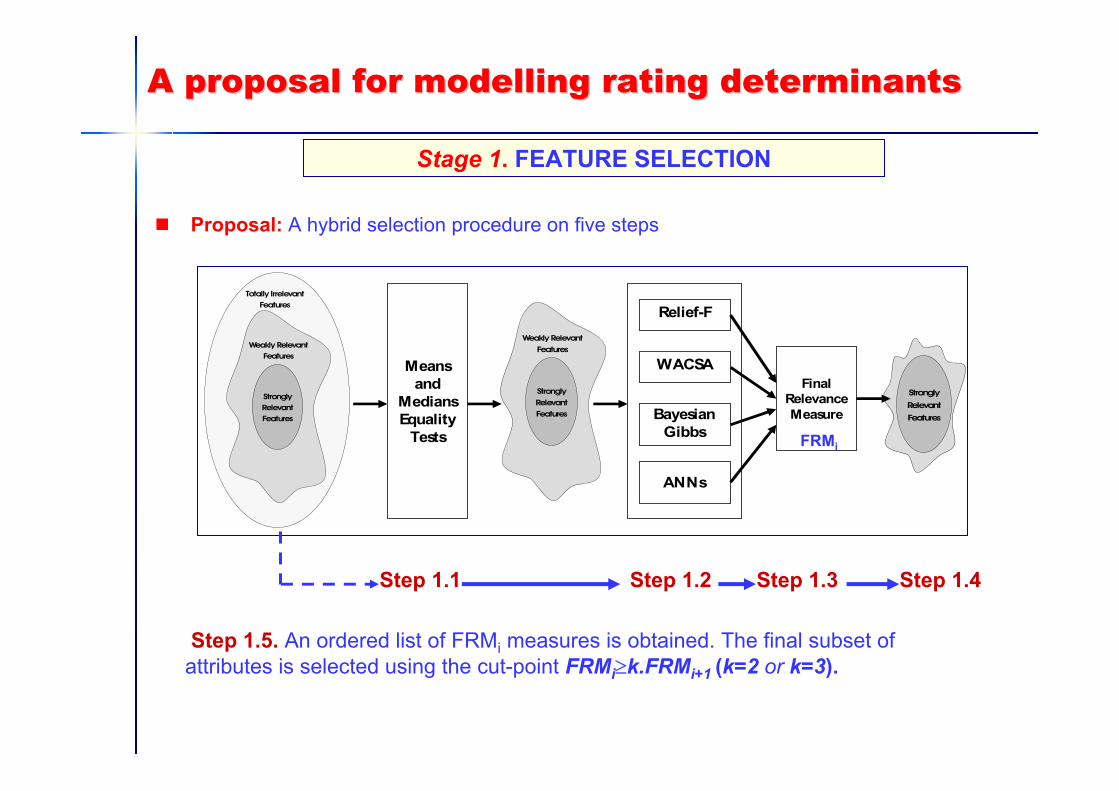
Proposal: A hybrid selection procedure on five steps
Stage 1. FEATURE SELECTION
Meansand
MediansEquality
Tests
Relief-F
WACSA
BayesianGibbs
ANNs
Final RelevanceMeasure
StronglyRelevantFeatures
Weakly RelevantFeatures
Totally IrrelevantFeatures
StronglyRelevantFeatures
WeaklyRelevantFeatures
Strongly
Relevant
Features
Step 1.1 Step 1.2 Step 1.3 Step 1.4
Step 1.5. An ordered list of FRMi measures is obtained. The final subset ofattributes is selected using the cut-point FRMi≥k.FRMi+1 (k=2 or k=3).
FRMi
A proposal for modelling rating determinantsA proposal for modelling rating determinants
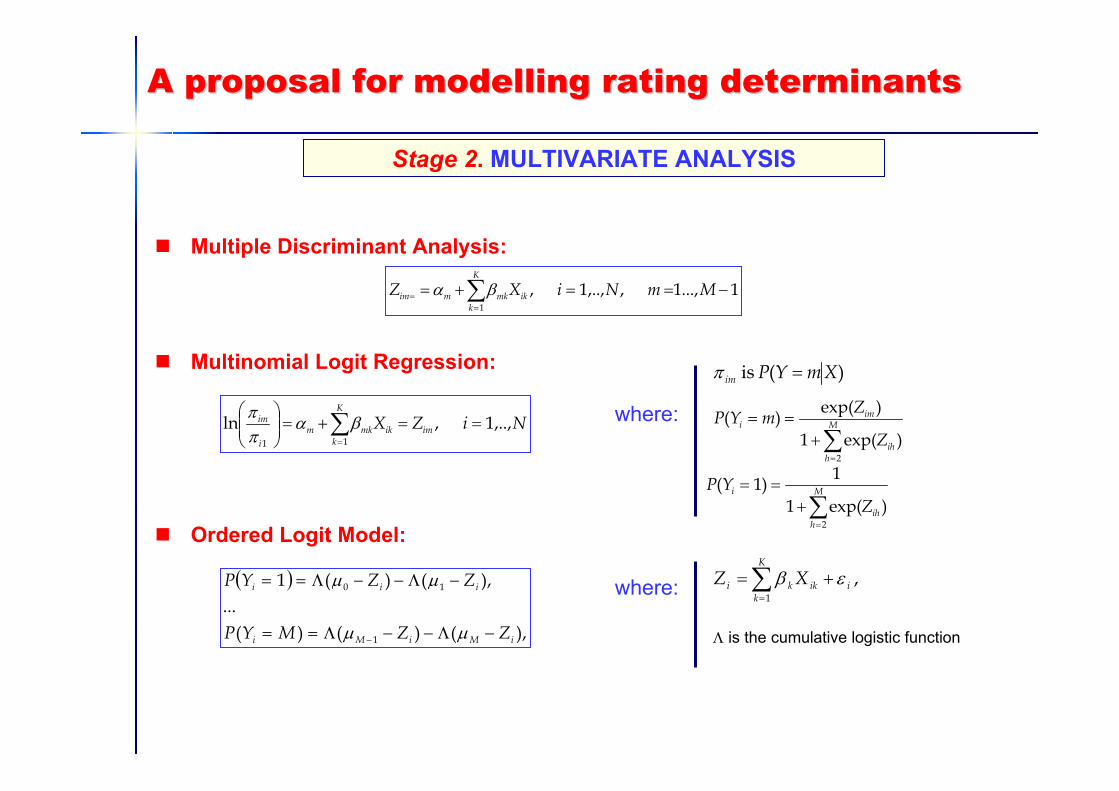
Multiple Discriminant Analysis:
Multinomial Logit Regression:
Ordered Logit Model:
Stage 2. MULTIVARIATE ANALYSIS
1...,1,,..,1,1
−==+= ∑=
= MmNiXZK
kikmkmim βα
∑=
==+=⎟⎟⎠
⎞⎜⎜⎝
⎛ K
kimikmkm
i
im NiZX11
,..,1,ln βαππ
)( is XmYPim =π
where:∑=
+== M
hih
imi
Z
ZmYP
2
)exp(1
)exp()(
∑=
+== M
hih
i
ZYP
2
)exp(1
1)1(
( )
),()()(...
),()(1
1
10
iMiMi
iii
ZZMYP
ZZYP
−Λ−−Λ==
−Λ−−Λ==
− µµ
µµ where: ∑=
+=K
kiikki XZ
1
,εβ
Λ is the cumulative logistic function
A proposal for modelling rating determinantsA proposal for modelling rating determinants
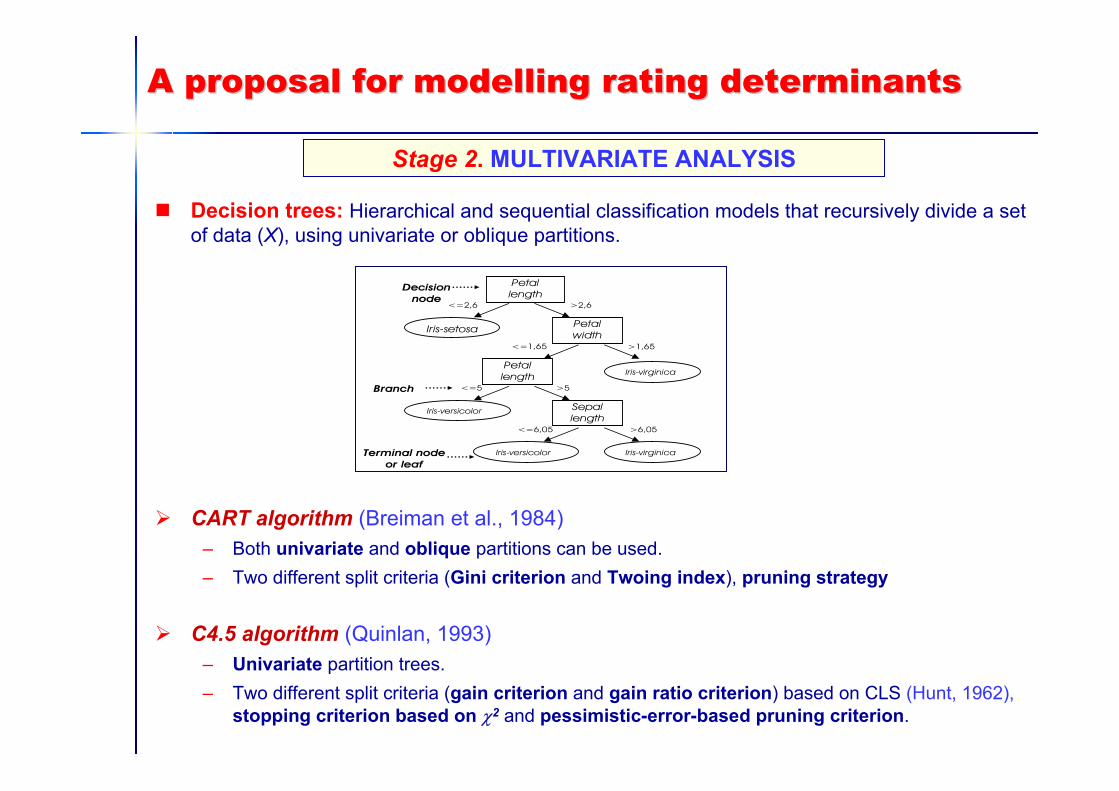
Decision trees: Hierarchical and sequential classification models that recursively divide a setof data (X), using univariate or oblique partitions.
CART algorithm (Breiman et al., 1984) – Both univariate and oblique partitions can be used.– Two different split criteria (Gini criterion and Twoing index), pruning strategy
C4.5 algorithm (Quinlan, 1993) – Univariate partition trees.– Two different split criteria (gain criterion and gain ratio criterion) based on CLS (Hunt, 1962),
stopping criterion based on χ2 and pessimistic-error-based pruning criterion.
Stage 2. MULTIVARIATE ANALYSIS
Iris-setosa Petalwidth
Iris-virginicaPetallength
Sepallength
Iris-versicolor
Iris-virginicaIris-versicolor
<=2,6 >2,6
<=1,65 >1,65
<=5 >5
<=6,05 >6,05
Branch
Decisionnode
Terminal nodeor leaf
Petallength
A proposal for modelling rating determinantsA proposal for modelling rating determinants
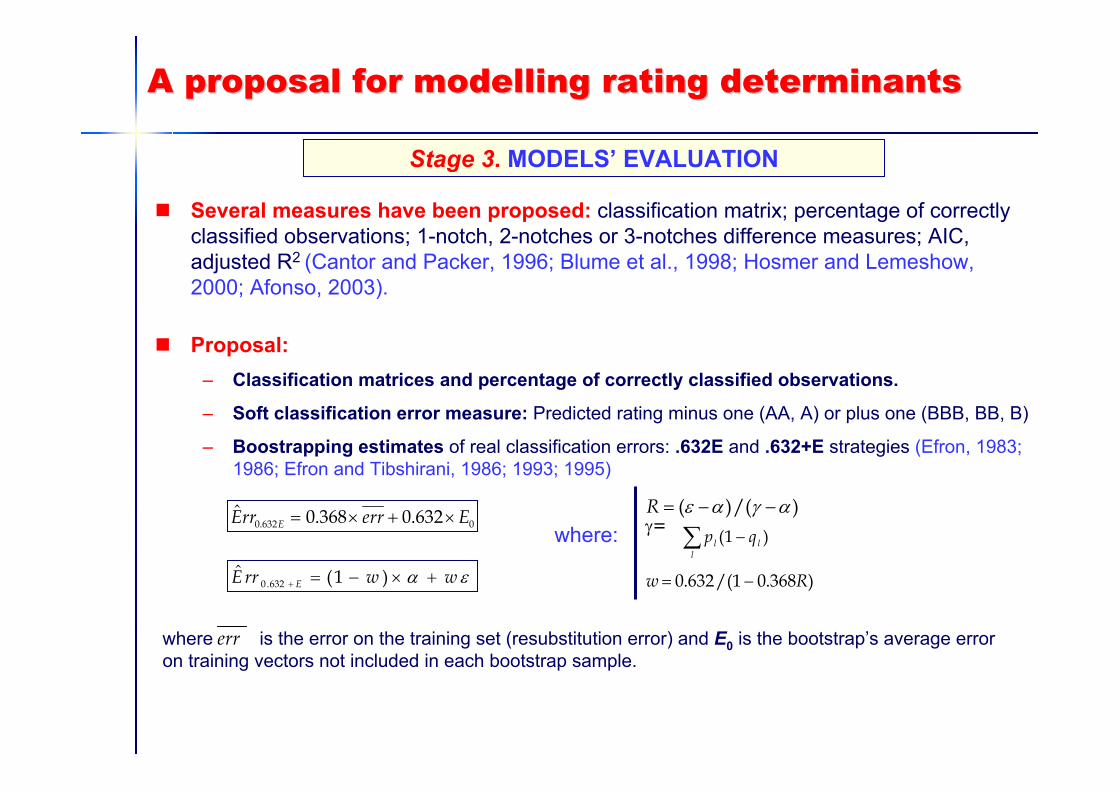
Several measures have been proposed: classification matrix; percentage of correctlyclassified observations; 1-notch, 2-notches or 3-notches difference measures; AIC, adjusted R2 (Cantor and Packer, 1996; Blume et al., 1998; Hosmer and Lemeshow, 2000; Afonso, 2003).
Proposal:– Classification matrices and percentage of correctly classified observations.
– Soft classification error measure: Predicted rating minus one (AA, A) or plus one (BBB, BB, B)
– Boostrapping estimates of real classification errors: .632E and .632+E strategies (Efron, 1983; 1986; Efron and Tibshirani, 1986; 1993; 1995)
Stage 3. MODELS’ EVALUATION
0632.0 632.0368.0ˆ EerrrrE E ×+×=
εα wwrrE E +×−=+ )1(ˆ632.0
where:)/()( αγαε −−=R
γ= ∑ −l
ll qp )1(
)368.01/(632.0 Rw −=
where is the error on the training set (resubstitution error) and E0 is the bootstrap’s average error on training vectors not included in each bootstrap sample.
err
A proposal for modelling rating determinantsA proposal for modelling rating determinants
Target: To obtain synergic effects from multivariate methods and results.
Justification: Due to different techniques capture diverse characteristics andvariability from data, their combination on a unique net would offer a hybrid solutionthat could outperform individual results.
State: Currently in progress (not included in this paper).
Stage 4. BAYESIAN HYBRID PROPOSAL

OverviewOverview
1. Introduction
2. Researches on external credit rating determinants
3. A proposal for modelling rating determinants3.1. Feature Selection3.2. Multivariate analyses3.3. Models’ evaluation3.4. Bayesian hybrid proposal
4. Empirical application4.1. Data and sample4.2. Feature selection4.3. Multivariate models: results and comparisons
5. Conclusions
Empirical ApplicationEmpirical Application
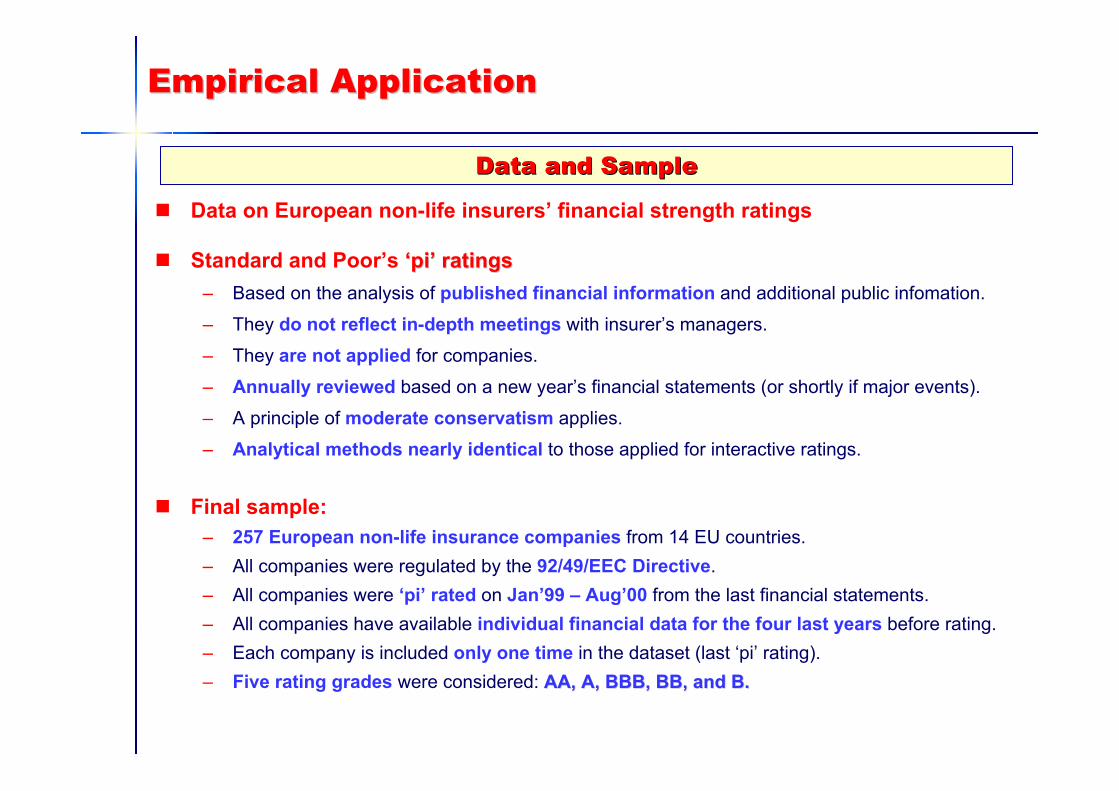
Data on European non-life insurers’ financial strength ratings
Standard and Poor’s ‘pi’ ratings‘pi’ ratings– Based on the analysis of published financial information and additional public infomation.
– They do not reflect in-depth meetings with insurer’s managers.
– They are not applied for companies.
– Annually reviewed based on a new year’s financial statements (or shortly if major events).
– A principle of moderate conservatism applies.
– Analytical methods nearly identical to those applied for interactive ratings.
Final sample:– 257 European non-life insurance companies from 14 EU countries.– All companies were regulated by the 92/49/EEC Directive.– All companies were ‘pi’ rated on Jan’99 – Aug’00 from the last financial statements.– All companies have available individual financial data for the four last years before rating.– Each company is included only one time in the dataset (last ‘pi’ rating).– Five rating grades were considered: AA, A, BBB, BB, AA, A, BBB, BB, andand B.B.
Data Data andand SampleSample
Empirical ApplicationEmpirical Application
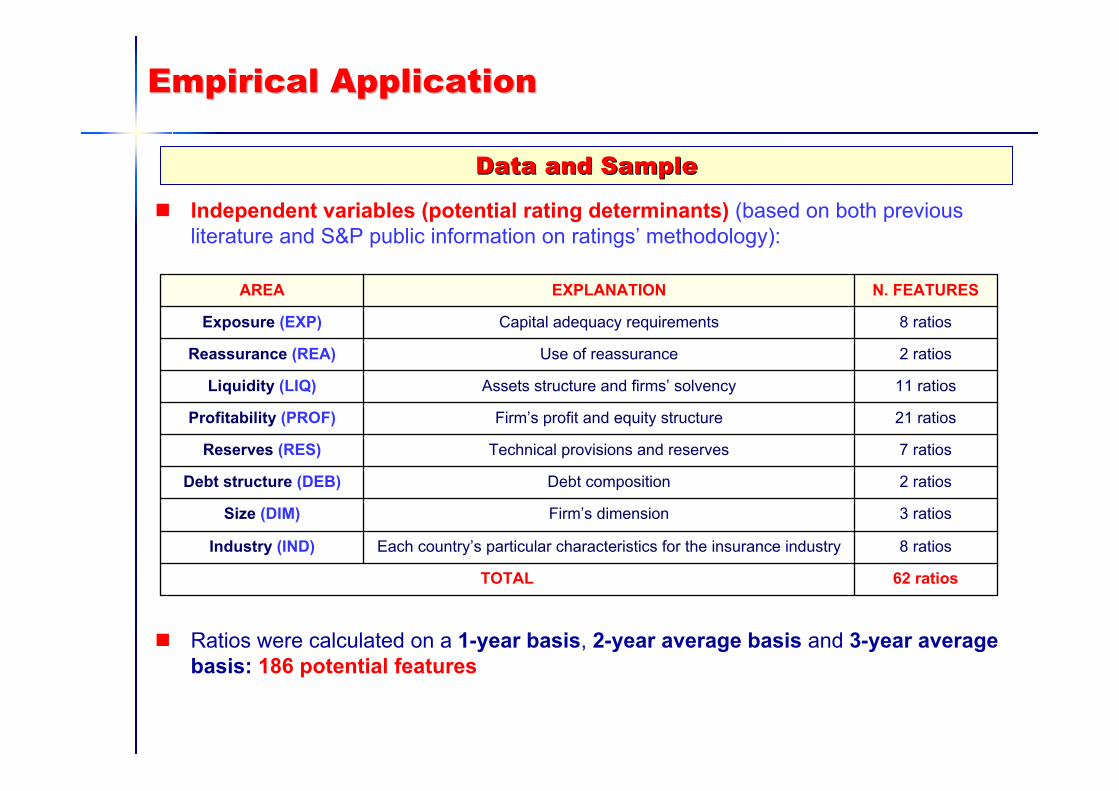
Independent variables (potential rating determinants) (based on both previousliterature and S&P public information on ratings’ methodology):
Ratios were calculated on a 1-year basis, 2-year average basis and 3-year average basis: 186 potential features
Data Data andand SampleSample
62 ratiosTOTAL
8 ratiosEach country’s particular characteristics for the insurance industryIndustry (IND)
3 ratiosFirm’s dimensionSize (DIM)
2 ratiosDebt compositionDebt structure (DEB)
7 ratiosTechnical provisions and reservesReserves (RES)
21 ratiosFirm’s profit and equity structureProfitability (PROF)
11 ratiosAssets structure and firms’ solvencyLiquidity (LIQ)
2 ratiosUse of reassuranceReassurance (REA)
8 ratiosCapital adequacy requirementsExposure (EXP)
N. FEATURESEXPLANATIONAREA
Empirical ApplicationEmpirical Application
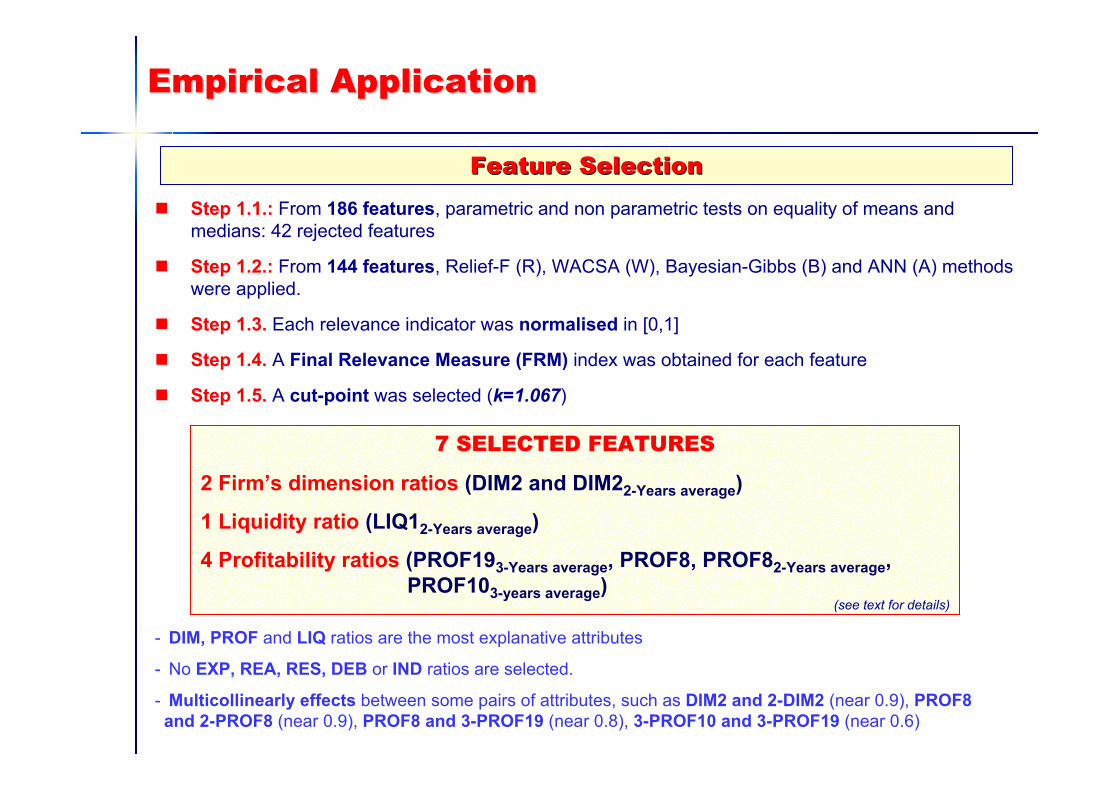
Step 1.1.: From 186 features, parametric and non parametric tests on equality of means andmedians: 42 rejected features
Step 1.2.: From 144 features, Relief-F (R), WACSA (W), Bayesian-Gibbs (B) and ANN (A) methodswere applied.
Step 1.3. Each relevance indicator was normalised in [0,1]
Step 1.4. A Final Relevance Measure (FRM) index was obtained for each feature
Step 1.5. A cut-point was selected (k=1.067)
FeatureFeature SelectionSelection
7 SELECTED FEATURES
2 Firm’s dimension ratios (DIM2 and DIM22-Years average)
1 Liquidity ratio (LIQ12-Years average)
4 Profitability ratios (PROF193-Years average, PROF8, PROF82-Years average, PROF103-years average)
- DIM, PROF and LIQ ratios are the most explanative attributes
- No EXP, REA, RES, DEB or IND ratios are selected.
- Multicollinearly effects between some pairs of attributes, such as DIM2 and 2-DIM2 (near 0.9), PROF8 and 2-PROF8 (near 0.9), PROF8 and 3-PROF19 (near 0.8), 3-PROF10 and 3-PROF19 (near 0.6)
(see text for details)
Empirical ApplicationEmpirical Application
MultivariateMultivariate MethodsMethods: : ResultsResults andand ComparisonComparison
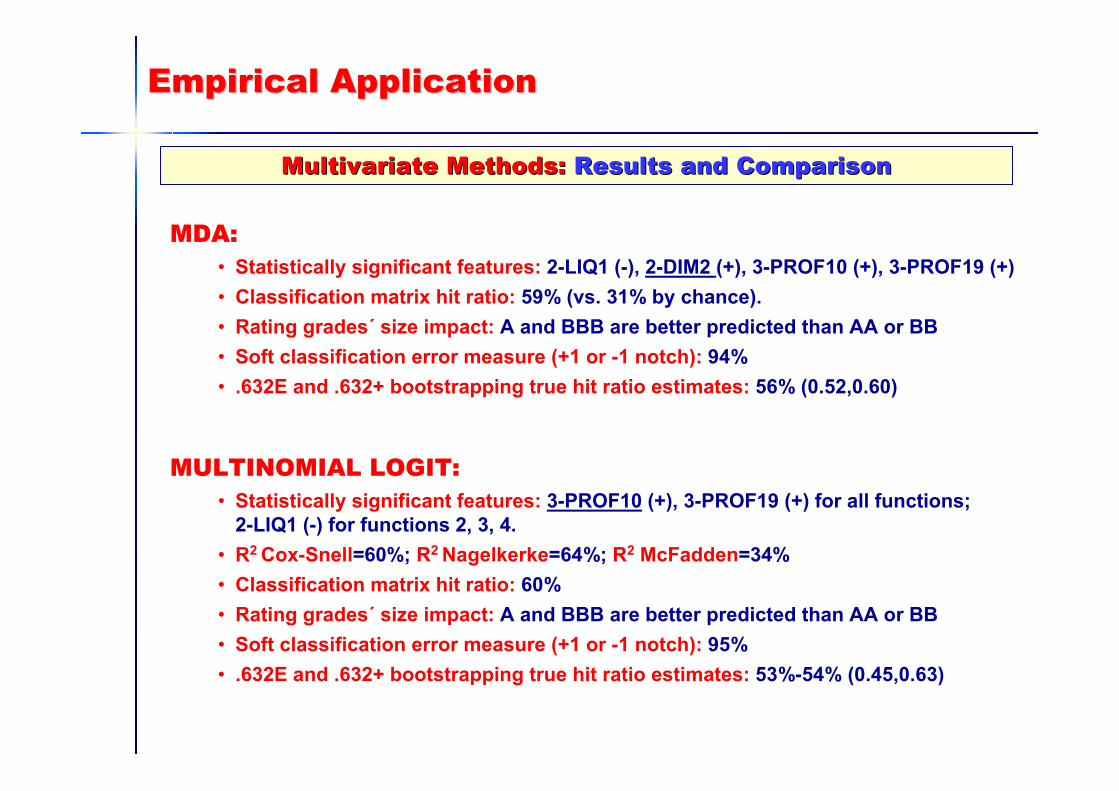
MDA:• Statistically significant features: 2-LIQ1 (-), 2-DIM2 (+), 3-PROF10 (+), 3-PROF19 (+)• Classification matrix hit ratio: 59% (vs. 31% by chance).• Rating grades´ size impact: A and BBB are better predicted than AA or BB• Soft classification error measure (+1 or -1 notch): 94%• .632E and .632+ bootstrapping true hit ratio estimates: 56% (0.52,0.60)
MULTINOMIAL LOGIT:• Statistically significant features: 3-PROF10 (+), 3-PROF19 (+) for all functions;
2-LIQ1 (-) for functions 2, 3, 4.• R2 Cox-Snell=60%; R2 Nagelkerke=64%; R2 McFadden=34%• Classification matrix hit ratio: 60%• Rating grades´ size impact: A and BBB are better predicted than AA or BB• Soft classification error measure (+1 or -1 notch): 95%• .632E and .632+ bootstrapping true hit ratio estimates: 53%-54% (0.45,0.63)
Empirical ApplicationEmpirical Application
MultivariateMultivariate MethodsMethods: : ResultsResults andand ComparisonComparison
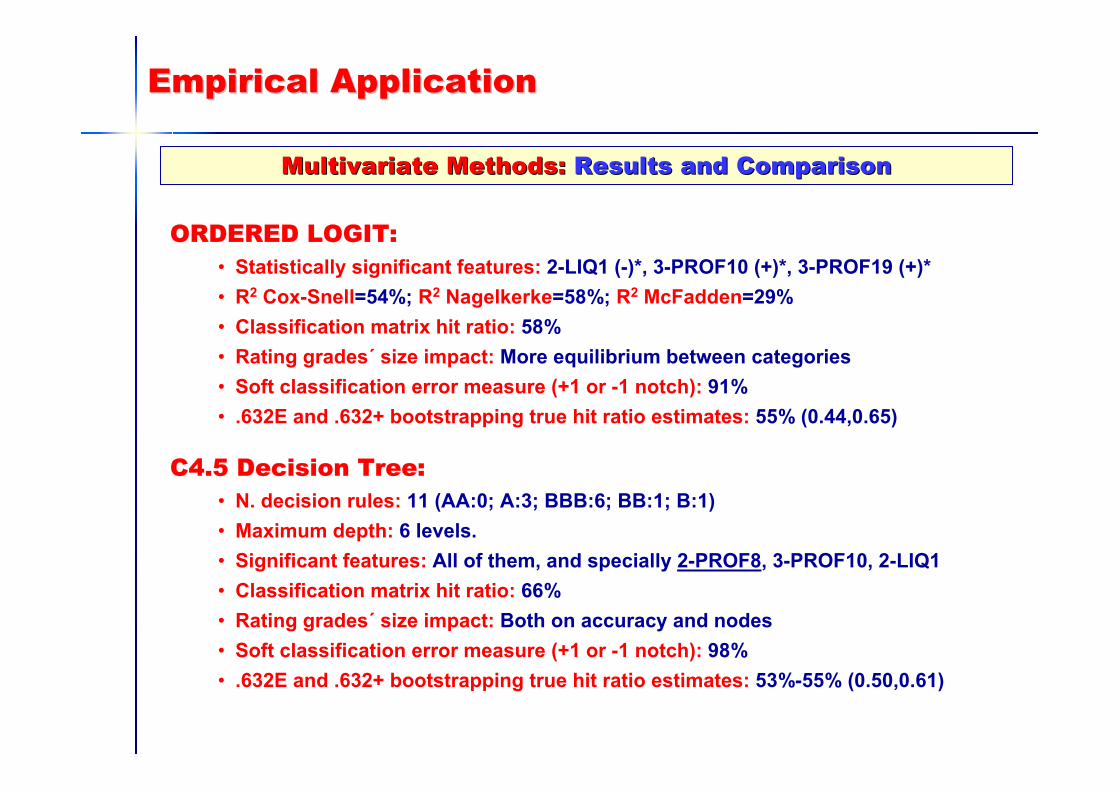
ORDERED LOGIT:• Statistically significant features: 2-LIQ1 (-)*, 3-PROF10 (+)*, 3-PROF19 (+)*• R2 Cox-Snell=54%; R2 Nagelkerke=58%; R2 McFadden=29%• Classification matrix hit ratio: 58%• Rating grades´ size impact: More equilibrium between categories• Soft classification error measure (+1 or -1 notch): 91%• .632E and .632+ bootstrapping true hit ratio estimates: 55% (0.44,0.65)
C4.5 Decision Tree:• N. decision rules: 11 (AA:0; A:3; BBB:6; BB:1; B:1)• Maximum depth: 6 levels.• Significant features: All of them, and specially 2-PROF8, 3-PROF10, 2-LIQ1• Classification matrix hit ratio: 66%• Rating grades´ size impact: Both on accuracy and nodes• Soft classification error measure (+1 or -1 notch): 98%• .632E and .632+ bootstrapping true hit ratio estimates: 53%-55% (0.50,0.61)
Empirical ApplicationEmpirical Application
MultivariateMultivariate MethodsMethods: : ResultsResults andand ComparisonComparison
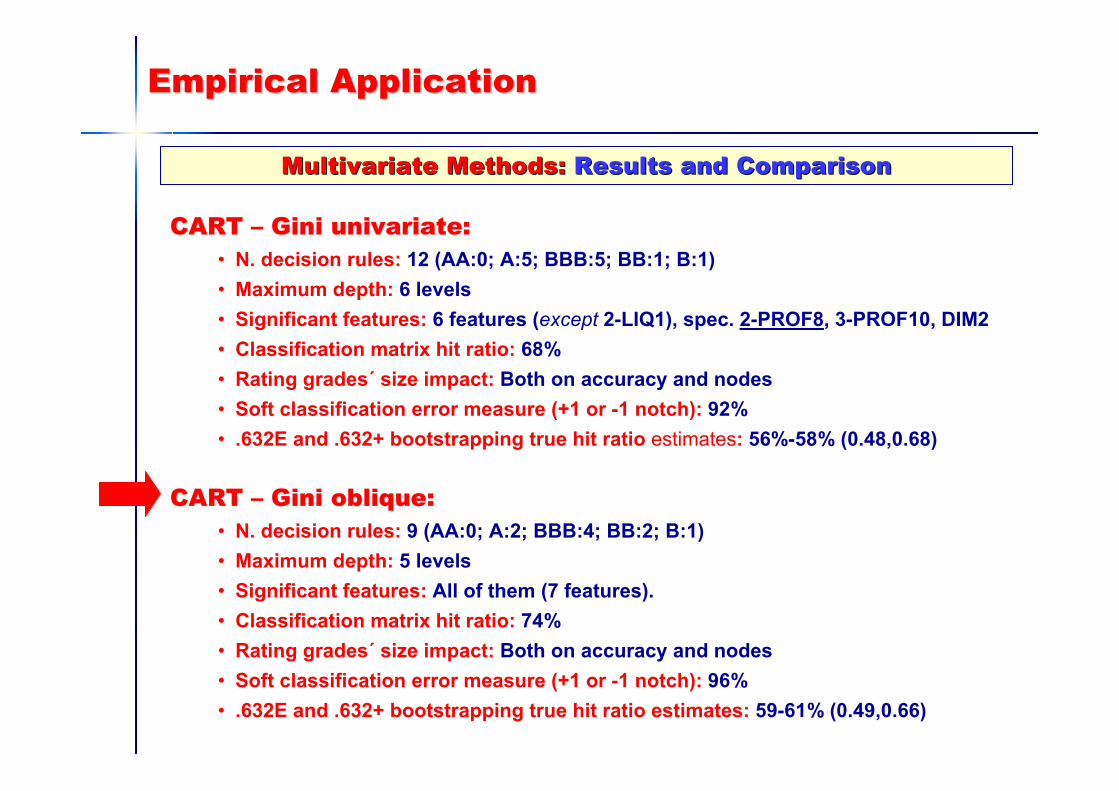
CART – Gini oblique:• N. decision rules: 9 (AA:0; A:2; BBB:4; BB:2; B:1)• Maximum depth: 5 levels• Significant features: All of them (7 features).• Classification matrix hit ratio: 74%• Rating grades´ size impact: Both on accuracy and nodes• Soft classification error measure (+1 or -1 notch): 96%• .632E and .632+ bootstrapping true hit ratio estimates: 59-61% (0.49,0.66)
CART – Gini univariate:• N. decision rules: 12 (AA:0; A:5; BBB:5; BB:1; B:1)• Maximum depth: 6 levels• Significant features: 6 features (except 2-LIQ1), spec. 2-PROF8, 3-PROF10, DIM2• Classification matrix hit ratio: 68%• Rating grades´ size impact: Both on accuracy and nodes• Soft classification error measure (+1 or -1 notch): 92%• .632E and .632+ bootstrapping true hit ratio estimates: 56%-58% (0.48,0.68)

OverviewOverview
1. Introduction
2. Researches on external credit rating determinants
3. A proposal for modelling rating determinants3.1. Feature Selection3.2. Multivariate analyses3.3. Models’ evaluation3.4. Bayesian hybrid proposal
4. Empirical application4.1. Data and sample
4.2. Feature selection4.3. Multivariate models: results and comparisons
5. Conclusions
ConclusionsConclusions
- According Basel ll, the Internal Ratings-Based (IRB) approach for credit riskmanagement and control is based on the estimate of the probability of default (PD) ofborrowers.
- For corporate, sovereign and bank exposures, the estimate of PD may be obtainedthrough the mapping of internal grades to external data, based on a comparison ofinternal and external rating determinants.
- Additionally, the Solvency II Project uses external ratings for assisting supervisors, conditioned to the comprehensibility of methodologies and ratings’ determinants.
- In the literature, ratings’ deteminants have been analysed for industrial corporations and banks, but researches on insurance firms are much more limited.
- In this paper, we proposed a four-stage model, based on statistical techniques andMachine Learning models, to analyse rating determinants, that was applied to a sample of European insurance firms.

ConclusionsConclusions
- Several multivariate models were applied, including MDA, multivariate logitregression, ordinal logit, and decision trees as C4.5, CART-Gini univariate and CART-Gini oblique.
- Previous models were compared through their comprehensibility and accuracy, using .632E and .632E+ bootstrap variants.
- The CART-Gini oblique tree with nine non-simple decision rules outperformed allother models, and could be a satisfactory solution for the problem of financial strengthratings’ determinants.
- In the future, an out-of-time validation test must be performed, together to the full development of the Bayesian hybrid proposal. Also, other Machine Learningtechniques should be tested.
- The initial feature selection process selected seven financial ratios as relevantattributes, concerning firms’ liquidity, profitabilty and size.