back analysis of the crandall canyon mine using the lamodel program · back analysis of the...
TRANSCRIPT

Back Analysis of the Crandall Canyon Mine
Using the LaModel Program
By
Keith A. Heasley, Ph.D., P.E. June 20, 2008

ii
Executive Summary On August 6th, 2007, the Crandall Canyon Mine in Utah collapsed entrapping six miners. It appeared that a large area of pillars in the Main West and South Barrier sections of the mine had bumped in a brief time period, filling the mine entries with coal from the failed pillars and entrapping the six miners working in the South Barrier section. Ten days later, during the heroic rescue effort, another bump occurred thereby killing three of the rescue workers, including one federal inspector, and injuring six other rescue workers. A few days after the August 16th incident, a panel of ground control experts determined that the Main West area was structurally un-stable and underground rescue attempts halted. Subsequently the mine was abandoned and sealed. The objective of this investigation is to utilize the LaModel boundary-element program along with the best available information to back-analyze the August 6th, 2007 collapse at the Crandall Canyon Mine in order to better understand the geometric and geo-mechanical factors which contributed to that collapse. Ultimately, it is hoped that this back-analysis will help determine improvements in mine design that can be made in the future to eliminate similar type events. In order to determine the optimum parameter values for matching the observed mine behavior, to assess the sensitivity of the model results to the input values, and to investigate various triggering mechanisms, an extensive parametric analysis was performed. This analysis examined: different overburden properties, gob properties, coal behavior and triggering mechanisms. In all, over 230 different models were run to perform the parameter optimization, sensitivity analysis and trigger investigation. Based on this extensive back analysis of the Crandall Canyon Mine using the LaModel program and with the benefit of hindsight from the March bump and August collapse, a number of conclusions can be made concerning the mine design and August 6th collapse: 1) Overall, the Main West and adjacent North and South Barrier sections were primed for a
massive pillar collapse because of the large area of equal size pillars and the near unity safety factors. This large area of undersized pillars was the fundamental cause of the collapse. a. The pillars and inter-panel barriers in this portion of the Crandall Canyon Mine
essentially constitute a large area of similar size pillars, one of the essential ingredients for a massive pillar collapse.
b. The high overburden (2200 ft) was causing considerable development stress on the pillars in this area, and bringing pillar development safety factors below 1.4.
c. Considerable longwall abutment stress was overriding the barrier pillars between the active sections and the old longwall gobs.
2) The abutment stress from the active North Barrier retreat section was key to the March 10th bump occurrence and the modeling indicated that the North Barrier abutment stress contributed to the August 6th pillar collapse.
3) From the modeling, it is not clear exactly what triggered the August collapse. A number of factors or combination of factors could have been the final perturbation that initiated the collapse of the undersized pillars in the Main West area.
4) LaModel analysis demonstrated that the active pillar recovery mining in the South Barrier section could certainly have been the trigger that initiated the August collapse; however, the modeling by itself does not indicate if the active mining was the most likely trigger.

iii
Table of Contents Page Executive Summary .....................................................................................................ii List of Figures.................................................................................................................v 1. Objective ....................................................................................................................1 2. Background ...............................................................................................................1 2.1 The Crandall Canyon Mine...................................................................................1 2.2 The LaModel Program..........................................................................................1 2.2.1 Calibrating LaModel.................................................................................2 2.2.1.1 Rock Mass Stiffness...................................................................3 2.2.1.2 Gob Stiffness..............................................................................4 2.2.1.3 Coal Strength..............................................................................8 2.2.1.4 Post-Failure Coal Behavior ........................................................9 2.2.2 LaModel and Bumps ...............................................................................10 2.2.3 LaModel and Massive Pillar Collapses...................................................11 2.2.4 LaModel and Time and Homogeneity....................................................11 2.2.5 Pillar Safety Factors in LaModel ............................................................12 3. The LaModel Analysis ........................................................................................15 3.1 Approach………….. ...........................................................................................15 3.2 Basic Calibration Points......................................................................................15 3.2.1 Main West...............................................................................................15 3.2.2 North Barrier...........................................................................................15 3.2.3 South Barrier...........................................................................................18 3.2.4 Results of the August 6th Collapse ..........................................................18 3.3 The LaModel Grid ..............................................................................................18 3.4 Calibrating the Critical Parameters.....................................................................19 3.4.1 Determining the Rock Mass Lamination Thickness ...............................19 3.4.2 Determining the Gob Stiffness................................................................21 3.4.3 Determining the Coal Strength ...............................................................22 3.4.3.1 Back Analysis of the North Barrier Bump...............................23 3.5 Analyzing the August 6th Collapse .....................................................................26 3.5.1 Primary Results.......................................................................................26 3.5.2 Triggering the Collapse of the South Barrier Section.............................30 3.5.2.1 Reduced Coal Strength.............................................................31

iv
Page 3.5.2.2 Joint Slip ..................................................................................31 3.5.2.3 Softer Southern Gob.................................................................36 3.6 Parametric Analysis ............................................................................................36 3.7 Final Back Analysis Model.................................................................................38 4. Summary…………….. ............................................................................................42 5. Conclusions…………….. .......................................................................................43 References………………..............................................................................................45
v
List of Figures Page 2.1 Conceptualization of the abutment angle....................................................................6 2.2 Suggested stability factors for the ARMPS deep-cover database...............................7 2.3 Stress-strain and safety factor curves for the North Barrier 60 X 70 pillar ..............14 3.1 Map of the Main West area.......................................................................................16 3.2 Rib and pillar failure in the North Barrier section as of March 16th 2007................17 3.3 Overburden stress as calculated by LaModel ...........................................................20 3.4 Average gob stress as a function of lamination thickness and final gob modulus ...22 3.5 Analysis of North Barrier bump ...............................................................................24 3.6 Plot of pillar and element safety factors for step 3 ...................................................27 3.7 Plot of pillar and element safety factors for step 5 ...................................................28 3.8 Plot of pillar safety factors with coal strength adjusted in Main West .....................29 3.9 Plot of pillar and element safety factors for step 6 with 4 pillars removed ..............32 3.10 Plot of pillar safety factors for weakened coal in the Main West.............................33 3.11 Plot of pillar safety factors for the model with a joint at crosscut 137 .....................34 3.12 Plot of pillar safety factors for softer gob in the southern panels .............................35 3.13 Final model of Crandall Canyon Mine – steps 3 & 5 ...............................................40 3.14 Final model of Crandall Canyon Mine – step 9 ........................................................41
- 1 -
1. Objective The objective of this investigation is to utilize the LaModel boundary-element program along with the best available information to back-analyze the August 6th, 2007 collapse at the Crandall Canyon Mine in order to better understand the geometric and geo-mechanical factors which contributed to that collapse. A secondary objective of this work is to perform a parametric analysis of the pertinent input parameters to assess the sensitivity of the model results to the input values. Ultimately, it is hoped that this back-analysis will help determine improvements in mine design that can be made in the future to eliminate similar type events.
2. Background
2.1 The Crandall Canyon Mine On August 6th, 2007, the Crandall Canyon Mine in Utah collapsed entrapping six miners. It appeared that a large area of pillars in the Main West and South Barrier sections of the mine had bumped in a brief time period, filling the mine entries with coal from the failed pillars and entrapping the six miners working in the South Barrier section. The seismic event associated with the initial accident registered 3.9 on the Richter scale. Ten days later during the heroic rescue effort, another bump occurred thereby killing three of the rescue workers, including one federal inspector, and injuring six other rescue workers. A few days after the August 16th incident, a panel of ground control experts determined that the Main West area was structurally unstable and posed a significant risk to anyone entering the area. At this point, underground rescue attempts halted and subsequently the mine was abandoned and sealed. 2.2 The LaModel Program The LaModel program is used to model the stresses and displacements on thin tabular deposits such as coal seams. It use the displacement-discontinuity (DD) variation of the boundary-element method, and because of this formulation, it is able to analyze large areas of single or multiple-seam coal mines (Heasley, 1998). LaModel is unique among boundary element codes because the overburden material includes laminations which give the model a very realistic flexibility for stratified sedimentary geologies and multiple-seam mines. Using LaModel, the total vertical stresses and displacements in the coal seam are calculated, and also, the individual effects of multiple-seam stress interactions and topographic relief can be separated and analyzed individually. Since LaModel’s original introduction in 1996, it has continually been upgraded (based on user requests) and modernized as operating systems and programming languages have changed. The present program is written in Microsoft Visual C++ and runs in the windows operating system. It can be used to calculate convergence, vertical stress, overburden stress, element safety factors, pillar safety factors, intra-seam subsidence, etc. on single and multiple seams with complex geometries and variable topography. Presently, the program can analyze a 1000 x 1000 grid with 6 different material models and 26 different individual in-

- 2 -
seam materials. It uses a forms-based system for inputting model parameters and a graphical interface for creating the mine grid. Also, it includes a utility referred to as a “Wizard” for automatically calculating coal pillars with a Mark-Bienawski pillar strength and another utility to assist with the development of “standard” gob properties. Recently, the LaModel program was interfaced with AutoCAD to allow mine plans and overburden contours to be automatically imported into the corresponding seam and overburden grids. Also, the output from LaModel can be downloaded into AutoCAD and overlain on the mine map for enhanced analysis and graphical display. 2.2.1 Calibrating LaModel:
The accuracy of a LaModel analysis depends entirely on the accuracy of the input parameters. Therefore, the input parameters need to be calibrated with the best available information, either: measured, observed, or empirically or numerically derived. However, in calibrating the model, the user also needs to consider that the mathematics in LaModel are only a simplified approximation of the true mechanical response of the overburden and because of the mathematical simplifications built into the program, the input parameters may need to be appropriately adjusted to reconcile the program limitations.
In particular, after many years of experience with the program, it is clear that in many situations the overburden model in LaModel is not as flexible as the true overburden. The laminated overburden model in LaModel is inherently more flexible than a homogeneous elastic overburden as used in previous displacement-discontinuity codes and it is more flexible than a stratified elastic model without bedding plane slip as used in many finite-element programs. However, using reasonable values of input parameters, the LaModel program still does not produce the level of seam convergence and/or surface subsidence as measured in the field. It is believed that this displacement limitation in the model may be due to the lack of any consideration for vertical joint movement in the program. The laminated model makes a good attempt at simulating bedding plane slip in the overburden, but it does not consider any overburden movement due to vertical/sub-vertical joint slip, thereby limiting the amount of calculated displacements.
Knowing the inherent limitations of LaModel, the user can either calibrate for realistic stress output or for realistic displacement output. In general, it is not possible to accurately model both with the same set of material parameters. If the user calibrates the model to produce realistic stress values, then the input parameters are optimized to match as closely as possible the observed/measured stress levels from the field, and it is likely that the calculated displacement values will be low. On the other hand, if the user optimizes the input parameters to produce realistic displacement /subsidence values, then generally, the calculated stress values will be inaccurate. Historically, the vast majority of LaModel users have been interested in calculating realistic stresses and loads, and in this back-analysis of the pillar stability at the Crandall Canyon Mine realistic stress and load calculations are also the primary objective.
When actually building a model, the geometry of the mining in the seams and the topography are fairly well known and fairly accurately discretized into LaModel grids. The most critical input parameters with regard to accurately calculating stresses and loads, and, therefore, pillar stability and safety factors, are then:

- 3 -
• The Rock Mass Stiffness • The Gob Stiffness • The Coal Strength
These three parameters are always fundamentally important to accurate modeling with LaModel and particularly so in simulations analyzing abutment stress transfer (from gob areas) and pillar stability as in the Crandall Canyon Mine situation. During model calibration, it is critical to note that these parameters are strongly interrelated, and because of the model geo-mechanics, the parameters need to be calibrated in the order shown above. With this sequence of parameter calibration, the calibrated value of the subsequent parameters is determined by the chosen value of the previous parameters, and changing the value of any of the preceding parameters will require re-calibration of the subsequent parameters. The model calibration process as it relates to each of these parameters is discussed in more detail below. 2.2.1.1 Rock Mass Stiffness: The stiffness of the rock mass in LaModel is primarily determined by two parameters, the rock mass modulus and the rock mass lamination thickness. Increasing the modulus or increasing the lamination thickness of the rock mass will increase the stiffness of the overburden. With a stiffer overburden: 1) the extent of the abutment stresses will increase, 2) the convergence over the gob areas will decrease and 3) the multiple seam stress concentrations will be smoothed over a larger area. When calibrating for realistic stress output, the rock mass stiffness should be calibrated to produce a realistic extent of abutment zone at the edge of the critical gob areas. Since changes in either the modulus or lamination thickness cause a similar response in the model, it is most efficient to keep one parameter constant and only adjust the other. When calibrating the rock mass stiffness, it has been found to be most efficient to initially select a rock mass modulus and then solely adjust the lamination thickness for the model calibration. In calibrating the lamination thickness for a model based on the extent of the abutment zone, it would be best to use specific field measurements of the abutment zone from the mine. However, often these field measurements are not available. In this case, visual observations of the extent of the abutment zone can often be used. Most operations personnel in a mine have a fairly good idea of how far the stress effects can be seen from an adjacent gob. Without any field measurements or observations, general historical field measurements can be used. For instance, historical field measurements would indicate that, on average, the extent of the abutment zone (D) at depth (H) (with both terms expressed in units of ft) should be (Mark and Chase, 1997; Mark, 1992):
H9.3 D = (2.1) or that 90% of the abutment load should be within: H5D = (2.2)
Once the extent of the abutment zone (D) at a given site is determined, an equation recently derived from the fundamental laminated overburden model can be used to determine

- 4 -
the lamination thickness (t) required to match that abutment extent based on the value of some of the other site parameters:
2
g
2s
)L-ln(1d-D
ME)v12(12E
t
×
×−
= (2.3)
Where: E = The elastic modulus of the overburden v = The Poisson’s Ratio of the overburden Es = The elastic modulus of the seam M = The seam thickness d = The extent of the coal yielding at the edge of the gob Lg = The fraction of gob load within distance D
As mentioned previously, there is a practical trade-off between getting a realistic stress distribution and getting realistic convergence. Equation 2.3 provides an optimum lamination thickness to use for matching the desired abutment stress extent; it should not be used for determining the optimum lamination thickness for accurately calculating displacement and/or subsidence values. Furthermore, when using equation 2.3, the user is fairly accurately matching the “global” stress transfer in the field with the global stress transfer in the model. In many practical mining situations, the more “local” stress transfer between adjacent pillars or between adjacent multiple seams is probably determined by the local flexing of the thinner strata laminations in the immediate roof or interburden. To optimally match these more local effects or to compromise between matching global and local stress transfer, a thinner lamination thickness than determined by equation 2.3 may be appropriate.
2.2.1.2 Gob Stiffness: In a LaModel analysis with gob areas, an accurate input stiffness for the gob (in relation to the stiffness of the rock mass) is critical to accurately calculating pillar stresses and safety factors. The relative stiffness of the gob determines how much overburden weight is carried by the gob; and therefore, not transferred to the surrounding pillars as an abutment stress. This means that a stiffer gob carries more load and the surrounding pillars carry less, while a softer gob carries less load and the surrounding pillars carry more. In LaModel, three models are available to simulate gob behavior: 1) linear-elastic, 2) bilinear and 3) strain-hardening. The gob wizard available in LamPre is designed to assist the user in developing strain-hardening input parameters. In the strain hardening model, the stiffness of the gob is primarily determined by adjusting the “Final Modulus” (Heasley, 1998; Pappas and Mark, 1993; Zipf, 1992). A higher final modulus gives a stiffer gob and a lower modulus value produces a softer gob material. Given that the behavior of the gob is so critical in determining the pillar stresses and safety factors, it is a sad fact that our knowledge of insitu gob properties and stresses is very poor. For a calibrated LaModel analysis, it is imperative that the gob stiffness be calibrated with the best available information on the amount of abutment load (or gob load) experienced at that mine. Once again, it would be best to use specific field measurements of the abutment load or gob load from the mine in order to determine realistic gob stiffness. However, these

- 5 -
types of field measurements are quite rare (and sometimes of questionable accuracy). Also, visual observations are not very useful for estimating abutment loads or gob loads; and therefore, general empirical information is quite often the only available data. In order to calibrate the gob stiffness for a practical situation, it is best to consider a number of general guiding factors. For a first approximation, a comparison of the present gob width and the critical gob width for the given depth can provide some insight. For a critical (or supercritical) panel width (where the maximum amount of subsidence has been achieved), it would be expected that the peak gob load in the middle of the panel would approach the insitu overburden load. As the depth increases from the critical situation and the gob width becomes more subcritical, a laminated overburden analysis with a linear gob material would suggest that the peak gob load would increase linearly with depth from the load level in the critical case (Chase et al., 2002; Heasley, 2000). The critical depth (Hc) for a given gob width (P) and abutment angle (ß) can be calculated as:
) ß tan(2
PH c ×
= (2.4)
Where: P = Panel Width (ft) β = Abutment Angle and then the expected average gob stress (s gob-lam-av) at the actual seam depth (H) can be calculated as:
×
=
××
=− 288
H1442
HHH
s c
cavlam-gob
δδ (2.5)
Where: H = Seam Depth (ft) δ = Overburden Density (lbs/cu ft) Equation 2.5, which is based on a laminated overburden and a linear elastic gob, implies that the average gob stress for a subcritical panel is solely a function of the depth and equal to half of the insitu stress. (In reality, gob material is generally considered to be strain-hardening and therefore, equation 2.5 may underestimate the actual gob loading. ) Another factor to consider in estimating the gob stiffness and the abutment loading is the abutment angle concept utilized in ALPS and ARMPS. In both these programs, an average abutment angle of 21º was determined from a large empirical database and is used to calculate the abutment loading. Using the abutment angle concept and the geometry shown in Figure 2.1, the average gob stress (s gob-sup-av) for a supercritical panel can be calculated as:
( )
×−
×
=− PtanßHP
144H
s avsup-gobδ
(2.6)
Where: H = Seam Depth (ft) δ = Overburden Density (lbs/cu ft)
- 6 -
P = Panel Width (ft) β = Abutment Angle Similarly, the average gob stress (s gob-sub-av) for a subcritical panel can be calculated from the geometry in Figure 2.1 as:
=− 144tanß
14P
s avsub-gobδ
(2.7)
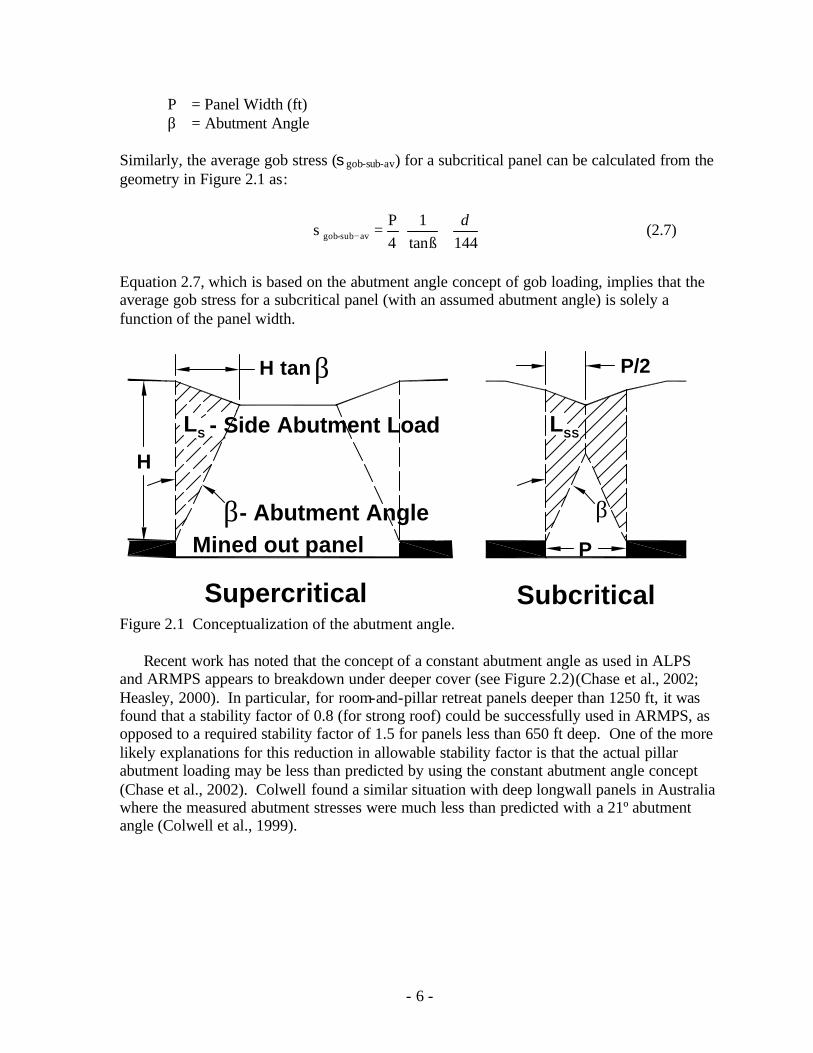
Equation 2.7, which is based on the abutment angle concept of gob loading, implies that the average gob stress for a subcritical panel (with an assumed abutment angle) is solely a function of the panel width.
H
Mined out panel
LS
Supercritical
- Abutment Angle
- Side Abutment Load
H tan β
βP
SSL
P/2
Subcritical
β
Figure 2.1 Conceptualization of the abutment angle.
Recent work has noted that the concept of a constant abutment angle as used in ALPS
and ARMPS appears to breakdown under deeper cover (see Figure 2.2)(Chase et al., 2002; Heasley, 2000). In particular, for room-and-pillar retreat panels deeper than 1250 ft, it was found that a stability factor of 0.8 (for strong roof) could be successfully used in ARMPS, as opposed to a required stability factor of 1.5 for panels less than 650 ft deep. One of the more likely explanations for this reduction in allowable stability factor is that the actual pillar abutment loading may be less than predicted by using the constant abutment angle concept (Chase et al., 2002). Colwell found a similar situation with deep longwall panels in Australia where the measured abutment stresses were much less than predicted with a 21º abutment angle (Colwell et al., 1999).

- 7 -
Design Line
0
0.5
1
1.5
2
650 850 1050 1250 1450 1650 1850
Depth of Cover (ft)
AR
MP
S S
tab
ility
Fac
tor Successful Case
Unsuccessful Case
Figure 2.2 Suggested stability factors for the ARMPS deep-cover database.
The degree to which a constant abutment angle might overestimate the abutment loading
can be investigated by comparing the recommended NIOSH stability factors for shallow and deep cover. Below 650 ft, a stability factor greater than 1.5 is recommended but, at depths greater than 1250 ft, 0.8 is acceptable. Since higher coal strengths have not been correlated with greater depth, it is most likely that the lower stability factor recommendation is due to an overestimate of applied stress or load. Based on the NIOSH recommendations, it appears that the abutment loading based on the constant abutment angle of 21° could be as much as 1.875 (1.5/0.8) times higher than actual loading experienced in the field. Implementing this adjustment produces the following equation for an adjusted average gob load for a subcritical panel based on the abutment angle concept (given without derivation):
( )
∗
∗
∗
−∗∗
−=− 144
Htanß 4H
Ptanß4H1.50.8
1s avadj-gob
δ (2.8)
Where: H = Seam Depth (ft) δ = Overburden Density (lbs/cu ft) P = Panel Width (ft) β = Abutment Angle
The preceding discussion on gob stiffness and loading has produced several competing
concepts/equations. Equation 2.5, which is based on a laminated overburden model and a linear elastic gob, implies that the average gob stress for a subcritical panel is solely a function of the depth. Equation 2.7, which is based on the abutment angle concept of gob loading, implies that the average gob stress for a subcritical panel is solely a function of the panel width. Equation 2.8 modifies the abutment angle concept in an attempt to produce more realistic results for panels deeper than 1250 ft.

- 8 -
It is not entirely clear which concept or equation provides the most realistic estimates of gob stress. From recent experience, Equation 2.7 appears to provide a lower bound for realistic gob stresses and Equation 2.8 appears to provide an upper bound. Equation 2.5 is between the bounds set by equations 2.7 & 2.8 and may provide a reasonable starting point for further calibration. Regardless of which equation is chosen as a starting point, it is clear that a realistic gob/abutment loading is critical to a realistic model result and that the gob stiffness should be carefully analyzed and calibrated in a realistic model.
If the user desires to calibrate the abutment and/or gob loading in the model based on a laminated approximation or a specific abutment angle, then either equation 2.5, 2.7 or 2.8, depending on the situation, could be used to determine the average gob loading. Each of these equations provides an estimate of average gob stress. After choosing among them, the user would need to run several models with various gob stiffnesses (in LaModel or LaM2D), measure the average gob loading in the model, and then choose the final gob modulus which best fits the estimated gob stress.
2.2.1.3 Coal Strength: Accurate insitu coal strength is another value which is very difficult to obtain and yet is critical to determining accurate pillar safety factors. It is difficult to get a representative laboratory test value for the coal strength and scaling the laboratory values to accurate insitu coal pillar values is not very straightforward or precise (Mark and Barton, 1997). For the default coal strength in LaModel, 900 psi (Si) is used in conjunction with the Mark-Bieniawski pillar strength formula (Mark, 1999):
−
+=
lhw
0.18hw
0.540.64SS2
ip (2.9)
Where: Sp = Pillar Strength (psi) Si = Insitu Coal Strength (psi) w = Pillar Width l = Pillar Length h = Pillar Height This formula also implies a stress gradient from the pillar rib that can be calculated as:
+=
hx
2.16 0.64S(x)s ip (2.10)
Where: s p(x) = Peak Coal Stress (psi) x = Distance into Pillar Si = Insitu Coal Strength (psi) h = Pillar Height The best technique to determine appropriate coal strength for LaModel is to back analyze a previous mining situation (similar to the situation in question) where the coal was close to,

- 9 -
or past, failure. Back-analysis is an iterative process in which coal strength is increased or decreased to determine a value that provides model results consistent with the actual observed failure. This back analysis should, of course, use the previously determined optimum values of the lamination thickness and gob stiffness. If there are no situations available where the coal was close to failure, then the back-analysis can at least determine a minimum insitu coal strength with some thought of how much stronger the coal may be, or the default average of 900 psi can be used. The 900 psi insitu coal strength that is the default in LaModel comes from the databases used to create the ALPS and ARMPS program and is supported by considerable empirical data. It is the author’s opinion that insitu coal strengths calculated from laboratory tests are not more valid than the default 900 psi, due to the inaccuracies inherent to the testing and scaling process for coal strength. If the LaModel user chooses to deviate very much from the default 900 psi, they should have a very strong justification, preferably a suitable back analysis as described above. 2.2.1.4 Post-Failure Coal Behavior: The present understanding of the post failure behavior of coal pillars is very limited, and most of this understanding comes from the analysis of coal specimens tested in the laboratory, not pillars in the field (Barron, 1992; Das, 1986). It is generally understood that a slender coal specimen tested past its ultimate strength will initially reach maximum peak strength at the point of “failure” and then, with further strain, the specimen will “soften” (carry increasingly less load as it continues to be deformed) until the broken coal reaches a final “residual” strength. In general, as the specimen width-to-height ratio increases or the confining pressure on the specimen increases, the peak strength will increase, the residual strength will increase, and the softening modulus will flatten. At a particular width-to-height ratio (Das found this to be approximately 8:1) or confining stress, the specimen will no longer soften after elastic failure, but will become essentially “elastic-plastic”. At higher width-to-height ratios or confining pressure, the coal specimens actually become “strain-hardening”, where they carry increasing load with increasing deformation after elastic failure. There is also some information that indicates that coal in the field may actually become pseudo-ductile at very high confining stresses (Barron, 1992; Heasley and Barron, 1988). When the post- failure behavior of coal pillars needs to be accurately simulated (as is the case with this back-analysis of Crandall Canyon Mine), “residual strength” and “residual strain” must be determined accurately. These parameters essentially define the pillar post-failure behavior. Some insights to residual strength and residual strain have been provided by laboratory tests where the peak and residual strength are seen to increase with increased confining pressure (or distance into the pillar) while the softening modulus decreases with increased confinement. These trends are also seen/assumed to be valid in the field. Some pioneering work in trying to accurately quantify the strain softening behavior of coal pillars for boundary-element modeling was done by Karabin and Evanto (1999). In this work, they developed an equation from field measurements which estimated an ultimate residual stress level (s r):
( )( ) (x)s xln 0.2254(x)s pr ×= (2.11) Where:
- 10 -
s r(x) = Residual Stress (psi) s p(x) = Peak Stress (psi) x = Distance into Pillar and the strain level (er) for the final residual stress:
(x)e 4(x)e pr ×= (2.12) Where: er(x) = Residual Strain (psi) ep(x) = Peak Strain (psi) x = Distance into Pillar These post- failure stress-strain relationships are consistent with trends in the load/deflection response of coal samples as described above; however, Karabin and Evanto certainly note that these properties are only “first approximations” and must be verified for accuracy. For use in LaModel or any boundary element model, these are some of the only post-failure coal properties calculations available. Certainly, this is an area for additional research. (It should be noted in equation 2.11 that the value, “0.2254” essentially determines the global magnitude of the residual stress in this strain-softening coal model and that the value of “4” in equation 2.12 essentially determines the global magnitude of the residual strain value in this strain-softening model. For LaModel calibration purposes, these single values can be adjusted in order to vary the residual strength or strain of the coal model.) 2.2.2 LaModel and Bumps: The term “bump” is used in this report to describe the sudden violent failure of a coal pillar or rib which ejects coal into the adjacent openings. At the present time, the exact mechanics of coal bumps are not completely understood. However, a lot of research has been done to understand the bump phenomenon, and a lot of progress has been made. Bumps are known to be associated with deep cover, competent strata and retreat mining which concentrates overburden stress. Also, it is known that bump behavior can be triggered in laboratory specimens by using a “soft” loading system or by suddenly releasing confining stresses. The past bump research has produced many significant improvements in minimizing or eliminating coal bumps (in some situations ) through better mine designs and cut sequencing. However, in general, it is still not possible to precisely predict whether a particular pillar or mine plan will bump, nor is it generally possible to predict the exact timing of a bump event. Bump prediction can be readily compared to earthquake prediction. The general area and nature of certain earthquakes (bumps) are well understood, but predicting the exact timing, location and magnitude of the next earthquake (bump) is still beyond the present scientific capability. In LaModel, a bump is simply simulated as a pillar (or coal) failure. LaModel does not calcula te any of the details of the coal or overburden failure mechanics; the program does not consider whether a bump occurs from simply overloading the coal or whether there is some external loading mechanism or sudden loss of confinement. However, coal that bumps has to be at, or very near, its ultimate failure strength at the time of the bump; therefore, it is reasonable to associate the point of coal failure in LaModel simulations with potential coal

- 11 -
bumps. Since LaModel does not have any dynamic capabilities, it cannot distinguish between a gentle controlled pillar failure and a violent pillar bump. However, that distinction can generally be determined from the geology and/or history of the mine. In some mines, the pillars fail gently while in other mines, with “bump-prone” conditions, pillar failure is likely to occur as a bump. Therefore, in a bump-prone mine or in bump-prone conditions, it can be assumed that any pillar failure could be a potential bump. 2.2.3 LaModel and Massive Pillar Collapses: The term massive pillar collapse (also called “cascading pillar failures”, “domino-type failures” or “pillar runs”) refers to the situation in a room-and-pillar mine where a large area of undersized pillars dynamically fails. In a massive pillar collapse, it is generally assumed that one pillar fails (for some reason), it sheds its load to the adjacent pillars, causing them to fail, and so forth (Mark et al,, 1997). This phenomenon has occurred a dozen or so times in the U.S, and has been fairly well documented and analyzed (Mark et al., 1997; Zipf, 1996). The basic condition for a massive pillar collapse is a large area of pillars loaded almost to failure. Generally, the roof and floor must be fairly competent or they would yield and relieve the pressure on the pillars. Also, the pillars have to be strain-softening in order for them to shed load and propagate the collapse. (On initial inspection, the Crandall Canyon Mine failure certainly appears to be consistent with a massive pillar collapse; however, the depth of the mine workings, the size of the collapse area and the bump-type failure set this failure outside of the previous database of massive pillar collapses.) In LaModel, a massive pillar collapse is simulated when a “small” change in the mining condition results in a “large” number of pillars failing over a “large” area. The small change in mining condition can be any one (or combination) of a number of items: an additional cut or two, the pulling of another pillar, a small drop in coal strength (e.g. deterioration over time), the sudden movement on a fault or joint, etc. Of course, in LaModel, as in reality, to accurately simulate the massive pillar collapse, a large area of pillars must be close to failure and they must be strain-softening. 2.2.4 LaModel and Time and Homogeneity: A complete discussion of LaModel calibration must also address time and homogeneity. In a LaModel analysis, the solutions are static. The model converges on a static solution of stresses and displacements based on the given geometry and material properties. In reality, we know that geologic materials change over time without necessarily any outside stress or displacement influence. Coal pillars can slough, weaken and fail, roof rock can crack, soften and fall, and floors can heave, etc. In fact, the geo-mechanical environment in a mine is very dynamic. Not only is the geometry constantly changing due to the active mining, but the pillars, roof and floor are continuously adjusting to the stresses through time. Generally, the geo-mechanical adjustment to new stresses initially occurs quickly and then slows exponentially as time advances. In a LaModel analysis, geologic materials are assumed to be perfectly homogeneous. The material behavior is identical at different locations in the model and the stresses and displacements are continuous and smooth from one location to another and from one step to the next. In reality, we know that geologic material is not homogeneous. The rock and coal have bedding planes, joints and other discontinuities, and the intrinsic material properties can change dramatically (10-20% or more) in very short distances. Similarly, failure in a mine is

- 12 -
not typically continuous and smooth. The roof and floor can appear essentially stable and then suddenly fail, pillars can suddenly slough or fail and certainly large cave/gob areas are known to advance in a stepwise fashion. Since LaModel does not inherently account for the effects of time or inhomogeneity, the user needs to consider these factors in the analysis and interpretation of any results. For instance, in a given cut sequence, LaModel may indicate that a certain pillar has just barely failed. In reality, considering time, it may take a little while for the pillar to ultimately fail, or considering homogeneity, the pillar may be a little weaker or stronger than modeled and may fail a little sooner or later in the cut sequence. The static and homogenous nature of LaModel actually resists sudden changes in stability. The classic example is the analysis of a large area of equal size (strain-softening) pillars. A LaModel analysis may show that all of these “equal” pillars have exactly the same stability factor that is a bit greater than one; and therefore, the area is stable. In reality, the pillars have some statistical distribution of strength, and the stability factor of each individual pillar is slightly different. So, even if the average stability factor of the section is greater than one, once the weakest pillar fails and sheds it load, this can overload the adjacent pillars and the whole section can collapse. To account for the assumptions regarding time and homogeneity inherent in LaModel, users must use some intuition to properly assess the realistic stability of the modeled mine plan. For example, the user needs to consider how the result might change if the material weakens over time, or if there is some variation in material properties. In an analysis of a massive pillar collapse with LaModel, small changes in material properties and/or geometry can cause large changes in pillar stability. Time dependent behavior or a local inhomogeneity in the material properties can have a large effect on the real stability of the situation and greatly affect the correspondence between the model and reality. Therefore, it is very difficult to “exactly” model unstable mining situations with LaModel; however, the general instability can easily be modeled. 2.2.5 Pillar Safety Factors in LaModel: Recently, the capability of calculating safety factors was added to the LaModel program (Hardy and Heasley, 1996). For the strain-softening and elastic-plastic material models, the safety factor is calculated as the ratio between the peak strain defined for that particular element and the applied strain:
a
p
e
eSF = (2.13)
Where: SF = Safety Factor ep = Peak Strain ea = Applied strain
For the linear elastic model, which has no pre-defined peak stress or strain, the strain safety factor is set to a default value of 10 (in order to adjust the scaling).
Conventionally, safety factors are calculated on a stress basis, rather than a strain basis. However, stress based calculations can be problematic when determining safety factors in the post-failure range in LaModel as inappropriate values result for the elastic-plastic and strain-softening material models. The strain-based safety factor calculation detailed above yields values equivalent to the stress-based calculation in the pre-failure range but also gives
- 13 -
appropriate values in the post- failure range for all the materials. Safety factors below 1.0 indicate that an element has failed. Values lower than 1.0 provide a measure of the amount of strain that has occurred beyond failure. For instance, an element which has compressed to twice the peak strain will generate a safety factor of 0.5. Therefore, the strain-based safety factor as shown in Equation 2.13 above is used throughout LaModel.
In LaModel, the safety factor is initially calculated for each individual element and this value can be displayed in the output. However, most users desire to know the safety factor for the entire pillar. In order to provide a pillar safety factor, safety factors from each individual element comprising a pillar are averaged. This algorithm is easy to implement, but does not necessarily give a pillar safety factor which equates to the safety factor that would be determined from a traditional analysis of the full stress-strain curve for the pillar. The safety factor calculation is accurate for the stress-strain curve of the individual elements, but when the element safety factors are averaged over the pillar, the average does not give a traditional safety factor result.
With strain-softening elements, the peak stress and peak strain are determined from the insitu coal strength, the coal modulus, and the distance of the element into the pillar (see equation 2.10). For the weaker elements at the edge of the pillar, the peak stress is reached at much lower levels of strain than the elements in the confined core of the pillar. After the edge elements reach peak stress, they soften as pillar strain continues and the interior elements move towards failure. At the point of peak pillar strength (the “traditional” point of failure and a unity safety factor) only a few elements in the core of the pillar are still in the elastic range and have safety factors greater than one. Thus, the overall safety factor for the pillar calculated from an average of the elements will be much lower than one. The exact magnitude of this reduced safety factor is determined by: the size and shape of the pillar, the amount of strain-softening in the elements, and the flexibility of the rock mass. Since the pillar elements do not reach peak stress at the same time, the ultimate strength of the pillar is not the sum of the ultimate strengths of the elements. In particular, the pillar peak stress is affected by the degree of strain softening input to the elements. (For a pillar made of elastic-perfectly plastic materials as generated by the LaModel coal wizard, the peak strength of the pillar will be the weighted sum of the peak strength of the elements.)
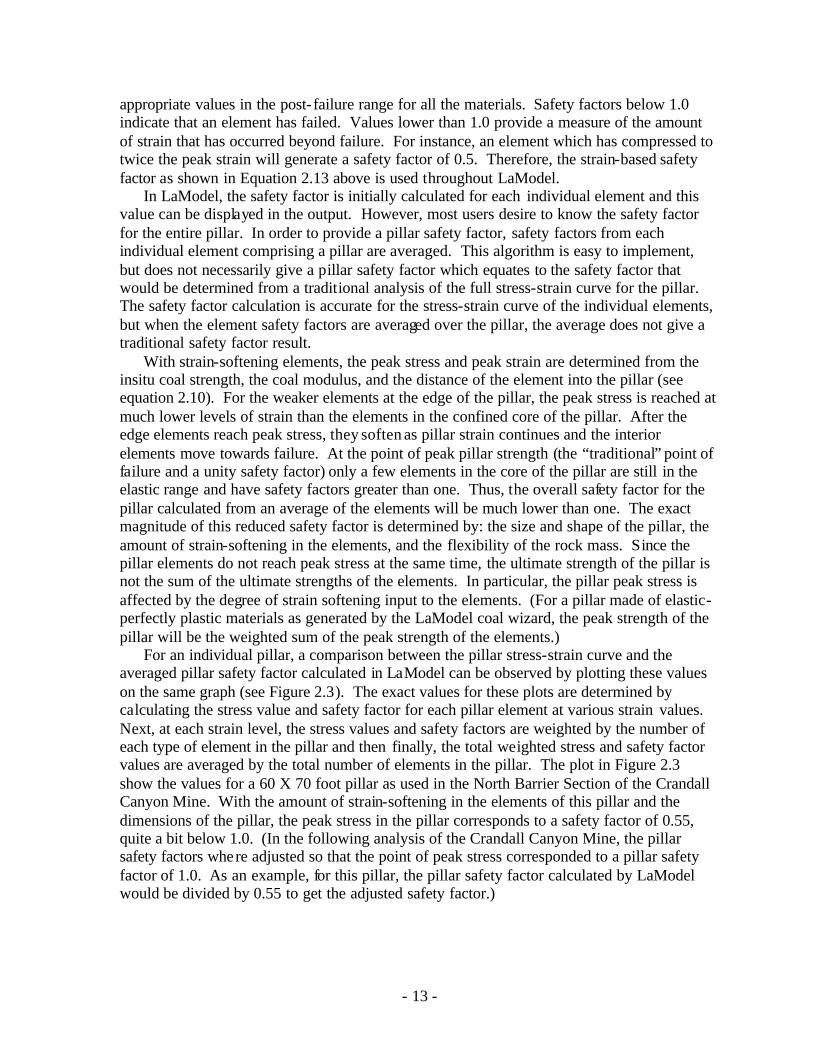
For an individual pillar, a comparison between the pillar stress-strain curve and the averaged pillar safety factor calculated in LaModel can be observed by plotting these values on the same graph (see Figure 2.3). The exact values for these plots are determined by calculating the stress value and safety factor for each pillar element at various strain values. Next, at each strain level, the stress values and safety factors are weighted by the number of each type of element in the pillar and then finally, the total weighted stress and safety factor values are averaged by the total number of elements in the pillar. The plot in Figure 2.3 show the values for a 60 X 70 foot pillar as used in the North Barrier Section of the Crandall Canyon Mine. With the amount of strain-softening in the elements of this pillar and the dimensions of the pillar, the peak stress in the pillar corresponds to a safety factor of 0.55, quite a bit below 1.0. (In the following analysis of the Crandall Canyon Mine, the pillar safety factors where adjusted so that the point of peak stress corresponded to a pillar safety factor of 1.0. As an example, for this pillar, the pillar safety factor calculated by LaModel would be divided by 0.55 to get the adjusted safety factor.)
- 14 -
Figure 2.3. Stress-strain and safety factor curves for the North Barrier 60 X 70 ft pillar.
0
500
1000
1500
2000
2500
3000
3500
4000
0.0000 0.0200 0.0400 0.0600 0.0800 0.1000
Strain
Str
ess
(psi
)
0.0
0.2
0.4
0.6
0.8
1.0
1.2
1.4
1.6
1.8
Pill
ar S
afet
y F
acto
r
Pillar Stress-Strain Curve
Average Element Safety Factor
Peak Stress, 3343Safety Factor, 0.55
0
500
1000
1500
2000
2500
3000
3500
4000
0.0000 0.0200 0.0400 0.0600 0.0800 0.1000
Strain
Str
ess
(psi
)
0.0
0.2
0.4
0.6
0.8
1.0
1.2
1.4
1.6
1.8
Pill
ar S
afet
y F
acto
r
Pillar Stress-Strain Curve
Average Element Safety Factor
Peak Stress, 3343Safety Factor, 0.55
- 15 -
3. The LaModel Analysis
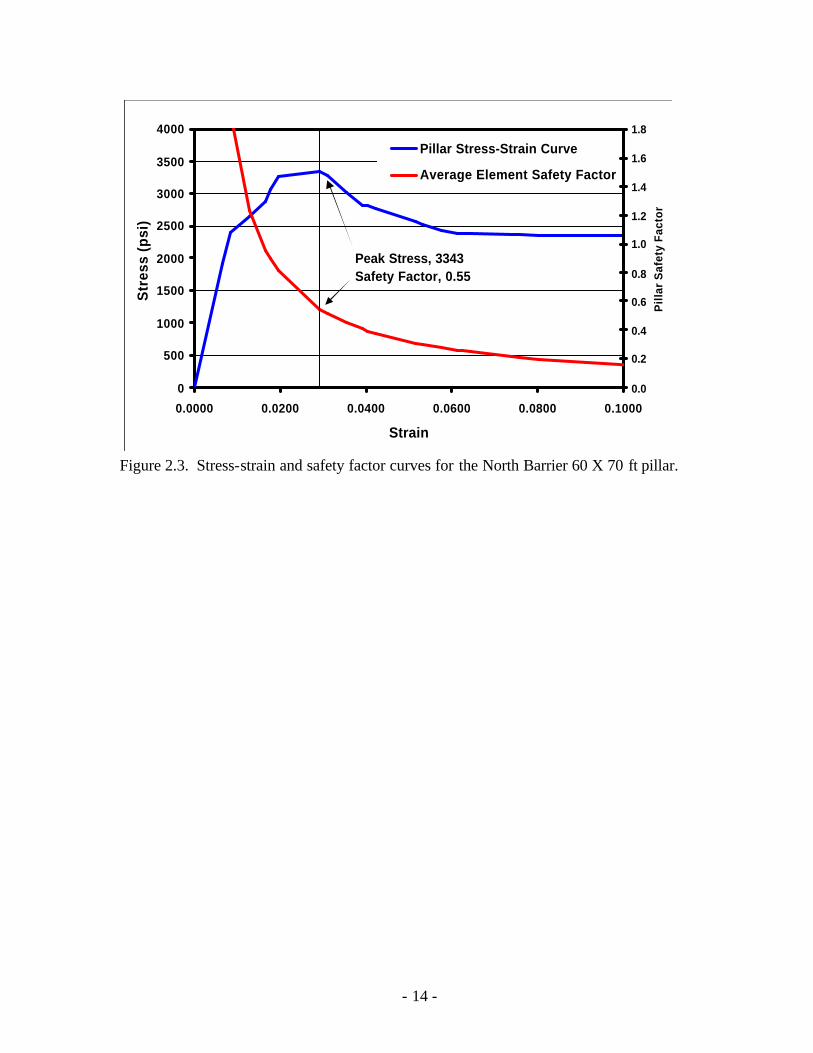
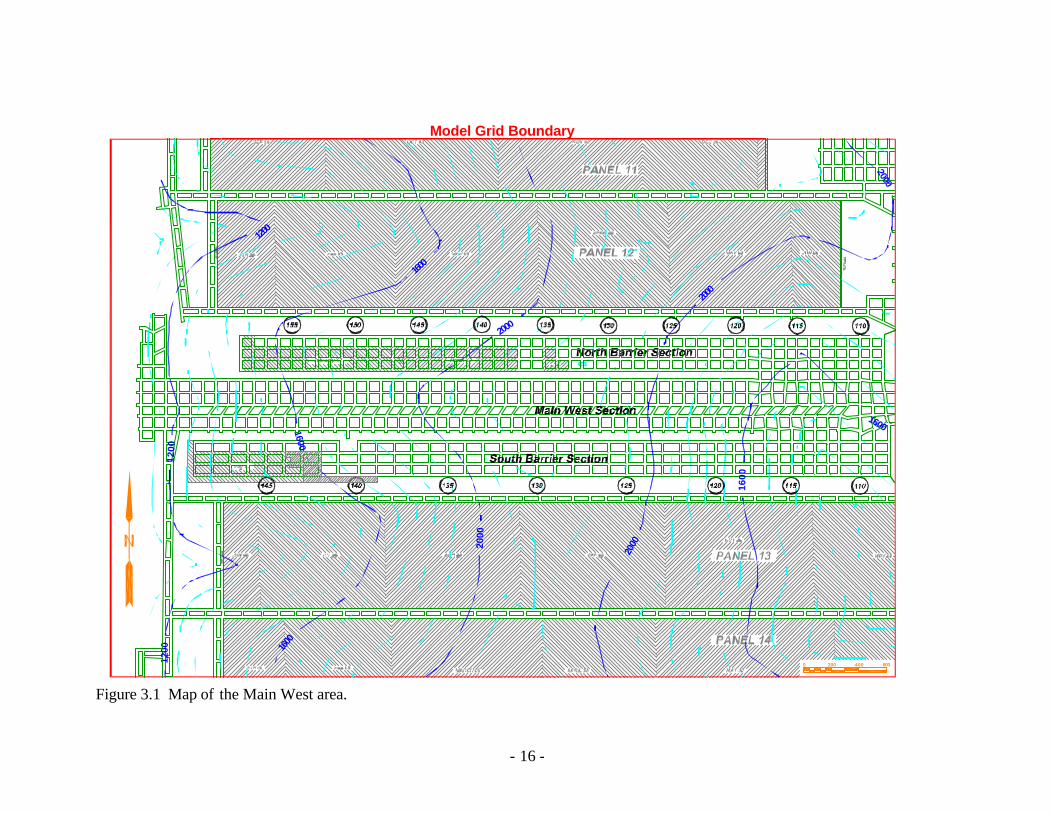
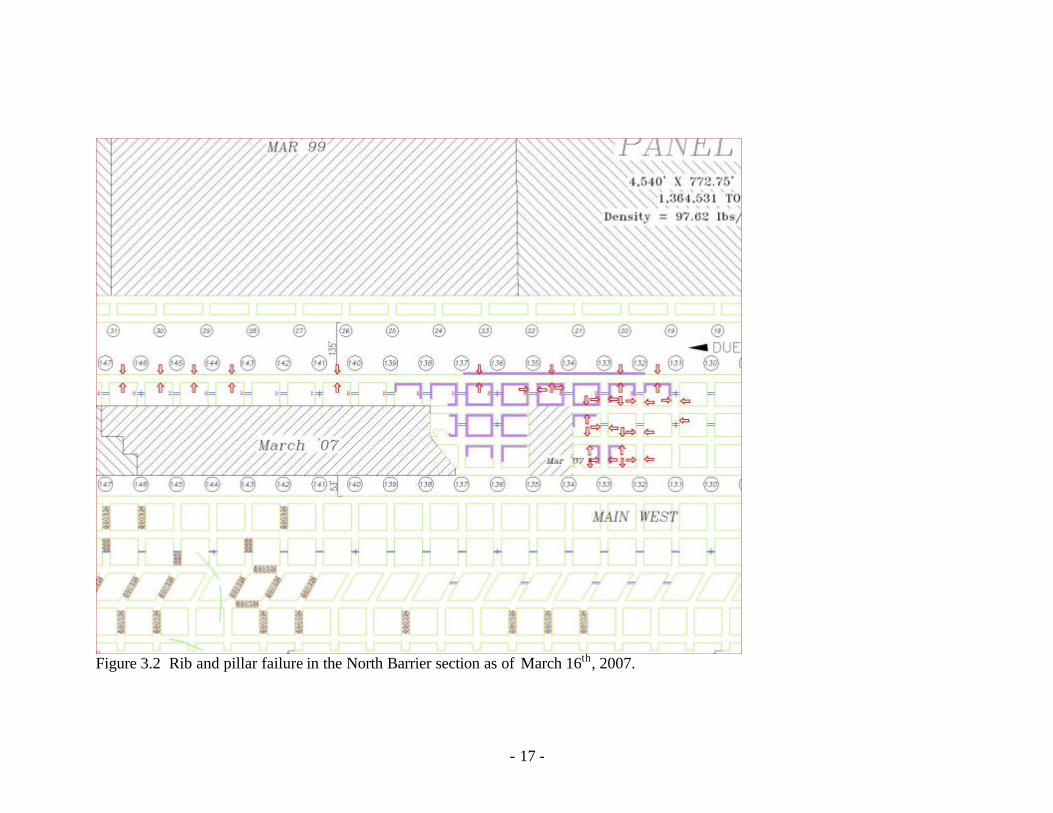
3.1 Approach The major effort in this back-analysis was directed toward calibrating the critical rock mass, gob and coal properties to provide the best LaModel simulation of what we know happened at Crandall Canyon Mine. Initially, the mine and overburden geometries of the Main West area of the mine were developed into LaModel mine and overburden grids. Then, the rock mass stiffness was calibrated against the expected abutment load distribution (i.e., extent) consistent with empirical averages and local experience. Next, the gob behavior was calibrated to provide reasonable abutment and gob loading magnitudes. For the coal properties, the peak strength was primarily determined from back analyzing a March 10th bump in the Main West North Barrier section, and the strain-softening behavior was optimized from the back-analysis of the August 6, 2007, event. Throughout the back-analysis, a wide range of reasonable input parameter values were investigated to optimize the agreement between the model and the observed reality. Also, a number of different events that could have triggered the August 6th collapse were investigated with the basic model. 3.2 Basic Calibration Points Knowledge of the actual mining conditions and the scenarios in which they occurred served as the basis for calibrating the LaModel model to the reality of the mining situation at Crandall Canyon Mine. A number of particular locations, situations and conditions were used as distinct calibration points. 3.2.1 Main West: During the initial mining of the Main West section, the pillars were assumed to be stable, although some difficulties were encountered in this area and the safety factor under the deepest cover was probably not very high (see Figure 3.1). When longwall Panel 12 to the north and Panel 13 to the South were being mined, the abutment stress effects were seen in the outside entries of Main West and additional support was installed. When the Main West section was eventually sealed, some of the intersections had fallen and the pillars were in poor shape. 3.2.2 North Barrier: When the North Barrier Section was initially developed, the section was fairly stable. Under the lower cover at the western end of the section, the pillar retreat was fairly successful. As the retreat line moved under the deeper cover to the east, pillar line stresses increased and became untenable in the 137-138 crosscut area where a couple of pillar rows were then skipped. After mining a couple of pillars between crosscuts 134 and 135, a bump (pillar failure) occurred that effected: the two rows of pillars inby, a number of pillar ribs and the barriers along the bleeder entry, and one to two rows of pillars outby crosscut 134 (see Figure 3.2). At this point, the section was abandoned and sealed shortly after that.
- 16 -
1200
1200
1200
1600
1600
1600
1600
1600
2000
2000
2000
2000
2000
0 200 400 600
Model Grid Boundary
Figure 3.1 Map of the Main West area.
- 17 -
Figure 3.2 Rib and pillar failure in the North Barrier section as of March 16th, 2007.

18
3.2.3 South Barrier: When the South Barrier section was developed, the section was fairly stable. Also, as the section retreated to crosscut 142, the conditions were mostly manageable. There were some signs of high stress and some bumping noted in the section before the August 6th, 2007 collapse. 3.2.4 Results of The August 6th Collapse: Immediately after the August 6th, 2007, collapse, it appeared that the pillars in the South Barrier Section inby crosscut 120 had bumped and filled the entries with coal. Stress effects from the collapse were visibly evident in the pillar ribs as far outby as crosscut 116 in the South Barrier and Main West Sections. On the inby end of the South Barrier, video from the drillholes revealed that there was still several feet of open entry at the intersections of cross cuts 137-138 and entry #2, but that the entries and crosscuts were bumped full of coal. Further inby the South Barrier section in the bleeder area at crosscut 142, the entry was half filled with bumped coal, and at the end of the bleeder at crosscut 147, the entry was wide open. Observations made during the rescue operation indicated that the remaining south barrier had certainly bumped on the north rib and subsequent analysis indicates that it may have completely failed under the deepest cover. A Richter 3.9 seismic event was associated with the collapse. Subsequent analysis of the initial part of this event locates it over the barrier pillar between the Main West and South Barrier sections at about crosscut 143. After the collapse, seismic activity was located along a North-South line through the whole Main West area around crosscut 120 and around crosscuts 141 to 146. 3.3 The LaModel Grid The LaModel simulation of the Main West area encompassed the entire Main West, North Barrier and South Barrier Sections so that all of the areas of interest could be included within one grid. Thus, the west and east boundaries of the model were set as shown in Figure 3.1. The north and south boundaries were established to include the full abutment loading from both the northern and southern longwall mining districts for at least a couple of panels. So, anticipating a symmetric boundary condition, model boundaries were set in the middle of the longwall panels, 1-1/2 panels from the north and south barriers (see Figure 3.1). For determining an optimum element size, a number of factors were considered. First, the desired model area shown in Figure 3.1 is approximately 6000 X 4000 ft. Presently, LaModel is limited to a maximum grid size of 1000 X 1000 elements; therefore, the required element size must be greater than 6 ft. Second, the pillar sizes were examined. The pillars are 80 X 92 ft on centers in the North Barrier section, 90 X 92 ft on centers in the Main West section, and 80 X 130 ft on centers in the South Barrier section. Also, in this deep cover, high stress situation, it was desired to have a pillar yield zone that would extend completely through the 120 ft wide barriers to the north and south of the room-and-pillar sections. So, considering all of these factors, a 10 ft wide element was chosen. This width fits most of the pillar dimensions fairly well and can easily span the 6000 ft grid width. Also, with a 10 ft wide element, the 120 ft wide barrier will only require 12 yield zone elements to reach to the middle of the pillar (two element codes are required to define each yield zone in models developed for this report).

19
Five and 6 ft wide elements were also considered. However, in the case of the 5 ft element, a 5000 ft wide grid would not span the desired model area, it does not fit the pillar dimensions any better than the 10 ft element, and it would take 24 yield elements to represent the larger barrier pillars. In the case of the 6 ft element, a 6000 ft grid just barely spans the desired model area, it does not fit the pillar dimensions any better than the 10 ft element, and it would take 20 yield elements to cover the larger barrier pillars. In the final grid, 10 ft elements were used and overall dimensions were set at 570 elements in the east-west direction and 390 elements in the north-south direction with a grid boundary as shown in Figure 3.1. The actual mine grid was automatically generated from the AutoCAD mine map of the Main West area with some manual editing to enforce 2 element entry widths and rectangular pillars. For inputting the overburden information to the model, an overburden grid was developed that was 1500 ft wider on all 4 sides than the model grid and used 100 ft wide elements on an 87 X 69 element grid. This overburden grid was then automatically generated from the AutoCAD topographic lines as shown in Figure 3.1. The result of the overburden grid generation process is the calculated overburden stress on the coal seam as shown in Figure 3.3. In the plotted overburden stress, it can be seen how the laminated model softens the effects of the ridges and valleys in the topography. Also, a couple other points should be noted in this plot. First, the north-south trending ridge centered over crosscuts 130 in both the North and South Barrier sections dominates the overburden stress. From the center part of this ridge, the overburden stresses drop quickly to both the east and west, or both the inby and outby ends of the North Barrier, Main West and South Barrier Sections. Also, the slightly higher overburden stress above longwall Panel 12 should be noted. This higher stress is probably carried to some extent by the abutment onto the North Barrier section. 3.4 Calibrating the Critical Parameters 3.4.1 Determining the Rock Mass Lamination Thickness: Equation 2.3 was used to determine an appropriate lamination thickness to give a realistic extent of the abutment zone in this model. In this equation, the rock mass was assumed to have an elastic modulus of 3,000,000 psi and a Poisson’s ratio of 0.25. The coal seam was assumed to have an elastic modulus of 300,000 psi and to average 8 ft thick. A “high average” overburden depth of 2000 ft was used resulting in a full abutment extent (Equation 2.1) of 416 ft and 90% of the abutment load (Equation 2.2) within 224 ft. Using a yield zone depth of 40 ft (consistent with the extent of yielding actually observed in the model), the required lamination thickness was calculated as 533 ft. As part of the parametric analysis discussed later, lamination thicknesses of 300, 500 and 600 ft were investigated. Ultimately, the 500 ft value appeared to match the observed conditions best and was subsequently used in the optimum model. For Crandall Canyon Mine, Equations 2.1 and 2.3 appear to be fairly appropriate. The mine noted the effects of increasing stresses in the Main West section when the adjacent longwalls were retreating and these longwalls are some 430 ft away. Also, the Wasatch Plateau area and the Crandall Canyon Mine are known for stiff massive sandstones in the overburden which would help bridge and transfer the abutment stresses for considerable distances and, therefore, help justify thicker model lamination.

20
1200
1320
1440
1560
1680
1800
1920
2040
2160
2280
2400
1200
1200
1200
1600
1600
1600
1600
1600
2000
2000
2000
2000
2000
0 200 400 600
Model Grid Boundary
Overburden
(psi)Stress
Figure 3.3. Overburden stress as calculated by LaModel.
- 21 -
3.4.2 Determining the Gob Stiffness: A number of factors were examined to optimize gob loading and gob stiffness in the model. First, Equation 2.4 was used with an 800 ft wide panel at 2000 ft of cover and an abutment angle of 21º to calculate a critical seam depth of 1042 ft. Then, using Equation 2.5, the laminated overburden model would suggest that an average gob loading of 1125 psi would be appropriate. Next, the gob loading as used in ALPS and ARMPS was calculated using Equation 2.7 with an abutment angle of 21º and an overburden density of 162 lbs/cu ft. This results in an average gob stress of 586 psi and a corresponding abutment load of 1659 psi. However, with the 2000+ feet of overburden the “correction” factor of 1.875 was applied to the abutment load resulting in a suggested average gob loading (Equation 2.8) of 1362 psi. From these various calculations of gob loading, the average gob stress value of 586 psi, (73% abutment load) as determined by the abutment angle concept, is considered a very lower bound. The average gob loading of 1362 psi, (38% abutment load) as determined by adjusting the abutment loading by the 1.875 “deep-cover” factor, is considered an upper bound. The actual gob loading is probably somewhere in between, but choosing the exact value is very difficult. In this mining situation at the very deepest part of the ARMPS deep-cover database, the tendency might be to start on the high end of gob loading range, something in the 1000-1300 psi range, but with the stiff competent overburden at the mine, the gob loading would tend to be less. To investigate the appropriate final gob modulus to use in the model, a simple grid was built of the Crandall Canyon Mine without any barrier mining in the Main West area. The depth was set at 2000 ft and then various combinations of lamination thickness and final gob modulus were input and the resultant average gob stress adjacent to the Main West area was determined. The results of this parametric analysis are shown in Table 1 and Figure 3.4. In these results, it is easy to see that, for a given lamination thickness, increasing the final gob modulus increases the average stress on the gob. Also, it is clear that for a given final gob modulus, increasing the lamination thickness reduces the average stress on the gob. In the parametric analysis discussed later, average gob stresses of 800 – 1400 psi were evaluated. Ultimately, gob stress around 900 psi (60% abutment loading) was determined to be best for matching the observed results. With the 500 ft lamination thickness this gob stress translates to a final gob modulus of 250,000 psi (see Table 1 and Figure 3.4).

- 22 -
Table 3.1 Average Gob Stress as a function of lamination
thickness and final gob modulus.
Average Gob Stress (psi) Lamination Thickness
Final Modulus
(psi) 300 ft 500 ft 600 ft 100,000 680 435 365 200,000 1066 763 662 300,000 1305 1012 903 400,000 1467 1198 1094 500,000 1581 1340 1242 600,000 1668 1449 1359 700,000 1735 1538 1455
0
200
400
600
800
1000
1200
1400
1600
1800
0 100,000 200,000 300,000 400,000 500,000 600,000 700,000 800,000
Final Gob Modulus (psi)
Ave
rage
Gob
Str
ess
(psi
)
300 ft Laminations500 ft Laminations600 ft Laminations
Figure 3.4 Average gob stress as a function of lamination thickness and final gob modulus. 3.4.3 Determining the Coal Strength: In determining appropriate coal strength, a couple of simple analyses provided significant insight. The pillars in the Main West Section were certainly stable when they were mined, and the overburden stress plot (Figure 3.3) shows some 2200 psi of insitu stress. With 90 X 92 ft centers and 20 ft wide openings, the extraction ratio would be 39.1% and the assumed tributary area stress on these pillars would be 3614 psi. Using the Mark-Bieniawski pillar

- 23 -
strength formula, this implies that the insitu coal strength must be at least 943 psi. Similarly, evaluating the 80 X 92 ft pillars in the North Barrier section and the 80 X 130 ft pillars in the South Barrier section (with 18 ft wide entries), implies a minimum coal strength of 965 psi and 813 psi, respectively. This analysis assumes tributary area loading, but with the narrow panels and competent overburden, this may not be the case causing the true pillar loading to be somewhat less. From underground observations, these pillars did not appear to be too close to failure on development; and therefore, the insitu coal strength could be higher than the calculated minimum. However, considering that the Main West was showing considerable weakness when it was eventually sealed, the safety factors on development were certainly not excessive. Another simple analysis which can provide some insight is to compare the pillar design in the North Barrier section to the design in the South Barrier section. Based on the above analysis, and comparing the 965 psi minimum strength in the North Barrier to the 813 psi minimum strength in the South Barrier implies that the larger pillars in the South Barrier section provide a 16% stronger design than the pillars in the North Barrier section. 3.4.3.1 Back Analysis of North Barrier Bump: Ultimately, the best information for computing the insitu coal strength at Crandall Canyon Mine is the pillar bump that occurred on March 10th, 2007, in the North Barrier Section (see Figure 3.2). A back-analysis of this event can provide reasonably reliable insitu coal strength to use in the further analysis of the subsequent collapse. To develop a back-analysis of the North Barrier Section bump, a six step LaModel run was developed to represent the cut sequence leading up to the bump. This model starts when the pillar retreat line is at crosscut 141, and retreats the pillar line one crosscut per step until the point when the bump occurred (i.e., after the pillars were pulled at crosscut 134 (see Figure 3.5)). For this back-analysis, Figure 3.2 was used as the primary calibration objective. This figure indicates that 2 rows of pillars inby crosscut 135 failed and bumped and that 1 to 2 rows of pillars outby crosscut 134 failed and bumped, also, the failures appear to be more prevalent towards the north. To calibrate the model, the coal strength was adjusted until the calculated conditions matched the observed conditions as closely as possible. Figure 3.5 shows the results of this calibration process. (Note: the safety factors in Figure 3.5 were adjusted so that the peak pillar strength in the North Barrier pillars corresponds to a safety factor of 1.0. This same adjustment was made to all pillar safety factors plots in this report.) In the back-analysis of the North Barrier bump shown in Figure 3.5, the lamination thickness was set at 500 ft, the final modulus of the gob was set at 300,000 psi, and the coal strength was calibrated to an input value of 1325 psi (in the strain softening equations of 2.11 and 2.12). For the strain softening coal behavior, the residual stress was calculated using equation 2.11 with a factor of 0.188 (essentially a 30% reduction from the peak stress), and the residual strain was calculated with equation 2.12 using a peak stress multiplication factor of 2. The resultant pillar strength correlates to a Mark-Bieniawski pillar strength with an insitu coal strength of 927 psi.

- 24 -
F. Retreat Line at XC 134
E. Retreat Line at XC 138.5
D. Retreat Line at XC 138
C. Retreat Line at XC 139
B. Retreat Line at XC 140
A. Retreat Line at XC 141
Figure 3.5 Analysis of North Barrier bump.

- 25 -
The model results illustrated in Figure 3.5 agree reasonably well with the observed behavior. When the retreat line is at crosscut 141 (see Figure 3.5A), the model shows that two pillars on the retreat line have safety factors slightly less than one. This is a pretty typical response of a room-and-pillar retreat section. These pillars on the retreat line (although the model shows failure) may not fail in the short amount of time that they are under this stress condition, and often can be safely extracted. (However, if the section is allowed to sit idle for a length of time, these pillars may indeed fail.) As the North Barrier Section continues to retreat under deeper cover (the deepest cover is essentially crosscuts 131-132, see Figure 3.1), safety factors on the retreat line decrease. When the retreat line is at crosscut 138 (see Figure 3.5D & E), the model now shows that two full rows of pillars on the retreat line have safety factors less than one. It was at this point that deteriorating ground conditions prompted mine personnel to stop recovering pillars, move the section a couple rows outby, and continue retreating. The mine then extracted two pillars between crosscut 134 and 135 and the bump occurred. In the calibrated model, the extraction of the two pillars between crosscut 134 and 135 caused 4 pillars to fail outby, 2 pillars to fail to the north and the 4 pillars inby to fail more, or soften considerably. These calibrated pillar conditions appear to match the observed conditions in Figure 3.2 fairly well. Also, this response in the model, where a small mining step causes a large amount of failure, is certainly indicative of a dynamic event, such as the bump in this case. It should also be noted in Figure 3.5, that as the North Barrier Section is retreated, considerable failure also occurs in the Main West Section. This response was seen in all of the calibrated models indicating that if the coal strength is adjusted to fail at the pillar geometry of the bump, then pillars in the Main West will also fail. This reaction seems entirely reasonable considering that: 1) the pillars in the Main West are only about 2% stronger than the pillars in the North Barrier Section, 2) the overburden stress is a little greater over the Main West than either the North or South Barrier sections, and 3) the abutment loading from the North Barrier gob can easily transfer over the intervening 50 ft wide barrier just as it transfers further inby in the North Barrier section. It is not believed that this amount of failure in the Main West section actually occurred at this time. Some adjustments to the model to correct this apparent inconsistency in the sequence of observed failure are discussed later in section 3.5.1. In performing this back-analysis of the North Barrier Section with various sets of parameter properties (see the parametric analysis section), a couple of important points become evident. First, once the coal strength is reduced in the calibration process to a development safety factor under the deepest cover of 1.4 or less, retreating the pillar line into the high stress, deep cover area will cause significant pillar failure at the retreat line (at some point) due to the combination of the high development stress from the deep cover and the abutment stress from the retreat line. The exact location of the significant pillar failure will move further west under the shallower cover if the coal is weaker or the failure point will move further east under the deeper cover if the coal is stronger. Second, it is apparent from the occurrence of the bump, and the model definitely indicates, that moving the face two rows of pillars outby the old retreat line was not sufficient to isolate it from the previous retreat line abutment stresses in the given conditions.
- 26 -
3.5 Analyzing the August 6th Collapse Once the optimum lamination thickness and gob modulus were developed (within the given resolution) and the coal strength was calibrated from the North Barrier bump, the parameters were set to use LaModel to back-analyze the August 6th, 2007, collapse at the Crandall Canyon Mine. For this collapse analysis, a six step model was developed: 1. Development of the Main West Section 2. Development of the North Barrier Section 3. Final retreat of the North Barrier Section 4. Development of the South Barrier Section 5. Final retreat of the South Barrier Section 6. Final retreat of the South Barrier Section, with bump triggers. When performing this back-analysis, a number of critical calibration conditions needed to be met. For step 1, the Main West Section should be stable on development. Similarly, for step 2, the North Barrier Section should be stable on development. For step 3, the pillar failure in the North Barrier Section should be consistent with Figure 3.2. For step 4, the South Barrier Section should be stable on development. Finally, for Step 6, after the bump event, pillar failure should cover the middle portion of the South barrier Section and extend outby to crosscut 122 to 124. Also, pillar failure (and pillar bumps) should extend into the face area at least to crosscut 138 with some moderate pillar bumping at crosscut 142 (as indicated by the drillholes). 3.5.1 Primary Results: The primary results of the initial back-analysis model for the Crandall Canyon Mine are shown in Figures 3.6-3.8. Figure 3.6 show the average pillar and individual element safety factors for step 3 which is the March 2007 bump geometry. Figure 3.6a is identical to Figure 3.5f and pillar failure in this plot was discussed above. Figure 3.6b shows the individual element safety factors calculated in the model for the bump geometry (step 3). By examining the element safety factors, it can be seen that the 50 ft wide barrier between the Main West and the North Barrier sections is indicating substantial failure between crosscut 137 and crosscut 144. Figure 3.6 also clearly shows the effect of the depth of cover on the pillar safety factors which increase rapidly as the cover drops below 2000 ft west of crosscut 145 and east of crosscut 125. Similarly, under the deepest cover between crosscuts 129 and 134, many pillars have not yet failed but they have very low safety factors and are close to failure. Finally, this figure indicates that the abutment stress from the active retreat gob is one of the primary factors driving the bump and the pillar failure; and therefore, the pillar failure radiates out from the active gob area. In addition, the deep cover stress is seen as a significant factor in propagating the pillar failure to the east. Figure 3.7 shows the average pillar and individual element safety factors calculated by the model after the South Barrier section was developed and retreated to its final configuration. Several important observations can be made from this figure. First, on development and partial retreat, the pillars in the central portion of the South Barrier section (crosscuts 120–138) are shown to be fairly stable with the lowest safety factors.

- 27 -
B. Element Safety Factors
A. Pillar Safety Factors
1600
16001600
2000
1600
16001600
2000
0.0 0.2 0.4 0.6 0.8 1.0 1.2 1.4 1.6 1.8 2.0
Safety Factor
Figure 3.6 Plot of pillar and element safety factors for step 3.

- 28 -
B. Element Safety Factors
A. Pillar Safety Factors
1600
16001600
2000
1600
16001600
2000
0.0 0.2 0.4 0.6 0.8 1.0 1.2 1.4 1.6 1.8 2.0
Pillar Safety Factor
Figure 3.7 Plot of pillar and element safety factors for step 5.

- 29 -16
00
16001600
2000
1600
16001600
2000
B. 5.7% Stronger Coal in Main West
A. 3.8% Stronger Coal in Main West
0.0 0.2 0.4 0.6 0.8 1.0 1.2 1.4 1.6 1.8 2.0
Pillar Safety Factor
Figure 3.8 Plot of pillar safety factors with coal strength adjusted in Main West.

- 30 -
around 1.2-1.4. As previously noted, these pillars are about 16% stronger than the pillars in the Main West or North Barrier sections, and this stability is undoubtedly a result of this higher strength. Next, it can be seen by examining the pillar safety factors from crosscut 139-145 in the South Barrier section that the stresses from the active retreat line/working section are fairly isolated from the potentially unstable pillars under the deeper cover to the east. The retreat line is under relatively shallow cover and there are five rows of fairly stable pillars (safety factors up to 1.8) between the active mining and the 2000 ft cover line. Finally, it can be seen by comparing Figure 3.7 with the previous Figure 3.6 that the small increase in stress from the development of the South Barrier section has caused considerable additional pillar failure in the Main West and North Barrier sections. Fourteen additional pillars have failed in the North Barrier section and 46 additional pillars have failed in the Main West section. There is no evidence to support whether this degree of failure actually did or did not occur. It does not seem reasonable that a failure of this magnitude could have gone unnoticed during development of the South Barrier section. However, the failure may have been very gradual. More likely, the difference in Main West pillar failure between Figure 3.6 and 3.7 was part of the collapse on August 6th. Regardless, this model response certainly indicates how sensitive the Main West and North Barrier geometries are to any slight change in loading condition. To maintain general stability in the Main West through the final retreat position of the South Barrier does not take much of a change in the model. A 50 psi (3.8%) increase in coal strength in just the Main West reduces the number of failed pillars in the Main West from 76 to 33 (see Figure 3.8a), and a 75 psi (5.7%) increase in coal strength reduces the pillar failure in the Main West to 12 pillars (see Figure 3.8b). However, either of these increases in coal strength in the Main West adversely affects the degree of fit to the March 2007 bump, but not too much (see Figure 3.8). The only strong justification for increasing the strength of the coal in the Main West in the model above the calibrated strength is to postpone the pillar failure until the August collapse. There is not much physical evidence that the Main West coal is any different than the coal in the North and South Barrier sections. On one hand, the coal in the Main West might be expected to be weaker than in the surrounding sections because it had been standing for 10+ years. However, there are a variety of possible explanations for pillars in this area not to exhibit lower strength. For example, the floor may have yielded enough over time to allow some overburden stress to bridge the section and functionally reduce the pillar load or roof falls and/or gobbed crosscuts may functionally provide additional confinement to the pillars. Any number of small changes in the loading condition of the Main West section could account for the pillars not failing at exactly the point indicated by the model. This is one point where the back-analysis model does not easily/smoothly match the perceived reality of the Crandall Canyon Mine; however, certainly a 4-6% increase in the stability of the Main West pillars (for any number of possible reasons) would be easily conceivable considering the natural variability of the geologic and mining systems. 3.5.2 Triggering the Collapse of the South Barrier Section: It can be seen in Figure 3.7a, that when the pillars in the Main West do start to fail, there is reluctance for the failure to propagate south past the barrier pillar and into the South Barrier Section. However, we know that this failure did occur on August 6th. To investigate what possible conditions may have triggered the collapse, or what conditions or parameter
- 31 -
changes are necessary to replicate the observed South Barrier failure in the model, a number of different trigger scenarios were investigated. A classic boundary-element technique used to check the stability of a potentially unstable mining plan is to simulate the extraction of a few pillars in the model (i.e., cause a small stress increase) and observe the magnitude of the resultant changes. In the optimized Crandall Canyon Mine model, four pillars (with a safety factor around 1) were removed between crosscut 128 and 132 on the south side of the Main West. The results of this perturbation are shown in Figure 3.9; it can be observed that the removal of the pillars has indeed caused 25 pillars to fail in the South Barrier section between crosscuts 125 and 134. Comparing this figure with Figure 3.7, it can also be observed that additional pillars in the Main West have failed between crosscut 124 and 129, and that the stability of the barrier between the sections has greatly decreased. The final pillar failure results shown in the South Barrier section of Figure 3.9 are not quite as extensive as observed in the field, but it does demonstrate that a relatively small change in the model conditions can cause the pillar failure to continue into the South Barrier section. 3.5.2.1 Reduced Coal Strength: The next triggering technique was to reduce the coal strength in the Main West by 50 psi or 3.8%. The results of this investigation are shown in Figure 3.10. Figure 3.10a shows that the small strength reduction has caused 37 pillars to fail in the South Barrier section between crosscuts 124 and 137, also many more pillars have failed in the Main West section. Figure 3.10b includes the removal of four pillars in the Main West and shows that the failure in the South Barrier section has encompassed the face area (crosscuts 137 to 139) and several pillars in the bleeder area (crosscuts 141 to 143). If Figures 3.8a and 3.10a are compared, it can be seen that a 7.7% reduction in the coal strength of the Main West pillars will cause 37 pillars to fail in the South Barrier section and 94 additional pillars to fail in the Main West. This large number of pillar failures in the model due to a relatively small decrease in coal strength effectively simulates the observed August 6th collapse. Seeing these model results, it certainly seems reasonable and plausible that the strength of the Main West pillars may have degraded from the effects of time and the northern abutment stresses, and a massive pillar collapse initiated which swept through the Main West pillars and down through the South Barrier section. 3.5.2.2 Joint Slip: The seismic event that accompanied the August 6th collapse was analyzed by personnel at the University of Utah Seismological Stations. The seismic signal was consistent with a collapse event but there was a small component of shear. Thus, it seems plausible that movement along one of the pervasive vertical joint surfaces known to exist on the mine property may have initiated the collapse (or certainly have contributed to the collapse). In order to simulate this possibility, a simple joint model was added to a special version of LaModel as part of this investigation. This joint model simulates a frictionless vertical plane in the LaModel grid, such that the plane does not allow any transfer of shearing or bending stresses across the joint. Basically, the plane is inserted between two rows or columns of the LaModel grid, and the program calculates the modified seam stresses and displacements that result from the addition of the joint.
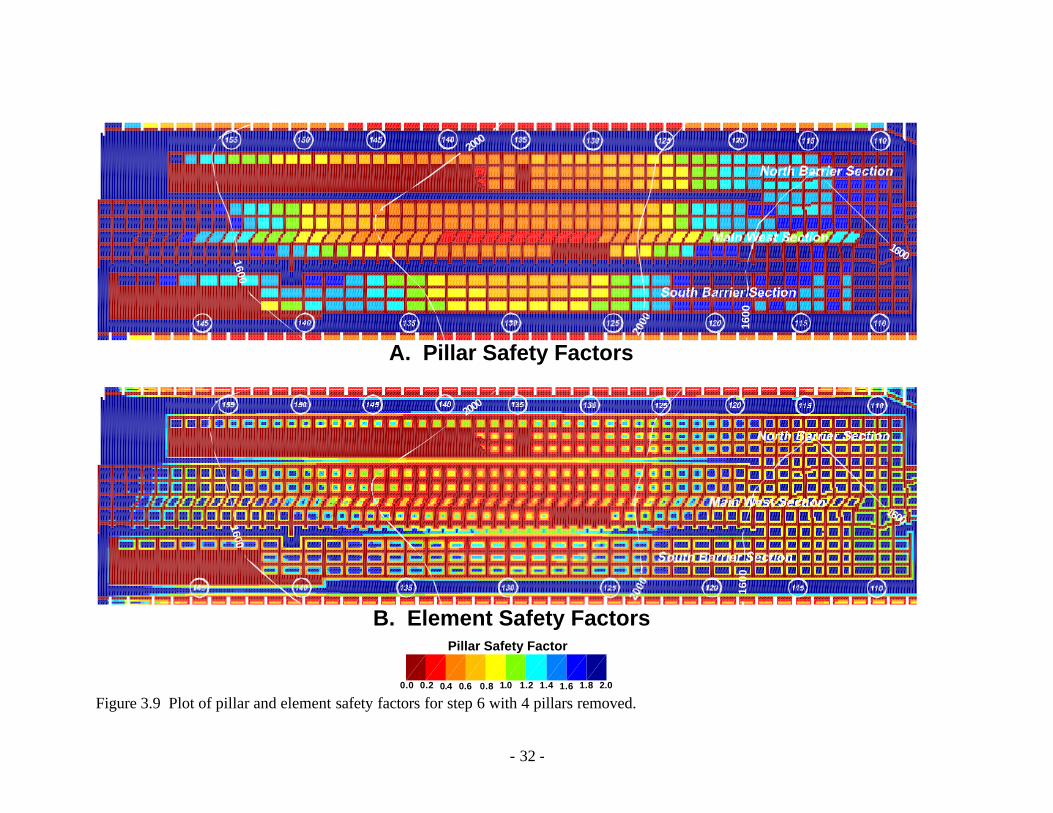
- 32 -
B. Element Safety Factors
A. Pillar Safety Factors
1600
16001600
2000
1600
16001600
2000
0.0 0.2 0.4 0.6 0.8 1.0 1.2 1.4 1.6 1.8 2.0
Pillar Safety Factor
Figure 3.9 Plot of pillar and element safety factors for step 6 with 4 pillars removed.

- 33 -16
00
16001600
2000
1600
16001600
2000
B. Step 6 - 4 Pillars Removed in Main West
A. Step 5 - South Barrier Retreated
0.0 0.2 0.4 0.6 0.8 1.0 1.2 1.4 1.6 1.8 2.0
Pillar Safety Factor
Figure 3.10 Plot of pillar safety factors for weakened coal in the Main West.
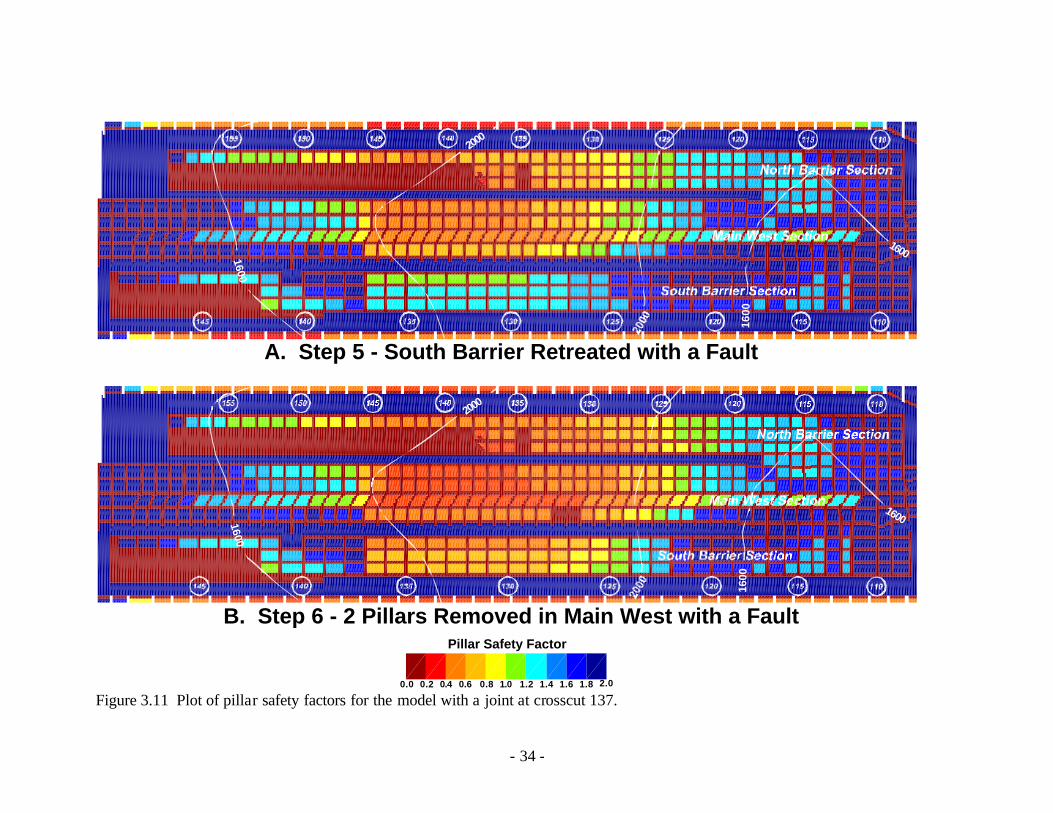
- 34 -16
00
16001600
2000
1600
16001600
2000
B. Step 6 - 2 Pillars Removed in Main West with a Fault
A. Step 5 - South Barrier Retreated with a Fault
0.0 0.2 0.4 0.6 0.8 1.0 1.2 1.4 1.6 1.8 2.0
Pillar Safety Factor
Figure 3.11 Plot of pillar safety factors for the model with a joint at crosscut 137.

- 35 -16
00
16001600
2000
1600
16001600
2000
B. Step 7 - 4 Pillars Removed in Main West
A. Step 6 - 2 Pillars Removed in Main West
0.0 0.2 0.4 0.6 0.8 1.0 1.2 1.4 1.6 1.8 2.0
Pillar Safety Factor
Figure 3.12 Plot of pillar safety factors for softer gob in the southern panels.
- 36 -
For the analysis of a possible fault trigger, the joint was placed at crosscut 137 of the South Barrier section and oriented in a north-south direction between the columns of the LaModel grid. The results of this joint analysis are shown in Figure 3.11. Figure 3.11a indicates that the addition of the joint by itself does not cause any failure in the South Barrier section, but the joint with a couple pillars removed in the Main West causes 35 pillars to fail in the South Barrier section. This analysis indicates that a sudden change in stresses due to slip along a joint in the roof certainly could have been a factor in triggering the collapse seen on August 6th. 3.5.2.3 Softer Southern Gob: Given that pillars in the South Barrier section are 16% stronger than the pillars in the North Barrier section and 14% stronger than the pillars in the Main West section, and that overburden loading in the south appears a little less than in the Main West, one would anticipate that pillars in the Main West would have failed before the South Barrier pillars, as seen in the previous models. This actually may have occurred and gone unnoticed, but it is also possible that failure in both areas occurred simultaneously. To account for this simultaneous failure, it seems reasonable to hypothesize that the abutment loading from the southern longwall panels may have been higher than the abutment loading from the northern longwall panels. In the north, longwall panel 12 (see Figure 3.1) was the last longwall in the northern district, whereas longwall panel 13 to the south of the South Barrier section was the first longwall panel in the southern district. This configuration may have resulted in a higher abutment load from the southern longwalls, or the southern geology may have been a little stiffer or more massive causing additional abutment load. To simulate additional abutment load from the southern longwall, the gob modulus in the south was reduced from 300,000 psi to 250,000 psi. Nominally, this reduces the average gob loading from 1013 psi to 888 psi, and increases the abutment load from 1187 psi to 1312 psi (10.5%). The results of this loading condition are shown in Figure 3.12 where it can be clearly seen that the increased southern abutment loading certainly increases the amount of failure in the Southern Barrier section. By comparing Figure 3.12b with 3.8a, it can be seen that the softer southern gob has caused an additional 23 pillars to fail and caused the failure to encompass the face area in the South Barrier section. Also, the softer southern gob has made the South Barrier section more likely to fail as a “natural” extension of failure in the Main West (see Figure 3.12a) 3.6 Parametric Analysis In order to assess the sensitivity of the model results to the input values and to determine the optimum parameter values for matching the observed mine behavior, an extensive parametric analysis was performed. This analysis examined: 3 different lamination thicknesses (300 ft, 500ft and 600 ft); final gob moduli ranging from 100,000 psi to 700,000 psi; strain-softening coal strengths ranging from 1150 psi to 1450 psi (corresponding to a Mark-Bieniawski insitu coal strengths of 835 psi to 1115 psi); post-failure residual coal strength reductions of 20%, 30% and 40%, and several different mechanisms for triggering the collapse. In all, over 230 models were evaluated. In a back-analysis, such as this investigation of the Crandall Canyon Mine collapse, there are an infinite number of parameter combinations that might be analyzed. The resolution of each optimized parameter (and therefore the accuracy of the back-analysis) can always be

- 37 -
further improved. Obviously, there is a practical time constraint and also, it is only reasonable to refine the parameters to within the overall accuracy of the general input values. In this case, with a geo-mechanical model, an accuracy of 10-20% seems more than sufficient. In this back-analysis, the smallest resolution of the critical parameters was:
• Lamination Thickness 100 ft • Final Gob Modulus 50,000 psi • Coal Strength 25 psi • Residual Strength Reduction 10%
To investigate the optimum lamination thickness, 300 ft, 500 ft and 600 ft thicknesses were examined (with a fixed rock mass modulus of 3,000,000 psi). The 300 ft lamination thickness has an abutment extent of around 180 ft and, in general, it showed a relatively local influence of the abutment stresses from the gob areas. The longwall abutment stresses did not appropriately influence the North and South Barrier sections and the North Barrier section gob did not project sufficient abutment stress into the bump area. On the other hand, the 600 ft lamination thickness had an effective (90% of abutment load) abutment extent of around 235 ft; however, this thickness had a tendency to over-extend the abutment zones and cause the coal failures to travel further than observed. Of the three lamination thicknesses investigated, the 500 ft thickness appeared to be most realistic. If the lamination thickness were to be further refined, the next selection would be in the 300 to 500 ft range. A fairly wide range of final gob moduli and the resultant abutment loads were investigated. When the abutment loads reached 65-75% of the overburden load, it was found that the North and South Barrier sections were beginning to fail on development. Also, this high abutment loading produced stresses in the barrier sections that were very biased towards the gob, much more than was actually experienced. On the other end of the spectrum, when the abutment loading was reduced to 30-40% of the overburden load, the low abutment stress ceased to be much of a factor in the modeled failure. At this point, the pillar failures were primarily driven by just the tributary overburden load. In this scenario, very low coal strengths were required to recreate a wide spread failure in the model. However these low strength pillars were close to failure on development and this behavior was not observed. The abutment loading was ultimately found to be most realistic in the 55-65% range (highest in the south) resulting in a final gob modulus between 200,000 and 300,000 psi (with the 500 ft lamination thickness). The coal strengths in the model were readily calibrated using the North Barrier bump geometry once a lamination thickness and abutment loading was determined. The calibrated coal strength essentially correlated with the modeled abutment loading. Increasing the abutment load required a corresponding increase in coal strength to calibrate the model. Conversely, decreasing the abutment load required a decrease in the coal strength for a realistic calibration. The final optimized strain-softening coal strength was in the 1300-1400 psi range corresponding to Mark-Bieniawski formula insitu coal strengths of 910-980 psi. The final critical parameter that was investigated in the parametric analysis was the post failure coal behavior. In this investigation, coal strength reductions of 20%, 30% and 40% after pillar failure were examined. Essentially, the magnitude of strength reduction determines the tendency for the pillar failures to propagate (or run) and generate a massive pillar collapse. With the 20% reduction, it was difficult for the model to produce the pillar
- 38 -
run that was observed. The pillars failed, but did not run across large areas of the sections. On the other hand, with the 40% reduction in coal strength, the pillar failures ran too far, out to around crosscut 115. Of the post-failure coal strength reductions examined, the 30% level produced the best results. If this value were to be further refined, it would be increased in order to get the pillar failures to spread further outby crosscut 124 in the South Barrier section as was observed. The magnitude of the post failure reduction in coal strength in this model necessary to simulate the observed pillar behavior is somewhat surprising. The classic laboratory tests by Das (1986) would indicate that a 60 ft wide pillar in an 8 ft seam (w/h=7.5) would be close to elastic, perfectly-plastic behavior and would not have much strain-softening behavior. Obviously, there was a massive pillar collapse; and therefore, the pillars had to exhibit significant strain-softening behavior. It is not clear whether this magnitude of strain-softening behavior is: typical for a pillar with a width-to-height of 7.5, a behavior unique to the seam at this mine, an effect of the bump-type pillar failure, a manifestation of the veracity/dynamics of the pillar collapse or has some other explanation. 3.7 Final Back Analysis Model In the initial model analyzed in section 3.5 above, all of the coal and gob at different locations have identical properties. However, it was shown that this assumption causes the pillars in the Main West section to fail too soon and the pillars in the South Barrier to be difficult to fail. It was also shown that a small (<8%) change in the coal strength or loading condition in the Main West pillars would make their behavior correlate well with observed conditions and that a small change (10.5%) in the southern abutment loading brings the South Barrier pillars’ behavior closer to observations. So, by combining all of these adjustments into one model, a final back-analysis model of the Crandall Canyon Mine can be developed that:
• Accurately simulates the March 10th, 2007 bump, • Accurately simulates the South Barrier section development, and • Accurately simulates the final August 6th collapse.
In this model, the lamination thickness was set at 500 ft, the final modulus of the north gob was set at 250,000 psi, and the final modulus of the southern gob was set at 200,000 psi. The coal strength in the North and South Barrier sections was set at 1300 psi and coal strength in the Main West was set at 1400 psi. For the strain softening coal behavior, the residual stress was set with a 30% reduction from the peak stress. The results from this final back analysis model are shown in Figure 3.13 and 3.14. In Figure 3.13a, the March 2007 bump is simulated with fairly good correlation to the observed results in Figure 3.2. In this final model, only one pillar has failed in the Main West at the time of the bump. Figure 3.13b shows the development and retreat of the South Barrier section. In this final model, the pillars in the South Barrier section have fairly good stability, although some 42 pillars have failed in the Main West. Then, in Figure 3.14 after perturbing the model by removing 6 pillars, the August 6th collapse is simulated. The removal of the six trigger pillars has caused 106 additional pillars to fail in the Main West and 59 pillars to fail in the South Barrier section. The failure runs from crosscut 123 in the South Barrier section

- 39 -
in to crosscut 146 in the bleeder area. This final model does a fairly good job of simulating most of the critical observation of the geo-mechanical behavior at the Crandall Canyon Mine.

- 40 -
1600
16001600
2000
1600
16001600
2000
B. Step 5 - South Barrier Retreated
A. Step 3 - North Barrier Bump
0.0 0.2 0.4 0.6 0.8 1.0 1.2 1.4 1.6 1.8 2.0
Pillar Safety Factor
Figure 3.13 Final model of Crandall Canyon Mine – steps 3 & 5.

- 41 -16
00
16001600
2000
1600
16001600
2000
B. Step 9 - Element Safety Factors
A. Step 9 - Pillar Safety Factors
0.0 0.2 0.4 0.6 0.8 1.0 1.2 1.4 1.6 1.8 2.0
Safety Factor
Figure 3.14 Final model of Crandall Canyon Mine - step 9.

- 42 -
4. Summary In this back analysis of the Crandall Canyon Mine, a six step base model of the mining in the Main West area was initially developed. The mine grid for the model was sized to cover the entire area of interest with a 10 ft element size that sufficiently fit the pillar sizes and entry widths. An appropriate overburden grid was also developed. This base model included a step for each of the critical stages in the mining of this area: development of the Main West Section, development of the North Barrier Section, final retreat of the North Barrier Section, development of the South Barrier Section, and final retreat of the South Barrier Section. Next, calibrated values for the critical input parameters: rock mass stiffness, gob stiffness and coal strength, were developed. The rock mass stiffness was calibrated against the expected abutment load distribution (i.e., extent) consistent with empirical averages and local experience. The gob behavior was calibrated to provide reasonable abutment and gob loading magnitudes. The peak strength of the coal was primarily determined from back analyzing the March 10th bump in the Main West North Barrier section, and the strain-softening behavior was optimized from back-analysis of the August 6th, 2007, event. Throughout this calibration process, a number of particular locations, situations, and conditions were used as distinct calibration points. As part of calibrating the critical input parameters, a wide range of reasonable sets of input parameter values were investigated (a parametric study) to optimize agreement between the model and the observed reality, and to assess the sensitivity of the model results to changes in the critical input parameters. Also, a number of different events that could have triggered the August 6th collapse were investigated with the basic model. In total, over 230 different sets of input parameters were evaluated, and from this extensive analysis a broad understanding of the factors that affected ground conditions at Crandall Canyon Mine was developed. Also, a pretty clear picture of the range of reasonable input values for the critical parameters was developed: lamination thickness, 300-600 ft; gob load, 25-60% of insitu load; coal strength, 1250-1450 psi - 20-40% strain softening. In all of these models (with different sets of lamination thicknesses and gob loadings), once the coal strength was calibrated to the North Barrier bump, LaModel naturally showed that the pillars in the Main West were also close to failure. Once the South Barrier was subsequently developed, the model showed that it was very likely for the entire Main West and South Barrier sections to collapse upon the South Barrier development, or just a small perturbation was needed to initiate the collapse. Different sets of lamination thickness and coal strength primarily just determined the exact timing and extent of the collapse. With the initial base model where all of the coal and gob in different areas are maintained at the same strength, the critical input parameters which best matched the known collapse conditions at the Crandall Canyon Mine were: a lamination thickness = 500 ft, a gob load = 40% of insitu load, and a coal strength = 1325 psi with 30% strain softening (see Figures 3.5-3.12). In the initial optimized base model were all of the coal and gob have identical properties, it was noted that the pillars in the Main West section seemed to fail a little too soon (or too easy) while the pillars in the South Barrier seemed to resist failure. Relaxing the condition that all of the coal and gob have the same properties, a final model was developed that fits the known conditions a bit better than the optimized base model (See Figures 3.13 and 3.14). In this final model, the Main West coal strength was raised to 1400 psi while the rest of the coal strength was lowered slightly to 1300 psi, Also, the south gob load was decreased to

- 43 -
36% of insitu load. With these two changes, the final model accurately simulates the March 10th, 2007 bump and minimizes the pillar failure in the Main West at that time. Also, the final model now more accurately simulates the final August 6th collapse with the simultaneous failure of 106 pillars in the Main West and 59 pillars in the South Barrier section. The collapse runs from crosscut 123 in the South Barrier section completely through the active section to crosscut 146 in the South Barrier bleeder area (see Figure 3.14).
5. Conclusions Based on the extensive back analysis of the Crandall Canyon Mine using the LaModel program describe above, and with the benefit of hindsight from the March bump and August collapse, a number of conclusions can be made concerning the mine design and the August 6th collapse. 1) Overall, the Main West and adjacent North and South Barrier sections were primed for a
massive pillar collapse because of the large area of equal size pillars with near unity safety factors. This large area of undersized pillars was the fundamental cause of the collapse. a. The pillars and inter-panel barriers in this portion of the Crandall Canyon Mine
essentially constitute a large area of similar size pillars. The pillars in the North Barrier and Main West section are essentially the same size and strength. Also, the inter-panel barrier pillars between the Main West section and the North and South Barrier sections have a comparable strength (+15%) to the pillars in the sections. The pillars in the South Barrier section are stronger than the pillars in the North Barrier and Main West sections, but only by about 16%. Therefore, the South Barrier section pillars might also be included as part of the large area of equal size pillars. This large area of similar size pillars is one of the essential ingredients for a massive pillar collapse (Mark et al., 1997; Zipf and Mark, 1996).
b. The high overburden (2200 ft) was causing considerable development stress on the
pillars in this area and bringing pillar development safety factors below 1.4. c. Considerable longwall abutment stress was overriding the barrier pillars between the
active sections and the old longwall gobs. In the north, the abutment stress from Panel 12 was overriding the North Barrier section and in the south the abutment stress from Panel 13 was overriding the South Barrier Section.
2) The abutment stress from the active North Barrier retreat section was key to the March 10th bump occurrence and the modeling indicated that the North Barrier abutment stress contributed to the August 6th pillar collapse.
3) From the modeling, it was not clear exactly what triggered the August collapse. A number of factors or combination of factors could have been the perturbation that initiated the collapse. Likely candidates include: the active retreat mining in the South

- 44 -
Barrier section, random pillar failure, a joint slip in the overburden, a gradual weakening of the coal over time, a change in the abutment loading, etc. The boundary element modeling identified a number of possible triggers, but by itself could not distinguish the most likely trigger.
4) LaModel analysis demonstrated that the active pillar recovery mining in the South Barrier section could certainly have been the trigger that initiated the August collapse; however, the modeling by itself does not indicate if the active mining was the most likely trigger. Certainly removing more coal in the South Barrier section contributed to the ultimate collapse by applying additional load to the outby area that was primed to collapse. In fact, if the active mining was not the specific trigger on August 6th, then it is fairly certain that as the South Barrier section had retreated further under the deeper cover, it would have eventually triggered the collapse of the undersized pillars in the Main West area.

- 45 -
References
Barron, K., 1992, “A Revised Model for Coal Pillars,” Proceedings of the Workshop on Coal Pillar Mechanics and Design, BuMines IC 9315, p. 144-157. Chase, F., C. Mark and K. Heasley, 2002, “Deep Cover Pillar Extraction in the U.S. Coalfields,” Proceedings of the 21st International Conference on Ground Control in Mining, Morgantown, WV, Aug. 6-8, p. 68-80. Das, M. N., 1986, “Influence of Width/Height ratio on Postfailure Behavior of Coal,” International Jounral of Mining and Geological Engineering, vol. 4, p. 79-87. Hardy, R. and K. A. Heasley, 2006, “Enhancements to the LaModel Stress Analysis Program”, Society of Mining Engineers Annual Meeting, St. Louis, Missouri, March 26-29, Pre-print 06-067, 7 pp. Heasley, K. A, 2000, “The Forgotten Denominator, Pillar Loading”, Proceedings of the 4th North American Rock Mechanics Symposium, Seattle, WA, July 31-Aug. 3, p. 457-464. Heasley, K. A., 1998, "Numerical Modeling of Coal Mines with a Laminated Displacement-Discontinuity Code", Ph.D. Dissertation, Colorado School of Mines, May, 187 pp. Heasley, K. A. and K. Barron, 1988, “A Case Study of gate Pillar Response to Longwall Mining in Bump-Prone Strata,” Proceedings of the 3rd Annual Longwall USA Exhibition and Conference, Chicago, MacLean-Hunter, p. 92-105 Karabin, G. and M. Evanto, 1999, “Experience with the Boundary-Element Method of Numerical Modeling to Resolve Complex Ground Control Problems,” Proceedings of the Second International Workshop on Coal Pillar Mechanics and Design, NIOSH IC 9448, p. 89-113. Mark, C., 1999, “Empirical Methods for Coal Pillar Design,” Proceedings of the Second International Workshop on Coal Pillar Mechanics and Design, NIOSH IC 9448, p. 145-154. Mark, C. and F. E. Chase, 1997, “Analysis of Retreat Mining Pillar Stability (ARMPS),” Proceedings of New Technology for Ground Control in Retreat Mining, NIOSH IC 9446, p. 17-34. Mark, C. and T. M. Barton, 1997, “Pillar Design and Coal Strength,” Proceedings of New Technology for Ground Control in Retreat Mining, NIOSH IC 9446, p. 49-59. Mark, C., F.E. Chase and R. K. Zipf, 1997, “Preventing Massive Pillar Collapses in Coal Mines,” Proceedings of New Technology for Ground Control in Retreat Mining, NIOSH IC 9446, p. 35-48.

- 46 -
Mark, C., 1992, “Analysis of Longwall Pillar Stability (ALPS); an update,” Proceedings of the Workshop on Coal Pillar Mechanics and Design, BuMines IC 9315, p. 238-249. Mark, C., 1990, “Pillar Design Methods for Longwall Mining, BuMines IC 9247. Pappas, D. M. and C. Mark, 1993, “Behavior of Simulated Longwall Gob Material,” BuMines RI 9458. Zipf, R. K. and C. Mark, 1996, “Design Methods to Control Violent Pillar Failures in Room-and-Pillar Mines,” Proceedings of the 15th International Conference on Ground Control in Mining, Golden, CO, Colorado School of Mines, p. 225-264. Zipf, R. K., 1992, “MULSIM/NL Theoretical and Programmer’s Manual,” BuMines IC 9321.