background -...
TRANSCRIPT

1

2

Background
3

Background
• Incorporated under the Name “Trimitsamphat Co., Ltd” to operate Auto Hire-purchase and Leasing Businesses. Later on, the name was changed to “Nava Leasing Co., Ltd”
1992(2535)
• Converted in to Public Company, while having Nava Finance and Securities Public Company Limited, and Thai Military Bank Public Company Limited as the major Shareholders.
1995(2538)
• Get listed in the Stock Exchange of Thailand (SET) under the symbolic name “NVL”.
2001(2544)
• Islamic Bank of Thailand (IBANK) acquired 49% of stocks through capital increase and tender offer, and the company’s name was changed to “Amanah Leasing Public Company Limited” (AMANAH)
2010(2553)
4

July 2015
(2558)
(Major Event)
• Board of Directors was restructured.
• Board of Directors approved the new Business Plan. According to thenew business plan, AMANAH ceased to conduct low yield financing ( new car’s hire-purchase, auto-floor plan financing, and financing tocorporations). AMANAH’s new business direction was to conductretails and high yield financing : used car hire- purchase, targeting to retail customers (called “ Auto to Money, ATM” product).
• 39 new branches were opened to add up to 7 existing branches,resulting in 46 branches in total to support retail financing. (now 41 existing branches)
Background
5

Background Current Board of Directors
6

Current Branches and AEsBackground
Northeast:14 branches
Central & East & West :13 branches
South:14 branches
Branches
Old 7
Added: new 34
Total 41
Active Amanah Express/ AE
as of 31 Oct 2017 = 411 AEs

Branch Model
8

New Business Plan/Direction (Implemented 1 July 2015 (2558)
9
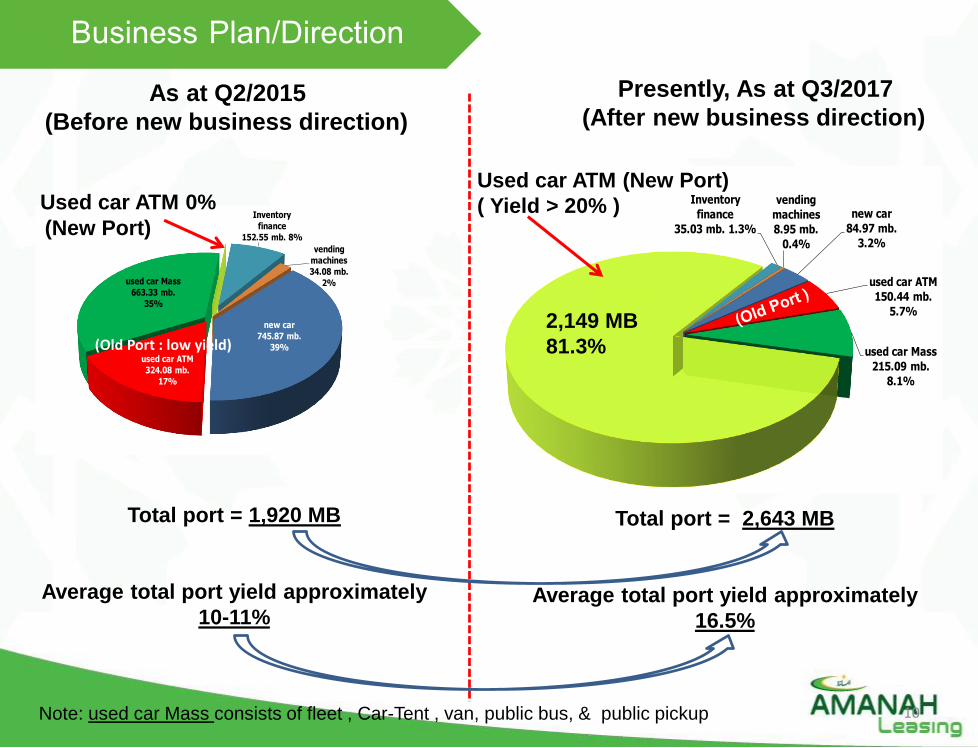
Business Plan/Direction
new car
84.97 mb.
3.2%
used car ATM
150.44 mb.
5.7%
used car Mass
215.09 mb.
8.1%
Inventory
finance
35.03 mb. 1.3%
vending
machines
8.95 mb.
0.4%
new car
745.87 mb.
39%
used car ATM
324.08 mb.
17%
used car Mass
663.33 mb.
35%
Inventory
finance
152.55 mb. 8%
vending
machines
34.08 mb.
2%
Total port = 1,920 MB
Average total port yield approximately
10-11%
Total port = 2,643 MB
Average total port yield approximately
16.5%
As at Q2/2015
(Before new business direction)
Used car ATM (New Port)
( Yield > 20% )
Presently, As at Q3/2017
(After new business direction)
Used car ATM 0%
10Note: used car Mass consists of fleet , Car-Tent , van, public bus, & public pickup
(Old Port : low yield)
(New Port)
2,149 MB
81.3%

New Business Plan/DirectionNew Lending, and Lending Yield: before June 2015 VS after June 2015
Unit in MB
74.39104.61
117.60
228.07
356.97
410.54 403.60 397.67
276.03
377.96 375.44
8.40%
12.31%
18.03%
21.43%22.34%
22.37%
22.02% 21.81% 22.33%
21.00%21.60%
0.00%
5.00%
10.00%
15.00%
20.00%
25.00%
0
100
200
300
400
500
600
Q1/58 Q2/58 Q3/58 Q4/58 Q1/59 Q2/59 Q3/59 Q4/59 Q1/60 Q2/60 Q3/60
Weighted Avg. EIR% Weighted Average YieldNew lending
Before June 2015 After June 2015
11

New Business Plan/Direction
Actual Actual Target Yield
Jun-2015 Sep-2017 Dec-2018
Vending machines 2% 0.5% 0% 20%
Inventory finance 7% 1% 1% 9%
Used car (Old Portfolio) 53% 14% 7% 12%
New car 38% 3.5% 2% 8%
100% 100% 100%
A Shift in product mix
12

Financial Figures
13

Financial Figures Revenue Structure
0%
10%
20%
30%
40%
50%
60%
70%
80%
90%
100%
Y2013 Y2014 Y2015 Y2016 9M/2017
78% 79%71% 74%
80%
6%7%
9% 5%
2%
4%5%
7%3%
2%
8%5%
6%12% 10%
3% 3%7% 6% 6%
Income from hire-purchase Income from operating lease
Income from inventory finance Fee and service income
Other income
Total Revenue (MB) Revenues : broken down by types
Before new business direction After new business direction
-
50
100
150
200
250
300
350
400
Y2013 Y2014 Y2015 Y2016 9M/2017
324
275
229
351 369
Total income
Unit : MB.
Before new business direction After new business direction
14
Old Old Old
Old
+
New
Old
+
New

Financial Figures Statements of financial position
Y2013 Y2014 Y2015 Y2016 Q3/2017
3,117
2,655
1,965
2,699 2,780
Total assets
Total assets
Y2013 Y2014 Y2015 Y2016 Q3/2017
1,867 1,631
1,080
1,783 1,850
1,250
1,024
885
916 929
Total liabilities Total shareholders' equity
Before new business direction After new business direction
D/E =1.49 D/E =1.59 D/E =1.22 D/E =1.95 D/E =1.99
15

Financial Figures Statement of Income 2013 – Q3/2017
Actual Yield
12.5%
Actual Yield
11.52%
Actual Yield
16.54%
Continuing operations Y2013 Y2014 Y2015 Q1/2016 Q2/2016 Q3/2016 Q4/2016 Y2016 Q1/2017 Q2/2017 Q3/2017 9M/2017
Income from hire-purchase 252.00 218.43 163.97 48.20 59.93 74.23 78.35 260.70 92.47 95.56 105.59 293.62
Income from finance lease 0.060 0.002 0.004 0.003 0.004 0.003 0.00 0.01 0.01 - - -
Income from operating lease 20.33 20.37 20.31 5.01 4.47 4.01 3.52 17.01 3.33 2.95 2.72 9.01
Income from inventory finance 14.07 14.22 15.27 1.90 2.23 2.62 2.71 9.46 2.73 2.73 1.76 7.22
Fee and service income 27.44 12.72 13.06 7.85 9.73 13.29 12.73 43.60 10.31 14.00 12.19 36.50
Other income 10.44 9.50 16.77 3.63 7.98 3.18 5.71 20.49 9.55 4.43 8.58 22.55
Total income 324.34 275.24 229.38 66.58 84.35 97.33 103.01 351.27 118.40 119.67 130.84 368.90
Cost of operating lease 12.82 18.86 18.98 4.29 4.61 4.73 5.23 18.85 3.88 3.44 3.78 11.10
Selling expenses 5.85 1.67 3.22 1.50 0.65 1.42 0.62 4.19 1.20 0.61 0.39 2.20
Administrative expenses 127.05 153.95 150.89 45.43 48.11 53.63 46.25 193.42 53.06 48.64 49.38 151.06
Bad debt and doubtful accounts 121.08 86.20 79.96 -39.94 9.99 14.56 -0.10 -15.49 20.81 90.01 -6.95 103.87
Impairment loss and loss on sales of properties foreclosed
38.51 130.81 56.62 42.21 6.85 6.78 7.70 63.54 6.45 -0.23 7.22 24.10
Reversal in allowance for impairment of investment in subsidiary
-9.15 10.43 -9.38
Finance costs 72.71 72.94 52.78 10.10 12.51 14.92 16.70 54.23 15.71 15.95 17.88 49.56
Total expenses 378.02 464.42 362.45 63.60 82.72 96.03 76.40 318.74 91.96 168.85 71.70 332.51
Profit (Loss) before income tax expenses -53.68 -189.18 -133.07 2.99 1.63 1.30 26.61 32.53 26.44 -49.18 59.14 36.40
Income tax expense -3.30 -42.98 0.00 -0.09 1.25 -0.11 0.52 1.57 9.21 3.06 10.53 22.80
Profit (Loss) from discontinued operations 7.87 -3.34 0.26 -0.18 0.16 0.24 0.48
Net Profit (Loss) -56.98 -224.29 -136.41 3.15 2.71 1.34 24.24 31.44 17.23 -52.24 48.61 13.60
unit in million THB Before new business direction After new business direction
16

Financial Figures Financial Position 2013 – Q3/2017
unit in million THB
Statements of financial position Y2013 Y2014 Y2015 Q1/2016 Q2/2016 Q3/2016 Y2016 Q1/2017 Q2/2017 Q3/2017AssetsCash and cash equivalents 33.63 267.89 162.17 114.96 141.11 142.35 99.85 32.46 36.83 40.69 loan receivables 2,573.06 1,948.67 1,488.98 1,575.14 1,899.34 2,106.92 2,263.74 2,191.15 2,328.70 2,451.70 finance lease receivables 150.68 168.84 67.52 53.55 90.17 89.40 87.02 90.00 48.44 35.03 Properties and equipment 108.96 120.20 104.62 101.39 96.49 93.47 86.42 81.67 79.03 77.09 Properties foreclosed 69.57 74.26 57.06 66.96 58.17 68.76 75.10 102.81 87.27 91.38 Deferred tax assets 56.40 23.38 22.48 22.48 23.64 23.53 23.43 23.38 23.23 23.10 Other assets 124.88 51.99 62.13 62.28 66.21 71.22 63.62 62.14 61.41 60.82
Total assets 3,117.18 2,655.23 1,964.97 1,996.76 2,375.13 2,595.64 2,699.19 2,583.61 2,664.92 2,779.81
LiabilitiesShort-term loan from Ibank 1,791.15 1,594.01 1,044.09 1,063.83 1,441.47 1,637.04 1,731.34 1,574.96 1,720.00 1,780.00 Other liabilities 75.91 37.42 35.81 44.70 42.73 66.33 51.86 77.37 64.26 70.41
Total liabilities 1,867.06 1,631.43 1,079.90 1,108.53 1,484.20 1,703.37 1,783.20 1,652.33 1,784.26 1,850.41 Shareholders' equityShare capital -paid up 950.00 950.00 950.00 950.00 950.00 950.00 950.00 950.00 951.48 951.48 premium 291.89 291.89 291.89 291.89 291.89 291.89 291.89 291.89 0.42 0.56 Retained earningsAppropriated - statutory reserve 39.54 39.54 39.54 39.54 39.54 39.54 39.54 39.54 - - Unappropriated (Deficit) -31.30 -257.63 -396.36 -393.20 -390.50 -389.16 -365.57 -350.43 -71.20 -22.63
Total shareholders' equity 1,250.13 1,023.80 885.07 888.23 890.93 892.27 915.99 931.28 880.66 929.40
Total liabilities and shareholders' equity 3,117.19 2,655.23 1,964.97 1,996.76 2,375.13 2,595.64 2,699.19 2,583.61 2,664.92 2,779.81
Before new business direction After new business direction
17

Financial FiguresBefore new business direction After new business direction
Y2013 Y2014 Y2015 Y2016 9M/2016 9M/2017 9M%
new loan amount 838.0 356.0 380.0 1,569.0 1,179.0 1,029.0 -12.72%
loan receivables (net balance) 2,573.1 1,948.7 1,489.0 2,263.7 2,106.9 2,451.7 16.36%
Total income 324.3 275.2 229.4 351.3 248.3 368.9 48.60%
Net Profit (Loss) -56.98 -224.29 -136.41 31.4 7.2 13.6 88.89%
18
unit : MB Q3/2017 Q3/2016 YoY% Q2/2017 QoQ%
new loan amount 375.4 403.6 -6.98% 378.0 -0.67%
loan receivables (net balance) 2,451.7 2,106.9 16.36% 2,328.7 5.28%
Total income 130.8 97.3 34.43% 119.7 9.33%
Net Profit (Loss) 48.6 1.3 3527.61% -52.2 n.m.

Financial Figures Non Performing Finance (NPF)
Before new business direction After new business direction
19
amount : MB.
179 186 197 159 188 242 208
6.23%
8.03%
11.26%
6.81%
7.79%
9.39%
7.88%
0.00%
2.00%
4.00%
6.00%
8.00%
10.00%
12.00%
0
50
100
150
200
250
300
Y2013 Y2014 Y2015 Y2016 Q1/2017 Q2/2017 Q3/2017
NPF amount % NPF
% NPF and Amount Total Port.

Financial Figures Non Performing Finance (NPF)
Before new business direction After new business direction
5.99%
8.23%
9.09%
7.62%
0.00%
1.00%
2.00%
3.00%
4.00%
5.00%
6.00%
7.00%
8.00%
9.00%
10.00%
0
20
40
60
80
100
120
140
160
180
200
Y2013 Y2014 Y2015 Y2016 Q1/2017 Q2/2017 Q3/2017
NPF amount % NPF
amount : MB.
% NPF and Amount ATM
90 139 177 164

New Business Plan/Direction
Passenger car
47%Pick-up52%
Van1%
Current Lending by Booking Areas Current Lending by Car Types
Central27%
North-Eastern
28%
Sountern45%
21

22
Annualized ROA as at Q3 2017:
Annualized ROE as at Q3 2017:
Total asset as at Q3 2017:
D/E as at Q3 2017 :
To generate growth and improve ROA and ROE through :1. Growing loan portfolio and yield through ATM lending2. Increasing financial leverage (D/E) through borrowed-fund financing3. Enhancing collection capability, controlling and reducing NPF

23
ผู้บริหารลงพืน้ที่ตามภมิูภาคตา่งๆ

Q & A
24