banc 2016 - investor presentation
TRANSCRIPT

August 2, 2016
Investor Presentation

1 1
Forward-looking Statements
When used in this presentation and in documents filed with or furnished to the Securities and Exchange Commission (the “SEC”), or other public shareholder communications, or in oral statements made with the approval of an authorized executive officer, the words or phrases “believe,” “will,” “should,” “will likely result,” “are expected to,” “will continue,” “is anticipated,” “estimate,” “project,” “plans,” or similar expressions are intended to identify “forward-looking statements” within the meaning of the Private Securities Litigation Reform Act of 1995. You are cautioned not to place undue reliance on any forward-looking statements, which speak only as of the date made. These statements may relate to future financial performance, strategic plans or objectives, revenue, expense or earnings projections, or other financial items of Banc of California Inc. and its affiliates (“BANC,” the “Company,” “we,” “us” or “our”). By their nature, these statements are subject to numerous uncertainties that could cause actual results to differ materially from those anticipated in the statements. Factors that could cause actual results to differ materially from the results anticipated or projected include, but are not limited to, the following: (i) risks that the Company’s recently completed acquisitions, including the acquisitions of branches from Banco Popular, The Private Bank of California, CS Financial, Inc., and The Palisades Group, may disrupt current plans and operations, the potential difficulties in customer and employee retention as a result of those transactions and the amount of the costs, fees, expenses and charges related to those transactions; (ii) the credit risks of lending activities, which may be affected by further deterioration in real estate markets and the financial condition of borrowers, may lead to increased loan and lease delinquencies, losses and nonperforming assets in our loan portfolio, and may result in our allowance for loan and lease losses not being adequate to cover actual losses and require us to materially increase our loan and lease loss reserves; (iii) the quality and composition of our securities and loan portfolios; (iv) changes in general economic conditions, either nationally or in our market areas; (v) continuation of the historically low short-term interest rate environment, changes in the levels of general interest rates, and the relative differences between short- and long-term interest rates, deposit interest rates, our net interest margin and funding sources; (vi) fluctuations in the demand for loans and leases, the number of unsold homes and other properties and fluctuations in commercial and residential real estate values in our market area; (vii) results of examinations of us by regulatory authorities and the possibility that any such regulatory authority may, among other things, require us to increase our allowance for loan and lease losses, write-down asset values, increase our capital levels, or affect our ability to borrow funds or maintain or increase deposits, which could adversely affect our liquidity and earnings; (viii) legislative or regulatory changes that adversely affect our business, including changes in regulatory capital or other rules; (ix) our ability to control operating costs and expenses; (x) staffing fluctuations in response to product demand or the implementation of corporate strategies that affect our work force and potential associated charges; (xi) errors in our estimates in determining fair value of certain of our assets, which may result in significant declines in valuation; (xii) the network and computer systems on which we depend could fail or experience a security breach; (xiii) our ability to attract and retain key members of our senior management team; (xiv) costs and effects of litigation, including settlements and judgments; (xv) increased competitive pressures among financial services companies; (xvi) changes in consumer spending, borrowing and saving habits; (xvii) adverse changes in the securities markets; (xviii) earthquake, fire or other natural disasters affecting the condition of real estate collateral; (xix) the availability of resources to address changes in laws, rules or regulations or to respond to regulatory actions; (xx) inability of key third-party providers to perform their obligations to us; (xxi) changes in accounting policies and practices, as may be adopted by the financial institution regulatory agencies or the Financial Accounting Standards Board or their application to our business or final audit adjustments, including additional guidance and interpretation on accounting issues and details of the implementation of new accounting methods; (xxii) war or terrorist activities; and (xxiii) other economic, competitive, governmental, regulatory, and technological factors affecting our operations, pricing, products and services and the other risks described in this report and from time to time in other documents that we file with or furnish to the SEC. You should not place undue reliance on forward-looking statements, and we undertake no obligation to update any such statements to reflect circumstances or events that occur after the date on which the forward-looking statement is made.

2 2
ENTREPRENEURIALISM
SUPERIOR ANALYTICS
OPERATIONAL EXCELLENCE
WE ARE CALIFORNIA’S BANK.
Empowering California Through Its Diverse Businesses, Entrepreneurs and Communities

3 3
$6.5 $7.9
$26.5
$104.3
$179.2
FY 2012 FY 2013 FY 2014 FY 2015
$1.7
$3.6
$6.0
$8.2
$10.2
YE 2012 YE 2013 YE 2014 YE 2015 2Q16
100% of branches in California 90%+ loans are California Loans 90%+ employees live in California Outstanding CRA Rating
+67% CAGR +129% CAGR
$10.2 billion in Assets 101% Total Shareholder Return Since YE 20141
16% Return on Tangible Common Equity 2Q16 1.1% Return on Assets 2Q16
Total Assets2 Pretax Income3
California’s Bank Made of California, by California, for California
1 Source: Bloomberg Total Return Analysis; Total Shareholder Return assumes reinvested dividends (1-1-2015 to 7-25-2016) 2 Dollars in billions 3 Dollars in millions
2Q16 Annualized

4 4
Lending Platform
We Empower California’s Businesses and Entrepreneurs On Track to Fund Over $8 billion in Loans to Over 20 Thousand Californians in 2016
Commercial
Commercial Real Estate
Multi-Family
Residential
SBA
Equipment Finance
Asset Backed Lines of Credit
Warehouse
Construction and Rehabilitation
Entertainment and Private

5 5
Clinton Global Initiative, America Community Commitment
SDSU Athletics Financial Literacy Partnership
Pepperdine Micro-Enterprise Program
USC Athletics Financial Literacy Partnership
We Empower California’s Diverse Communities Largest Independent Bank in California with an Outstanding CRA Rating
World’s Largest Financial Literacy Education Event

6 6
$0.32 $0.29
$0.39 $0.36
$0.43
2Q15 3Q15 4Q15 1Q16 2Q16
$27.4 $23.8
$31.0 $33.0
$44.8
2Q15 3Q15 4Q15 1Q16 2Q16
1.0%
0.9%
1.0%
0.9%
1.1%
2Q15 3Q15 4Q15 1Q16 2Q16
15% 12%
17% 14%
16%
2Q15 3Q15 4Q15 1Q16 2Q16
1 Diluted 2 Dollars in million 3 Return on Assets and Return on Tangible Common Equity based on average assets and average tangible common equity, respectively, over stated time periods
Pretax Income2 Earnings per Share1
Return on Tangible Common Equity3 Return on Assets3
Track-Record of Compelling Financial Results Ninth Straight Quarter Exceeding Analyst Estimates

7 7 1 Dollars in millions 2 Business Segment Pretax Income inclusive of intra-company allocations; excludes unallocated Corporate / Other interest expense. Mortgage Banking and Financial Advisory segments reported negative pre-tax income after allocated intra-company expenses for 1Q16
$54.1 $55.6
$62.1
$70.4
$81.0
2Q15 3Q15 4Q15 1Q16 2Q16
+50%
78% 91% 90%
100% 96%
22% 9% 10% 4%
2Q15 3Q15 4Q15 1Q16 2Q16
Mortgage Banking & Financial Advisory
Commercial Banking
High quality earnings resulting in low earnings volatility
Pretax Income by Business Segment2 Net Interest Income1
Accelerating Growth of Core, Spread-based Businesses Commercial Banking Segment Driving Earnings Strength

8 8
Commercial Banking Driving Growth in Loan Production Commercial Banking Loan Production up over 100% Year Over Year
Total 2Q loan production of $2.6 billion, including $1.3 billion of commercial banking segment production
Commercial banking loan production up 109% year over year while mortgage banking production flat
Commercial banking loan production lead by C&I, CRE/MFL and Residential lending businesses
$629 $729 $914 $823
$1,313
$1,257 $1,096 $951 $1,024
$1,277
2Q15 3Q15 4Q15 1Q16 2Q16
Commercial Banking Mortgage Banking
Loan Production by Business Segment
($ in millions)
+37%

9 9 1 C&I Loans include SBA and Lease loans
Commercial Banking Loan Production Led by C&I Lending New Commercial Banking Team Additions Resulting in Increased C&I Lending
C&I1 41%
CRE & Multifamily
23%
Residential 36%
Other 1%
$1.3 billion in total 2Q16 commercial banking segment loan production
Record $473 million 2Q16 C&I loan production
Record $302 million 2Q16 CRE & Multifamily loan production
100% = $1.3 billion
Commercial Banking Segment Loan Production
Second Quarter 2016

10 10 1 Total funding includes total interest-bearing liabilities and noninterest-bearing deposits
Deposit Growth Reducing Borrowings Strong Liquidity Position Key to Continued Long Term Growth
Total Liabilities (Quarter-over-Quarter)
($ in millions)
Record quarterly deposit growth of $1.1 billion; Decline in total interest expense
Repo & Other Liabilities
1Q16
$8,749
$(275)
Deposits FHLB Advances
$(83) $(265)
2Q16
$9,218 $1,091
Notes Payable
Total funding cost1 fell by 10bps quarter over quarter resulting in lower total interest expense
Net Interest Margin has remained stable at 3.39% for the third consecutive quarter
$2.8 billion of deposit growth over the prior four quarters
Contingent liquidity at FHLB increased from $350 million to $930 million over the four prior quarters.

11 11
Scale Resulting in Increased Efficiencies and Productivity Continue to Target 40% Marginal Efficiency Ratio
($ in millions)
$4.1 $4.4
$4.8
$5.7 $5.9
2Q15 3Q15 4Q15 1Q16 2Q16
Assets / FTE
86%
92%
88%
75%
68%
FY 2012 FY 2013 FY 2014 FY 2015 2Q16
Efficiency Ratio
-21%
3.5% 3.0% 2.9% 2.7% 2.6%
2.2% 1.8% 1.6% 1.4% 1.4%
2Q15 3Q15 4Q15 1Q16 2Q16
Commercial Banking Mortgage Banking
Business Segment Noninterest Expense / Total Assets
5.6% 4.9% 4.5% 4.0% 4.0%
12 12
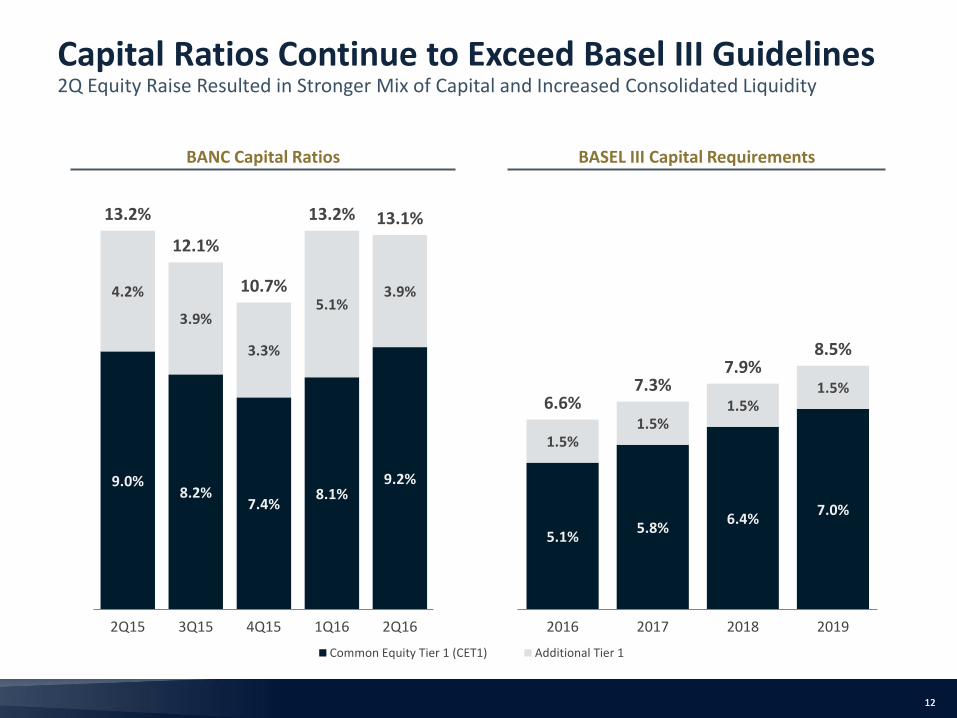
Capital Ratios Continue to Exceed Basel III Guidelines 2Q Equity Raise Resulted in Stronger Mix of Capital and Increased Consolidated Liquidity
5.1% 5.8%
6.4% 7.0%
1.5% 1.5%
1.5% 1.5%
6.6% 7.3%
7.9% 8.5%
2016 2017 2018 2019
9.0% 8.2%
7.4% 8.1%
9.2%
4.2%
3.9%
3.3%
5.1% 3.9%
13.2%
12.1%
10.7%
13.2% 13.1%
2Q15 3Q15 4Q15 1Q16 2Q16
Common Equity Tier 1 (CET1) Additional Tier 1
BASEL III Capital Requirements BANC Capital Ratios

13 13
Asset Quality Remains Strong and Stable Strengthening Credit Metrics Resulting in Increased ALLL / NPL Coverage Ratio
2Q 2015
3Q 2015
4Q 2015
1Q 2016
2Q 2016
% Change YoY
NPAs / Assets 0.66% 0.62% 0.56% 0.46% 0.45% (32%)
NPAs / Equity 6.7% 7.0% 7.1% 5.1% 4.8% (28%)
ALLL / NPLs 81% 77% 79% 81% 83% 2%
ALLL / Total Loans 0.78% 0.74% 0.69% 0.66% 0.60% (23%)
ALLL and Discount / Total Loans 2.94% 2.65% 2.66% 2.47% 2.33% (21%)

14 14 1 Dollars in billions 2 Dollars in millions 3 Diluted 4 Normalized to assume full 40% tax rate
Market Leading Asset and Earnings Growth Rates Platform and Infrastructure Investments Leading to Increased Long-term Value Creation
$6.5 $7.9 $26.5
$104.3
$179.2
2012 2013 2014 2015 2Q16
$1.7
$3.6
$6.0
$8.2
$10.2
2012 2013 2014 2015 2Q16
$(0.15)
$1.34
$0.39 $0.41
$1.60+
2012 2013 2014 2015
$1.3
$2.9
$4.7
$6.3
$7.9
2012 2013 2014 2015 2Q16
Deposits1
Earnings per Share3 Pretax Income2
Assets1
4
2016 Guidance Annualized
CAGR +67% CAGR +67%
CAGR +129% CAGR +42%

15 15
We Believe in California.
39.1 Million CA Population1
5.1% Population Growth 24% Higher Than National Average2
$61,489 Household Income 15% Higher Than National Average3
5.4% CA Unemployment Rate
Lowest Since 20074
13.4 Million CA Private Nonfarm Employment >11% of Total National Employment5
874,000 CA Private Businesses5
6th Largest World Economy $2.4 Trillion GDP6
>13% of Total U.S. GDP Largest of Any State7
3.0% CA GDP Growth in 20157
1 Census.gov (2015 est.); 2 Census.gov (April 1, 2010 to July 1, 2015 ); 3 Census.gov (2010-2014) in 2014 dollars; 4 BLS.gov (May 2016); 5 Census.gov (2013); 6 IMF World Economic Outlook (April 2016) and BEA Global Insight; 7 LAEDC Economic Forecast (Feb. 2016); 8 Cal Facts, Legislative Analyst’s Office (Dec 2014)
Largest and most liquid residential and commercial real estate market in the country CA is a national leader in the technology, aerospace and life sciences industries as well as entertainment, tourism
and agriculture CA firms have attracted venture capital funding in recent years that has equaled or exceeded the amount
received by firms in the other 49 states combined8
California banks have historically traded at a premium to national average given attractive market demographics
Demographics Employment
Economy
16 16
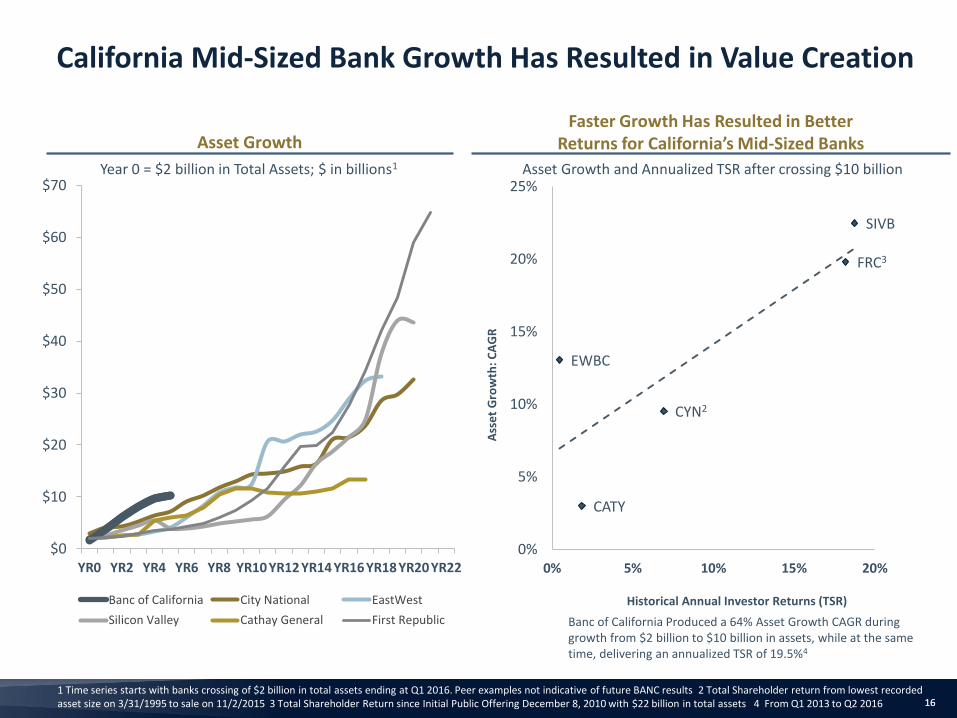
California Mid-Sized Bank Growth Has Resulted in Value Creation
$0
$10
$20
$30
$40
$50
$60
$70
YR0 YR2 YR4 YR6 YR8 YR10 YR12 YR14 YR16 YR18 YR20 YR22
Banc of California City National EastWest
Silicon Valley Cathay General First Republic
Year 0 = $2 billion in Total Assets; $ in billions1
FRC3
EWBC
SIVB
CYN2
CATY
0%
5%
10%
15%
20%
25%
0% 5% 10% 15% 20%
Ass
et
Gro
wth
: C
AG
R
Historical Annual Investor Returns (TSR)
Asset Growth and Annualized TSR after crossing $10 billion
Banc of California Produced a 64% Asset Growth CAGR during growth from $2 billion to $10 billion in assets, while at the same time, delivering an annualized TSR of 19.5%4
Asset Growth Faster Growth Has Resulted in Better
Returns for California’s Mid-Sized Banks
1 Time series starts with banks crossing of $2 billion in total assets ending at Q1 2016. Peer examples not indicative of future BANC results 2 Total Shareholder return from lowest recorded asset size on 3/31/1995 to sale on 11/2/2015 3 Total Shareholder Return since Initial Public Offering December 8, 2010 with $22 billion in total assets 4 From Q1 2013 to Q2 2016

17 17
Scale and Capability
California Focus • CA footprint and reach • % Deposits in CA • % Loans in CA • % Employees in CA • % of Branches in CA
• Capital and Balance Sheet to Serve Key Businesses • Breadth and Quality of Lending Products and Banking Services
California Banks with Under $2 Billion in
Assets
Community Bank
Specialty Bank Regional Bank
California’s Bank
Low High
Low
High
California Banks with
Over $2 Billion in
Assets
Uniquely Positioned in Market as California’s Bank

18 18 1 Excluding expenses related to capital transactions
2016 Guidance Implies Continued Outperformance Maintaining ROATCE and ROAA with Strong Balance Sheet Growth Will Yield 15%+ EPS Growth
Metric FY 2016 On Target
ROATCE 15%
ROAA 1%+
Efficiency Ratio 65% – 70%
Total Assets $10 – $11 billion
Earnings Per Share1 $1.60+

19 19
V I S I O N
We Are California’s Bank.

20 20
M I S S I O N
Empowering California through its Diverse Businesses, Entrepreneurs and Communities

21 21
W E B E L I E V E
We Believe In Empowering Dreams.
We Believe In Strong Partnerships.
We Believe In California.

22 22