barclays capital investment grade energy & pipeline...
TRANSCRIPT

Barclays Capital Investment Grade Energy & Pipeline
ConferenceMarch 2012

2
Cautionary Language Re: Forward-Looking Statements
This presentation contains forward-looking statements. Western Gas Partners, LP believesthat its expectations are based on reasonable assumptions. No assurance, however, can begiven that such expectations will prove to have been correct. A number of factors couldcause actual results to differ materially from the projections, anticipated results or otherexpectations expressed in this presentation. These factors include the ability to meetfinancial guidance or distribution-growth expectations; the ability to obtain new sources ofnatural gas supplies; the effect of fluctuations in commodity prices and the demand fornatural gas and related products; the ability to meet projected in-service dates for capitalgrowth projects; and construction costs or capital expenditures exceeding estimated orbudgeted costs or expenditures, as well as other factors described in the “Risk Factors”section of the Partnership’s most recent Form 10-K filed with the Securities and ExchangeCommission and other public filings and press releases by Western Gas Partners. WesternGas Partners undertakes no obligation to publicly update or revise any forward-lookingstatements. Please also see our earnings release, posted on our website atwww.westerngas.com, and the information provided at the end of this presentation forreconciliations of the differences between any non-GAAP financial measures used in thispresentation and the most directly comparable GAAP financial measures.

The WES Asset Portfolio
Helper
Clawson
Chipeta
MIGCHilight Complex
Newcastle
Bison
WattenbergPlatte ValleyLancaster
White Cliffs
Hugoton
HaleyDew / Pinnacle
Granger Complex Red Desert
Brasada
Western Gas Partners, LP
3rd Party Infrastructure
Major Pipelines
Fort Union
Current Assets / Investments 15 natural gas gathering systems 8 natural gas treating facilities 9 processing facilities 1 natural gas pipeline 2 NGL pipelines 1 crude oil pipeline
Current Throughput Attributable to WES Average daily throughput of 2.46 Bcf/d
4Q11 Throughput by Region
East Texas
81%Rockies
12%
Mid-Continent4%
West Texas3%
3
Treating Facilities
Processing Facilities
Gathering Lines
Rendezvous
Wind River

APC – WES Relationship
4
Fixed-Price Commodity Swap Agreements
Accretive Acquisitions
100% GP Ownership
44% LP Unit Ownership

Liquids Rich vs. Dry Gas Basins
5
Dry Gas Basin
Dry Gas Shale Play
Liquids-Rich Basin
Liquids-Rich Shale Play
2012E Gross Margin
Liquids-Rich Basins
77%
Dry Gas Basins (Demand Charge)
7%
Dry Gas Basins(Non-Demand
Charge)
16%
Powder River
Greater GreenRiver Basin
UintaNiobrara
DJ Basin
Bossier
Eagleford
Maverick
DelawareBasin
Hugoton
Platte Valley / Fort Lupton / Lancaster Plant Site
Wattenberg Plant
Western Gas Partners, LP
Processing FacilitiesGathering Lines
3rd Party Infrastructure
Major Pipelines
Anadarko Petroleum Corp.
Processing Facilities
6
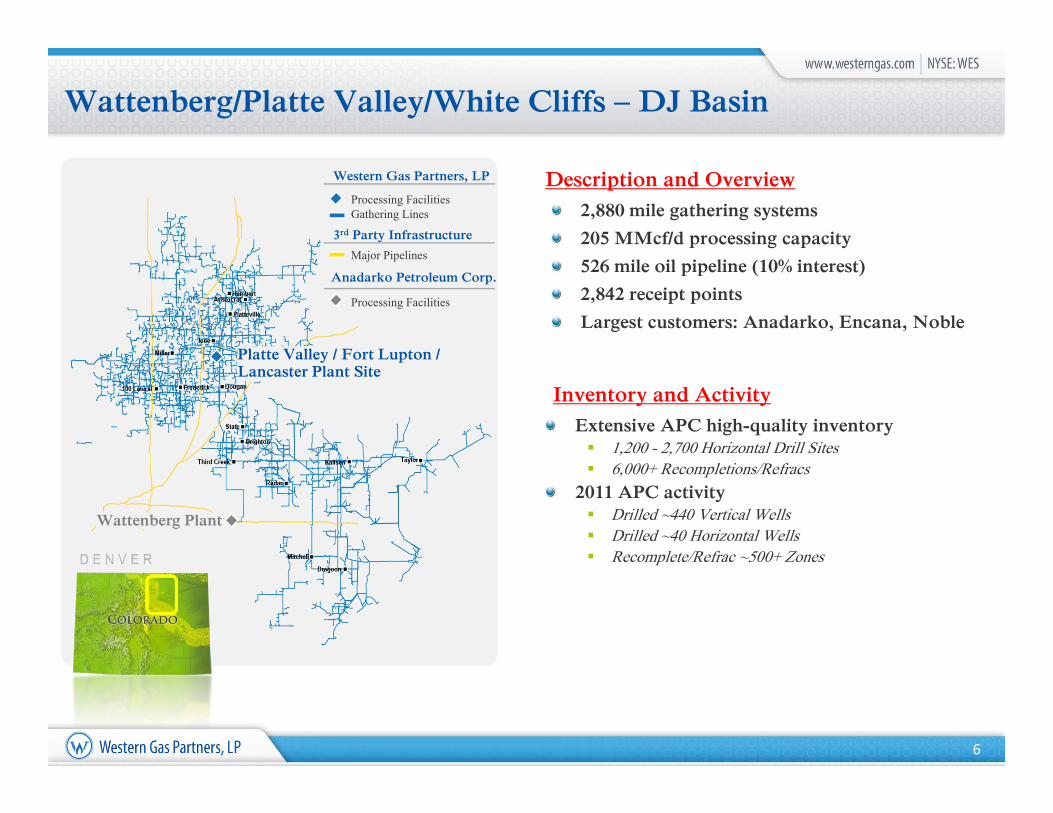
Wattenberg/Platte Valley/White Cliffs – DJ Basin
Extensive APC high-quality inventory 1,200 - 2,700 Horizontal Drill Sites 6,000+ Recompletions/Refracs
2011 APC activity Drilled ~440 Vertical Wells Drilled ~40 Horizontal Wells Recomplete/Refrac ~500+ Zones
Description and Overview
Inventory and Activity
2,880 mile gathering systems
205 MMcf/d processing capacity
526 mile oil pipeline (10% interest)
2,842 receipt points
Largest customers: Anadarko, Encana, Noble
Chipeta Plant
Natural Buttes Plant
Western Gas Partners, LP
Gathering Lines
3rd Party Infrastructure
Major Pipelines
NGL Line
Anadarko Petroleum Corp.
Gathering Lines
7
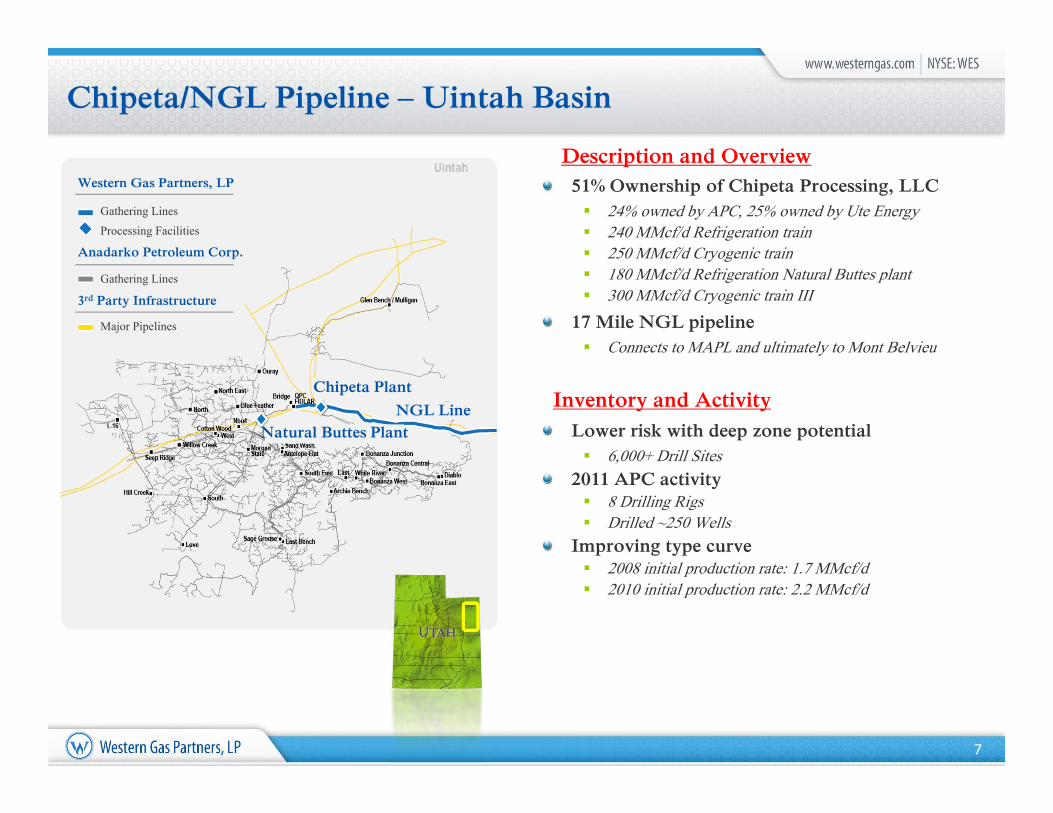
Chipeta/NGL Pipeline – Uintah Basin
Lower risk with deep zone potential 6,000+ Drill Sites
2011 APC activity 8 Drilling Rigs Drilled ~250 Wells
Improving type curve 2008 initial production rate: 1.7 MMcf/d 2010 initial production rate: 2.2 MMcf/d
Inventory and Activity
Description and Overview51% Ownership of Chipeta Processing, LLC 24% owned by APC, 25% owned by Ute Energy 240 MMcf/d Refrigeration train 250 MMcf/d Cryogenic train 180 MMcf/d Refrigeration Natural Buttes plant 300 MMcf/d Cryogenic train III
17 Mile NGL pipeline Connects to MAPL and ultimately to Mont Belvieu
Processing Facilities

8
Granger/Mountain Gas Resources – Greater Green River Basin
Inventory and Activity
Lower-risk drilling 6,000+ Drill Sites (5,000+ at Pinedale)
Pinedale – A world class asset 38.2 TCF Recoverable
2011 Ultra activity 242 Pinedale and Jonah Wells
2,528 mile gathering systems Does not include 22% interest in Rendezvous gas
services, LLC
Three cryogenic plants (373 MMcf/d capacity)
Two refrigeration trains (100 MMcf/d capacity)
Two fractionation trains (21,500 Bbl/d)
1,255 receipt points
Delivers gas to five major pipelines Access to two additional gas pipelines via Rendezvous
MAPL transports NGLs to Mont Belvieu
Description and Overview
Patrick Draw Plant
Red Desert Plant
Granger Plant
Western Gas Partners, LP
Processing FacilitiesGathering Lines
3rd Party Infrastructure
Major Pipelines
Rendezvous

9
Hilight and Newcastle – Powder River Basin (East)
Inventory and Activity
Conventional oil-driven plays
Diverse customer base
EOG and Resolute Resources operators –drilling in 2011; APC non-op interests
Increasing volumes under favorable POP contracts
Description and Overview
1,235 mile gathering system
Two refrigeration processing plants in service
Hilight delivers gas to MIGC (owned by WES), Newcastle to MGTC (owned by APC)
Liquids sold locally
Largest customers – Resolute, EOG, Devon
Western Gas Partners, LP
Processing FacilitiesGathering Lines
3rd Party Infrastructure
Major Pipelines
Anadarko Petroleum Corp.
Processing Facilities
MIGC
Fort Union
Hilight Plant
Newcastle Plant
Boggy Creek Compressor
MIGC

10
WES Core Principles
Stability
ReliabilityConservatism
Consistency
11
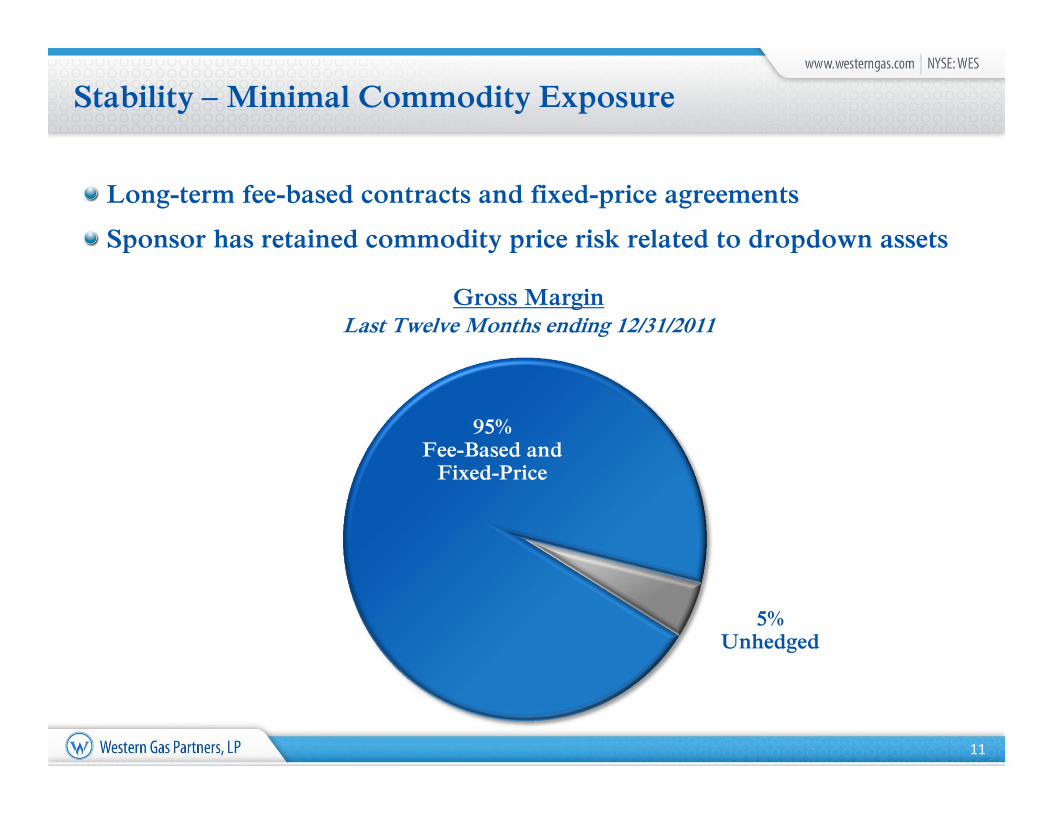
Stability – Minimal Commodity Exposure
Gross MarginLast Twelve Months ending 12/31/2011
Long-term fee-based contracts and fixed-price agreements
Sponsor has retained commodity price risk related to dropdown assets
5%Unhedged
95%Fee-Based and
Fixed-Price

Consistency – Track Record of Accretive Acquisitions
12
2008 2009 2010
5/2008IPO
12/2008 $210 MM
PRB Drop
7/2009 $107 MM Chipeta
Drop
1/2010 $254 MM Granger
Drop
8/2010$498 MM
Wattenberg Drop
7.9X
8.2X
7.2X
8.1X
2011
7/2011 $130 MM
BisonDrop
8.8X
1/2012$483 MM
Red Desert Drop
7.0X
2012

Conservatism – Commitment to Investment Grade Metrics
13
Coverage Ratio
0.00x
0.20x
0.40x
0.60x
0.80x
1.00x
1.20x
1.40x
1.60x
1.80x
2.00x
Debt / EBITDA1
0.0x
0.5x
1.0x
1.5x
2.0x
2.5x
3.0x
3.5x
4.0x
1. Quarter-end Debt Divided by (Reported EBITDA * 4)
Committed credit facility of $800MM through March 2016 Expandable to $1.0 Billion

$0.0
$10.0
$20.0
$30.0
$40.0
$50.0
$60.0
$70.0
$80.0
Mill
ions
14
Reported EBITDA
Reliability – Predictable, Transparent Results
Note: All figures shown as originally reported
Quarterly Distribution
$0.00
$0.05
$0.10
$0.15
$0.20
$0.25
$0.30
$0.35
$0.40
$0.45
$0.50
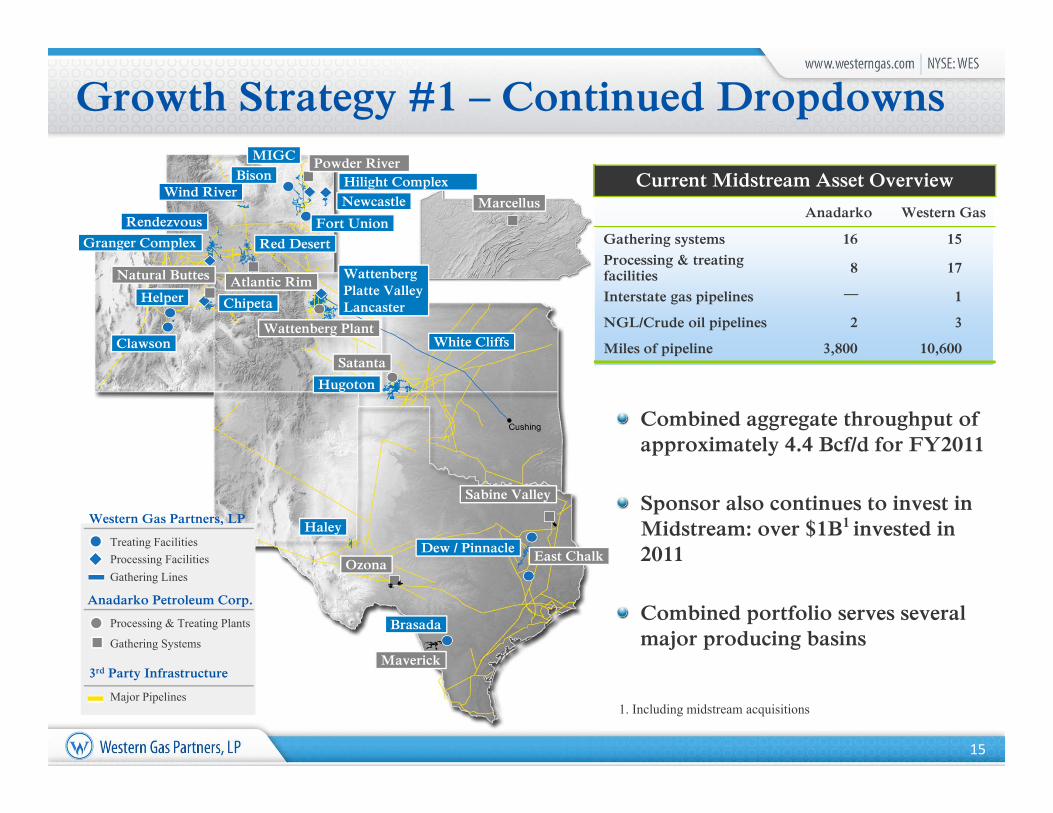
Current Midstream Asset Overview
Anadarko Western Gas
Gathering systems 16 15Processing & treating facilities 8 17
Interstate gas pipelines 1
NGL/Crude oil pipelines 2 3
Miles of pipeline 3,800 10,600
Growth Strategy #1 – Continued Dropdowns
15
Helper
Clawson
Chipeta
MIGC
Hilight ComplexNewcastle
Fort Union
WattenbergPlatte ValleyLancaster
White Cliffs
Hugoton
Haley
Dew / Pinnacle
Granger Complex
Brasada
Western Gas Partners, LP
Processing Facilities
3rd Party Infrastructure
Major Pipelines
Rendezvous
Wind RiverBison
Powder River
Natural Buttes Atlantic Rim
Wattenberg Plant
Satanta
Red Desert
Marcellus
Sabine Valley
East Chalk
Maverick
Ozona
Anadarko Petroleum Corp.
Processing & Treating Plants
Combined aggregate throughput of approximately 4.4 Bcf/d for FY2011
Sponsor also continues to invest in Midstream: over $1B1 invested in 2011
Combined portfolio serves several major producing basinsGathering Systems
Treating Facilities
Gathering Lines
1. Including midstream acquisitions

16
Growth Strategy #2 – Strategic Expansions
Chipeta Train III Underwritten by Anadarko volume commitment Base Case IRR of 18-25%
Lancaster Plant (1Q2014 expected start-up) 10-year, 100% fixed-fee agreement Throughput commitment from Anadarko Base Case EBITDA multiple of ~6.5x
Brasada Plant (2Q2013 expected start-up) 10-year, 100% fixed-fee agreement Throughput commitment from Anadarko Base Case EBITDA multiple of ~6.5x

17
Growth Strategy #3 – Equity Options
APC Negotiated Equity Interest
Project APC Interest Date Acquired
Satanta Plant 49% January 2011
Texas Express Pipeline 20% September 2011
Bone Spring Plant 33 1/3% December 2011
APC negotiates equity interest options in projects in exchange for their long-term volume commitments
WES acquired a 10% interest in White Cliffs Pipeline, LLC in September 2010 Potential for replication in other areas

2012 Outlook
18
($ in millions)Full-Year
2012
Adjusted EBITDA $335 - 365
Total Capex $410 - 460
Maint. Capex as % of Adj. EBITDA 8 - 11%
Distribution Growth 16 - 20%

www.westerngas.com

20
Non-GAAP Adjusted EBITDA Reconciliation
1. As reported 2. Includes the Partnership's 51% share of income tax expense; depreciation, amortization and impairment; and other income, net,
attributable to Chipeta Processing LLC
(in thousands)Reconciliation of Net Income to Adjusted EBITDA (1)
3Q08 4Q08 1Q09 2Q09 3Q09 4Q09 1Q10 2Q10 3Q10 4Q10 1Q11 2Q11 3Q11 4Q11
Net income 17,396$ 20,113$ 16,958$ 18,124$ 17,048$ 19,278$ 22,914$ 23,411$ 31,481$ 35,143$ 34,984$ 33,939$ 36,809$ 34,427$ Add:
Distributions from equity investees - 1,455 1,111 1,459 1,555 1,363 1,111 1,038 1,381 2,316 2,434 3,013 2,426 2,739 Non-cash equity-based compensation expense - - 846 942 948 844 567 680 570 2,970 1,928 1,918 2,389 7,519 Expenses in excess of omnibus cap - - - - - 842 - - - 133 - - - - Interest expense 37 253 1,785 1,786 3,127 3,257 3,528 3,598 5,648 6,019 6,111 6,697 8,931 8,607 Income tax expense (2) 68 2,654 - 55 171 164 957 17 1,505 92 32 94 92 446 Depreciation, amortization & impairments (2) 7,145 8,395 8,621 8,752 9,586 9,757 12,983 12,849 18,419 17,626 18,853 21,007 21,928 22,321 Other expense, net (2) - - - - - - - 2,395 - - - 3,682 - -
Less:Equity Income, net - 896 1,550 1,985 1,794 1,653 1,340 1,258 1,911 2,042 2,044 2,646 2,299 3,102 Interest income - affiliate 4,253 4,512 4,225 4,225 4,225 4,225 4,225 4,225 4,225 4,225 4,225 4,225 4,225 4,225 Other income, net (2) 93 21 5 9 12 11 19 - 62 187 1,759 6 288 Income tax benefit - - 490 - - - - - - - - - - -
Adjusted EBITDA 20,300$ 27,441$ 23,051$ 24,899$ 26,404$ 29,616$ 36,476$ 38,505$ 52,806$ 57,845$ 56,314$ 63,479$ 66,045$ 68,444$

21
Non-GAAP DCF Reconciliation
1. As reported 2. Includes the Partnership's 51% share of income tax expense; depreciation, amortization and impairment; and other income, net,
attributable to Chipeta Processing LLC3. 3Q08-3Q09 distributions used in the coverage ratio calculation are based on the weighted average units outstanding during the period4. Excludes $2.5MM prior-period benefit
(in thousands)Reconciliation of Net Income to Distributable Cash Flow (1)
3Q08 4Q08 1Q09 2Q09 3Q09 4Q09 1Q10 2Q10 3Q10 4Q10 1Q11 2Q11 3Q11 4Q11
Net income 17,396$ 20,113$ 16,958$ 18,124$ 17,048$ 19,278$ 22,914$ 23,411$ 31,481$ 35,143$ 34,984$ 33,939$ 36,809$ 34,427$ Add:
Distributions from equity investees - 1,455 1,111 1,459 1,555 1,363 1,111 1,038 1,381 2,316 2,434 3,013 2,426 2,739 Non-cash equity-based compensation expense - - 846 942 948 844 567 680 570 2,970 1,928 1,918 2,389 7,519 Expenses in excess of omnibus cap - - - - - 842 - - - 133 - - - - Income tax expense (2) 68 2,654 - 55 171 164 957 17 1,505 92 32 94 92 446 Depreciation, amortization & impairments (2) 7,145 8,395 8,621 8,752 9,586 9,757 12,983 12,849 18,419 17,626 18,853 21,007 21,928 22,321
Other expense, net (2) - - - - - - - 2,395 - - - 3,682 - - Less:Equity Income, net - 896 1,550 1,985 1,794 1,653 1,340 1,258 1,911 2,042 2,044 2,646 2,299 3,102 Cash paid for maintenance capital expenditures (2) 3,802 6,908 4,226 4,500 3,288 4,018 3,891 3,742 5,983 5,563 4,702 4,375 9,690 6,885 Capitalized interest - - - - - - - - - - - 13 121 286 Cash paid for income taxes - - - - - - - - - 507 - - 190 - Interest income, net (non-cash settled) - 324 - - - - - - - - - - - - Other income, net (2) 93 21 5 9 12 11 19 - 62 187 1,759 - 6 288 Income tax benefit - - 490 - - - - - - - - - - -
Distributable Cash Flow 20,714$ 24,468$ 21,265$ 22,838$ 24,214$ 26,566$ 33,282$ 35,390$ 45,400$ 49,981$ 49,726$ 56,619$ 51,338$ 56,891$
Distribution declared, three Months ended Limited Partner 15,922 16,689 16,689 17,364 17,924 20,966 21,601 23,838 25,589 29,478 31,756 34,178 37,859 39,941 General Partner 325 341 341 354 366 428 441 540 792 1,086 1,412 1,885 2,464 3,086 Total 16,247 17,030 17,030 17,718 18,290 21,394 22,042 24,378 26,381 30,564 33,168 36,063 40,323 43,027
Distribution Coverage Ratio(3) 1.27x 1.44x 1.25x 1.30x 1.32x 1.13x(4) 1.51x 1.45x 1.72x 1.64x 1.50x 1.57x 1.27x 1.32x

www.westerngas.com