barrick gold corporation - s22.q4cdn.com 2018 priorities and first quarter highlights operating cash...
TRANSCRIPT
1
BarrickGoldCorporation
2018 First Quarter Results | April 24, 2018
2
Certain information contained or incorporated by reference in this presentation, including any information as to our strategy, projects, plans or future financial or operating performance, constitutes “forward‐looking statements”. All statements, other than statements of historical fact, are forward‐looking statements. The words “believe”, “expect”, “anticipate”, “target”, “plan”, “objective”, “assume”, “intend”, “project”, “goal”, “continue”, “budget”, “estimate”, “potential”, “may”, “will”, “can”, “could”, “would” and similar expressions identify forward‐looking statements. In particular, this presentation contains forward‐looking statements including, without limitation, with respect to: (i) Barrick’s forward‐looking production guidance; (ii) estimates of future cost of sales per ounce for gold and per pound for copper, cash costs per ounce and C1 cash costs per pound, and all‐in‐sustaining costs per ounce/pound; (iii) cash flow forecasts; (iv) projected capital, operating, exploration and general and administrative expenditures; (v) Barrick’s ability to successfully negotiate a new partnership between Acacia Mining plc (“Acacia”) and the Government of Tanzania, and the timing for completion of such negotiations; (vi) targeted debt and cost reductions; (vii) estimated timing for construction of, and production from, new projects (viii) the ability of investments in infrastructure and mine exploration drilling to strengthen the quality of Barrick’s production profile; (ix) our pipeline of high confidence projects at or near existing operations; (x) potential mineralization and metal or mineral recoveries; (xi) the estimated timing for permitting and a record of decision at Cortez Deep South; (xii) the adjustment of Barrick’s closure plan for surface infrastructure on the Chilean side of the Pascua‐Lama project and continued evaluation of de‐risking opportunities; (xiii) asset sales, joint ventures and partnerships; and (xiv) expectations regarding future price assumptions, financial performance and other outlook or guidance.
Forward‐looking statements are necessarily based upon a number of estimates and assumptions including material estimates and assumptions related to the factors set forth below that, while considered reasonable by the Company as at the date of this presentation in light of management’s experience and perception of current conditions and expected developments, are inherently subject to significant business, economic and competitive uncertainties and contingencies. Known and unknown factors could cause actual results to differ materially from those projected in the forward‐looking statements and undue reliance should not be placed on such statements and information. Such factors include, but are not limited to: fluctuations in the spot and forward price of gold, copper or certain other commodities (such as silver, diesel fuel, natural gas and electricity); the speculative nature of mineral exploration and development; changes in mineral production performance, exploitation and exploration successes; risks associated with the fact that certain Best‐in‐Class initiatives are still in the early stages of evaluation and additional engineering and other analysis is required to fully assess their impact; risks associated with the ongoing implementation of Barrick's digital transformation initiative, and the ability of projects under this initiative to meet the Barrick's capital allocation objectives; the duration of the Tanzanian ban on mineral concentrate exports; the ultimate terms of any definitive agreement between Acacia and the Government of Tanzania to resolve a dispute relating to the imposition of the concentrate export ban and allegations by the Government of Tanzania that Acacia under‐declared the metal content of concentrate exports from Tanzania; the status of certain tax re‐assessments by the Tanzanian government; the manner in which amendments to the 2010 Mining Act (Tanzania) increasing the royalty rate applicable to metallic minerals such as gold, copper and silver to 6% (from 4%), the new Finance Act (Tanzania) imposing a 1% clearing fee on the value of all minerals exported from Tanzania from July 1, 2017 and the new Mining Regulations announced by the Government of Tanzania in January 2018 will be implemented and the impact of these and other legislative changes on Acacia; whether Acacia will approve the terms of any final agreement reached between Barrick and the Government of Tanzania with respect to the dispute between Acacia and the Government of Tanzania; the benefits expected from recent transactions being realized; diminishing quantities or grades of reserves; increased costs, delays, suspensions and technical challenges associated with the construction of capital projects; operating or technical difficulties in connection with mining or development activities, including geotechnical challenges and disruptions in the maintenance or provision of required infrastructure and information technology systems; failure to comply with environmental and health and safety laws and regulations; timing of receipt of, or failure to comply with, necessary permits and approvals; uncertainty whether some or all of the Best‐in‐Class initiatives, targeted investments and projects will meet the Company’s capital allocation objectives and internal hurdle rate; the impact of global liquidity and credit availability on the timing of cash flows and the values of assets and liabilities based on projected future cash flows; adverse changes in our credit ratings; the impact of inflation; fluctuations in the currency markets; changes in U.S. dollar interest rates; risks arising from holding derivative instruments; changes in national and local government legislation, taxation, controls or regulations and/or changes in the administration of laws, policies and practices, expropriation or nationalization of property and political or economic developments in Canada, the United States and other jurisdictions in which the Company or its affiliates do or may carry on business in the future; lack of certainty with respect to foreign legal systems, corruption and other factors that are inconsistent with the rule of law; damage to the Company’s reputation due to the actual or perceived occurrence of any number of events, including negative publicity with respect to the Company’s handling of environmental matters or dealings with community groups, whether true or not; the possibility that future exploration results will not be consistent with the Company’s expectations; risks that exploration data may be incomplete and considerable additional work may be required to complete further evaluation, including but not limited to drilling, engineering and socioeconomic studies and investment; risk of loss due to acts of war, terrorism, sabotage and civil disturbances; litigation and legal and administrative proceedings; contests over title to properties, particularly title to undeveloped properties, or over access to water, power and other required infrastructure; business opportunities that may be presented to, or pursued by, the Company; risks associated with the fact that certain of the initiatives described in this presentation are still in the early stages and may not materialize; our ability to successfully integrate acquisitions or complete divestitures;risks associated with working with partners in jointly controlled assets; employee relations including loss of key employees; increased costs and physical risks, including extreme weather events and resource shortages, related to climate change; availability and increased costs associated with mining inputs and labor; and the organization of our previously held African gold operations and properties under a separate listed Company. In addition, there are risks and hazards associated with the business of mineral exploration, development and mining, including environmental hazards, industrial accidents, unusual or unexpected formations, pressures, cave‐ins, flooding and gold bullion, copper cathode or gold or copper concentrate losses (and the risk of inadequate insurance, or inability to obtain insurance, to cover these risks).
Many of these uncertainties and contingencies can affect our actual results and could cause actual results to differ materially from those expressed or implied in any forward‐looking statements made by, or on behalf of, us. Readers are cautioned that forward‐looking statements are not guarantees of future performance. All of the forward‐looking statements made in this presentation are qualified by these cautionary statements. Specific reference is made to the most recent Form 40‐F/Annual Information Form on file with the SEC and Canadian provincial securities regulatory authorities for a more detailed discussion of some of the factors underlying forward‐looking statements and the risks that may affect Barrick’s ability to achieve the expectations set forth in the forward‐looking statements contained in this presentation.
Barrick disclaims any intention or obligation to update or revise any forward‐looking statements whether as a result of new information, future events or otherwise, except as required by applicable law.
CAUTIONARY STATEMENT ON FORWARD-LOOKING INFORMATION

3
Today’sSpeakers
Catherine RawChief Financial Officer
Greg WalkerSenior Vice President
Operational and
Technical Excellence
Kelvin DushniskyPresident
Bill MacNevinBarrick Nevada CEO
Rob KrcmarovExecutive Vice President
Exploration and Growth
4
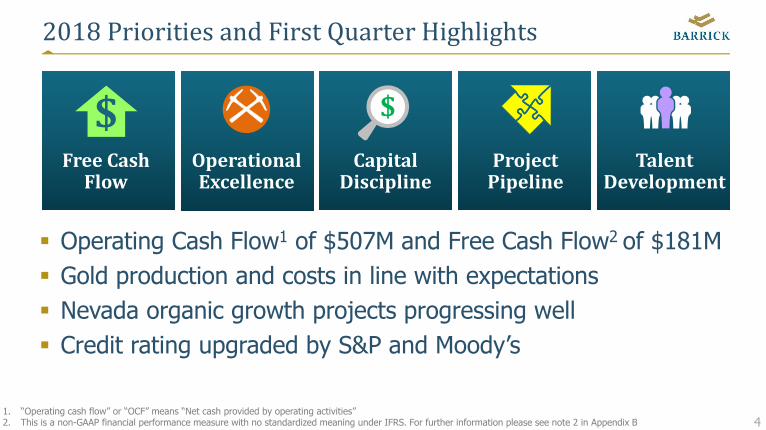
2018PrioritiesandFirstQuarterHighlights
Operating Cash Flow1 of $507M and Free Cash Flow2 of $181M Gold production and costs in line with expectations Nevada organic growth projects progressing well Credit rating upgraded by S&P and Moody’s
1. “Operating cash flow” or “OCF” means “Net cash provided by operating activities”2. This is a non-GAAP financial performance measure with no standardized meaning under IFRS. For further information please see note 2 in Appendix B
FreeCashFlow
ProjectPipeline
CapitalDiscipline
OperationalExcellence
TalentDevelopment
$ $
5
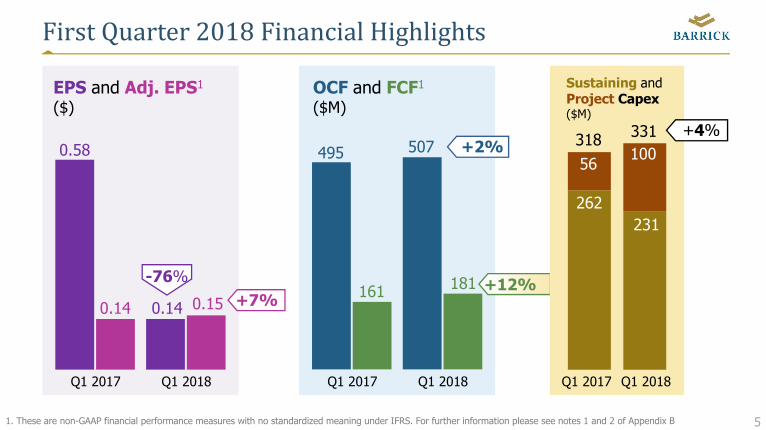
FirstQuarter2018FinancialHighlights
1. These are non-GAAP financial performance measures with no standardized meaning under IFRS. For further information please see notes 1 and 2 of Appendix B
Q1 2017 Q1 2018
Sustaining andProject Capex($M)
262
10056
331318 +4%
231
Q1 2017 Q1 2018
EPS and Adj. EPS1
($)
0.58
0.14
Q1 2017 Q1 2018
OCF and FCF1
($M)
+7%+12%
0.15
495 507
161 181-76%
+2%
0.14
6
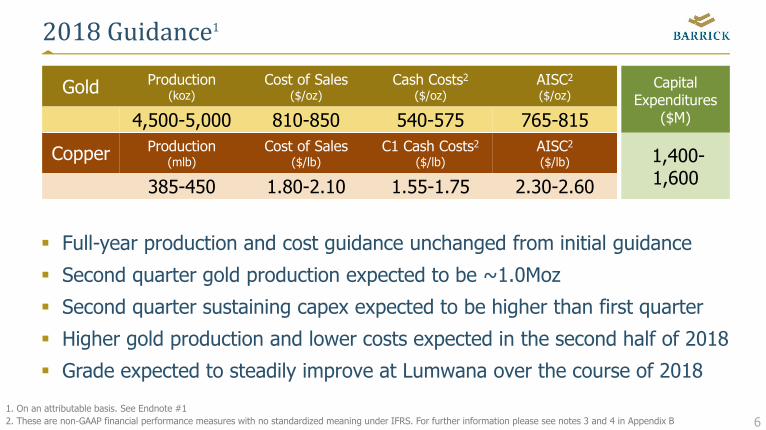
2018Guidance1
Full-year production and cost guidance unchanged from initial guidance
Second quarter gold production expected to be ~1.0Moz
Second quarter sustaining capex expected to be higher than first quarter
Higher gold production and lower costs expected in the second half of 2018
Grade expected to steadily improve at Lumwana over the course of 2018
Gold Production (koz)
Cost of Sales($/oz)
Cash Costs2
($/oz)AISC2
($/oz)
4,500-5,000 810-850 540-575 765-815
Copper Production (mlb)
Cost of Sales($/lb)
C1 Cash Costs2
($/lb)AISC2
($/lb)
385-450 1.80-2.10 1.55-1.75 2.30-2.60
1. On an attributable basis. See Endnote #1 2. These are non-GAAP financial performance measures with no standardized meaning under IFRS. For further information please see notes 3 and 4 in Appendix B
Capital Expenditures
($M)
1,400-1,600
7
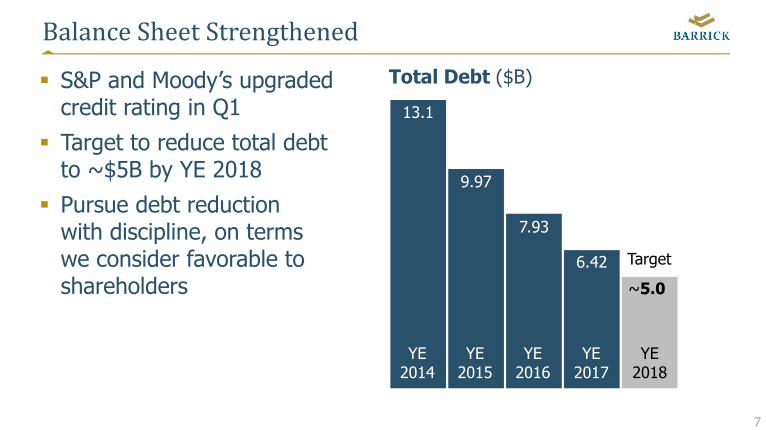
BalanceSheetStrengthened
S&P and Moody’s upgraded credit rating in Q1
Target to reduce total debt to ~$5B by YE 2018
Pursue debt reduction with discipline, on terms we consider favorable to shareholders
Total Debt ($B)
YE2015
YE2016
YE2018
YE2014
YE2017
Target
~5.0
9.97
7.93
13.1
6.42
8
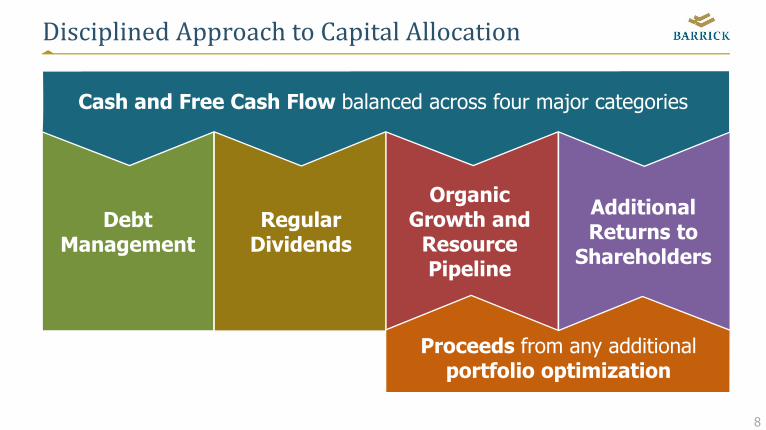
DisciplinedApproachtoCapitalAllocation
Cash and Free Cash Flow balanced across four major categories
DebtManagement
Organic Growth and
Resource Pipeline
RegularDividends
Additional Returns to
Shareholders
Proceeds from any additional portfolio optimization
9
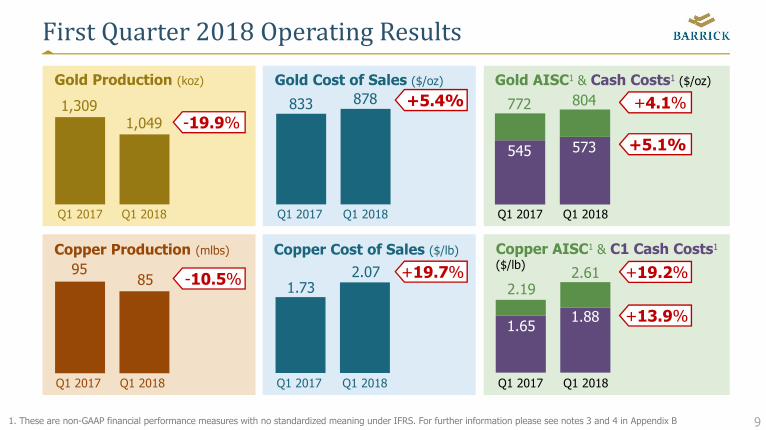
FirstQuarter2018OperatingResults
1. These are non-GAAP financial performance measures with no standardized meaning under IFRS. For further information please see notes 3 and 4 in Appendix B
Q1 2017 Q1 2018 Q1 2017 Q1 2018Q1 2017 Q1 2018
1,3091,049
772 804833 878
545 573
Q1 2017 Q1 2018 Q1 2017 Q1 2018Q1 2017 Q1 2018
9585
2.192.61
1.732.07
1.651.88
Gold Production (koz) Gold AISC1 & Cash Costs1 ($/oz)Gold Cost of Sales ($/oz)
Copper Production (mlbs) Copper Cost of Sales ($/lb) Copper AISC1 & C1 Cash Costs1
($/lb)
-19.9%
-10.5%
+5.4%
+19.7%
+4.1%
+19.2%
+5.1%
+13.9%
10
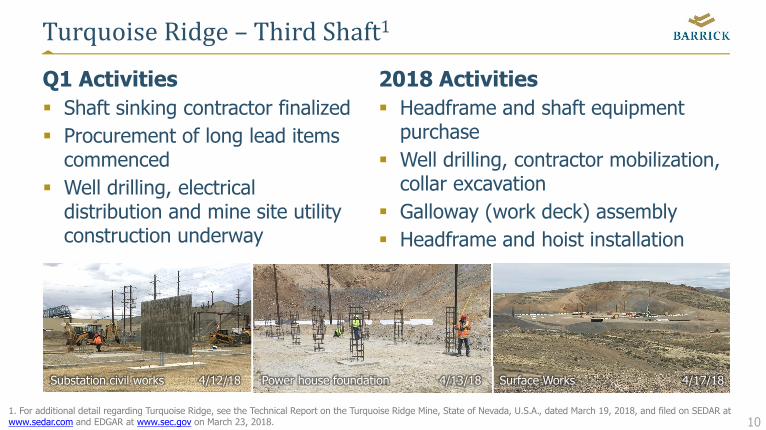
TurquoiseRidge– ThirdShaft1
Q1 Activities Shaft sinking contractor finalized Procurement of long lead items
commenced Well drilling, electrical
distribution and mine site utility construction underway
2018 Activities Headframe and shaft equipment
purchase Well drilling, contractor mobilization,
collar excavation Galloway (work deck) assembly Headframe and hoist installation
Substation civil works Power house foundation
1. For additional detail regarding Turquoise Ridge, see the Technical Report on the Turquoise Ridge Mine, State of Nevada, U.S.A., dated March 19, 2018, and filed on SEDAR at www.sedar.com and EDGAR at www.sec.gov on March 23, 2018.
Surface Works 4/17/184/12/18 4/13/18
11
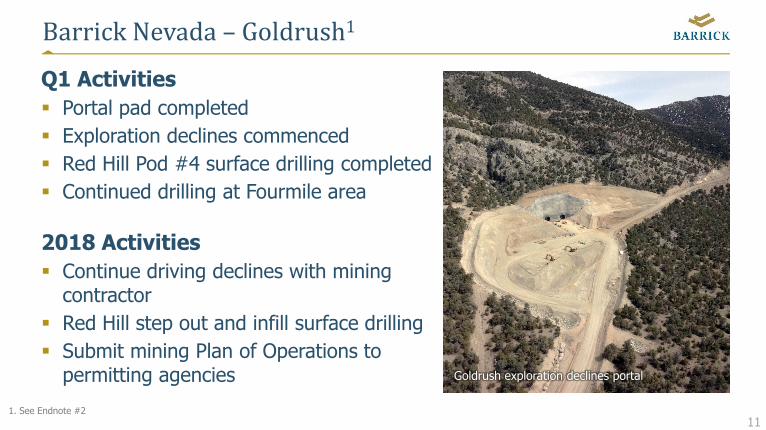
BarrickNevada– Goldrush1
Q1 Activities Portal pad completed Exploration declines commenced Red Hill Pod #4 surface drilling completed Continued drilling at Fourmile area
2018 Activities Continue driving declines with mining
contractor Red Hill step out and infill surface drilling Submit mining Plan of Operations to
permitting agencies Goldrush exploration declines portal
1. See Endnote #2
12
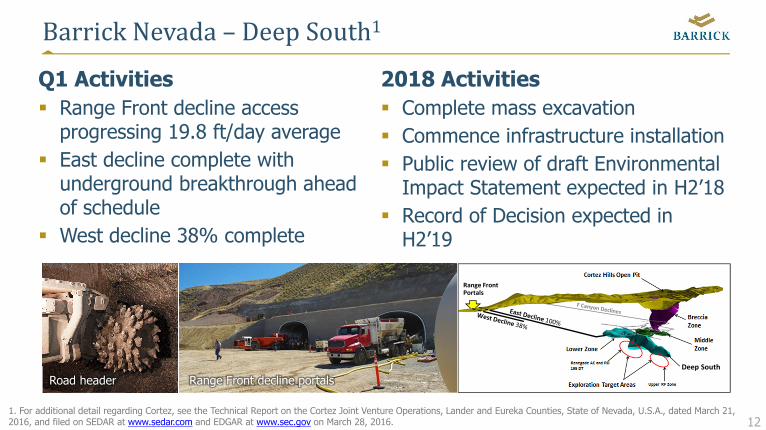
BarrickNevada– DeepSouth1
Q1 Activities Range Front decline access
progressing 19.8 ft/day average East decline complete with
underground breakthrough ahead of schedule
West decline 38% complete
2018 Activities Complete mass excavation Commence infrastructure installation Public review of draft Environmental
Impact Statement expected in H2’18 Record of Decision expected in
H2’19
Road header Range Front decline portals
1. For additional detail regarding Cortez, see the Technical Report on the Cortez Joint Venture Operations, Lander and Eureka Counties, State of Nevada, U.S.A., dated March 21, 2016, and filed on SEDAR at www.sedar.com and EDGAR at www.sec.gov on March 28, 2016.
Range FrontPortals
Deep South
13
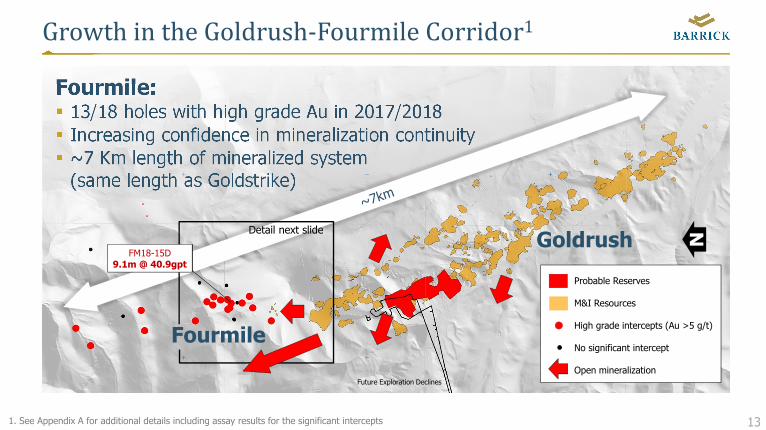
GrowthintheGoldrush‐FourmileCorridor1
Fourmile: 13/18 holes with high grade Au in 2017/2018 Increasing confidence in mineralization continuity ~7 Km length of mineralized system
(same length as Goldstrike)
Future Exploration Declines
Goldrush
Fourmile
Detail next slide
FM18-15D9.1m @ 40.9gpt
1. See Appendix A for additional details including assay results for the significant intercepts
Probable Reserves
M&I Resources
High grade intercepts (Au >5 g/t)
No significant intercept
Open mineralization
N
14
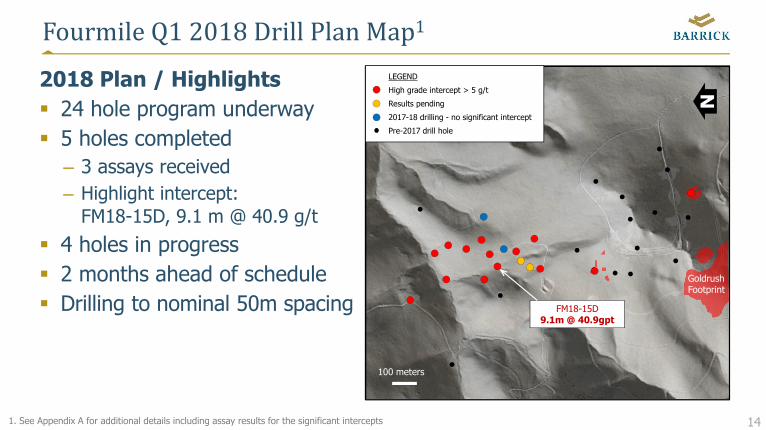
FourmileQ12018DrillPlanMap1
2018 Plan / Highlights 24 hole program underway 5 holes completed – 3 assays received– Highlight intercept:
FM18-15D, 9.1 m @ 40.9 g/t
4 holes in progress 2 months ahead of schedule Drilling to nominal 50m spacing
100 meters
Goldrush Footprint
LEGEND
High grade intercept > 5 g/t
Results pending
2017-18 drilling - no significant intercept
Pre-2017 drill hole
FM18-15D9.1m @ 40.9gpt
N
1. See Appendix A for additional details including assay results for the significant intercepts
15
BarrickGoldCorporation
16
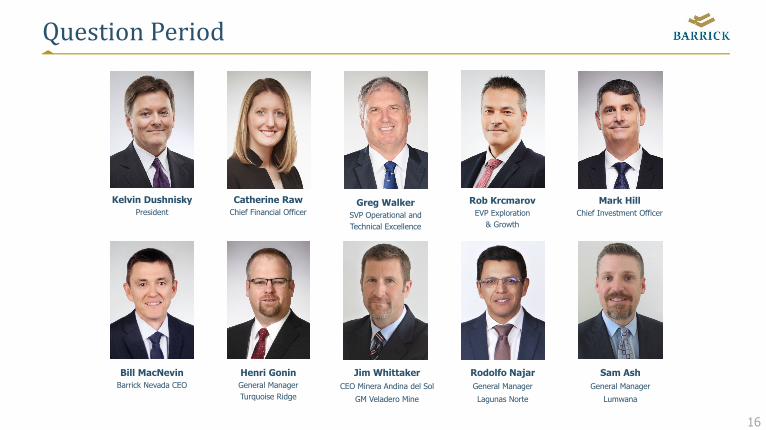
QuestionPeriod
Catherine RawChief Financial Officer
Rob KrcmarovEVP Exploration
& Growth
Bill MacNevinBarrick Nevada CEO
Greg WalkerSVP Operational and Technical Excellence
Henri GoninGeneral ManagerTurquoise Ridge
Jim WhittakerCEO Minera Andina del Sol
GM Veladero Mine
Kelvin DushniskyPresident
Rodolfo NajarGeneral Manager
Lagunas Norte
Sam AshGeneral Manager
Lumwana
Mark HillChief Investment Officer
17
TechnicalInformation
1. 2018 guidance is based on gold, copper, and oil price assumptions of $1,200/oz, $2.75/lb, and $55/bbl, respectively, a USD:AUD exchange rate of 0.75:1, a CAD:USD exchange rate of 1.25:1, a ARS:USD exchange rate of 18.35:1 and a CLP:USD exchange rate of 650:1. For economic sensitivity analysis of these assumptions, please refer to page 12 of Barrick’s 2017 Full Year and Fourth Quarter Results.
2. Estimated in accordance with National Instrument 43-101 as required by Canadian securities regulatory authorities. Estimates are as of December 31, 2017, unless otherwise noted. Goldrush probable reserves of 5.7 million tonnes grading 8.12 g/t, representing 1.5 million ounces of gold. Goldrush measured resources of 140,000 tonnes grading 10.44 g/t, representing 47,000 ounces of gold, and indicated resources 31.4 million tonnes grading 9.27 g/t, representing 9.4 million ounces of gold. Complete mineral reserve and mineral resource data for all mines and projects referenced in this press release, including tonnes, grades, and ounces, can be found on pages 29-39 of Barrick’s Annual Information Form for the year ended December 31, 2017.
The scientific and technical information contained in this presentation has been reviewed and approved by Steven Haggarty, P. Eng., Senior Director, Metallurgy of Barrick; Rick Sims, Registered Member SME, Vice President, Reserves and Resources of Barrick; and Robert Kcrmarov, FAusIMM, Executive Vice President, Exploration and Growth of Barrick, who are each a "Qualified Person" as defined in National Instrument 43-101 – Standards of Disclosure for Mineral Projects.
Endnotes
18
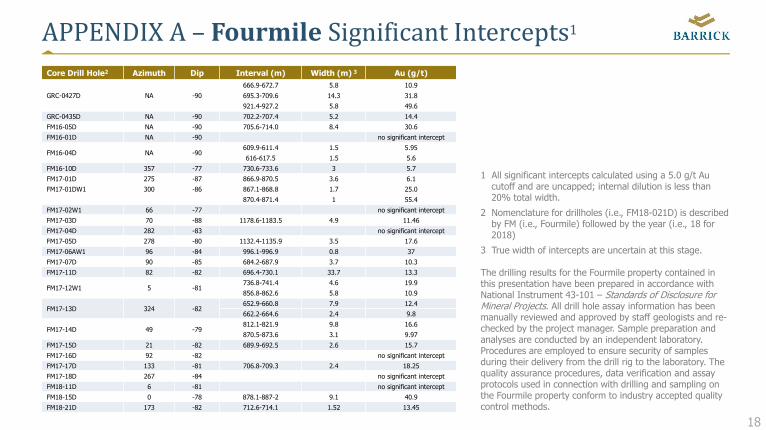
APPENDIXA– FourmileSignificantIntercepts1Core Drill Hole2 Azimuth Dip Interval (m) Width (m) 3 Au (g/t)
GRC-0427D NA -90
666.9-672.7 5.8 10.9
695.3-709.6 14.3 31.8
921.4-927.2 5.8 49.6
GRC-0435D NA -90 702.2-707.4 5.2 14.4
FM16-05D NA -90 705.6-714.0 8.4 30.6
FM16-01D NA -90 no significant intercept
FM16-04D NA -90609.9-611.4 1.5 5.95
616-617.5 1.5 5.6
FM16-10D 357 -77 730.6-733.6 3 5.7
FM17-01D 275 -87 866.9-870.5 3.6 6.1
FM17-01DW1 300 -86 867.1-868.8 1.7 25.0
870.4-871.4 1 55.4
FM17-02W1 66 -77 no significant intercept
FM17-03D 70 -88 1178.6-1183.5 4.9 11.46
FM17-04D 282 -83 no significant intercept
FM17-05D 278 -80 1132.4-1135.9 3.5 17.6
FM17-06AW1 96 -84 996.1-996.9 0.8 37
FM17-07D 90 -85 684.2-687.9 3.7 10.3
FM17-11D 82 -82 696.4-730.1 33.7 13.3
FM17-12W1 5 -81736.8-741.4 4.6 19.9
856.8-862.6 5.8 10.9
FM17-13D 324 -82652.9-660.8 7.9 12.4
662.2-664.6 2.4 9.8
FM17-14D 49 -79812.1-821.9 9.8 16.6
870.5-873.6 3.1 9.97
FM17-15D 21 -82 689.9-692.5 2.6 15.7
FM17-16D 92 -82 no significant intercept
FM17-17D 133 -81 706.8-709.3 2.4 18.25
FM17-18D 267 -84 no significant intercept
FM18-11D 6 -81 no significant intercept
FM18-15D 0 -78 878.1-887-2 9.1 40.9
FM18-21D 173 -82 712.6-714.1 1.52 13.45
1 All significant intercepts calculated using a 5.0 g/t Au cutoff and are uncapped; internal dilution is less than 20% total width.
2 Nomenclature for drillholes (i.e., FM18-021D) is described by FM (i.e., Fourmile) followed by the year (i.e., 18 for 2018)
3 True width of intercepts are uncertain at this stage.
The drilling results for the Fourmile property contained in this presentation have been prepared in accordance with National Instrument 43-101 – Standards of Disclosure for Mineral Projects. All drill hole assay information has been manually reviewed and approved by staff geologists and re-checked by the project manager. Sample preparation and analyses are conducted by an independent laboratory. Procedures are employed to ensure security of samples during their delivery from the drill rig to the laboratory. The quality assurance procedures, data verification and assay protocols used in connection with drilling and sampling on the Fourmile property conform to industry accepted quality control methods.
Appendix B
NOTE 1
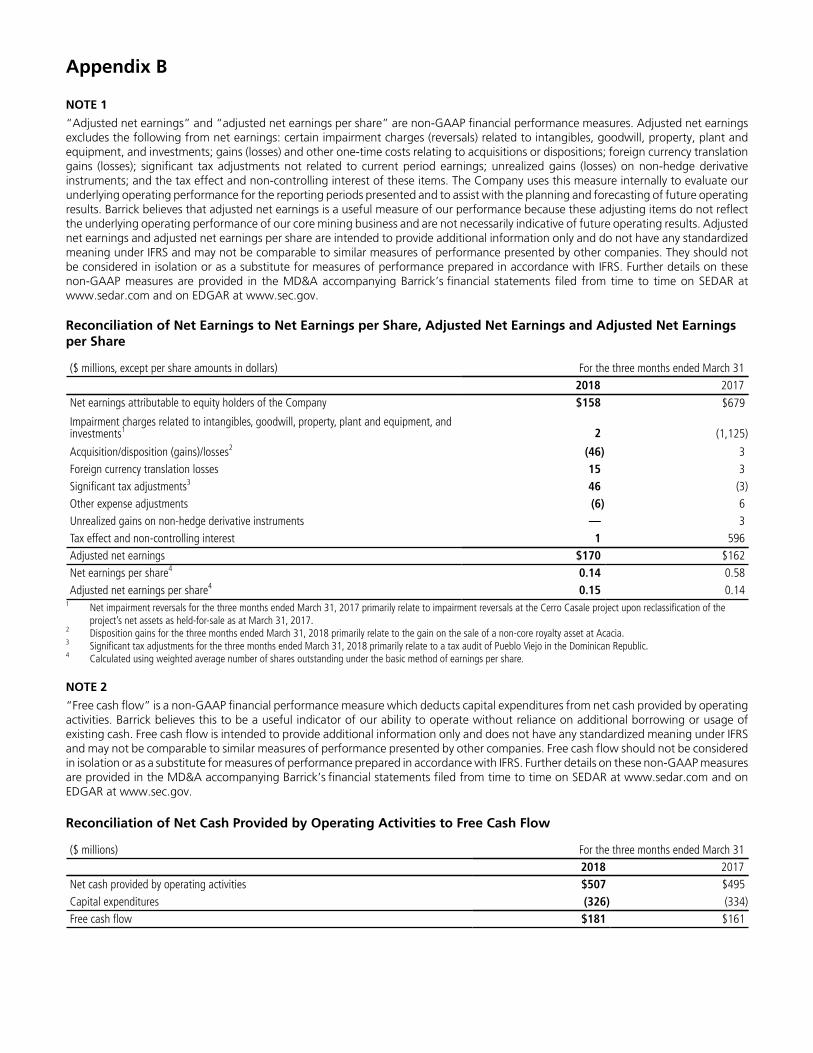
“Adjusted net earnings” and “adjusted net earnings per share” are non-GAAP financial performance measures. Adjusted net earnings excludes the following from net earnings: certain impairment charges (reversals) related to intangibles, goodwill, property, plant and equipment, and investments; gains (losses) and other one-time costs relating to acquisitions or dispositions; foreign currency translation gains (losses); significant tax adjustments not related to current period earnings; unrealized gains (losses) on non-hedge derivative instruments; and the tax effect and non-controlling interest of these items. The Company uses this measure internally to evaluate our underlying operating performance for the reporting periods presented and to assist with the planning and forecasting of future operating results. Barrick believes that adjusted net earnings is a useful measure of our performance because these adjusting items do not reflect the underlying operating performance of our core mining business and are not necessarily indicative of future operating results. Adjusted net earnings and adjusted net earnings per share are intended to provide additional information only and do not have any standardized meaning under IFRS and may not be comparable to similar measures of performance presented by other companies. They should not be considered in isolation or as a substitute for measures of performance prepared in accordance with IFRS. Further details on these non-GAAP measures are provided in the MD&A accompanying Barrick’s financial statements filed from time to time on SEDAR at www.sedar.com and on EDGAR at www.sec.gov.
Reconciliation of Net Earnings to Net Earnings per Share, Adjusted Net Earnings and Adjusted Net Earnings per Share
($ millions, except per share amounts in dollars) For the three months ended March 312018 2017
Net earnings attributable to equity holders of the Company $158 $679
Impairment charges related to intangibles, goodwill, property, plant and equipment, and investments1 2 (1,125)
Acquisition/disposition (gains)/losses2 (46) 3Foreign currency translation losses 15 3Significant tax adjustments3 46 (3)Other expense adjustments (6) 6Unrealized gains on non-hedge derivative instruments — 3Tax effect and non-controlling interest 1 596Adjusted net earnings $170 $162Net earnings per share4 0.14 0.58Adjusted net earnings per share4 0.15 0.14
1 Net impairment reversals for the three months ended March 31, 2017 primarily relate to impairment reversals at the Cerro Casale project upon reclassification of the project’s net assets as held-for-sale as at March 31, 2017.
2 Disposition gains for the three months ended March 31, 2018 primarily relate to the gain on the sale of a non-core royalty asset at Acacia.3 Significant tax adjustments for the three months ended March 31, 2018 primarily relate to a tax audit of Pueblo Viejo in the Dominican Republic.4 Calculated using weighted average number of shares outstanding under the basic method of earnings per share.
NOTE 2
“Free cash flow” is a non-GAAP financial performance measure which deducts capital expenditures from net cash provided by operating activities. Barrick believes this to be a useful indicator of our ability to operate without reliance on additional borrowing or usage of existing cash. Free cash flow is intended to provide additional information only and does not have any standardized meaning under IFRS and may not be comparable to similar measures of performance presented by other companies. Free cash flow should not be considered in isolation or as a substitute for measures of performance prepared in accordance with IFRS. Further details on these non-GAAP measures are provided in the MD&A accompanying Barrick’s financial statements filed from time to time on SEDAR at www.sedar.com and on EDGAR at www.sec.gov.
Reconciliation of Net Cash Provided by Operating Activities to Free Cash Flow
($ millions) For the three months ended March 312018 2017
Net cash provided by operating activities $507 $495Capital expenditures (326) (334)Free cash flow $181 $161
NOTE 3
“Cash costs” per ounce and “All-in sustaining costs” per ounce are non-GAAP financial performance measures. “Cash costs” per ounce starts with cost of sales applicable to gold production, but excludes the impact of depreciation, the non-controlling interest of cost of sales, and includes by-product credits. “All-in sustaining costs” per ounce begin with “Cash costs” per ounce and add further costs which reflect the additional costs of operating a mine, primarily sustaining capital expenditures, general & administrative costs, minesite exploration and evaluation costs, and reclamation cost accretion and amortization. Barrick believes that the use of “cash costs” per ounce and “all-in sustaining costs” per ounce will assist investors, analysts and other stakeholders in understanding the costs associated with producing gold, understanding the economics of gold mining, assessing our operating performance and also our ability to generate free cash flow from current operations and to generate free cash flow on an overall Company basis. “Cash costs” per ounce and “All-in sustaining costs” per ounce are intended to provide additional information only and do not have any standardized meaning under IFRS. Although a standardized definition of all-in sustaining costs was published in 2013 by the World Gold Council (a market development organization for the gold industry comprised of and funded by 25 gold mining companies from around the world, including Barrick), it is not a regulatory organization, and other companies may calculate this measure differently. These measures should not be considered in isolation or as a substitute for measures prepared in accordance with IFRS. Further details on these non-GAAP measures are provided in the MD&A accompanying Barrick’s financial statements filed from time to time on SEDAR at www.sedar.com and on EDGAR at www.sec.gov.
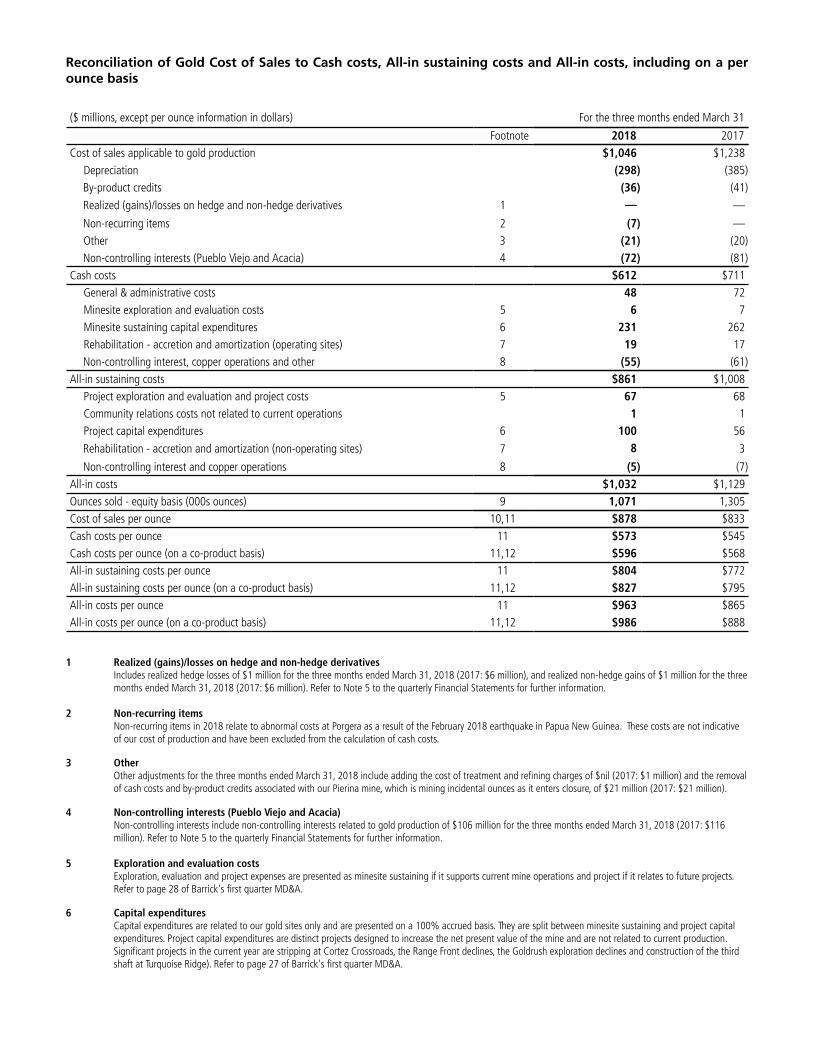
Reconciliation of Gold Cost of Sales to Cash costs, All-in sustaining costs and All-in costs, including on a per ounce basis
($ millions, except per ounce information in dollars) For the three months ended March 31
Footnote 2018 2017Cost of sales applicable to gold production $1,046 $1,238
Depreciation (298) (385)By-product credits (36) (41)
Realized (gains)/losses on hedge and non-hedge derivatives 1 — —
Non-recurring items 2 (7) — Other 3 (21) (20)Non-controlling interests (Pueblo Viejo and Acacia) 4 (72) (81)
Cash costs $612 $711 General & administrative costs 48 72 Minesite exploration and evaluation costs 5 6 7 Minesite sustaining capital expenditures 6 231 262 Rehabilitation - accretion and amortization (operating sites) 7 19 17Non-controlling interest, copper operations and other 8 (55) (61)
All-in sustaining costs $861 $1,008 Project exploration and evaluation and project costs 5 67 68 Community relations costs not related to current operations 1 1 Project capital expenditures 6 100 56
Rehabilitation - accretion and amortization (non-operating sites) 7 8 3
Non-controlling interest and copper operations 8 (5) (7)All-in costs $1,032 $1,129Ounces sold - equity basis (000s ounces) 9 1,071 1,305Cost of sales per ounce 10,11 $878 $833Cash costs per ounce 11 $573 $545Cash costs per ounce (on a co-product basis) 11,12 $596 $568All-in sustaining costs per ounce 11 $804 $772All-in sustaining costs per ounce (on a co-product basis) 11,12 $827 $795All-in costs per ounce 11 $963 $865All-in costs per ounce (on a co-product basis) 11,12 $986 $888
1 Realized (gains)/losses on hedge and non-hedge derivativesIncludes realized hedge losses of $1 million for the three months ended March 31, 2018 (2017: $6 million), and realized non-hedge gains of $1 million for the three months ended March 31, 2018 (2017: $6 million). Refer to Note 5 to the quarterly Financial Statements for further information.
2 Non-recurring itemsNon-recurring items in 2018 relate to abnormal costs at Porgera as a result of the February 2018 earthquake in Papua New Guinea. These costs are not indicative of our cost of production and have been excluded from the calculation of cash costs.
3 OtherOther adjustments for the three months ended March 31, 2018 include adding the cost of treatment and refining charges of $nil (2017: $1 million) and the removal of cash costs and by-product credits associated with our Pierina mine, which is mining incidental ounces as it enters closure, of $21 million (2017: $21 million).
4 Non-controlling interests (Pueblo Viejo and Acacia)Non-controlling interests include non-controlling interests related to gold production of $106 million for the three months ended March 31, 2018 (2017: $116 million). Refer to Note 5 to the quarterly Financial Statements for further information.
5 Exploration and evaluation costs Exploration, evaluation and project expenses are presented as minesite sustaining if it supports current mine operations and project if it relates to future projects. Refer to page 28 of Barrick's first quarter MD&A.
6 Capital expenditures Capital expenditures are related to our gold sites only and are presented on a 100% accrued basis. They are split between minesite sustaining and project capital expenditures. Project capital expenditures are distinct projects designed to increase the net present value of the mine and are not related to current production. Significant projects in the current year are stripping at Cortez Crossroads, the Range Front declines, the Goldrush exploration declines and construction of the third shaft at Turquoise Ridge). Refer to page 27 of Barrick's first quarter MD&A.
7 Rehabilitation—accretion and amortizationIncludes depreciation on the assets related to rehabilitation provisions of our gold operations and accretion on the rehabilitation provision of our gold operations, split between operating and non-operating sites.
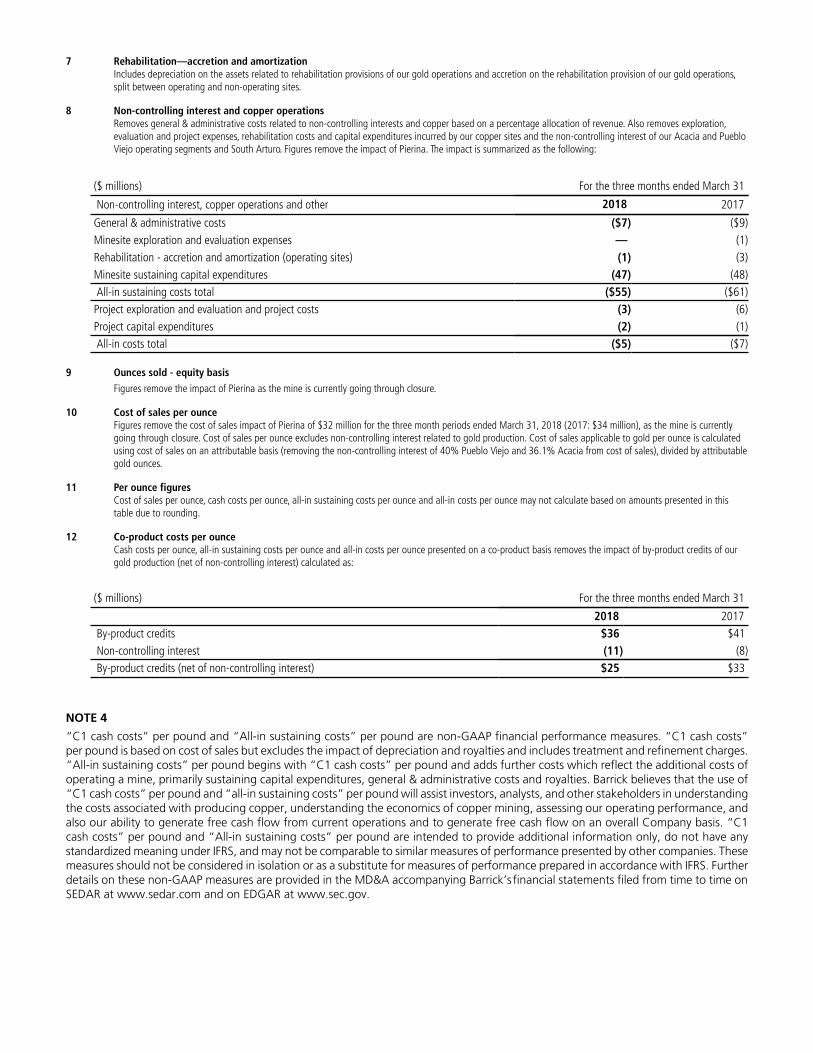
8 Non-controlling interest and copper operations Removes general & administrative costs related to non-controlling interests and copper based on a percentage allocation of revenue. Also removes exploration, evaluation and project expenses, rehabilitation costs and capital expenditures incurred by our copper sites and the non-controlling interest of our Acacia and Pueblo Viejo operating segments and South Arturo. Figures remove the impact of Pierina. The impact is summarized as the following:
($ millions) For the three months ended March 31
Non-controlling interest, copper operations and other 2018 2017
General & administrative costs ($7) ($9)Minesite exploration and evaluation expenses — (1)Rehabilitation - accretion and amortization (operating sites) (1) (3)Minesite sustaining capital expenditures (47) (48) All-in sustaining costs total ($55) ($61)Project exploration and evaluation and project costs (3) (6)Project capital expenditures (2) (1) All-in costs total ($5) ($7)
9 Ounces sold - equity basis
Figures remove the impact of Pierina as the mine is currently going through closure.
10 Cost of sales per ounceFigures remove the cost of sales impact of Pierina of $32 million for the three month periods ended March 31, 2018 (2017: $34 million), as the mine is currently going through closure. Cost of sales per ounce excludes non-controlling interest related to gold production. Cost of sales applicable to gold per ounce is calculated using cost of sales on an attributable basis (removing the non-controlling interest of 40% Pueblo Viejo and 36.1% Acacia from cost of sales), divided by attributable gold ounces.
11 Per ounce figures Cost of sales per ounce, cash costs per ounce, all-in sustaining costs per ounce and all-in costs per ounce may not calculate based on amounts presented in this table due to rounding.
12 Co-product costs per ounce Cash costs per ounce, all-in sustaining costs per ounce and all-in costs per ounce presented on a co-product basis removes the impact of by-product credits of our gold production (net of non-controlling interest) calculated as:
($ millions) For the three months ended March 31
2018 2017 By-product credits $36 $41 Non-controlling interest (11) (8) By-product credits (net of non-controlling interest) $25 $33
NOTE 4
“C1 cash costs” per pound and “All-in sustaining costs” per pound are non-GAAP financial performance measures. “C1 cash costs” per pound is based on cost of sales but excludes the impact of depreciation and royalties and includes treatment and refinement charges. “All-in sustaining costs” per pound begins with “C1 cash costs” per pound and adds further costs which reflect the additional costs of operating a mine, primarily sustaining capital expenditures, general & administrative costs and royalties. Barrick believes that the use of “C1 cash costs” per pound and “all-in sustaining costs” per pound will assist investors, analysts, and other stakeholders in understanding the costs associated with producing copper, understanding the economics of copper mining, assessing our operating performance, and also our ability to generate free cash flow from current operations and to generate free cash flow on an overall Company basis. “C1 cash costs” per pound and “All-in sustaining costs” per pound are intended to provide additional information only, do not have any standardized meaning under IFRS, and may not be comparable to similar measures of performance presented by other companies. These measures should not be considered in isolation or as a substitute for measures of performance prepared in accordance with IFRS. Further details on these non-GAAP measures are provided in the MD&A accompanying Barrick’s financial statements filed from time to time on SEDAR at www.sedar.com and on EDGAR at www.sec.gov.
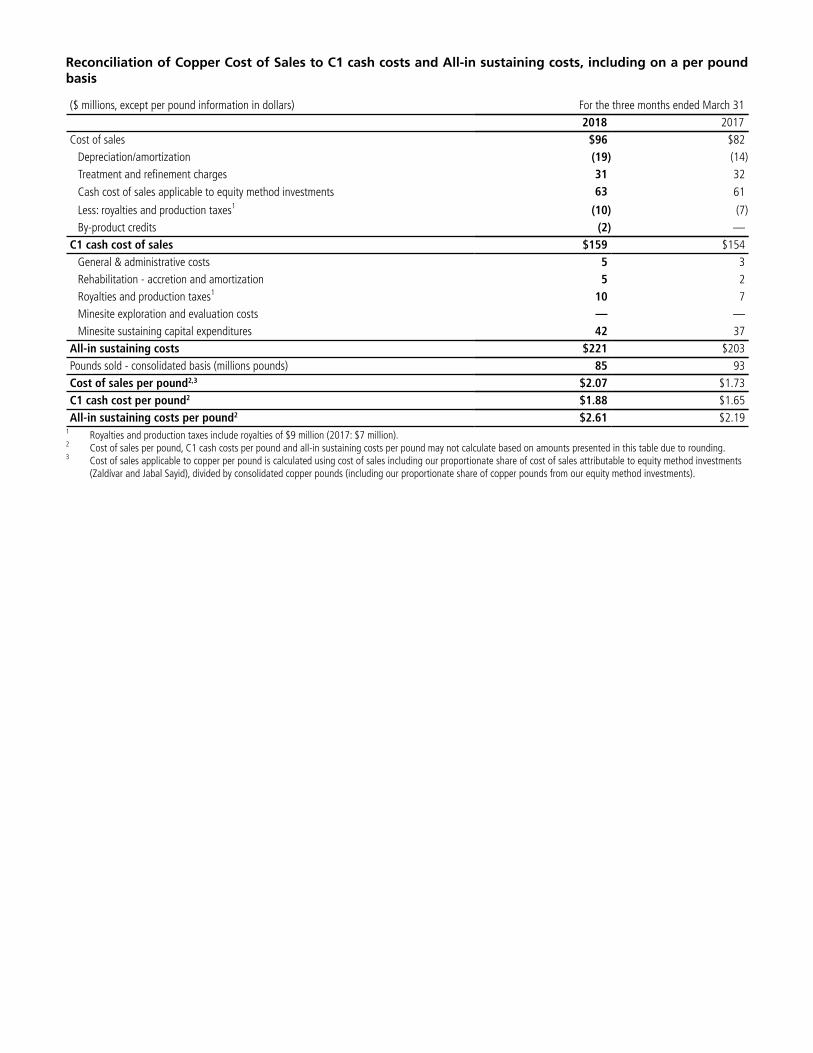
Reconciliation of Copper Cost of Sales to C1 cash costs and All-in sustaining costs, including on a per pound basis
($ millions, except per pound information in dollars) For the three months ended March 312018 2017
Cost of sales $96 $82Depreciation/amortization (19) (14)Treatment and refinement charges 31 32
Cash cost of sales applicable to equity method investments 63 61
Less: royalties and production taxes1 (10) (7)By-product credits (2) —
C1 cash cost of sales $159 $154General & administrative costs 5 3Rehabilitation - accretion and amortization 5 2Royalties and production taxes1 10 7Minesite exploration and evaluation costs — —Minesite sustaining capital expenditures 42 37
All-in sustaining costs $221 $203Pounds sold - consolidated basis (millions pounds) 85 93Cost of sales per pound2,3 $2.07 $1.73C1 cash cost per pound2 $1.88 $1.65All-in sustaining costs per pound2 $2.61 $2.19
1 Royalties and production taxes include royalties of $9 million (2017: $7 million).2 Cost of sales per pound, C1 cash costs per pound and all-in sustaining costs per pound may not calculate based on amounts presented in this table due to rounding.3 Cost of sales applicable to copper per pound is calculated using cost of sales including our proportionate share of cost of sales attributable to equity method investments
(Zaldívar and Jabal Sayid), divided by consolidated copper pounds (including our proportionate share of copper pounds from our equity method investments).