basf report 2017 - handelsblattircenter.handelsblatt.com/download/companies/basf/annual... ·...
TRANSCRIPT

BASF Report 2017Economic, environmental and social performance

ChemicalsThe Chemicals segment comprises our business with basic chemicals and intermediates. Its portfolio ranges from solvents and plasticizers to high-volume monomers and glues as well as raw materials for detergents, plas-tics, textile fibers, paints and coatings, crop protection and medicines. In addition to supplying customers in the chemical industry and numerous other sectors, we also ensure that other BASF segments are supplied with chemicals for producing downstream products.
Page 62
Key data Chemicals1 (million €)
2017 2016 Change in %
Sales 16,331 12,905 27
Thereof Petrochemicals 6,389 5,035 27
Monomers 6,963 5,189 34
Intermediates 2,979 2,681 11
EBITDA 5,374 3,114 73
Income from operations (EBIT) 4,208 1,953 115
EBIT before special items 4,233 2,032 108
Performance ProductsOur Performance Products lend stability, color and bet-ter application properties to many everyday products. Our product portfolio includes vitamins and other food additives in addition to ingredients for pharmaceuticals, personal care and cosmetics, as well as hygiene and household products. Other products from this segment improve processes in the paper industry, in oil, gas and ore extraction, and in water treatment. They furthermore enhance the efficiency of fuels and lubricants, the effec-tiveness of adhesives and coatings, and the stability of plastics.
Page 68
Key data Performance Products1 (million €)
2017 2016 Change in %
Sales 16,217 15,558 4
Thereof Dispersions & Pigments 5,398 5,086 6
Care Chemicals 5,079 4,735 7
Nutrition & Health 1,844 1,932 (5)
Performance Chemicals 3,896 3,805 2
EBITDA 2,427 2,577 (6)
Income from operations (EBIT) 1,510 1,678 (10)
EBIT before special items 1,416 1,777 (20)
Functional Materials & SolutionsIn the Functional Materials & Solutions segment, we bundle system solutions, services and innovative products for specific sectors and customers, especially the automotive, electrical, chemical and construction industries, as well as applications for household, sports and leisure. Our portfolio comprises catalysts, battery materials, engineering plastics, polyurethane systems, automotive coatings, surface treatment solutions and concrete admixtures as well as construction systems like tile adhesives and decorative paints.
Page 75
Key data Functional Materials & Solutions (million €)
2017 2016 Change in %
Sales 20,745 18,732 11
Thereof Catalysts 6,658 6,263 6
Construction Chemicals 2,412 2,332 3
Coatings 3,969 3,249 22
Performance Materials 7,706 6,888 12
EBITDA 2,251 2,906 (23)
Income from operations (EBIT) 1,545 2,199 (30)
EBIT before special items 1,617 1,946 (17)
Agricultural SolutionsThe Agricultural Solutions segment provides innovative solutions in the areas of chemical and biological crop protection, seed treatment and water management as well as for nutrient supply and plant stress.
Page 81
Key data Agricultural Solutions (million €)
2017 2016 Change in %
Sales 5,696 5,569 2
EBITDA 1,282 1,305 (2)
Income from operations (EBIT) 1,015 1,037 (2)
EBIT before special items 1,033 1,087 (5)
Oil & GasIn the Oil & Gas segment, we focus on exploration and production in oil and gas-rich regions in Europe, North Africa, Russia, South America and the Middle East. Together with our Russian partner Gazprom, we are also active in the transportation of natural gas in Europe.
Page 85
Key data Oil & Gas (million €)
2017 2016 Change in %
Sales 3,244 2,768 17
EBITDA 2,069 1,596 30
Income from operations (EBIT) 1,043 499 109
EBIT before special items 793 517 53
Net income 719 362 99
1 On January 1, 2017, the Monomers and Dispersions & Pigments divisions’ activities for the electronics industry were merged into the global Electronic Materials business unit and allocated to the Dispersions & Pigments division. For better comparability, the affected figures for 2016 have been adjusted accordingly.

Creation of value added (million €)
2017 2016
Business performance 67,176 59,852
1 Cost of raw materials and merchandise (29,224) (25,450)
2 Services purchased, energy costs and other expenses (14,520) (13,658)
3 Amortization and depreciation (4,202) (4,251)
4 Value added 19,230 16,493
Use of value added
2017 2016
4.1 Employees 55.2% 61.6%
4.2 Government 8.9% 8.6%
4.3 Creditors 2.9% 4.0%
4.4 Minority interests 1.4% 1.2%
4.5 Shareholders (dividend and retention) 31.6% 24.6%
3 Value added results from the company’s performance minus goods and services purchased, depreciation and amortization. Business performance includes sales revenues, other operating income, interest income and net income from shareholdings. Value added shows the BASF Group’s contribution to both private and public income as well as its distribution among all stakeholders.
BASF Group 2017 at a glance
Value added 20173
4
1
2
3
2016:
4.1
4.24.3
4.4
4.5
Businessperformance
€67,176 million
€59,852 million
Economic data
2017 2016 Change in %
Sales million € 64,475 57,550 12.0
Income from operations before depreciation and amortization (EBITDA) and special items million € 12,527 10,327 21.3
EBITDA million € 12,724 10,526 20.9
Amortization and depreciation1 million € 4,202 4,251 (1.2)
Income from operations (EBIT) million € 8,522 6,275 35.8
Special items million € 194 (34) .
EBIT before special items million € 8,328 6,309 32.0
Financial result million € (722) (880) 18.0
Income before taxes and minority interests million € 7,800 5,395 44.6
Net income million € 6,078 4,056 49.9
EBIT after cost of capital million € 2,727 1,136 140.1
Earnings per share € 6.62 4.42 49.8
Adjusted earnings per share € 6.44 4.83 33.3
Dividend per share € 3.10 3.00 3.3
Research and development expenses million € 1,888 1,863 1.3
Personnel expenses million € 10,610 10,165 4.4
Number of employees 115,490 113,830 1.5
Assets million € 78,768 76,496 3.0
Investments2 million € 4,364 7,258 (39.9)
Equity ratio % 44.1 42.6 –
Return on assets % 10.8 8.2 –
Return on equity after tax % 18.9 13.3 –
Net debt million € 11,485 14,401 (20.2)
Cash provided by operating activities million € 8,785 7,717 13.8
Free cash flow million € 4,789 3,572 34.1
1 Amortization of intangible assets, depreciation of property, plant and equipment, impairments and reversals of impairments 2 Additions to intangible assets and property, plant and equipment (including acquisitions)

Innovation
2017 2016 Change in %
Research and development expenses million € 1,888 1,863 1.3
Number of employees in research and development at year-end 10,110 9,966 1.4
Employees and society
2017 2016 Change in %
Employees
Employees at year-end 115,490 113,830 1.5
Apprentices at year-end 3,103 3,120 (0.5)
Personnel expenses million € 10,610 10,165 4.4
Society
Donations and sponsorship million € 56.0 47.0 19.1
Environment, health, safety and security
2017 2016 Change in %
Safety, security and health
Transportation incidents with significant impact on the environment 0 0 0
Process safety incidents per one million working hours 2.0 2.0 0
Lost-time injuries4 per one million working hours 1.4 1.5 (6.6)
Health Performance Index5 0.97 0.96 1.0
Environment
Primary energy use6 million MWh 57.3 57.4 (0.2)
Energy efficiency in production processes kilograms of sales product/MWh 625 617 1.3
Total water withdrawal million cubic meters 1,816 1,649 10.1
Withdrawal of drinking water million cubic meters 20.3 20.7 (1.9)
Emissions of organic substances to water7 thousand metric tons 14.1 15.9 (11.3)
Emissions of nitrogen to water7 thousand metric tons 2.8 2.9 (3.4)
Emissions of heavy metals to water7 metric tons 24.8 23.2 6.9
Emissions of greenhouse gases4 million metric tons of CO2 equivalents 22.6 22.0 2.7
Emissions to air (air pollutants)7 thousand metric tons 25.7 26.0 (1.2)
Waste million metric tons 2.12 2.10 1.0
Operating costs for environmental protection million € 1,024 1,011 1.3
Investments in environmental protection plants and facilities million € 234 206 3.6
4 The 2016 figure has been adjusted due to updated data.5 For more information, see page 1006 Primary energy used in BASF’s plants as well as in the plants of our energy suppliers to cover energy demand for production processes7 Excluding emissions from oil and gas production
Audits along the value chain
2017 2016 Change in %
Suppliers
Number of on-site sustainability audits of raw material suppliers 120 104 15.4
Responsible Care Management System
Number of environmental and safety audits 109 121 (9.9)
Number of short-notice audits 63 37 70.2
Number of occupational medicine and health protection audits and health performance control visits8 44 30 –
8 For more information, see page 97
BA
SF
Gro
up 2
017
at a
gla
nce

Contents
To Our Shareholders
Letter from the Chairman of the Board of Executive Directors 7The Board of Executive Directors of BASF SE 10BASF on the capital market 14
Management’s Report
Overview 19The BASF Group 20Our strategy 23Customers 34Innovation 35Investments, acquisitions and divestitures 40Working at BASF 42The BASF Group business year 48Responsibility along the value chain 93Forecast 111
Corporate Governance
Corporate governance report 127Compliance 135Management and Supervisory Boards 137Board of Executive Directors 137Supervisory Board 139Compensation report 140
Report of the Supervisory Board 152Declaration of Conformity pursuant to section 161 of the German Stock Corporation Act (AktG) 157Declaration of Corporate Governance 158
Consolidated Financial Statements
Statement by the Board of Executive Directors 161Independent Auditor’s Report 162Statement of income 168Statement of income and expense recognized in equity 169Balance sheet 170Statement of cash flows 171Statement of equity 172Notes 173
Supplementary Information on the Oil & Gas Segment
Supplementary information on the Oil & Gas segment 237
Overviews
Ten-year summary 247Trademarks 249Glossary 250
Detailed tables of contents can be found on each colored chapter divider

Table of Contents
Welcome to BASFOur integrated corporate report combines financial and sustainability reporting to inform shareholders, employees and the interested public about the 2017 business year.

Chemistry for a sustainable future Our innovations contribute to a sustainable future. We support the United Nations in the implementation of the U.N. Sustainable Development Goals (SDGs), which create the framework for sustainable business practices at the economic, social and environmental levels. In drafting these development goals, the United Nations worked together with nongovernmental organi za-tions, international trade associations, employee representatives, scientists, policymakers and industry. BASF was actively involved in the development of the SDGs as a member of working groups.
Cover photo and page 1: At the Application Technology Center in Heidelberg, Germany, BASF tests new powders, resins, filaments and granulates for 3D printing and develops solutions for industrial additive manufacturing. This makes it possible to create parts with new properties for our customers’ applications in industries such as automotive, aviation and aerospace or consumer goods. One example is this open printed functional model of a tool. The tool can be heated or cooled using the integrated tempering channels close to the surface conture.
For more information on 3D printing, see page 37

How we create value BASF–Bericht 2017
BASF’s success is supported by both financial and nonfinancial value drivers such as environmental, production-related, personnel and knowledge-based factors, along with aspects of society and partnerships. We want to understand the relationships between these and derive measures to increase the positive impact of our actions and further minimizing the negative effects. This intention forms the basis of our integrated reporting.
The following overview provides examples of how we create value for our company, the environment and society. It is modeled on the framework of the International Integrated Reporting Council (IIRC). Both financial and nonfinancial value drivers form the foundation of our actions. Our business model transforms these principles and actions into results.
How we create value

Our stakeholders include customers, employees, suppliers and shareholders, as
well as representatives from academia, industry, politics,
society and the media
115,490employees worldwide, of which
3,103apprentices
84.6% of our senior executives
have international experience
120raw material supplier
sites audited
>50external
compliance hotliness
€234 millioninvested in environmental
protection
Our foundation
€34.8 billionin equity
€1.9 billionspent on research and development
Over 70,000suppliers
€38 billionworth of raw materials,
goods and services purchased for own
production
30,000different raw materials
procured 5%of raw materials
purchased worldwide from renewable resources
around 90%of raw materials,
goods and services for own
production sourced locally
39.7million MWh
of steam demand
1,816 million m3
of water abstracted
15.1 million MWhof electricity
demand
€10.6 billionin personnel expenses
€4.4 billioninvested in property, plant and equipment and intangible assets (including acquisitions)
Employees and contractors worldwide participated in the
global safety initiative with
over 930 activities at around
360 sites
Training:
>72,000enrollments in
information protection courses
44 occupational medicine and
health protection audits and health
performance control visits
109environmental, safety and security audits performed at
83 sites
Numerous offerings for balancing personal and
professional life worldwide Around 10,000 employees in research and
development
How we create value BASF Report 2017

Values guide our conduct and actions
▪ Creative
▪ Open
▪ Responsible
▪ Entrepreneurial
▪ Chemicals
▪ Performance Products
▪ Functional Materials & Solutions
▪ Agricultural Solutions
▪ Oil & Gas
Market success based on strategic principles
▪ We add value as one company
▪ We innovate to make our customers more successful
▪ We drive sustainable solutions
▪ We form the best team
Around 130,000 customers With our broad portfolio, we serve customers
from many different sectors – from major global customers, small and medium-sized enterprises
to end consumers.
Our business model1
1,766 million m3of water discharged
BASF Group companies
in more than
80countries
5segments
13operating divisions
86strategic business units
Intelligent Verbund system2
6 Verbund sites and
347 additional production sites worldwide
Our corporate purpose:
We create chemistryfor a sustainable future
Corporate Governance
1 For more information on our business model, see page 20 onward2 For more information on the Verbund system, see page 21

Greenhouse gas emissions:
22.6 million metric tonsCO2 equivalents
0transportation incidents
with significant impact on the environment
Process safety incidents:
2.0per one million working
hours
Net income of
€6.1 billion
Number of lost-time injuries per one million working
hours:
1.4
In 1 case we terminated
our collaboration with suppliers as
a result of unsatisfactory sustainability performance
Our results
Around
800patents filed worldwide
Around
600 universities, research
institutions and companies within our global network
Around
3,000projects in the
research pipeline
Over
60,000product applications assessed and rated for aspects of sustainability
1,766 million m3of water discharged
19.2 million MWhfuel saved through Verbund system
Customers’ use of BASF’s climate protection products avoids
570 million metric tons of CO2 equivalents
20.5% 38.9%
Proportion of non-German senior executives
Proportion of women in executive positions
€1.4 billion in income taxes
€3.10dividend per share
€64.5 billionin sales, of which
over €9 billionfrom innovations that we have launched in the past five years
290phone calls and emails
received by external compliance hotlines
€8.5 billionin EBIT
€56.0 millionspent on donations
and sponsorship
Involved inU.N. Global Compact
since 2000
€8.3 billionin EBIT before special items

2 About This Report BASF Report 2017
Integrated reporting
This integrated report documents BASF’s economic, environmental and social performance in 2017. We use examples to illustrate how sustainability contributes to BASF’s long-term success and how we as a company create value for our customers, employees, shareholders, business partners, neighbors and the public.
Further information
The following symbols indicate important information for the reader:
You can find more information in this report.
You can find more information on our website.
The content of this paragraph (symbol at the end of the paragraph) or section (symbol below the section) is not part of the statutory audit of the annual financial statements but has undergone a separate audit with limited assurance by our auditor.
If the symbol is underlined, it is relevant to the entire chapter.
This paragraph (symbol at the end of the paragraph) or section (symbol below the section) shows how the 10 principles of the U.N. Global Compact are implemented in line with the Blueprint for Corporate Sustainability Leadership.
If the symbol is underlined, it is relevant to the entire chapter.
The BASF Report online
HTML version with additional features: basf.com/report
PDF version available for download: basf.com/basf_report_2017.pdf
About This Report
Über diesen Bericht

3BASF Report 2017 About This Report
Content and structure
▪ As an integrated report, the BASF Report also serves as a U.N. Global Compact progress report
▪ Sustainability reporting is based on the international standards issued by the Global Reporting Initiative (GRI)
The BASF Report combines the major financial and non financial information necessary to thoroughly evaluate our performance. We select the report’s topics based on the following reporting principles: materiality, sustainability context, completeness, balance, and stakeholder inclusion. In addition to our integrated report, we publish further information online. Links to this sup-plementary information are provided in each section. Our sustainability reporting has been based on Global Reporting Initiative (GRI) standards since 2003. The BASF Report 2017 was prepared in accordance with the “Comprehensive” application option of the new Global Reporting Initiative Standards. We have been active in the International Integrated Reporting Council (IIRC) since 2014 in order to discuss our experiences of integrated reporting with other stakeholders and at the same time, receive inspiration for enhancing our reporting. This report addresses elements of the IIRC frame-work by, for example, providing an illustrative overview of how we create value or demonstrating the relationships between financial and nonfinancial performance in the sec-tions on the segments. The information in the BASF Report 2017 also serves as a progress report on BASF’s implementa-tion of the 10 principles of the United Nations Global Compact and takes into consideration the Blueprint for Corporate Sus-tainability Leadership of the Global Compact LEAD platform. The GRI and Global Compact Index can be found in the online report and provides information on GRI indicators, topics relevant to the U.N. Global Compact principles and the results of the audit of this information in the form of an assurance report by KPMG AG Wirtschaftsprüfungsgesellschaft.
The 2017 Online Report can be found at basf.com/report
For more information on sustainability, see basf.com/sustainability
For more information on the Global Compact, the implementation of the Global Compact principles, Global Compact LEAD and Blueprint for Corporate Sustainability Leadership, see globalcompact.org and basf.com/en/global-compact
The GRI and Global Compact Index can be found at basf.com/en/gri-gc
For a visualization of BASF’s business model based on the IIRC framework, see “How we create value” in the introduction
Requirements and topics
▪ Financial reporting according to International Financial Reporting Standards (IFRS), the German Commercial Code and German Accounting Standards (GAS)
▪ Sustainability reporting focused on material topics
The information on the financial position and performance of the BASF Group comply with the requirements of International Financial Reporting Standards (IFRS), and, where applicable, the German Commercial Code, German Accounting Stan-dards (GAS) and the guidelines on alternative performance measures from the European Securities and Markets Authority (ESMA). Internal control mechanisms ensure the reliability of the information presented in this report. BASF’s management confirmed the effectiveness of the internal control measures and compliance with the regulations for financial reporting. The focus of sustainability reporting and the limits of this report are based on our materiality analysis together with a strategic internal evaluation defining focus areas along the val-ue chain.
For more information on the Global Reporting Initiative, see globalreporting.org
For more information on our selection of sustainability topics, see page 29 onward and basf.com/materiality
For more information on our control and risk management system, see page 111 onward

4 About This Report BASF Report 2017
Data
▪ Relevant information included up to the editorial deadline of February 21, 2018
▪ The report is published each year in English and German
All information and bases for calculation in this report are founded on national and international standards for financial and sustainability reporting. The data and information for the reporting period were sourced from the expert units responsible using representative methods. The reporting period was the 2017 business year. Relevant information is included up to the editorial deadline of February 21, 2018. The report is published each year in English and German. BASF Group’s scope of consolidation for its financial reporting comprises BASF SE, with its headquarters in Ludwigs hafen, Germany, and all of its fully consolidated material subsidiaries and proportionally included joint opera-tions. Shares in joint ventures and associated companies are accounted for, if material, using the equity method in the BASF Group Consolidated Financial Statements and are thus not included in the scope of consolidation. The section “Working at BASF” refers to employees active in a company within the BASF Group scope of consolidation as of December 31, 2017. Our data collection methods for environmental protection and occupational safety are based on the recommendations of the European Chemical Industry Council (CEFIC). In the section “Environment, Health, Safety and Security,” we report all data on the emissions and waste of the world-wide production sites of BASF SE, its subsidiaries, and joint operations based on our interest. Work-related accidents at all sites of BASF SE and its subsidiaries as well as joint operations and joint ventures in which we have sufficient authority in terms of safety management, are compiled worldwide regardless of our interest and reported in full. Unless otherwise indicated, further data on social responsibility and transportation safety refers to BASF SE and its consolidated subsidiaries.
For more information on companies accounted for in the Consolidated Financial Statements, see the Notes from page 173 onward
For more information on emissions, see page 104 onward
The Consolidated Financial Statements begin on page 159
The list of shares held can be found at basf.com/en/governance
External audit and evaluation
Our reporting is audited by a third party. KPMG AG Wirtschafts-prüfungsgesellschaft has audited the BASF Group Consolidated Financial Statements and the Management’s Report and has approved them free of qualification. The audit of the Consolidated Financial Statements including the Notes is based on the likewise audited financial statements of the BASF Group companies. Statements and figures pertaining to sustainability in the Management’s Report and Consolidated Financial Statements are also audited. The audit with limited assurance was conducted in accordance with ISAE 3000 (Assurance Engagements other than Audits or Reviews of Historical Financial Information) and ISAE 3410 (Assurance Engagements on Greenhouse Gas Statements), the relevant international auditing standards for sustainability reporting. The additional content provided on the BASF internet sites indicated in this report is not part of the information audited by KPMG. The Supervisory Board also engaged KPMG with a substantive audit with limited assurance of the nonfinancial statement (NFS).
The Independent Auditor’s Report can be found on page 162
An assurance report on the sustainability information in the BASF Report 2017 can be found at basf.com/sustainability_information
An assurance report on the substantive audit of the NFS can be found at basf.com/nfs-audit
Forward-looking statements and forecasts
This report contains forward-looking statements. These state-ments are based on current estimates and projections of BASF management and currently available information. Future statements are not guarantees of the future developments and results outlined therein. These are dependent on a number of factors; they involve various risks and uncertainties; and they are based on assumptions that may not prove to be accurate. Such factors include those discussed in the Opportunities and Risks Report from pages 111 to 118. We do not assume any obligation to update the forward-looking statements contained in this report above and beyond the legal requirements.

1To Our Shareholders Management’s Report 17
Corporate Governance 125
Consolidated Financial Statements 159
Supplementary Information on the Oil & Gas Segment 235
Overviews 245
To O
ur S
hare
hold
ers
Letter from the Chairman of the Board of Executive Directors 7
The Board of Executive Directors of BASF SE 10
BASF on the capital market 14


BASF Report 2017 To Our Shareholders
Letter from the Chairman of the Board of Executive Directors 7
Letter from the Chairman of the Board of Executive Directors
Dear Shareholder,
Looking back, 2017 was a successful business year in which BASF significantly exceeded its earnings targets. We achieved strong growth and were able to further increase our profitability. Moreover, we laid important groundwork for BASF’s future development – in terms of both people and strategy. With the acquisitions announced for 2018 we want to further strengthen our company. We are ensuring our future competitiveness.
The positive development of our business is driven by the performance of our skilled and dedicated team at BASF. On behalf of the Board of Executive Directors, I sincerely thank all employees worldwide for their contribution to BASF’s success.
Economic activity picked up in many countries in 2017. We took advantage of this upturn and markedly increased our sales and earnings compared with the previous year. We sold higher volumes in all segments and divisions. For basic chemicals in particular, we also increased our prices significantly. Overall, our sales grew by 12%. One contributing factor was the Chemetall business acquired in December 2016, which comprises tailor-made solutions for metals surface treatment.
Our earnings rose even more sharply, by around one-third. Our EBIT before special items came in at €8.3 billion, with a significant contribution coming from the Chemicals segment. Higher margins and volumes in the basic chemicals and intermediates businesses more than offset the lower margins in our businesses that are closer to customers. Overall, our earnings in the chemicals business were significantly higher than in the previous year.
In an ongoing difficult market environment, our Agricultural Solutions segment was nearly able to match the 2016 results thanks to a strong fourth quarter. In light of our promising research pipeline, we take an optimistic view of the future.
We significantly improved our earnings in the Oil & Gas segment, where we also benefited from the recovery in the oil price. It climbed to an average of $54 per barrel for Brent crude in 2017 versus an average price of $44 in the previous year.

8 To Our Shareholders BASF Report 2017
Letter from the Chairman of the Board of Executive Directors
BASF achieved strong growth in all regions. We were particularly pleased with our strong growth in Asia. Our investments there in recent years are paying off. Our earnings in Asia doubled, making it the most profitable region for BASF.
The key indicator of the value we produce for you, our shareholders, is EBIT after cost of capital. This increased once again in 2017 and more than doubled to €2.7 billion.
At the end of 2017, our shares were trading for €91.74. This represents a 3.9% increase over the closing price in 2016, which was also the high for that year. We propose to you that the dividend be increased by €0.10 to €3.10 per share. The BASF share would thus once more offer an attractive dividend yield of around 3.4% based on the 2017 year-end share price. In total, we plan to pay out €2.8 billion to our shareholders.
Our strategy provides direction for how we further develop BASF. At the core is our corporate purpose: “We create chemistry for a sustainable future.” We are well aware of the needs of the fast-growing global population. More and more people need access to food and water, energy, raw materials, housing and healthcare. At the same time, the Earth’s resources are limited. Our products and services contribute to reconciling the needs with the limitations.
In doing so, we rely on research and development, organic growth through investments in plants, and the continuous refinement of our portfolio. Operational excellence and cost discipline along our value chains also continue to be essential for our sustainable success.
Around 10,000 dedicated employees worldwide work in research at BASF to develop new products for a sustainable future. We often collaborate with customers and academic partners as well as startups. We believe that innovation and sustainability are inextricably linked.
For nearly two decades, we have been involved in the U.N. Global Compact network and we actively support the U.N. Sustainable Development Goals. Mobility, for example, is an established part of our lives. But we also have a responsibility to design it in a sustainable way. BASF contributes to this with our lightweight plastics, high-performance catalysts and new battery materials.
In order to strengthen our capacity for innovation, we also utilize the opportunities offered by digitalization. We are increasingly using digital technologies throughout our value chains. This helps us to design our processes more effectively and efficiently. At our sites around the globe, we combine data with modern analytics. At our Verbund site Ludwigshafen, for example, we use predictive maintenance techniques at our steam cracker, the heart of our production. Several thousand sensors record process data, such as temperature and pressure, around the clock. This makes it easier for us to optimally operate and monitor the plants.
Another example is our digital business models – such as services, platform solutions and licenses that customers obtain from us and use – which create additional value for our customers and for BASF.
“BASF achieved strong growth in all regions. We were particularly pleased with our strong growth in Asia.”
“For nearly two decades, we have been involved in the U.N. Global Compact network.”

BASF Report 2017 To Our Shareholders
Letter from the Chairman of the Board of Executive Directors 9
In the past year we made important decisions for the development of our portfolio. We plan to acquire Solvay’s global polyamide business. This will expand our range of engineering plastics for the transportation, construction and consumer goods industries and will strengthen our access to raw materials. Furthermore, we also expect to improve our access to key growth markets in Asia and South America.
We want to bolster our Agricultural Solutions segment with the acquisition of significant parts of Bayer’s seed and herbicide businesses. These will be an excellent complement to our well-established and successful crop protection business and our biotechnology activities. With this acquisition we aim to expand our offerings for farmers. We want to enter into the seed business with proprietary assets in key agricultural markets, which will also allow us to more quickly implement the results of our seed research.
These two transactions exemplify our strategy of broadening BASF’s portfolio by adding fast-growing, cyclically resilient businesses. Innovations play a major role in this, as they enable us to offer our customers specific and sustainable solutions for their particular applications.
However, we also divest businesses when we believe they could be more successful in a different constellation. At the end of September 2017, we transferred our business with leather chemicals to the Stahl Group, a leading producer of process chemicals for leather products. In return, we now hold a 16% share in the Stahl Group.
In December 2017, we announced fundamental changes for our oil and gas activities. BASF and the LetterOne group plan to merge their respective oil and gas businesses in a joint venture. The new company, Wintershall DEA, should be one of the largest independent exploration and production companies in Europe, with excellent growth prospects. We plan to list the company on the stock exchange in the medium term.
Despite a number of political risks, we expect economic conditions to be solid in 2018. We anticipate that the global economy and chemical production will grow at the same pace as in 2017. We assume an average oil price of $65 per barrel for Brent crude and an average annual exchange rate of $1.20 per euro for 2018.
I am also very optimistic about the future development of our company, which the BASF team will shape with great élan. Everyone contributes his or her own experiences, perspectives, ideas and skills at work each day. My successor, Martin Brudermüller, has what it takes to maintain our successful track record and advance the company. I am convinced that BASF will continue to seize opportunities in the future.
Yours,
Kurt Bock
“In the past year we made important decisions for the development of our portfolio.”
“I am very optimistic about the future development of our company, which the BASF team will shape with great élan.”

10 To Our Shareholders BASF Report 2017
The Board of Executive Directors of BASF SE
The Board of Executive Directors of BASF SE
Dr. Kurt BockChairman of the Board of Executive Directors
Dr. Kurt Bock discussing business in South America, the opportunities of digitalization and future prospects with young leaders in Brazil.
Saori Dubourg
Saori Dubourg testing Maglis®
Agronomic Advice in a rapeseed oil field with a BASF employee. This
digital application helps farmers to make more informed decisions
during the growing season.

BASF Report 2017 To Our Shareholders
The Board of Executive Directors of BASF SE 11
Dr. Hans-Ulrich EngelChief Financial Officer
Dr. Hans-Ulrich Engel at Supply Chain Operations and Information Services in Ludwigshafen, Germany. A new web-based tracking system increases supply chain transparency and enables customers to track their deliveries in real time.
Dr. Martin BrudermüllerVice Chairman of the Board of Executive Directors
Dr. Martin Brudermüller at the supercomputer at the Ludwigshafen site in Germany. BASF researchers can perform complex simulations and modeling operations in no time thanks to the new supercomputer’s 1.75 petaflops of computing power.
12 To Our Shareholders BASF Report 2017
The Board of Executive Directors of BASF SE
The Board of Executive Directors of BASF SE
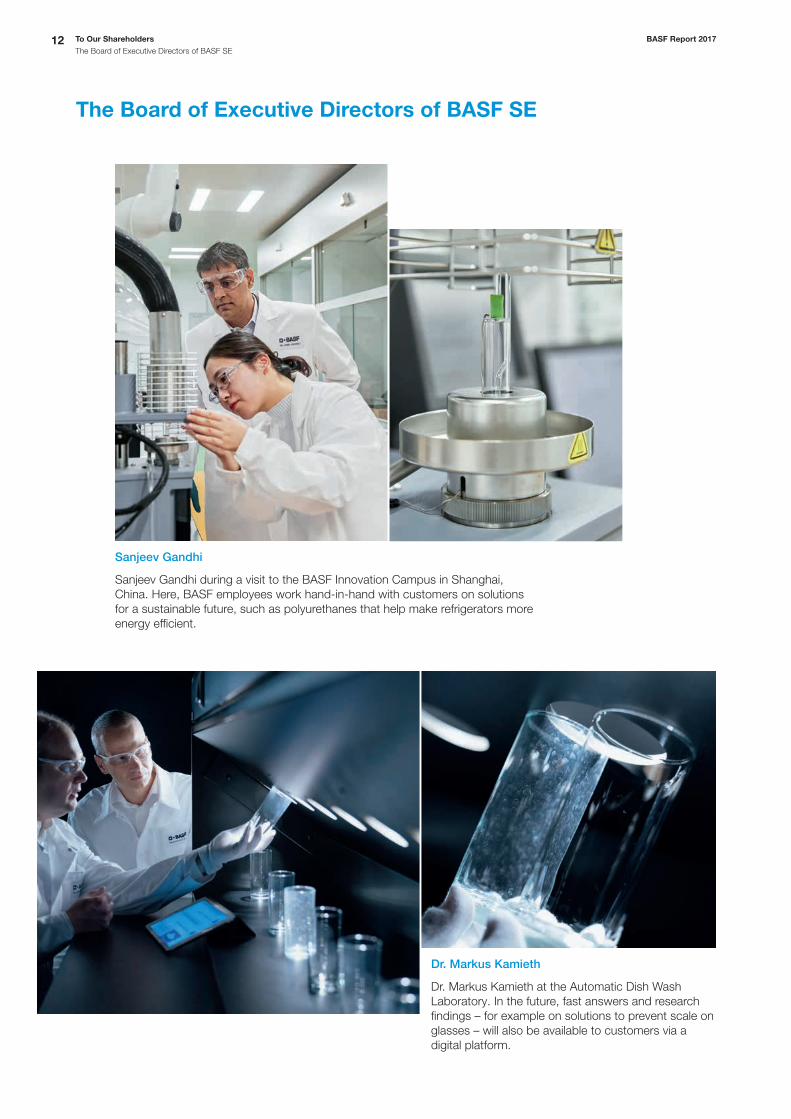
Dr. Markus Kamieth
Dr. Markus Kamieth at the Automatic Dish Wash Laboratory. In the future, fast answers and research findings – for example on solutions to prevent scale on glasses – will also be available to customers via a digital platform.
Sanjeev Gandhi
Sanjeev Gandhi during a visit to the BASF Innovation Campus in Shanghai, China. Here, BASF employees work hand-in-hand with customers on solutions for a sustainable future, such as polyurethanes that help make refrigerators more energy efficient.

BASF Report 2017 To Our Shareholders
The Board of Executive Directors of BASF SE 13
Michael Heinz
Michael Heinz in the control center for automated guided vehicles (AGV) in Ludwigshafen, Germany, where the AGVs that transport tank containers at the site are monitored.
Wayne T. Smith
Wayne T. Smith at the Battery Materials Pilot Plant in Beachwood, Ohio. Here, BASF scientists develop innovative cathode materials for lithium-ion batteries, which are used in electromobility applications.

14 To Our Shareholders BASF Report 2017
BASF on the capital market
The BASF share price rose by 3.9% in 2017, trading at €91.74 at the year-end. We stand by our ambitious dividend policy and will propose a dividend of €3.10 per share at the Annual Shareholders’ Meeting – an increase of 3.3% compared with the previous year. BASF enjoys solid financing and good credit ratings.
BASF share performance
▪ BASF share gains 3.9% in 2017 ▪ Long-term performance continues to clearly exceed
benchmark indexes
The BASF share closed the 2017 stock market year with a closing price of €91.74. This equates to a 3.9% rise in the value of BASF shares compared with the previous year’s closing price, which also marked the high for 2016. Assuming that dividends were reinvested, BASF shares gained 7.4% in value in 2017. The benchmark indexes of the German and European stock markets – the DAX 30 and the EURO STOXX 50 – rose by 12.5% and 9.2% over the same period, respec-tively. The global industry index MSCI World Chemicals gained 23.6%. The BASF share reached a new high of €97.46 over the course of 2017. Viewed over a 10-year period, the long-term performance of BASF shares still clearly surpasses the German, European and global benchmark indexes. The assets of an investor who invested €1,000 in BASF shares at
the end of 2007 and reinvested the dividends in additional BASF shares would have increased to €2,676 by the end of 2017. This represents an annual yield of 10.3%, placing BASF shares above the returns for the DAX 30 (4.8%), EURO STOXX 50 (0.8%) and MSCI World Chemicals (6.8%) indexes.
Long-term performance of BASF shares compared with indexes(Average annual increase with dividends reinvested)
2012 – 2017 8.9%
11.1%
8.8%
12.2%
2007 – 2017 10.3%
4.8%
0.8%
6.8%
BASF share EURO STOXX 50 MSCI World ChemicalsDAX 30
Weighting of BASF shares in important indexes as of December 31, 2017
DAX 30 8.1%
EURO STOXX 50 3.5%
MSCI World Chemicals 8.6%
BASF on the capital market
€91.74BASF share closing price up by 3.9% year-on-year
€3.10Proposed dividend
per share
CDP, MSCI ESG BASF once again recognized
in sustainability indexes
Change in value of an investment in BASF shares in 2017 (With dividends reinvested; indexed)
BASF share 7.4% DAX 30 12.5 % EURO STOXX 50 9.2 % MSCI World Chemicals 23.6 %
DecNovOctSepAugJulJunMayAprMarFebJan90
100
120
130
110
90
100
120
130
110

BASF Report 2017 To Our Shareholders
BASF on the capital market 15
Proposed dividend of €3.10 per share
At the Annual Shareholders’ Meeting, the Board of Executive Directors and the Supervisory Board will propose a dividend payment of €3.10 per share. We stand by our ambitious dividend policy and plan to pay out €2.8 billion to our share-holders. Based on the year-end share price for 2017, BASF shares offer a high dividend yield of around 3.4%. BASF is part of the DivDAX share index, which contains the 15 companies with the highest dividend yield in the DAX 30. We aim to increase our dividend each year, or at least maintain it at the previous year’s level.
Dividend per share (€ per share)
20172014 2015 20162012 20132011201020092008
1.951.70
2.20
2.60 2.70 2.802.50
2.90 3.00 3.10
Broad base of international shareholders
With over 500,000 shareholders, BASF is one of the largest publicly owned companies with a high free float. An analysis of the shareholder structure carried out at the end of 2017 showed that, at around 20% of share capital, the United States and Canada made up the largest regional group of institutional investors. Institutional investors from Germany accounted for around 11%. Shareholders from the United Kingdom and Ireland hold 12% of BASF shares, while investors from the rest of Europe hold a further 17% of capital. Approximately 29% of the company’s share capital is held by private investors, nearly all of whom reside in Germany. BASF is therefore one of the DAX 30 companies with the largest percentage of private shareholders.
Shareholder structure (by region, rounded)
1 Germany 40%
2 United States and Canada 20%
3 United Kingdom and Ireland 12%
4 Rest of Europe 17%
5 Rest of world 5%
6 Not identified 6%
Employees becoming shareholders
In many countries, we offer share purchase programs that turn our employees into BASF shareholders. In 2017, for example, 23,700 employees (2016: approximately 24,000) purchased employee shares worth €63 million (2016: €59 million).
For more information on employee share purchase programs, see page 46
BASF a sustainable investment
▪ CDP again awards BASF leadership status and honors company’s sustainable water management
▪ BASF continues to be included in MSCI ESG Ratings with score of AA
Since 2004, BASF has participated in the CDP’s program for reporting on data relevant to climate protection. The interna-tional organization CDP represents more than 800 institutional investors who manage over $100 trillion in assets. BASF again achieved a score of A- in 2017, awarding it “Leadership” status. Companies on this level are distinguished by factors such as the completeness and transparency of their reporting. They also have approaches in place for managing the oppor-tunities and risks associated with climate change as well as corporate strategies to reduce emissions. BASF has also reported on water management to CDP since 2010 and was again included in the CDP Water A List in 2017. This assess-ment includes how transparently companies report on water management activities, the degree to which risks are reduced and the extent to which product developments contribute to sustainable water management at customers. Efficient water use and the development of sustainable local solutions are important elements of BASF’s water stewardship strategy. BASF continued to be included in the MSCI ESG Ratings in 2017 with a score of AA. MSCI made special mention of BASF’s leading environmental protection programs. The analysts recognized that BASF has made further progress in reducing greenhouse gas emissions and has one of the lowest emissions intensities in the chemical industry.
For more information on the key sustainability indexes, see basf.com/sustainabilityindexes
For more information on energy and climate protection, see page 104 onward
For more information on water, see page 108 onward
Analysts’ recommendations
Around 30 financial analysts regularly publish studies on BASF. The latest analyst recommendations for our shares as well as the average target share price ascribed to BASF by analysts can be found online at basf.com/analystestimates.
1
2
3
4
56

16 To Our Shareholders BASF Report 2017
BASF on the capital market
Close dialog with the capital market
▪ Roadshows for institutional investors and talks with rating agencies
▪ BASF R&D Roundtable ▪ Informational events for private investors
Our corporate strategy aims to create long-term value. We support this strategy through regular and open communica-tion with all capital market participants. We engage with insti-tutional investors and rating agencies in numerous one-on-one meetings, as well as at roadshows and conferences world-wide, and give private investors an insight into BASF at infor-mational events. In 2017, around 2,000 private investors took the opportunity to attend such events. At the end of June 2017, we discussed the opportunities and potential of digitalization along our value chains with analysts and investors at an R&D Roundtable held in Ludwigs-hafen, Germany. We presented digital methods, various tools and the wide range of applications in research at BASF. The growing use of digital technologies secures our leading position in chemistry-based innovations. In 2017, we once again held special events aimed toward investors who base their investment decisions on sustainability criteria. There, we outlined in particular our measures for climate protection, energy efficiency, health and safety. In addition, we offered several creditor relations roadshows, where credit analysts and creditors could learn more about our business and financing strategy.
For more information on our credit ratings, see the Financial Position on page 58
Analysts and investors have confirmed the quality of our financial market communications: We took first place in the “Best IR” category of the Materials sector in the annual survey conducted by Britain’s IR Magazine. In addition, Institutional Investor Magazine recognized BASF for the best investor relations program in the Chemicals market segment. The IR Society awarded BASF first place in the “Best use of digital communications – international” category of the Best Practice Awards 2017.
For more information about BASF stock, see basf.com/share
Register for the newsletter with current topics and dates at basf.com/share/newsletter
Contact the Investor Relations team by phone at +49 621 60-48230 or email [email protected]
Further information on BASF share
Securities code numbers
Germany BASF11
United Kingdom 0083142
Switzerland 11450563
United States (CUSIP number) 055262505
ISIN International Securities Identification Number DE000BASF111
International ticker symbols
Deutsche Börse BAS
London Stock Exchange BFA
Swiss Exchange BAS
Key BASF share data
2013 2014 2015 2016 2017
Year-end price € 77.49 69.88 70.72 88.31 91.74
Year high € 78.97 87.36 96.72 88.31 97.46
Year low € 64.79 65.61 65.74 56.70 79.64
Year average € 71.96 77.93 79.28 70.96 88.16
Daily trade in shares1
million € 200.8 224.5 264.5 201.9 185.7
million shares 2.8 2.9 3.3 2.9 2.1
Number of shares December 31 million shares 918.5 918.5 918.5 918.5 918.5
Market capitalization December 31 billion € 71.2 64.2 65.0 81.1 84.3
Earnings per share € 5.22 5.61 4.34 4.42 6.62
Adjusted earnings per share € 5.31 5.44 5.00 4.83 6.44
Dividend per share € 2.70 2.80 2.90 3.00 3.10
Dividend yield2 % 3.48 4.01 4.10 3.40 3.38
Payout ratio % 52 50 67 68 47
Price-earnings ratio (P/E ratio)2 14.8 12.5 16.3 20.0 13.9
1 Average, Xetra trading 2 Based on year-end share price

2
Man
agem
ent’s
Rep
ort
Overview 19
The BASF Group 20
Our strategy 23Corporate strategy 23Goals 26Value-based management 28Integration of sustainability 29
Customers 34
Innovation 35
Investments, acquisitions and divestitures 40
Working at BASF 42
The BASF Group business year 48Economic environment 48Results of operations 51Net assets 56Financial position 57Business review by segment 60
Chemicals 62Performance Products 68Functional Materials & Solutions 75Agricultural Solutions 81Oil & Gas 85
Other 90Regional results 91
Responsibility along the value chain 93Suppliers 93Raw materials 95Environment, health, safety and security 97
Responsible Care Management System 97Production 98Product stewardship 101Transportation and storage 103Energy and climate protection 104Water 108Air and soil 110
Forecast 111Opportunities and risks report 111
Economic environment in 2018 119Outlook 2018 122
To Our Shareholders 5
Management’s Report Corporate Governance 125
Consolidated Financial Statements 159
Supplementary Information on the Oil & Gas Segment 235
Overviews 245


BASF Report 2017 Management’s Report
Overview 19
The Management’s Report comprises the chapter of the same name on pages 17 to 124, as well as the disclo- sures required by takeover law, the Compensation Report and the Declaration of Corporate Governance, which are presented in the Corporate Governance chapter. The nonfinancial statement (NFS) is integrated into the Management’s Report.
Nonfinancial statement (NFS) in accordance with sections 315b and 315c of the German Commercial Code (HGB)
The NFS disclosures can be found in the relevant sections of the Management’s Report. A table in the section “Integration of sustainability” on page 33 indicates where the individual disclosures can be found. In addition to a description of the business model, the NFS includes disclosures on the following matters, to the extent that they are required to understand the development and performance of the business, the Group’s position and the impact of business development on the following matters: – Environmental matters – Employee-related matters – Social matters – Respect for human rights – Anti-corruption and bribery matters
Within the scope of the audit of the annual financial state-ments, the external auditor KPMG checked pursuant to sec-tion 317(2) sentence 4 HGB that the NFS was presented in accor dance with the statutory requirements. The Supervisory Board also engaged KPMG with a substantive audit with limited assurance of the NFS. An assurance report on this substantive audit can be found online at basf.com/nfs-audit and is part of the BASF Report 2017. The audit was conducted in accor-dance with ISAE 3000 (Assurance Engagements other than Audits or Reviews of Historical Financial Information) and ISAE 3410 (Assurance Engagements on Greenhouse Gas Statements), the relevant international auditing standards for sustainability reporting.
Compensation Report and disclosures in accordance with section 315a HGB
The Compensation Report can be found in the Corporate Governance chapter from page 140 onward, and the disclo-sures required by takeover law in accordance with section 315a(1) HGB from page 132 onward. They form part of the Management’s Report audited by the external auditor.
Declaration of Corporate Governance in accordance with section 315d HGB in connection with section 289f HGB
The Declaration of Corporate Governance can be found in the Corporate Governance chapter from page 125 onward and is a component of the Management’s Report. It comprises: – The Corporate Governance Report including the description of the diversity concept for the composition of the Board of Executive Directors and the Supervisory Board (excluding the disclosures required by takeover law in accordance with section 315a(1) HGB)
– Compliance reporting – The Declaration of Conformity pursuant to section 161 of the German Stock Corporation Act
Pursuant to section 317(2) sentence 6 HGB, the external audi-tor checked that the disclosures according to section 315d HGB were made.
Overview

20 Management’s Report BASF Report 2017
The BASF Group
At BASF, we create chemistry for a sustainable future. We combine economic success with environmental protec-tion and social responsibility. The approximately 115,000 employees in the BASF Group work on contributing to the success of our customers in nearly all sectors and almost every country in the world. Our portfolio is arranged into five segments: Chemicals, Performance Products, Functional Materials & Solutions, Agricultural Solutions and Oil & Gas.
Organization of the BASF Group
▪ Thirteen divisions grouped into five segments ▪ Regional divisions, functional units and corporate and
research units support our business
Our 13 divisions are aggregated into five segments based on their business models. The divisions bear operational respon-sibility and are organized according to sectors or products. They manage our 55 global and regional business units and develop strategies for the 86 strategic business units.
Our regional units are responsible for optimizing local infra-structure, and contribute to tapping our market potential. For financial reporting purposes, we organize the regional divisions into four regions: Europe; North America; Asia Pacific; South America, Africa, Middle East. Eight functional units and seven corporate units support the BASF Group’s business activities. The functional and cor-porate units provide services in areas such as finance, investor relations, communications, human resources, engineering and site management, as well as environmental protection, health and safety. Our research and development organization has around 10,000 employees in global research units and safe-guards our innovative capacity and competitiveness. Business processes are the shared responsibility of the divisions and the functional units. They closely coordinate the procurement of raw materials and services, production and transport to customers.
For more information on the products and services offered by the segments, see page 34
The BASF Group
Verbund conceptIntelligent networking of
production, technologies, employees and partners
In 80+ countriesEmployees contribute to our
success and that of our customers worldwide
Broad portfolio5 segments
13 operating divisions 86 strategic business units
BASF structurePercentage of total sales in 2017
1 Chemicals – Petrochemicals – Monomers – Intermediates
25%
2 Performance Products
– Dispersions & Pigments – Care Chemicals – Nutrition & Health – Performance Chemicals
25%
3 Functional Materials & Solutions
– Catalysts – Construction Chemicals – Coatings – Performance Materials
32%
4 Agricultural Solutions – Crop Protection 9%
5 Oil & Gas – Oil & Gas 5%
6 Other 4%
1
2
3
4
56

BASF Report 2017 Management’s Report
The BASF Group 21
Sites and Verbund
▪ Six Verbund sites with intelligent plant networking ▪ 347 additional production sites worldwide ▪ Global Technology and Know-How Verbund
BASF has companies in more than 80 countries. We operate six Verbund sites and 347 additional production sites world-wide. Our Verbund site in Ludwigshafen, Germany, is the world’s largest integrated chemical complex owned by a single company. This was where the Verbund principle was originally developed and continuously optimized before being imple-mented at additional sites. The Verbund system is one of BASF’s great strengths. Here, we add value as one company by using our resources
efficiently. The Production Verbund intelligently links produc-tion units and their energy supply so that, for example, the waste heat of one plant provides energy to others. Further-more, one facility’s by-products can serve as feedstock elsewhere. This not only saves us raw materials and energy, it also avoids emissions, lowers logistics costs and leverages synergies. We also make use of the Verbund principle for more than production, applying it for technologies, know-how, employ-ees, customers and partners, as well. Expert knowledge is pooled in our global research platforms.
For more information on the Verbund concept, see basf.com/en/verbund
BASF sites
Sã
Freeport
Geismar
o Paulo
Florham Park
Antwerp
Ludwigshafen
Nanjing
Hong Kong
Kuantan
Regional centersSelected sitesVerbund sitesSelected research and development sites

22 Management’s Report BASF Report 2017
The BASF Group
BASF sales by region 2017 (Location of customer)
1 Europe 45%
2 North America 24%
3 Asia Pacific 22%
4 South America, Africa, Middle East 9%
Procurement and sales markets
▪ Around 130,000 customers; broad customer portfolio ▪ More than 70,000 suppliers
BASF supplies products and services to around 130,000 customers from various sectors in almost every country in the world. Our customer portfolio ranges from major global customers and medium-sized businesses to end consumers. We work with over 70,000 suppliers from different sectors worldwide. They supply us with important raw materials, chemicals, investment goods and consumables, and perform a range of services. Some of our most important raw materials are naphtha, natural gas, methanol, ammonia and benzene.
For more information on customers, see page 34; for more information on suppliers, see page 93 onward
BASF sales by industry 2017 (Direct customers)
>20% Chemicals and plastics
10–20% Consumer goods | Transportation
5–10% Agriculture | Construction | Energy and resources
<5% Health and nutrition | Electronics
Business and competitive environment
BASF’s global presence means that it operates in the context of local, regional and global developments and is bound by various conditions. These include: – Global economic environment – Legal and political requirements (such as European Union regulations)
– Trade agreements like the North American Free Trade Agree-ment (NAFTA)
– Environmental agreements (such as the E.U. Emissions Trading System)
– Social aspects (such as the U.N. Universal Declaration of Human Rights)
BASF holds one of the top three market positions in around 75% of the business areas in which it is active. Our most important global competitors include AkzoNobel, Clariant, Covestro, DowDuPont, DSM, Evonik, Formosa Plastics, Huntsman, SABIC, Sinopec, Solvay and many hundreds of local and regional competitors. We expect competitors from Asia and the Middle East in particular to gain increasing signifi-cance in the years ahead.
Corporate legal structure
As the publicly traded parent company, BASF SE takes a central position: Directly or indirectly, it holds the shares in the companies belonging to the BASF Group, and is also the largest operating company. The majority of Group companies cover a broad spectrum of our business. In the BASF Group Consolidated Financial Statements, 286 companies including BASF SE are fully consolidated. We consolidate eight joint operations on a proportional basis, and account for 35 com-panies using the equity method.
For more information, see the Notes to the Consolidated Financial Statements from page 184 onward
1
2
3
4

BASF Report 2017 Management’s Report
Our strategy — Corporate strategy 23
With the “We create chemistry” strategy, BASF has set itself ambitious goals. We want to contribute to a sustain-able future and have embedded this into our corporate purpose: “We create chemistry for a sustainable future.”
In 2050, nearly 10 billion people will live on Earth. While the world’s population and its demands will keep growing, the planet’s resources are finite. On the one hand, population growth is associated with huge global challenges; and yet we also see many opportunities, especially for the chemical industry.
Our corporate purpose
▪ We create chemistry for a sustainable future
We want to contribute to a world that provides a viable future with enhanced quality of life for everyone. We do so by creating chemistry for our customers and society and by making the best use of available resources. We live our corporate purpose by: – Sourcing and producing responsibly – Acting as a fair and reliable partner – Connecting creative minds to find the best solution for market needs
For us, this is what successful business is all about.
As an integrated global chemical company, we make important contributions in the following three areas: – Resources, environment and climate – Food and nutrition – Quality of life
In doing so, we act in accordance with four strategic principles.
Our strategic principles
We add value as one company. Our Verbund concept is unique in the industry. Encompassing the Production Verbund, Technology Verbund and Know-How Verbund as well as all relevant customer industries worldwide, this sophisticated and profitable system will continue to be expanded. This is how we combine our strengths and add value as one company. We innovate to make our customers more successful. We want to align our business optimally with our customers’ needs and contribute to their success with innovative and sustainable solutions. Through close partnerships with customers and research institutes, we link expertise in chemistry, biology, physics, materials science and engineering to jointly develop customized products, functional materials, and system solutions as well as processes and technologies. We drive sustainable solutions. In the future, sustain-ability will more than ever serve as a starting point for new business opportunities. That is why sustainability and innova-tion are becoming significant drivers for our profitable growth. We form the best team. Committed and qualified employ-ees around the world are the key to making our contribution to a sustainable future. Because we want to form the best team, we offer excellent working conditions and inclusive leader ship based on mutual trust, respect and dedication to top performance.
For more information on innovation, see page 35 onward
For more information on business opportunities with sustainability, see page 29 onward
For more information on the Best Team Strategy, see page 42 onward
Our strategyCorporate strategy
PurposeWe create chemistry
for a sustainable future
PrinciplesAs strategic basis for our
success on the market
ValuesAs guideline for our conduct
and actions
World population growth
2010
7.0 billion
Europe737 million
Asia4,194 million
Oceania37 million
Africa1,049 million
Americas 940 million
2050
9.8 billion
Europe716 million–3%
Asia5,257 million+25%
Oceania57 million+56%
Africa2,528 million
+141%
Americas1,214 million
+29%
Source: United Nations 2017

24 Management’s Report BASF Report 2017
Our strategy — Corporate strategy
Our values
Our conduct is critical for the successful implementation of our strategy: This is what our values represent. They guide how we interact with society, our partners and with each other. Creative: In order to find innovative and sustainable solutions, we have the courage to pursue bold ideas. We link our areas of expertise from many different fields and build partnerships to develop creative, value-adding solutions. We constantly improve our products, services and solutions. Open: We value diversity – in people, opinions and experi-ences. That is why we foster dialog based on honesty, respect and mutual trust. Responsible: We act responsibly as an integral part of society. In doing so, we strictly adhere to our compliance standards. And in everything we do, we never compromise on safety. Entrepreneurial: All employees contribute to BASF’s suc-cess – as individuals and as a team. We turn market needs into customer solutions. We succeed in this because we take ownership and embrace accountability for our work.
Our focus areas
▪ We set ourselves goals along the value chain for our focus areas
Sustainability is key to the company’s long-term success and as such, is embedded into our corporate strategy. We have systematically formulated expectations for our conduct and defined focus areas to meet the growing challenges along the value chain: – We source responsibly – We produce safely for people and the environment – We produce efficiently – We value people and treat them with respect – We drive sustainable products and solutions
For more information on our materiality analysis, see basf.com/materiality
For more information on our goals, see page 26 onward
For more information on the integration of sustainability, see page 29 onward
The BASF brand
▪ Above-average awareness of, and trust in, BASF brand in chemical industry
▪ Corporate design updated
BASF’s success as an integrated global chemical company relies on having a strong brand. This is derived from our strategy and our corporate purpose – “We create chemistry for a sustainable future” – as well as our strategic principles and values.
“Connected” describes the essence of the BASF brand. Con-nectedness is one of BASF’s great strengths. Our Verbund concept – realized in production, technologies, knowledge, employees, customers and partners – enables innovative solutions for a sustainable future. The claim that “We create chemistry,” as stated in the BASF logo, helps us embed this solution-oriented strategy in the public perception. Our brand creates value by helping communicate its benefits for our stakeholders as well as our values. Wherever our stakeholders encounter our brand, we want to convince them that BASF stands for connectedness, intelligent solutions, value-adding partnerships, an attractive working environment and sustainability. This contributes to our customers’ confidence in their buying decisions and to our company value. We are constantly developing our brand image. We regularly measure awareness of and trust in our brand, and therefore in our company. A global market research study conducted every two years showed in 2016 that, in terms of awareness and trust, BASF is above the industry average in numerous countries. Our goal is to continue increasing awareness of BASF in all of our relevant markets. In 2017, we updated our corporate design to be able to present our brand flexibly, uniformly and efficiently in a fast-moving media land-scape.
Global standards
▪ We act according to our values and internationally recognized standards of conduct
▪ We review our performance with audits
Our standards fulfill or exceed existing laws and regulations and take internationally recognized principles into account. We respect and promote: – The 10 principles of the U.N. Global Compact – The Universal Declaration of Human Rights and the two U.N. Human Rights Covenants
– The core labor standards of the ILO and the Tripartite Declaration of Principles Concerning Multinational Enterprises and Social Policy (MNE Declaration)
– The OECD Guidelines for Multinational Enterprises – The Responsible Care® Global Charter – The German Corporate Governance Code
We stipulate rules for our employees with standards that apply throughout the Group. We set ourselves ambitious goals with voluntary commitments and monitor our performance in terms of the environment, health and safety using our Responsible Care Management System. In terms of labor and social standards, this takes place using three elements: the Compliance Program (including the compliance hotlines, which can be used for internal and external questions or complaints), close dialog with our stakeholders (such as with employee representatives or international organizations), and

BASF Report 2017 Management’s Report
Our strategy — Corporate strategy 25
the global management process for the respect of international labor norms. Our business partners are expected to comply with pre-vailing laws and regulations and to align their actions with internationally recognized principles. We have established monitoring systems to ensure this.
For more information on labor and social standards, see page 47
For more information on the Responsible Care Management System, see page 97
For more information on Corporate Governance, see page 127 onward
For more information on compliance, see page 135 onward
For more information on Supplier Standards, see page 93 onward
Innovations for a sustainable future
Innovations in chemistry are indispensable to meeting the needs of the growing world population on a long-term basis. The develop ment of innovative products and solutions is, there-fore, of vital significance for BASF. In the long term, we aim to continue to significantly increase sales and earnings with new and improved products. Effective and efficient research lays the foundation for this. We believe that the digitalization of research offers great potential and are driving this forward around the world. We are engaged in intensive research and development activities in our established business areas. One focus of our research is on the enhancement and innovative application of specific key technologies. They pool the diverse competencies of our international Research and Development Verbund to strengthen our competitive ability in the long-term. In addition, we are addressing clearly defined topics to drive forward innovation in new business fields and with new technologies above and beyond the current focus areas of our divisions. We are also working on overarching projects with a high techno-logical, social or regulatory relevance. With our research, we aim to make a decisive contribution to innovative solutions for global challenges and contribute to sustainable development. Our three global technology platforms are based in our key regions – Europe, Asia Pacific and North America: Process Research & Chemical Engineering (Ludwigshafen, Germany), Advanced Materials & Systems Research (Shanghai, China) and Bioscience Research (Research Triangle Park, North Carolina). We want to continue expanding our research and development activities on a global level. The stronger presence of our research and development in key markets opens up new opportunities to find appropriate solutions for regional markets, actively participate in worldwide innovation process-es and gain access to talent.
For more information on innovation, see page 35 onward
For more information on competition for talent, see page 43
Business expansion in emerging markets
In the years ahead, we want to continue to grow in the emerging markets and expand our position there. We define the emerg-ing markets as Greater China, the ASEAN countries,1 India, Pakistan and Bangladesh; Central and South America; eastern Europe; the Middle East, Turkey and Africa. Today’s emerging markets are expected to account for around 65% of global chemical production in 2025. We aim to benefit from the above-average growth in these regions, which is why we have invested more than a quarter of our capital expenditures2 (excluding Oil & Gas) there in the past five years. Growth in the emerging markets gathered pace slightly in 2017. This was attributable on the one hand to more positive developments in eastern Europe. The eastern European E.U. countries recorded dynamic growth and the Russian economy again improved slightly after two years of recession. In Brazil, too, the economic situation improved markedly over the course of the year. In China and the other Asian emerging markets, growth was slightly higher than in 2016, while India recorded a slight decline. Overall, economic growth in the re-gion was roughly as strong as in the previous year. Growth in the Middle East slowed slightly, but increased somewhat in Africa. Compared with 2016, sales (excluding Oil & Gas) at our companies located in the emerging markets rose by 13% to €16,853 million, largely as a result of significantly higher sales volumes and prices. Measured by customer location, we in-creased sales (excluding Oil & Gas) in the emerging markets by 15% to €21,496 million. This brought sales to customers in emerging markets to around 35% of total sales (excluding Oil & Gas) in 2017. In the years ahead, we want to continue expanding this percentage based on past and future invest-ments.
For more information on our goals, see page 26 onward
Sales3 in emerging markets
2017 35% 65%
2007 29% 71%
Industrialized countriesEmerging markets
wird aktualisiert
3 Percentage of BASF Group sales (excluding Oil & Gas) by location of customer
IndustrieländerSchwellenländer
1 Brunei, Indonesia, Malaysia, Myanmar, Cambodia, Laos, the Philippines, Singapore, Thailand, Vietnam2 Excluding additions to property, plant and equipment resulting from acquisitions, capitalized exploration, restoration obligations and IT investments

26 Management’s Report BASF Report 2017
Our strategy — Goals
Goals
We carry out our corporate purpose, “We create chemistry for a sustainable future,” by pursuing ambitious goals along our entire value chain. In this way, we aim to achieve profitable growth and take on social and environmental responsibility.
We are focusing on issues where we as a company can make a significant contribution.
Growth and profitability
As determined in 2015, our aim for the years ahead is, on average, to grow sales slightly faster and EBITDA considerably faster than global chemical production (excluding pharmaceu-ticals; 2017: 3.5%; average change since 2015: 3.5%), and to earn a significant premium on our cost of capital. Moreover, we strive for a high level of free cash flow each year, either raising or at least maintaining the dividend at the prior-year level.
For more information on our results of operations in 2017, see pages 51 to 55
For more information on our financial position, see pages 57 to 59
2017Change since
2016
Average change since
2015
Sales €64.5 billion 12.0% 3.7% 2
EBITDA €12.7 billion 20.9% 13.1% 2
Dividends per share paid out €3.00 €0.10
Premium on cost of capital €2.7 billion
Free cash flow €4.8 billion
2 Baseline 2015: excluding the gas trading and storage business transferred to Gazprom
Goal areas along the value chain
Suppliers BASF Customers
ProcurementGrowth and profitability; Employees;Production; Product stewardship;Energy and climate protection; Water
Products and solutions
Employees
2021 Goal Status at end of 2017 More on
Proportion of women in leadership positions with disciplinary responsibility 22–24% 20.5% Page 45
Long-term goals
International representation among senior executives3
Increase in proportion of non-German senior executives (baseline 2003: 30%) 38.9% Page 45
Senior executives with international experience
Proportion of senior executives with international experience over 80% 84.6% Page 45
Employee development Systematic, global employee development as shared responsibility of employees and leaders based on relevant processes and tools
Project implemented worldwide Page 44
3 The term “senior executives” refers to leadership levels 1 to 4, whereby level 1 denotes the Board of Executive Directors. In addition, individual employees can attain senior executive status by virtue of special expertise.
Procurement
2020 Goal Status at end of 2017 More on
Assessment of sustainability performance of relevant suppliers;1 development of action plans where improvement is necessary 70% 56% Page 93
1 Our suppliers are evaluated based on risk due to the size and scale of our supplier portfolio. We define relevant suppliers as those showing an elevated sustainability risk potential as identified by our risk matrices and our purchasers’ assessments. We also use further sources of information to identify relevant suppliers such as evaluations from Together for Sustainability (TfS), a joint initiative of chemical companies for sustainable supply chains.

BASF Report 2017 Management’s Report
Our strategy — Goals 27
Production
2025 Goals Status at end of 2017 More on
Reduction of worldwide lost-time injury rate per one million working hours ≤0.5 1.4 Page 98
Reduction of worldwide process safety incidents per one million working hours ≤0.5 2.0 Page 99
Annual goal
Health Performance Index >0.9 0.97 Page 100
Product stewardship
2020 Goal Status at end of 2017 More on
Risk assessment of products that we sell in quantities of more than one metric ton per year worldwide >99% 76.2% Page 101
Energy and climate protection
2020 Goal Status at end of 2017 More on
Coverage of our primary energy demand by introducing certified energy management systems (ISO 50001) at all relevant sites4 90% 54.3% Page 105
Reduction of greenhouse gas emissions per metric ton of sales product (excluding Oil & Gas, baseline 2002) (40%) (35.5%) Page 105
4 The selection of relevant sites is determined by the amount of primary energy used and local energy prices.
Water
2025 Goals Status at end of 2017 More on
Introduction of sustainable water management at all production sites in water stress areas and at all Verbund sites (excluding Oil & Gas) 100% 45.2% Page 108
Products and solutions
2020 Goal Status at end of 2017 More on
Increase the proportion of sales generated by products that make a particular contribution to sustainable development (Accelerator products) 28% 27.3% Page 32

28 Management’s Report BASF Report 2017
Our strategy — Value-based management
Value-based management
“We add value as one company” is one of the four principles of our “We create chemistry” strategy. To create value in the long term, a company’s earnings must exceed the cost of stockholders’ equity and borrowing costs. This is why we strive to earn a significant premium on our cost of capital. To ensure BASF’s long-term success, we encourage and support all employees in thinking and acting entrepreneurially in line with our value-based management concept. Our goal: to create awareness as to how each and every employee can find value-oriented solutions in the company’s day-to-day operations and implement these in an effective and efficient manner.
EBIT after cost of capital
▪ Performance and management indicator
Income from operations (EBIT) after cost of capital is a key performance and management indicator for the BASF Group, its operating divisions and business units. This figure combines the company’s economic situation as summarized in EBIT with the costs for the capital made available to us by shareholders and creditors. When EBIT exceeds cost of capital, we earn a premium on our cost of capital and exceed the return expected by our shareholders.
For more information on the development of this key performance indicator, see the Results of Operations on page 53
Calculating EBIT after cost of capital
▪ Cost of capital determined using cost of capital per-centage and cost of capital basis
To calculate EBIT after cost of capital, we take the BASF Group’s EBIT and deduct the EBIT of activities recognized under Other – not allocated to the segments – and subtract the cost of capital of the BASF Group from the resulting figure. Cost of capital is determined by applying the cost of capital percentage before taxes to the value of the cost of capital basis at each month-end. Monthly cost of capital is then add-ed up over the course of the year. The cost of capital percentage is determined using the weighted cost of capital from equity and borrowing costs (weighted average cost of capital, WACC). To calculate a pre-tax figure similar to EBIT, it is adjusted using the projected tax rate for the BASF Group for the business year. In addition, the projected net expense of Other is already provided for by an adjustment to the cost of capital percentage. The cost of equity is ascertained using the Capital Asset Pricing Model. Borrowing costs are determined based on the financing costs of the BASF Group. The cost of capital basis consists of the operating assets of the segments plus the customer and supplier financing not
included there. Operating assets comprise the current and noncurrent asset items used by the operating divisions.1
Value-based management throughout the company
▪ Exercising a value-oriented mindset in day-to-day business by every employee
For us, value-based management means the daily focus placed on value by all of our employees. To this end, we have identified value drivers that show how each and every unit in the company can create value. We develop performance indicators for the individual value drivers that help us to plan and pursue changes. An important factor in ensuring the successful imple-mentation of value-based management is linking the goals of BASF to the individual target agreements of employees. In the operating units, the most important performance indicator is EBIT after cost of capital. By contrast, the functional units’ contribution to value is assessed on the basis of effectiveness and efficiency. All this forms a consistent system of value drivers and key indicators for the individual units and levels at BASF. In addition to EBIT after cost of capital, EBIT and EBIT before special items are the most significant performance indicators for measuring economic success as well as for steering the BASF Group and its operating units. We primarily comment on EBIT before special items on a segment and division level in our financial reporting. Special items arise from the integration of acquired businesses, restructuring measures, impairments, gains or losses resulting from divestitures and sales of shareholdings, and other expenses and income that arise outside of ordinary business activities. Adjusting for special items makes EBIT before special items an especially suitable figure for illustrating develop ment over time. In addition to EBIT before special items, we also report on sales as a further main driver for EBIT after cost of capital. BASF’s nonfinancial targets are focused more on the long term, and are not used for short-term steering. According to our value-based management concept, all employees can make a contribution in their business area to help ensure that we earn the targeted premium on our cost of capital. We pass this value-based management concept on to our team around the world through seminars and training events, thereby promoting entrepreneurial thinking at all levels within BASF.
For more information on the development of these performance indicators, see the Results of Operations on page 51 onward
1 These include fixed assets, intangible assets, investments accounted for using the equity method, inventories, trade accounts receivable, other receivables and other assets generated by core business activities as well as any assets of disposal groups.

BASF Report 2017 Management’s Report
Our strategy — Integration of sustainability 29
Sustainability is an integral part of our corporate strategy. Using the various tools of our sustainability management, we carry out our company purpose: “We create chemistry for a sustainable future.” We incorporate sustainability into our business. This is how we seize business opportu-nities and minimize risks along the value chain.
Strategy
▪ Ensuring long-term economic success ▪ Taking advantage of business opportunities and
minimizing risks
We aim to add value in the long term for our company, the environment and society. Sustainability is at the core of what we do, a driver for growth as well as an element of our risk management. That is why we incorporate aspects of sustain-ability into our decision-making processes and have defined clear responsibilities in our organization. This is how we posi-tion our company for long-term economic success. We have created structures to promote sustainable, entre-preneurial actions all the way from strategy to implementation. The Corporate Sustainability Board is BASF’s central steering committee for sustainable development. It is composed of the heads of our business, corporate and functional units, and regions. A member of the Board of Executive Directors serves as chair. We have also established an external, independent Stakeholder Advisory Council. Here, international experts from academia and society contribute their perspectives to discus-sions with BASF’s Board of Executive Directors, helping us expand our strengths and identify our potential for improve-ment. Through our constant dialog with stakeholders, our internal analysis methods and our many years of experience, we are continuously refining our understanding of significant topics and trends as well as potential opportunities and risks along our value chain. For example, we have defined sustainability focus areas within our corporate strategy. These formulate the commit-ments with which BASF positions itself in the market and how it aims to meet the growing challenges along the value chain: – We source responsibly – We produce safely for people and the environment – We produce efficiently – We value people and treat them with respect – We drive sustainable products and solutions
Relevant topics resulting from these commitments – such as supply chain responsibility, responsible production, resource efficiency, energy and climate protection, water, product stew-ardship, employment and employability, and portfolio management – form the focal points of our reporting. We also
integrate these topics into our long-term steering processes to ensure societal acceptance and take advantage of business opportunities.
For more information on the organization of our sustainability management, see basf.com/sustainabilitymanagement
For more information on our materiality analysis, see basf.com/materiality
For more information on our financial and sustainability goals, see page 26 onward
Societal acceptance
▪ Constant dialog with our key stakeholders ▪ Global requirements for community advisory panels ▪ Social commitment
Sustainability management helps to minimize risks. This sup-ports our long-term economic success and ensures societal acceptance of our business activities. We aim to reduce potential risks in the areas of environment, safety and security, health protection, product stewardship, compliance, and labor and social standards by setting ourselves globally uniform requirements. These often go beyond local legal requirements. Internal monitoring systems and grievance mechanisms enable us to check compliance with these standards: they include, for example, questionnaires, audits and compliance hotlines. All employees, managers and Board members are required to abide by our global Code of Conduct, which defines a mandatory framework for our business activities. Our investment decisions for property, plant and equip-ment and financial assets also involve sustainability criteria. Our decision -making is supported by expert appraisals that assess economic implications as well as potential effects on the environment, human rights or local communities. Our stakeholders include customers, employees, suppliers and shareholders, as well as representatives from academia, industry, politics, society and the media. Parts of our business activities, such as the use of new technologies, are frequently viewed by some stakeholders with a critical eye. In order to increase societal acceptance for our business activities, we take on these questions, assess our business activities in terms of their sustainability, and communicate this transpar-ently. Such dialogs help us to even better understand society’s expectations of us and which measures we need to pursue in order to establish and maintain trust and build partnerships. We use a custom model to identify key stakeholders and involve them more effectively. When selecting our stake-holders, we assess factors such as their topic-specific exper - tise and willingness to engage in constructive dialog, for instance. We draw on the competence of global initiatives and networks, and contribute our own expertise.
Integration of sustainability

30 Management’s Report BASF Report 2017
Our strategy — Integration of sustainability
That is why we are involved in worldwide initiatives with various stakeholder groups, such as the U.N. Global Compact. BASF’s Chairman of the Board of Executive Directors is a member of the United Nations Global Compact Board. As a member of the U.N. Global Compact LEAD initiative, we support the imple-mentation of the Agenda 2030 and its Sustainable Develop-ment Goals. BASF is also active in local Global Compact net-works. We once again met with the Stakeholder Advisory Council in 2017 to discuss important aspects of sustainability. The main topics were strengthening sustainability in the corporate strategy and challenges in the supply chain. We received and implemented recommendations for our thematic focus areas. For example, we initiated a lighthouse project on the circular economy that is analyzing to what extent waste streams can be used as raw materials. In 2017, BASF joined the Ellen MacArthur Foundation’s circular economy initiatives to drive forward existing approaches. Our lobbying and political communications are conducted in accordance with transparent guidelines and our publicly stated positions. BASF does not financially support political parties. In the United States, employees at BASF Corporation have exercised their right to establish a Political Action Com-mittee (PAC). The BASF Corporation Employee PAC is a volun-tary, federally registered employee association founded in 1998. It collects donations for political purposes and inde-pendently decides how these are used, in accordance with U.S. law. We have a particular responsibility toward our production sites’ neighbors. With the established community advisory panels, we promote open exchange between citizens and our site management, and strengthen trust in our activities. In 2017, we updated our globally binding requirements for com-munity advisory panels at our sites. These minimum require-ments are oriented toward the grievance mechanisms outlined in the U.N. Guiding Principles for Business and Human Rights. We keep track of their implementation through the existing global databank of the Responsible Care Management Sys-tem. As a founding member of the U.N. Global Compact, we support the implementation of the United Nations’ Sustainable Development Goals with our social commitment around the world. We promote social, educational, cultural, academic and sports projects as part of our social engagement strategy. The main aim of these projects is to have a lasting impact on society and offer learning opportunities for participating cooperation partners and BASF. As a responsible neighbor, BASF strives to create a livable community for our sites’ neighbors, employees and their fami-lies. To achieve this, BASF supports projects that reach out to as many people as possible and have long-term impact. One example is the Connected to Care program, where employees around the world form teams to carry out social projects to-gether with nonprofit organizations. Employees can suggest their own ideas or get involved in BASF initiatives.
We also aim to create long-term value for BASF and society with new business models and cross-industry partnerships. Our company-wide Starting Ventures program provides access to growing low-income markets. This helps people with precar-ious livelihoods to improve their income-earning opportunities and their quality of life. The program also strengthens our con-tribution to reaching the U.N. Sustainable Development Goals. In one project in Kenya and Tanzania, for example, local food supply and quality of life are improved by fortifying flour with micronutrients such as vitamin A. This reduces health risks for the population. To take advantage of these opportunities for the people there, BASF draws on an established network of local mills, nonprofit organizations and government authorities. In the area of international development work, we support the BASF Stiftung, an independent nonprofit organization, through donations to its projects with various U.N. and non-governmental organizations. In 2017, BASF supported various activities by the U.N. Refugee Agency (UNHCR) to give children in Kenyan refugee camps access to education with its annual year-end donation campaign to the BASF Stiftung. BASF dou-bled all donations by employees of German and African Group companies, bringing the total amount benefiting the refugee children in Kenya to €642,703. This total donation was again doubled to €1,285,405 by the German arm of the U.N. refugee agency. The BASF Group spent a total of €56.0 million supporting projects in 2017; we donated 57% of this amount (2016: €47.0 million, of which 49.6% were donations).
BASF Group donations, sponsorship and own projects in 2017 (million €)
2017 Share
1 Social projects 21.4 38.2%
2 Education 16.6 29.7%
3 Culture 5.1 9.1%
4 Science 2.9 5.2%
5 Sports 2.7 4.8%
6 Other 7.3 13.0%
For more information on stakeholder dialog, see basf.com/en/dialog
For more information on the Stakeholder Advisory Council, see basf.com/en/stakeholder-advisory-council
For more information on our guidelines for responsible lobbying, see basf.com/guidelines_political_communication
For more information on Starting Ventures, see basf.com/en/starting-ventures
For more information on our production standards, see page 98 onward
For more information on standards in our supply chain, see page 93 onward
For more information on compliance and our Code of Conduct, see page 135 onward
1
2
3
4
5
6
€56.0 million

BASF Report 2017 Management’s Report
Our strategy — Integration of sustainability 31
Responsibility for human rights
▪ Implementation of grievance mechanisms at production sites evaluated
BASF acknowledges its responsibility to respect human rights. In our own business activities, our aim is to prevent human rights abuses. As a participant in numerous global value chains, we are dependent on partners and demand that they likewise respect human rights and the associated standards. We offer to help our partners in their efforts to meet their human rights responsibilities. We integrate human rights criteria into our business activi-ties as standard: due diligence processes in investment, acquisition and divestiture projects, in product assessments along the product lifecycle, in supplier evaluation processes, in training for security personnel at our sites, as well as in sys-tems to monitor labor and social standards. Employees and third parties can report suspected or actu-al violations of laws or company guidelines to our compliance hotline. The hotline received 193 human rights-related com-plaints in 2017. All complaints received are reviewed and for-warded to the relevant departments for in-depth investigation. If justified, suitable measures are taken to address the issue. We also documented the implementation of our minimum standards on grievance mechanisms as part of the community advisory panels at all production sites worldwide in 2017. These are based on the U.N. Guiding Principles on Business and Human Rights. Building on this, in 2018 we aim to ensure the uniform application of these standards at sites with an established local grievance mechanism. BASF is part of the Global Business Initiative on Human Rights (GBI). This group of globally operating companies from various sectors aims to ensure implementation of the U.N. Guiding Principles on Business and Human Rights. In 2017, we again consulted with representatives of civil society at an international and national level on an ongoing basis, which provided valuable input for our measures.
For more information on our human rights position, see basf.com/humanrights and pages 47 and 135
For more information on labor and social standards, see page 47 onward
For more information on our production standards, see page 98 onward
For more information on standards in our supply chain, see page 93 onward
For more information on compliance, see page 135 onward
Measuring value added by sustainability and harnessing business opportunities
▪ Value to Society: method for assessing economic, environmental and social impact of business activities along the value chain
We take advantage of business opportunities by offering our customers innovative products and solutions that contribute to sustainable development. We ensure that sustainability cri-teria are integrated into our business units’ development and implementation of strategies, research projects and innovation processes. For example, we analyze sustainability-related market trends in customer industries to systematically exploit new business opportunities. We want to measure the value proposition of our actions along the entire value chain, aware that our business activities are connected to both positive and negative impacts on the environment and society. We strive to increase our positive contribution to society and minimize the negative effects of our business activities. In order to achieve this, we need to understand how our actions impact society and the environment. We already have many years of experience evaluating our products and pro-cesses using methods such as eco-efficiency analyses, the Sustainable Solution Steering® portfolio analysis, or BASF’s corporate carbon footprint. Building on this, BASF has developed a method with external experts to perform a monetary assessment of the economic, ecological, and social impacts of its business activ-ities along the value chain – the Value to Society approach. It enables a direct comparison between financial and nonfinan-cial effects on society, along with how these interact. This transparency supports the integrated character of our actions, contributing to BASF’s long-term success. The results of these assessments are helpful in our discussions with stake-holders, in internal progress measurements, and in decision -making processes. We contribute our approach and expertise to current debates on the monetary value of the economic, environ-mental and social impact of business decisions. We share our experience in networks and are involved in the corresponding standardization processes within the International Organiza-tion for Standardization (ISO). Among other initiatives, BASF has participated in the Coalition for Inclusive Capitalism’s Embankment Project since 2017. In the project, leading global companies and investors are working on a common understanding of how companies can create value over the long term. The initiative aims to strengthen trust in business and in this way, generate long-term corporate value.

32 Management’s Report BASF Report 2017
Our strategy — Integration of sustainability
As well as measuring the impacts of our operations, our busi-ness activities are guided by sustainability considerations.
For more information on this method and the results of Value to Society, see basf.com/en/value-to-society
For more information on our sustainability instruments, see basf.com/en/measurement-methods and page 95
Portfolio management based on sustainability performance
▪ Sustainable Solution Steering® method to manage our product portfolio
A significant lever for the steering of our product portfolio, based on the sustainability performance of our products, is the Sustainable Solution Steering® method. By the end of the 2017 business year, BASF had con-ducted sustainability assessments and ratings for 97.5% of its entire relevant portfolio1 of more than 60,000 specific product applications – which account for €58.4 billion in sales. We consider the products’ application in various markets and industries. Because of increasing sustainability requirements on the market, we regularly conduct reassessments of existing product categories as well as of the relevant portfolio.
2020 Goal
Increase proportion of sales generated by Accelerator products to 28%
Accelerator products make a particular contribution to sustainability in the value chain. That is why we want to increase the proportion of sales from Accelerator products to 28% by 2020.
Transitioners are products with specific sustainability challenges that are being actively tackled. We are developing plans of action for all products classified as challenged, even in the case of portfolio revisions and product reassessments. These action plans include research projects, reformulations or even replacing one product with an alternative product. At the end of 2017, action plans had been created for 100% of challenged products. We played a leading role in the development of a cross- industry framework for portfolio sustainability assessments published by the World Business Council for Sustainable Development (WBCSD) in November 2017, contributing our many years of expertise in the application of this method.
For more information on Sustainable Solution Steering®, see basf.com/en/sustainable-solution-steering
Nonfinancial statement (NFS) in accordance with sections 315b and 315c of the German Commercial Code (HGB)
In order to meet the new reporting requirements of the CSR Directive Implementation Act, we conducted an additional internal analysis based on the materiality criteria defined by the legislation in 2017. Findings of a systematic survey already conducted internally were used to analyze the effects of sustainability topics along the value chain on BASF’s business. We were able to derive BASF’s impact along the value chain on the nonfinancial matters defined by the legislation based on the results of the Value to Society method. The nonfinancial statement (NFS) in accordance with sections 315b and 315c of the German Commercial Code is integrated into the Management’s Report. The NFS disclosures can be found in the relevant sections of the Management’s Report and have been prepared in accordance with the new Global Reporting Initiative Standards (“Comprehensive” application option) and the reporting require ments of the U.N. Global Compact.
Meets basic sustainability standardson the market
Substantial sustainability contribution in the value chain
Specific sustainability issues which are being actively addressed
Significant sustainability concern identified and action plan in development
27.3%(2016: 27.2%)
68.3%(2016: 68.3%)
4.3%(2016: 4.2%)
0.1%(2016: 0.3%)
Accelerator Performer Transitioner Challenged
SustainableSolutionSteering®
Sustainable Solution Steering®: How BASF’s products contribute to sustainability
1 Not included in the portfolio are primarily the sales reported under Other (see page 90 for more information on the composition of Other) or not allocated to the operating business (such as licences).

BASF Report 2017 Management’s Report
Our strategy — Integration of sustainability 33
Nonfinancial statement (NFS) disclosures in the relevant chapters of the integrated report
NFS disclosure Topics Concepts
Business model The BASF Group Page 20–22
Environmental matters Process safety Page 27 (goals)Pages 97 and 99 (goals, measures, results)
Emergency response and corporate security Pages 97 and 100 (goals, measures, results)
Product stewardship Page 27 (goals)Pages 97 and 101–102 (goals, measures, results)
Transportation and storage Pages 97 and 103 (goals, measures, results)
Energy and climate protection Page 27 (goals)Pages 97 and 104–107 (goals, measures, results)
Water Page 27 (goals)Pages 97 and 108–109 (goals, measures, results)
Emissions to air Pages 97 and 110 (goals, measures, results)
Management of waste and contaminated sites Pages 97 and 110 (goals, measures, results)
Portfolio management Page 27 (goals)Page 32 (goals, measures, results)
Suppliers Page 26 (goals)Pages 93–94 (goals, measures, results)
Employee-related matters Occupational safety Page 27 (goals)Pages 97, 98–99 (goals, measures, results)
Health protection Page 27 (goals)Pages 97 and 100 (goals, measures, results)
Competition for talent Page 43 (goals, measures, results)
What we expect from our leaders Page 44 (goals, measures, results)
Learning and development Page 26 (goals)Page 44 (goals, measures, results)
Inclusion of diversity Page 26 (goals)Page 45 (goals, measures, results)
Compensation and benefits Page 46 (goals, measures, results)
Employees participate in the company’s success Page 46 (goals, measures, results)
Dialog with employee representatives Page 47 (goals, measures, results)
Global labor and social standards Page 47 (goals, measures, results)
Suppliers Page 26 (goals)Pages 93–94 (goals, measures, results)
Social matters Societal acceptance Pages 29–30 (goals, measures, results)
Respect for human rights Responsibility for human rights Page 31 (goals, measures, results)
Global labor and social standards Page 47 (goals, measures, results)
Suppliers Page 26 (goals)Pages 93–94 (goals, measures, results)
Anti-corruption and bribery matters Compliance Pages 135–136 (goals, measures, results)
Suppliers Page 26 (goals)Pages 93–94 (goals, measures, results)
1 Key: The content of this paragraph (symbol at the end of the paragraph) or section (symbol below the section) is not part of the statutory audit of the annual financial statements but has
undergone a separate audit with limited assurance by our external auditor.
If the symbol is underlined, it is relevant to the entire section.
Both the NFS disclosures and our sustainability reporting based on the GRI standards have undergone an audit with limited assurance by our auditor.1 The table below indicates the sections and subsections in which the individual NFS disclosures can be found.
For more information on nonfinancial disclosures, see page 19
An assurance report on the substantive audit of the nonfinancial statement can be found online at basf.com/nfs-audit
An assurance report on the sustainability information in the BASF Report 2017 can be found online at basf.com/sustainability_information

34 Management’s Report BASF Report 2017
Customers
Customers
Around 130,000Customers from almost all sectors and countries
in the world
InnovativeIn close partnership with
our customers
FlexibleThanks to in-depth expertise and wide range of resources
BASF supplies products and services to around 130,000 customers from various sectors in almost every country in the world. Our customer portfolio ranges from major global customers and medium-sized businesses to end consumers.
Customer industry orientation
▪ Innovations and tailored solutions in close partner-ship with our customers
Our broad portfolio – from basic chemicals to high value-added products and system solutions – means that we are active in many value chains and value creation networks. As a result, we work with a wide range of business models, which we flexibly adapt to the needs of individual industries. This industry orientation is primarily driven forward and enhanced by the divisions. Around half of our business units are oriented toward specific industries. The close alignment of our business with our customers’ needs is a key element in our “We create chemistry” strategy. Our ability to combine in-depth expertise with a wide range of resources to meet specific demands enables us to position BASF as a solution-oriented system provider. We engage in close partner ships with customers in which we develop inno-vations and tailored solutions together and optimize processes and applications. Our comprehensive understanding of value chains and value creation networks as well as our global setup and market knowledge are key success factors.
Quality management
Our customers’ satisfaction is the basis for long-term business success, which is why quality management is of vital signifi-cance for BASF. We strive to continually improve processes and products. This is also reflected in our Global Quality Policy. The majority of BASF’s production sites and business units are certified according to ISO 9001.1 In addition, we also meet industry- and customer-specific quality requirements that go beyond the ISO standard.
Products and customer relations in the segments
The business models used in our divisions are constantly assessed and refined. We continually adapt our offering to the changing market conditions – such as growing digitali-zation – to secure our competitiveness. The Chemicals segment comprises the classic chemicals business with basic chemicals and intermediates. The focus is on cost leadership in our value chains, efficient and reliable production and logistics processes as well as process innova-tion. The Performance Products segment concentrates on tailored solutions. These enable our customers to improve the application properties of their products or optimize production processes, for example. Close customer contact and meeting the demanding requirements of a wide range of industries are crucial to business success. The Functional Materials & Solutions segment bundles our businesses with innovative products as well as system solutions and services for specific sectors and customers. An in-depth understanding of applications, the development of innovations in close cooperation with customers and adapta-tion to different regional needs are key success factors. In the Agricultural Solutions segment, we help farmers to be successful in the complex world of modern agriculture. We offer them innovative solutions, including solutions based on digital technologies, combined with practical, pragmatic ex-pertise to optimize agricultural production and increase the profitability of their farms. In the Oil & Gas segment, we focus on exploration and production in oil and gas-rich regions in Europe, North Africa, Russia, South America and the Middle East. We benefit from strong partnerships and our technological expertise. Together with our Russian partner Gazprom, we are also active in the transportation of natural gas in Europe.
For more information on the segments, see pages 62, 68, 75, 81 and 85 onward
1 ISO 9001 is a standard published by the International Organization for Standardization (ISO) and sets out the requirements for a quality management system.

BASF Report 2017 Management’s Report
Innovation 35
Innovation
Around 10,000Employees in research and
development worldwide
€1,888 millionSpent on research and development
Around 3,000Projects in research pipeline
A growing need for food, energy and clean water, limited resources and a booming world population – reconciling all these factors is the greatest challenge of our time. Innovations based on chemistry play a key role here, as they contribute decisively to new solutions. Effective and efficient research and development is a prerequisite for innovation as well as an important growth engine for BASF. We develop innovative processes and products for a sustainable future and drive forward digitalization in research worldwide. This is how we ensure our long- term business success with chemistry-based solutions for almost all sectors of industry.
For BASF, innovation is the key to successfully standing out from the crowd in a challenging market environment. Our innovative strength is based on a global team of highly qualified employees with various specializations. We had around 10,000 employees involved in research and develop-ment in 2017. Our three global technology platforms are run from our key regions – Europe, Asia Pacific and North America: Process Research & Chemical Engineering (Ludwigshafen, Germany), Advanced Materials & Systems Research (Shanghai, China) and Bioscience Research (Research Triangle Park, North Carolina). Together with the development units in our operating divisions, they form the core of our global Know-How Verbund. BASF New Business GmbH and BASF Venture Capital GmbH supplement this network with the task of using new technologies to tap into attractive markets and new busi-ness models for BASF. In 2017, we generated sales of over €9 billion with prod-ucts launched on the market in the past five years that stemmed from research and development activities. In the long term, we aim to continue significantly increasing sales and earnings with new and improved products.
Global network
▪ Network with around 600 universities, research institutes and companies
Our global network of about 600 universities, research insti-tutes and companies forms an important part of our Know-How Verbund. We collaborate with them in many different
disciplines. The direct access to external scientific expertise, new technologies and talented minds from various disciplines helps us to strengthen our portfolio with creative new projects. For instance, we are working on innovative materials for electrochemical energy storage with the Karlsruhe Institute of Technology (KIT) at the BELLA (Battery and Electrochemistry Laboratory) joint laboratory. We use the Creator Space® approach developed by BASF to generate innovative ideas and continuously promote dialog with customers, partners and suppliers. We draw on cutting-edge innovation methods here. In our excellence program UNIQUE – The BASF Academic Partnership Program, we are working with fifteen leading universities around the world. BASF also runs four postdoctor-al centers that pool collaborations with several research groups on a regional level. The North American Center for Research on Advanced Materials (NORA) and the California Research Alliance (CARA) postdoctoral centers are located in the United States. In 2017, BASF extended the cooperation between NORA and its academic partners by another five years and celebrated the 10-year anniversary of the partnership with Harvard University. Focus areas include materials science, bioscience, catalysis research, digitalization and cooperation with start-ups. The CARA multidisciplinary collaboration has been work-ing on new functional materials and in the area of biosciences for three years now. It has established more than 25 research projects, which have resulted in many scientific discoveries and patent applications. In 2017, we announced that the collaboration between CARA researchers and BASF experts will continue for another five years. The Joint Research Network on Advanced Materials and Systems (JONAS) postdoctoral center is active in Europe, while the Network for Asian Open Research (NAO) covers the Asia Pacific region. The Network for Advanced Materials Open Research was renamed the Network for Asian Open Research in 2017 after NAO’s research projects were expanded to include process research, chemical engineer-ing and biosciences.
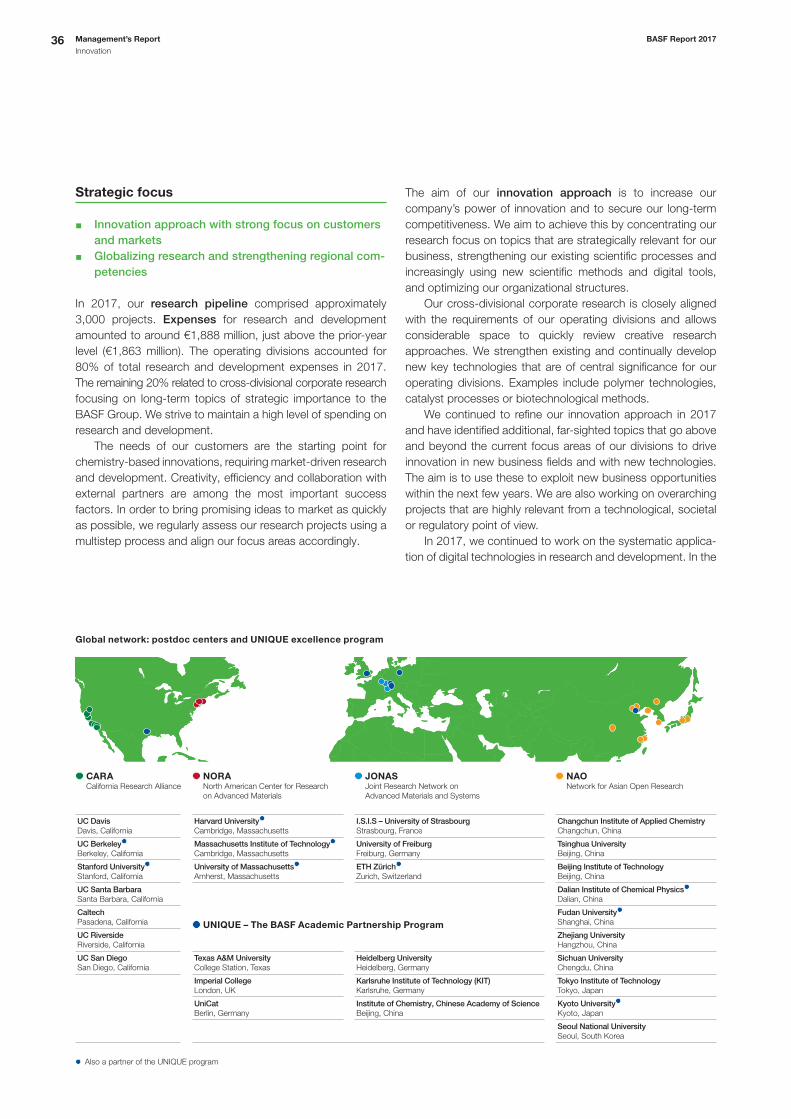
36 Management’s Report BASF Report 2017
Innovation
Strategic focus
▪ Innovation approach with strong focus on customers and markets
▪ Globalizing research and strengthening regional com-petencies
In 2017, our research pipeline comprised approximately 3,000 projects. Expenses for research and development amounted to around €1,888 million, just above the prior-year level (€1,863 million). The operating divisions accounted for 80% of total research and development expenses in 2017. The remaining 20% related to cross-divisional corporate research focusing on long-term topics of strategic importance to the BASF Group. We strive to maintain a high level of spending on research and development. The needs of our customers are the starting point for chemistry-based innovations, requiring market-driven research and development. Creativity, efficiency and collaboration with external partners are among the most important success factors. In order to bring promising ideas to market as quickly as possible, we regularly assess our research projects using a multistep process and align our focus areas accordingly.
The aim of our innovation approach is to increase our company’s power of innovation and to secure our long-term competitiveness. We aim to achieve this by concentrating our research focus on topics that are strategically relevant for our business, strengthening our existing scientific processes and increasingly using new scientific methods and digital tools, and optimizing our organizational structures. Our cross-divisional corporate research is closely aligned with the requirements of our operating divisions and allows considerable space to quickly review creative research approaches. We strengthen existing and continually develop new key technologies that are of central significance for our operating divisions. Examples include polymer technologies, catalyst processes or biotechnological methods. We continued to refine our innovation approach in 2017 and have identified additional, far-sighted topics that go above and beyond the current focus areas of our divisions to drive innovation in new business fields and with new technologies. The aim is to use these to exploit new business opportunities within the next few years. We are also working on overarching projects that are highly relevant from a technological, societal or regulatory point of view. In 2017, we continued to work on the systematic applica-tion of digital technologies in research and development. In the
Global network: postdoc centers and UNIQUE excellence program
CARA California Research Alliance
NORA North American Center for Research on Advanced Materials
JONAS Joint Research Network on Advanced Materials and Systems
NAO Network for Asian Open Research
UC Davis Davis, California
Harvard University Cambridge, Massachusetts
I.S.I.S – University of StrasbourgStrasbourg, France
Changchun Institute of Applied ChemistryChangchun, China
UC Berkeley Berkeley, California
Massachusetts Institute of TechnologyCambridge, Massachusetts
University of FreiburgFreiburg, Germany
Tsinghua UniversityBeijing, China
Stanford UniversityStanford, California
University of MassachusettsAmherst, Massachusetts
ETH ZürichZurich, Switzerland
Beijing Institute of TechnologyBeijing, China
UC Santa Barbara Santa Barbara, California
Dalian Institute of Chemical Physics Dalian, China
Caltech Pasadena, California UNIQUE – The BASF Academic Partnership Program
Fudan UniversityShanghai, China
UC Riverside Riverside, California
Zhejiang University Hangzhou, China
UC San Diego San Diego, California
Texas A&M UniversityCollege Station, Texas
Heidelberg UniversityHeidelberg, Germany
Sichuan University Chengdu, China
Imperial CollegeLondon, UK
Karlsruhe Institute of Technology (KIT)Karlsruhe, Germany
Tokyo Institute of Technology Tokyo, Japan
UniCatBerlin, Germany
Institute of Chemistry, Chinese Academy of ScienceBeijing, China
Kyoto UniversityKyoto, Japan
Seoul National University Seoul, South Korea
Also a partner of the UNIQUE program

BASF Report 2017 Management’s Report
Innovation 37
years ahead, we plan to consistently expand existing expertise in fields like modeling and simulation and to develop new digital applications. Our global research and development presence is vital to our success. We want to continue advancing our research and development activities, particularly in Asia as well as in North America, and are adapting this to growth in regional markets. A stronger presence outside Europe creates new opportunities for developing and expanding customer relation-ships and scientific collaborations as well as for gaining access to talented employees. This strengthens our Research and Development Verbund and makes BASF an even more attrac-tive partner and employer. In addition to the Innovation Campus Shanghai (previously Innovation Campus Asia Pacific) which opened in 2015, we inaugurated the Innovation Campus Mumbai in 2017 to further increase our research capacity in Asia. The new Campus brings together existing and new research and development activities in Mumbai, India, under one roof, where up to 300 scientists focus on crop protection and process development. Ludwigshafen remains the largest site in our Research Verbund. This is underscored by the investment in the world’s largest supercomputer for research in the chemical industry, which was put into operation in 2017. With a computing power of 1.75 petaflops,1 Quriosity offers around 10 times the computing power previously available to BASF research ers worldwide. In collaboration with the Hewlett Packard Enter-prise group, the new supercomputer was custom designed for chemical research and will drive forward the digitalization of BASF research globally. The number and quality of our patents also attest to our power of innovation and long-term competitiveness. We filed around 800 new patents worldwide in 2017. In 2017, we once again ranked among the leading companies in the Patent Asset Index, a method that compares patent portfolios industry-wide.
For a multiyear overview of research and development expenditures, see the Ten-year summary on page 247
Research focus areas – examples
▪ Increased use of digital technologies ▪ Expansion of business activities in 3D printing
Our focus areas in research are derived from the three major areas in which chemistry-based innovations will play a key role in the future: resources, environment and climate; food and nutrition; and quality of life.
In 2017, BASF researchers from the Process Research & Chemical Engineering technology platform demonstrated the enormous potential of digitalization in research. For the first time, researchers were able to systematically analyze the existing data on catalysts used in the production of the inter-mediate product ethylene oxide, leading to valuable insights. The correlations between the formulations and the application properties of the catalysts allow their performance and lifetime to be predicted more accurately and faster. A further example is the data-based optimization for the production of dirt-resistant, water-based coatings used in the furniture industry, for instance. Using electronic data from prev ious experiments, researchers from the Advanced Mate -rials & Systems Research technology platform were able to quickly determine a successful formulation. Through the com-bination of laboratory work and virtual experiments, they were able to create new coatings that meet customer demands in a very short time. We also use data mining methods to gain new insights from very large quantities of existing data. In biotechnology, for example, data mining helps to identify promising enzymes or suitable bacteria more quickly as part of product or process development. This work comes under our Bioscience Research technology platform. 3D printing involves the development of innovative materials. In the chemical industry, BASF already has a broad portfolio with materials, system solutions, compo-nents and services. In 2017, BASF New Business GmbH established BASF 3D Printing Solutions GmbH in Heidel-berg, Germany, to continue the targeted expansion of the business. As a wholly owned subsidiary of BASF, it works closely together with researchers and application engineers from BASF as well as external partners, such as universities and cust omers. In addition, BASF New Business GmbH acquired the filament producer Innofil3D B.V. headquartered in Emmen, Netherlands, in 2017. We can now provide both plastic granulates and filaments for 3D printing. These long, thin plastic fibers are used in fused filament fabrication, a special 3D printing process that manufactures items layer by layer from meltable plastic. Our competence in the area of material development for 3D processes is demonstrated by the filament Ultrafuse 316LX. It was specially developed for a new process on the market for metal printing and has been in use since 2017. The product makes it easier to print 3D metal parts inexpensively and reliably.
For more information on research and development, see basf.com/innovations
1 One petaflop is equal to one thousand trillion (1015) operations per second.

38 Management’s Report BASF Report 2017
Innovation
Innovations in the segments – examples
Research and development expenses by segment 2017
1 Chemicals 7%
2 Performance Products 21%
3 Functional Materials & Solutions 23%
4 Agricultural Solutions 27%
5 Oil & Gas 2%
6 Corporate research, Other 20%
Chemicals: Our specialty monomers enable innovation in our customers’ downstream applications. These include a new application with tertiary butylacrylate (tBA) in decorative paints. tBA is primarily used as a functional component in water-based exterior paints. Our customers can use tBA to fomulate dispersions that improve the specific properties of their exterior paints – such as weathering and surface adhe-sion – without increasing production costs. BASF’s constant stream of new ideas has secured its position as the technology leader and largest supplier of hy-drosulfites for over 100 years. These bleaching and reducing agents are used in paper production, for example. The new Adlite®, a hydrosulfite for the paper industry, testifies to our innovative strength. Adlite® improves the entire paper produc-tion process and makes it more flexible. It enables our cus-tomers to achieve a higher degree of whiteness with the same raw materials and in this way, manufacture higher quality pa-per. At the same time, Adlite® saves energy and mitigates the impact on the environment, resulting in lower wastewater res-idues. BASF is one of the leading global providers in the field of gas treatment. Our OASE® brand portfolio ranges from gas treatment agents to licenses for gas treatment processes and the planning of plants. We have further developed our busi-ness model and systematically expanded our service offering with the new OASE® connect online platform, which is partic-ularly attractive for customers at remote locations. Special software enables them to find the optimum technical settings for their plants and manage them more efficiently, achieving energy savings of up to 20% in the form of electricity and steam and significantly reducing operating costs at the same plant output.
Performance Products: Acronal® 6292 is a new styrene acrylic binder that enables the production of more environ-mentally friendly scrub resistant interior wall paints. The poly-mer’s high pigment binding power also means that less binder is required to produce a scrub resistant paint. This offers a cost advantage for paint manufacturers. Acronal® 6292 can also be used to produce low-emission paints without biocides
– preservatives needed to prevent bacterial growth in tradition-al water-based paints. Fibroblasts are important cells in the skin, which contribute to skin regeneration. When they lose their vitality, the skin loses its resilience and elasticity. Dermagenist®, a marjoram leaf extract developed by BASF, restores the skin’s density and firmness. It inhibits the fibroblast ageing process and stimu-lates the cells to produce structural proteins in the connective tissue. Pronovum is a new BASF technology in the area of omega-3 food supplements. Intake of Omega 3 can help improve consumers’ coronary and cognitive health. Indepen-dent studies have shown that the body processes omega-3 fatty acids formulated with Pronovum four times better than conventional, highly concentrated omega-3 fatty acids in the form of the chemical compound ethyl ester. Pronovum is a patented mixture of omega-3 oils in a new formulation that can be accessed much better by digestive enzymes. “Cool roofs” are more reflective and so do not heat up as much in direct sunlight. Roofing membranes made from thermo plastic polyolefins (TPO) are an energy-saving and cost - efficient solution here. BASF now offers new plastic additive systems that are customized for such TPO roof membrane applications. Combinations of the light stabilizers Chimassorb® and Tinuvin®, the antioxidants Irganox® and Irgafos® as well as customer-specific plastic additive mixtures with minimal dust formation protect TPO membranes from the damaging effects of sunlight, extending their lifetime by up to 30 years.
Functional Materials & Solutions: Formaldpure® is a new catalyst from BASF, which removes the pollutant formaldehyde at room temperature with high conversion efficiency. It is suit-able for use in a wide range of portable and large-scale air purification equipment. Formaldehyde is used in the manufac-ture of building materials and household products, so it is found in homes and buildings as an indoor pollutant. BASF’s Formaldpure® is a thorough, long-life technology that removes formaldehyde from indoor environments and reduces the costs otherwise associated with frequent filter changes. BASF’s MasterSeal 7000 CR waterproofing system pro-tects concrete structures in wastewater and biogas plants exposed to high concentrations of chemicals such as sulfuric acid. MasterSeal 7000 CR bridges cracks in concrete to prevent penetration by aggressive substances. This prolongs the lifetime of concrete structures, contributes to sustainable water management and simultaneously reduces maintenance costs. MasterSeal 7000 CR is easy to work with and even adheres to humid substrates. The quick hardening time allows water contact only 24 hours after application, reducing down-times – an important factor in wastewater management.
1
2
34
5
6
€1,888 million

BASF Report 2017 Management’s Report
Innovation 39
Thanks to the biomass balance method developed by BASF, we are able to flexibly replace fossil resources in our current Verbund system with sustainably generated bio-based raw materials by feeding biogas and bionaphtha directly into the value chain at the very beginning. The first biomass-balanced products have now been introduced in the area of automotive refinish coatings. The share of raw materials replaced by renewable raw materials in the Production Verbund is allocated to certain refinish coating products according to certified methods. Coatings in this category add ecological value by saving on fossil-based raw materials while maintaining their usual qualities. The specialty polyamide Ultramid® Deep Gloss picks up on the trend toward higher quality and functionalized surfaces in car interiors. Ultramid® Deep Gloss is suitable for high gloss yet resistant components without the need for coating. It offers excellent resistance to scratching along with high chemical and good UV resistance. The material reproduces even the smallest structures true to detail, making haptic design elements and intuitive user interfaces possible – similar to a touchscreen. Demand for new operating concepts like this will continue to grow in the transition to autonomous driving. Ultramid® Deep Gloss also takes into account the automotive industry’s demands with respect to emissions and odor.
Agricultural Solutions: We are working with farmers around the globe to improve the quality and yield of their agricultural production while taking societal expectations and require-ments into consideration. To achieve this, we constantly invest in our development pipeline in order to expand our portfolio both in and beyond conventional crop protection – such as in biological solutions. In 2017, we invested €507 million in research and development in the Crop Protection division, representing around 9% of sales for the segment. Our well-stocked innovation pipeline comprises products with a launch date between 2017 and 2027. With a peak sales potential1 of €3.5 billion, the pipeline includes innovations from all business areas. The first market launches of Revysol®, our new fungicide, are scheduled for the 2019 growing season following registration with the relevant authorities. A new her-bicide with a unique mode of action to control key weeds in
cereal should come on the market in 2019. The market intro-duction of the new insecticide Inscalis® to combat piercing- sucking pests is planned for 2018. Another new insecticide, Broflanilide, which helps farmers control chewing insects like potato beetles and caterpillars in specialty and field crops, should be on the market from 2020. In Functional Crop Care, we are pushing ahead with the market introduction of Velondis®, for example, a biological fungicide for seed treat-ment. This is planned for 2018. Digital innovations are also a key focus in the Crop Protec-tion division. One example from digital agriculture is the online platform Maglis® that was launched in 2016, which offers farmers agronomic information and combines this with IT solutions and expertise from BASF. Maglis® is used by farmers worldwide – and we are constantly enhancing it. We are already testing new applications such as the automated diagnosis of plant diseases based on photo analysis.
For more information on Revysol®, see page 82
Oil & Gas: The Wintershall Group concentrates its innovation- related activities on improving the success rate of exploration, developing technologies for reservoirs with challenging develop ment and production conditions, and increasing the recovery factor of reservoirs. Wintershall is working on the development of heat- resistant and salt-tolerant surfactants together with the Performance Chemicals division. These substances are used in enhanced oil recovery to mobilize the oil trapped in the pores of the rock. Conventional surfactants often cannot be used because of the high temperatures and high salt concen-trations of many reservoirs, especially in regions such as the Middle East, North Africa or in the North Sea. The research project is currently in the laboratory phase.
1 Peak sales describes the highest sales value to be expected in one year. For more information, see the Glossary on page 253

40 Management’s Report BASF Report 2017
Investments, acquisitions and divestitures
Investments, acquisitions and divestitures
€4,121 millionIn investments made in 2017
€243 millionUsed for
acquisitions in 2017
OptimizationOf our portfolio through
acquisitions, divestitures and cooperative partnerships
In addition to innovations, investments and acquisitions make a decisive contribution toward achieving our ambitious growth goals. We use targeted acquisitions to supplement our organic growth.
By investing in our plants, we create the conditions for our desired growth while constantly improving the efficiency of our production processes. For the period from 2018 to 2022, we have planned investments in property, plant and equipment1 totaling €19.0 billion. We also continue to develop our portfolio through acquisitions that promise above-average profitable growth, are driven by innovation, offer added value for our customers, and reduce the cyclicality of our earnings. Invest-ments and acquisitions alike are prepared by interdisciplinary teams and assessed using diverse criteria. In this way, we ensure that economic, environmental and social concerns are included in strategic decision-making.
For more information on our investments from 2018 onward, see page 124
Investments and acquisitions 2017 (million €)
Invest- ments
Acquisi-tions Total
Intangible assets 101 235 336
Thereof goodwill – 97 97
Property, plant and equipment2 4,020 8 4,028
Total 4,121 243 4,364
Investments
We invested €4,020 million in property, plant and equipment in 2017. Total investments were therefore €202 million lower than in the previous year and €434 million above the level of depreciation3 in 2017. Our investments in 2017 focused on the Chemicals, Functional Materials & Solutions and Oil & Gas segments. In Europe, we largely concluded the investment in our integrated TDI complex at the Ludwigshafen site. We will strengthen the Ludwigshafen Verbund site by replacing our acetylene plant, which occupies a central role for many products and value chains, with a modern, highly efficient plant by 2019. We are also constructing another production plant for special zeolites in Ludwigshafen. Special zeolites are used to produce state-of-the-art exhaust catalysts for commercial vehicles and passenger cars with diesel engines. Production startup is scheduled for 2019. At the site in Antwerp, Belgium, we completed the technical retrofitting of the superabsorbent plant, where the superabsorbent products Saviva® and HySorb® can be produced. In North America, we are constructing an ammonia production plant in Freeport, Texas, together with Yara Inter-national ASA, headquartered in Oslo, Norway. It is scheduled for completion in 2018. The expansion of the production facility for dicamba in Beaumont, Texas, is complete and operational. In Asia, we started up two large-scale plants in Shanghai, China, in 2017: one for chemical catalysts and another for automotive coatings together with our partner Shanghai Huayi Fine Chemical Co. Ltd., based in Shanghai, China. We built a new aroma ingredients complex at the integrated chemical site in Kuantan, Malaysia, together with our partner PETRONAS Chemicals Group Berhad, headquartered in Kuala Lumpur, Malaysia. It is in the process of being started up. In Gimcheon, South Korea, we are constructing a new plant for Ultraform® together with our partner Kolon Plastics Inc., head-quartered in Gimcheon, South Korea. The new plant is scheduled for completion in 2018. With these investments, we are expanding our presence in Asia. In the Oil & Gas segment, we invested primarily in field development projects in Argentina, Norway and Russia in 2017.
For more information on investments within the segments, see page 60 onward
1 Excluding additions to property, plant and equipment resulting from acquisitions, capitalized exploration, restoration obligations and IT investments2 Including capitalized exploration, restoration obligations and IT investments3 Including impairments and reversals of impairments

BASF Report 2017 Management’s Report
Investments, acquisitions and divestitures 41
2 BASF’s gas transportation business is not included in this shareholding ratio. As of closing, Wintershall DEA would issue a mandatory convertible bond to BASF reflecting the value of BASF’s gas transportation business.
Additions to property, plant and equipment1 by segment in 2017
1 Chemicals 28%
2 Performance Products 18%
3 Functional Materials & Solutions 22%
4 Agricultural Solutions 4%
5 Oil & Gas 24%
6 Other (infrastructure, R&D) 4%
Additions to property, plant and equipment1 by region in 2017
1 Europe 56%
2 North America 20%
3 Asia Pacific 18%
4 South America, Africa, Middle East 6%
1 Including capitalized exploration, restoration obligations and IT investments
Acquisitions
We added €8 million worth of property, plant and equipment through several acquisitions in 2017. Additions to intangible assets including goodwill amounted to €235 million.
For more information on acquisitions, see the Notes to the Consolidated Financial Statements from page 187 onward
On September 18, 2017, we signed an agreement with Solvay on the acquisition of Solvay’s global polyamide business. The aim is to close the transaction in the third quarter of 2018 after regulatory approvals have been obtained and the consent of a joint venture partner has been received. The acquisition would complement our engineering plastics portfolio and expand our position as a solutions provider for the transportation, con-struction and consumer goods industries as well as for other industrial applications. We plan to integrate the global poly amide business into the Performance Materials and Monomers divi-sions. The purchase price excluding adjustments is €1.6 billion. On October 13, 2017, we signed an agreement with Bayer AG, Leverkusen, Germany, on the acquisition of significant parts of Bayer’s seed and non-selective herbicide businesses. The agreement covers Bayer’s global glufosinate-ammonium non-selective herbicide business, commercialized under the Liberty®, Basta® and Finale® brands, as well as its seed businesses for key row crops in selected markets. The acquisition also covers Bayer’s trait research and breeding capabilities for these crops. Closing is expected in the first half of 2018, subject to Bayer’s acquisition of Monsanto and approval by the relevant authorities. The purchase price amounts to €5.9 billion, subject to certain adjustments at closing.
For more information on agreed transactions, see the Notes to the Consolidated Financial Statements from page 189 onward
Divestitures
On September 29, 2017, we transferred our leather chemicals business to the Stahl group. In return, we received a minority share in the Stahl group as well as a payment. Furthermore, in the medium to long term, we will supply the Stahl group with significant volumes of leather chemicals from remaining plants.
For more information on divestitures, see the Notes to the Consolidated Financial Statements from page 188 onward
Intended transactions
On December 7, 2017, we signed a letter of intent with the LetterOne group on the merger of our respective oil and gas businesses including BASF’s gas transportation business in a joint venture, which would operate under the name Winters-hall DEA. The merger is designed to optimize the portfolio footprint of the combined business and exploit synergies. Wintershall DEA would have significant growth potential and be one of the largest independent European exploration and production companies. BASF shall initially hold 67% and LetterOne 33% of the shares in Wintershall DEA.2 Following the closing of the transaction, we expect to account for our interest in the joint venture using the equity method in the Consolidated Financial Statements. In the medium term, BASF and LetterOne aim to list Wintershall DEA on the stock mar-kets by way of an initial public offering. The definitive transac-tion agreements are to be negotiated over the coming months. There is no assurance that we will reach an agree-ment with LetterOne and that the intended transaction will be consummated.
For more information, see page 86 onward
1
2
3
4
5
6
€4,020 million
1
2
3
4
€4,020 million

42 Management’s Report BASF Report 2017
Working at BASF
115,490Employees
around the world
Life-long learningOn center stage
3,103Apprentices1
in around 50 occupations
Our employees are key to implementing the “We create chemistry” strategy. We want to attract and retain talented people for our company and support them in their development. To do so, we cultivate a working environ-ment that inspires and connects people. It is founded on inclusive leadership based on mutual trust, respect and dedication to top performance.
Strategy
▪ Best Team Strategy focuses on excellent people, workplace and leaders
The Best Team Strategy is derived from our corporate strategy and plays a key role in achieving our goals. We want to form the best team. To achieve this, we focus on three strategic directions: excellent people, excellent place to work and excellent leaders. Emphasis is placed on our attractiveness in worldwide labor markets, personal and professional develop-ment, lifelong learning, and supporting and developing our leaders. We are committed to complying with internationally recognized labor and social standards worldwide. In addition, BASF reacts early to external trends and challenges such as the advance of globalization and the increasingly rapidly
changing environment, especially as this relates to the digitali-zation of work. The Best Team Strategy also addresses the balance needed between the inherently local nature of human resources issues and regional or global requirements (concept, structure, process) for the human resources topics that are of overriding importance for BASF.
Number of employees
At the end of 2017, BASF had 115,490 employees (2016: 113,830); of these, 3,103 were apprentices (2016: 3,120). The higher headcount was primarily due to the acquisitions of Grupo Thermotek, Monterrey, Mexico, Rolic AG, Allschwil, Switzerland, and the western European building material business for professional users from the Henkel group.
North America
South America,Africa,Middle East
18,29515.8%
71,65362.1%
7,2866.3%
24.6% 75.4% 71.9% 76.1% 74.1%28.1% 23.9% 25.9%
Europe
18,25615.8%
Asia Pacific
Germany: 54,020 (46.8%)23.7% women and 76.3% menBASF SE: 34,923 (30.2%)21.5% women and 78.5% men
BASF Group employees by region(Total: 115,490, thereof 24.6% women, as of December 31, 2017)
Working at BASF
1 At BASF, the apprenticeship program trains students for technical, scientific and business vocations as well as for trade and craft professions.

BASF Report 2017 Management’s Report
Working at BASF 43
Competition for talent
▪ Positioning as an attractive employer ▪ Focus on social media and online marketing
Our aim is to position BASF as an attractive employer and recruit qualified talent in the global competition for the best skilled employees and leaders. To this end, we are constantly working on measures to increase BASF’s appeal in the global labor markets and to help create a compelling total offer pack-age for employees. We are increasingly using digital platforms such as our country-specific career websites as well as global and regional social networks to reach potential candidates. This enables us to address specific target groups. For instance, we increased awareness of BASF among digital specialists in particular with a global campaign on various social media. In Brazil, we used Snapchat – a special instant messenger to send images and other media – for the first time in 2017 to directly address candidates for the trainee program and give them a better understanding of the company. In Germany, we held the first BASF hackathon. Around 50 university students solved a specific problem from our divisions within 24 hours and presented their solutions to a panel of BASF experts. In North America, the Diverse Leaders program was initiated to attract talented leadership candidates with an MBA from differ-ent backgrounds. We once again achieved high scores in a number of employer rankings in 2017. For example, in a study conducted by Universum, BASF was again selected by engi-neering and IT students as one of the 50 most attractive employers in the world. In North America, BASF was rated one of the top 50 employers on the employer rating website glass-door.com. In Asia, Top Employer recognized BASF China as one of the best employers for the seventh time in succession.
BASF Group new hires in 2017
December 31, 2017 Thereof women %
Europe 3,987 29.3
North America 2,002 30.1
Asia Pacific 2,141 24.9
South America, Africa, Middle East 786 38.8
Total 8,916 29.3
The BASF Group hired 8,916 new employees in 2017. The average percentage of employees who resigned during their first three years of employment was 1.3% worldwide in 2017. This turnover rate was 0.7% in Europe, 1.9% in North America, 3.0% in Asia Pacific and 2.1% in South America, Africa, Middle East. Our early turnover rate is therefore at a desirable low level.
Vocational training
▪ 3,103 apprentices in around 50 occupations worldwide ▪ Around €106 million spent on vocational training
Our vocational training plays a key role in securing qualified employees at our largest site in Ludwigshafen, Germany, as well as at many other Group companies. We give school students in the career orientation phase insights into different training paths with target group-specific measures such as the Wunschberuf im Praxistest (“Test Drive Your Dream Job”) day, which is held several times a year. Digitalization is also changing vocational training at BASF. Course content is adapted to include new Industry 4.0 topics such as modules on data management or automation, and modern communication technologies make new learning methods possible. Young people train for their future profes-sion in modern workshops and laboratories, where they use digital technologies from the start. In 2017, 831 apprentices started their vocational training at BASF SE and at German Group companies, filling almost all available vocational program slots in Germany. As of December 31, 2017, the BASF Group was training 3,103 people in 15 countries and around 50 occupations. We spent a total of around €106 million on vocational training in 2017.
BASF Group employees by contract type (total: 115,490)
December 31, 2017 Thereof women %
Permanent staff 109,837 24.1
Apprentices 3,103 24.3
Temporary staff 2,550 43.9
We also foster social integration, particularly of young low achievers and refugees. Examples of this include the Start in den Beruf, Anlauf zur Ausbildung and Start Integration programs in the Rhine-Neckar metropolitan region. In 2017, 284 young people in the BASF Training Verbund participated in these programs in cooperation with partner companies. The goal of these programs is to prepare participants for a subse-quent apprenticeship within one year, and ultimately secure the long-term supply of qualified employees in the region. Since being launched at the end of 2015, BASF’s Start Integration program has supported 250 refugees with a high probability of being granted the right to remain in Germany, helping to integrate them into the labor market. We spent around €6 million on the BASF Training Verbund in 2017 as part of our social commitment.
For more information, see basf.com/apprenticeship

44 Management’s Report BASF Report 2017
Working at BASF
What we expect from our leaders
▪ Leaders as role models ▪ Multifaceted offers for leadership development
Our leaders and their teams should make a sustainable contri-bution to BASF’s success and to safeguarding its future. We expect our leaders to serve as role models by developing and implementing business strategies in line with our corporate values. They should also have a positive impact on shaping day-to-day business, motivating employees and fostering their development. These expectations are part of the standard global nomination criteria for leadership candidates. Our lead-ership culture is founded on BASF’s strategic principles and values, which are set out in specific behavioral standards in the global Competency Model, as well as our global Code of Conduct. We offer our leaders learning and development opportuni-ties for all phases of their career, as well as various formats that enable them to share knowledge and learn from one another. Global, regional and local offerings are coordinated. For instance, the European Emerging Leader program pre-pares leadership candidates from all over Europe for a leader-ship role. The global New Leader Program is a basic qualifica-tion to get new leaders off to a good start in their new, more responsible role. The modular structure of the program means that it can be adapted to regional needs. One example of the development of experienced leaders is a program developed in North America where experienced leaders from BASF are brought together with leaders from other companies. This broadens participants’ perspectives, promotes dialog and builds networks beyond company borders. Regular feedback plays an important role in the develop-ment of leaders. One tool is Global Leadership Feedback, where leaders receive feedback from their employees, manag-ers, colleagues and customers on their conduct. Leadership responsibility in the BASF Group
December 31, 2017 Thereof women %
Professionals1 37,642 29.7
(Senior) executives2 9,388 20.5
1 Specialists without disciplinary leadership responsibilities2 Employees with disciplinary leadership responsibilities
Learning and development
▪ Life-long learning concept ▪ Focus on virtual learning and digitalization
Learning and development are essential success factors for a strong company culture. The skills and competencies of our employees are critical for profitable growth and lasting suc-cess. For this reason, we want to further modernize our learn-ing culture and step up our efforts to promote lifelong, self- directed learning as part of the Best Team Strategy. This learning culture is based on systematic employee development. In our understanding, there is more to develop-ment than a promotion or a job change – it encompasses all forms of further development of personal experience and abilities. We have derived specific day-to-day behavioral stan-dards from our corporate strategy and integrated these into our global Competency Model. In regular development meet-ings, which are held as part of our annual employee dialogs, employees outline prospects for their individual development together with their leaders and determine specific measures for further training and development, which focus on personal and professional competencies. We have now implemented our employee development concept worldwide using a struc-tured process and appropriate tools and have introduced personal development meetings for all employees. Our learning activities follow the “70-20-10” philosophy: We apply the elements “learning from experience” (70%), “learning from others” (20%) and “learning through courses and media” (10%). Our learning and development offerings cover a range of learning goals: starting a career, expanding knowledge, personal growth and leadership development. Virtual learning is playing an increasingly important role here. In Asia, a Virtual Week was held for the first time in 2017, where over 1,100 employees from 15 countries virtually discussed topics such digitalization, sustainability and change manage-ment. In addition, more and more of our academies in the divisions and functional units, which teach specific profession-al content, offer virtual training. One example of a successful development measure in the area of virtual learning is Virtual Presence, in which employees learn how to communicate effectively in virtual meetings in an increasingly digital world. Initially offered to leaders, this training will be available to all employees starting in 2018. In North America, we expanded our learning offering with a flexible and efficient new learning platform that offers compact modules for all employees.

BASF Report 2017 Management’s Report
Working at BASF 45
Inclusion of diversity
▪ Promoting diversity is part of our company culture
The strong global character of our markets translates into dif-ferent customer requirements – and we want to reflect this diversity in our workforce, too. For us, diversity is first and foremost about bringing together employees with different backgrounds who can draw on different perspectives to grow our business. At the same time, we want to better understand our customers’ expectations. Diversity also boosts our teams’ performance and power of innovation, and increases creativi-ty, motivation and identification with the company. Promoting diversity is an integral part of our corporate culture and as such, it is also anchored in the global Competency Model as one of the behaviors expected of employees and leaders. This is how we promote the appreciation and inclusion of diversity. Leaders play an important role in its implementation. We sup-port them by integrating topics such as inclusive leadership into our leadership development courses. Special seminars are held to sensitize leaders to the issue of unconscious bias. The aim is to help leaders remain as objective as possible when making personnel decisions, for example, to avoid unconscious biases in favor of or against candidates with certain characteristics or views.
2021 Goal
Proportion of women in leadership positions with disciplinary responsibility 22–24%
Since 2015, BASF has set itself global quantitative goals for increasing the percentage of women in leadership positions. In the BASF Group, the global proportion of female leaders with disciplinary responsibility was 20.5% at the end of 2017 (2016: 19.8%). We aim to increase this ratio to 22–24% worldwide by 2021, so that the proportion of women in leadership positions reflects that of women in the global company workforce. Con-sidering the relatively low rate of turnover in the BASF Group’s leadership team, this is an ambitious goal that we want to achieve through various measures. One example is the Karriere Plus program, which supports leaders and future leaders with young children in their professional development with mentoring, networking events and training. The mentors gain insights into successful models for flexible work and leadership. BASF has been a member of the Chefsache initia-tive since 2016, a network of leaders from industry, academia, the public sector and media. The initiative aims to initiate social change such as increasing the percentage of women in lead-ership positions in Germany. Furthermore, BASF wants to continue increasing the percentage of senior executives1 that
come from countries other than Germany. This figure was at 38.9% at the end of 2017 (2016: 36.4%). Moreover, we intend to maintain the proportion of senior executives with interna-tional experience at over 80%. We exceeded this figure again in 2017, reaching 84.6%. With these goals, we continue to drive our globally integrated approach to promoting diversity and leadership development.
For more information, see basf.com/diversity
For more information on diversity in the Board of Executive Directors and the Supervisory Board, see page 131 onward
Managing demographic change
▪ Leadership duties include “leadership in times of demographic change”
Our aim is to create a suitable framework to help maintain the employability of our personnel at all stages of life and ensure the availability of qualified employees – particularly in a techno-logical environment – over the long term. We are working intensively on future trends like new technologies and digitali-zation (Industry 4.0). We see digitalization as an opportunity to meet the challenges of demographic change. The demographic situation within the BASF Group varies widely by region. The ever-increasing delay of retirement and the aging employee population are relevant issues, particularly in Germany and North America. We address these different challenges with various measures to manage demographic change such as health and exercise programs, flexible work-ing arrangements, age-appropriate workplaces and knowl-edge management. Demographic analyses for our sites, for individual plants and specific job profiles make each demo-graphic situation transparent for the responsible leaders. For plants and profiles with a particularly critical age structure, we immediately derive specific measures such as direct knowl-edge transfer programs or succession planning. Given the special role that our leaders assume, the topic “leadership in times of demographic change” forms a part of many of our leadership programs.
For more information on health protection, see page 100
BASF Group employee age structure (Total: 115,490, thereof 24.6 % women, as of December 31, 2017)
Up to and including25 years
Between 26and 39 years
Between 40and 54 years
55 years and up
Men Women
38,412
8,151
47,478
21,449
72.3 %27.7 %
70.0 %
30.0 %
76.7 %
23.3 %
83.4 %
16.6 %
1 The term “senior executives” refers to leadership levels 1 to 4, whereby level 1 denotes the Board of Executive Directors. In addition, individual employees can attain senior executive status by virtue of special expertise.

46 Management’s Report BASF Report 2017
Working at BASF
Balancing personal and professional life
▪ Wide range of offerings for different phases of life
Our identity as an employer includes our belief in supporting our employees worldwide in balancing their personal and professional lives. We lay the foundation with a wide range of offerings to help our employees meet their individual needs and overcome challenges in different phases of life. We want to strengthen their identification with the company and bolster our position as an attractive employer in the competition for qualified personnel. Our offering includes flexible working hours, part-time employment and mobile working. Regional initiatives specifically address the needs of our employees at a local level. In the United States, a new family-friendly leave program was introduced in 2017 that enables employees to concentrate solely or primarily on their families for a certain period of time in important life-changing situations. Our Work-Life Management employee center in Ludwigshafen (LuMit) offers a number of services under one roof: childcare, fitness and health, social counseling and coaching as well as other programs to help employees balance professional and per-sonal life. We also provide social counseling at the Münster and Schwarzheide sites in Germany as well as in Asia, South Africa and North America to help employees overcome difficult life situations and maintain their employability.
Compensation and benefits
▪ Compensation based on employee’s position and individual performance as well as company’s success
We want to attract committed and qualified employees, retain them and motivate them to achieve top performance with an attractive package including market-oriented compensation, individual development opportunities and a good working envi-ronment. Our employees’ compensation is based on market-, position- and performance-related global compensation princi-ples. By linking compensation to both company and individual performance, employees can participate in the company’s success and be rewarded for their individual performance. As a rule, compensation comprises fixed and variable components as well as benefits that often exceed legal requirements. In many countries, these include company pension benefits, supplementary health insurance and share programs. We reg-ularly review our compensation systems at local and regional levels.
Employees participate in the company’s success
▪ Return on assets determines variable compensation
We want our employees to contribute to the company’s long-term success. This is why the compensation granted to vast majority of our employees includes variable compensation components, with which they participate in the success of the BASF Group as a whole and are recognized for their individual performance. The same principles basically apply for all employees worldwide. The amount of the variable component is determined by the company’s economic success (measured by the return on assets¹ of the BASF Group) as well as the employee’s individual performance. Individual performance is assessed as part of a globally consistent performance manage ment process. In numerous BASF Group companies, employees are offered the chance to purchase shares. Our plus share program ensures employees’ long term participation in the company’s success through incentive shares: A portion of the variable compensation can be invested in BASF shares in order to profit from BASF’s long-term development. In 2017, for example, 23,700 employees worldwide (2016: approx-imately 24,000) participated in the plus share program. BASF offers senior executives the opportunity to partici-pate in a share price-based compensation program. This long term incentive (LTI) program ties a portion of their annual variable compensation to the long term performance of BASF shares by making an individual investment in the company’s stock. In 2017, 92% of the approximately 1,200 people eligible to participate in the LTI program worldwide did so, investing up to 30% of their variable compensation in BASF shares.
For more information, see the Notes to the Consolidated Financial Statements from page 231 onward
Personnel expenses
In 2017, the BASF Group spent €10,610 million on wages and salaries, social security contributions and expenses for pen-sions and assistance (2016: €10,165 million). Personnel expenses thus rose by 4.4%. As well as wage and salary increases, this was primarily attributable to a higher average headcount following the acquisition of Chemetall. The partial release of provisions for the long-term incentive program and currency effects had an offsetting effect.
BASF Group personnel expenses (million €)
2017 2016Change
in %
Wages and salaries 8,471 8,170 3.7
Social security contributions and expenses for pensions and assistance 2,139 1,995 7.2
Thereof for pension benefits 705 627 12.4
Total personnel expenses 10,610 10,165 4.4
For more information, see the Notes to the Consolidated Financial Statements from page 200 onward
1 To calculate variable compensation, return on assets is adjusted for special effects.

BASF Report 2017 Management’s Report
Working at BASF 47
Global Employee Survey
The BASF Group’s Global Employee Survey is an important feedback tool and is used to actively involve employees in shaping their working environment. We have conducted the Global Employee Survey on a regular basis since 2008; the next one is scheduled for 2018. The results of the 2015 survey were presented to the Board of Executive Directors and the Supervisory Board. Employees and leaders in all regions then discussed the results and identified the necessary improve-ment measures. These related to topics such as supporting employees in their professional development, intensifying feedback, or supporting leaders and their teams in driving change and innovation.
Dialog with employee representatives
Trust-based cooperation with employee representatives is an important component of our corporate culture. Our open and ongoing dialog lays the foundation for balancing the interests of the company and its employees, even in challenging situa-tions. If restructuring leads to staff downsizing, for example, we involve employee representatives to develop socially responsible implementation measures at an early stage. This is done in accordance with the respective legal regulations and the agreements reached. It is important to us that this dialog is based on the specific operational situation. For example, in 2017 we developed a qualification concept and derived quali-fication measures from this together with the employee repre-sentatives at the Ludwigshafen site to familiarize employees with new digital working practices in production and support the introduction of applications for mobile devices. By focusing our discussions on the local and regional situations, we aim to find tailored solutions to the different challenges and legal considerations for each site. The BASF Europa Betriebsrat (European Works Council) addresses cross-border matters in Europe. The Diálogo Social has established a platform for dialog in South America.
For more information, see basf.com/employeerepresentation
Global labor and social standards
▪ Alignment with U.N. Guiding Principles on Business and Human Rights
▪ Adjusted management process for monitoring adherence to labor and social standards
As an integral part of society, we act responsibly toward our employees. Part of this is our voluntary commitment to respecting international labor and social standards, which we have embedded in our global Code of Conduct. This encom-passes internationally recognized labor norms as stipulated in the United Nations’ Universal Declaration of Human Rights, the OECD Guidelines for Multinational Enterprises, and the Tripartite Declaration of Principles Concerning Multinational Enterprises and Social Policy of the International Labour Orga-nization (ILO). BASF is committed to upholding these stan-dards worldwide. We mainly approach our adherence to inter-national labor and social standards using three elements: the Compliance Program (including external compliance hotlines), close dialog with our stakeholders (such as with employee representatives or international organizations) and the global management process for the respect of international labor norms. We completed the restructuring of our management pro-cess in 2017. A Group-wide guideline now sets out a BASF standard for compliance with international labor and social standards.1 A compliance risk management process monitors its implementation. We completed a risk-based assessment of all the countries in which BASF operates by the end of 2017. In countries where the guideline cannot be readily implement-ed because of national laws, rules or practices, we will evaluate to what extent meaningful adaptations can be made within the scope of local requirements. A centralized due diligence system is used to regularly assess and document this information, as well as the set targets and measures to implement the guide-line. Starting in 2018, the degree of compliance with the guideline in BASF Group companies will be reviewed using internal control processes such as compliance audits.
For more information on labor and social standards, see basf.com/labor_social_standards
For more information on global standards, see page 24
For more information on our sustainability-related risk management, see page 29
For more information on compliance, see page 135 onward
1 The guideline provides concrete interpretations for the topics outlined in the global Code of Conduct under “Human Rights and International Labor Standards.”

48 Management’s Report BASF Report 2017
The BASF Group business year — Economic environment
The BASF Group business yearEconomic environment
3.1%Growth in global gross
domestic product
3.3%Growth in global
industrial production
3.5%Growth in the global
chemical industry
Global economic expansion in 2017 was stronger than we expected at the beginning of 2017. Both the advanced economies and the emerging markets posted significantly higher growth compared with the previous year. The economy gained momentum in almost all European Union (E.U.) countries. In China, economic growth was slightly stronger than in the previous year on the back of govern-ment investment incentives. This benefited the neighbor-ing Asian countries in particular. China’s robust economy also had a positive impact on raw materials exporters worldwide, enabling Russia and Brazil to shake off reces-sion, for example. Overall, global gross domestic product (GDP) grew by 3.1%, significantly faster than in 2016 (+2.4%). The average price for a barrel of Brent blend crude oil rose to $54 per barrel (2016: $44 per barrel).
For the outlook on the economic environment in 2018, see page 119 onward
Trends in the global economy in 2017
After moderate growth in the previous year, the global economy improved steadily in 2017. This trend was supported by monetary and fiscal policy framework conditions. Interest rates remained at a very low level in Europe and Japan. In the United States, the Federal Reserve’s policy rate hikes only led to a moderate increase in long-term interest rates. Global prices for industrial and energy raw materials rose moderately, which helped to stabilize the economic situation in the exporting countries. At the same time, the price level remained low enough so as not to dampen economic development in the importing countries. Consumer and investor sentiment contin-ued to brighten against this backdrop.
Gross domestic product (Real change compared with previous year1)
World 2017 3.1%
2016 2.4%
European Union 2017 2.5%
2016 1.9%
United States 2017 2.3%
2016 1.5%
Emerging markets of Asia
2017 6.3%
2016 6.1%
Japan 2017 1.6%
2016 0.9%
South America 2017 0.8%
2016 (2.9%)
1 Figures that refer to previous years may deviate from last year’s report due to statistical revisions.
Economic trends by region
▪ Stronger economic growth in the E.U. ▪ Economy firms in the United States ▪ Stable growth in Asia ▪ Slight recovery in South America
In the E.U., GDP growth rose from 1.9% in 2016 to 2.5% in 2017. The upturn extended to almost all E.U. countries and was supported by higher consumption and growing invest-ment. Driven by the more stable global economy, export activ-ities also provided positive momentum. Germany’s economy saw comparatively strong growth, at 2.5%. Growth rates in France (+1.9%) and Italy (+1.5%) also exceeded the previous years’ averages. The independence conflict in Catalonia has had little impact on the Spanish economy (+3.1%) so far. Growth in the United Kingdom (+1.8%) remained on a level with the previous year amid uncertainty about the further course of Brexit negotiations and rising inflation. The central and eastern E.U. countries recorded dynamic growth of 4.5% thanks to the upturn at trading partners in western Europe and the higher absorption of E.U. funds. Russia’s GDP rose by 1.7% after a slight decline in the previous year, primarily due to the recovery in the price of oil and the stabilization of the ruble.

BASF Report 2017 Management’s Report
The BASF Group business year — Economic environment 49
In the United States, growth remained modest at the begin-ning of 2017 but stabilized over the course of the year. This was mainly attributable to strong private consumption on the back of the solid labor market situation. Higher levels of invest-ment also contributed to the positive economic trend. The hurricanes in Texas and Florida in the fall did not dampen growth significantly. Overall, the U.S. economy expanded by 2.3% in 2017, considerably faster than in 2016 (+1.5%). At 6.3%, growth in the emerging markets of Asia was slightly higher than in the previous year (+6.1%). In China, government investment incentives compensated for a slow-down. The Chinese economy grew by 6.9% overall, slightly faster than in 2016 (+6.7%). In 2017, this was primarily driven by the electronics industry, while the automotive industry saw much slower growth than in the previous year. The robust upward trend in the Chinese construction industry weakened only slightly. Against this background, GDP in the remaining emerging markets of Asia rose by 5.5% (2016: +5.3%). Japan saw much stronger growth than in the previous year, at 1.6% (2016: +0.9%). The weaker yen and the recovery of the global economy stimulated demand for Japanese exports. Private consumption was buoyed by the strong labor market and a declining savings rate. South America overcame the severe recession of the previous year, with GDP rising by 0.8% (2016: −2.9%). In Argen tina, the economy picked up significantly as a result of economic reforms and grew by 2.8% (2016: −2.2%). The Brazilian economy also expanded, with growth of 1.0% (2016: −3.6%) on the back of higher agricultural exports and an increase in industrial production. With the exception of Vene-zuela, where the economy again contracted significantly, aver-age growth in the other countries in the region was on a level with the previous year.
Trends in key customer industries
▪ Growth in global industrial production significantly higher than in 2016
▪ Mixed trends in key customer sectors
Global industrial production grew by 3.3% in 2017, significant-ly faster than in the previous year (+2.1%). Growth in the advanced economies accelerated particularly strongly (2017: +2.6%; 2016: +0.8%) and the emerging markets also posted a slight increase (2017: +4.0%; 2016: +3.5%). The uptick in growth was especially pronounced in the E.U. (2017: +3.3%; 2016: +1.4%) and Japan (2017: +3.9%; 2016: +0.3%). North America saw noticeable growth based on the low prior-year level (2017: +1.6%; 2016: +0.3%). In the emerging markets of Asia, growth in industrial production was down slightly on the previous year, at 5.5% (2016: +5.8%). Industry growth remained stable in China but cooled some-what in the other countries. At 0.2%, industrial production in South America returned to slow growth (2016: −4.6%).
The chemical industry’s key customer sectors saw very mixed trends: Global automotive production only grew by 2.5% in 2017, considerably less than in the previous year (+4.8%). Growth declined in both China and western Europe; automo-tive production contracted in the United States. By contrast, the industry experienced an upturn in Japan. Compared with the low prior-year level, production increased significantly in Brazil and Russia. At 2.9%, growth in the construction indus-try was down only slightly compared with the previous year (+3.1%). The E.U. saw a strong increase in construction activ-ity. Growth in the United States again slowed considerably. Housing construction expanded strongly, while construction of other structures declined slightly. There was a significant decline in infrastructure investment. In Asia, growth in the construction industry was slightly slower but remained at a high level. After weather-related weaknesses in the previous year, agricultural output again rose by around 3.1%. Starting from a low base, South America in particular saw a recovery (2017: +8.8%; 2016: −3.4%).
Growth in key customer industries (Real change compared with previous year 1)
Industry total 2017 3.3%
2016 2.1%
Transportation 2017 2.6%
2016 2.7%
Energy andresources
2017 1.6%
2016 0.2%
Construction 2017 2.9%
2016 3.1%
Consumer goods 2017 3.1%
2016 2.3%
Electronics 2017 7.9%
2016 4.5%
Health and nutrition 2017 4.1%
2016 3.6%
Agriculture 2017 3.1%
2016 1.7%
1 Figures that refer to previous years may deviate from last year’s report due to statistical revisions.

50 Management’s Report BASF Report 2017
The BASF Group business year — Economic environment
Trends in the chemical industry
▪ Global growth in line with expectations
The global chemical industry (excluding pharmaceuticals) grew by 3.5%, roughly on a level with our expectations at the beginning of 2017 (+3.4%) as well as the 2016 level (+3.4%). Chemical production in the E.U. expanded at a much faster rate as a result of growing demand from local customer indus-tries and higher exports (2017: +3.8%; 2016: +0.4%). By contrast, the chemical industry in Asia saw lower growth (2017: +4.1%; 2016: +5.2%). Unusually strong growth in Japan, primarily from higher exports to China, was unable to completely offset the decline of growth in China. In North America, chemical production was negatively impacted by Hurricane Harvey, which led to significant production outages in the United States in the third quarter. Chemical production in the United States nevertheless rose by 2.9%. Chemical production (excluding pharmaceuticals) (Real change compared with previous year1)
World 2017 3.5%
2016 3.4%
European Union 2017 3.8%
2016 0.4%
United States 2017 2.9%
2016 1.0%
Emerging markets of Asia
2017 3.8%
2016 5.8%
Japan 2017 7.2%
2016 1.7%
South America 2017 0.5%
2016 (0.8%)
1 Figures that refer to previous years may deviate from last year’s report due to statistical revisions.
Important raw material price developments
▪ Higher prices for crude oil and naphtha ▪ Year-on-year increase in gas prices, but with wide
regional variance
Averaging around $54 per barrel in 2017, the price of Brent blend crude oil rose by about 23% compared with the previ-ous year ($44 per barrel). The average monthly oil price fluctu-ated over the course of the year between $47 per barrel in June and $64 per barrel in December. The average monthly price for the chemical raw material naphtha ranged over the course of 2017 between $401 per metric ton in June and $576 per metric ton in December. At $485 per metric ton, the annualized average price of naphtha in 2017 was higher than in 2016 ($385 per metric ton). The average price of gas in the United States was $2.97 per mmBtu, above the level of the previous year ($2.49 per mmBtu). In Europe, the average price of gas on the spot market was significantly higher than in 2016, at $5.71 per mmBtu (2016: $4.62 per mmBtu).2 Gas prices in China aver-aged around $6.24 per mmBtu nationally (2016: $6.54 per mmBtu), while the average price in the coastal regions was $7.43 per mmBtu (2016: $7.72 per mmBtu).
Price trends for crude oil (Brent blend) and naphtha ($/barrel, $/metric ton)
ø 2017: $54/bbl
ø 2016: $44bbl
ø 2017: $485/t
ø 2016: $385/t100
200
300
400
500
600
700
800
900
1,000
1,100
$/t
30
40
50
60
70
80
90
100
110
120
130
$/bbl
Naphtha Crude oil
2012 2013 2014 2015 2016 2017
2 In contrast to prior-year reports, we refer here to the prices quoted by the Title Transfer Facility (TTF) in the Netherlands. The TTF is the trading point with the largest trading volume for natural gas in Europe. The previously referenced average of several spot market prices in 2017 was $5.76 per mmBtu (2016: $4.58 per mmBtu).
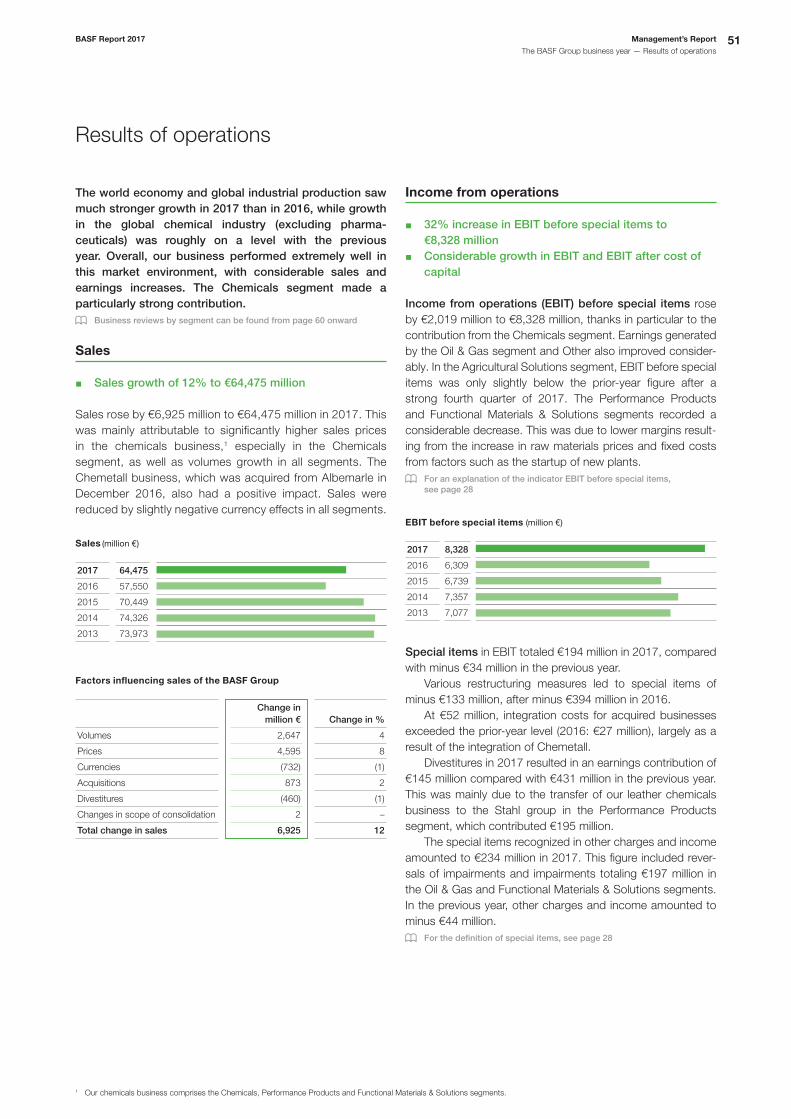
BASF Report 2017 Management’s Report
The BASF Group business year — Results of operations 51
Results of operations
The world economy and global industrial production saw much stronger growth in 2017 than in 2016, while growth in the global chemical industry (excluding phar ma-ceuticals) was roughly on a level with the previous year. Overall, our business performed extremely well in this market environment, with considerable sales and earnings increases. The Chemicals segment made a particularly strong contribution.
Business reviews by segment can be found from page 60 onward
Sales
▪ Sales growth of 12% to €64,475 million
Sales rose by €6,925 million to €64,475 million in 2017. This was mainly attributable to significantly higher sales prices in the chemicals business,1 especially in the Chemicals segment, as well as volumes growth in all segments. The Chemetall business, which was acquired from Albemarle in December 2016, also had a positive impact. Sales were reduced by slightly negative currency effects in all segments.
Sales (million €)
2017 64,475
2016 57,550
2015 70,449
2014 74,326
2013 73,973
Factors influencing sales of the BASF Group
Change in million € Change in %
Volumes 2,647 4
Prices 4,595 8
Currencies (732) (1)
Acquisitions 873 2
Divestitures (460) (1)
Changes in scope of consolidation 2 –
Total change in sales 6,925 12
Income from operations
▪ 32% increase in EBIT before special items to €8,328 million
▪ Considerable growth in EBIT and EBIT after cost of capital
Income from operations (EBIT) before special items rose by €2,019 million to €8,328 million, thanks in particular to the contribution from the Chemicals segment. Earnings generated by the Oil & Gas segment and Other also improved consider-ably. In the Agricultural Solutions segment, EBIT before special items was only slightly below the prior-year figure after a strong fourth quarter of 2017. The Performance Products and Functional Materials & Solutions segments recorded a consider able decrease. This was due to lower margins result-ing from the increase in raw materials prices and fixed costs from factors such as the startup of new plants.
For an explanation of the indicator EBIT before special items, see page 28
EBIT before special items (million €)
2017 8,328
2016 6,309
2015 6,739
2014 7,357
2013 7,077
Special items in EBIT totaled €194 million in 2017, compared with minus €34 million in the previous year. Various restructuring measures led to special items of minus €133 million, after minus €394 million in 2016. At €52 million, integration costs for acquired businesses exceeded the prior-year level (2016: €27 million), largely as a result of the integration of Chemetall. Divestitures in 2017 resulted in an earnings contribution of €145 million compared with €431 million in the previous year. This was mainly due to the transfer of our leather chemicals business to the Stahl group in the Performance Products segment, which contributed €195 million. The special items recognized in other charges and income amounted to €234 million in 2017. This figure included rever-sals of impairments and impairments totaling €197 million in the Oil & Gas and Functional Materials & Solutions segments. In the previous year, other charges and income amounted to minus €44 million.
For the definition of special items, see page 28
1 Our chemicals business comprises the Chemicals, Performance Products and Functional Materials & Solutions segments.

52 Management’s Report BASF Report 2017
The BASF Group business year — Results of operations
Sales and earnings (million €)
2017 2016 Change in %
Sales 64,475 57,550 12.0
Income from operations before depreciation and amortization (EBITDA) and special items 12,527 10,327 21.3
EBITDA 12,724 10,526 20.9
EBITDA margin % 19.7 18.3 –
Amortization and depreciation1 4,202 4,251 (1.2)
Income from operations (EBIT) 8,522 6,275 35.8
Special items 194 (34) .
EBIT before special items 8,328 6,309 32.0
Financial result (722) (880) 18.0
Income before taxes and minority interests 7,800 5,395 44.6
Income before minority interests 6,352 4,255 49.3
Net income 6,078 4,056 49.9
Earnings per share € 6.62 4.42 49.8
Adjusted earnings per share € 6.44 4.83 33.3
Sales and earnings by quarter in 20172 (million €)
1st quarter 2nd quarter 3rd quarter 4th quarter Full year
Sales 16,857 16,264 15,255 16,099 64,475
Income from operations before depreciation and amortization (EBITDA) and special items 3,507 3,291 2,793 2,936 12,527
EBITDA 3,502 3,233 3,007 2,982 12,724
Amortization and depreciation1 1,051 1,052 1,049 1,050 4,202
Income from operations (EBIT) 2,451 2,181 1,958 1,932 8,522
Special items (6) (70) 198 72 194
EBIT before special items 2,457 2,251 1,760 1,860 8,328
Financial result (152) (174) (185) (211) (722)
Income before taxes and minority interests 2,299 2,007 1,773 1,721 7,800
Net income 1,709 1,496 1,336 1,537 6,078
Earnings per share € 1.86 1.63 1.45 1.68 6.62
Adjusted earnings per share € 1.97 1.78 1.40 1.29 6.44
Sales and earnings by quarter in 20162 (million €)
1st quarter 2nd quarter 3rd quarter 4th quarter Full year
Sales 14,208 14,483 14,013 14,846 57,550
Income from operations before depreciation and amortization (EBITDA) and special items 2,843 2,674 2,490 2,320 10,327
EBITDA 2,812 2,790 2,437 2,487 10,526
Amortization and depreciation1 946 1,072 973 1,260 4,251
Income from operations (EBIT) 1,866 1,718 1,464 1,227 6,275
Special items (40) 11 (52) 47 (34)
EBIT before special items 1,906 1,707 1,516 1,180 6,309
Financial result (188) (177) (283) (232) (880)
Income before taxes and minority interests 1,678 1,541 1,181 995 5,395
Net income 1,387 1,092 888 689 4,056
Earnings per share € 1.51 1.19 0.97 0.75 4.42
Adjusted earnings per share € 1.64 1.30 1.10 0.79 4.83
1 Amortization of intangible assets and depreciation of property, plant and equipment (including impairments and reversals of impairments) 2 Quarterly results not audited

BASF Report 2017 Management’s Report
The BASF Group business year — Results of operations 53
Special items (million €)
2017 2016
Restructuring measures (133) (394)
Integration costs (52) (27)
Divestitures 145 431
Other charges and income 234 (44)
Total special items in EBIT 194 (34)
Special items reported in financial result – –
Total special items in income before taxes and minority interests 194 (34)
At €8,522 million, EBIT for the BASF Group in 2017 was considerably higher than the previous year’s level (2016: €6,275 million). Included in this figure is income from companies accounted for using the equity method, which rose from €307 million to €571 million.
EBIT (million €)
2017 8,522
2016 6,275
2015 6,248
2014 7,626
2013 7,160
We once again earned a significant premium on our cost of capital in 2017. EBIT after cost of capital amounted to €2,727 million, compared with €1,136 million in the previous year. The cost of capital rose by €364 million year-on-year. This was primarily attributable to the increase in noncurrent assets since the acquisition of Chemetall in December 2016, as well as the higher level of capital tied up in trade accounts receivable as a result of sales growth.
For an explanation of the indicator EBIT before special items, see page 28
The calculation of EBIT as part of our statement of income is shown in the Consolidated Financial Statements on page 168
EBIT after cost of capital (million €)
2017 2016
EBIT of BASF Group 8,522 6,275
– EBIT of Other (799) (1,091)
– Cost of capital1 6,594 6,230
EBIT after cost of capital 2,727 1,136
1 In 2016 and 2017, the cost of capital percentage was 10%.
EBIT after cost of capital (million €)
2017 2,727
2016 1,136
2015 194
2014 1,368
2013 1,768
Financial result and net income
▪ Considerable year-on-year increase in financial result and net income
▪ Earnings per share rise from €4.42 to €6.62
The financial result improved to minus €722 million in 2017, compared with minus €880 million in the previous year. Net income from shareholdings decreased from minus €17 million in 2016 to minus €29 million as a result of lower income from shareholdings. The interest result improved from minus €482 million in 2016 to minus €334 million. Interest expenses declined due to the overall decrease in liabilities to credit institutions, the scaling back of the U.S. dollar commercial paper program and the associated hedging transactions. We also generated higher interest income from interest/cross-currency swaps and granting loans. The other financial result amounted to minus €359 million, compared with minus €381 million in the previous year. Income before taxes and minority interests rose from €5,395 million in the previous year to €7,800 million in 2017. Income taxes increased from €1,140 million in 2016 to €1,448 million in 2017. At 18.6%, the tax rate was below the prior-year level (21.1%), mainly as a result of one-off deferred tax income in the total amount of €416 million from tax reforms, of which €379 million in the United States. Income before minority interests rose from €4,255 million to €6,352 million. Minority interests amounted to €274 million, compared with €199 million in 2016. At €6,078 million, net income was considerably higher than the prior-year figure of €4,056 million. Earnings per share increased from €4.42 to €6.62.
For information on the items in the statement of income, see the Notes to the Consolidated Financial Statements from page 194 onward
For information on the tax rate, see the Notes to the Consolidated Financial Statements from page 198 onward
Additional indicators for results of operations
▪ EBITDA before special items and EBITDA considerably higher
▪ Adjusted earnings per share increase from €4.83 to €6.44
Aside from EBIT, EBIT before special items and EBIT after cost of capital – key performance indicators drawn upon to steer the BASF Group – we also provide additional performance indicators in this report that are not defined by IFRS. They should not be viewed in isolation, but treated as supplementary information.

54 Management’s Report BASF Report 2017
The BASF Group business year — Results of operations
EBITDA before special items (million €)
2017 2016
EBIT 8,522 6,275
– Special items 194 (34)
EBIT before special items 8,328 6,309
+ Amortization, depreciation and valuation allowances on intangible assets and property, plant and equipment before special items 4,199 4,018
EBITDA before special items 12,527 10,327
EBITDA (million €)
2017 2016
EBIT 8,522 6,275
+ Amortization, depreciation and valuation allowances on intangible assets and property, plant and equipment 4,202 4,251
EBITDA 12,724 10,526
Income from operations before depreciation, amortization and special items (EBITDA before special items) and income from operations before depreciation and amortization (EBITDA) are indicators that describe operational performance independent of age-related amortization and depreciation of assets and extraordinary valuation allowances (impairments or reversals of impairments). Both figures are therefore particularly useful in cross-company comparisons. EBITDA before special items is also highly useful in making comparisons over time. EBITDA before special items rose by €2,200 million year-on-year to €12,527 million in 2017. At €12,724 million, EBITDA exceeded the prior-year figure by €2,198 million.
Return on assets (million €)
2017 2016
Income before taxes and minority interests 7,800 5,395
+ Interest expenses 560 661
Income before taxes and minority interests and interest expenses 8,360 6,056
Total assets as of January 1 76,496 70,836
Total assets as of December 31 78,768 76,496
Average assets employed 77,632 73,666
Return on assets % 10.8 8.2
We calculate return on assets as income before taxes and minority interests, plus interest expenses, as a percentage of average assets employed. This indicator reflects the return indepen dently of capital structure.
The return on assets was 10.8%, compared with 8.2% in the previous year. The considerable increase in income before taxes and minority interests with a simultaneous decrease in interest expenses more than offset the rise in average assets employed.
Adjusted earnings per share (million €)
2017 2016
Income before taxes and minority interests 7,800 5,395
– Special items 194 (34)
+ Amortization and valuation allowances on intangible assets 616 560
– Amortization and valuation allowances on intangible assets contained in special items 59 52
Adjusted income before taxes and minority interests 8,163 5,937
– Adjusted income taxes1 1,971 1,300
Adjusted income before minority interests 6,192 4,637
– Adjusted minority interests 277 197
Adjusted net income 5,915 4,440
Weighted average number of outstanding shares in thousands 918,479 918,479
Adjusted earnings per share € 6.44 4.83
Compared with earnings per share, this figure has been adjusted for special items as well as amortization of and valuation allowances (impairments and reversals of impair-ments) on intangible assets. Amortization of intangible assets primarily results from the purchase price allocation following acquisitions and is therefore of a temporary nature. The effects of these adjustments on income taxes and on minority interests are also eliminated. This makes adjusted earnings per share a suitable measure for making comparisons over time and predicting future profitability. In 2017, adjusted earnings per share amounted to €6.44 compared with €4.83 in the previous year.
For information on the earnings per share according to IFRS, see the Notes to the Consolidated Financial Statements on page 194
1 Income taxes in 2017 were also adjusted for the effects of the tax reform in the United States. Of this figure, €379 million related to deferred tax income and €27 million to current tax expenses.

BASF Report 2017 Management’s Report
The BASF Group business year — Results of operations 55
Actual development compared with outlook for 2017
In 2017, BASF Group sales rose considerably in line with our forecast. EBIT before special items also increased consider-ably in 2017 and was higher than the slight growth forecast at the beginning of the year. This was primarily attributable to the sales and earnings development in the Chemicals segment, which exceeded our expectations. As a result, we also saw considerable growth in EBIT in 2017, instead of the slight increase we had anticipated. We likewise recorded a consider-able increase in EBIT after cost of capital, contrary to our pre-diction of a considerable decrease. As well as the higher EBIT generated by the segments, this was also due to the cost of capital, which did not increase as strongly as expected due to currency effects.3
Sales in the Chemicals segment increased considerably as forecast, whereby we achieved higher prices than expected. EBIT before special items was expected to be on a level with the previous year. However, the higher margins, especially for the isocyanates business in the Monomers division, signifi-cantly exceeded our expectations. Margins were also stronger in the Petrochemicals and Intermediates divisions. As a result, EBIT before special items was considerably higher than the 2016 figure. We slightly increased sales in the Performance Products segment in line with our forecast. Contrary to our expecta-tions, there was a considerable decline – rather than a slight increase – in EBIT before special items. This was primarily attri butable to softer margins, mainly as a result of higher raw
materials prices, which would not be fully passed on via sales prices. Sales in the Functional Materials & Solutions segment rose considerably, as predicted. EBIT before special items did not increase slightly as expected, but declined considerably despite sales growth. The decrease was due to lower margins and higher fixed costs. We had forecast considerable growth for sales in the Agricultural Solutions segment. However, sales only rose slightly as the higher volumes were partially offset by price declines, particularly in South America, and negative currency effects. The lower average margin and the difficult market environment in Brazil had a stronger impact on earnings devel-op ment than anticipated. Our earnings were also reduced by the shutdowns of our production facilities in Beaumont, Texas, and Manatí, Puerto Rico, because of the hurricanes. As a result, EBIT before special items did not increase slightly, but declined slightly. In the Oil & Gas segment, sales and EBIT before special items rose considerably as expected. Both sales and EBIT before special items rose considerably in Other and thus corresponded to our forecast. In 2017, we invested a total of €3.7 billion in capital expen-ditures,4 less than the anticipated level of around €3.9 billion. Investments in the Chemicals and Oil & Gas segments in particular were below the values considered in our planning.
For information on our expectations for 2018, see page 122 onward
Forecast/actual comparison1
SalesIncome from operations (EBIT)
before special items
2017 forecast 2017 actual 2017 forecast 2017 actual
Chemicals considerable increase considerable increase at prior-year level considerable increase
Performance Products slight increase slight increase slight increase considerable decrease
Functional Materials & Solutions considerable increase considerable increase slight increase considerable decrease
Agricultural Solutions considerable increase slight increase slight increase slight decrease
Oil & Gas considerable increase considerable increase considerable increase considerable increase
Other considerable increase considerable increase considerable increase considerable increase
BASF Group considerable increase considerable increase slight increase2 considerable increase
1 For sales, “slight” represents a change of 1–5%, while “considerable” applies to changes of 6% and higher. “At prior-year level” indicates no change (+/–0 %). For earnings, “slight” means a change of 1–10%, while “considerable” is used for changes of 11% and higher. “At prior-year level” indicates no change (+/–0 %).
2 We most recently revised our forecast in October 2017 to a considerable increase in EBIT before special items.
3 We most recently revised our forecast in October 2017 to a significant increase in EBIT before special items, EBIT and EBIT after cost of capital.4 Excluding additions to property, plant and equipment resulting from acquisitions, capitalized exploration, restoration obligations and IT investments

56 Management’s Report BASF Report 2017
The BASF Group business year — Net assets
1 Including impairments and reversals of impairments
Net assets
Assets
▪ Growth in total assets primarily attributable to higher cash and cash equivalents
▪ Decline in noncurrent assets mainly due to currency effects
Total assets amounted to €78,768 million, up €2,272 million on the prior-year figure. Noncurrent assets decreased by €2,927 million to €47,623 mil lion, mostly as a result of currency effects. The value of intangible assets declined by €1,568 million to €13,594 million. Additions amounted to €336 million, €97 mil-lion of which was goodwill. Currency effects reduced intangible assets by €1,071 million, amortization1 by €616 million and disposals by €43 million. The value of property, plant and equipment declined by €1,155 million to €25,258 million. Additions amounted to €4,028 million, €4,020 million of which was attributable to investments. Depreciation1 reduced property, plant and equip-ment by €3,586 million, currency effects by €1,663 million and disposals by €118 million. Investments accounted for using the equity method rose by €68 million to €4,715 million. This was primarily due to the acquisition of a €184 million minority interest in the Stahl group, to which we transferred our leather chemicals business. Currency effects of minus €143 million in particular had an offsetting effect.
Other financial assets were on a level with the previous year, at €606 million. Deferred tax assets declined by €395 million to €2,118 million, primarily from the tax reform in the United States and lower provisions for pensions and similar obligations. Other receivables and miscellaneous assets rose by €122 million year-on-year to €1,332 million, mainly due to higher loan receivables. Current assets increased by €5,199 million to €31,145 mil-lion. This was largely attributable to cash and cash equivalents. At €6,495 million, these were up €5,120 million on the figure as of December 31, 2016 and were primarily increased in view of payment of the purchase prices for the planned acquisition of significant parts of the seed and non-selective herbicide businesses from Bayer and the global polyamide business from Solvay. The €238 million increase in trade accounts receivable was attributable to higher sales compared with the previous year. Inventories rose by €298 million; other receivables and miscellaneous assets increased by €27 million. Marketable securities declined by €484 million, mostly from the €500 mil-lion contribution to BASF Pensionstreuhand e.V., Ludwigs-hafen am Rhein, Germany.
For more information on the composition and development of individual asset items, see the Notes to the Consolidated Financial Statements from page 201 onward
Assets
December 31, 2017 December 31, 2016
Million € % Million € %
Intangible assets 13,594 17.3 15,162 19.8
Property, plant and equipment 25,258 32.0 26,413 34.5
Investments accounted for using the equity method 4,715 6.0 4,647 6.1
Other financial assets 606 0.8 605 0.8
Deferred tax assets 2,118 2.7 2,513 3.3
Other receivables and miscellaneous assets 1,332 1.7 1,210 1.6
Noncurrent assets 47,623 60.5 50,550 66.1
Inventories 10,303 13.1 10,005 13.1
Accounts receivable, trade 11,190 14.2 10,952 14.3
Other receivables and miscellaneous assets 3,105 3.9 3,078 4.0
Marketable securities 52 0.1 536 0.7
Cash and cash equivalents 6,495 8.2 1,375 1.8
Current assets 31,145 39.5 25,946 33.9
Total assets 78,768 100.0 76,496 100.0

BASF Report 2017 Management’s Report
The BASF Group business year — Financial position 57
Financial position
Equity and liabilities
▪ Equity ratio at 44.1%, compared with 42.6% in previous year
▪ Higher financial indebtedness in preparation for planned acquisitions
Equity rose by €2,188 million year-on-year to €34,756 million. Retained earnings increased by €3,311 million to €34,826 mil-lion. Other comprehensive income declined by €1,268 million to minus €5,282 million. This decrease was mainly due to currency effects, primarily as a result of the weaker U.S. dollar. The remeasurement of defined benefit plans in particular had an offsetting effect. The equity ratio was 44.1% (2016: 42.6%). Compared with the end of 2016, noncurrent liabilities grew by €521 million to €29,132 million. This was primarily attribut-able to noncurrent financial indebtedness, which increased by €2,990 million. New bonds in EUR, USD, NOK and GBP were issued in 2017 with an aggregate carrying amount of €4,852 mil-lion at the year-end and maturities of between two and 20 years; they serve general company purposes and to finance the planned acquisitions of significant parts of the seed and non -selective herbicide businesses from Bayer and the global poly-amide business from Solvay. These also included bonds with nondilutive warrants due in 2023 with a carrying amount of €664 million. Upon exercise, the warrants will be cash-settled only; no new shares will be issued, nor will existing shares of BASF SE be serviced. As a hedge, BASF has purchased corresponding call options. Three eurobonds due in 2018 with
an aggregate carrying amount of €1,773 million were reclassi-fied to current financial indebtedness. Noncurrent liabilities to banks rose by €170 million, mainly as a result of loans taken out with the European Investment Bank and the Kreditanstalt für Wieder aufbau, a German government development bank. The partial transfer of the financing for gas transportation activities to a newly established equity-accounted company had an offsetting effect. Provisions for pensions and similar obligations decreased by €1,916 million, mainly as a result of the positive per formance of plan assets. Noncurrent other provisions declined by €189 million. The €586 million decrease in deferred tax liabilities was largely due to the reduction in the U.S. corpor ate tax rate from 35% to 21%, which accounted for €653 million of this figure. Noncurrent other liabilities rose by €222 million. Current liabilities declined by €437 million to €14,880 million. This was primarily attributable to the €1,270 million decrease in current financial indebtedness, mostly from the scheduled repayment of four bonds in EUR and GBP with an aggregate carrying amount of €1,359 million, as well as the the complete scaling back of our U.S. dollar commercial paper program, which accounted for €1,033 million. Current liabilities to banks declined by €646 million; this mainly related to loans in Brazil. The reclassification of the above bonds increased current finan-cial indebtedness accordingly. Current tax liabilities declined by €169 million. Trade accounts payable rose by €361 million, current provisions by €427 million and current other liabilities by €214 million.
Equity and liabilities
December 31, 2017 December 31, 2016
Million € % Million € %
Paid-in capital 4,293 5.4 4,306 5.6
Retained earnings 34,826 44.2 31,515 41.2
Other comprehensive income (5,282) (6.7) (4,014) (5.2)
Minority interests 919 1.2 761 1.0
Equity 34,756 44.1 32,568 42.6
Provisions for pensions and similar obligations 6,293 8.0 8,209 10.7
Other provisions 3,478 4.4 3,667 4.8
Deferred tax liabilities 2,731 3.5 3,317 4.3
Financial indebtedness 15,535 19.7 12,545 16.4
Other liabilities 1,095 1.4 873 1.2
Noncurrent liabilities 29,132 37.0 28,611 37.4
Accounts payable, trade 4,971 6.3 4,610 6.0
Provisions 3,229 4.1 2,802 3.7
Tax liabilities 1,119 1.4 1,288 1.7
Financial indebtedness 2,497 3.2 3,767 4.9
Other liabilities 3,064 3.9 2,850 3.7
Current liabilities 14,880 18.9 15,317 20.0
Total equity and liabilities 78,768 100.0 76,496 100.0

58 Management’s Report BASF Report 2017
The BASF Group business year — Financial position
Overall, financial indebtedness grew by €1,720 million to €18,032 mil lion. Net debt declined by €2,916 million to €11,485 million. This is calculated by subtracting marketable securities and cash and cash equivalents from current and noncurrent financial indebtedness. This balance-related indi-cator provides information on effective indebtedness.
For more information on the composition and development of individual equity and liability items, see the Notes to the Consolidated Financial Statements from page 209 onward
For more information on the development of the balance sheet, see the Ten-Year Summary on page 248
Net debt (million €)
Dec. 31, 2017 Dec. 31, 2016
Noncurrent financial indebtedness 15,535 12,545
+ Current financial indebtedness 2,497 3,767
Financial indebtedness 18,032 16,312
– Marketable securities 52 536
– Cash and cash equivalents 6,495 1,375
Net debt 11,485 14,401
Financing policy and credit ratings
▪ Financing principles remain unchanged ▪ “A” ratings confirmed
Our financing policy is aimed at ensuring our solvency at all times, limiting the risks associated with financing and optimiz-ing our cost of capital. We preferably meet our external financ-ing needs on the international capital markets. We strive to maintain at least a solid “A” rating, which ensures unrestricted access to financial and capital markets. Our financing measures are aligned with our operational busi-ness planning as well as the company’s strategic direction and also ensure the financial flexibility to take advantage of strate-gic options.
Maturities of financial indebtedness (million €)
2018 2,497
2019 2,052
2020 1,845
2021 1,140
2022 1,781
2023 and beyond 8,717
Rated “A1/P-1/outlook stable” by Moody’s, “A/A-1/outlook stable” by Standard & Poor’s and “A/S-1/outlook stable” by Scope, BASF enjoys good credit ratings, especially compared with competitors in the chemical industry. These ratings were most recently confirmed by the above agencies in the fourth quarter of 2017 (Moody’s: December 19; Standard & Poor’s and Scope: October 18).
We have solid financing. Corporate bonds form the basis of our medium to long-term debt financing. These are issued in euros and other currencies with different maturities as part of our €20 billion debt issuance program. The goal is to create a balanced maturity profile, diversify our investor base and optimize our debt capital financing conditions. For short-term financing, we use BASF SE’s U.S. dollar commercial paper program, which has an issuing volume of up to $12.5 billion. As of December 31, 2017, no commercial paper was outstanding under this program (December 31, 2016: $1,089 million). Firmly committed, syndicated credit lines of €6 billion serve to cover the repayment of outstanding com-mercial paper, and can also be used for general company pur-poses. These credit lines were not used at any point in 2017. Our external financing is therefore largely independent of short-term fluctuations in the credit markets.
Financing instruments (million €)
1 Bonds and other liabilities to the capital market 15,653
2 U.S. dollar commercial paper –
3 Liabilities to banks 2,379
Off-balance-sheet financing tools, such as leasing, are of minor importance to us. BASF Group’s most important finan-cial contracts contain no side agreements with regard to specific financial ratios (financial covenants) or compliance with a specific rating (rating trigger).
For more information on the financing tools used, see Note 24 from page 218 onward and Note 27 from page 222 onward in the Notes to the Consolidated Financial Statements
To minimize risks and exploit internal optimization potential within the Group, we bundle the financing, financial invest-ments and foreign currency hedging of BASF SE’s subsidiaries within the BASF Group where possible. Foreign currency risks are primarily hedged centrally by means of derivative financial instruments in the market. Our interest risk management generally pursues the goal of reducing interest expenses for the BASF Group and limiting interest risks. Interest rate hedging transactions are therefore conducted with banks in order to turn selected liabilities to the capital market from fixed interest to variable rates or vice versa.
1
3
€18,032 million

BASF Report 2017 Management’s Report
The BASF Group business year — Financial position 59
Statement of Cash Flows
▪ Cash provided by operating activities and free cash flow significantly above previous year
Cash provided by operating activities improved by €1,068 million year-on-year to €8,785 million in 2017. This was due to higher net income. In contrast with the previous year, the change in net working capital reduced cash flow. This was largely attributable to the higher level of cash tied up in inventories and trade accounts receivable for operational reasons. Miscellaneous items in 2017 mainly related to the adjustment of earnings contributions from investments accounted for using the equity method. In the previous year, this item primarily included the transfer of disposal gains to cash used in investing activities. Cash used in investing activities amounted to €3,958 million in 2017 compared with €6,490 million in 2016. Payments made for property, plant and equipment and intan-gible assets amounted to €3,996 million, below both the prior- year figure (€4,145 million) and the level of amortization and depreciation of intangible assets, property, plant and equip-ment, and financial assets (€4,213 million). Acquisitions and divestitures in 2017 resulted in net pay-ments received of €27 million. In comparison, net payments of €2,164 million were made in 2016, primarily as a result of the acquisition of Chemetall. The cash inflow from financial assets and other items in 2017 amounted to €11 million. In the previous year, the acqui-sition of marketable securities in particular led to net payments made of €181 million.
For more information on investments and acquisitions, see page 40 onward
Cash provided by financing activities amounted to €394 mil lion in 2017, compared with cash used in financing activities of €2,160 million in the previous year. Changes in financial liabilities resulted in a cash inflow of €3,248 million. This was mainly due to the issue of bonds with a volume of around €5 billion. The main offsetting factors were the sched-uled repayment of four bonds and the scaling back of BASF SE’s U.S. dollar commercial paper program. In 2017, dividends of €2,755 million were paid to shareholders of BASF SE and €118 million to minority interests. Cash and cash equivalents amounted to €6,495 million as of December 31, 2017. They rose by a cash-effective amount of €5,221 million in 2017, largely in preparation for payment of the purchase prices for the planned transactions with Bayer and Solvay. Free cash flow represents the financial resources remain-ing after deducting payments made for property, plant and equipment and intangible assets from cash provided by operating activities. It rose to €4,789 million compared with €3,572 million in the previous year, primarily due to the increase in cash provided by operating activities.
Cash flow (billion €)
Cash provided by operating activities Payments made for property, plant and equipment and intangible assets1
Free cash flow
1 Including investments to the extent that they already had an effect on cash
201720162015201420130
2
4
6
10
8
Statement of cash flows (million €)
2017 2016
Net income 6,078 4,056
Depreciation and amortization of intangible assets, property, plant and equipment, and financial assets 4,213 4,291
Changes in net working capital (1,167) 104
Miscellaneous items (339) (734)
Cash provided by operating activities 8,785 7,717
Payments made for property, plant and equipment and intangible assets (3,996) (4,145)
Acquisitions/divestitures 27 (2,164)
Financial assets and other items 11 (181)
Cash used in investing activities (3,958) (6,490)
Capital increases/repayments and other equity transactions 19 28
Changes in financial liabilities 3,248 579
Dividends (2,873) (2,767)
Cash provided by/used in financing activities 394 (2,160)
Net changes in cash and cash equivalents 5,221 (933)
Cash and cash equivalents at the beginning of the year and other changes 1,274 2,308
Cash and cash equivalents at the end of the year 6,495 1,375

60 Management’s Report BASF Report 2017
The BASF Group business year — Business review by segment
Segment overview (million €)
Sales
Income from operations before depreciation and amortization
(EBITDA)Income from operations (EBIT)
before special items
2017 2016 2017 2016 2017 2016
Chemicals1 16,331 12,905 5,374 3,114 4,233 2,032
Performance Products1 16,217 15,558 2,427 2,577 1,416 1,777
Functional Materials & Solutions 20,745 18,732 2,251 2,906 1,617 1,946
Agricultural Solutions 5,696 5,569 1,282 1,305 1,033 1,087
Oil & Gas 3,244 2,768 2,069 1,596 793 517
Other 2,242 2,018 (679) (972) (764) (1,050)
64,475 57,550 12,724 10,526 8,328 6,309
Segment overview (million €)
Income from operations (EBIT) Assets
Investments including acquisitions2
2017 2016 2017 2016 2017 2016
Chemicals1 4,208 1,953 13,233 13,124 1,149 1,185
Performance Products1 1,510 1,678 14,432 14,911 800 892
Functional Materials & Solutions 1,545 2,199 17,364 17,359 1,056 3,679
Agricultural Solutions 1,015 1,037 8,096 8,899 185 266
Oil & Gas 1,043 499 11,967 12,829 988 1,115
Other (799) (1,091) 13,676 9,374 186 121
8,522 6,275 78,768 76,496 4,364 7,258
Business review by segment
Contributions to total sales by segment
Chemicals 25%
Performance Products 25%
Functional Materials & Solutions 32%
Agricultural Solutions 9%
Oil & Gas 5%
Other 4%
Contributions to EBITDA by segment
Chemicals 42%
Performance Products 19%
Functional Materials & Solutions 18%
Agricultural Solutions 10%
Oil & Gas 16%
Other (5%)
1 On January 1, 2017, the Monomers and Dispersions & Pigments divisions’ activities for the electronics industry were merged into the global Electronic Materials business unit and allocated to the Dispersions & Pigments division. For better comparability, the affected figures for 2016 have been adjusted accordingly.
2 Additions to property, plant and equipment (thereof from acquisitions: €8 million in 2017 and €155 million in 2016) and intangible assets (thereof from acquisitions: €235 million in 2017 and €2,789 million in 2016)

BASF Report 2017 Management’s Report
The BASF Group business year — Business review by segment 61
Income from operations (EBIT)1 (million €)
1st quarter 2nd quarter 3rd quarter 4th quarter
2017 2016 2017 2016 2017 2016 2017 2016
Chemicals2 974 460 1,119 458 1,089 490 1,026 545
Performance Products2 499 543 363 495 567 467 81 173
Functional Materials & Solutions 521 452 427 531 357 492 240 724
Agricultural Solutions 531 590 270 288 20 93 194 66
Oil & Gas 169 66 183 93 255 178 436 162
Other (243) (245) (181) (147) (330) (256) (45) (443)
2,451 1,866 2,181 1,718 1,958 1,464 1,932 1,227
Income from operations (EBIT) before special items1 (million €)
1st quarter 2nd quarter 3rd quarter 4th quarter
2017 2016 2017 2016 2017 2016 2017 2016
Chemicals2 958 457 1,120 458 1,102 488 1,053 629
Performance Products2 515 555 405 512 385 473 111 237
Functional Materials & Solutions 531 456 422 535 397 497 267 458
Agricultural Solutions 533 591 272 320 21 97 207 79
Oil & Gas 170 66 183 94 180 194 260 163
Other (250) (219) (151) (212) (325) (233) (38) (386)
2,457 1,906 2,251 1,707 1,760 1,516 1,860 1,180
Sales1 (million €)
1st quarter 2nd quarter 3rd quarter 4th quarter
2017 2016 2017 2016 2017 2016 2017 2016
Chemicals2 4,105 3,019 4,045 3,236 4,023 3,227 4,158 3,423
Performance Products2 4,260 3,913 4,142 3,983 3,983 3,921 3,832 3,741
Functional Materials & Solutions 5,198 4,408 5,261 4,703 4,975 4,660 5,311 4,961
Agricultural Solutions 1,855 1,780 1,526 1,459 987 1,049 1,328 1,281
Oil & Gas 829 611 814 617 739 618 862 922
Other 610 477 476 485 548 538 608 518
16,857 14,208 16,264 14,483 15,255 14,013 16,099 14,846
Contributions to EBIT before special items by segment
Chemicals 51%
Performance Products 17%
Functional Materials & Solutions 19%
Agricultural Solutions 12%
Oil & Gas 10%
Other (9%)
Contributions to EBIT by segment
Chemicals 49%
Performance Products 18%
Functional Materials & Solutions 18%
Agricultural Solutions 12%
Oil & Gas 12%
Other (9%)
1 Quarterly results not audited
2 On January 1, 2017, the Monomers and Dispersions & Pigments divisions’ activities for the electronics industry were merged into the global Electronic Materials business unit and allocated to the Dispersions & Pigments division. For better comparability, the affected figures for 2016 have been adjusted accordingly.
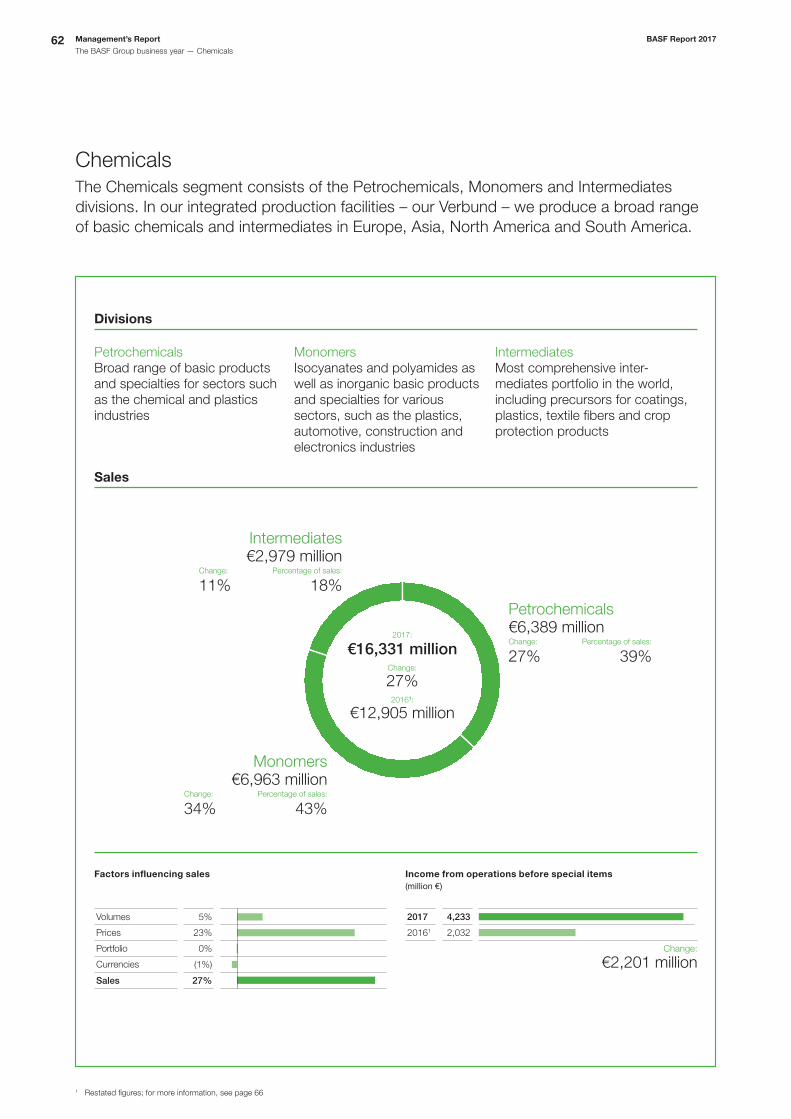
62 Management’s Report BASF Report 2017
The BASF Group business year — Chemicals
ChemicalsThe Chemicals segment consists of the Petrochemicals, Monomers and Intermediates divisions. In our integrated production facilities – our Verbund – we produce a broad range of basic chemicals and intermediates in Europe, Asia, North America and South America.
Divisions
PetrochemicalsBroad range of basic products and specialties for sectors such as the chemical and plastics industries
MonomersIsocyanates and polyamides as well as inorganic basic products and specialties for various sectors, such as the plastics, automotive, construction and electronics industries
IntermediatesMost comprehensive inter-mediates portfolio in the world, including precursors for coatings, plastics, textile fibers and crop protection products
Sales
Factors influencing sales
Volumes 5%
Prices 23%
Portfolio 0%
Currencies (1%)
Sales 27%
Income from operations before special items (million €)
2017 4,233
20161 2,032
Change:
€2,201 million
Intermediates€2,979 million
Change: Percentage of sales:
11% 18%
Monomers€6,963 million
Change: Percentage of sales:
34% 43%
Petrochemicals€6,389 millionChange: Percentage of sales:
27% 39%Change:
€16,331 million
27%
€12,905 million20161:
2017:
1 Restated figures; for more information, see page 66
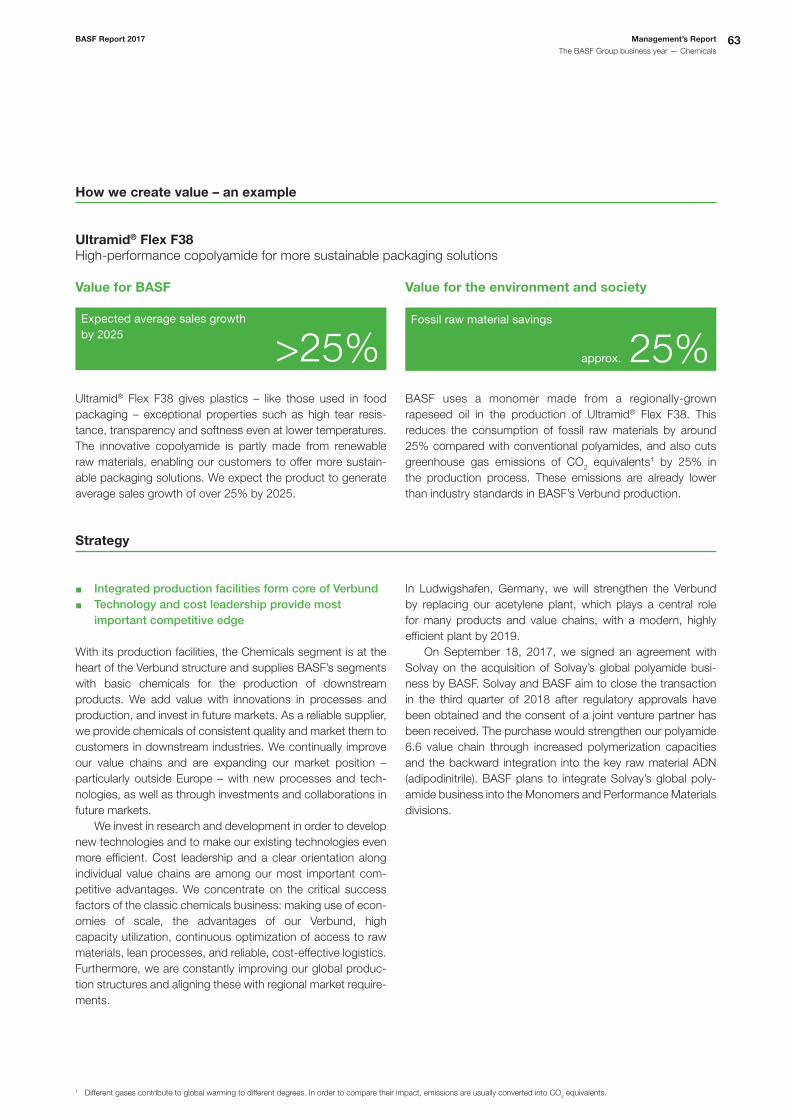
BASF Report 2017 Management’s Report
The BASF Group business year — Chemicals 63
Strategy
▪ Integrated production facilities form core of Verbund ▪ Technology and cost leadership provide most
important competitive edge
With its production facilities, the Chemicals segment is at the heart of the Verbund structure and supplies BASF’s segments with basic chemicals for the production of downstream products. We add value with innovations in processes and production, and invest in future markets. As a reliable supplier, we provide chemicals of consistent quality and market them to customers in downstream industries. We continually improve our value chains and are expanding our market position – particularly outside Europe – with new processes and tech-nologies, as well as through investments and collaborations in future markets. We invest in research and development in order to develop new technologies and to make our existing technologies even more efficient. Cost leadership and a clear orientation along individual value chains are among our most important com-petitive advantages. We concentrate on the critical success factors of the classic chemicals business: making use of econ-omies of scale, the advantages of our Verbund, high capacity utilization, continuous optimization of access to raw materials, lean processes, and reliable, cost-effective logistics. Furthermore, we are constantly improving our global produc-tion structures and aligning these with regional market require-ments.
In Ludwigshafen, Germany, we will strengthen the Verbund by replacing our acetylene plant, which plays a central role for many products and value chains, with a modern, highly efficient plant by 2019. On September 18, 2017, we signed an agreement with Solvay on the acquisition of Solvay’s global polyamide busi-ness by BASF. Solvay and BASF aim to close the transaction in the third quarter of 2018 after regulatory approvals have been obtained and the consent of a joint venture partner has been received. The purchase would strengthen our polyamide 6.6 value chain through increased polymerization capacities and the backward integration into the key raw material ADN (adipodinitrile). BASF plans to integrate Solvay’s global poly-amide business into the Monomers and Performance Materials divisions.
How we create value – an example
Ultramid® Flex F38High-performance copolyamide for more sustainable packaging solutions
Value for BASF
Expected average sales growth by 2025 >25%
Value for the environment and society
Fossil raw material savings
approx. 25%Ultramid® Flex F38 gives plastics – like those used in food packaging – exceptional properties such as high tear resis-tance, transparency and softness even at lower temperatures. The innovative copolyamide is partly made from renewable raw materials, enabling our customers to offer more sustain-able packaging solutions. We expect the product to generate average sales growth of over 25% by 2025.
BASF uses a monomer made from a regionally-grown rapeseed oil in the production of Ultramid® Flex F38. This reduces the consumption of fossil raw materials by around 25% compared with conventional polyamides, and also cuts greenhouse gas emissions of CO2 equivalents1 by 25% in the production process. These emissions are already lower than industry standards in BASF’s Verbund production.
1 Different gases contribute to global warming to different degrees. In order to compare their impact, emissions are usually converted into CO2 equivalents.

64 Management’s Report BASF Report 2017
The BASF Group business year — Chemicals
Products, customers and applications
Division Products Customer industries and applications
Petrochemicals Basic products: ethylene, propylene, butadiene, benzene, alcohols, solvents, plasticizers, alkylene oxides, glycols and acrylic monomers
Specialties: special plasticizers, special acrylates
Use in the BASF Verbund Chemical and plastics industry, detergent, hygiene, automotive, packaging and textile industries; production of paints, coatings, and cosmetics as well as oilfield, construction and paper chemicals
Monomers Basic products: isocyanates (MDI, TDI), ammonia, caprolactam, adipic acid, chlorine, urea, glues and impregnating resins, caustic soda, polyamides 6 and 6.6, standard alcoholates, sulfuric and nitric acid
Use in the BASF Verbund
Industries such as plastics, electronics, lumber, furniture, packaging, textile, construction and automotive
Intermediates Basic products: butanediol and derivatives, alkylamines and alkanolamines, neopentyl glycol, formic and propionic acid
Specialties: specialty amines such as tertiary butylamine and polyetheramine, gas treatment chemicals, vinyl monomers, acid chlorides, chloroformates, chiral intermediates
Use in the BASF Verbund
Plastics, coatings and pharmaceutical industries, production of detergents and cleaners as well as crop protection products and textile fibers
Production capacities of significant products1
Product
Sites
Annual capacity (metric tons) Europe North America Asia Pacific
South America, Africa, Middle East
Acrylic acid • • • • 1,510,000
Alkylamines • • • 250,000
Formic acid • • • 305,000
Ammonia • 1,525,000
Benzene • • • 910,000
Butadiene • • • 680,000
Butanediol equivalents • • • 670,000
Chlorine • 385,000
Ethanolamines and derivatives • • 430,000
Ethylene • • • 3,480,000
Ethylene oxide • • • 1,445,000
Urea • 545,000
Isocyanates • • • 2,610,000
Caustic soda • 360,000
Neopentyl glycol • • • 205,000
Oxo-C4 alcohols (calculated as butyraldehyde) • • • 1,625,000
Polyamide 6 and 6.6 • • • 820,000
Polyamide precursors • • 910,000
PolyTHF® • • • 350,000
Propionic acid • • 150,000
Propylene • • • 2,610,000
Propylene oxide • 675,000
Sulfuric acid • 920,000
Plasticizers • • 595,000
1 All capacities are included at 100%, including plants belonging to joint operations and joint ventures.

BASF Report 2017 Management’s Report
The BASF Group business year — Chemicals 65
Investments
Location Project
Additional annual capacity through expansion
(metric tons)
Total annual capacity
(metric tons) Startup
Freeport, Texas Construction: ammonia plant1 750,000 2018
Ludwigshafen, Germany Replacement: acetylene plant n/a 90,000 2019
Nanjing, China Construction: specialty amines plant 21,000 n/a 2019
Expansion: propionic acid plant2 30,000 69,000 2019
Pasadena, Texas Changeover of plasticizers production to dioctyl terephthalate (DOTP) 60,000 2017
Shanghai, China Expansion: MDI plant3 240,000 480,000 2017
1 Operated by an associated company with Yara International ASA2 Operated by a joint venture with Sinopec3 Operated by an associated company with Huntsman, Shanghai Hua Yi (Group) Company, Shanghai Chlor-Alkali Chemical Co. Ltd. and Sinopec Group Assets Management Corp.

66 Management’s Report BASF Report 2017
The BASF Group business year — Chemicals
Chemicals segment
▪ Sales grow by 27% to €16,331 million, mainly due to higher prices
▪ Stronger margins increase EBIT before special items by 108% to €4,233 million
In the Chemicals segment, sales to third parties increased by €3,426 million to €16,331 million in 2017 (volumes 5%, prices 23%, portfolio 0%, currencies –1%). This was primarily attri butable to higher prices, especially in the Monomers divi-sion. We increased volumes in all divisions. Income from operations (EBIT) before special items rose by €2,201 million to €4,233 million, mainly as a result of higher margins for isocyanates in the Monomers division. Stronger margins in the Petrochemicals and Intermediates divisions also contributed to the increase in earnings; slightly higher fixed costs had an offsetting effect. The negative impact on earnings in 2017 caused by the North Harbor accident at the Ludwigshafen site in October 2016 was compen sated by insurance payments. EBIT rose by €2,255 million to €4,208 million. Overall, special items did not have a substantial impact.
For the Outlook for 2018, see page 123
Petrochemicals
▪ Sales rise by 27% to €6,389 million, primarily as a result of price increases
▪ Considerable increase in EBIT before special items due to higher margins
Sales to third parties in the Petrochemicals division rose by €1,354 million to €6,389 million in 2017. This was mainly due to significantly higher sales prices in all regions and in almost all strategic business units, particularly for steam cracker products. Prices largely followed the higher raw materials prices for naphtha and butane, our most important feedstock. Sales volumes rose overall. Volumes rose significantly in North America, mainly as a result of higher capacity utilization of the steam cracker and the condensate splitter in Port Arthur, Texas. In Europe, sales volumes were up slightly from the previous year: Higher volumes, especially for steam cracker products, were able to compensate for the limited volumes growth for plasticizers and in the alcohols and solvents busi-ness following the accident at the North Harbor.
Petrochemicals – Factors influencing sales
Volumes 8%
Prices 20%
Portfolio 0%
Currencies (1%)
Sales 27%
Segment data1 (million €)
2017 2016 Change in %
Sales to third parties 16,331 12,905 27
Thereof Petrochemicals 6,389 5,035 27
Monomers 6,963 5,189 34
Intermediates 2,979 2,681 11
Intersegmental transfers 6,063 4,832 25
Sales including intersegmental transfers 22,394 17,737 26
Income from operations before depreciation and amortization (EBITDA) 5,374 3,114 73
EBITDA margin % 32.9 24.1 –
Amortization and depreciation2 1,166 1,161 0
Income from operations (EBIT) 4,208 1,953 115
Special items (25) (79) 68
EBIT before special items 4,233 2,032 108
EBIT after cost of capital 2,895 690 320
Assets 13,233 13,124 1
Investments including acquisitions3 1,149 1,185 (3)
Research and development expenses 128 145 (12)
1 On January 1, 2017, the Monomers and Dispersions & Pigments divisions’ activities for the electronics industry were merged into the global Electronic Materials business unit andallocated to the Dispersions & Pigments division. For better comparability, the affected figures for 2016 have been adjusted accordingly.
2 Amortization of intangible assets and depreciation of property, plant and equipment (including impairments and reversals of impairments) 3 Additions to intangible assets and property, plant and equipment

BASF Report 2017 Management’s Report
The BASF Group business year — Chemicals 67
Petrochemicals – Sales by region (Location of customer)
1 Europe 55%
2 North America 34%
3 Asia Pacific 8%
4 South America, Africa, Middle East 3%
EBIT before special items considerably exceeded the 2016 figure as a result of higher margins. In Europe in particular, margins for steam cracker products as well as for alkylene oxides and glycols rose significantly. Margins for acrylic monomers and oxo alcohols also developed positively overall, mainly due to strong demand and low product availability. The negative impact on earnings in 2017 caused by the North Harbor accident was offset by insurance payments.
Monomers
▪ Sales up 34% at €6,963 million, mainly due to higher prices
▪ Considerable increase in EBIT before special items, primarily from stronger isocyanate margins
Sales to third parties in the Monomers division rose by €1,774 million to €6,963 million in 2017, largely as a result of higher prices. Robust demand and the temporary product shortages on the market led to a strong price increase, espe-cially in the isocyanates business. Sales prices for polyamides also rose. We achieved year-on-year volumes growth with our new production facilities.
Monomers – Factors influencing sales
Volumes 3%
Prices 33%
Portfolio 0%
Currencies (2%)
Sales 34%
Monomers – Sales by region (Location of customer)
1 Europe 39%
2 North America 20 %
3 Asia Pacific 34%
4 South America, Africa, Middle East 7%
Stronger margins and volumes for isocyanates were the main reason for the considerable increase in EBIT before special items in the Monomers division. Earnings were also positively impacted by the restructuring of our caprolactam production in Europe. Fixed costs exceeded the prior-year level, mainly from our new production facilities.
Intermediates
▪ Sales growth of 11% to €2,979 million due to higher prices and volumes
▪ EBIT before special items slightly above the prior-year level due to margin and volumes growth
Sales to third parties in the Intermediates division rose by €298 million year-on-year to €2,979 million. This was mainly due to higher prices, particularly in the butanediol and deriva-tives as well as the acids and polyalcohols businesses. We were able to raise volumes in all regions in 2017. The amines business in Europe and Asia showed especially strong growth. Negative exchange rate effects and the divestiture of the inorganic specialties business in the first quarter of 2017, which included the site in Evans City, Pennsylvania, slightly dampened sales growth.
Intermediates – Factors influencing sales
Volumes 4%
Prices 10%
Portfolio (1%)
Currencies (2%)
Sales 11%
Intermediates – Sales by region (Location of customer)
1 Europe 42%
2 North America 17%
3 Asia Pacific 38%
4 South America, Africa, Middle East 3%
EBIT before special items in 2017 was up slightly from the previous year: Improved margins and higher sales volumes more than compensated for the rise in fixed costs. The year-on-year increase in fixed costs was primarily due to a higher number of plant maintenance activities, the startup of new production plants in all regions, as well as unplanned repairs. The construction of the new acetylene plant in Ludwigs-hafen, Germany, is progressing on schedule.
12
34
€6,389 million
1
2
3
4
€6,963 million
1
2
3
4
€2,979 million

68 Management’s Report BASF Report 2017
The BASF Group business year — Performance Products
Performance Products
The Performance Products segment consists of the Dispersions & Pigments, Care Chemicals, Nutrition & Health and Performance Chemicals divisions. Our offerings enhance the performance of industrial and consumer products worldwide. With our tailor-made solutions, our customers can make their production processes more efficient and give their products improved application properties.
Divisions
Dispersions & Pigments Raw materials used to formulate products in the construction, automotive, adhesives, printing, packaging, electronics and paper industries
Care ChemicalsIngredients for the hygiene, cosmetics, detergent and cleaner industries as well as for applications in the chemical industry
Nutrition & HealthProducts for the food and feed industries, the flavor and fragrance industry and the pharmaceutical industry
Performance ChemicalsCustomized products for many sectors, from mining and the fuel industry to plastics processing
Sales
Factors influencing sales
Volumes 5%
Prices 1%
Portfolio (1%)
Currencies (1%)
Sales 4%
Income from operations before special items (million €)
2017 1,416
20161 1,777
Change:
minus €361 million
Performance Chemicals€3,896 million
Change: Percentage of sales:
2% 24%
Nutrition & Health€1,844 million
Change: Percentage of sales:
–5% 12%
Dispersions & Pigments€5,398 millionChange: Percentage of sales:
6% 33%
Care Chemicals€5,079 millionChange: Percentage of sales:
7% 31%
Change:
€16,217 million
4%
€15,558 million20161:
2017:
1 Restated figures; for more information, see page 72

BASF Report 2017 Management’s Report
The BASF Group business year — Performance Products 69
Strategy
▪ Tailor-made products and solutions improve our customers’ applications and processes
▪ Global presence ensures reliable supply to customers in all regions
We take on the challenges posed by important future issues, especially population growth: scarce resources, environmental and climatic stressors, greater demand for food and the desire for better quality of life. In doing so, we focus on research and development and maintain close relationships to leading companies in our customer industries. We position ourselves globally in order to reliably supply customers in all regions. We invest in the development of innovations that enable our products and processes – as well as our customers’ applica-tions and processes – to make a contribution to sus tainability: for example, by allowing resources to be used more efficiently. Our products create additional value for our customers, providing a competitive advantage. We develop new solutions together with our customers and strive for long-term partner-ships that create profitable growth opportunities for both
sides. In this way, we aim to strengthen our focus on highly specialized applications in the business fields of displays and semi-conductors in the electronics industry, for example. A different business model is pursued for standard products such as vitamins or dispersions for paper coatings. Here, efficient production setups, backward integration in our Production Verbund’s value chains, capacity management, and technology and cost leadership are all essential. We support our customers by serving as a reliable supplier with consistently high product quality, good value for money and lean processes. In the Dispersions & Pigments division, for instance, we draw on our in-depth knowledge of the areas of application and technological innovations to strengthen customer relationships in key industries. At the Caojing site in Shanghai, China, we are planning a new plant for plastic additives (antioxidants), which is expected to be completed in 2019. We are expanding our existing ibuprofen production capacities in Bishop, Texas, and are planning the construction of a new world-scale ibuprofen plant in Ludwigshafen, Germany, scheduled for startup in 2021.
How we create value – an example
Hydraulan® 406 ESINew low-viscous brake fluid for enhanced driving safety
Value for BASF
Market growth compared with the market for brake fluids as a whole 2-fold
Value for our customers
Lower viscosity compared with standard products
>50%BASF has developed and sold brake fluids for the automotive industry for over 60 years. Hydraulan® 406 ESI enables us to secure a leading position in the attractive market segment for low-viscous brake fluids, which is growing twice as fast as the market as a whole. The new product meets several interna-tional market standards1 as well as the new requirements of automotive manufacturers, particularly with respect to assisted and autonomous driving.
As electronic systems become more and more complex, the demands on the braking system also increase. Brake fluids are a safety factor – they must ensure fast signal processing and breaking reactions. A low viscosity is crucial here. With a viscosity that is more than 50% lower than standard products,2 Hydraulan® 406 ESI significantly improves braking safety – even under difficult conditions.
1 DOT 3, DOT 4, DOT 5.1 2 Brake fluids in accordance with DOT 3 and DOT 4

70 Management’s Report BASF Report 2017
The BASF Group business year — Performance Products
Products, customers and applications
Division Products Customer industries and applications
Dispersions & Pigments Polymer dispersions, pigments, resins, high-performance additives, formulation additives, electronic materials
Raw materials used to formulate products for industries such as construction, automotive, adhesive, printing, packaging, electronics and paper
Care Chemicals Ingredients for skin and hair cleansing and care products, such as emollients, cosmetic active ingredients, polymers and UV filters
Ingredients for detergents and cleaners in household, institution or industry, such as surfactants, enzymes, chelating agents, polymers, biocides and products for optical effects
Solvents and other ingredients for crop protection product formulations, as well as products for concrete additives and chemical processes such as metal surface treatments or textile processing
Superabsorbents for baby diapers, incontinence products and feminine hygiene articles
Cosmetics industry, hygiene industry, detergent and cleaner industry, agricultural industry and technical applications
Nutrition & Health Additives for the food and feed industries, such as vitamins, carotenoids, sterols, enzymes, emulsifiers and omega-3 fatty acids
Flavors and fragrances, such as geraniol, citronellol, L-menthol and linalool
Excipients for the pharmaceutical industry and selected, high-volume active pharmaceutical ingredients, such as ibuprofen and omega-3 fatty acids
Food and feed industries, flavor and fragrance industry and pharmaceutical industry
Performance Chemicals Antioxidants, light stabilizers and flame retardants for plastic applications
Fuel and refinery additives, polyisobutene, brake fluids and engine coolants, lubricant additives and basestocks, components for metalworking fluids and compounded lubricants
Process chemicals for the extraction of oil, gas, metals and minerals, chemicals for enhanced oil recovery
Functional chemicals and process chemicals for the production of paper and cardboard, water treatment chemicals, membrane technologies, kaolin minerals
Plastics processing industry, automotive industry, fuel and lubricant industry, oil and gas industry, mining industry, municipal and industrial water treatment as well as paper industry and packaging made of paper
Production capacities of significant products1
Product
Sites
Annual capacity (metric tons) Europe North America Asia Pacific
South America, Africa, Middle East
Anionic surfactants • • • • 600,000
Citral • • 78,000
Chelating agents • • • 170,000
Methane sulfonic acid • 30,000
Nonionic surfactants • • • 630,000
Polyisobutene • • 265,000
Superabsorbents • • • • 590,000
1 All capacities are included at 100%, including plants belonging to joint operations and joint ventures.

BASF Report 2017 Management’s Report
The BASF Group business year — Performance Products 71
Investments
Location Project Startup
Antwerp, Belgium Flexibilization: superabsorbent plant 2017
Besigheim, Germany Expansion: production plant for bismuth vanadate pigments 2017
Kuantan, Malaysia Construction: aroma ingredients complex 2017/2018
Construction: polyisobutene plant 2017
Ludwigshafen, Germany Expansion: polyvinylpyrrolidone plant 2017
Expansion: production plant for resins (Basonat®) 2017
Expansion: production plant for dispersions 2018
Construction: production plant for vitamin A 2020
Construction: production plant for ibuprofen 2021
Nanjing, China Construction: production plant for bio-acrylamide 2017
Expansion: polyacrylamide plant 2018
Shanghai, China Construction: production plant for emollients and waxes 2017
Construction: production plant for plastic additives 2019

72 Management’s Report BASF Report 2017
The BASF Group business year — Performance Products
Performance Products segment
▪ Sales up 4% at €16,217 million, mainly driven by higher volumes
▪ EBIT before special items decreases by 20% to €1,416 million as a result of lower margins
At €16,217 million, sales to third parties in the Performance Products segment were €659 million above the prior- year figure in 2017 (volumes 5%, prices 1%, portfolio –1%, currencies –1%). This is mainly attributable to volumes growth in all divisions. Higher sales prices in the Care Chemicals and Dispersions & Pigments divisions also had a
positive impact on sales. Portfolio measures and negative currency effects in all divisions reduced sales slightly. Income from operations (EBIT) before special items declined by €361 million year-on-year to €1,416 million. This was largely due to lower margins, primarily as a result of higher raw materials prices that could not be fully passed on via sales prices. Compared with 2016, EBIT declined by €168 million to €1,510 million. Special income in the Performance Chemicals division from the transfer of BASF’s leather chemicals business to the Stahl group only partially compensated for the margin-related decline in earnings.
For the Outlook for 2018, see page 123
Segment data1 (million €)
2017 2016 Change in %
Sales to third parties 16,217 15,558 4
Thereof Dispersions & Pigments 5,398 5,086 6
Care Chemicals 5,079 4,735 7
Nutrition & Health 1,844 1,932 (5)
Performance Chemicals 3,896 3,805 2
Intersegmental transfers 506 469 8
Sales including intersegmental transfers 16,723 16,027 4
Income from operations before depreciation and amortization (EBITDA) 2,427 2,577 (6)
EBITDA margin % 15.0 16.6 –
Amortization and depreciation2 917 899 2
Income before operations (EBIT) 1,510 1,678 (10)
Special items 94 (99) .
EBIT before special items 1,416 1,777 (20)
EBIT after cost of capital 26 205 (87)
Assets 14,432 14,911 (3)
Investments including acquisitions3 800 892 (10)
Research and development expenses 395 399 (1)
1 Effective January 1, 2017, the Chemicals and Performance Products segments’ activities for the electronics industry were merged and allocated to the Performance Products segmentas the Electronic Materials global business unit. To facilitate comparability, the relevant figures for 2016 have been adjusted accordingly.
2 Amortization of intangible assets and depreciation of property, plant and equipment (including impairments and reversals of impairments) 3 Additions to intangible assets and property, plant and equipment

BASF Report 2017 Management’s Report
The BASF Group business year — Performance Products 73
Dispersions & Pigments
▪ Higher volumes and prices lift sales by 6% year-on-year to €5,398 million
▪ EBIT before special items considerably below prior-year level, mainly due to lower margins
Sales to third parties in the Dispersions & Pigments division amounted to €5,398 million, up €312 million from the previous year. This positive development was driven by volumes growth and higher sales prices in the dispersions business. Portfolio and currency effects were slightly negative overall. The acqui-sition of Rolic AG, Allschwil, Switzerland, in February 2017, had a positive impact on sales, while the divestiture of the photoinitiator business in August 2016 had a dampening effect. This divestiture reduced sales in the additives business; sales increased in all other business areas. Our sales volumes rose in all business areas, particularly in the dispersions and electronic materials businesses. Sales prices in the dispersions business increased on the back of higher raw materials prices. In the remaining business areas, particularly electronic materials and pigments, sales prices were pushed down by stronger market competition.
Dispersions & Pigments – Factors influencing sales
Volumes 6%
Prices 2%
Portfolio (1%)
Currencies (1%)
Sales 6%
Dispersions & Pigments – Sales by region (Location of customer)
1 Europe 39%
2 North America 24%
3 Asia Pacific 31%
4 South America, Africa, Middle East 6%
Despite the rise in sales and volumes, EBIT before special items declined considerably compared with 2016. This was mainly due to lower margins as a result of the oil price-related increase in raw materials prices as well as slightly higher fixed costs.
Care Chemicals
▪ 7% increase in sales to €5,079 million largely due to volumes growth
▪ Considerable decline in EBIT before special items attributable to lower margins
In the Care Chemicals division, sales to third parties rose by €344 million to €5,079 million in 2017. This was predomi- nantly the result of higher sales volumes, particularly in the hygiene business and of ingredients for the detergents and cleaners industries as well as for the cosmetics industry. Price increases on the back of higher raw materials prices, especially for oleochemical surfactants and fatty alcohols, also had a positive effect on sales. Currency effects reduced sales slightly. Sales rose in all regions, buoyed by strong demand. Higher volumes led to sales growth in Europe in particular.
Care Chemicals – Factors influencing sales
Volumes 5%
Prices 3%
Portfolio 0%
Currencies (1%)
Sales 7%
Care Chemicals – Sales by region (Location of customer)
1 Europe 50%
2 North America 22%
3 Asia Pacific 18%
4 South America, Africa, Middle East 10%
EBIT before special items declined considerably compared with 2016. This was mainly due to the ongoing pressure on margins for superabsorbents and lower margins for oleo-chemical surfactants. Fixed costs increased slightly as a result of additional maintenance costs and higher production volumes. Special charges were predominantly attributable to restructuring measures in North America. In November 2017, we completed the technical retrofitting of the superabsorbent plant at the site in Antwerp, Belgium, where the superabsorbent products Saviva® and HySorb® can be produced.
1
2
3
4
€5,398 million
1
2
3
4
€5,079 million

74 Management’s Report BASF Report 2017
The BASF Group business year — Performance Products
Nutrition & Health
▪ Sales decline 5% to €1,844 million, primarily as a result of divestitures
▪ EBIT before special items considerably below the 2016 figure due to higher fixed costs
Sales to third parties in 2017 declined by €88 million to €1,844 million in the Nutrition & Health division. This was primarily attributable to portfolio effects. Sales were also reduced by slightly lower sales prices, especially for vitamins, as well as negative currency effects. Higher volumes in almost all business areas had an offsetting effect.
Nutrition & Health – Factors influencing sales
Volumes 2%
Prices (1%)
Portfolio (5%)
Currencies (1%)
Sales (5%)
Nutrition & Health – Sales by region (Location of customer)
1 Europe 41%
2 North America 18%
3 Asia Pacific 30%
4 South America, Africa, Middle East 11%
EBIT before special items declined considerably compared with 2016. This was mainly due to higher fixed costs from the gradual startup of our new aroma ingredients complex in Kuantan, Malaysia, as well as the expansion of capacities at our ibuprofen production facility in Bishop, Texas. Earnings were also reduced by lower margins, especially for vitamins. On October 31, 2017, a fire occurred during startup of the citral plant in Ludwigshafen, Germany. As a result, we had to declare Force Majeure for all citral- and isoprenol- based aroma ingredients, and consequently for vitamin A, vitamin E and several carotenoid products as well.
Performance Chemicals
▪ Sales growth of 2% to €3,896 million from higher volumes
▪ Considerable decline in EBIT before special items due to lower margins
In the Performance Chemicals division, sales to third parties rose by €91 million to €3,896 million compared with 2016. This was due to higher sales volumes in all regions and businesses. Volumes growth led to higher sales, especially in the lubricant and mineral oil additive businesses as well as in plastic additives. Sales were also positively impacted by the recovery of the markets for oilfield and mining chemicals. Lower sales prices, particularly in Asia and South America, negative currency effects and the transfer of BASF’s leather chemicals business to the Stahl group reduced sales.
Care Chemicals – Factors influencing sales
Volumes 6%
Prices (1%)
Portfolio (2%)
Currencies (1%)
Sales 2%
Care Chemicals – Sales by region (Location of customer)
1 Europe 39%
2 North America 26%
3 Asia Pacific 25%
4 South America, Africa, Middle East 10%
EBIT before special items declined considerably compared with the previous year. The softer margins resulting from higher raw materials prices were only partially offset by volumes growth and lower fixed costs. We generated special income of €195 million from the transfer of BASF’s leather chemicals business to the Stahl group.
1
2
3
4
€1,844 million
1
2
3
4
€3,896 million

BASF Report 2017 Management’s Report
The BASF Group business year — Functional Materials & Solutions 75
Functional Materials & Solutions
The Functional Materials & Solutions segment comprises the Catalysts, Construction Chemicals, Coatings and Performance Materials divisions. They develop and market system solutions, services and innovative products for specific sectors and customers, particularly for the automotive, electronics, chemical and construction industries as well as for household applications, sports and leisure.
Divisions
CatalystsAutomotive and process catalysts, battery materials, precious metal trading
Construction ChemicalsSolutions for building structure and envelopes, interior construction and infrastructure
CoatingsCoatings solutions, surface treatments, decorative paints
Performance MaterialsPolyurethanes, thermo-plastics and foams
Sales
Factors influencing sales
Volumes 4%
Prices 5%
Portfolio 3%
Currencies (1%)
Sales 11%
Income from operations before special items (million €)
2017 1,617
2016 1,946
Change:
minus €329 million
2016:
2017:
Change:
Performance Materials€7,706 million
Change: Percentage of sales:
12% 37%
Coatings€3,969 million
Change: Percentage of sales:
22% 19%
Catalysts€6,658 millionChange: Percentage of sales:
6% 32%
Construction Chemicals€2,412 millionChange: Percentage of sales:
3% 12%
€20,745 million
11%
€18,732 million

76 Management’s Report BASF Report 2017
The BASF Group business year — Functional Materials & Solutions
Strategy
▪ Development of innovative products and technolo-gies in close collaboration with our customers
▪ Focus on specialties and system solutions that allow our customers to stand out from the competition
We develop innovative products and technologies in close cooperation with our customers. Our aim is to find the best solution in terms of cost and functionality, helping our cus-tomers to drive forward innovation in their industries and contribute to sustainable development. For instance, the transformation of mobility is a key trend in the automotive industry. To address this, we are developing solutions in the areas of battery materials, emission control, lightweight engi-neering concepts and coatings together with our customers. Our specialties and system solutions enable customers to stand out from the competition. One focus of our strategy is the ongoing optimization of our product and services portfolio and our structures accord-ing to different regional market requirements as well as trends
in our customer industries. We are positioning ourselves to grow profitably and faster than the market. We aim to secure our leading market position in Europe, to profitably expand our position in the North American market and to purposefully extend our activities in the growth regions of Asia, South America, eastern Europe and the Middle East. New business fields such as battery materials play a particu-larly important role here. On September 18, 2017, we signed an agreement with Solvay on the acquisition of Solvay’s integrated polyamide business. The aim is to close the transaction in the third quar-ter of 2018 after regulatory approvals have been obtained and the consent of a joint venture partner has been received. The acquisition would complement our engineering plastics portfo-lio and expand our position as a solutions provider for the transportation, construction and consumer goods industries as well as for other industrial applications. We plan to integrate the global polyamide business into the Performance Materials and Monomers divisions.
How we create value – an example
Borocat® A new generation of high-performance refining catalysts
Value for BASF
Expected sales growth with Borocat® through 2022 >50%
Value for our customers and the environment
Unwanted by-product hydrogen reduced by
up to 25%Refineries use fluid catalytic cracking (FCC) catalysts to extract high-value products like gasoline, diesel or liquid gas from the residues of crude oil distillation. Borocat®, our new generation of FCC catalysts, increases the yield of valuable hydrocarbons – especially from heavy crude oil with metal contaminants. As more and more crude oil of this type is being produced and processed, we expect sales growth of over 50% for Borocat® through 2022.
The metals contained in crude oil present a particular chal-lenge to further processing as they catalyze the generation of unwanted by-products like hydrogen, reducing the yield of valuable substances. Our new boron-based catalyst tech-nology hampers these chemical by-reactions so that up to 25% less hydrogen is produced. This enables refineries to process heavier, more contaminated crude oil and use these resources more efficiently.

BASF Report 2017 Management’s Report
The BASF Group business year — Functional Materials & Solutions 77
Products, customers and applications
Division Products Customer industries and applications
Catalysts Automotive and process catalysts
Battery materials
Precious and base metal services
Automotive and chemical industries, refineries, battery manufacturers
Solutions for the protection of air quality as well as the production of fuels, chemicals, plastics and battery materials
Construction Chemicals Concrete admixtures, cement additives, underground construction solutions, flooring systems, sealants, solutions for the protection and repair of concrete, high-performance mortars and grouts, tile-laying systems, exterior insulation and finishing systems, expansion joints, wood protection
Cement and concrete producers, construction companies, craftspeople, builders’ merchants
Solutions for new building construction, maintenance, repair and renovation of commercial and residential buildings as well as infrastructure
Coatings Coatings solutions for automotive applications, technology and system solutions for surface treatments, decorative paints
Automotive industry, body shops, steel industry, aviation, aluminum applications in the architecture and construction industries, household appliances, painting businesses and private consumers
Performance Materials Engineering plastics, biodegradable plastics, standard foams, foam specialties, polyurethanes
Automotive manufacture, electrical engineering, packaging, games, sports and leisure, household, mechanical engineering, construction, medical technology, sanitation and water industry, solar thermal energy and photovoltaics
Investments
Location Project Startup
Brighton, Colorado Capacity expansion: plant for sealants 2019
Dahej, India Capacity expansion: for Cellasto® 2019
Gimcheon, South Korea Construction: plant for Ultraform® 2018
Greenville, Ohio Capacity expansion: resin plant 2019
Hamm, Germany Capacity expansion: logistics for floor installation systems 2018
Ludwigshafen, Germany Construction: specialty zeolites plant for emissions catalysts 2019
Münster, Germany Construction: plant for functional film coatings 2018
Onoda, Japan Capacity expansion: plant for cathode materials 2017
Rayong, Thailand Construction: plant for automotive emissions catalysts 2018
Shanghai, China Construction: chemical catalysts plant 2017
Construction: automotive coatings plant 2017
Construction: technical competence center for automotive coatings 2018
Schwarzheide, Germany Capacity expansion: compounding plant for Ultramid® and Ultradur® 2017
Sroda Slaska, Poland Capacity expansion: plant for emissions catalysts 2020
Tultitlán, Mexico Capacity expansion: automotive coatings plant 2018
Yangon, Myanmar Construction: plant for concrete additives 2017
Yeosu, South Korea Capacity expansion: plant for Ultrason® 2017

78 Management’s Report BASF Report 2017
The BASF Group business year — Functional Materials & Solutions
Functional Materials & Solutions segment
▪ Sales growth of 11% to €20,745 million, mainly from higher prices and volumes
▪ EBIT before special items down 17% to €1,617 million due to lower margins and rising fixed costs
In the Functional Materials & Solutions segment, sales to third parties increased by €2,013 million to €20,745 million. This was due to higher prices and volumes as well as the Chemetall business, which was acquired from Albemarle in December 2016; sales were slightly reduced by currency effects (volumes 4%, prices 5%, portfolio 3%, currencies –1%). The volumes growth was largely attributable to higher demand for our products for the automotive and construction industries. At €1,617 million, income from operations (EBIT) before special items was down €329 million on the 2016 figure, primarily due to lower margins and higher fixed costs. Special charges in 2017 mainly related to integration costs in connec-tion with the Chemetall acquisition as well as the acquisition of the western European building material business for profes-sional users from the Henkel group. In 2016, special income arose from the divestiture of the industrial coatings busi - ness in the Coatings division. EBIT declined by €654 million to €1,545 mil lion in 2017.
For the Outlook for 2018, see page 123
Catalysts
▪ Sales increase of 6% to €6,658 million largely driven by higher prices
▪ Considerable improvement in EBIT before special items, mainly from volumes growth
Sales to third parties in the Catalysts division rose by €395 mil-lion to €6,658 million in 2017. This was primarily due to higher sales prices on the back of an increase in precious metal prices and increased volumes of mobile emissions catalysts. Currency effects and the divestiture of the polyolefin catalysts business in June 2016 had a negative impact on sales. We increased sales volumes for battery materials and chemical catalysts, while volumes declined in the refining catalysts business. In precious metal trading, sales rose by €182 million to €2,518 million. Higher prices more than offset the decline in volumes.
Catalysts – Factors influencing sales
Volumes 1%
Prices 8%
Portfolio (1%)
Currencies (2%)
Sales 6%
Segment data (million €)
2017 2016 Change in %
Sales to third parties 20,745 18,732 11
Thereof Catalysts 6,658 6,263 6
Construction Chemicals 2,412 2,332 3
Coatings 3,969 3,249 22
Performance Materials 7,706 6,888 12
Intersegmental transfers 805 736 9
Sales including intersegmental transfers 21,550 19,468 11
Income from operations before depreciation and amortization (EBITDA) 2,251 2,906 (23)
EBITDA margin % 10.9 15.5 –
Depreciation and amortization1 706 707 0
Income from operations (EBIT) 1,545 2,199 (30)
Special items (72) 253 .
EBIT before special items 1,617 1,946 (17)
EBIT after cost of capital (190) 813 .
Assets 17,364 17,359 0
Investments including acquisitions2 1,056 3,679 (71)
Research and development expenses 431 393 10
1 Amortization of intangible assets and depreciation of property, plant and equipment (including impairments and reversals of impairments) 2 Additions to intangible assets and property, plant and equipment

BASF Report 2017 Management’s Report
The BASF Group business year — Functional Materials & Solutions 79
Catalysts – Sales by region (Location of customer)
1 Europe 39%
2 North America 30%
3 Asia Pacific 24%
4 South America, Africa, Middle East 7%
We considerably increased EBIT before special items year-on-year, mainly thanks to higher sales volumes.
Construction Chemicals
▪ Sales up 3% year-on-year at €2,412 million as a result of acquisitions and higher volumes
▪ Considerable decline in EBIT before special items due to increase in raw materials prices
In the Construction Chemicals division, sales to third parties rose by €80 million as against the previous year to €2,412 mil-lion. This was partly attributable to the acquisition of the Henkel group’s western European building material business for pro-fessional users in early 2017, as well as the acquisition of the waterproofing systems supplier Grupo Thermotek, Monterrey, Mexico, in September 2017. We also increased our sales vol-umes. Overall, prices remained on a level with the previous year. The aforementioned acquisition of the construction chemicals business and higher volumes led to sales growth in Europe. In North America, the acquisition of Thermotek only partially compensated for declining volumes and negative currency effects. Sales in Asia rose year-on-year due to vol-umes growth. In the region South America, Africa, Middle East, sales decreased as a result of negative currency effects and slightly lower volumes and prices. Demand in the Middle East in particular did not meet our expectations.
Construction Chemicals – Factors influencing sales
Volumes 2%
Prices 0%
Portfolio 4%
Currencies (3%)
Sales 3%
Construction Chemicals – Sales by region (Location of customer)
1 Europe 38%
2 North America 30%
3 Asia Pacific 19%
4 South America, Africa, Middle East 13%
EBIT before special items was considerably below the 2016 figure, primarily as a result of higher raw materials prices. Special charges mainly arose in connection with the acquisi-tion of the western European building material business for professional users from the Henkel group.
Coatings
▪ Sales growth of 22% to €3,969 million from Chemetall acquisition and higher volumes
▪ EBIT before special items considerably below prior-year figure due to higher fixed costs and lower margins
In the Coatings division, sales to third parties in 2017 grew by €720 million to €3,969 million, mainly as a result of the Che-metall business acquired in December 2016. We increased sales volumes in Asia and Europe in particular. Sales were reduced by negative currency effects, especially in Asia and North America, as well as slightly lower prices. Sales of automotive OEM coatings increased thanks to higher volumes in all regions. We recorded slight sales growth in the automotive refinish coatings business, as we were able to more than offset the negative currency effects with higher sales volumes and the acquisition of Guangdong Yinfan Chemistry, Jiangmen, China, in September 2016. In the deco-rative paints business in Brazil, sales were up slightly on the prior-year figure: currency effects and slight price increases had a positive impact, while demand declined slightly.
Coatings – Factors influencing sales
Volumes 4%
Prices (1%)
Portfolio 20%
Currencies (1%)
Sales 22%
Coatings – Sales by region (Location of customer)
1 Europe 39%
2 North America 22%
3 Asia Pacific 24%
4 South America, Africa, Middle East 15%
1
2
3
4
€6,658 million
1
2
3
4
€2,412 million
1
2
3
4
€3,969 million

80 Management’s Report BASF Report 2017
The BASF Group business year — Functional Materials & Solutions
EBIT before special items in the Coatings division declined considerably. The Chemetall business made a positive contri-bution to earnings but was unable to compensate for the decline in the businesses not affected by the portfolio measures. The decrease in the latter was mainly due to higher fixed costs and lower margins as a result of the increase in raw materials prices. Special charges arose from the integration of the Chemetall business and the restructuring in connection with the divestiture of the industrial coatings business, which was completed in December 2016 and led to special income in the prior year. In November 2017, we inaugurated a new large-scale automotive coatings plant at the Caojing site in Shanghai, China, to complement our existing automotive coatings plant there. We also inaugurated a production facility for automotive OEM coatings in Bangpoo, Thailand. With the expansion, we aim to even better serve the growing automobile market in Asia Pacific, especially in China.
Performance Materials
▪ Sales growth of 12% to €7,706 million mainly due to price developments
▪ Considerable decrease in EBIT before special items, primarily as a result of lower margins
The Performance Materials division increased sales to third parties by €818 million to €7,706 million in 2017. This was largely thanks to price increases on the back of a significant rise in raw materials prices. Higher sales volumes to the auto-motive, consumer goods and construction industries also contributed to sales growth, while currency effects had a negative impact. There was strong growth in sales to the automotive indus-try in Europe and Asia in particular thanks to higher prices and greater demand for polyurethane systems and engineering plastics. The increase in sales volumes in North and South America also contributed to the positive sales development. In the consumer goods industry, sales were likewise up significantly year-on-year, mainly as a result of higher volumes in Asia and Europe. We recorded volumes growth, particularly in our businesses with polyurethane systems, thermoplastic polyurethanes and biopolymers. Significantly higher prices in the polyurethane systems business also had a positive effect. Sales to the construction sector grew, mainly as a result of the significant increase in sales prices for polyurethane sys-tems and styrene foams in Europe and Asia. Higher volumes in all regions also boosted sales.
Performance Materials – Factors influencing sales
Volumes 6%
Prices 7%
Portfolio 0%
Currencies (1%)
Sales 12%
Performance Materials – Sales by region (Location of customer)
1 Europe 48%
2 North America 21%
3 Asia Pacific 28%
4 South America, Africa, Middle East 3%
EBIT before special items was considerably below the prior -year figure. This was mainly attributable to lower margins: The increase in raw materials prices could only be partially offset by the higher sales prices. Earnings were also reduced by higher production costs from the startup of new plants. EBIT before special items in the previous year also included positive one-off effects from insurance payments and the release of provisions.
1
2
3
4
€7,706 million

BASF Report 2017 Management’s Report
The BASF Group business year — Agricultural Solutions 81
Agricultural Solutions
The Agricultural Solutions segment consists of the Crop Protection division. We develop and produce innovative solutions for the improvement of crop health and yields, and market them worldwide.
Indications and sectors
Fungicides Protecting crops against harmful fungi
HerbicidesReducing competition from weeds for water and nutrients
InsecticidesCombating insect pests in agriculture and beyond
Functional Crop CareBiological crop protection, seed treatment, polymers and colorants
Sales
Factors influencing sales
Volumes 6%
Prices (3%)
Portfolio 0%
Currencies (1%)
Sales 2%
Income from operations before special items (million €)
2017 1,033
2016 1,087
Change:
minus €54 million
2016:
2017:
Insecticides€663 million
Change: Percentage of sales:
–10% 12%
Herbicides€2,371 million
Change: Percentage of sales:
10% 42%
Functional Crop Care€305 millionChange: Percentage of sales:
5% 5%
Fungicides€2,357 millionChange: Percentage of sales:
–1% 41%
Change:
€5,696 million
2%
€5,569 million

82 Management’s Report BASF Report 2017
The BASF Group business year — Agricultural Solutions
Strategy
▪ Long-term innovation strategy ensures future growth ▪ Development of solutions that go beyond
conventional crop protection ▪ Agreement on acquisition of significant parts of
Bayer’s seed and non-selective herbicide businesses
Natural resources such as land and arable area are limited, while the world’s population and its demand for food continue to grow. This means that farmers around the world face the challenge of increasing their crop yields with limited resources. We offer our customers innovative solutions combined with practical, down-to-earth advice so that they can produce more – and more nutritious – food as efficiently as possible. We are committed to the responsible treatment of our products and the preservation of a healthy environment. We also constantly invest in our development pipeline to offer our customers an increasingly wide range of integrated solutions for crop protection and beyond. Our research and development activities range from solu-tions for guarding plants against fungi, insects and weeds, to seeds and improved soil management, and supporting plant health. For example, the Functional Crop Care business unit
provides products for improving seeds and innovations for better nitrogen and water management in soil. It also offers biological and chemical technologies that make plants better able to withstand stress factors like heat, cold and nutrient deficiency. The success of our customers depends on many factors such as weather, plant health, soil conditions and prices for agricultural products. As a result, modern farmers have to analyze more and more data of increasing complexity to make the right cultivation decisions. BASF’s innovative digital appli-cations help our customers to use these data to their advan-tage as a basis for making better decisions, ensuring more efficient and sustainable resource allocation. One example of our strategic investments in digital solu-tions is the acquisition of ZedX Inc., Bellefonte, Pennsylvania, in May 2017. ZedX is a leader in the development of informa-tion technology products and services for the agriculture sec-tor. The company develops agronomic weather, crop and pest models that can rapidly translate data into insights for more efficient agricultural production. Our aim is to offer farmers a wider range of solutions going forward to even better meet the growing demand for high-
How we create value – an example
Revysol® BASF’s new blockbuster fungicide
Value for BASF
Peak sales potential >€1 billion
Value for our customers and the environment
Stronger activity than existing triazoles
up to 100 timesRevysol® will play a key role in our fungicide portfolio in many crops for farmers around the world. We are driving forward the approval process in all regions – in more than 60 countries and for more than 240 crops. The first products based on Revysol® are to be launched on the market for the 2019 growing season following registration with the relevant authorities. This will give farmers a new active ingredient that offers exceptional biologi-cal performance and provides additional resistance manage-ment opportunities in agriculture. We are aiming for a peak sales potential of over €1 billion with Revysol®.
Revysol® is an innovative fungicide active ingredient from the triazole chemical class. It binds to the fungus enzyme up to 100 times more strongly than the products currently on the market, making it significantly more effective. Farmers can thus also safely manage those plant diseases that have become resistant to the triazoles used in the past. At the same time, Revysol® has better toxicological properties than other standard triazoles and is another important building block for sustainable agricul-ture. Farmers around the world will benefit from Revysol®-based products, which safeguard and improve yield quality.

BASF Report 2017 Management’s Report
The BASF Group business year — Agricultural Solutions 83
quality seeds as well as chemical and biological crop protec-tion. We therefore signed an agreement to acquire significant parts of the seed and non-selective herbicide businesses from Bayer AG, Leverkusen, Germany, in October 2017. The trans-action is expected to close in the first half of 2018, subject to the closing of Bayer’s acquisition of Monsanto and approval by the relevant authorities. The planned acquisition includes attractive businesses in important field crops and markets. With the acquisition, we aim to expand our crop protection business, strengthen our herbicide portfolio and enter the seed business in key agricultural markets. It will also strengthen our global innovation potential. The agreement covers Bayer’s global glufosinate-ammoni-um non-selective herbicide business, commercialized under the Liberty®, Basta® and Finale® brands, as well as its seed businesses for key row crops in selected markets. These include canola hybrids in North America under the InVigor® brand using the LibertyLink® trait technology, as well as the oilseed rape business mainly in the European markets, cotton in the Americas and Europe, and soybean in the Americas. The agreed transaction also includes Bayer’s trait research and breeding capabilities for these crops and the LibertyLink® trait and trademark.
Investments
In 2017, we invested €114 million in property, plant and equip-ment. Major projects included the startup of our expanded production capacities for dicamba in Beaumont, Texas, as well as new production capacities for our fungicide Revysol® and our insecticide Inscalis®. In the area of Functional Crop Care, we expanded our capacities for biological seed treatments and soil management in Saskatoon, Canada. We also invested in infrastructure, in particular at our plants in North America. In
order to continue meeting the ongoing high demand for our innovative solutions in the future, we will invest around €780 mil lion in developing and expanding our infrastructure and in our production and formulation capacities for active ingredients between 2018 and 2022.
Plant biotechnology at BASF
Our activities in the field of plant biotechnology are part of the Bioscience Research technology platform. Research and development expenses, sales, earnings and all other data are not included in the Agricultural Solutions segment; they are reported under Other. With our network of research sites, we help farmers meet the growing demand for increased agricultural productivity as well as better nutrition. With a pioneering platform for gene identification, we have specialized in the development of plant characteristics such as higher yield, herbicide tolerance, dis-ease resistance and quality traits. Our goal is to optimize crops so that farmers can achieve greater and more secure yields. In this way, we make an important contribution to securing a better food supply for a growing world population. We also contribute to sustainable agriculture, as the cultivation of these plants significantly reduces the amount of land, water and energy required to produce each metric ton of harvested crops. Together with Cargill, we are developing a rapeseed oil that represents a new source of heart-healthy omega-3 fatty acids, for example. The first regulatory dossier was submitted to the U.S. Department of Agriculture in November 2017. Market launch is planned from 2020, subject to regulatory approval. We are also working on a soybean that is resistant to the devastating Asian soybean rust disease. A number of lead genes have been successfully tested in field trials in Brazil.
Products, customers and applications
Indications and sectors Applications Example products
Fungicides Protecting crops from harmful fungal infections; improving plant health
Boscalid, metiram, dimethomorph, Initium®, metrafenone, F 500®, Xemium®, AgCelence® (umbrella brand)
Herbicides Reducing competition from weeds for water and nutrients Kixor®, Engenia®, pendimethalin, imazamox, topramezone, Clearfield® herbicide tolerance system, dimethenamid-P
Insecticides Combating insect pests in agriculture and beyond, such as in the fields of public health, professional pest control and landscape maintenance
Fipronil, alpha-cypermethrin, chlorfenapyr, teflubenzuron, Nealta®, Termidor® to guard against termite infestation, Interceptor® mosquito nets to protect against malaria
Functional Crop Care Products for plant health and increased yield potential that go beyond traditional crop protection, such as biological crop protection, seed treatments, polymers and colorants
Vizura®, Limus®, Systiva®, Vault® HP, Nodulator® PRO, Flo Rite®, Integral®, Serifel®

84 Management’s Report BASF Report 2017
The BASF Group business year — Agricultural Solutions
Agricultural Solutions segment
▪ Sales improve by 2% to €5,696 million as a result of higher volumes
▪ EBIT before special items down 5% year-on-year at €1,033 million due to lower margins
Sales to third parties in the Agricultural Solutions segment rose by €127 million to €5,696 million in 2017 as a result of higher sales volumes. In an ongoing difficult market environment for crop protection products, sales growth was negatively impacted by price declines, especially in South America, and negative currency effects. In Europe, sales increased by €25 million to €1,983 million. Volumes growth, especially in oilseed herbicides in eastern and southern Europe, more than compensated for declines in western and northern Europe, particularly in fungicides. At €2,003 million, sales in North America exceeded the prior-year figure by €202 million. We were able to considerably increase sales volumes, especially for herbicides in the United States. The successful market launch of our new herbicide Engenia® contributed substantially to sales growth. Strong demand for fungicides in Canada also had a positive impact. Sales in Asia rose by €33 million to €582 million. We achieved particularly strong volumes growth for fungicides in China and India, particularly with innovations such as our new product portfolio for rice. In Southeast Asia, sales volumes increased, especially for fungicides and herbicides. In the region South America, Africa, Middle East, sales declined by €133 million to €1,128 million. This was largely due to lower prices for fungicides and insecticides, negative currency effects and the reduction of inventories at our customers in Brazil. Here, we were able to increase sales volumes despite the ongoing difficult business environment for crop protection products. The positive trend in Argentina also contributed to volumes growth in the region.
Agricultural Solutions – Factors influencing sales
Volumes 6%
Prices (3%)
Portfolio 0%
Currencies (1%)
Sales 2%
Agricultural Solutions – Sales by region (Location of customer)
1 Europe 35%
2 North America 35%
3 Asia Pacific 10%
4 South America, Africa, Middle East 20%
Income from operations (EBIT) before special items was €1,033 million, down €54 million on the prior-year figure. The slight decline was mainly due to the lower average margins from a different product mix and the difficult market situ ation in Brazil. Earnings were also negatively impacted by the shut-downs of our production facilities in Beaumont, Texas, and Manatí, Puerto Rico, because of the hurricanes. Fixed costs rose slightly. EBIT declined by €22 million to €1,015 million.
For the Outlook for 2018, see page 123
1
2
3
4
€5,696 million
Segment data (million €)
2017 2016 Change in %
Sales to third parties 5,696 5,569 2
Intersegmental transfers 36 33 9
Sales including intersegmental transfers 5,732 5,602 2
Income from operations before depreciation and amortization (EBITDA) 1,282 1,305 (2)
EBITDA margin % 22.5 23.4 –
Depreciation and amortization1 267 268 0
Income from operations (EBIT) 1,015 1,037 (2)
Special items (18) (50) 64
EBIT before special items 1,033 1,087 (5)
EBIT after cost of capital 171 172 (1)
Assets 8,096 8,899 (9)
Investments including acquisitions2 185 266 (30)
Research and development expenses 507 489 4
1 Amortization of intangible assets and depreciation of property, plant and equipment (including impairments and reversals of impairments) 2 Additions to intangible assets and property, plant and equipment

BASF Report 2017 Management’s Report
The BASF Group business year — Oil & Gas 85
Oil & Gas
BASF’s oil and gas activities are bundled in the Wintershall Group. We focus on exploration and production in oil and gas-rich regions in Europe, North Africa, Russia, South America and the Middle East – focus regions in which Wintershall has a high level of regional and technological expertise. We are also active in the transportation of natural gas in Europe with our Russian partner Gazprom.
Sales
Factors influencing sales
Volumes 4%
Prices/currencies 13%
Portfolio 0%
Sales 17%
Income from operations before special items (million €)
2017 793
2016 517
Change:
€276 million
2016:€2,768 million
2017:€3,244 million
Change
17%
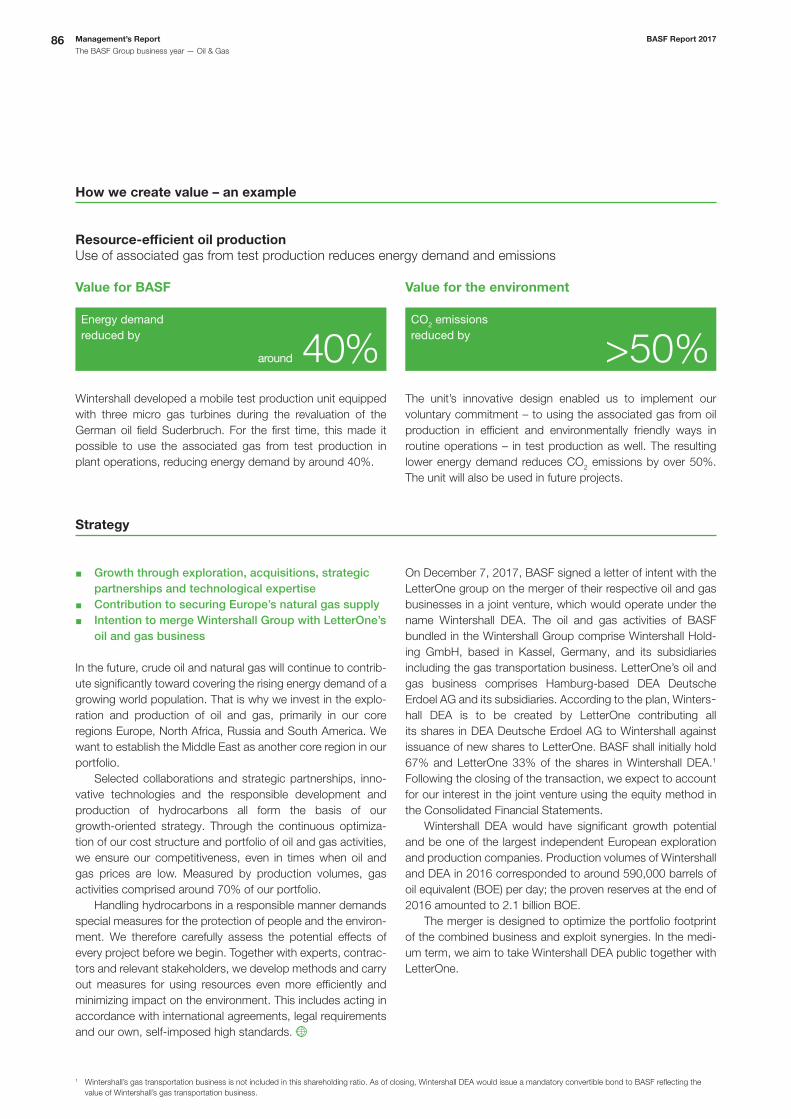
86 Management’s Report BASF Report 2017
The BASF Group business year — Oil & Gas
Strategy
▪ Growth through exploration, acquisitions, strategic partnerships and technological expertise
▪ Contribution to securing Europe’s natural gas supply ▪ Intention to merge Wintershall Group with LetterOne’s
oil and gas business
In the future, crude oil and natural gas will continue to contrib-ute significantly toward covering the rising energy demand of a growing world population. That is why we invest in the explo-ration and production of oil and gas, primarily in our core regions Europe, North Africa, Russia and South America. We want to establish the Middle East as another core region in our portfolio. Selected collaborations and strategic partnerships, inno-vative technologies and the responsible development and production of hydrocarbons all form the basis of our growth-oriented strategy. Through the continuous optimiza-tion of our cost structure and portfolio of oil and gas activities, we ensure our competitiveness, even in times when oil and gas prices are low. Measured by production volumes, gas activities comprised around 70% of our portfolio. Handling hydrocarbons in a responsible manner demands special measures for the protection of people and the environ-ment. We therefore carefully assess the potential effects of every project before we begin. Together with experts, contrac-tors and relevant stakeholders, we develop methods and carry out measures for using resources even more efficiently and minimizing impact on the environment. This includes acting in accordance with international agreements, legal requirements and our own, self-imposed high standards.
On December 7, 2017, BASF signed a letter of intent with the LetterOne group on the merger of their respective oil and gas businesses in a joint venture, which would operate under the name Wintershall DEA. The oil and gas activities of BASF bundled in the Wintershall Group comprise Wintershall Hold-ing GmbH, based in Kassel, Germany, and its subsidiaries including the gas transportation business. LetterOne’s oil and gas business comprises Hamburg-based DEA Deutsche Erdoel AG and its subsidiaries. According to the plan, Winters-hall DEA is to be created by LetterOne contributing all its shares in DEA Deutsche Erdoel AG to Wintershall against issuance of new shares to LetterOne. BASF shall initially hold 67% and LetterOne 33% of the shares in Wintershall DEA.1 Following the closing of the transaction, we expect to account for our interest in the joint venture using the equity method in the Consolidated Financial Statements. Wintershall DEA would have significant growth potential and be one of the largest independent European exploration and production companies. Production volumes of Wintershall and DEA in 2016 corresponded to around 590,000 barrels of oil equivalent (BOE) per day; the proven reserves at the end of 2016 amounted to 2.1 billion BOE. The merger is designed to optimize the portfolio footprint of the combined business and exploit synergies. In the medi-um term, we aim to take Wintershall DEA public together with LetterOne.
How we create value – an example
Resource-efficient oil productionUse of associated gas from test production reduces energy demand and emissions
Value for BASF
Energy demand reduced by
around 40%
Value for the environment
CO2 emissionsreduced by
>50%Wintershall developed a mobile test production unit equipped with three micro gas turbines during the revaluation of the German oil field Suderbruch. For the first time, this made it possible to use the associated gas from test production in plant operations, reducing energy demand by around 40%.
The unit’s innovative design enabled us to implement our voluntary commitment – to using the associated gas from oil production in efficient and environmentally friendly ways in routine operations – in test production as well. The resulting lower energy demand reduces CO2 emissions by over 50%. The unit will also be used in future projects.
1 Wintershall’s gas transportation business is not included in this shareholding ratio. As of closing, Wintershall DEA would issue a mandatory convertible bond to BASF reflecting the value of Wintershall’s gas transportation business.

BASF Report 2017 Management’s Report
The BASF Group business year — Oil & Gas 87
The definitive transaction agreements are to be negotiated over the coming months; the transaction could be expected to close in the second half of 2018, subject to the customary regulatory approvals. There is no assurance that we will enter into definitive transaction agreements with LetterOne or that the intended transaction will be consummated.
Exploration and production
▪ Active portfolio management, including expansion of our position in Norway
Europe: The Mittelplate field off the North Sea coast is the cornerstone of our crude oil production in Germany. We own a 50% share in the development of this largest known oil deposit in the country. Some 30 million metric tons of oil have already been extracted there. We have completed and started up all 12 new wells at the Emlichheim site. A new drilling campaign with a total of five new production wells started at the Bockstedt oilfield. The first wells have already started operation. We conducted a seismic survey at the Landau concession in early 2017 and are currently evaluating the results. In Norway, oil production from the Maria field in the Norwe-gian Sea started in 2017. It is the first project in Norway that Wintershall has operated from the discovery of the field to the start of production. Rather than building a new production platform, we implemented an innovative development concept for Maria: The production equipment was installed directly on the seabed and connected underwater with three nearby platforms operated by our cooperation partner Statoil. Production started a year earlier than originally planned and costs were more than a fifth lower than expected. Develop-ment of the Ivar Aasen and Edvard Grieg fields continued with additional wells drilled. As the operator of the Nova field (previously: Skarfjell), we are in the process of finalizing the development concept. This proposes to connect the oil and gas reservoir with the nearby Gjøa platform via a subsea tie-back. In January 2017, Wintershall was granted shares in five new exploration licenses on the Norwegian continental shelf from the Ministry of Petroleum and Energy. Wintershall will take over operatorship of two licenses. In early 2017, Wintershall Noordzee B.V., Rijswijk, Nether-lands, started production from the Ravn oilfield as operator. It is the first oilfield operated by the company in Denmark. Tech-nical difficulties arose in production in mid-August; we are still working on a solution.
Russia: The Yuzhno Russkoye natural gas field in western Siberia, in which Wintershall has a 35% economic interest, has been producing at plateau since 2009. We hold a 50% share in the development of Block IA of the Achimov formation in the Urengoy field in western Siberia. The gradual development of this field was continued and 88 wells were producing at the end of 2017. We will develop blocks IV and V of the Achimov formation with our partner Gazprom. We are also active in exploration and production in the Volgograd region together with the LUKOIL group. North Africa / Middle East: In Libya, we are the operator of eight oilfields in the onshore concessions 96 and 97. Crude oil production was temporarily suspended in both con-cessions in March 2017. Based on an agreement with the government-owned National Oil Corporation (NOC), we were able to resume production from June to October: 55,000 barrels of oil per day (BOPD) for concession 96 and 10,000 BOPD for concession 97. Production in concession 96 then halted due to a strike. We are currently negotiating with NOC on the framework of our future cooperation. At the Al Jurf oil-field off the coast of Libya, in which we hold a share, operations could be continued without interruption in 2017. In Abu Dhabi, Wintershall successfully completed the first offshore exploration well in the Shuwaihat field. South America: We hold shares in a total of 15 onshore and offshore fields in Argentina. In the Neuquén province, we drilled three pilot wells as an operator in the Bandurria Norte block. The first exploration well in the CN-V block in the Mendoza province found oil. In Tierra del Fuego, work began on the expansion of the gas treatment facilities for the Cuenca Marina Austral 1 concession. In the Neuquén province, Wintershall reduced its interest in the Aguada Pichana concession. Its share in the Aguada Pichana Oeste (West) block was sold to Pan American Energy LLC, Buenos Aires, Argentina, and YPF S.A., Buenos Aires, Argentina. Wintershall reduced its interest in the Aguada Pichana Este (East) block through the sale of shares to Total Austral S.A., Buenos Aires, Argentina, at the beginning of 2018.
For information on current reserves, see pages 89 and 237

88 Management’s Report BASF Report 2017
The BASF Group business year — Oil & Gas
Investments
Location ProjectPlateau/peak production
per year1 Startup
Argentina Development of Aguada Pichana Este 7 million BOE 2017/20242
North Sea, Norway Development of Maria field 8 million BOE 2017
Development of Edvard Grieg field 5 million BOE 2015/20182
Development of Aasta Hansteen field 12 million BOE 2018
Siberia, Russia Achimgaz, development of Achimov horizon in Urengoy natural gas and condensate field
44 million BOE 2008/20202
1 BASF’s share in barrels of oil equivalent (BOE)2 Year completed
Natural gas transportation
▪ Mostly regulated business with stable framework ▪ Construction of European gas pipeline link (EUGAL)
planned ▪ Contribution to financing of the project company
Nord Stream 2 AG
The largey regulated natural gas transportation sector is char-acterized by stable conditions and yields based on approved costs and tariffs. Our organizational structure meets the unbundling requirements set down by the German Energy Act. As an indirect holding company for the German subsidiar-ies in natural gas transportation, WIGA Transport Beteiligungs- GmbH & Co. KG (WIGA) mainly fulfills a reporting and financing function. GASCADE Gastransport GmbH, OPAL Gastransport GmbH & Co. KG, and NEL Gastransport GmbH all act as independent companies under the umbrella of the WIGA group. In August 2017, we established W & G Infrastruktur Finan-zierungs-GmbH as an intermediate holding company and contributed GASCADE Gastransport GmbH and NEL Gas-transport GmbH to it. The intermediate holding company performs WIGA’s financing function for the two companies and is accounted for in the BASF Group’s financial statements us-ing the equity method. The companies under the WIGA umbrella operate a 3,300-kilometer long-distance pipeline network that includes links to the Nord Stream pipeline, the Baltic Sea Pipeline Link (OPAL) and the North European Gas Pipeline (NEL). GASCADE Gastransport GmbH plans, as project devel-oper, to construct the 485-kilometer European gas pipeline link (EUGAL), which will extend from the Baltic sea in north-ern Germany to the Czech border. Its maximum annual transportation capacity of 51 billion cubic meters is to be achieved in two phases by 2020. The project will be imple-mented under a fractional ownership agreement with our
partners Fluxys Deutschland GmbH, Düsseldorf, Gasunie Deutschland Transport Services GmbH, Hannover, and ONTRAS Gastransport GmbH, Leipzig, each of which holds a 16.5% share. We hold a 15.5% share in the Nord Stream pipeline that started up in 2011 through Nord Stream AG, based in Zug, Switzerland, which is accounted for in the BASF Group’s financial statements using the equity method. Other share-holders are the Gazprom (51%), E.ON (15.5%), N.V. Neder-landse Gasunie (9%) and ENGIE (9%) groups. With a total capacity of 55 billion cubic meters of natural gas per year, this pipeline, which stretches from Russia to the German coast over the Baltic Sea, helps strengthen the security of supply in Europe. Wintershall is contributing to the financing of the new Nord Stream 2 project as a co-creditor. Its implementation will strengthen infrastructure and security of supply in Europe, which is particularly important given the decline in production there. Together with the ENGIE, OMV, Royal Dutch Shell and Uniper groups, Wintershall signed long-term financing agree-ments with the project company Nord Stream 2 AG, Zug, Switzerland, on April 24, 2017. The five European energy companies committed to long-term financing of 50% of the entire project costs, which are currently estimated at €9.5 bil-lion. Wintershall will provide up to €950 million. As of Decem-ber 31, 2017, €324 million of this amount had already been called up. Gazprom is the sole shareholder of the project company Nord Stream 2 AG.

BASF Report 2017 Management’s Report
The BASF Group business year — Oil & Gas 89
Oil & Gas segment
▪ Sales improve by 17% to €3,244 million due to higher prices and volumes
▪ 53% increase in EBIT before special items to €793 million mainly from higher prices
In the Oil & Gas segment, sales to third parties increased by €476 million year-on-year to €3,244 million as a result of higher prices and volumes. The price of a barrel of Brent crude oil averaged $54 in 2017 (previous year: $44). Gas prices on European spot markets rose by 24% compared with the pre-vious year. Volumes growth was mainly driven by higher gas sales volumes. Production volumes matched the prior-year level.
Oil & Gas – Factors influencing sales
Volumes 4%
Prices/currencies 13%
Portfolio 0%
Sales 17%
Oil & Gas – Sales by region (Location of customer)
1 Europe 83%
2 North America 0%
3 Asia Pacific 0%
4 South America, Africa, Middle East 17%
Income from operations (EBIT) before special items grew by €276 million to €793 million in 2017. This is primarily attributable to the increase in oil and gas prices as well as the higher earnings contribution from our share in the Yuzhno Russkoye natural gas field. Comprehensive measures aimed at optimizing exploration and technology projects as well as the successful implementation of operational cost-saving measures also had a positive effect. EBIT rose by €544 million to €1,043 million. This included special income from the reversal of impairments in Norway and the Netherlands as well as from the sale of shares in the Aguada Pichana concession in Argen-tina. This was partially offset by an impairment on exploration potential in Norway. Net income increased by €357 million to €719 million.
For the Outlook for 2018, see page 123
At 164 million barrels of oil equivalent (BOE), our oil and gas production was on a level with the previous year. In the search for new oil and gas reservoirs, we completed a total of seven exploration and appraisal wells in 2017, of which three were successful. Our proven oil and gas reserves rose by 3% compared with the end of 2016, to 1,677 million BOE. We replenished 133% of the volumes produced in 2017. The reserves-to-production ratio is around 10 years (2016: 10 years). This is based on Wintershall’s production in 2017 and the reserves at year-end.
1
4
€3,244 million
Segment data1 (million €)
2017 2016 Change in %
Sales to third parties 3,244 2,768 17
Intersegmental transfers 409 331 24
Sales including intersegmental transfers 3,653 3,099 18
Income from operations before depreciation and amortization (EBITDA) 2,069 1,596 30
EBITDA margin % 63.8 57.7 –
Depreciation and amortization2 1,026 1,097 (6)
Income from operations (EBIT) 1,043 499 109
Special items 250 (18) .
EBIT before special items 793 517 53
EBIT after cost of capital (175) (744) 76
Assets 11,967 12,829 (7)
Investments including acquisitions3 988 1,115 (11)
Research and development expenses 46 39 18
Exploration expenses 104 94 11
Net income4 719 362 99
1 Supplementary information on the Oil & Gas segment can be found from page 235 onward 2 Amortization of intangible assets and depreciation of property, plant and equipment (including impairments and reversals of impairments) 3 Additions to intangible assets and property, plant and equipment 4 More on this figure can be found in the reconciliation reporting for Oil & Gas in the Notes to the Consolidated Financial Statements from page 191 onward.

90 Management’s Report BASF Report 2017
The BASF Group business year — Other
Other
Sales in Other rose by €224 million compared with 2016 to €2,242 million, mainly as a a result of higher sales prices in the raw materials trading business. At minus €764 million, income from operations before special items in Other was up €286 mil-lion on the prior-year figure. This is largely attributable to valu-ation effects for our long-term incentive program.
Data for Other1 (million €)
2017 2016 Change in %
Sales 2,242 2,018 11
Income from operations before depreciation and amortization (EBITDA) (679) (972) 30
Amortization and depreciation2 120 119 1
Income from operations (EBIT) (799) (1,091) 27
Special items (35) (41) 15
EBIT before special items (764) (1,050) 27
Thereof costs for cross-divisional corporate research (379) (395) 4
costs of corporate headquarters (224) (222) (1)
other businesses 60 54 11
foreign currency results, hedging and other measurement effects (28) (331) 92
miscellaneous income and expenses (193) (156) (24)
Assets3 13,676 9,374 46
Investments including acquisitions4 186 121 54
Research and development expenses 381 398 (4)
1 Information on the composition of Other can be found in the Notes to the Consolidated Financial Statements from page 191 onward. 2 Amortization of intangible assets and depreciation of property, plant and equipment (including impairments and reversals of impairments) 3 Contains assets of businesses recognized under Other as well as reconciliation to assets of the BASF Group 4 Additions to intangible assets and property, plant and equipment

BASF Report 2017 Management’s Report
The BASF Group business year — Regional results 91
Regional results
Europe
▪ Sales up 13% compared with 2016 at €30,778 million ▪ Acquisitions strengthen businesses in key European
markets
Sales at companies located in Europe rose by 13% year-on-year to €30,778 million. This was mainly due to significant price increases, especially in the Chemicals segment, as well as higher volumes. Sales rose in all segments: In the Chemicals segment, this was largely attributable to significantly higher prices in the Petrochemicals and Monomers divisions. Slightly higher volumes and prices led to growth in the Performance Products segment. As well as price increases, the positive sales devel-opment in the Functional Materials & Solutions segment was mainly driven by the Chemetall business acquired in December 2016. Sales growth in the Agricultural Solutions segment was primarily due to slightly higher volumes. The main factors in the Oil & Gas segment were considerable price and volumes growth. Income from operations (EBIT) increased by 31% as against the previous year to €4,742 million, largely on account of the considerably higher contributions from the Chemicals and Oil & Gas segments. We want to strengthen our position in key European markets with investments such as the expansion of our pro-duction site for emissions catalysts in Sroda Slaska, Poland, or the inauguration of our production facility for construction chemicals in St. Petersburg, Russia. In addition, we also aim to complement and further expand our portfolio in Europe with the agreed acquisition of significant parts of Bayer’s seed and non-selective herbicide businesses and the planned acquisi-tion of the global polyamide business from Solvay.
North America
▪ Year-on-year sales growth of 9% to €15,937 million ▪ Ongoing investments in production plants
Sales at companies located in North America rose by 9% compared with 2016 to €15,937 million. In local currency terms, sales were up by 10%. This was driven by higher sales prices and volumes growth, especially in the Chemicals and Agricultural Solutions segments, as well as the acquisition of the Chemetall business in December 2016. Sales were damp-ened by currency effects. EBIT was up 11% on the 2016 figure, at €1,236 million. The significantly higher contributions from the Chemicals and Agricultural Solutions segments more than compensated for the decline in earnings in the Functional Materials & Solutions and Performance Products segments. Earnings in the Func-tional Materials & Solutions segment declined as a result of lower margins and higher fixed costs. In the Performance Products segment, the decline in margins was largely attribut-able to higher raw materials prices. In this region, we focus on innovation, attractive market segments and strategic partnerships with customers in order to grow profitably. At the same time, we are increasing our operational excellence and optimizing our portfolio through continuous improvement. We plan to further strengthen our position in the region with the agreed acquisition of significant parts of Bayer’s seed and non-selective herbicide businesses. We intend to continuously invest in our production facilities. For example, we are constructing a new ammonia plant in Freeport, Texas, together with Yara, expanding production for mobile emissions catalysts in Huntsville, Alabama, and increasing capacities for automotive coatings in Greenville, Ohio, and Tultitlán, Mexico.
Regions (million €)
Sales by location of company
Sales by location of customer
Income from operations by location of company
2017 2016Change
in % 2017 2016Change
in % 2017 2016Change
in %
Europe 30,778 27,221 13 29,214 26,039 12 4,742 3,632 31
Thereof Germany 19,873 17,540 13 8,359 7,412 13 1,913 1,582 21
North America 15,937 14,682 9 15,357 14,042 9 1,236 1,113 11
Asia Pacific 13,658 11,512 19 14,343 12,165 18 2,209 1,098 101
South America, Africa, Middle East 4,102 4,135 (1) 5,561 5,304 5 335 432 (22)
64,475 57,550 12 64,475 57,550 12 8,522 6,275 36

92 Management’s Report BASF Report 2017
The BASF Group business year — Regional results
1 Our chemicals business comprises the Chemicals, Performance Products and Functional Materials & Solutions segments.
Sales by region (Location of company)
1 Germany 31%
2 Europe (excl. Germany) 17%
3 North America 25%
4 Asia Pacific 21%
5 South America, Africa, Middle East 6%
1
23
4
5
€64,475 million
Income from operations by region (Location of company)
1 Germany 22%
2 Europe (excl. Germany) 33%
3 North America 15%
4 Asia Pacific 26%
5 South America, Africa, Middle East 4%
1
23
4
5
€8,522 million
Asia Pacific
▪ Sales 19% above prior-year level at €13,658 million ▪ Local production expanded through new plants in
Asia
Sales at companies located in the Asia Pacific region rose by 19% to €13,658 million in 2017. In local currency terms, sales increased by 21%. All segments contributed to this growth. The increase was mainly attributable to higher sales prices, especially in the Chemicals segment, as well as the 8% increase in volumes. The Functional Materials & Solutions and Performance Products segments in particular recorded volumes growth. By contrast, sales were weighed down by currency effects. Overall, portfolio measures had no material effect on sales development in 2017. EBIT in the region grew by 101% to €2,209 million. This was primarily due to a higher overall margin and volumes growth in all segments. There was a particularly strong increase in the contribution from the Chemicals segment. As part of our regional strategy, we want to further increase the proportion of sales from local production in Asia Pacific. We once again made progress toward this goal in 2017: One example is the mobile emissions catalysts production site opened in Chennai, India, in March 2017. In Shanghai, China, we started up a large-scale plant for the production of chemi-cal catalysts in November 2017. We will continue to work on this goal in 2018. We also inaugurated our new Innovation Campus Mumbai in India, whose research focuses on crop protection and process development. It represents BASF’s largest research and devel op ment investment in South Asia to date. Our investments in production facilities and research serve to bring products to market for our local and global customers in the growing region of Asia.
South America, Africa, Middle East
▪ Sales decline 1% to €4,102 million ▪ Investment in digital sales channels
Sales at companies located in the region South America, Africa, Middle East declined by 1% as against 2016 to €4,102 million. In local currency terms, sales were on a level with the previous year. After two years of recession in Brazil, the South American economy stabilized at a low level in 2017. Under these condi-tions, our sales rose slightly as a result of volumes growth, positive currency effects and higher prices in the chemicals business.1 Price declines and currency effects impacted the crop protection business in particular. In the Oil & Gas seg-ment, sales were lifted slightly by higher prices despite nega-tive currency effects and lower production volumes. Companies in Africa and in the Middle East posted a con-siderable sales decrease. In Africa, this was primarily due to lower volumes. In the Middle East, sales were mainly weighed down by negative currency effects. At €335 million, EBIT was 22% below the prior-year figure, mainly due to the decline in the Agricultural Solutions segment in Brazil. In South America in 2017, we completed the implementa-tion of a series of structural measures that increase our pro-ductivity and further sharpen the focus on our customers’ needs. We also aim to expand our sales channels. The objec-tive is to better develop new customer segments, for instance with digital sales channels, especially in the faster-growing South American markets.

BASF Report 2017 Management’s Report
Responsibility along the value chain — Suppliers 93
Responsibility along the value chainSuppliers
Our objective is to secure competitive advantages for BASF through professional procurement structures. Our suppliers are an important part of our value chain. Together with them, we aim to create value and minimize risks.
Strategy
As well as a reliable supply of raw materials, technical goods and services at competitive prices, our partnerships with suppliers are based on mutual value creation. We work together in an open and transparent way to realize long-term benefits for both sides. In doing so, we create added value that goes above and beyond procurement alone, for example by developing solutions to target market-specific customer requirements together with our suppliers. Our sustainability-oriented supply chain management also contributes to risk management by clarifying our expectations and standards for our suppliers, and by supporting them in carrying out our requirements. We count on reliable supply relationships and want to make our suppliers’ contribution to sustainable development transparent. In order to achieve this, we set ourselves an ambitious goal: By 2020, we aim to evaluate the sustainability performance of 70% of the BASF Group’s relevant suppliers1 and develop action plans for any necessary improvements.
2020 Goal
Percentage of relevant suppliers evaluated for their sustainability performance 70%
In 2017, we reviewed our evaluation methods for high-risk suppliers in order to focus even more closely on relevant issues. For example, we increased the weighting of industry- and country-specific risks in the evaluation to avoid the ambiguities in the previous system. The proportion of relevant suppliers evaluated by the end of 2017 in accordance with the new risk approach was 56%.2
Worldwide procurement
Our 70,000+ suppliers play a significant role in value creation at our company. We work in long-term partnership with companies from different industries around the world. They supply us with important raw materials, chemicals, investment goods and consumables, and perform a range of services. BASF acquired raw materials, goods and services for our own production totaling approximately €38 billion in value in 2017. There were no substantial changes with respect to our suppliers in 2017.
What we expect from our suppliers
▪ Global Supplier Code of Conduct ▪ Country-specific risk analysis forms basis of new
supplier selection
New suppliers are selected and existing suppliers are evalu-ated not only on the basis of economic criteria, but also on environmental, social and corporate governance standards. Our Supplier Code of Conduct is founded on internationally recognized guidelines, such as the principles of the United Nations’ Global Compact, the International Labor Organization (ILO) conventions and the topic areas of the Responsible Care® initiative. The Code of Conduct covers compliance with human rights, labor and social standards, and antidiscrimination and anticorruption policies in addition to protecting the environ-ment. The Code is available in 26 languages. A country-based risk analysis forms the basis of our selection process for new suppliers. As a result of the country- related risks identified in South America and Asia, we specifically asked 6,467 suppliers in these regions to commit to the values of our Supplier Code of Conduct in 2017. Only those companies that have committed to our Code of Conduct actually became new suppliers.
Suppliers BASF Customers
1 Our suppliers are evaluated based on risk due to the size and scale of our supplier portfolio. We define relevant suppliers as those showing an elevated sustainability risk potential as identified by our risk matrices and our purchasers’ assessments. We also use further sources of information to identify relevant suppliers such as evaluations from Together for Sustainability (TfS), a joint initiative of chemical companies for sustainable supply chains.
2 The proportion of relevant suppliers evaluated by the end of 2016 in accordance with the new risk approach was 55% (in accordance with the previous risk approach: 32%). The change in the percentage figure is due to the amended risk evaluation method and the greater integration of evaluations from other TfS companies.

94 Management’s Report BASF Report 2017
Responsibility along the value chain — Suppliers
Training
In 2017, we continued our collaborations in China and Brazil to instruct suppliers on sustainability standards. 179 sup pliers received training in 2017 as part of local partnerships with the East China University of Science and Technology in Shanghai and the Espaço Eco® Foundation in Brazil, for example. In addition, we instructed 704 BASF employees on sustainability- oriented supplier management. These are ways in which potential supply chain risks can be identified and minimized together with our suppliers.
Evaluating our suppliers
▪ “Together for Sustainability” initiative aims to harmonize and standardize supplier assessments and audits
▪ 120 raw material supplier sites audited
BASF is a founding member of the Together for Sustainability (TfS) initiative of leading chemical companies for the global standardization of supplier evaluations and auditing. With the help of TfS, we promote sustainability in the supply chain. The initiative aims to develop and implement a global program for the responsible supply of goods and services and improve suppliers’ environmental and social standards. The evaluation process is simplified for both suppliers and TfS member companies by a globally uniform questionnaire. The 20 mem-bers of the initiative conducted a total of 1,794 sustainability assessments and 441 audits in 2017. The collaboration between the TfS initiative and the China Petroleum and Chemical Industry Federation (CPCIF) to educate suppliers and raise awareness of sustainability topics continued in 2017. More than 300 participants took part in a joint TfS/CPCIF course. Using TfS evaluations, we pursue a risk-oriented approach with clearly defined, BASF-specific follow-up processes. A total of 120 raw material supplier sites were audited on sustainability standards in 2017. We also received sustainability assessments for 513 suppliers from an external service pro-vider. If we identify potential for improvement, we support suppli-ers in developing measures to fulfill our standards. We conduct another review according to a defined timeframe based on the sustainability risk measured. If the weak points discovered
were particularly severe and we are unable to confirm any improvement, we reserve the right to terminate the business relationship. This occurred in one case in 2017. We use this approach to evaluate suppliers with an elevated sustainability risk at least every five years. The approach itself is reviewed every two years to identify possibilities for optimization.
For more information on “Together for Sustainability,” see basf.com/en/together-for-sustainability
Audit results
Our audits have identified some deviations with respect to environmental, social and corporate governance standards, for example in waste and wastewater management and relating to occupational safety, working hours and minimum wage. In the follow-up audits conducted in 2017, we found improvements in all areas. None of our 2017 audits identified instances of child labor. For the suppliers we reviewed, persons under 18 were excluded from overtime and danger-ous work. We did not find any incidences of forced labor in 2017. BASF undertook a thorough examination of the issues raised at platinum supplier Lonmin Plc, London, in connection with the events in Marikana, South Africa.1 We intensified our regular dialog with both Lonmin and with local stakeholders, such as leading industry and human rights representatives. We had an internationally recognized audit firm conduct a follow-up audit conducted at Lonmin in January 2017. This reviewed to which extent Lonmin had resolved the weaknesses we had identified in the first audit in 2015. The audit also addressed working conditions below ground, social and work schedules, communication between Lonmin and local stake-holders and affected parties, as well as the progress of the construction of employee housing. This follow-up audit reported positive findings in several areas such as working standards. However, it also identified gaps that Lonmin still has to close, such as assessing the impact of Lonmin’s operations on local communities, improving dialog with various stakeholders in the community and implementing a grievance mechanism. We maintain an ongoing, close dialog with Lonmin and will continue to support the company in its improvement process.
For more information on suppliers, see basf.com/suppliers
1 In 2012, an extended strike at a Lonmin Plc mine in Marikana, South Africa, culminated in a violent confrontation between mine workers and armed South African police. Employees of the platinum supplier Lonmin were among the fatalities. For more information on the supplier relationship with Lonmin, see basf.com/audits-lonmin.

BASF Report 2017 Management’s Report
Responsibility along the value chain — Raw materials 95
Raw materials
Responsible resource management is an integral part of our strategy. It is applied within the company through our Verbund concept, our innovative products and the use of renewable raw materials. In the search for alternative raw materials, we employ solutions that contribute to sustainability.
Strategy
The Verbund system is an important component of our resource efficiency strategy: The by-products of one plant of-ten serve as feedstock elsewhere, thus helping us to use raw materials more efficiently. In 2017, BASF purchased a total of around 30,000 different raw materials from more than 6,000 suppliers. Some of our most important raw materials are naphtha, natural gas, methanol, ammonia and benzene. In addition to fossil resources, we also employ renewable raw materials. We use these to manufacture products that either cannot be made with fossil resources, or only at significantly greater expense, for example. Depending on the application, the better solution can be fossil or renewable raw materials. Renewable raw materials are not sustainable per se, but can contribute to sustainability by, for example, reducing green-house gas emissions.
Renewable resources
▪ Joint venture with Avantium ▪ Numerous projects to improve sustainability along
the value chain
In 2017, around 5% of the raw materials we purchased world-wide were from renewable resources. To make the use of these materials more competitive, we work on product innovations based on renewable raw materials as well as on enhancing production processes. We also further established our biomass balance approach on the market in 2017. The goal here is to replace natural gas and naphtha at the beginning of the value chain with biogas and bio-naphtha from certified sustainable production. Should a customer select a biomass balanced product, the proportion of renewable feedstock to be used is calculated based on the formulation. The calculation model is certified by an indepen-dent third party (TÜV Süd). Our Verbund production ensures that the properties and quality of all end products remain unchanged and that our customers can use them as usual. This method has already been applied for more than 50 BASF products – for example, for superabsorbents, dispersions, plastics such as polyamides and polyurethanes, and for inter-mediates available on the market as “drop-in products.” These
can be used in place of previously employed products in the production process without having to change the process itself. Synvina C.V., Netherlands, a joint venture of BASF and Avantium based in Amsterdam, has been producing and marketing furandicarboxylic acid (FDCA) from renewable resources since being established in 2016. FDCA is the most important chemical component of polyethylenefuranoate (PEF), a new plastic that is marketed by Synvina. In 2017, Synvina intensified its cooperation with partners along the entire value chain with the aim of making PEF commercially available in the medium term. One major step was the prelim-inary approval granted in 2017 to recycle PEF bottles in the European market and thus to integrate PEF into the circular economy. PEF has a broad application profile and is especially suitable for producing certain food packaging materials, such as films and plastic bottles. Compared with conventional plas-tics, PEF demonstrates higher barrier properties for gases like carbon dioxide and oxygen, extending the shelf life of pack-aged products. In addition, its higher degree of mechanical strength allows for thinner – and therefore lighter – packaging. Another product based on renewable feedstock that we offer our customers on a commercial scale is 1,4-butanediol (BDO), which is made from sugars. We use BDO to produce bio-based polytetra ydrofuran 1000 (PolyTHF® 1000), which pri-marily serves as a chemical component in thermoplastic polyurethane (TPU), an ingredient used to manufacture ski boots and roller skates, shoe soles, dashboard films in the automotive industry, and other products. Palm oil, palm kernel oil, and their derivatives are some of our most important renewable raw materials. We aim to ensure that these raw materials come from sustainable, certified sources, and actively support the Roundtable on Sustainable Palm Oil (RSPO). In 2017, we published our first progress report – the BASF Palm Progress Report – for greater transparency in the value chain. Based on the volun-tary commitment to sustainably source palm oil products that we expanded in 2015, we were able to purchase large volumes of certified palm kernel oil in 2017 despite a difficult business environment. In addition, our BASF Palm Sourcing Policy addresses the requirements for protecting and preserving forests and peatland, along with the involvement of local communities in decision-making processes. We further expanded the support offered to our customers to help them meet their voluntary commitments: BASF stepped up its commitment to certified sustainable oil palm products in the German, Austrian and Swiss markets by join-ing the Forum for Sustainable Palm Oil in 2017 as a manufac-turer of oleo derivatives. Demand for certified products again increased significantly.
Suppliers BASF Customers

96 Management’s Report BASF Report 2017
Responsibility along the value chain — Raw materials
In order to involve smallholder farmers and improve their living conditions, BASF and Henkel have cooperated with the devel-opment organization Solidaridad since 2016 to provide training for around 5,500 farmers in Indonesia. To date, more than 1,700 smallholders have completed a training program as part of the Farmer Field School initiative. BASF also advanced the RSPO supply chain certification of its sites for cosmetic ingredients. In 2017, 20 production sites worldwide were RSPO certified. Our goal is to only source RSPO certified palm oil and palm kernel oil by 2020, provided it is available on the market. By 2025, this voluntary commit-ment will be expanded to include the most important interme-diate products based on palm oil and palm kernel oil; these include fractions and primary oleochemical derivatives as well as edible oil esters. BASF is working together with Cargill, Proctor & Gamble and the German governmental agency for international cooperation (Gesellschaft für Internationale Zusammenarbeit, or GIZ) to help set up a certified and transparent supply chain for coconut oil in the Philippines and Indonesia. The project is being financed in part by the “develoPPP.de” program of the German Federal Ministry for Economic Cooperation and Development (BMZ). It is expected to improve income and living standards for around 3,300 smallholders. The joint initiative established by BASF together with Arkema, Jayant Agro and the non-governmental organization Solidaridad to promote sustainability in the castor oil supply chain continued in 2017. With the Sustainable Castor Initiative – Pragati, the project members aim to improve the economic situation of castor oil farmers and their employees in India by helping them to optimize their yield and reduce the impact on the environment. The first smallholders were trained and audited in 2017 based on a newly developed sustainability code. This enables the Indian smallholders to offer certified sustainable castor oil on the global market in the future. The project is scheduled to run for three years until 2019.
For more information on renewable resources, see basf.com/renewables
For more information on our voluntary commitment to palm oil products, see basf.com/en/palm-dialog
Mineral raw materials
We procure a number of mineral raw materials, like precious metals, that we use to produce process and mobile emissions catalysts. In suspected cases, we track the origins of minerals – as defined in the Dodd-Frank Act – to see if they come from mines in conflict regions. We reserve the right to conduct an external audit and, if necessary, terminate our business relationship. The suppliers addressed have confirmed to us that they do not source minerals matching this definition of conflict minerals from the Democratic Republic of the Congo or its neighboring countries. BASF is working on the implementation of the E.U. Conflict Minerals Regulation published in May 2017. This lays down supply chain due diligence obligations that must be met by importers and processors of certain mineral raw materials such as tin, tantalum, tungsten, their ores and gold originating from conflict regions and high-risk areas. BASF is committed to fostering a responsible and sustainable global supply of cobalt. As such, in 2017 BASF became a founding member of the Responsible Cobalt Initiative and the World Economic Forum’s Global Battery Alli-ance. These initiatives were created by companies in collabo-ration with international organizations such as the OECD and UNICEF to address fundamental challenges in the supply chain of battery materials. BASF mainly uses the mineral raw material mica and mica- based effect pigments in the production of coatings. Our demand is largely met with mica from our own mine in Hartwell, Georgia. We require our mica suppliers to comply with internationally recognized standards, including the prohi-bition of child labor. As a member of the Responsible Mica Initiative (RMI), BASF is actively working to eradicate child labor and unacceptable working conditions in the mica supply chain in India.

BASF Report 2017 Management’s Report
Responsibility along the value chain — Environment, health, safety and security — Responsible Care Management System97
Environment, health, safety and securityResponsible Care Management System
The protection of people and the environment is our top priority. Our core business – the development, production, processing and transportation of chemicals – demands a responsible approach. We systematically address risks with a comprehensive Responsible Care Management System, which is constantly being further developed. We expect our employees and contractors to know the risks of working with our products, substances and plants and handle these responsibly.
Responsible Care Management System
▪ Global directives and standards for safety, security, health and environmental protection
▪ Regular audits to monitor performance and progress
BASF’s Responsible Care Management System comprises the global directives, standards and procedures for safety, security, health and environmental protection for the various stations along our value chain. Our regulations cover the transportation of raw materials, activities at our sites and warehouses, and distribution of our products as well as our customers’ application of the products. Specifications for implementing these measures are laid out in binding directives that are introduced in consultation with employee representatives. These describe the relevant responsibilities, requirements and assessment methods. Our policies and requirements are constantly updated. We also maintain a dialog with government institutions, associations and other international organizations. We set ourselves ambitious goals for safety and security, and health and environmental protection. We regularly conduct audits to monitor our performance and progress. We assess the potential risks and weak points of all our activities – from research to production and logistics – and the effects of these on the safety and security of our employees, the environment or our surroundings. In our databases, we docu-ment accidents, near misses and safety-related incidents at our sites as well as along our transportation routes to learn from these; appropriate measures are derived according to specific cause analyses.
For more information on Responsible Care®, see basf.com/en/responsible-care
Audits
▪ 109 safety, security, health and environmental protection audits performed at 83 sites
Regular audits help ensure that standards are met for safety, security, health and environmental protection. We conduct audits at BASF sites and at companies in which BASF is a majority shareholder. Sites and companies acquired as part of acquisitions are audited in a timely manner to bring these into line with our standards and directives. We have defined our regulations for Responsible Care audits in a global Group requirement. During our audits, we create a safety and environmental profile that shows if we are properly addressing the existing hazard potential. If this is not the case, we agree on measures and conduct follow-up audits on their implementation. Our internal audit system complies with the standards for external auditing procedures ISO 19011 and OHSAS 18001. Worldwide, 178 BASF production sites are certified in accor-dance with ISO 14001 (2016: 155). In the BASF Group in 2017, 109 environmental and safety audits were conducted at 83 sites. The focus was on auditing sites based on the level of risk. For production plants with a medium and high hazard potential, we conducted an additional 63 short -notice audits at 47 sites. We audited 13 sites with respect to occupational medicine and health protection in 2017. The number of these audits declined due to the risk-based approach to site selection. In addition, 31 health perfor-mance control visits were conducted at sites with low to medium health risks.
For more information on occupational safety and health protection, see page 98 onward
Costs and provisions for environmental protection in the BASF Group (million €)
2017 2016
Operating costs for environmental protection 1,024 1,011
Investments in new and improved environmental protection plants and facilities1 234 206
Provisions for environmental protection measures and remediation2 600 588
1 Investments comprise end-of-pipe measures as well as integrated environmental protection measures.
2 Values shown refer to December 31 of the respective year.
For more information, see the Notes to the Consolidated Financial Statements on pages 196 and 217
Suppliers BASF Customers

98 Management’s Report BASF Report 2017
Responsibility along the value chain — Environment, health, safety and security — Production
Production
For occupational and process safety as well as health and environmental protection and corporate security, we rely on comprehensive preventive measures and expect the cooperation of all employees and contractors. Our global safety and security concepts serve to protect our employees, contractors and neighbors as well as to prevent property and environmental damage and protect information and company assets.
Strategy
▪ Global safety standards ▪ Strengthening risk awareness ▪ Comprehensive incident analyses and global
experience and information exchange
The safety of our employees, contractors, neighbors and the environment is our top priority. This is why we have set our-selves ambitious goals for occupational and process safety as well as health protection. We stipulate globally mandatory standards for safety, security, and environmental and health protection. A world-wide network of experts supports us in their implementation. We regularly monitor progress toward our goals as part of our continuous improvement process. Risk-conscious working behavior is promoted for every individual through measures like systematic hazard assess-ments, specific and ongoing qualification measures and global safety initiatives. We analyze accidents, incidents and their causes in detail at a global level to learn from these. Hazard analyses and the risk minimization measures derived from them are an important prevention tool. We also promote regular dialog across different sites to strengthen risk awareness among our employees and contractors, to learn from examples of good practice and in this way, continually develop the safety culture. Based on our corporate values, leaders serve as safety role models for our employees.
Global safety initiative
▪ Global Safety Days focus on order, cleanliness and discipline
Our global safety initiative was established in 2008 and plays a key role in the continuous development of the safety culture. With over 930 activities at around 360 sites, our 2017 Global Safety Days focused on order, cleanliness and discipline to help reduce the risk of accidents. At the Ludwigshafen site
alone, 13,000 employees and contractors registered to participate. This involvement and lively discussion make a major contribution to our safety culture.
For more information on the global safety initiative, see basf.com/global-safety-initiative
Occupational safety
▪ Employees and contractors worldwide instructed on safe behavior
We have made it our goal to reduce the worldwide lost-time injury rate per one million working hours to 0.5 at most by 2025.1 To prevent work-related accidents, we promote risk-conscious behavior and safe working practices for every individual. We are constantly refining and enhancing our requirements. In addition to the legally required briefings, we also held training courses on safe procedures in 2017 to strengthen risk awareness among our employees and contractors and prevent work-related accidents. At the Ludwigshafen site in Germany, our training center has offered continuous further education on diverse safety and security topics for employees and contractors since 2010. Some 22,000 participants received training in 2017.
2025 Goal1
Reduction of worldwide lost-time injury rate per one million working hours ≤0.5
In 2017, 1.4 work-related accidents per one million working hours occurred at BASF sites worldwide (2016: 1.52), reducing the proportion of chemical-related accidents to 5% (2016: 9%). The rate of work-related accidents for contractors was at 1.5 in 2017 (2016: 1.5). Unfortunately, there were two fatal work-related accidents in 2017. In 2016, four incidents occurred with a total of eight fatalities (seven in the same year). BASF is performing a com-prehensive analysis of the incidents and using the findings to derive appropriate measures. One employee of a contractor died during demolition work in McIntosh, Alabama, in November. The cause of the accident is still being investigated by BASF and the relevant authorities in Alabama. In November, one employee of a contractor died as a result of a traffic accident at the Shanghai-Pudong site in China. The cyclist was hit by a truck. The exact cause of the accident is still being investigated by BASF and the relevant
Suppliers BASF Customers
1 For 2018, we will adapt our reporting on accidents and process safety incidents to the recommendations of the International Council of Chemical Associations (ICCA), the European Chemical Industry Council (CEFIC) and the German Chemicals Industry Association (VCI). To implement these recommendations, we also have to convert our targets. Consequently, our goal from 2018 onward is to reduce occupational and process safety incidents to a rate of no more than 0.1 per 200,000 working hours by 2025 (previous goal: a rate of no more than 0.5 incidents per one million working hours).
2 The 2016 figure has been restated as against the previous year’s report from 1.4 to 1.5 due to retrospective accident reports.

BASF Report 2017 Management’s Report
Responsibility along the value chain — Environment, health, safety and security — Production99
local authorities. Refresher training on traffic safety was held for employees of contractors at the site following the accident. We will review additional measures based on the results of the investigation into the cause of the accident. In September 2017, one employee of the BASF fire department succumbed to injuries sustained in the accident at the North Harbor at BASF SE in Ludwigshafen, Germany, in October 2016. An explosion and subsequent fires occurred during work on a pipeline. Four employees of the BASF fire department and one barge crewman lost their lives in or as a result of the accident. Twenty-eight people were injured. Ac-cording to a report on the cause of the fire commissioned by the district attorney’s office of the city of Frankenthal, Germa-ny, the explo sion and subsequent fires occurred during work performed with an angle grinder. It states that one employee of a contractor cut into the wrong pipeline, triggering the chain reac tion that caused the explosion. The report rules out other causes or technical defects at the North Harbor plants. BASF continues to support the relevant authorities in their investi-gations.
For more information on occupational safety, see basf.com/occupational_safety
Lost-time injury rate per one million working hours
Process safety
▪ Plant protection plans to reduce process safety incidents
▪ Network of experts and global training methods foster dialog
Process safety is a core part of safe and efficient production. We meet high safety standards in the planning, construction and operation of our plants around the world. Some of these go beyond local legal requirements. Our global process safety standards provide the frame-work for the safe construction and operation of our plants as well as the protection of people and the environment. Our experts have developed a protection plan for every plant that considers the key aspects of safety, health and environmental protection – from conception to startup – and stipulates specific protection measures for each.
We use the number of process safety incidents per one million working hours as a key performance indicator, following to a large extent the definition set by the European Chemical Industry Council (CEFIC). In 2017, we recorded 2.0 process safety incidents per one million working hours worldwide (2016: 2.0). We pursue continual improvement by investigating every incident in detail, analyzing root causes and using the findings to derive suitable measures. We have set ourselves the goal of reducing process safety incidents to a rate of no more than 0.5 per one million working hours by 2025.1
2025 Goal1
Reduction of worldwide process safety incidents per one million working hours ≤0.5
In order to maintain the highest level of safety at our plants across their entire life cycle, we review the implementation of our protection plans in all facilities at regular intervals and depending on hazard potential. We periodically perform in-depth audits of our plants and update their safety concepts where necessary. Our training methods are constantly refined and enhanced to increase risk awareness. We are working on increasing the availability of our plants and determining the optimum point in time for maintenance measures. The aim is to further reduce unscheduled shut-downs with a digitalization pilot project. Implementation began in 2017, starting with the steam cracker in Ludwigshafen and other plants at the following sites: Ludwigshafen, Germany; Antwerp, Belgium; Schwarzheide, Germany; Port Arthur, Texas; Geismar, Louisiana; and Freeport, Texas. We also plan to implement this at further plants around the world. We play an active role in improving process safety around the world in a global network of experts, through our involvement in organizations such as the International Council of Chemical Associations (ICCA), the Center for Chemical Process Safety (CCPS) and the European Process Safety Centre (EPSC), and by fostering dialog with government institutions.
For more information on process safety, see basf.com/process_safety
2015 2016 20172014201320122002 2025 Goal
3.3
1.71.4 1.5 1.4
0.5
1.5 1.4
1 For 2018, we will adapt our reporting on accidents and process safety incidents to the recommendations of the International Council of Chemical Associations (ICCA), the European Chemical Industry Council (CEFIC) and the German Chemicals Industry Association (VCI). To implement these recommendations, we also have to convert our targets. Consequently, our goal from 2018 onward is to reduce occupational and process safety incidents to a rate of no more than 0.1 per 200,000 working hours by 2025 (previous goal: a rate of no more than 0.5 incidents per one million working hours).

100 Management’s Report BASF Report 2017
Responsibility along the value chain — Environment, health, safety and security — Production
Health protection
▪ Global corporate health management standards ▪ Focus in 2017: Lung and respiratory health
Our global health management serves to promote and maintain the health and productivity of our employees. Our worldwide standards for occupational medicine and health protection are specified in a directive that is implemented by a global network of experts. This was once again supported by numerous emergency drills and health promotion measures in 2017. We measure our performance in health protection using the Health Performance Index (HPI). The HPI comprises five components: recognized occupational diseases, medical emergency preparedness, first aid, medical surveillance examinations and health promotion. Each component contributes a maximum of 0.2 to the total score. The highest possible score is 1.0. Our goal is to reach a value of more than 0.9 every year. With an HPI of 0.97, we once again fulfilled the ambitious goal of exceeding 0.9 each year in 2017 (2016: 0.96). Our 2017 global health campaign focused on lung and respiratory health. Employees received an individual recommendation based on a self-evaluation, including lung function testing or consultation with a physician as necessary. The health campaign was offered by over 450 sites worldwide.
Annual goal
Health protectionHealth Performance IndexMaximum score 1.0 >0.9
We raise employee awareness of health topics through offers tailored toward specific target groups. The BASF health checks form the foundation of our global health promotion program and are offered to employees at regular intervals.
For more information on occupational medicine, health promotion campaigns and the HPI, see basf.com/health
Emergency response and corporate security
▪ Regular review of emergency systems and crisis management structures
▪ Comprehensive protection measures against third-party interference
We are well prepared for crisis situations thanks to our global crisis management system. In the event of a crisis, our global, regional or local emergency response plans and crisis manage-ment structures are engaged, depending on the impact scope. We involve situation-related partners and suppliers as well as cities, communities and neighboring companies.
We regularly check our emergency systems, crisis manage-ment structures and drill procedures with employees, contractors, and local authorities and emergency rescue workers. Through 202 drills and simulations in 2017, we instructed participants in our emergency response measures. We analyze the potential risks associated with investment projects and define appropriate emergency response plans. We also protect our employees, sites and company know-how against third-party interference. This includes, for example, addressing potential terrorist risks in the communities around our sites. We inform business travelers, transferees and employees about appropriate protection measures prior to and during travel in countries with elevated security risks. After any major incident such as a terrorist attack or a natural catastrophe, we have the possibility of more quickly and accurately locating and contacting employees in the affected regions through a standardized global travel research system. We discuss safe conduct in crisis situations with leaders and employees and train them on this. Aspects of human rights related to site security, such as the right to liberty and security of person, are a component of the global qualification requirements of our security personnel. Respect for human rights is a mandatory element of any contract with service providers of the BASF Group who are active in this area. Our investment projects include performing comprehensive analyses of potential risks and defining appropriate protection measures. In 2017, we standardized the use of security services in further countries in order to increase effectiveness and efficiency. Around the world, we work to sensitize all employees about protecting information and know-how. For example, we further strengthened our employees’ awareness of risks in 2017 with training, case studies and interactive offerings. We have defined mandatory information protection requirements to ensure compliance with our processes for protecting sensitive information and perform audits to monitor this. Our worldwide network of information protection officers comprises more than 600 employees. They support the implementation of our uniform requirements and conduct seminars on secure behaviors. We provided information protection instruction to more than 72,000 participants in 2017. In addition, we published standardized Group-wide recommendations for the protection of information and knowledge.
For more information on emergency response, see basf.com/emergency_response
For more information on corporate security, see basf.com/corporate-security

BASF Report 2017 Management’s Report
Responsibility along the value chain — Environment, health, safety and security — Product stewardship101
Product stewardship
We review the safety of our products from research and development through production and all the way to our customers’ application. We work continuously to ensure that our products pose no risk to people or the environment when they are used responsibly and in the manner intended.
Strategy
▪ Global directives with uniformly high standards for product stewardship
We are committed to continuously minimizing the negative effects of our products on the environment, health, safety and security along the value chain – from development to disposal. This commitment to product stewardship is enshrined in our Responsible Care® charter and the initiatives of the International Council of Chemical Associations (ICCA). We also ensure uniformly high standards for product stewardship worldwide. Some of our voluntary initiatives go beyond local legal requirements. We provide extensive information on all our chemical sales products to our customers with safety data sheets in around 40 languages. This is achieved with the help of a global data-base in which we maintain and evaluate continuously updated environmental, health and safety data for our substances and products. Our global emergency hotline network provides information around the clock. We train and support our customers in fulfilling their industry-specific or application- specific product requirements. For example, in cooperation with the chemical association ICCA, BASF is pushing for the establishment of a voluntary global commitment to the controlled marketing of chemicals that could be misused for purposes other than industrial chemical applications. Producers in North America and Europe are already implementing the voluntary commitment. Manufacturers in China and Taiwan are currently in talks about joining the scheme as well. Our risk assessment goals support the implementation of initiatives such as the Global Product Strategy (GPS) of the International Council of Chemical Associations (ICCA). GPS is establishing worldwide standards and best practices to improve the safe management of chemical substances. In addition, we are also involved in workshops and training seminars in developing countries and emerging markets. In order to facilitate public access to information, we are participating in the setup of an ICCA online portal that provides more than 4,500 GPS safety summaries.
For more information on GPS, see basf.com/en/gps
Global goal
By 2020, we will conduct risk assessments for more than 99% of the substances and mixtures sold by BASF worldwide in quantities of more than one metric ton per year. We already reached 76.2% of this goal in 2017 (2016: 75.4%). The risk associated with using a substance is determined by the combination of its hazardous properties and its potential exposure to people and the environment.
2020 Goal
Risk assessment of products that we sell in quantities of more than one metric ton per year >99%
REACH and other legal requirements
▪ Third registration phase of REACH
We are working on registering substances produced in annual volumes between one and one hundred metric tons for the third and final phase of the E.U. chemicals regulation, REACH, which will end on May 31, 2018. Our REACH activities are increasingly determined by E.U. authorities’ decisions on additional studies in connection with the evaluation of submitted dossiers. Independently of this, BASF is also obligated to continuously update the registration dossiers it has submitted. Over 80% of our dossiers have already been updated, although the majority of these updates were under-taken on our own initiative and not as a response to official inquiry. We apply the experience we have gathered with REACH to fulfill new legal requirements around the world, such as in South Korea and Turkey. In 2017, BASF took the industry lead in South Korea with a large number of substance registrations and was one of the first companies to receive such registrations. We also advised government representatives on chemicals legislation in 2017, for example in Brazil and Columbia. We are seeing a rise in both regulatory requirements for agrochemicals and the number of additional studies required to obtain or extend approval for crop protection products. Potential risks for people and the environment are carefully assessed and minimized throughout the research, develop-ment and registration process for crop protection agents. We perform a large number of scientific studies every year to ensure that our products meet the highest safety require-ments.
Suppliers BASF Customers

102 Management’s Report BASF Report 2017
Responsibility along the value chain — Environment, health, safety and security — Product stewardship
Environmental and toxicological testing
▪ Use of alternative and complementary methods for animal studies
Before launching products on the market, we subject them to a variety of environmental and toxicological testing. We apply state-of-the-art knowledge in the research and development phase of our products. For instance, we only conduct animal studies when they are required by law and approved by respective authorities. Animal studies are at times stipulated by REACH and other national legislation outside the European Union in order to obtain more information on the properties and effects of chemical products. We adhere to the specifications laid down by the German Animal Welfare Act as well as the requirements of the Association for Assessment and Accreditation of Laboratory Animal Care – the highest standard for laboratory animals in the world. We are continually developing and optimizing alter-native and complementary methods, and we use them wherever it is possible and approved by the authorities. We use alternative and complementary methods in more than a third of our tests. Currently, 30 replacement and supplementary methods are being used in our labs and another 19 are in the development stage. BASF spent €3.4 million toward this purpose in 2017. One focus area of our research in 2017 and subsequent years is the development of alternative methods for testing the potential of substances that negatively affect organisms’ growth and development. Since 2016, our Experimental Toxicology and Ecotoxi-cology department has been working together with a total of 39 partners on one of the largest European collaborative projects for alternative methods. The project, planned to run for six years, aims to develop alternative methods to the point that chemical risk assessments can be efficiently conducted largely without animal testing.
For more information on alternative methods, see basf.com/alternative_methods
Management of new technologies
▪ Continual safety research on nano- and biotechnology
Nano- and biotechnology offer solutions for key societal challenges – for example, in the areas of climate protection or health and nutrition. Safe handling of nanomaterials is stipulated in our Nano-technology Code of Conduct. Over recent years, we have conducted over 250 scientific studies and participated in over 35 different projects related to the safety of nanomaterials. The results were published in more than 100 scientific articles. One important finding is that toxicity is determined not by the size of the particles but by the intrinsic properties of the substance. The European Chemicals Agency (ECHA) as well as the OECD and national authorities are currently developing regulatory concepts to systematically test and assess nano-materials. We contribute our expertise through various ECHA working groups or the OECD’s Business and Industry Advisory Group (BIAC). In May 2017, the ECHA published guidance on the registration of nanomaterials, which we helped to develop. The E.U.-funded NanoDefine project, in which we developed measurement strategies for identifying nanomaterials together with 27 partners, was also concluded in 2017. BASF makes successful use of biotechnology. We produce a range of established products with the help of bio-technological methods. This provides us with extensive experience in the safe use of biotechnological methods in research and development as well as in production. When employing biotechnology, we adhere to all standards and legal regulations. We are guided by the code of conduct set out by EuropaBio, the European biotechnology association.
For more information on nanotechnology and the Nanotechnology Code of Conduct, see basf.com/nanotechnology

BASF Report 2017 Management’s Report
Responsibility along the value chain — Environment, health, safety and security — Transportation and storage103
Transportation and storage
Our regulations and measures for transportation and warehouse safety cover the delivery of raw materials, the storage and distribution of chemical products among BASF sites and customers, and the transportation of waste from our sites to the disposal facilities.
Strategy
▪ Risk minimization along the entire transportation chain
We want our products to be safely loaded, transported, handled and stored. This is why we depend on reliable logistics partners, global standards and an effective organization. Our goal is to minimize risks along the entire transportation chain – from loading and transportation to unloading. Some of our guidelines for the transportation of dangerous goods go above and beyond national and interna-tional dangerous goods requirements. We have defined global guidelines and requirements for the storage of our products and regularly monitor compliance with these.
Accident prevention and emergency response
▪ Risk assessments for transportation and storage
We regularly assess the safety and environmental risks of transporting and storing raw materials and sales products with high hazard potential using our global guideline. This is based on the guidelines of the European Chemical Industry Council, CEFIC. We also have binding global standards for load safety. We stipulate worldwide requirements for our logistics service providers and assess them in terms of safety and quality. Our experts use our own evaluation and monitoring tools as well as internationally approved schemes.
Transportation incidents
We are systematically implementing our measures to improve transportation safety and report in particular on dangerous goods spillages that could lead to significant environmental impacts. We report on dangerous goods leaks of BASF products in excess of 200 kilograms on public transportation routes, provided BASF arranged the transport. We have been able to reduce the number of transportation accidents per 10,000 shipments worldwide by around 70% since 2003. We recorded three incidents in 2017 with spillage of more than 200 kilograms of dangerous goods (2016: 2). None of these transportation incidents had a significant impact on the environment (2016: 0).
Activities in external networks
We are actively involved in external networks, which quickly provide information and assistance in emergencies. These include the International Chemical Environmental (ICE) initiative and the German Transport Accident Information and Emergency Response System (TUIS), in which BASF plays a coordinating role. In 2017, we provided assistance to other companies in 178 cases worldwide. We apply the experience we have gathered to set up similar systems in other countries: For example, we intensified our activities in Asia Pacific in 2017.
For more information, see basf.com/distribution_safety and basf.com/emergency_response
Suppliers BASF Customers

104 Management’s Report BASF Report 2017
Responsibility along the value chain — Environment, health, safety and security — Energy and climate protection
Energy and climate protection
As an energy-intensive company, we are committed to energy efficiency and global climate protection. We want to reduce emissions along the value chain and utilize, for example, efficient technologies for generating steam and electricity, energy-efficient production processes, and comprehensive energy management. Our climate protection products make an important contribution toward helping our customers avoid emissions.
Strategy
▪ We are committed to energy efficiency and global climate protection along the value chain
We want to reduce greenhouse gas emissions in our production and along the entire value chain. To this end, we have thoroughly analyzed the greenhouse gas emissions from our production in the past few years and implemented comprehensive reduction measures. Comparisons with European emissions trading bench-marks show that our greenhouse gas-intensive chemical plants operate at above-average efficiency. To supply our production sites with energy, we rely on highly efficient combined heat and power plants with gas and steam turbines, and on the use of heat released by production processes. Our success also depends on the long-term security and competitiveness of our energy supplies. Furthermore, we are committed to energy management that helps us analyze and further improve the energy efficiency of our plants. We continuously analyze potential risks to our business operations arising in connection with the topics of energy and climate protection and derive appropriate measures. We offer our customers solutions that help prevent green-house gas emissions and improve energy and resource efficiency. Around half of our total annual research and development spending goes toward developing these products and optimizing our processes.
Our climate protection activities are based on a comprehensive analysis of our emissions. We report on greenhouse gas emissions in accordance with the Greenhouse Gas Protocol Standard, as well as the sector-specific standard for the chemical industry. Since 2004, we have participated in the international non-profit organization CDP’s program for reporting on data relevant to climate protection. BASF again achieved a score of A- in CDP’s rating for 2017, awarding it “Leadership” status. Companies on the “Leadership” level are distinguished by factors such as the completeness and trans-parency of their reporting. They also pursue comprehensive approaches in managing the opportunities and risks associated with climate change as well as emissions reduction strategies to achieve company-wide goals. Climate protection is a shared global task. We advocate climate protection by supporting initiatives to this end. In 2017, companies from G20 countries – the Business 20 (B20) – developed recommendations on energy, climate and resource efficiency for state and government leaders. BASF led this B20 task force. BASF supports a consistent implementation of the Paris climate accord as the necessary basis for limiting global warming. We therefore also joined the World Economic Forum’s CEO Climate Leaders initiative in 2017.
For more information on climate protection, see basf.com/climate_protection
Reduction of greenhouse gas emissions per metric ton of sales product in BASF operations excluding Oil & Gas1 (%)
1 The value for the 2012 business year was not adjusted to reflect the currently applied global warming potential factors. For more information on our data collection methods, see page 105.
2015 2016 2017201420132012 2020 Goal2002Baseline
–33.4 –34.1 –33.9 –34.6–40.0
–37.2 –35.5
Suppliers BASF Customers

BASF Report 2017 Management’s Report
Responsibility along the value chain — Environment, health, safety and security — Energy and climate protection105
BASF Group’s greenhouse gas emissions according to the Greenhouse Gas Protocol1 (million metric tons of CO2 equivalents)
BASF operations including Oil & Gas 2002 2016 2017
Scope 12
CO2 (carbon dioxide) 14.634 16.215 16.813
N2O (nitrous oxide)3 6.407 0.586 0.747
CH4 (methane) 0.244 0.045 0.048
HFC (hydrofluorocarbons) 0.061 0.087 0.081
SF6 (sulfur hexafluoride) 0 0 0
Scope 24
CO2 5.243 3.884 3.796
Total 26.589 20.817 21.485
Sale of energy to third parties (Scope 1)5
CO2 0.347 1.161 1.086
Total 26.936 21.978 22.571
1 BASF reports separately on direct and indirect emissions from the purchase of energy. Scope 1 emissions encompass both direct emissions from production and generation of steam and electricity, as well as direct emissions from the generation of steam and electricity for sale. Scope 2 emissions comprise indirect emissions from the purchase of energy for BASF’s use.
2 Emissions of N2O, CH4, HFC and SF6 have been translated into CO2 emissions using the Global Warming Potential, or GWP, factor. GWP factors are based on the Intergovernmental Panel on Climate Change (IPCC) 1995 (2002 emissions) and IPCC 2007, errata table 2012 (2016 and 2017 emissions). HFC (hydrofluorocarbons) are calculated using the GWP factors of the individual components.
3 The 2016 figure has been adjusted due to updated data. 4 Location-based approach. Information on the calculation of market-based Scope 2 emissions can be found in the GRI and Global Compact Index; see basf.com/en/gri_gc5 Includes sale to BASF Group companies; as a result, emissions reported under Scope 2 can be reported again in some cases.
Global goals and measures
▪ Reduction of greenhouse gas emissions per metric ton of sales product
▪ Introduction of energy management systems in accordance with ISO 50001
We aim to reduce our greenhouse gas emissions per metric ton of sales product by 40% by 2020, compared with baseline 2002. Our emissions rose year-on-year in 2017, mainly due to higher production levels of precursors within the Group and an increase in nitrous oxide emissions. In 2017, we reduced greenhouse gas emissions per metric ton of sales product by 35.5% compared with baseline 2002 (2016: reduction of 37.2%). Since 1990, we have been able to lower our overall greenhouse gas emissions from BASF operations (excluding Oil & Gas) by 48.3% and even reduce specific emissions by 74.7%. We set ourselves a new energy efficiency goal in 2015 covering both the chemicals and the oil and gas businesses. By 2020, we want to have introduced certified energy management systems (DIN EN ISO 50001) at all relevant production sites.6 Taken together, this represents 90% of BASF’s primary energy demand. This is one of the ways in which we intend to identify and carry out improvements in energy efficiency, reducing not only greenhouse gas emissions and saving valuable energy resources, but also increasing the BASF Group’s competitive ability.
2020 Goal
Reduction of greenhouse gas emissions per metric ton of sales productBaseline 2002BASF operations excl. Oil & Gas
2020 Goal
Coverage of our primary energy demand through certified energy management systems at all relevant sitesBASF operations incl. Oil & Gas
–40% 90%The introduction and implementation of the energy manage-ment systems is steered by a global working group. All energy efficiency measures are recorded and analyzed in a global database and made available to BASF sites as best practices. Currently, over 100 measures are being pursued to reduce energy consumption and increase competitive ability. Sites and pilot plants across all regions were certified in accordance with ISO 50001 in 2017. These include the Verbund site in Antwerp, Belgium, production plants at the Guaratinguetá site in Brazil and Freeport in Texas, as well as another 10 sites in China, India, Singapore, Ireland, Norway and Switzerland. At the moment, 43 sites are certified worldwide, representing 54.3% of our primary energy demand.
6 The selection of relevant sites is determined by the amount of primary energy used and local energy prices.

106 Management’s Report BASF Report 2017
Responsibility along the value chain — Environment, health, safety and security — Energy and climate protection
Certified energy management systems (ISO 50001) introduced at BASF Group sites worldwide, in terms of primary energy demand (%)
2014 2015 2016 2017
90
54.3
2020 Goal
42.339.538.6
Energy supply and efficiency
▪ Verbund system as important component of our energy efficiency strategy
Gas and steam turbines in our combined heat and power plants enable us to fulfill more than 70% of the electricity demand of the BASF Group. Compared with separate methods of generating steam and electricity, we saved 12.7 mill ion MWh of fossil fuels and prevented 2.6 million metric tons of carbon emissions in 2017. The Verbund system is an important component of our energy efficiency strategy: Waste heat from one plant’s production process is used as energy in other plants. In this way, the Verbund saved us around 19.2 million MWh in 2017, which translates to 3.9 mil-lion metric tons less of CO2 released to the environment. With combined power and steam generation as well as our continuously enhanced Energy Verbund, we were thus able to prevent a total of 6.5 million metric tons of carbon emissions in 2017.
We were able to further optimize the resource and energy consumption of our production in numerous projects around the world in 2017. In Ludwigshafen, for example, we were able to reduce the energy required for cooling by systematically analyzing the cold supply and using a new absorption chiller to make the existing waste heat steam available for cooling. Furthermore, process improvements at many additional sites have led to savings in steam and electricity. We also rely on locally available energy sources for energy supply at our sites. Especially in the growing Asian market, we and our energy suppliers also utilize coal as an energy source in individual cases since the more climate-friendly natural gas is not available in sufficient quantities at competitive prices. We are continuously exploring the use of renewable energies. The focus here is on the purchase of electricity. It only makes economic sense to replace highly efficient internal electricity and steam generation using natural gas once renewable energies offer the necessary supply security and are available at competitive prices. Our research also contributes to increasing the efficiency of technologies for the use of renewable energy sources.
1
2
3
21
Residual fuels5.3 million MWh
Fossil and residual fuels used for own generation in power plants of the BASF Group
37.4 million MWhTotal:
Steam39.7 million
MWh1
Electricity15.1 million
MWh Natural gas31.2 million MWh83.4%Heating oil0.1 million MWh0.2%Coal0.8 million MWh2.3%
14.1%
Electricity supply
1
2
Internally generated
Purchased
Steam supply
1
2
Internally generated
Waste heat
3 Purchased
70%
30%
50%
47%
3%
Energy supply of the BASF Group 2017
1 Conversion factor: 0.75 MWh per metric ton of steam

BASF Report 2017 Management’s Report
Responsibility along the value chain — Environment, health, safety and security — Energy and climate protection107
Carbon footprint and climate protection products
▪ Reporting on greenhouse gas emissions along the entire value chain
▪ Customers’ use of climate protection products sold in 2017 avoids 570 million metric tons of CO2 equivalents
BASF has been publishing a comprehensive corporate carbon footprint since as early as 2008. This reports on all emissions along the value chain and shows the volume of emissions prevented through the use of our climate protection products. We plan our climate protection activities along the value chain based on our corporate carbon footprint. Through various measures to reduce our raw material and energy requirements, the emission of greenhouse gases asso-ciated with producing the raw materials was decreased by a total of around 153,000 metric tons in 2017. Our climate protection products help us offer solutions to our customers to avoid greenhouse gas emissions over their entire lifecycle as compared with reference products. Accord-ing to the systematic sustainability analysis we conduct on our portfolio – using the Sustainable Solution Steering® method – such products are referred to as “Accelerator” solutions as using them contributes positively to climate protection and energy. One example is the ammonium stabilizer DMPP. As the main component of BASF’s Vizura® fertilizer additive, it helps to increase plant uptake efficiency. This reduces the use of fertilizers or liquid manure and cuts nitrous oxide emissions by 50% on average.
Greenhouse gas emissions along the BASF value chain in 20174 (million metric tons of CO2 equivalents)
59 SuppliersPurchased products,services and capital goods (C 1, 2, 3a)
4 TransportTransport of products, employees’ commuting and business travel (C 4, 6, 7, 9)
43 CustomersEmissions from the use of end products (C 11)
4 Other(C 3b, 3c, 5, 8, 13, 15)
23 BASFProduction (including genera-tion of steam and electricity)
20 DisposalIncineration with energy recovery, landfilling (C 12)
4 According to Greenhouse Gas Protocol, Scope 1, 2 and 3; categories within Scope 3 are shown in parentheses
An analysis of 23 climate protection product groups revealed that customers’ use of products sold in 2017 helps to avoid 570 million metric tons of CO2 equivalents. Every product makes an individual contribution in the value chain of customer solutions. Value chains are assessed in terms of BASF’s economic share of the respective customer solution. On aver-age, 6% of the emissions avoided were attributable to BASF in 2017. The calculation of avoided greenhouse gas emissions took into account the chemical industry standards of the International Council of Chemical Associations (ICCA) and the World Business Council for Sustainable Development (WBCSD).
For more information on our emissions reporting, see basf.com/corporate_carbon_footprint
For more information on the sustainability analysis of our product portfolio, see page 32
Prevention of greenhouse gas emissions through the use of BASF products (million metric tons of CO2 equivalents)
Emissions along the entire value chain
Without the use of BASF’s climate protection products
990
With the use of BASF’s climate protection products
420Emissions avoided
570 million metric tons
Key indicators for energy and climate protection in BASF operations excluding Oil & Gas
Baseline 20021 2016 2017
Greenhouse gas emissions2 (million metric tons of CO2 equivalents) 24.713 19.976 20.716
Specific greenhouse gas emissions (metric tons of CO2 equivalents per ton of sales product) 0.897 0.564 0.579
Primary energy demand3 (million MWh) 55.759 57.423 57.268
Energy efficiency (kilograms of sales product per MWh) 494 617 625
1 The values for baseline 2002 were not adjusted to reflect the currently applied global warming potential factors.2 Scope 1 and Scope 2 (location-based) according to the GHG Protocol Standard, excluding emissions from the generation of steam and electricity for sale to third parties;
information on market-based Scope 2 emissions can be found in the GRI and Global Compact Index; see basf.com/en/gri_gc3 Primary energy used in BASF’s plants as well as in the plants of our energy suppliers to cover energy demand for production processes

108 Management’s Report BASF Report 2017
Responsibility along the value chain — Environment, health, safety and security — Water
Water
Water is of fundamental importance in chemical production. It is used as a coolant, solvent and cleaning agent, as well as to make our products. We are committed to its responsible use along the entire value chain and especially in our production sites’ water catchment areas. We have set ourselves a global goal for sustainable water management.
Strategy
▪ Sustainable water management
We aim to use water as sparingly as possible and further reduce emissions to water. To do so, we have set out a Group directive with globally applicable standards. We are introducing sustainable water management at all relevant production sites. These include our major Verbund sites as well as the sites in water stress areas – regions in which more than 60% of available water is used by industry, household and agriculture. We consider the quantitative, qualitative and social aspects of water use. We want to identify where we can improve at our sites, and use as little water as possible, especially in water stress areas. We offer our customers solutions that help purify water and use it more efficiently while minimizing pollution. In order to ensure transparency in our reporting on water, we once again took part in CDP reporting in 2017. According to CDP, an international nonprofit organization, BASF is a world leader in sustainable water management and was again included in CDP’s Water A List. Of the 742 companies
evaluated, only 73 of them received the top score of “A” – among them, BASF. CDP’s evaluation of sustainable water management includes how transparently companies report on their water management activities and what they do to reduce risks, such as water scarcity. CDP also assesses the extent to which product developments – even at the customers of the companies under evaluation – can contribute to sustainable water management.
For more information on the CDP water survey, see basf.com/en/cdp
Global goal and measures
By 2025, we want to introduce sustainable water manage-ment at all sites in water stress areas and at our Verbund sites, covering 93% of BASF’s entire water abstraction. We achieved 45.2% of this goal in 2017 (2016: 42.6%). We pursue our goal by applying the European Water Stewardship standard, which rests on four principles: sustainable water abstraction, maintaining good water quality, preserving conservation areas, and ensuring continuous improvement processes, including in cooperation with other users. In 2017, around 24% of our production sites were located in water stress areas. Around 1% of BASF’s total water supply was abstracted from these sites. The number of BASF sites in water stress areas rose significantly in 2017 as a result of the acquisition of Chemetall in December 2016. In 2017, BASF introduced sustainable water management at three sites in China and two sites in North America.
Suppliers BASF Customers
Water stress areas around the world
Source: Pfister et al., 2009

BASF Report 2017 Management’s Report
Responsibility along the value chain — Environment, health, safety and security — Water109
2025 Goal
Introduction of sustainable water management at all production sites in water stress areas and at all Verbund sites BASF operations excl. Oil & Gas 100%
Water use
▪ Using water responsibly
Our water usage totaled 1,816 million cubic meters in 2017. This demand was covered for the most part by surface water, such as rivers and lakes. At some sites, we use alternative sources such as treated municipal wastewater, brackish water or seawater, reducing our need for freshwater. We predominantly use water for cooling purposes (87%), after which we recirculate it back to our supply sources. We reduce our water use by recirculating as much water as possi-ble. Our larger sites have recooling plants that allow water to be reused several times and which reduce the temperature of used cooling water before it is discharged back into a body of water. The supply, treatment, transportation and recooling of water is associated with a considerable energy demand. We employ various means in our efforts to minimize this as much as possible. We are constantly working to optimize our energy consumption and the amount of water we use, and to adapt to the needs of our business and the environment.
Emissions to water
▪ Low level of emissions
A total of 1,766 million cubic meters of water were discharged from BASF production sites in 2017, including 177 million cubic meters of wastewater from production. Emissions of nitrogen to water amounted to 2,800 metric tons (2016: 2,900 metric tons). Around 14,100 metric tons of organic substances were emitted in wastewater (2016: 15,900 metric tons). Our wastewater contained 25 metric tons of heavy metals (2016: 23 metric tons). Phosphorus emissions amount-ed to 420 metric tons (2016: 310 metric tons). Our wastewater is treated through different methods depending on the type and degree of contamination – including biological processes, oxidation, membrane technologies, precipitation or adsorp-tion. In order to avoid unanticipated emissions and the pollution of surface or groundwater, we create water protection strategies for our production sites. This is mandatory for all production plants as part of the Responsible Care® initiative. The wastewater protection plans involve evaluating wastewater in terms of risk and drawing up suitable monitoring approaches. We use audits to check that these measures are being implemented and complied with.
For more information, see basf.com/water
Abstraction /withdrawal
Use Discharge
Production CoolingSurface water / freshwater 1,472
Cooling 6,372
External treatment plant 19
Surface water / freshwater 1,487
Brackish water / seawater 250
Groundwater 10
Thereof recirculating 4,783
once-through 1,589
Production2 241
Groundwater 65
Drinking water 20
Brackish water / seawater 258
Reusable wastewaterfrom third parties 1
13% 87%
111,816 6,613 1,766
Water in the BASF Group 2017 (million cubic meters per year)
1 The difference between the volume of water drawn and the volume discharged is primarily attributable to evaporation losses during closed-circuit cooling.2 Total from production processes, graywater, rinsing and cleaning in production

110 Management’s Report BASF Report 2017
Responsibility along the value chain — Environment, health, safety and security — Air and soil
Air and soil
We want to further reduce emissions to air from our production, prevent waste and protect the soil. We have set ourselves standards for doing so in global directives. If no recovery options are available for waste, we dispose of it in a proper and environmentally responsible manner.
Strategy
▪ Regular monitoring of emissions to air ▪ Professional disposal of hazardous waste
Regular monitoring of our emissions to air is a part of environmental management at BASF. Aside from greenhouse gases, we also measure emissions of other pollutants into the atmosphere. Our reporting does not take into account air pollutant emissions from oil and gas operations due to their substantial fluctuation during exploration phases. Our Raw Material Verbund helps us prevent or reduce waste. We regularly carry out audits to inspect external waste disposal companies to ensure that waste is properly disposed of. In this way, we also contribute to preventive soil protection and keep today’s waste from becoming tomorrow’s contamination. When treatment is required for soil and groundwater contam ination at active and former BASF sites, proper reme-diation measures are reviewed based on prevailing legal and current technical standards, and undertaken as necessary.
Emissions to air
▪ Further reduction of emissions
Absolute emissions of air pollutants from our chemical plants amounted to 25,706 metric tons in 2017. Emissions of ozone-depleting substances as defined by the Montreal Protocol totaled 23 metric tons in 2017 (2016: 23 metric tons1). Emissions of heavy metals in 2017 amounted to 3 metric tons (2016: 3 metric tons).
Emissions to air (metric tons) Air pollutants from BASF operations excluding Oil & Gas
2016 2017
CO (carbon monoxide) 3,585 3,644
NOX (total nitrogen oxides) 11,143 11,205
NMVOC (nonmethane volatile organic compounds) 4,824 4,727
SOX (total sulfur oxides) 1,872 1,753
Dust1 2,338 2,207
NH3 (ammonia) and other inorganic substances 2,229 2,170
Total 25,991 25,706
1 The 2016 figure has been adjusted due to updated data.
Our product portfolio contains a variety of catalysts used in the automotive sector and in industry to reduce the emission of air pollutants.
Management of waste and contaminated sites
▪ Total waste volume on a level with the previous year ▪ Systematic management of contaminated sites
Waste prevention is our topmost goal. If waste is unavoidable, we review the options for recycling or energy recovery, using BASF’s existing Verbund structures for efficient waste manage-ment. Total waste volume amounted to 2.12 million metric tons in 2017 (+1.0%).
Waste management in the BASF Group (million metric tons)
2016 2017
Total waste generation2 2.10 2.12
Thereof from oil and gas exploration 0.06 0.10
Waste recovered 0.77 0.79
Recycled 0.26 0.27
Thermally recovered 0.51 0.52
Waste disposed of 1.33 1.34
In underground landfills 0.14 0.17
In surface landfills 0.47 0.39
Through incineration 0.72 0.77
Classification of waste for disposal3
Nonhazardous waste 0.46 0.47
Hazardous waste 0.87 0.87
Transported hazardous waste 0.23 0.23
2 Comprises all production waste and hazardous waste from construction activities3 The classification of waste into hazardous and nonhazardous waste is performed
according to local regulations.
We set out global standards for our approach to managing contaminated sites. A worldwide network of experts ensures their proper implementation. We develop remediation solutions that combine nature conservation, climate protection concerns, costs, and social responsibility. This means making customized decisions on a case-by-case basis, founded on the legal framework and current technological possibilities. We have been documenting relevant sites in a contaminat-ed site database since 2013. Ongoing remediation work around the world continued on schedule and planning was concluded on future landfill remediation projects.
For more information, see the Notes to the Consolidated Financial Statements on pages 196 and 217
Suppliers BASF Customers

BASF Report 2017 Management’s Report
Forecast — Opportunities and risks report 111
ForecastOpportunities and risks report
The goal of BASF’s risk management is to identify and evaluate opportunities and risks as early as possible and to take appropriate measures in order to seize opportuni-ties and limit business losses. The aim is to avoid risks that pose a threat to BASF’s continued existence and to make improved managerial decisions to create value. We understand risk to be any event that can negatively impact the achievement of our short-term operational or long-term strategic goals. We define opportunities as potential successes that exceed our defined goals.
In order to effectively measure and manage identified opportunities and risks, we quantify these where appropriate in terms of probability and economic impact in the event they occur. Where possible, we use statistical methods to aggregate opportunities and risks into risk factors. This way, we achieve an overall view of opportunities and risks at a portfolio level, allowing us to take effective measures for risk management.
Overall assessment
▪ Significant risks and opportunities arise from overall economic developments and volatility in exchange rates and margins
For 2018, we expect the global economy to continue to grow at around the same pace as the previous year. Important opportunities and risks for our earnings are associated with uncertainty regarding market growth, the development of key customer industries, acquisitions and divestitures, as well as volatility in exchange rates and margins. In particular, a considerable slowdown of the Chinese economy continues to pose significant risks. Such a development would negatively affect demand for intermediate and investment goods. This would impact the emerging markets that export raw materials as well as the advanced economies. This is especially true for Europe. Further risks to the global economy arise from an escalation of geopolitical conflicts and an increased tendency toward protectionism.
Potential short-term effects on EBIT of key opportunity and risk factors subsequent to measures taken1
Possible variations related to:Outlook
– 2018 +
Business environment and sector
Market growth
Margins
Competition
Regulation/policy
Company-specific opportunities and risks
Purchasing/supply chain
Investments/production
Personnel
Acquisitions/divestitures/cooperations
Information technology
Law
Finance
Exchange rate volatility
Other financial opportunities and risks
€100 million €100 million €500 million €500 million €1,000 million €1,000 million €1,500 million
1 Using a 95% confidence interval per risk factor based on planned values; summation is not permissible.
According to our assessment, there continue to be no sig-nificant individual risks that pose a threat to the continued existence of the BASF Group. The same applies to the sum of individual risks, even in the case of another global economic crisis. Ultimately, however, residual risks remain in all entrepre-neurial activities which even comprehensive risk management cannot exclude.
OpportunitiesPotential successes that exceed our defined goals
RisksEvents that can negatively impact the achievement
of our goals
Risk managementIdentifying opportunities and
risks as early as possible and planning effective
courses of action

112 Management’s Report BASF Report 2017
Forecast — Opportunities and risks report
Functional and corporate units
FinanceCorporate Controlling
Corporate Development
Legal, Taxes, Insurance & Intellectual Property
Organization of BASF Group’s risk management
Supervisory Board
Board of Executive Directors
Divisions Functional unitsVerbund sitesRegions
Chief Compliance Officer
Corporate Audit External Auditors
Risk management process
▪ Integrated process for identification, assessment and reporting
▪ Decentralized management of specific opportunities and risks
▪ Aggregation at a Group level
The BASF Group’s risk management process is based on the international risk management standard COSO II Enterprise Risk Management – Integrated Framework (2004), and has the following key features:
Organization and responsibilities – Risk management is the responsibility of the Board of Executive Directors, which also determines the processes for approving investments, acquisitions and divestitures.
– The Board of Executive Directors is supported by the units Finance, Corporate Controlling, Corporate Development and Legal, Taxes, Insurance & Intellectual Property, and the Chief Compliance Officer. These units coordinate the risk management process at a Group level and provide the structure and appropriate methodology. Opportunity and risk management is thus integrated into the strategy, planning and budgeting processes.
– A network of risk managers in the business, functional and corporate units as well as in the regions and at the Verbund sites advances the implementation of appropriate risk management practices in daily operations.
– The management of specific opportunities and risks is largely delegated to the business units and is steered at a regional or local level. Risks relating to exchange rates and raw materials prices are an exception. In this case, there is an initial consolidation at a Group level before derivative hedging instruments, for example, are used.
– BASF’s Chief Compliance Officer (CCO) manages the implementation of our Compliance Management System,
supported by additional compliance officers worldwide. He regularly reports to the Board of Executive Directors on the status of implementation as well as on any significant results. He also provides a status report to the Supervisory Board’s Audit Committee at least once a year, including any major developments. In the event of significant incidents, the Audit Committee is immediately informed by the Board of Execu-tive Directors.
– The internal auditing unit (Corporate Audit) is responsible for regularly auditing the risk management system established by the Board of Executive Directors in accordance with section 91(2) of the German Stock Corporation Act. Further-more, as part of its monitoring of the Board of Executive Directors, the Supervisory Board considers the effectiveness of the risk management system. The suitability of the early detection system we set up for risks is evaluated by our external auditor.
Instruments – The Risk Management Policy, applicable throughout the Group, forms the framework for risk management and is implemented by the business units according to their particular business conditions.
– A catalog of opportunity and risk categories helps to identify all relevant opportunities and risks as comprehensively as possible.
– We use standardized evaluation and reporting tools for the identification and assessment of risks. The aggregation of opportunities, risks and sensitivities at division and Group level using a Monte Carlo simulation helps us to identify effects and trends across the Group.
– The nonfinancial topics relevant for BASF are addressed by the responsible functional units, which assess the risks identified as being relevant according to impact and probability of occurrence. We identify opportunities and risks that arise in connection with the topics of environment, society and governance with our sustainability management

BASF Report 2017 Management’s Report
Forecast — Opportunities and risks report 113
tools. We have established global monitoring systems to check adherence to laws and our voluntary commitments in these areas. These also incorporate our suppliers.
– The BASF Group’s management is informed about operational opportunities and risks (observation period of up to one year) in the monthly management report produced by the Corporate Controlling unit. In addition, Corporate Controlling and Finance provide information twice a year on the aggregated opportunity/risk exposure of the BASF Group. Furthermore, if a new individual risk is identified which has a more than €10 million impact on earnings or bears reputational risks, it must be immediately reported.
– As part of our strategy development, the Corporate Development unit conducts strategic opportunity/risk analyses with a 10-year assessment period. These analyses are annually reviewed as part of strategic controlling and are adapted if necessary.
For more information on our sustainability management processes, see page 29 onward
– Our Group-wide Compliance Program aims to ensure adherence to legal regulations and the company’s internal guidelines. Our global employee Code of Conduct firmly embeds these mandatory standards into everyday business. Members of the Board of Executive Directors are also expressly obligated to follow these principles.
For more information on our Group-wide Compliance Program, see page 135 onward
Significant features of the internal control and risk management system with regard to the Group financial reporting process
▪ Conducted in accordance with standardized Group guidelines
▪ Segregation of duties, principle of dual control and clearly regulated access rights
▪ Annual evaluation of the control environment and relevant processes at significant companies
The Consolidated Financial Statements are prepared by a unit in the Finance division. BASF Group’s accounting process is based on a standardized accounting guideline that sets out accounting policies and the significant processes and dead-lines on a Group-wide basis. There are binding directives for the internal reconciliations and other accounting operations within the Group. Standard software is used to carry out the accounting processes for the preparation of the individual financial statements as well as for the Consolidated Financial Statements. There are clear rules for the access rights of each participant in these processes. Employees involved in the accounting and reporting process meet the qualitative requirements and participate in training on a regular basis. There is a clear assignment of responsibilities between the specialist units, companies and regional service units involved.
We strictly adhere to the principles of segregation of duties and dual control, or the “four-eyes principle.” Complex actuarial reports and evaluations are produced by specialized service providers or specially qualified employees. An internal control system for financial reporting continuously monitors these principles. To this end, methods are provided to ensure that evaluation of the internal control system in financial reporting is structured and uniform across the BASF Group. The significant risks for the BASF Group regarding a reliable control environment for proper financial reporting are reviewed and updated on an annual basis. Risks are compiled into a central risk catalog. Moreover, a centralized selection process identifies companies that are exposed to particular risks, that are material to the Consolidated Financial Statements of the BASF Group, or that provide service processes. The selection process is conducted annually. In the relevant companies, one person is given the responsibility of monitoring the execution of the annual evaluation process.
In these companies, the process comprises the following steps: – Evaluation of the control environment Adherence to internal and external guidelines that are relevant for the maintenance of a reliable control environment is checked by means of a standardized questionnaire.
– Identification and documentation of control activities In order to mitigate the risks to the financial reporting processes listed in our central risk catalog, critical processes and control activities are documented.
– Assessment of control activities After documentation, a review is performed to verify whether the described controls are capable of adequately covering the risks. In the subsequent test phase, samples are taken to test whether, in practice, the controls were executed as described and effective.
– Monitoring of control weaknesses The managers responsible receive reports on any control weaknesses identified and their resolution, and an interdisciplinary committee investigates their relevance for the BASF Group. The Board of Executive Directors and the Audit Committee are informed once control weaknesses have been identified that have a considerable impact on financial reporting. Only after material control weaknesses have been resolved does the company’s managing director confirm the effectiveness of the internal control system.
– Internal confirmation of the internal control systemAll managing directors and chief financial officers of each consolidated Group company must confirm to the Board of Executive Directors of BASF SE every half-year and at the end of the annual cycle, in writing, that the internal control system is effective with regard to accounting and reporting.

114 Management’s Report BASF Report 2017
Forecast — Opportunities and risks report
Short-term opportunities and risks
Development of demand
The development of our sales markets is one of the strongest sources of opportunities and risks. More details on our assumptions regarding short-term growth rates for the global economy, regions and key customer industries, such as the chemicals, automotive and construction sectors, can be found from pages 119 to 121. We also consider risks from deviations in assumptions. We continue to see a significant macroeconomic risk in an increased slowdown of the Chinese economy, which would have considerable impact on demand for intermediate goods for industrial production as well as investment goods. This would have an effect on emerging markets that export raw materials as well as on advanced economies that specialize in technological goods. Risks to the global economy would also be posed by the possible escalation of geopolitical conflicts and an increased tendency toward protectionism. Should the macroeconomic environment develop more slowly than we predict, we expect a lower oil price. In this case, we also expect the euro to weaken relative to the U.S. dollar in the medium term as compared with our planning assumptions, as the eurozone’s economy shows a high level of dependency on exports and, in times of global economic weakness, the U.S. dollar is preferred by portfolio investors as a safe haven. Weather-related influences can result in positive or negative effects on our crop protection business.
Margin volatility
The BASF Group will be exposed to margin risk in 2018, driven by the isocyanates business in particular. It is also possible that margin pressure on a number of other products and value chains could be increased by, for example, new capacities or increasing raw material costs. This would have a negative effect on our income from operations (EBIT). The year’s average oil price for Brent crude was around $54 per barrel in 2017, compared with $44 per barrel in the previous year. For 2018, we anticipate an average oil price of $65 per barrel. We therefore expect a slight increase in price levels for the raw materials and petrochemical basic products that are important to our business. Yet an oil price level be-low the expected average would pose risks for our oil and gas business, whose EBIT declines by approximately €20 million for every $1 decrease in the average annual barrel price of Brent crude.
Competition
We continuously enhance our products and solutions in order to maintain competitive ability. We watch the market and the competition, and try to take targeted advantage of opportunities and counter emerging risks with suitable measures. Aside from innovation, a major component our competitiveness is our cost structure.
Regulation and political risks
Risks for us can arise from intensified geopolitical tensions, new trade sanctions, stricter emissions limits for plants or energy and climate laws. In addition, risks to the BASF Group can be posed by further regulations in key customer industries or on the use or registration of agricultural and other chemicals. Economic and political uncertainties may arise as a result of Brexit. At this point in time, it is not yet clear what the future relationship between the European Union and the United Kingdom will look like post-Brexit and what specific consequences this will have for our sites, our supply chains and the regulatory environment. A cross-divisional Brexit team has been established to prepare the BASF organization for various exit scenarios and enable it to quickly react to political decisions. Political measures could also give rise to opportunities. For example, we view the worldwide expansion of renewable energy and measures to increase energy efficiency as an opportunity for increased demand for our products, such as our insulation foams for buildings or our solutions for wind turbines. Our broad product portfolio enables us to offer alternatives if chemicals have to be substituted as a result of restrictions in connection with the REACH chemicals regulation or new standards in our customers’ industries.
Purchasing and supply chain
We minimize procurement risks through our broad portfolio, global purchasing activities and the purchase of raw materials on spot markets. If possible, we avoid procuring raw materials from a single supplier. When this cannot be avoided, we try to foster competition or we knowingly enter into this relationship and assess the consequences of potential nondelivery. We continuously monitor the credit risk of important business partners.
Production and investments
We try to prevent unscheduled plant shutdowns by adhering to high technical standards and by continuously improving our plants. We reduce the effects of unscheduled shutdowns on the supply of intermediate and end products through diversification within our global production Verbund.

BASF Report 2017 Management’s Report
Forecast — Opportunities and risks report 115
In the event of a production outage – caused by an accident, for example – our global, regional or local emergency response plans and crisis management structures are engaged, depending on the impact scope. Every region has crisis manage ment teams on a local and regional level. They not only coordinate the necessary emergency response measures, they also initiate the immediate measures for damage control and resumption of normal operations as quickly as possible. Short-term risks from investments can result from, for example, technical malfunctions or schedule and budget breaches. We counter these risks with highly experienced project management and controlling.
For more information on emergency response, see page 100 or basf.com/emergency_response
Acquisitions, divestitures and cooperations
We are constantly watching our environment in order to identify possible targets and develop our portfolio appropriately. In addition, we work together in collaborations with customers and partners to jointly develop new, competitive products and applications. Opportunities and risks arise in connection with acquisitions and divestitures from the conclusion of a transaction, or it being completed earlier or later than expected. They relate to the regular earnings contributions gained or lost as well as the realization of gains or losses from divestitures if these deviate from our planning assumptions.
For more information on opportunities and risks from acquisitions and divestitures in 2018, see the Outlook from page 122 onward
Personnel
Due to BASF’s worldwide compensation principles, the development of personnel expenses is partly dependent on the amount of variable compensation, which is linked to the company’s success, among other factors. The correlation between variable compensation and the success of the company has the effect of minimizing risk. Another factor is the development of interest rates for discounting pension obligations. Furthermore, changes to the legal environment of a particular country can have an impact on the development of personnel expenses for the BASF Group. For countries in which BASF is active, relevant developments are therefore constantly monitored in order to recognize risks at an early stage and enable BASF to carry out suitable measures.
For more information on our compensation system, see page 46
For more information on risks from pension obligations, see page 117
Information technology risks
BASF relies on a large number of IT systems. Their nonavailability, violation of confidentiality or the manipulation of data in critical IT systems and applications can all have a direct impact on production and logistics processes. The threat environment has changed in recent years, as attackers have become better organized, use more sophisticated technology, and have far more resources available. If data are lost or manipulated, this can, for example, negatively affect process safety and the accuracy of our financial reporting. Unauthorized access to sensitive data, such as personnel records, competition-related information or research results, can result in legal consequences or jeopardize our competitive position. This would also be accompanied by the associated loss of reputation. To minimize such risks, BASF uses globally uniform processes and systems to ensure IT security, such as stable and redundantly designed IT systems, backup processes, virus and access protection, encryption systems as well as integrated, Group-wide standardized IT infrastructure and applications. The systems used for information security are constantly tested, continuously updated, and expanded if necessary. In addition, our employees receive regular training on information and data protection. IT- related risk manage-ment is conducted using Group -wide regulations for organiza-tion and application, as well as an internal control system based on these regulations. BASF also established the Cyber Defense Center in 2015; is a member of the Cyber Security Sharing and Analytics e.V. (CSSA); and is a founding member of the German Cyber Security Organization (DCSO) together with Allianz SE, Bayer AG and Volkswagen AG.
Legal dispute and proceedings
We constantly monitor current and potential legal disputes and proceedings, and regularly report on these to the Board of Executive Directors and Supervisory Board. In order to assess the risks from current legal disputes and proceedings and any potential need to recognize provisions, we prepare our own analyses and assessments of the circumstances and claims considered. In addition, in individual cases, we consider the results of comparable proceedings and, if needed, indepen-dent legal opinions. Risk assessment is particularly based on estimates as to the probability of occurrence and the range of possible claims. These estimates are the result of close coop-eration between the affected operating and functional units together with the Legal and Finance units. If sufficient proba-bility is identified, a provision is recognized accordingly for each proceeding. Should a provision be unnecessary, general risk management continues to assess whether these litigations nevertheless present a risk for the EBIT of the BASF Group.

116 Management’s Report BASF Report 2017
Forecast — Opportunities and risks report
We use our internal control system to limit risks from potential infringements of rights or laws. For example, we try to avoid patent and licensing disputes whenever possible through extensive clearance research. As part of our Group-wide Compliance Program, our employees receive regular training.
Financial opportunities and risks
The management of liquidity, currency and interest rate risks is conducted in the Treasury unit. The management of commodity price risks takes place in the Procurement functional unit or in appropriately authorized Group companies. Detailed guide-lines and procedures exist for dealing with financial risks. Among other things, they provide for the segregation of trading and back office functions. As a part of risk management, activities in countries with transfer restrictions are continuously monitored. This includes, for example, regular analysis of the macroeconomic and legal environment, shareholders’ equity and the business models of the operating units. The chief aim is the reduction of counterparty, transfer and currency risks for the BASF Group.
Exchange rate volatility
Our competitiveness on global markets is influenced by fluctuations in exchange rates. For BASF’s sales, opportunities and risks arise in particular when the U.S. dollar exchange rate fluctuates. A full-year rise in the value of the U.S. dollar/euro exchange rate by $0.01 would result in an increase of around €50 million in the BASF Group’s EBIT, assuming other condi-tions remain the same. On the production side, we counter exchange rate risks by producing in the respective currency zones. Financial currency risks result from the translation of receivables, liabilities and other monetary items in accordance with IAS 21 at the closing rate into the functional currency of the respective Group company. In addition, we incorporate planned purchase and sales transactions in foreign currencies in our financial foreign currency risk management. These risks are hedged using derivative instruments, if necessary.
Interest rate risks
Interest rate risks result from potential changes in prevailing market interest rates. These can cause a change in the fair value of fixed-rate instruments and fluctuations in the interest payments for variable-rate financial instruments, which would positively or negatively affect earnings. To hedge these risks, interest rate swaps and combined interest rate and currency derivatives are used in individual cases.
In addition to market interest rates, BASF’s financing costs are determined by the credit risk premiums to be paid. These are mainly influenced by our credit rating and the market conditions at the time of issue. In the short to medium term, BASF is largely protected from the possible effects on its interest result thanks to the balanced maturity profile of its financial indebtedness.
Risks from metal and raw materials trading
In the catalysts business, BASF employs commodity derivatives for precious metals and trades precious metals on behalf of third parties and on its own account. Appropriate commodity derivatives are also traded to optimize BASF’s supply of refinery products, gas and other petrochemical raw materials. To address specific risks associated with these trades, which are not part of our operating business, we set and continuously monitor limits with regard to the type and size of the deals concluded.
Liquidity risks
Risks from fluctuating cash flows are recognized in a timely manner as part of our liquidity planning. We have access to extensive liquidity at any time thanks to our good ratings, our unrestricted access to the commercial paper market and committed bank credit lines. In the short to medium term, BASF is largely protected against potential refinancing risks by the balanced maturity profile of its financial indebtedness as well as through diversification in various financial markets.
For more information on the maturity profile of our financial indebted-ness, see the explanations in the Financial Position on page 58 and the Notes to the Consolidated Financial Statements from page 218 onward
Risk of asset losses
We limit country -specific risks with measures based on internally determined country ratings, which are continuously updated to reflect changing environment conditions. We selectively use investment guarantees to limit specific country-related risks. We lower credit risks for our financial investments by engaging in transactions only with banks with good credit ratings and by adhering to fixed limits. Creditworthiness is continuously monitored and the limits are adjusted accordingly. We reduce the risk of default on receivables by continuously monitoring the creditworthiness and payment behavior of our customers and by setting appropriate credit limits. Due to the global activities and diversified customer structure of the BASF Group, there are no major concentrations of credit default risk. Risks are also limited through the use of credit insurance and bank guarantees.

BASF Report 2017 Management’s Report
Forecast — Opportunities and risks report 117
Impairment risks
The risk of an asset impairment occurs if the assumed interest rate in an impairment test increases, the predicted cash flows decline, or investment projects are suspended. In the current business environment, we consider the risk of impairment of individual assets such as customer relationships, technologies and trademarks, as well as goodwill, to be nonmaterial. Never-theless, a continuing decline in the prices of oil or gas below our assumed planning level would result in impairment risks for the Oil & Gas segment’s assets.
Long-term incentive program for senior executives
Our senior executives have the opportunity to participate in a share price-based compensation program. The need for provisions for this program varies according to the develop-ment of the BASF share price and the MSCI World Chemicals Index; this leads to a corresponding increase or decrease in personnel costs.
Risks from pension obligations
Most employees are granted company pension benefits from either defined contribution or defined benefit plans. We predominantly finance company pension obligations externally through separate plan assets. This particularly includes BASF Pensionskasse VVaG and BASF Pensionstreuhand e.V. in Germany, in addition to the large pension plans of our Group companies in North America, the United Kingdom and Switzer-land. To address the risk of underfunding due to market -related fluctuations in plan assets, we have investment strategies that align return and risk optimization to the structure of the pension obligations. Stress scenarios are also simulated regularly by means of portfolio analyses. An adjustment to the interest rates used in discounting pension obligations leads immediately to changes in equity. To limit the risks of changing financial market conditions as well as demographic developments, employees have been almost exclusively offered defined contribution plans for future years of service in recent years. Some of these contribution plans include minimum interest guarantees. If the pension fund cannot generate this, it must be provided by the employer. A permanent continuation of the low interest rate environment could make it necessary to recognize pension obligations and plan assets for these plans.
Long-term opportunities and risks
Long-term demand development
We assume that chemical production (excluding pharmaceuti-cals) will grow slightly faster than global gross domestic product over the next five years and be slightly below the previous five-year average. Through our market-oriented and broad portfolio, which we will continue to strengthen in the years ahead through investments in new production capacities, research and develop ment activities and acquisitions, we aim to achieve sales growth that slightly exceeds this market growth. Should global economic growth see unexpected, considerable deceler-ation, due for example to an ongoing weak period in the emerg-ing markets or to geopolitical crises, the expected growth rates could prove too ambitious. As a result of our high degree of diversification across various customer industries and regions, we would still expect our growth to be above the market aver-age, even under these conditions.
For more information on the “We create chemistry” strategy, see page 23 onward
Development of competitive and customer landscape
We expect competitors – especially in Asia and the Middle East – to gain increasing significance in the years ahead. Furthermore, we predict that many producers in countries rich in raw materials will expand their value chains. We counter this risk through active portfolio management. We exit markets in which we see only limited possibilities to stand out from com-petitors in the long term. We continuously improve our processes in order to remain competitive through our operational excellence. Our strategic excellence program, DrivE, also contributes to this aim. Start-ing at the end of 2018, we expect this program to contribute around €1 billion in earnings each year compared with baseline 2015. In order to achieve lasting profitable growth, tap into new market segments and customers, and make our customers more successful, our research and business focus is on highly innovative business areas, some of which we enter into through strategic cooperative partnerships.
Innovation
The trend toward more sustainability in our customer industries continues. We want to use innovations to take advantage of the resulting opportunities. In the long term, we aim to continue increasing sales and earnings with new and improved products.

118 Management’s Report BASF Report 2017
Forecast — Opportunities and risks report
The central research areas Process Research & Chemical Engineering, Advanced Materials & Systems Research and Bioscience Research serve as global platforms headquartered in our key regions: Europe, Asia Pacific and North America. Together with the development units in our operating divisions, they form the core of the global Know-How Verbund. Stronger regional presence opens up new opportunities to participate in local innovation processes and gain access to local talent. We optimize the effectiveness and efficiency of our research activities through our global Know-How Verbund. Research activities funded by the BASF Group promote the targeted development and enhancement of key technolo-gies as well as the establishment of new business areas. Focus areas in research are determined based on their strategic rele-vance for BASF, above and beyond existing business areas. We also address the risk of the technical or economic failure of research and development projects by maintaining a balanced and comprehensive project portfolio, as well as through professional, milestone-based project management. The opportunities of digitalization – especially in produc-tion, for new business models and in research and develop-ment – are being assessed in specific project organizations. To take advantage of these, measures are being implemented together with the divisions and the functional and research units. The risks of digitalization are managed in the divisions and functional units. The trust of customers and consumers is essential for the successful introduction of new technologies. That is why we enter into dialog with our stakeholders at an early stage of development.
For more information on innovation and digitalization, see pages 35 to 39
Portfolio development through investments
Our decisions on the type, size and locations of our investment projects are based on assumptions related to the long term development of markets, margins and costs, as well as raw material availability and country, currency and technology risks. Opportunities and risks arise from potential deviations in actual developments from our assumptions. We expect the increase in chemical production in emerging markets in the coming years to remain above the global average. This will create opportunities that we want to exploit by expanding our local presence. We are continuing to evaluate an investment in a world-scale methane-to-propylene complex on the U.S. Gulf Coast and conduct regular assessments, taking into account raw materials prices and the relevant market conditions.
For more information on our investment plans, see page 124
Acquisitions
In the future, we will continue to refine our portfolio through acquisitions that promise above-average profitable growth, are innovation-driven, offer added value for our customers and reduce the cyclicality of our earnings. The evaluation of opportunities and risks plays a significant role during the assessment of acquisition targets. A detailed analysis and quantification is conducted as part of due diligence. Examples of risks include increased staff turnover, delayed realization of synergies, or the assumption of obligations that were not precisely quantifiable in advance. If our expectations in this regard are not fulfilled, risks could arise, such as the need to impair intangible assets; however, there could also be oppor-tunities, for example, from additional synergies.
For more information on our acquisitions, see page 40 onward
Recruitment and long-term retention of qualified employees
BASF is adjusting in the medium and long term to the rising challenge of gaining skilled employees due to demographic changes, especially in North America and Europe. As a result, there is an increased risk that job vacancies may not be filled with suitable applicants, or only after a delay. We address these risks with measures to integrate diversity, employee and leadership development, and intensified employer branding. At local level, demographic management includes succession planning, knowledge management and offerings to improve the balance between personal and professional life and pro-mote healthy living. This increases BASF’s appeal as an employer and retains our employees in the long term.
For more information on the individual initiatives and our goals, see page 42 onward
Sustainability
As part of our sustainability management, we also assess the opportunities and risks associated with the topics we have identified as material. These also include the increasing internal ization of external effects, through which positive and neg a tive earnings contributions from companies’ activities that were previously borne by the community are attributed to these companies. For example, the material topic “energy and climate” is analyzed to enable us to identify, assess and manage climate-related risks and opportunities. For BASF as an energy- intensive company, these arise particularly from regulatory changes, such as in carbon prices through emissions trading systems, taxes or energy legislation.
For more information on sustainability management and material topics for BASF, see page 29 onward
For more information on energy and climate protection, see page 104 onward
For more information on opportunities and risks from energy policies, see page 114

BASF Report 2017 Management’s Report
Forecast — Economic environment in 2018 119
Economic environment in 2018
The global economy is expected to grow by 3.0% in 2018, about as fast as in 2017 (+3.1%). We expect economic momentum in the European Union (E.U.) to ease slightly. The United States will presumably grow at a slightly stronger rate. We anticipate a weakening of the high growth in China. This will probably negatively impact the Japanese economy as well. We forecast a continuation of the recovery already underway in Brazil and Russia. Global chemical production is forecast to grow by 3.4% in 2018, roughly at the same rate as in 2017 (+3.5%). For 2018, we predict an average price of $65 per barrel for Brent crude oil and an exchange rate of $1.20 per euro.
Trends in the global economy in 2018
▪ Slightly slower growth forecast for the E.U. ▪ Slightly stronger growth in the United States ▪ Growth moderation expected in China ▪ Continuation of recovery in Brazil and Russia
Growth in the E.U. is expected to slow slightly in 2018. Although the economy is in a cyclical upturn that is likely to continue in 2018, supported by low interest rates and moder-ate inflation, exports will be curbed by the comparatively strong euro and the weaker growth expected in Asia. We also anticipate a weakening of growth in the United Kingdom as uncertainty about the situation following the announced Brexit dampens investment and private consumers increasingly suffer from unclear labor market prospects and high inflation. Growth rates in the eastern E.U. countries are forecast to decline slightly after the strong upswing in the previous year. We expect the recovery in Russia to continue at roughly the same moderate pace as in 2017. The United States should maintain its economic momen-tum, with slightly stronger growth compared with 2017. Early economic indicators point to a stable, positive consumer climate, which also reflects the strong labor market trend. Moderating effects will come from the financial market. Slowly rising interest rates should put more of a damper on consumer spending than in the previous year. By contrast, the corporate tax cut and the income tax reform passed in December 2017 will provide additional growth stimulus.
Outlook for gross domestic product 2018(Real change compared with previous year)
World 3.0%
European Union 2.0%
United States 2.5%
Emerging markets of Asia 5.9%
Japan 1.2%
South America 2.0%
Trends in gross domestic product 2018–2020 (Average annual real change)
World 2.9%
European Union 1.7%
United States 2.3%
Emerging markets of Asia 5.7%
Japan 0.8%
South America 2.4%
In the emerging markets of Asia, we expect economic growth to remain robust but slightly below the prior-year level in 2018. China should report slower but still strong growth: Government stimuli for the economy will probably be weaker and the financial markets will generally be more strictly regulat-ed to prevent a further rise in corporate and consumer debt. Conversely, we are seeing slightly stronger growth rates in India. Here, the dampening effects of the introduction of a new sales tax system will presumably taper off. For Japan, we anticipate a slowdown in 2018 after a year of unexpectedly high growth. In particular, China’s stimulating effect on Japanese exports is expected to weaken. However, the weak yen and the expansive fiscal policy will shore up the Japanese economy, meaning that the moderate upward trend is expected to continue. We anticipate a continuation of the slow economic recov-ery in South America. In Brazil, demand for investment goods and durable consumer goods will presumably pick up slowly and export demand will develop solidly. We expect the Argentinian government to continue its path of reforms. Declining inflation rates should strengthen private consump-tion, and rising demand should also improve the investment climate.

120 Management’s Report BASF Report 2017
Forecast — Economic environment in 2018
Outlook for key customer industries
▪ Stable growth expected in global industrial production for 2018
We expect global industrial production in 2018 to grow at more or less the same rate as in the previous year (2017: +3.3%; 2018: +3.2%). The trends in the regions are mixed: Growth in the E.U. and Japan will probably weaken compared with the high level of 2017. By contrast, we anticipate a slight upturn in the United States. In the emerging markets of Asia, we assume that China will experience a cooldown but India will return to stronger industrial growth. In South America, the recovery in industrial production that emerged over the course of 2017 is expected to continue. The transportation industry should post stable growth overall, roughly on the same level as in 2017. We continue to anticipate modest growth rates for the automotive industry in western Europe, but stronger and stable growth of around 3% for production in the transportation industry as a whole. Con-tinued robust growth is forecast for the eastern European automotive market, supported by a dynamic recovery of pro-duction in Russia. Automotive production in North America should also once again see slight growth in 2018 after the decline in the previous year. One reason is the anticipated replacement of the vehicles that were destroyed in the hurri-canes in fall 2017. We expect growth in Asia to slow, mainly as a result of the phasing out of sales tax incentives in China at the end of 2017. By contrast, the automotive industry in South America is expected to continue its recovery. In the energy and raw materials sector, we anticipate stronger production growth for 2018. The increase in prices for energy raw materials will drive forward the production of unconventional oil and gas deposits in the United States. In the Middle East, on the other hand, we only anticipate a slight rise in growth rates due to the ongoing production cuts imposed by the OPEC countries. We predict slight growth in South America for 2018 following the decline in the previous year. In Europe, too, we expect energy and raw material production to expand at a slightly higher rate. Global growth in the construction industry should increase slightly in 2018. However, we expect slightly weaker growth overall in western Europe: The construction industry in Germany is stretched to its capacity limits, government subsidy programs in France are coming to an end and the announced Brexit is negatively impacting construction demand in the United Kingdom. We anticipate robust growth in demand in the eastern European construction sector, which is also sup-ported by a gradual recovery in Russia. For the United States, we forecast low growth in the construction industry, but higher than the weak prior-year level; in the infrastructure segment, we once again expect a slight increase following a signifi - cant decline in the previous year. In China and the other
Asian emerging markets, we predict largely stable growth rates in the construction industry. As in previous years, the highest growth rates will likely be in infrastructure investment. For South America, we predict a weak increase in 2018 for the first time after four years of declining construction activity. Given a background of continuing weak oil and gas prices, the construction industry in the Middle East should see moderate growth. We expect consumer goods production to pick up slightly in 2018 in line with the positive trajectory of the world economy and rising purchasing power of consumers. Growth in western and eastern Europe should weaken somewhat after an excep-tionally strong previous year. We expect moderate growth in production in North and South America in 2018. In Asia, the world’s largest market for consumer goods, we forecast stable growth roughly at the high prior-year level. The electronics industry benefits from increasing digitali-zation and automation. Following strong growth in the previous year, particularly in Asia, growth rates should remain high but ease slightly in 2018. The industry will see different trends in the main production countries: We still anticipate double-digit growth rates in the emerging economies of Asia despite a slight slowdown. The downturn is expected to be more pronounced in Japan. Growth in the United States should in-crease slightly. We expect slightly lower growth in the health and nutrition sector for 2018 after a comparatively strong performance in 2017. The weaker global growth rate is primarily attributable to Asia, where momentum will be strong but slightly slower. In Europe, too, we anticipate a slight decline in growth, while slightly stronger increases are forecast for North and South America. Agricultural production should see stable growth in 2018 on a level with the long-term average. That being said, we expect very different regional trends. We anticipate slightly stronger growth at a low level in Europe, while production in North America should expand at a higher rate after the weather- related losses in the previous year. Continued growth is forecast for South America; however, this is expected to be weaker than the rates seen in 2017. The agricultural industry in Asia should expand at roughly the same robust level of the previous year.

BASF Report 2017 Management’s Report
Forecast — Economic environment in 2018 121
Outlook for the chemical industry
▪ Global growth in chemical industry roughly at level of previous year
Global chemical production (excluding pharmaceuticals) is expected to grow by 3.4% in 2018, roughly on a level with 2017 (+3.5%). We anticipate a slightly weaker expansion rate in the advanced economies (2017: +3.7%; 2018: +2.4%). Growth in the emerging markets should pick up slightly (2017: +3.4%; 2018: +4.2%). The development of the world’s largest chemical market – China – has a significant impact on the global growth rate. We again expect slightly stronger growth here after a compara-tively weak figure in 2017. As a result, China will presumably once again account for almost two percentage points of global chemical growth. Growth rates in the remaining emerg-ing markets of Asia should remain stable. We expect growth in the E.U. to remain above average in 2018, but slower than in 2017. Domestic demand in key cus-tomer industries will probably be slightly weaker following strong industrial growth in the previous year. We also anticipate weaker export demand from Asia. By contrast, chemical growth in the United States should pick up. One reason for the higher growth forecast for 2018 is the production outages in the U.S. caused by Hurricane Harvey in fall 2017. In addition, new production capacities will reach the market in 2018, which will presumably increase exports as well.
We expect chemical growth in Japan to level off after unusu-ally strong, largely export-driven growth in the previous year. In South America, we assume that the upturn in the chemical industry will continue in line with the overall eco nomic recovery.
Outlook for chemical production 2018 (excl. pharmaceuticals) (Real change compared with previous year)
World 3.4%
European Union 2.2%
United States 3.2%
Emerging markets of Asia 4.6%
Japan 2.5%
South America 2.0%
Trends in chemical production 2018–2020 (excl. pharmaceuticals) (Average annual real change)
World 3.4%
European Union 1.5%
United States 3.2%
Emerging markets of Asia 4.9%
Japan 1.0%
South America 2.4%

122 Management’s Report BASF Report 2017
Forecast — Outlook 2018
Outlook 2018
For 2018, we expect the global economy and chemical production to grow at roughly the same pace as in 2017. We assume an average price of $65 for a barrel of Brent blend crude oil and an exchange rate of $1.20 per euro. In this environment, we aim to continue to grow profitably and slightly increase the BASF Group’s sales and income from operations (EBIT) before special items in 2018.1 This forecast takes into account the agreed trans-actions with Bayer and Solvay. In contrast, it does not include the intended merger of our oil and gas activities with the business of DEA Deutsche Erdoel AG and its subsidiaries.
For more information on our expectations for the economic environment in 2018, see page 119 onward
Sales and earnings forecast for the BASF Group
▪ Slight sales growth, mainly from higher volumes ▪ EBIT before special items expected to be up slightly
on 2017 level
Our forecast for 2018 includes the agreed acquisition of sig-nificant parts of Bayer’s seed and non-selective herbicide businesses, which is expected to close in the first half of 2018. Based on the timing of the acquisition, the seasonality of the businesses to be taken over and the anticipated integra-tion costs, this is likely to have a positive impact on sales and a negative impact on earnings for the Agricultural Solutions segment and the BASF Group in 2018. This outlook also includes the intended acquisition of Solvay’s integrated polyamide business in the third quarter of 2018. However, we currently do not expect this transaction to have any mate-rial effect on sales and earnings for 2018. We anticipate slightly higher BASF Group sales in 2018, largely as a result of volumes growth. We expect considerable sales growth in the Agricultural Solutions and Oil & Gas seg-ments, and slightly higher sales in the Functional Materials & Solutions and Performance Products segments and in Other. Our planning for the Chemicals segment assumes slightly lower sales due to price factors. EBIT before special items is expected to be up slightly on the 2017 level. This will mainly be driven by significantly higher contributions from the Performance Products, Functional Materials & Solutions and Oil & Gas segments. We are fore-casting a slight improvement in the earnings generated by
Other. After a strong result in 2017, we expect considerably lower EBIT before special items in the Chemicals segment, primarily as a result of lower margins. We anticipate a slight decrease in the Agricultural Solutions segment: The agreed transaction with Bayer is likely to have a negative effect on earnings in 2018. Excluding this acquisition, we would expect the segment to record slight growth in EBIT before special items. EBIT for the BASF Group is forecast to decline slightly in 2018. We anticipate special charges in the form of integration costs in connection with the agreed acquisitions. In contrast, the Performance Products and Oil & Gas segments in particular recorded special income in 2017. EBIT in the Chemicals and Agricultural Solutions segments is expected to be consider-ably below the 2017 figure. We are forecasting slightly higher EBIT for the Performance Products and Oil & Gas segments and Other, and considerable growth in the Functional Mate-rials & Solutions segment. We aim to once again earn a significant premium on our cost of capital in 2018. However, compared with the previous year, the BASF Group’s EBIT after cost of capital will decrease considerably. This will mainly be due to lower EBIT as well as the additional cost of capital from the planned acquisitions. In the Chemicals and Agricultural Solutions seg-ments, we anticipate a considerable decrease in EBIT after cost of capital, and a considerable increase in the Performance Products, Functional Materials & Solutions and Oil & Gas segments. The intended merger of our oil and gas activities with the business of DEA Deutsche Erdoel AG and its subsidiaries is not taken into account in this outlook. On signature of the final transaction agreements, the Oil & Gas segment’s earnings would no longer be included in sales and EBIT for the BASF Group – retroactively as of January 1, 2018 and with the prior-year figures restated. Rather, this would be presented in the income before minority interests of the BASF Group as a separate item, income from discontinued operations. From the transaction closing date, we would presumably account for BASF’s share of income generated by the joint venture – Winters hall DEA – using the equity method and include this in EBIT for the BASF Group. The gain from the change from full consolidation to the equity method would be shown in income from discontinued operations. The significant risks and opportunities that could affect our forecast are described on pages 111 to 118.
1 For sales, “slight” represents a change of 1–5%, while “considerable” applies to changes of 6% and higher. “At prior-year level” indicates no change (+/–0 %). For earnings, “slight” means a change of 1–10%, while “considerable” is used for changes of 11% and higher. “At prior-year level” indicates no change (+/–0 %).

BASF Report 2017 Management’s Report
Forecast — Outlook 2018 123
Sales and earnings forecast for the segments
Despite the planned volumes growth, sales in the Chemicals segment are expected to decline slightly in 2018 due to price factors. Overall, we anticipate lower sales prices in the isocyanates business as a result of additional capacities, especially in the Middle East and Asia, which will increase competitive pressure. EBIT before special items will presum-ably be considerably below the high 2017 level. The earnings contribution from higher sales volumes is not expected to compensate for the lower margins in the isocyanates business in particular. In the Performance Products segment, we expect sales to be up slightly on the prior-year level in 2018. We plan to increase sales through volumes growth in the Dispersions & Pigments, Care Chemicals and Performance Chemicals divisions and are forecasting higher average prices overall. Sales will be dampened by the absence of the leather chemicals business, which was transferred to the Stahl group at the end of the third quarter of 2017, as well as the antici-pated negative currency effects and the limited product avail-ability of citral-based flavors and fragrances as well as vitamins. We are aiming for a considerable year-on-year increase in EBIT before special items with higher volumes and margins as well as strict cost discipline. Sales in the Functional Materials & Solutions segment will presumably rise slightly in 2018. Higher overall prices and volumes growth in all divisions – due to factors such as the startup of new production capacities – should contribute to this. Our forecast is supported by the expectation of continu-ing good demand from the automotive and construction industries. Despite the continued challenging market environ-ment and higher fixed costs from new plants, we anticipate a considerable increase in EBIT before special items, mainly as a result of volumes growth and higher margins.
In the Agricultural Solutions segment, our aim is to exploit positive market momentum, especially in the emerging markets, significantly increase sales volumes with innovative solutions and raise our prices. This should more than offset the expected negative currency effects. In this way, we plan to considerably increase sales. Excluding the agreed transaction with Bayer, we would expect a slight improvement in earnings, mainly from the planned volumes growth and innovative new products amid continued strict cost management. However, negative earnings effects from the timing of the acquisition, the seasonality of the businesses to be taken over and the anticipated integration costs will probably lead to a slight decline in EBIT before special items. Our forecast for the Oil & Gas segment does not take into account the intended merger of our oil and gas activities with the business of DEA Deutsche Erdoel AG and its subsidiaries. Planning for the 2018 business year is based on an average price for Brent blend crude oil of $65 per barrel. Gas prices are likely to be on a level with 2017. We are forecasting consider-able growth in sales and EBIT before special items in the Oil & Gas segment, driven by positive price effects and the start of production at fields in Norway in particular. Sales in Other are expected to increase slightly in 2018, primarily as a result of higher sales from raw materials trading. We anticipate a slight improvement in EBIT before special items as against 2017.
Forecast by segment1 (million €)
SalesIncome from operations (EBIT)
before special items
2017 Forecast 2018 2017 Forecast 2018
Chemicals 16,331 slight decline 4,233 considerable decline
Performance Products 16,217 slight increase 1,416 considerable increase
Functional Materials & Solutions 20,745 slight increase 1,617 considerable increase
Agricultural Solutions 5,696 considerable increase 1,033 slight decline2
Oil & Gas 3,244 considerable increase 793 considerable increase
Other 2,242 slight increase (764) slight increase
BASF Group 64,475 slight increase 8,328 slight increase
1 For sales, “slight” represents a change of 1–5%, while “considerable” applies to changes of 6% and higher. “At prior-year level” indicates no change (+/–0 %). For earnings, “slight” means a change of 1–10%, while “considerable” is used for changes of 11% and higher. “At prior-year level” indicates no change (+/–0 %).
2 Excluding the agreed transaction with Bayer, we expect a slight increase in EBIT before special items in the Agricultural Solutions segment.

124 Management’s Report BASF Report 2017
Forecast — Outlook 2018
Investments1
▪ Investments of around €4.0 billion planned for 2018
Our investments in 2017 focused on the Chemicals, Functional Materials & Solutions and Oil & Gas segments. For example, we started up the expanded compounding plant for Ultramid® and Ultradur® in Schwarzheide, Germany, completed construction of the chemical catalysts plant in Shanghai, China, and invested in field development projects in Argentina, Norway and Russia. We are planning total capital expenditures of around €4.0 billion for the BASF Group in 2018. For the period from 2018 to 2022, we have planned capital expenditures totaling €19.0 billion. The investment volume in the coming years is thus in line with the planning period 2017 to 2021. Projects currently being planned or underway include:
Capital expenditures: Selected projects
Location Project
Geismar, Louisiana Capacity expansion: MDI plant
Ludwigshafen, Germany
Replacement: acetylene plant
Construction: production plant for vitamin A
Construction: production plant for ibuprofen
Shanghai, China Construction: production plant for plastic additives
Sroda Slaska, Poland
Capacity expansion: plant for emissions catalysts
In the Oil & Gas segment, our currently planned investments of around €3.5 billion between 2018 and 2022 will focus mainly on the development of proven gas and oil deposits in Argentina, Norway and Russia. The actual expenses are also dependent on oil and gas price developments and will be adjusted as necessary. If the merger of our oil and gas activities with the business of DEA Deutsche Erdoel AG and its subsidiaries is consummated as intended, these expenditures will no longer be reported as investments by the BASF Group.
Investments in property, plant and equipment by segment, 2018–2022
1 Chemicals 25%
2 Performance Products 16%
3 Functional Materials & Solutions 19%
4 Agricultural Solutions 4%
5 Oil & Gas 18%
6 Other (infrastructure, R&D) 18%
Investments in property, plant and equipment by region, 2018–2022
1 Europe 54%
2 North America 19%
3 Asia Pacific 14%
4 South America, Africa, Middle East 8%
5 Alternative sites currently being investigated 5%
Dividends
We stand by our ambitious dividend policy and offer our share-holders an attractive dividend yield. We continue to aim to increase our dividend each year, or at least maintain it at the previous year’s level.
Information on the proposed dividend can be found on page 15
Financing
In 2018, we expect cash outflows in the equivalent amount of around €1.8 billion from the scheduled repayment of bonds. To refinance maturing bonds and to optimize our maturity profile, we continue to have medium to long-term corporate bonds and our U.S. dollar commercial paper program at our disposal.
Information on our financing policies can be found on page 58
Events after the reporting period
There have been no significant changes in the company’s situation or market environment since the beginning of the 2018 business year.
1
2
3
4
5
6
€19.0 billion
1
2
3
45
€19.0 billion
1 Excluding additions to property, plant and equipment resulting from acquisitions, capitalized exploration, restoration obligations and IT investments

3
Co
rpo
rate
Go
vern
ance
Corporate governance report 127
Compliance 135
Management and Supervisory Boards 137Board of Executive Directors 137Supervisory Board 139
Compensation report 140
Report of the Supervisory Board 152
Declaration of Conformity pursuant to section 161 of the German Stock Corporation Act (AktG) 157
Declaration of Corporate Governance 158
To Our Shareholders 5
Management’s Report 17
Corporate Governance Consolidated Financial Statements 159
Supplementary Information on the Oil & Gas Segment 235
Overviews 245


BASF Report 2017 Corporate Governance
Corporate governance report 127
Corporate governance report
Corporate governance refers to the entire system for managing and supervising a company. This includes its organization, values, corporate principles and guidelines as well as internal and external control and monitoring mechanisms. Effective and transparent corporate gover-nance guarantees that BASF is directed and monitored in a responsible manner focused on value creation. It fosters the confidence of our domestic and international inves-tors, the financial markets, our customers and other business partners, employees, and the public in BASF.
The fundamental elements of BASF SE’s corporate gover-nance system are: its two -tier system, with a transparent and effective separation of company management and supervision between BASF’s Board of Executive Directors and the Super-visory Board; the equal representation of shareholders and employees on the Supervisory Board; and the shareholders’ rights of co -administration and supervision at the Annual Shareholders’ Meeting.
Direction and management by the Board of Executive Directors
▪ Board of Executive Directors strictly separate from the Supervisory Board
▪ Responsible for company management ▪ Sets corporate goals and strategic direction
The Board of Executive Directors is responsible for the man-agement of the company, and represents BASF SE in business undertakings with third parties. BASF’s Board of Executive Directors is strictly separated from the Supervisory Board, which monitors the activity of the Board of Executive Directors and decides on its composition. A member of the Board of Executive Directors cannot simultaneously be a member of the Supervisory Board. As the central duty of company manage-ment, the Board of Executive Directors agrees on the corpo-rate goals and strategic direction of the BASF Group as well as its individual business areas; determines the company’s inter-nal organization; and decides on the composition of manage-ment on the levels below the Board. It also manages and monitors BASF Group business by planning and setting the corporate budget, allocating resources and management capacities, monitoring and making decisions on significant in-dividual measures, and supervising operational management.
The Board’s actions and decisions are geared toward the company’s best interests. It is committed to the goal of sus-tainably increasing the company’s value. Among the Board’s responsibilities is the preparation of the Consolidated and Separate Fnancial Statements of BASF SE and reporting on the company’s financial and nonfinancial performance. Further more, it must ensure that the company’s activities comply with the applicable legislation and regulatory require-ments, as well as internal corporate directives. This includes the establishment of appropriate systems for control, compli-ance and risk management as well as establishing a company- wide compliance culture with undisputed standards. Decisions that are reserved for the Board as a whole by law, through the Board of Executive Directors’ Rules of Proce-dure or through resolutions adopted by the Board, are made at regularly held Board meetings called by the Chairman of the Board of Executive Directors. Board decisions are based on detailed information and analyses provided by the business areas and specialist units, and, if deemed necessary, by exter-nal consultants. Board decisions can generally be made via a simple majority. In the case of a tied vote, the casting vote is given by the Chairman of the Board. However, the Chairman of the Board does not have the right to veto the decisions of the Board of Executive Directors. Members of the Board of Exec-utive Directors are authorized to make decisions individually in their assigned areas of responsibility. The Board can set up Board Committees to consult and decide on individual issues such as proposed material acqui-sitions or divestitures; these must include at least three mem-bers of the Board of Executive Directors. For the preparation of important decisions, such as those on acquisitions, divesti-tures, investments and personnel, the Board has various commissions at the level below the Board that carefully assess the planned measure and evaluate the associated opportuni-ties and risks, and based on this information, report and make recommendations to the Board – independently of the affected business area. The Board of Executive Directors informs the Supervisory Board regularly, without delay and comprehensively, of all issues important to the company with regard to planning, business development, risk situation, risk management and compliance. Furthermore, the Board of Executive Directors coordinates the company’s strategic orientation with the Supervisory Board.
Board of Executive Directors
Manages company and represents BASF SE in
business with third parties
Supervisory Board
Appoints, monitors and advises Board of
Executive Directors
Shareholders
Exercise rights of co-adminis-tration and supervision at
Annual Shareholders’ Meeting

128 Corporate Governance BASF Report 2017
Corporate governance report
The Statutes of BASF SE define certain transactions that require the Board of Executive Directors to obtain the Super-visory Board’s approval prior to their conclusion. Such cases include the acquisition and disposal of enterprises and parts of enterprises, as well as the issue of bonds or comparable finan-cial instruments. However, this is only necessary if the acquisi-tion or disposal price or the amount of the issue in an individ-ual case exceeds 3% of the equity reported in the last approved Consolidated Financial Statements of the BASF Group.
For more information on risk management, see the Forecast from page 111 onward
The members of the Board of Executive Directors, including their areas of responsibility and memberships on the supervisory bodies of other companies, are listed on page 137. Compensation of the Board of Executive Directors is described in detail in the Compensation report from page 140 onward.
Competence profile, diversity concept and succession planning for the Board of Executive Directors
The Supervisory Board works hand-in-hand with the Board of Executive Directors to ensure long-term succession planning for the composition of the Board of Executive Directors. BASF aims to fill most Board positions with candidates from within the company. It is the task of the Board of Executive Directors to propose a sufficient number of suitable candidates to the Supervisory Board. BASF’s long-term succession planning is guided by the “We create chemistry” strategy. It is based on systematic management development characterized by the following: – Early identification of suitable candidates of different profes-sional backgrounds, nationalities and genders
– Systematic development of leaders through the successful assumption of tasks with increasing responsibility, where possible in different business areas, regions and functions
– Desire to shape strategic and operational decisions, and proven success in doing so, as well as leadership skills, especially under challenging business conditions
– Role model function in putting our corporate values into practice
The aim is to enable the Supervisory Board to ensure a rea-sonable level of diversity with respect to education and profes-sional experience, cultural background, international represen-tation, gender and age when appointing members of the Board of Executive Directors. Independent of these individual criteria, the Supervisory Board is convinced that ultimately, only a holistic approach can determine an individual’s suitability for appointment to the Board of Executive Directors of BASF SE. The overall aim is to ensure that the Board of Executive Directors as a whole has the following profile, which serves as a diversity concept: – Many years of management experience in scientific, techni-cal and commercial fields
– International experience based on background and/or pro-fessional experience
– At least one female Board member – A balanced age distribution to ensure the continuity of the Board’s work and enable seamless succession planning
The number of Board members is based on the insights gained by BASF as a company with an integrated leadership culture and is determined by the needs arising from coopera-tion within the Board of Executive Directors. The Board of Executive Directors currently comprises eight members.1 The standard age limit for members of the Board of Executive Directors is 63. The current composition of the Board of Executive Direc-tors meets the competence profile and the requirements of the diversity concept in full.
Two-tier management system of BASF SE
Board of Executive Directors
8 membersappointed by the Supervisory Board
Chairmanappointed by the Supervisory Board
12 members6 shareholder representatives elected at the Annual Shareholders’ Meeting
and 6 employee representatives
Chairmanelected by the Supervisory Board
Supervisory Board
appoints the Board of Executive Directors
monitors the Board of Executive Directors
advises the Board of Executive Directors
reports to Supervisory Board
1 In May 2018, this will be reduced from eight to seven members in the course of the changes to the composition of the Board of Executive Directors.

BASF Report 2017 Corporate Governance
Corporate governance report 129
Supervision of company management by the Supervisory Board
▪ Supervisory Board appoints, monitors and advises Board of Executive Directors
▪ Four Supervisory Board committees
The Supervisory Board appoints the members of the Board of Executive Directors and supervises and advises the Board of Executive Directors on management issues. As members of the Supervisory Board cannot simultaneously be on the Board of Executive Directors, a high level of autonomy is already structurally ensured with regard to the supervision of the Board of Executive Directors. In addition to the SE Council Regulation, the relevant legal basis for the size and composition of the Supervisory Board is provided by the Statutes of BASF SE and the Agree ment Concerning the Involvement of Employees in BASF SE (Employee Participation Agreement), which also includes the regulations applicable to BASF for implementing the gender quota for the Supervisory Board mandated by law as of Janu-ary 1, 2016. The German Codetermination Act does not apply to BASF as a European stock corporation (Societas Europaea, SE). The Supervisory Board of BASF SE comprises 12 mem-bers. Six members are elected to a five-year term each by the shareholders at the Annual Shareholders’ Meeting. The remain- ing six members are elected by the BASF Europa Betriebs rat (BASF Works Council Europe), the European employee repre-sentation body of the BASF Group. The meetings of the Supervisory Board and its committees are called by their chairmen and, independently, at the request of one of their members or the Board of Executive Directors. Resolutions of the Supervisory Board are passed by a simple majority vote of the participating members. In the event of a tie, the vote of the Chairman of the Supervisory Board, who must always be a shareholder representative, shall be the casting vote. This resolution process is also applicable for the appointment and dismissal of members of the Board of Exec-utive Directors by the Supervisory Board. Resolutions can, as needed, also be made in writing or through other means of communication outside of the meetings, as long as no mem-ber objects to this form of passing a resolution. The Board of Executive Directors regularly informs the Supervisory Board about matters such as the course of busi-ness and expected developments, the financial position and results of operations, corporate planning, the implementation of the corporate strategy, business opportunities and risks, and risk and compliance management. The Supervisory Board has embedded the main reporting requirements in an informa-tion policy. The Chairman of the Supervisory Board is in regular contact with the Board of Executive Directors outside of meet-ings as well. BASF SE’s Supervisory Board has established a total of four Supervisory Board Committees: the Personnel Commit-
tee, the Audit Committee, the Nomination Committee and the Strategy Committee.
For more information on the Statutes of BASF SE and the Employee Participation Agreement, see basf.com/en/cg/investor
A list of the members of the Supervisory Board of BASF SE indicating which members are shareholder or employee representatives and their appointments to the supervisory bodies of other companies can be found on page 139
The compensation of the Supervisory Board is described in the Compensation report from page 150 onward
Personnel Committee
Members: Dr. Jürgen Hambrecht (chairman), Michael Diekmann, Sinischa Horvat (since May 12, 2017), Robert Oswald (until May 12, 2017), Michael Vassiliadis
Duties: – Prepares the appointment of members to the Board of Exec-utive Directors by the Supervisory Board as well as the employment contracts to be entered into with members of the Board of Executive Directors
– When making recommendations for appointments to the Board of Executive Directors, considers professional qualifi-cations, international experience and leadership skills as well as long term succession planning, diversity, and especially the appropriate consideration of women
– Prepares the resolutions made by the Supervisory Board with regard to the system and amount of compensation paid to members of the Board of Executive Directors
Audit Committee
Members: Dame Alison Carnwath DBE (chairman), Ralf-Gerd Bastian, Franz Fehrenbach, Michael Vassiliadis
Duties: – Prepares the negotiations and resolutions of the Supervisory Board for the approval of the Financial Statements, the Con-solidated Financial Statements and the Management’s Reports including the nonfinancial statements and discusses the quarterly statements and the half-year financial report with the Board of Executive Directors prior to their publica-tion
– Deals with monitoring the financial reporting process, the annual audit, the effectiveness of the internal control system, the risk management system, and the internal auditing sys-tem as well as compliance issues
– Is responsible for business relations with the company’s external auditor: prepares the Supervisory Board’s proposal to the Annual Shareholders’ Meeting regarding the selection of an auditor, monitors the auditor’s independence, defines the focus areas of the audit together with the auditor, nego-tiates auditing fees and establishes the conditions for the provision of the auditor’s nonaudit services

130 Corporate Governance BASF Report 2017
Corporate governance report
– Is authorized to request any information that it deems neces-sary from the auditor or Board of Executive Directors; can also view all of BASF’s business documents and examine these and all other assets belonging to BASF. The Audit Committee can also engage experts such as auditors or lawyers to carry out these inspections
Financial Experts: Dame Alison Carnwath DBE and Franz Fehrenbach are mem-bers with special knowledge of, and experience in, applying accounting and reporting standards and internal control meth-ods pursuant to the German Corporate Governance Code (GCGC).
Nomination Committee
Members: Dr. Jürgen Hambrecht (chairman), Dame Alison Carnwath DBE, Prof. Dr. François Diederich, Michael Diekmann, Franz Fehrenbach, Anke Schäferkordt
Duties: – Identifies suitable candidates for the Supervisory Board based on objectives for the composition decided on by the Supervisory Board
– Prepares the recommendations made by the Supervisory Board for the election of Supervisory Board members for the Annual Shareholders’ Meeting
Strategy Committee
Members: Dr. Jürgen Hambrecht (chairman), Ralf-Gerd Bastian (since May 12, 2017), Dame Alison Carnwath DBE, Michael Diek-mann, Sinischa Horvat (since May 12, 2017), Robert Oswald (until May 12, 2017), Michael Vassiliadis
Duties: – Handles the further development of the company’s strategy – Prepares resolutions of the Supervisory Board on the com-pany’s major acquisitions and divestitures
Meetings and meeting attendance
In the 2017 business year, meetings were held as follows: – The Supervisory Board met six times. – The Personnel Committee met four times. – The Audit Committee met five times. – The Nomination Committee met once. – The Strategy Committee met four times.
With the exception of one Supervisory Board meeting, two Audit Committee meetings, one Strategy Committee meeting
and one Personnel Committee meeting, at each of which one member was absent, all respective members attended all meetings of the Supervisory Board and its committees.
For more information on the Supervisory Board’s activities and resolu-tions in the 2017 business year, see the Report of the Supervisory Board on page 152 onward
For an individual overview of meeting attendance, see basf.com/gover-nance/supervisoryboard/meetings
Competence profile, diversity concept and objectives for the composition of the Supervisory Board
▪ Composition criteria: professional and personal quali-fications, diversity, and independence
One important concern of good corporate governance is to ensure that seats on the responsible corporate bodies, the Board of Executive Directors and the Supervisory Board, are appropriately filled. On December 21, 2017, the Supervisory Board therefore agreed on new objectives for the composition, the competence profile and the diversity concept of the Super-visory Board in accordance with section 5.4.1 of the German Corporate Governance Code (GCGC) and section 289f(2) no. 6 of the German Commercial Code (HGB). The guiding princi-ple for the composition of the Supervisory Board is to ensure qualified supervision and guidance for the Board of Executive Directors of BASF SE. Candidates shall be proposed to the Annual Shareholders’ Meeting for election to the Supervisory Board who can, based on their professional expertise and experience, integrity, commitment, independence and charac-ter, successfully perform the work of a supervisory board member in an international chemical company.
Competence profile
The following requirements and objectives are considered essential to the composition of the Supervisory Board as a collective body: – Leadership experience in managing companies, associa-tions and networks
– Members’ collective knowledge of the chemical sector and the related value chains
– Appropriate knowledge within the body as a whole of finance, accounting, financial reporting, law and compliance as well as one independent member with accounting and auditing expertise (“financial expert”) within the meaning of section 100(5) of the German Stock Corporation Act (AktG)
– At least one member with in-depth experience in digitaliza-tion, information technology, business models and start-ups
– At least one member with in-depth experience in human resources, corporate governance, communications and the media
– Specialist knowledge and experience in sectors outside of the chemical industry

BASF Report 2017 Corporate Governance
Corporate governance report 131
Diversity concept
The Supervisory Board strives to achieve a reasonable level of diversity with respect to character, gender, international repre-sentation, professional background, specialist knowledge and experience as well as age distribution, and takes the following composition criteria into account: – At least 30% women and 30% men – At least 30% of members have international experience based on their background or professional experience
– At least 50% of members have different educational back-grounds and professional experience
– At least 30% under the age of 60
Further composition objectives
– Character and integrity: All members of the Supervisory Board must be personally reliable and have the knowledge and experience required to diligently and independently perform the work of a supervisory board member.
– Availability: Each member of the Supervisory Board ensures that they invest the time needed to properly perform their role as a member of the Supervisory Board of BASF SE. The statutory limits on appointments to governing bodies and the recommendations of the German Corporate Governance Code (GCGC) must be complied with and the demands of the capital market given appropriate consideration when accepting further appointments.
– Age limit and period of membership: Persons who have reached the age of 72 on the day of election by the Annual Shareholders’ Meeting should generally not be nominated for election. Membership on the Supervisory Board should generally not exceed 15 years; this corresponds to three regular statutory periods in office.
– Independence: All Supervisory Board members should be independent within the meaning of the criteria specified in the German Corporate Governance Code (GCGC). This means that they may not have a personal or business relationship with BASF, its governing bodies, a controlling shareholder or a company affiliated with this controlling shareholder that may cause a substantial and not merely temporary conflict of interest. The Supervisory Board has additionally defined the following principles to clarify the meaning of independence: The independence of employee representatives is not com-promised by their role as an employee representative or employment by BASF SE or a Group company. Prior member ship of the Board of Executive Directors does not preclude independence following the expiry of the statutory cooling-off period of two years. Members who have sat on the Supervisory Board for more than 15 years are not consid-ered independent. Based on these criteria, the Supervisory Board should comprise at least 10 independent members; this also means that of the total of six shareholder represen-tatives, at least four must be independent.
Status of implementation
According to the Supervisory Board’s own assessment, its current composition already meets nearly all of the require-ments of the competence profile. Only the competence area of digitalization is not yet completely covered. The Supervisory Board intends to meet the competence profile in full with its nominations for election to the Supervisory Board in 2019. The same applies to the diversity concept. The Super-visory Board currently comprises 25% women. The target of 30%, which also corresponds to the statutory quota, is to be met following the Supervisory Board elections in 2019. According to the Supervisory Board’s assessment, 11 of the 12 current members are considered independent based on the above criteria. One member of the Supervisory Board no longer meets the independence criteria as he has been a member of the Supervisory Board since May 1998.
For more information on the statutory minimum quotas for the number of women and men on the Supervisory Board, see the section below
The independent Supervisory Board members are named under Management and Supervisory Boards on page 139
Commitments to promote the participation of women in leadership positions at BASF SE
▪ Minimum quota on Supervisory Board, target figures for Board of Executive Directors and top management
On April 24, 2015, the Law on Equal Participation of Women and Men in Leadership Positions in the Private and Public Sector came into force in Germany. The supervisory board of a publicly listed European society (SE) that is composed of the same number of shareholder and employee representatives must, according to section 17(2) of the SE Implementation Act, consist of at least 30% each of women and men. The Supervisory Board of BASF SE currently comprises three women and nine men. Two of the six shareholder representa-tives elected at the Annual Shareholders’ Meeting are women. According to the legal stipulations of section 17(2) SE Imple-mentation Act, the minimum quota is not to be fulfilled imme-diately but rather upon any necessary reappointments, that is, new elections. In 2017, the employee-elected Supervisory Board member Robert Oswald left the Supervisory Board. He is succeeded by Sinischa Horvat, who joined the Supervisory Board without additional appointment, that is, without elec-tion, as the member personally chosen to replace Robert Oswald as early as 2013 until the end of the 2019 Annual Shareholders’ Meeting. In accordance with legal regulations, the minimum quota will therefore be reached after the next regular Supervisory Board election in 2019 at the latest. As a target figure for the Board of Executive Directors, the Supervisory Board determined that, in accordance with sec-tion 111(5) AktG for the second target-attainment period after the law’s entry into force, which began on January 1, 2017, the Board of Executive Directors should continue to have at
132 Corporate Governance BASF Report 2017
Corporate governance report
least one female member. With eight members of the Board of Executive Directors, this represented 12.5% on the date the target was set. The Board of Executive Directors also decided on target figures for the proportion of women in the two man-agement levels below the Board of Executive Directors of BASF SE: Women are to make up 12.1% of the leadership level directly below the Board, and the level below that is to comprise 7.3% women. This corresponds to the status at the time these target figures were determined. The deadline for achieving the goals for the second target-attainment period was set for December 31, 2021. BASF views the further development and promotion of women as a global duty independent of individual Group com-panies. We set ourselves ambitious global goals for this and made further progress in 2017. BASF will continue working on expanding the percentage of women in its leadership team. The company is carrying out, and constantly enhancing, world-wide measures to this effect.
The November 2015 Employee Participation Agreement relevant to the composition of the Supervisory Board is available at basf.com/en/governance
For more information on women in executive positions in the BASF Group worldwide, see page 26
For more information on the inclusion of diversity, including promotion of women, see the chapter on Working at BASF in the Management’s Report on page 45
Shareholders’ rights
▪ Shareholders’ rights of co-administration and super-vision at the Annual Shareholders’ Meeting
▪ One share, one vote
Shareholders exercise their rights of co-administration and supervision at the Annual Shareholders’ Meeting, which usually takes place within the first five months of the business year. The Annual Shareholders’ Meeting elects half of the members of the Supervisory Board and, in particular, decides on the formal discharge of the Board of Executive Directors and the Supervisory Board, the distribution of profits, capital mea-sures, the authorization of share buybacks, changes to the Statutes and the selection of the auditor. Each BASF SE share represents one vote. All of BASF SE’s shares are registered shares. Shareholders are obliged to have themselves entered with their shares into the company share register and to provide the information necessary for registra-tion in the share register according to the German Stock Cor-poration Act. There are no registration restrictions and there is no limit to the number of shares that can be registered to one shareholder. Only the persons listed in the share register are entitled to vote as shareholders. Listed shareholders may exercise their voting rights at the Annual Shareholders’ Meet-ing either personally, through a representative of their choice or through a company-appointed proxy authorized by the shareholders to vote according to their instructions. There are neither voting caps to limit the number of votes a shareholder may cast nor special voting rights. BASF has fully implement-ed the principle of “one share, one vote.”
All shareholders entered in the share register are entitled to participate in the Annual Shareholders’ Meetings, to have their say concerning any item on the agenda and to request infor-mation about company issues insofar as this is necessary to make an informed judgment about the item on the agenda under discussion. Registered shareholders are also entitled to file motions pertaining to proposals for resolutions made by the Board of Executive Directors and Supervisory Board at the Annual Shareholders’ Meeting and to contest resolutions of the Meeting and have them evaluated for their lawfulness in court. Shareholders who hold at least €500,000 of the compa-ny’s share capital, a quota corresponding to 390,625 shares, are furthermore entitled to request that additional items be added to the agenda of the Annual Shareholders’ Meeting.
Implementation of the German Corporate Governance Code (GCGC)
▪ BASF SE follows all recommendations of German Corporate Governance Code (GCGC)
BASF advocates responsible corporate governance that focuses on sustainably increasing the value of the company. BASF SE follows all recommendations of the German Corporate Governance Code (GCGC) in its most recently revised version of February 2017. In the same manner, BASF has followed nearly all of the nonobligatory suggestions of the German Corporate Governance Code (GCGC). We have not implemented the suggestion to enable shareholders to follow the proceedings of the entire Annual Shareholders’ Meeting online. The Annual Shareholders’ Meeting is publicly accessi-ble via online broadcast until the end of the speech by the Chairman of the Board of Executive Directors. The subsequent discussion of items on the agenda is not accessible online in order to preserve the character of the Annual Shareholders’ Meeting as a meeting attended by our shareholders on -site.
The joint Declaration of Conformity 2017 by the Board of Executive Directors and Supervisory Board of BASF SE is rendered on page 157
For more information on the Declaration of Conformity 2017, the implementation of the Code’s suggestions and the German Corporate Governance Code, see basf.com/en/governance
Disclosures according to section 315a(1) of the German Commercial Code (HGB) and explanatory report of the Board of Executive Directors according to section 176(1) sentence 1 of the German Stock Corporation Act (AktG)
As of December 31, 2017, the subscribed capital of BASF SE was €1,175,652,728.32 divided into 918,478,694 registered shares with no par value. Each share entitles the holder to one vote at the Annual Shareholders’ Meeting. Restrictions on the right to vote or transfer shares do not exist. The same rights and duties apply to all shares. According to the Statutes, shareholders are not entitled to receive share certificates.

BASF Report 2017 Corporate Governance
Corporate governance report 133
There are neither different classes of shares nor shares with preferential voting rights (golden shares). The appointment and dismissal of members of the Board of Executive Directors is legally governed by the regulations in Article 39 of the SE Council Regulation, section 16 of the SE Implementation Act and sections 84, 85 AktG as well as Article 7 of the BASF SE Statutes. Accordingly, the Supervisory Board determines the number of members of the Board of Executive Directors (at least two), appoints the members of the Board of Executive Directors, and can nominate a chair-person, as well as one or more vice chairpersons. The mem-bers of the Board of Executive Directors are appointed for a maximum of five years, and reappointments are permissible. The Supervisory Board can dismiss a member of the Board of Executive Directors if there is serious cause to do so. Serious cause includes, in particular, a gross breach of the duties pertaining to the Board of Executive Directors and a vote of no confidence at the Annual Shareholders’ Meeting. The Supervi-sory Board decides on appointments and dismissals accord-ing to its own best judgment. According to Article 59(1) SE Council Regulation, amend-ments to the Statutes of BASF SE require a resolution of the Annual Shareholders’ Meeting adopted with at least a two-thirds majority of the votes cast, provided that the legal provi-sions applicable to German stock corporations under the German Stock Corporation Act do not stipulate or allow for larger majority requirements. In the case of amendments to the Statutes, the section 179(2) of the German Stock Corpo-ration Act requires a majority of at least three-quarters of the subscribed capital represented. Pursuant to Article 12(6) of the Statutes of BASF SE, the Supervisory Board is authorized to resolve upon amendments to the Statutes that merely concern their wording. This applies in particular to the adjustment of the share capital and the number of shares after the redemption of repurchased BASF shares and after a new issue of shares from the authorized capital. Until May 1, 2019, the Board of Executive Directors of BASF SE is empowered by a resolution passed at the Annual Shareholders’ Meeting of May 2, 2014, to increase the sub-scribed capital – with the approval of the Supervisory Board – by a total amount of €500 million through the issue of new shares against cash or contributions in kind (authorized capi-tal). A right to subscribe to the new shares shall be granted to shareholders. This can also be done by a credit institution acquiring the new shares with the obligation to offer these to shareholders (indirect subscription right). The Board of Execu-tive Directors is authorized to exclude the statutory subscrip-tion right of shareholders to a maximum amount of a total of 20% of share capital in certain exceptional cases that are defined in Article 5(8) of the BASF SE Statutes. This applies in particular if, for capital increases in return for cash contribu-tions, the issue price of the new shares is not substantially lower than the stock market price of BASF shares and the total number of shares issued under this authorization is not more than 10% of the stock of shares on the date of issue or, in eli-
gible individual cases, to acquire companies or shares in companies in exchange for surrendering BASF shares. By way of a resolution of the Annual Shareholders’ Meeting on May 12, 2017, the share capital was increased conditionally by up to €117,565,184 by issuing up to 91,847,800 new shares. The contingent capital increase serves to grant shares to the holders of convertible bonds or warrants attached to bonds with warrants of BASF SE or a subsidiary, which the Board of Executive Directors is authorized to issue up to May 11, 2022 by way of a resolution of the Annual Shareholders’ Meeting on May 12, 2017. A right to subscribe to the bonds shall be granted to shareholders. The Board of Executive Directors is authorized to exclude the subscription right in certain exceptional cases that are defined in Article 5(9) of the BASF SE Statutes. At the Annual Shareholders’ Meeting on May 12, 2017, the Board of Executive Directors was authorized to purchase up to 10% of the shares existing at the time of the resolution (10% of the company’s share capital) until May 11, 2022. At the discretion of the Board of Executive Directors, the purchase can take place on the stock exchange or by way of a public purchase offer directed to all shareholders. The Board of Executive Directors is authorized to sell the repurchased com-pany shares (a) through a stock exchange, (b) through a public offer directed to all shareholders and – with the approval of the Supervisory Board – to third parties, (c) for a cash payment that is not significantly lower than the stock exchange price at the time of sale and (d) for contributions in kind, particularly in connection with the acquisition of companies, parts of compa-nies or shares in companies or in connection with mergers. In the cases specified under (c) and (d), the shareholders’ sub-scription right is excluded. The Board of Executive Directors is furthermore authorized to redeem the shares bought back and to reduce the share capital by the proportion of the share capital accounted for by the redeemed shares. Bonds issued by BASF SE grant the bearer the right to request early repayment of the bonds at nominal value if one person – or several persons acting in concert – hold or acquire a BASF SE share volume after the time of issuance which corresponds to more than 50% of the voting rights (change of control), and one of the rating agencies named in the bond’s terms and conditions withdraws its rating of BASF SE or the bond, or reduces it to a noninvestment grade rating within 120 days after the change-of-control event. In the event of a change of control, members of the Board of Executive Directors shall, under certain additional condi-tions, receive compensation (details of which are listed in the Compensation Report on page 148). A change of control is assumed when a shareholder informs BASF of a shareholding of at least 25% or the increase of such a holding. In addition, employees of BASF SE and its subsidiaries who are classed as senior executives will receive a severance payment if their contract of employment is terminated by BASF within 18 months of the occurrence of a change of control, provided the employee has not given cause for the termination. The employee whose service contract has been terminated in such

134 Corporate Governance BASF Report 2017
Corporate governance report
a case will receive a maximum severance payment of 1.5 times the annual salary (fixed component) depending on the number of months that have passed since the change- of-control event. The remaining specifications stipulated in section 315a(1) HGB refer to situations that are not applicable to BASF SE.
For more information on bonds issued by BASF SE, see basf.com/en/investor/bonds
Directors’ and Officers’ liability insurance
BASF SE has taken out liability insurance that covers the activities of members of the Board of Executive Directors and the Supervisory Board (directors’ and officers’ liability insur-ance). This policy provides for the level of deductibles for the Board of Executive Directors as prescribed by section 93(2) sentence 3 AktG and for the level of deductibles for the Super-visory Board as recommended in section 3.8(3) of the German Corporate Governance Code (GCGC) (10% of damages up to one-and-a-half times the fixed annual compensation).
Share ownership by Members of the Board of Executive Directors and the Supervisory Board
No member of the Board of Executive Directors or the Super-visory Board owns shares in BASF SE and related options or other derivatives that account for 1% or more of the share capital. Furthermore, the total volume of BASF SE shares and related financial instruments held by members of the Board of Executive Directors and the Supervisory Board accounts for less than 1% of the shares issued by the company.
Share dealings of the Board of Executive Directors and Supervisory Board (obligatory reportable and publishable directors’ dealings under Article 19(1) of the E.U. Market Abuse Regulation 596/2014 (MAR))
As legally stipulated by Article 19(1) MAR, all members of the Board of Executive Directors and the Supervisory Board as well as certain members of their families are required to disclose the purchase or sale of financial instruments of BASF SE (e.g., shares, bonds, options, forward contracts, swaps) to the Federal Financial Supervisory Authority (Bundesanstalt für Finanzdienstleistungsaufsicht) and to the company if transac-tions within the calendar year exceed the threshold of €5,000. In 2017, a total of five purchases by members of the Board of Executive Directors and the Supervisory Board and mem-bers of their families subject to disclosure were reported as Directors’ Dealings, involving between 510 and 10,000 BASF shares. The price per share was between €79.12 and €80.36. The volume of the individual trades was between €40,494 and €800,161.70. The disclosed share transactions are published on the website of BASF SE.
For more information on securities transactions reported in 2017, see basf.com/en/governance/sharedealings
Information on the auditor
The Annual Shareholders’ Meeting of May 12, 2017, once again elected KPMG AG Wirtschaftsprüfungsgesellschaft as the auditor of the BASF Group Consolidated Financial State-ments and Separate Financial Statements of BASF SE for the 2017 business year, as well as for those reports’ correspond-ing Management’s Reports. KPMG member firms also audit the majority of companies included in the Consolidated Finan-cial Statements. KPMG has been the continuous auditor of BASF SE since the 2006 Financial Statements. For this reason, a public call to tender was made in 2015 to all auditors for the audit of the 2016 Consolidated and Separate Financial State-ments, in line with the E.U. Regulation 537/2014 of April 16, 2014. Based on the results of the tendering process, the Audit Committee recommended to the Supervisory Board that it once again propose KPMG for election. After completing the tendering process, KPMG can now be proposed for election at the Annual Shareholders’ Meeting as BASF’s auditor with-out further tendering processes up to and including the 2025 business year. Alexander Bock has been the auditor responsi-ble for the Consolidated Financial Statements since auditing the 2017 Financial Statements. Since the 2017 Financial Statements, the auditor responsible for the Separate Financial Statements has been Dr. Stephanie Dietz. The total fee paid to KPMG and auditing firms of the KPMG group by BASF SE and other BASF Group companies for non-audit services, in addition to the auditing fee, was €0.7 million in 2017. This represents around 3.8% of the fees for auditing the financial statements.
For more information, see Note 33 of the Consolidated Financial Statements on page 234

BASF Report 2017 Corporate Governance
Compliance 135
Our Group-wide Compliance Program aims to ensure adherence to legal regulations and the company’s internal guidelines. This topic has been integrated into our “We create chemistry” strategy. Our employee Code of Conduct firmly embeds these mandatory standards into day-to-day business. Members of the Board of Executive Directors are also expressly obligated to follow these principles.
Compliance Program and Code of Conduct
▪ Integrated into corporate values ▪ Regular compliance training for employees
Based on international standards, BASF’s Compliance Program combines important laws and company-internal policies – often exceeding legal requirements – with external voluntary commitments to create a framework that regulates how all BASF employees interact with business partners, officials, colleagues and society. At the core of our Compliance Program is the global, standardized Code of Conduct received by every employee. All employees and managers are obligated to adhere to its guidelines, which describe our principles for proper conduct and cover topics ranging from corruption and antitrust laws to human rights, labor and social standards, conflicts of interest and trade control, and protection of data privacy.
Abiding by compliance standards is the foundation of responsible leadership. This has been expressly embedded in our values, where we state: “We strictly adhere to our compliance standards.” We are convinced that compliance with these standards will not only prevent the disadvantages associated with violations, such as penalties and fines; we also view compliance as the right path toward securing our company’s long-term success. Our efforts are principally aimed at preventing violations from the outset. We perform systematic risk assessments to identify the risk of compliance violations, including corruption risks. These are conducted at division, regional and country level. The regular compliance audits performed by the Corporate Audit department are another source for the systematic identification of risks. These risks are documented in each risk or audit report. The same applies to specific risk minimization measures as well as the time frame for their implementation. One key element in the prevention of compliance violations is compulsory training and workshops held as classroom or online courses. All employees are required within a prescribed time frame to take part in basic compliance training, refresher courses and special tutorials dealing with, for example, antitrust legislation, taxes or trade control regulations. Course materials and formats are constantly updated, taking into account the specific risks of individual target groups and business areas. In total, more than 33,500 participants worldwide received around 54,000 hours of compliance training in 2017.
For more information on the BASF Code of Conduct, see basf.com/code_of_conduct
Compliance
Code of ConductForms core of our
Compliance Program
More than 33,500 Participants in
compliance training
75 auditsConducted internally
on compliance
BASF’s Code of Conduct
Money Laundering
Human Rights, Labor and Social Standards
Protection of Environment, Health and Safety
Antitrust Legislation
Corruption
Gifts and Entertainment
Protection of Company Property and Property of Business Partners
Conflicts of Interest Information Protection and Insider Trading Laws
Protection of Data Privacy
Imports and ExportsBASF’s Code of Conduct stipulates
how these topics are handled

136 Corporate Governance BASF Report 2017
Compliance
Compliance culture at BASF
We firmly believe that for corporate responsibility to be a success, there must be an active culture of living these guide-lines within the company. Thanks to the early introduction of our Code of Conduct, these standards have already been firmly established and are undisputed. We expect all employ-ees to act in line with these compliance principles. Managers place a key role here – they serve as an example of and com-municate our values and culture both internally and externally.
Monitoring adherence to our Compliance principles
BASF’s Chief Compliance Officer (CCO) reports directly to the Chairman of the Board of Executive Directors and manages the further development of our global compliance organization and our Compliance Management System. He is supported in this task by more than 100 compliance officers worldwide in the regions and countries as well as in the divisions. Material compliance topics are regularly discussed in the compliance committees established at global and regional level. The CCO reports to the Supervisory Board’s Audit Committee in at least one of its meetings each year on the status of the Compliance Program as well as any major developments. In the event of significant incidents, the Audit Committee is immediately informed by the Board of Executive Directors. We particularly encourage our employees to actively and promptly seek guidance if in doubt. For this, they can consult their managers, dedicated specialist departments, such as the Legal department, and company compliance officers. We have also set up more than 50 external hotlines worldwide that our employees can use – including anonymously – to report suspected or actual violations of laws or company guidelines. All hotlines are also open to the public. Each concern is documented according to specific criteria, properly investigated in line with standard internal procedures and answered as quickly as possible. The outcome of the investigation as well as any measures taken are documented accordingly and included in internal reports. In 2017, 290 calls and emails were received by our external hotlines (2016: 278). These concerns involved questions ranging from personnel management and handling of company property to information on the behavior of business partners or human rights issues, such as on labor and social standards. We continued to observe increasing awareness when it came to potential conflicts of interest. We launched case-specific investigations, in accordance with applicable law and internal regulations, into all cases of suspected misconduct that we became aware of. These include, for example, improved control mechanisms, additional informational and training measures, clarification and expansion of the relevant internal regulations, as well as disciplinary measures as appropriate.
Most of the justified cases related to personal misconduct in connection with the protection of company property, inappropriate handling of conflicts of interests or gifts and invitations. There was one case of passive corruption. In such isolated cases, we took disciplinary measures up to and including dismissal in accordance with uniform internal standards and also pursued claims for damages where there were sufficient prospects of success. BASF’s Corporate Audit department monitors adherence to compliance principles, covering all areas in which compliance violations could occur. They check that employees uphold regulations and make sure that the established processes, procedures and monitoring tools are appropriate and sufficient to minimize potential risk or preclude violations in the first place. In 2017, 75 Group-wide audits of this kind were performed (2016: 63). One audit gave rise to the suspicion of unlawful billing of labor by external service providers, with the involvement of BASF employees, at the Ludwigshafen site in the past few years. The district attorney’s office is now investi-gating the matter. Overall, the audits confirmed the effective-ness of the compliance management system. No irregularities were shown in the audit’s focus areas of antitrust law, trade controls and embargo. Our business partners in sales are monitored for potential compliance risks based on the Guideline on Business Partner Due Diligence, which has been in effect since 2015, using a checklist, a questionnaire and an internet-based analysis. The results are then documented. Depending on the results, con-clusions must be drawn regarding whether and how to main-tain the business relationship. To date, we have ended one existing business relationship based on the results of the audit. In a number of cases, business relationships were not entered into because the business partners were not prepared to answer the questionnaire put to them. A dedicated global Supplier Code of Conduct applies to our suppliers. We support the United Nations’ Guiding Principles on Business and Human Rights and are constantly working to enhance our internal guidelines and processes in keeping with these principles. For example, there is an internal guideline to respect international labor and social standards that is applicable throughout the Group. Outside of our company, as well, we support respect for human rights and the fight against corruption: We are a founding member of the United Nations Global Compact. As a member of Transparency International Deutschland and the Partnering Against Corruption Initiative (PACI) of the World Economic Forum, we assist in the implementation of these organizations’ objectives.
For more information on the Supplier Code of Conduct and supplier assessments, see page 93 onward
For more information on human rights and labor and social standards, see basf.com/human_rights

BASF Report 2017 Corporate Governance
Management and Supervisory Boards — Board of Executive Directors 137
Management and Supervisory BoardsBoard of Executive Directors
There were eight members on the Board of Executive Directors of BASF SE as of December 31, 2017
Dr. Kurt BockChairman of the Board of Executive Directors Degree: Business Administration, 59 years old, 27 years at BASF
Responsibilities: Legal, Taxes, Insurance & Intellectual Property; Corporate Development; Corporate Communications & Government Relations; Senior Executive Human Resources; Investor Relations; Compliance
First appointed: 2003, Term expires: 2018
Supervisory Board memberships (excluding internal memberships): Fresenius Management SE (member)
Dr. Martin BrudermüllerVice Chairman of the Board of Executive Directors Degree: Chemistry, 56 years old, 30 years at BASF
Responsibilities: Petrochemicals; Monomers; Intermediates; Process Research & Chemical Engineering; Innovation Management; Digitalization in Research & Development; Corporate Technology & Operational Excellence; BASF New Business
First appointed: 2006, Term expires: 2023
Saori Dubourg (since May 12, 2017)Degree: Business Administration, 46 years old, 21 years at BASF
Responsibilities: Construction Chemicals; Crop Protection; Bioscience Research; Region Europe
First appointed: 2017, Term expires: 2020
Dr. Hans-Ulrich EngelDegree: Law, 58 years old, 30 years at BASF
Responsibilities: Finance; Oil & Gas; Procurement; Supply Chain Operations & Information Services; Corporate Controlling; Corporate Audit
First appointed: 2008, Term expires: 2023
Internal memberships within the meaning of section 100(2) of the German Stock Corporation Act: Wintershall Holding GmbH (Chairman of the Supervisory Board) Wintershall AG (Chairman of the Supervisory Board)
Comparable German and non-German supervisory bodies: Nord Stream AG (member of the Shareholders’ Committee)
Sanjeev Gandhi Degrees: Chemical Engineering, Business Administration, 51 years old, 24 years at BASF
Responsibilities: Dispersions & Pigments; Greater China & Functions Asia Pacific; South & East Asia, ASEAN & Australia/New Zealand
First appointed: 2014, Term expires: 2023
Michael HeinzDegree: Business Administration, 53 years old, 34 years at BASF
Responsibilities: Engineering & Maintenance; Environmental Protection, Health & Safety; European Site & Verbund Management; Human Resources
First appointed: 2011, Term expires: 2019
Comparable German and non-German supervisory bodies: BASF Antwerpen N.V. (Chairman of the Administrative Council since April 20, 2017)
Dr. Markus Kamieth (since May 12, 2017)Degree: Chemistry, 47 years old, 19 years at BASF
Responsibilities: Care Chemicals; Nutrition & Health; Performance Chemicals; Advanced Materials & Systems Research; Region South America
First appointed: 2017, Term expires: 2020
Wayne T. Smith Degrees: Chemical Engineering, Business Administration, 57 years old, 14 years at BASF
Responsibilities: Catalysts; Coatings; Performance Materials; Market & Business Development, Site & Verbund Management North America; Regional Functions & Country Platforms North America
First appointed: 2012, Term expires: 2020
The following members left the Board of Executive Directors on May 12, 2017
Dr. Harald SchwagerDegree: Chemistry, 57 years old, 29 years at BASF
First appointed: 2008, Term expired: May 12, 2017
Margret SuckaleDegrees: Law, Business Administration, 61 years old, 8 years at BASF
First appointed: 2011, Term expired: May 12, 2017
Comparable German and non-German supervisory bodies: BASF Antwerpen N.V. (Chairwoman of the Administrative Council until April 20, 2017)

138 Corporate Governance BASF Report 2017
Management and Supervisory Boards — Board of Executive Directors
Changes as of May 4, 2018
The Chairman of the Board of Executive Directors Dr. Kurt Bock will step down from the Board of Executive Directors following the Annual Shareholders’ Meeting on May 4, 2018. The Supervi-sory Board has appointed Dr. Martin Brudermüller, currently Vice Chairman, as Chairman of the Board of Executive Directors and Dr. Hans-Ulrich Engel as Vice Chairman of the Board of Executive Directors from this date. In the course of these changes, the number of Board members will be reduced from eight to seven. The areas of responsibility within the Board of Executive Directors will be as follows:
Dr. Martin BrudermüllerLegal, Taxes, Insurance & Intellectual Property; Corporate Development; Corporate Communications & Government Relations; Senior Executive Human Resources; Investor Relations; Compliance; BASF 4.0; Corporate Technology & Operational Excellence; Digitalization in Research & Development; Innovation Management
Saori DubourgConstruction Chemicals; Crop Protection; Bioscience Research; Region Europe
Dr. Hans-Ulrich EngelFinance; Oil & Gas; Procurement; Supply Chain Operations & Information Services; Corporate Controlling; Corporate Audit
Sanjeev GandhiIntermediates; Monomers; Petrochemicals; Greater China & Functions Asia Pacific; South & East Asia, ASEAN & Australia/New Zealand
Michael HeinzEngineering & Maintenance; Environmental Protection, Health & Safety; European Site & Verbund Management; Human Resources
Dr. Markus KamiethCare Chemicals; Dispersions & Pigments; Nutrition & Health; Performance Chemicals; Advanced Materials & Systems Research; BASF New Business; Region South America
Wayne T. SmithCatalysts; Coatings; Performance Materials; Market & Business Development, Site & Verbund Management North America; Regional Func-tions & Country Platforms North America; Process Research & Chemical Engineering

BASF Report 2017 Corporate Governance
Management and Supervisory Boards — Supervisory Board 139
Supervisory Board
In accordance with the Statutes, the Supervisory Board of BASF SE comprises 12 members
The term of office of the Supervisory Board commenced follow-ing the Annual Shareholders’ Meeting on May 2, 2014, in which the shareholder representatives on the Supervisory Board were elected. It terminates upon conclusion of the Annual Share-holders’ Meeting that resolves on the discharge of members of the Supervisory Board for the fourth complete business year after the term of office commenced; this is the Annual Share-holders’ Meeting in 2019. The Supervisory Board comprises the following members:
Dr. Jürgen Hambrecht, Neustadt an der Weinstraße, Germany*1 Chairman of the Supervisory Board of BASF SE
Former Chairman of the Board of Executive Directors of BASF SE (until May 2011)
Member of the Supervisory Board since: May 2, 2014
Supervisory board memberships:
Fuchs Petrolub SE (chairman) Trumpf GmbH & Co. KG (chairman) Daimler AG (member)
Comparable German and non-German supervisory bodies:
Nyxoah S.A. (nonexecutive director until December 31, 2017)
Michael Diekmann, Munich, Germany*1
Vice Chairman of the Supervisory Board of BASF SE
Chairman of the Supervisory Board of Allianz SE
Member of the Supervisory Board since: May 6, 2003
Supervisory board memberships: Allianz SE (chairman since May 7, 2017)
Fresenius Management SE (member)
Fresenius SE & CO. KGaA (vice chairman)
Linde AG (vice chairman until May 10, 2017) Siemens AG (member)
Sinischa Horvat, Limburgerhof, Germany*2
Chairman of the Works Council of BASF SE, Ludwigshafen Site; Chairman of BASF’s Joint Works Council and of the BASF Works Council Europe
Member of the Supervisory Board since: May 12, 2017
Ralf-Gerd Bastian, Neuhofen, Germany*2
Member of the Works Council of BASF SE, Ludwigshafen Site
Member of the Supervisory Board since: May 6, 2003
Dame Alison Carnwath DBE, Exeter, England*1
Senior Advisor Evercore Partners
Member of the Supervisory Board since: May 2, 2014
Comparable German and non-German supervisory bodies:
Zurich Insurance Group AG (independent, nonexecutive member of the Administrative Council)
Zürich Versicherungs-Gesellschaft AG (independent, nonexecutive member of the Administrative Council)
Land Securities Group plc (nonexecutive Chairman of the Board of Directors)
PACCAR Inc. (independent member of the Board of Directors)
Coller Capital Ltd. (nonexecutive member of the Board of Directors)
Prof. Dr. François Diederich, Dietikon, Switzerland1
Professor at the Swiss Federal Institute of Technology, Zurich, Switzerland
Member of the Supervisory Board since: May 19, 1998
Franz Fehrenbach, Stuttgart, Germany*1
Chairman of the Supervisory Board of Robert Bosch GmbH
Member of the Supervisory Board since: January 14, 2008
Supervisory board memberships: Robert Bosch GmbH (chairman)
Stihl AG (vice chairman) Linde AG (second deputy chairman)
Comparable German and non-German supervisory bodies: Stihl Holding AG & Co. KG (member of the Advisory Board)
Francesco Grioli, Ronnenberg, Germany*2
Member of the Executive Committee of the Mining, Chemical and Energy Industries Union
Member of the Supervisory Board since: May 2, 2014
Supervisory board memberships:
Gerresheimer AG (vice chairman)
Villeroy & Boch AG (member)
Steag New Energies GmbH (vice chairman)
V & B Fliesen GmbH (member)
Waldemar Helber, Otterbach, Germany*2
Deputy Chairman of the Works Council of BASF SE, Ludwigshafen Site
Member of the Supervisory Board since: April 29, 2016
Anke Schäferkordt, Cologne, Germany*1
Member of the Executive Board of Bertelsmann SE & Co. KGaA Co-Chief Executive Officer of RTL Group S.A. (until April 19, 2017) Chief Executive Officer of Mediengruppe RTL Deutschland GmbH
Member of the Supervisory Board since: December 17, 2010
Comparable German and non-German supervisory bodies:
Métropole Télévision S.A. (member of the Supervisory Board)
Denise Schellemans, Brecht, Belgium*2
Full-time trade union delegate
Member of the Supervisory Board since: January 14, 2008
Michael Vassiliadis, Hannover, Germany*2
Chairman of the Mining, Chemical and Energy Industries Union
Member of the Supervisory Board since: August 1, 2004
Supervisory board memberships:
K+S Aktiengesellschaft (vice chairman) Steag GmbH (member) RAG AG (vice chairman)
RAG DSK AG (vice chairman)
The following member left the Supervisory Board on May 12, 2017
Robert Oswald, Altrip, Germany*2
Vice Chairman of the Supervisory Board of BASF SE; Chairman of the Works Council of BASF SE, Ludwigshafen Site; Chairman of BASF’s Joint Work Council
Member of the Supervisory Board since: October 1, 2000
* Classified by the Supervisory Board as an “independent” member of the Supervisory Board (see page 131 for the criteria used to determine independence)
¹ Shareholder representative ² Employee representative

140 Corporate Governance BASF Report 2017
Compensation report
Compensation report
Fixed salaryAnnual amount: €800,0001
Payment: in equal installments
Annual variable compensation
Annual target: €1,600,0001
Cap: €2,500,0001
Payment: after the Annual Shareholders’ Meeting for the prior business year
Long-term, share price-based incentive program (LTI program)
Annual amount granted is dependent on the fair value of the options as of the grant date and the scope of the individual investment
Cap: €3,750,0001,2
Payment: in a period of 4–8 years after the grant date, depending on individual exercise date
Fringe benefits Annual amount corresponds to value of nonmonetary compensation
Company pension benefitsAnnual service cost is the accounting figure for the pension entitlements accrued in the relevant business year
1 Amounts apply to an ordinary member of the Board of Executive Directors. The amount for the chairman of the Board of Executive Directors is 2 times this value, and 1.33 times this value for the vice chairman.
2 To reach the cap, a Board member must make the maximum individual investment based on the maximum annual variable compensation and the set limit on the gain from exercising the options granted must be reached.
This report outlines the main principles of the compensa-tion for the Board of Executive Directors and discloses the amount and structure of the compensation of each Board member. Furthermore, it provides information on end-of-service undertakings with respect to members of the Board of Executive Directors, as well as information on the compensation of Supervisory Board members. This report meets the disclosure requirements of the German Commercial Code, supplemented by the addi-tional requirements based on the German Act on Disclosure of Management Board Remuneration (Vorstandsvergütungs- Offenlegungsgesetz) as well as the German Act on the Appropriateness of Management Board Remuneration (Gesetz zur Angemessenheit der Vorstandsvergütung), and is aligned with the recommen-dations of the German Corporate Governance Code (GCGC) in the version dated February 7, 2017.
Compensation of the Board of Executive Directors
Based on a proposal by the Personnel Committee, the Super-visory Board determines the amount and structure of compen-sation of members of the Board of Executive Directors.
The amount and structure of compensation is determined by the company’s size, complexity and financial position, as well as the performance of the Board of Executive Directors and promotes the company’s sustainable development. Internal and external appropriateness of the Board’s compensation is reviewed by an independent external auditor on a regular ba-sis. Globally operating companies based in Europe serve as an external reference. For internal comparison, compensation is considered in total as well as over time, especially for senior executives. In 2016, the Supervisory Board engaged an independent external compensation consultant with an appropriateness review. The results of the appropriateness review revealed that the compensation granted to BASF’s Board of Executive Directors is below that of the peer group. On this basis, the Supervisory Board resolved to increase the compensation of the Board of Executive Directors for the first time since January 1, 2014, effective January 1, 2017. The amount of the increase was determined to position the compensation granted to BASF’s Board of Executive Directors competitively within the peer group.
For more information on the Supervisory Board and its committees, see page 139 and from page 154 onward
Overview of compensation

BASF Report 2017 Corporate Governance
Compensation report 141
Principles and structure
The compensation of the Board of Executive Directors is designed to promote sustainable corporate development. It is marked by a pronounced variability in relation to the perfor-mance of the Board of Executive Directors and the BASF Group’s success.
Compensation components
1. Fixed salary2. Annual variable compensation3. Long -term, share price- based incentive program
(LTI program)4. Nonmonetary compensation and other additional
compensation (fringe benefits)5. Company pension benefits
Individual compensation components
1. Fixed salary
The fixed salary is a set amount of yearly compensation paid out in equal installments. The fixed salary was increased effec-tive January 1, 2017 for the first time since January 1, 2014. The annual fixed salary for an ordinary member of the Board of Executive Directors is €800,000, compared with €650,000 in the three years prior. The amount for the chairman of the Board of Executive Directors is 2 times this value, and 1.33 times this value for the vice chairman.
2. Annual variable compensation
Annual variable compensation
– Actual annual variable compensation is based on the achievement of set targets and the company’s success
– Agreement of short-term operational targets and medium- and long-term strategic goals
– Evaluation of target achievement in the current and previous two business years and definition of a performance factor of between 0 and 1.5
– Key performance indicator for the success of the BASF Group: return on assets
The amount of the actual annual variable compensation is based on the performance of the Board of Executive Directors as a whole and the BASF Group’s return on assets adjusted for special effects. In order to assess the sustainable performance of the Board of Executive Directors, each year the Supervisory Board sets a target agreement with the entire Board of Executive Directors that primarily contains medium- and long-term goals.
The Supervisory Board assesses target achievement in the current and the previous two years. A performance factor with a value between 0 and 1.5 is determined on the basis of the target achievement ascertained by the Supervisory Board. The return on assets is also used to determine the variable compensation for all other employee groups. The annual variable target compensation for a target return on assets for the Board of Executive Directors of 10% and a target achievement of 100% is double the fixed salary. Annual variable compensation is defined for each relevant return on assets value. It declines at a faster rate if the return on assets is lower than 8% and increases at a slower rate if the return on assets is higher than 12%. The relevant return on assets for 2017 is 10.6% (2016: 7.7%). The actual amount is calculated by multiplying the amount of annual variable compensation for the relevant return on assets by the average of the performance factor for the current and the previous two years. The actual annual variable compensation for the business year under review is payable after the Annual Shareholders’ Meeting. A cap of €2,500,000 was defined for the actual annual variable compensation. The amount for the chairman of the Board of Executive Directors is 2 times this value, and 1.33 times this value for the vice chairman. Board members, like other employee groups, may contrib-ute a portion of their actual annual variable compensation into a deferred compensation program. For members of the Board of Executive Directors, as well as for all other senior executives of the BASF Group in Germany, the maximum amount that can be contributed to this program per year is €30,000. Board members have taken advantage of this offer to varying degrees.

142 Corporate Governance BASF Report 2017
Compensation report
3. Long- term, share price -based incentive program (LTI program)
LTI program
– Absolute performance threshold: BASF share price gains at least 30% compared with the base price for the LTI program concerned
– Relative performance threshold: BASF shares outperform the MSCI World Chemicals Index and no share price loss compared with the base price on the option grant date
– Holding obligation: mandatory individual investment in BASF shares with a holding obligation of 10% of the actual annual variable compensation, plus up to an additional 20% of the actual annual variable compensation on a voluntary basis
– Term: eight years
– Exercise first possible: four years after the grant date (vesting period)
– Maximum exercise gain (cap): five times the individual investment
An LTI program exists for members of the Board of Executive Directors. It is also offered to all other senior executives of BASF Group. Members of the Board of Executive Directors are subject to a stricter set of rules than are contained in the general program conditions: for instance, they are required to participate in the program with at least 10% of their actual annual variable compensation. This mandatory investment consisting of BASF shares is subject to a holding period of four years (share ownership obligation). For any additional voluntary investment of up to 20% of the actual annual variable compen-sation, the general holding period of two years applies. Mem-bers of the Board of Executive Directors may exercise their options four years after they have been granted at the earliest (vesting period). Each member of the Board of Executive Directors may decide individually on the timing and scope of the exercise of options within the four-year exercise period following the vesting period. From the 2013 LTI program onward, the maximum exercise gain is capped at five times the original individual investment. For programs from previous years, the maximum exercise gain is capped at 10 times the original individual investment. Due to the multiple-year exercise period, it can occur that exercise gains from several LTI program years accumulate inside of one year; there can also be years without any exercise gains.
For more information on share ownership by members of the Board of Executive Directors, see page 134
For more information on the LTI program, see page 46 and from page 231 onward
4. Nonmonetary compensation and other additional compensation (fringe benefits)
Fringe benefits include delegation allowances, accident insur-ance premiums, transportation and benefits from the provision of security measures by the company. The members of the Board of Executive Directors did not receive loans or advances from the company in 2017. The members of the Board of Executive Directors are covered by a directors’ and officers’ liability insurance (D&O insurance) concluded by the company. This policy provides for the level of deductibles for the Board of Executive Directors as prescribed by section 93(2) sentence 3 of the German Stock Corporation Act.
5. Company pension benefits
Board Performance Pension
– Accrual of annual pension units, the amount of which depend on the company’s success and the performance of the Board of Executive Directors as a whole
– Pension entitlement: retirement, disability and surviving dependents’ pensions
– Pension benefits due: on reaching the retirement age of 60 (63 for members first appointed to the Board of Executive Directors since 2017) or on account of disability or death
As part of the pension benefits granted to the Board of Execu-tive Directors (Board Performance Pension), company pension benefits are intended to accrue annual pension units, the amount of which depend on the company’s success and the performance of the Board of Executive Directors as a whole in the business year concerned. The method used to determine the amount of the pension benefits generally corresponds to that used for all other senior executives of the BASF Group in Germany.
Fixed pension component
x =Annuity
conversion factor
Annual pension unit
+
Variable pension component

BASF Report 2017 Corporate Governance
Compensation report 143
The annual pension benefits accruing to Board members in a given reporting year (pension unit) are composed of a fixed and a variable component. The fixed component is calculat-ed by multiplying the annual fixed salary above the Social Security Contribution Ceiling by 32% (fixed pension compo-nent). The variable component of the pension unit is the result of multiplying the fixed component with a factor based on the relevant return on assets in the reporting year concerned, as well as the performance factor used to determine the actual annual variable compensation (variable pension component). The amount resulting from the fixed and the variable pension component is converted into a pension unit (lifelong pension) using actuarial factors (annuity conversion factor) based on an actuarial interest rate (5%), the probability of death, invalidity and bereavement according to Heubeck Richttafeln, 2005G (modified) and an assumed pension increase (at least 1% each year). The sum of the pension units accumulated over the reporting years determines the respective Board member’s pension benefit in the event of a claim. This is the amount that is payable on retirement, disability or death. Pension benefits fall due at the end of service on reaching the age of 60 (for members first appointed to the Board of Executive Directors after January 1, 2017: on reaching the age of 63), or on account of disability or death. Pension payments are reviewed on a regular basis and adjusted by at least 1% each year. The pension units also include survivor benefits. Upon the death of an active or former member of the Board of Executive Directors, the surviving spouse receives a survivor pension amounting to 60% of the Board member’s pension entitlement. The orphan pension amounts to 10% for each half-orphan, 33% for an orphan, 25% each for two orphans and 20% each for three or more orphans of the pension entitlement of the deceased (former) Board member. Total survivor benefits may not exceed 75% of the Board member’s pension entitlement. If the survivor pensions exceed the upper limit, they will be proportionately reduced. Board members are members of the BASF Pensions-kasse VVaG, as are generally all employees of BASF SE. Contributions and benefits are determined by the Statutes of the BASF Pensionskasse VVaG and the General Conditions of Insurance.
Amount of total compensation
The tables on pages 144 to 147 show the granted and allo-cated compensation as well as service cost of each member of the Board of Executive Directors in accordance with sec-tion 4.2.5(3) of the German Corporate Governance Code (GCGC) in the version dated February 7, 2017.
Compensation granted in accordance with the German Corporate Governance Code (GCGC)
The table “Compensation granted in accordance with the German Corporate Governance Code (GCGC)” shows: fixed salary, fringe benefits, annual variable target compensation, LTI program measured at fair value as of the grant date and service cost. The individual compensation components are supplemented by individually attainable minimum and maximum compensation. Furthermore, a reconciliation statement for total compen-sa tion to be reported is provided below the table “Compen-sation granted in accordance with the German Corporate Governance Code (GCGC)” due to the disclosures required by section 314(1) no. 6a of the German Commercial Code (HGB) in connection with the German Accounting Standard 17 (GAS 17).

144 Corporate Governance BASF Report 2017
Compensation report
Compensation granted in accordance with the German Corporate Governance Code (GCGC) (thousand €)
Dr. Kurt Bock Dr. Martin Brudermüller
Chairman of the Board of Executive Directors Vice Chairman of the Board of Executive Directors
2016 2017 2017 (min)
2017 (max)
2016 2017 2017 (min)
2017 (max)
Fixed salary 1,300 1,600 1,600 1,600 865 1,064 1,064 1,064
Fringe benefits 68 84 84 84 239 1 46 46 46
Total 1,368 1,684 1,684 1,684 1,104 1,110 1,110 1,110
Annual variable target compensation 2,600 3,200 0 5,000 1,729 2,128 0 3,325
Multiple-year variable compensation 844 726 0 3,092 561 483 0 2,056
LTI program 2016 (2016–2024) 844 – – – 561 – – –
LTI program 2017 (2017–2025) – 726 0 3,092 – 483 0 2,056
Total 4,812 5,610 1,684 9,776 3,394 3,721 1,110 6,491
Service cost 537 1,142 1,142 1,142 471 1,001 1,001 1,001
Total compensation in accordance with GCGC 5,349 6,752 2,826 10,918 3,865 4,722 2,111 7,492
Reconciliation reporting of total compensation pursuant to section 314(1) no. 6a HGB in connection with GAS 17
less granted annual variable target compensation (2,600) (3,200) (1,729) (2,128)
plus allocated actual annual variable compensation 2,061 3,629 1,371 2,414
less service cost (537) (1,142) (471) (1,001)
Total compensation 4,273 6,039 3,036 4,007
Michael Heinz Dr. Markus Kamieth
(since May 12, 2017)
2016 2017 2017 (min)
2017 (max)
2016 2017 2017 (min)
2017 (max)
Fixed salary 650 800 800 800 – 507 507 507
Fringe benefits 84 33 33 33 – 27 27 27
Total 734 833 833 833 – 534 534 534
Annual variable target compensation 1,300 1,600 0 2,500 – 1,019 0 1,593
Multiple-year variable compensation 422 363 0 1,546 – 182 0 775
LTI program 2016 (2016–2024) 422 – – – – – – –
LTI program 2017 (2017–2025) – 363 0 1,546 – 182 0 775
Total 2,456 2,796 833 4,879 – 1,735 534 2,902
Service cost 373 816 816 816 – 791 791 791
Total compensation in accordance with GCGC 2,829 3,612 1,649 5,695 – 2,526 1,325 3,693
Reconciliation reporting of total compensation pursuant to section 314(1) no. 6a HGB in connection with GAS 17
less granted annual variable target compensation (1,300) (1,600) – (1,019)
plus allocated actual annual variable compensation 1,031 1,815 – 1,156
less service cost (373) (816) – (791)
Total compensation 2,187 3,011 – 1,872
1 Includes payments to cover additional costs of transfers, such as assumption of prevailing local rental fees.
Saori Dubourg Dr. Hans-Ulrich Engel Sanjeev Gandhi
(since May 12, 2017)
2016 2017 2017 (min)
2017 (max)
2016 2017 2017 (min)
2017 (max)
2016 2017 2017 (min)
2017 (max)
– 507 507 507 650 800 800 800 455 1 538 1 538 1 538 1
– 37 37 37 92 59 59 59 978 2 2,079 2,3 2,079 2, 3 2,079 2, 3
– 544 544 544 742 859 859 859 1,433 2,617 2,617 2,617
– 1,019 0 1,593 1,300 1,600 0 2,500 1,300 1,600 0 2,500
– 53 0 224 422 363 0 1,546 422 121 0 515
– – – – 422 – – – 422 – – –
– 53 0 224 – 363 0 1,546 – 121 0 515
– 1,616 544 2,361 2,464 2,822 859 4,905 3,155 4,338 2,617 5,632
– 796 796 796 363 697 697 697 445 957 957 957
– 2,412 1,340 3,157 2,827 3,519 1,556 5,602 3,600 5,295 3,574 6,589
– (1,019) (1,300) (1,600) (1,300) (1,600)
– 1,156 1,031 1,815 1,031 1,815
– (796) (363) (697) (445) (957)
– 1,753 2,195 3,037 2,886 4,553
Dr. Harald Schwager Wayne T. Smith Margret Suckale
(until May 12, 2017) (until May 12, 2017)
2016 2017 2017 (min)
2017 (max)
2016 2017 2017 (min)
2017 (max)
2016 2017 2017 (min)
2017 (max)
650 296 296 296 828 1 955 1 955 1 955 1 650 296 296 296
83 25 25 25 106 2 71 2 71 2 71 2 58 17 17 17
733 321 321 321 934 1,026 1,026 1,026 708 313 313 313
1,300 585 0 914 1,300 1,600 0 2,500 1,300 585 0 914
422 314 0 1,338 517 431 0 1,546 422 314 0 1,338
422 – – – 517 – – – 422 – – –
– 314 0 1,338 – 431 0 1,546 – 314 0 1,338
2,455 1,220 321 2,573 2,751 3,057 1,026 5,072 2,430 1,212 313 2,565
359 277 277 277 445 844 844 844 309 135 135 135
2,814 1,497 598 2,850 3,196 3,901 1,870 5,916 2,739 1,347 448 2,700
(1,300) (585) (1,300) (1,600) (1,300) (585)
1,031 663 1,031 1,815 1,031 663
(359) (277) (445) (844) (309) (135)
2,186 1,298 2,482 3,272 2,161 1,290
1 Payment was made partly in local currency abroad based on a theoretical net salary in Germany.2 Includes payments to cover additional costs of transfers, such as assumption of prevailing local rental fees.3 Fringe benefits include the payment of additional taxes for 2017 and tax back payments for previous years arising in connection with transfers.

BASF Report 2017 Corporate Governance
Compensation report 145
Saori Dubourg Dr. Hans-Ulrich Engel Sanjeev Gandhi
(since May 12, 2017)
2016 2017 2017 (min)
2017 (max)
2016 2017 2017 (min)
2017 (max)
2016 2017 2017 (min)
2017 (max)
– 507 507 507 650 800 800 800 455 1 538 1 538 1 538 1
– 37 37 37 92 59 59 59 978 2 2,079 2,3 2,079 2, 3 2,079 2, 3
– 544 544 544 742 859 859 859 1,433 2,617 2,617 2,617
– 1,019 0 1,593 1,300 1,600 0 2,500 1,300 1,600 0 2,500
– 53 0 224 422 363 0 1,546 422 121 0 515
– – – – 422 – – – 422 – – –
– 53 0 224 – 363 0 1,546 – 121 0 515
– 1,616 544 2,361 2,464 2,822 859 4,905 3,155 4,338 2,617 5,632
– 796 796 796 363 697 697 697 445 957 957 957
– 2,412 1,340 3,157 2,827 3,519 1,556 5,602 3,600 5,295 3,574 6,589
– (1,019) (1,300) (1,600) (1,300) (1,600)
– 1,156 1,031 1,815 1,031 1,815
– (796) (363) (697) (445) (957)
– 1,753 2,195 3,037 2,886 4,553
Dr. Harald Schwager Wayne T. Smith Margret Suckale
(until May 12, 2017) (until May 12, 2017)
2016 2017 2017 (min)
2017 (max)
2016 2017 2017 (min)
2017 (max)
2016 2017 2017 (min)
2017 (max)
650 296 296 296 828 1 955 1 955 1 955 1 650 296 296 296
83 25 25 25 106 2 71 2 71 2 71 2 58 17 17 17
733 321 321 321 934 1,026 1,026 1,026 708 313 313 313
1,300 585 0 914 1,300 1,600 0 2,500 1,300 585 0 914
422 314 0 1,338 517 431 0 1,546 422 314 0 1,338
422 – – – 517 – – – 422 – – –
– 314 0 1,338 – 431 0 1,546 – 314 0 1,338
2,455 1,220 321 2,573 2,751 3,057 1,026 5,072 2,430 1,212 313 2,565
359 277 277 277 445 844 844 844 309 135 135 135
2,814 1,497 598 2,850 3,196 3,901 1,870 5,916 2,739 1,347 448 2,700
(1,300) (585) (1,300) (1,600) (1,300) (585)
1,031 663 1,031 1,815 1,031 663
(359) (277) (445) (844) (309) (135)
2,186 1,298 2,482 3,272 2,161 1,290
1 Payment was made partly in local currency abroad based on a theoretical net salary in Germany.2 Includes payments to cover additional costs of transfers, such as assumption of prevailing local rental fees.3 Fringe benefits include the payment of additional taxes for 2017 and tax back payments for previous years arising in connection with transfers.

146 Corporate Governance BASF Report 2017
Compensation report
Compensation allocated in accordance with the German Corporate Governance Code (GCGC) (thousand €)
Dr. Kurt Bock Dr. Martin Brudermüller Saori Dubourg Dr. Hans-Ulrich Engel
Chairman of the Board of Executive Directors
Vice Chairman of the Board of Executive
Directors
(since May 12, 2017)
2017 2016 2017 2016 2017 2016 2017 2016
Fixed salary 1,600 1,300 1,064 865 507 – 800 650
Fringe benefits 84 68 46 239 2 37 – 59 92
Total 1,684 1,368 1,110 1,104 544 – 859 742
Actual annual variable compensation1 3,629 2,061 2,414 1,371 1,156 – 1,815 1,031
Multiple-year variable compensation 4,504 3 4,386 4 – 1,657 – – 4,037 3 –
LTI program 2008 (2008–2016) – 4,386 4 – – – – – –
LTI program 2009 (2009–2017) 4,504 3 – – – – – 4,037 3 –
LTI program 2010 (2010–2018) – – – 1,657 – – – –
LTI program 2011 (2011–2019) – – – – – – – –
LTI program 2012 (2012–2020) – – – – – – – –
LTI program 2013 (2013–2021) – – – – – – – –
Total 9,817 7,815 3,524 4,132 1,700 – 6,711 1,773
Service cost 1,142 537 1,001 471 796 – 697 363
Total compensation in accordance with GCGC 10,959 8,352 4,525 4,603 2,496 – 7,408 2,136
1 The basis for the allocated actual annual variable compensation is the return on assets adjusted for special effects and the performance factor. This includes contributions made to the deferred compensation program.
2 Includes payments to cover additional costs of transfers, such as assumption of prevailing local rental fees.3 At the end of the regular term of the LTI program 2009, exercise gains that were realized in 2013 were allocated to Dr. Kurt Bock and Dr. Hans-Ulrich Engel in 2017 in accordance with
the special conditions of the U.S. LTI program.4 At the end of the regular term of the LTI program 2008, exercise gains that were realized in 2012 or 2010 were allocated to Dr. Kurt Bock and Wayne T. Smith in 2016 in accordance with
the special conditions of the U.S. LTI program.
The table below shows the options granted to the Board of Executive Directors on July 1 of both reporting years.
Number of options granted
2017 2016
Dr. Kurt Bock 28,156 35,108
Dr. Martin Brudermüller 18,724 23,344
Saori Dubourg (since May 12, 2017)1 2,040 –
Dr. Hans-Ulrich Engel 14,076 17,552
Sanjeev Gandhi 4,692 17,552
Michael Heinz 14,076 17,552
Dr. Markus Kamieth (since May 12, 2017)1 7,060 –
Dr. Harald Schwager (until May 12, 2017) 12,188 17,552
Wayne T. Smith 14,076 17,552
Margret Suckale (until May 12, 2017) 12,188 17,552
Total 127,276 163,764
1 Saori Dubourg and Dr. Markus Kamieth were not yet members of the Board of Executive Directors as of the reporting date for the LTI program 2016 (July 1, 2016).
Compensation allocated in accordance with the German Corporate Governance Code (GCGC)
The “Compensation allocated in accordance with the German Corporate Governance Code (GCGC)” shown for 2016 and 2017 comprises the fixed and variable compensation compo-nents actually allocated, plus the service cost calculated for each member of the Board of Executive Directors in the reporting years even though this does not actually represent payment in the narrower sense.

BASF Report 2017 Corporate Governance
Compensation report 147
Compensation allocated in accordance with the German Corporate Governance Code (GCGC) (thousand €)
Sanjeev Gandhi Michael Heinz Dr. Markus Kamieth Dr. Harald Schwager
(since May 12, 2017) (until May 12, 2017)
2017 2016 2017 2016 2017 2016 2017 2016
Fixed salary 538 2 455 2 800 650 507 – 296 650
Fringe benefits 2,079 3, 4 978 3 33 84 27 – 25 83
Total 2,617 1,433 833 734 534 – 321 733
Actual annual variable compensation1 1,815 1,031 1,815 1,031 1,156 – 663 1,031
Multiple-year variable compensation – – – – – – – 1,569
LTI program 2008 (2008–2016) – – – – – – – –
LTI program 2009 (2009–2017) – – – – – – – –
LTI program 2010 (2010–2018) – – – – – – – 1,569
LTI program 2011 (2011–2019) – – – – – – – –
LTI program 2012 (2012–2020) – – – – – – – –
LTI program 2013 (2013–2021) – – – – – – – –
Total 4,432 2,464 2,648 1,765 1,690 – 984 3,333
Service cost 957 445 816 373 791 – 277 359
Total compensation in accordance with GCGC 5,389 2,909 3,464 2,138 2,481 – 1,261 3,692
Wayne T. Smith Margret Suckale
(until May 12, 2017)
2017 2016 2017 2016
Fixed salary 955 2 828 2 296 650
Fringe benefits 71 3 106 3 17 58
Total 1,026 934 313 708
Actual annual variable compensation1 1,815 1,031 663 1,031
Multiple-year variable compensation – 798 5 – 527
LTI program 2008 (2008–2016) – 798 5 – –
LTI program 2009 (2009–2017) – – – –
LTI program 2010 (2010–2018) – – – 527
LTI program 2011 (2011–2019) – – – –
LTI program 2012 (2012–2020) – – – –
LTI program 2013 (2013–2021) – – – –
Total 2,841 2,763 976 2,266
Service cost 844 445 135 309
Total compensation in accordance with GCGC 3,685 3,208 1,111 2,575
1 The basis for the allocated actual annual variable compensation is the return on assets adjusted for special effects and the performance factor. This includes contributions made to the deferred compensation program.
2 Payment was made partly in local currency abroad based on a theoretical net salary in Germany.3 Includes payments to cover additional costs of transfers, such as assumption of prevailing local rental fees.4 Fringe benefits include the assumption of additional taxes for 2017 and tax back payments for previous years arising in connection with transfers.5 At the end of the regular term of the LTI program 2008, exercise gains that were realized in 2012 or 2010 were allocated to Dr. Kurt Bock and Wayne T. Smith in 2016 in accordance with
the special conditions of the U.S. LTI program.

148 Corporate Governance BASF Report 2017
Compensation report
Accounting valuation of multiple-year variable compensation (LTI programs)
In 2017, some of the option rights granted resulted in an expense and some resulted in income. This expense or income refers to the total of all option rights from the LTI programs 2009 to 2017 and is calculated as the difference in the fair value of the option rights on December 31, 2017, compared with the fair value on December 31, 2016, consid-ering the option rights exercised and granted in 2017. The fair value of the option rights is based primarily on the develop-ment of the BASF share price and its relative performance compared with the benchmark index, the MSCI World Chem-icals Index. The expenses and income reported below are purely accounting figures that do not equate with the actual gains should options be exercised. Each member of the Board of Executive Directors may decide individually on the timing and scope of the exercise of options of the LTI programs, while taking into account the terms and conditions of the program. The outstanding option rights held by the members of the Board of Executive Directors resulted in the following income and expenses in 2017: Dr. Kurt Bock: expense of €542 thou-sand (2016: expense of €5,000 thousand); Dr. Martin Brudermüller: income of €604 thousand (2016: expense of €4,052 thou sand); Saori Dubourg: expense of €8 thousand; Dr. Hans-Ulrich Engel: income of €1,300 thousand (2016: expense of €4,011 thousand); Sanjeev Gandhi: expense of €178 thousand (2016: expense of €156 thousand); Michael Heinz: income of €226 thousand (2016: expense of €2,423 thou sand); Dr. Markus Kamieth: expense of €26 thou-sand; Wayne T. Smith: income of €35 thousand (2016: expense of €1,872 thousand). The income resulting from the accounting valuation of the options granted to Dr. Harald Schwager and Margret Suckale, former members of the Board of Executive Directors who stepped down in 2017, are included in the total compensation for former members of the Board of Executive Directors and their surviving dependents.
For more information on the LTI program, see page 46 and from page 231 onward
Pension benefits
The values for service cost incurred in 2017 contain service cost for BASF Pensionskasse VVaG and Board Perform ance Pension. Service cost for the members of the Board of Executive Directors is shown individually in the tables “Compensation granted in accordance with the German Cor-porate Governance Code (GCGC)” and “Compensation allo-cated in accordance with the German Corporate Governance Code (GCGC).” The present value of pension benefits (defined benefit obligation) is an accounting figure for the entitlements that the Board members have accumulated in their years of service at BASF. The defined benefit obligations up to and including 2017 amounted to €20,313 thousand for Dr. Kurt Bock (2016: €18,931 thousand), €17,248 thousand for Dr. Martin Bruder-müller (2016: €15,929 thousand), €3,665 thousand for Saori Dubourg, €11,811 thousand for Dr. Hans-Ulrich Engel (2016: €10,968 thousand), €3,598 thousand for Sanjeev Gandhi (2016: €2,409 thousand), €11,411 thousand for Michael Heinz (2016: €10,229 thousand), €2,739 thousand for Dr. Markus Kamieth, €11,462 thousand for Dr. Harald Schwager (2016: €11,096 thousand), €4,165 thousand for Wayne T. Smith (2016: €3,210 thousand) and €4,479 thousand for Margret Suckale (2016: €4,315 thousand).
End-of-service benefits
In the event that a member of the Board of Executive Directors appointed before 2017 retires from employment before the age of 60, either because their appointment was not extended or was revoked for an important reason, they are entitled to pension benefits if they have served on the Board for at least 10 years or if the time needed to reach legal retirement age is less than 10 years. The company is entitled to offset compen-sation received for any other work done against pension benefits until the legal retirement age is reached. The following applies to end of service due to a change-of-control event: A change-of-control event, in terms of this provision, occurs when a shareholder informs BASF of a shareholding of at least 25%, or the increase of such a holding. If a Board member’s appointment is revoked within one year following a change-of-control event, the Board member will receive the contractually agreed payments for the remaining contractual term of office as a one-off payment (fixed salary and annual variable target compensation). The Board member may also receive the fair value of the option rights acquired in connection with the LTI program within a period of three months or may continue to hold the existing rights under the terms of the program. For the determination of the accrued pension benefits from the Board Performance Pension, the time up to the regular expiry of office is taken into consideration.

BASF Report 2017 Corporate Governance
Compensation report 149
There is a general limit on severance pay (severance payment cap) for all Board members. Accordingly, payments made to a Board member upon premature termination of their contract, without serious cause, may not exceed the value of two years’ compensation, including fringe benefits, nor compensate more than the remaining term of the contract. The severance payment cap is to be calculated on the basis of the total compensation for the past business year and, if appropriate, also the expected total compensation for the current business year. If the appointment to the Board of Executive Directors is prematurely terminated as the result of a change-of-control event, the payments may not exceed 150% of the severance compensation cap.
Further development of the compensation system for the Board of Executive Directors
Changes to variable compensation and pension benefits
In its meeting in December 2017, the Supervisory Board resolved to further develop the compensation system for the Board of Executive Directors and, from 2018 onward, replace the annual variable compensation granted to date with a perfor mance bonus with a multiple-year, forward-looking assessment basis in accordance with the amended recom-mendations on variable compensation in the German Corpo-rate Governance Code (GCGC) in the version dated February 7, 2017. In addition, a clawback clause will be introduced for the variable compensation components. From the 2018 business year onward, the return on assets will be replaced by the return on capital employed (ROCE) as the key performance indicator on which the variable compen-sation of all employee groups is based. In the future, under the Board Performance Pension, members of the Board of Executive Directors will be able to choose between payment of their pension entitlements in the form of a lifelong pension or a lump sum. For members first appointed to the Board of Executive Directors after January 1, 2018, the pensionable age will be increased from 60 to 63 years, as for the members first appointed to the Board of Executive Directors in 2017. The revised compensation system for the Board of Execu-tive Directors will be submitted to the Annual Shareholders’ Meeting on May 4, 2018 for approval. A detailed description will be published when the Annual Shareholders’ Meeting is convened.
Former members of the Board of Executive Directors
Total compensation for previous Board members and their surviving dependents amounted to €5.7 million in 2017 (2016: €15.9 million). This figure also contains payments that previous Board members have themselves financed through the deferred compensation program and the expense or income for 2017 relating to option rights that previous members of the Board still hold from the time of their active service period. The decline in total compensation was due to the fair value measurement of these option rights, which generated total income of €4.4 million in 2017 (2016: expense of €6.4 million). Option rights that have not yet been exercised on retire-ment are to be continued under the conditions of the program including the associated holding period to emphasize that the compensation for the Board of Executive Directors is geared to sustainability. Pension provisions for previous Board members and their surviving dependents amounted to €144.3 million (2016: €150.4 million).

150 Corporate Governance BASF Report 2017
Compensation report
Compensation of Supervisory Board members
Compensation of Supervisory Board members
– Fixed salary: €200,0001
– Share purchase and share holding component: 25% of the fixed compensation must be used to purchase shares in BASF; these shares must be held for the duration of membership on the Supervisory Board
– Compensation for committee memberships: €12,5002; Audit Committee: €50,0002; Nomination Committee: no additional compensation
1 The amount for the chairman of the Supervisory Board is 2.5 times this value, and 1.5 times this value for the vice chairman compared with the compensation of an ordinary member.
2 The amount for the chairman of a committee is 2 times this value, and 1.5 times this value for the vice chairman.
The disclosure of compensation of the Supervisory Board is based on the German Commercial Code and is aligned with the recommendations of the German Corporate Governance Code (GCGC). The compensation of the Supervisory Board is regulated by the Statutes of BASF SE passed by the Annual Shareholders’ Meeting. A clause on the compensation of the Supervisory Board was added to Article 14 of the company’s Statutes by way of a resolution of the Annual Shareholders’ Meeting on May 4, 2006. This provided for an annual fixed salary of €60,000 for each ordinary member of the Supervisory Board and perfor-mance-based variable compensation based on earnings per share (EPS) in the business year concerned in the period up to and including 2016. The performance-based variable com-pensation was capped at €120,000. By way of a resolution of the Annual Shareholders’ Meeting on May 12, 2017, the compensation system for the Super-visory Board in accordance with Article 14 of the Statutes was changed to a fixed salary only plus share purchase and share holding components from the 2017 business year onward. An attendance fee is no longer granted.
Each member of the Supervisory Board receives an annual fixed compensation of €200,000. The amount for the chairman of the Supervisory Board is 2.5 times this value, and 1.5 times this value for the vice chairman compared with the compensa-tion of an ordinary member. Members of the Supervisory Board who are members of a committee, except for the Nomination Committee, receive an additional fixed compensation of €12,500. The additional fixed compensation for members of the Audit Committee is €50,000. The amount of additional fixed compensation for the chairman of a committee is 2 times this value, and 1.5 times this value for the vice chairman. Each member of the Supervisory Board is required to use 25% of their fixed compensation to acquire shares in BASF SE, and to hold these shares for the duration of membership on the Supervisory Board. This does not apply to the amount of compensation that the member of the Supervisory Board transfers to a third party on a pro rata basis as a result of an obligation entered into before their appointment to the Super-visory Board. In this case, the utilization and holding obligation applies to 25% of the remaining compensation after deducting the amount transfered. The company reimburses members of the Supervisory Board for out-of-pocket expenses and value-added tax to be paid with regard to their activities as members of the Super-visory Board or of a committee. The directors’ and officers’ liability insurance (D&O insurance) concluded by the company covers the duties performed by the members of the Super-visory Board. This policy provides for the level of deductibles for the Supervisory Board as recommended in section 3.8(3) of the German Corporate Governance Code (GCGC). Total compensation of the Supervisory Board in 2017 was around €3.3 million (2016: around €3 million). The com pen-sation of the individual Supervisory Board members was as follows.

BASF Report 2017 Corporate Governance
Compensation report 151
Compensation of the Supervisory Board of BASF SE (thousand €)
Fixed salary
Performance- related variable compensation
Compensation for committee
memberships Total compensation
2017 2016 2017 2016 2017 2016 2017 2016
Dr. Jürgen Hambrecht, Chairman1, 5 500.0 150.0 – 300.0 50.0 25.0 550.0 475.0
Michael Diekmann, Vice Chairman2, 6 300.0 90.0 – 180.0 31.3 12.5 331.3 282.5
Robert Oswald, Vice Chairman until May 12, 20172, 7 125.0 90.0 – 180.0 10.4 12.5 135.4 282.5
Sinischa Horvat, Vice Chairman since May 12, 20172, 7 200.0 – – – 16.7 – 216.7 –
Ralf-Gerd Bastian4, 7 200.0 60.0 – 120.0 58.3 50.0 258.3 230.0
Dame Alison Carnwath DBE3, 7 200.0 60.0 – 120.0 112.5 100.0 312.5 280.0
Wolfgang Daniel, Supervisory Board member until April 29, 2016 – 20.0 – 40.0 – – – 60.0
Prof. Dr. François Diederich 200.0 60.0 – 120.0 – – 200.0 180.0
Franz Fehrenbach4 200.0 60.0 – 120.0 50.0 50.0 250.0 230.0
Francesco Grioli 200.0 60.0 – 120.0 – – 200.0 180.0
Waldemar Helber, Supervisory Board member since April 29, 2016 200.0 45.0 – 90.0 – – 200.0 135.0
Anke Schäferkordt 200.0 60.0 – 120.0 – – 200.0 180.0
Denise Schellemans 200.0 60.0 – 120.0 – – 200.0 180.0
Michael Vassiliadis2, 4, 7 200.0 60.0 – 120.0 75.0 62.5 275.0 242.5
Total 2,925.0 875.0 – 1,750.0 404.2 312.5 3,329.2 2,937.5
1 Chairman of the Personnel Committee 2 Member of the Personnel Committee 3 Chairman of the Audit Committee 4 Member of the Audit Committee
5 Chairman of the Strategy Committee
6 Vice Chairman of the Strategy Committee
7 Member of the Strategy Committee
Compensation for Supervisory Board membership and mem-bership of Supervisory Board committees is payable after the Annual Shareholders’ Meeting, which approves the Consoli-dated Financial Statements for the business year. Accordingly, compensation relating to the year 2017 will be paid following the Annual Shareholders’ Meeting on May 4, 2018. In 2017, as in 2016, the company paid the Supervisory Board member Prof. Dr. François Diederich a total of CHF 38,400 (2017: approximately €34,500; 2016: approximately
€35,200) for consulting work in the area of chemical research based on a consulting contract approved by the Supervisory Board. Beyond this, no other Supervisory Board members received any compensation in 2017 for services rendered personally, in particular, the rendering of advisory and agency services.
For more information on share ownership by members of the Supervisory Board, see page 134

152 Corporate Governance BASF Report 2017
Report of the Supervisory Board
Report of the Supervisory Board
The dynamic development of BASF and its competitive environment meant that 2017 was a very busy year for the Supervisory Board. Its work focused primarily on the following: – Strategically important portfolio measures such as the agreed acquisition of significant parts of the seed business from Bayer and the planned transfer of the oil and gas business to a joint venture
– The further development of the compensation system for the Board of Executive Directors
– Changes to the Board of Executive Directors with the naming of a new Chairman, also for the purpose of succession planning for the Supervisory Board
The Supervisory Board addressed these tasks with a great sense of responsibility. Its aim is to lay the best possible foundation for BASF’s continued successful and sustainable growth.
Monitoring and consultation in an ongoing dialog with the Board of Executive Directors
In 2017, the Supervisory Board of BASF SE exercised its duties as required by law and the Statutes with the utmost care. It regularly monitored the management of the Board of Executive Directors and provided advice on the company’s strategic development and important individual measures, about which the Supervisory Board was regularly and thoroughly informed by the Board of Executive Directors. This occurred both during and outside of the meetings of the Supervisory Board and its committees in the form of written and oral reports on, for example, all of the major financial key performance indicators (KPIs) of the BASF Group and its segments, the economic situation in the main sales and procurement markets, and on deviations in business developments from original plans. Furthermore, the Supervisory Board tackled fundamental questions of corporate planning, including financial, invest-ment, sales volumes and personnel planning, as well as mea-sures for designing the future of research and development.
The Supervisory Board discussed in detail the reports from the Board of Executive Directors, and also deliberated on pros-pects for the company and its individual business areas with the Board of Executive Directors. It was convinced of the lawfulness, expediency and propriety of the Board of Executive Director’s company leadership. The Chairman of the Supervisory Board and the Chairman of the Board of Executive Directors were also in regular contact outside of Supervisory Board meetings so that the Chairman of the Supervisory Board was promptly informed of current developments and significant issues. The Supervisory Board was always involved at an early stage in decisions of major importance. The Supervisory Board passed resolutions on all of those individual measures taken by the Board of Executive Directors which by law or the Statutes required the approval of the Supervisory Board. In the 2017 business year, these included authorizing: – The acquisition of the seed business offered by Bayer – The transfer of the oil and gas business bundled in the Wintershall Group to a joint venture with LetterOne, including possible public listing
– The acquisition of the polyamide business from Solvay – Co-financing the Nord Stream 2 pipeline project
Supervisory Board meetings
The Supervisory Board held six meetings in the 2017 business year. With the exception of one meeting at which one member of the Supervisory Board was unable to attend, all members attended all Supervisory Board meetings in 2017. No member of the Supervisory Board attended only half or fewer of the meetings of the Supervisory Board and the committees of which they are members. The members of the Supervisory Board elected by shareholders and those elected by the employees prepared for the meetings in separate preliminary discussions in each case, which were also attended by members of the Board of Executive Directors. All members of the Board of Executive Directors attended the Supervisory Board meetings unless it was deemed appropriate that the Supervisory Board discuss individual topics – such as personnel matters relating to the Board of Executive Directors – without them being present.
An individual overview of attendance at meetings of the Supervisory Board and its committees will be made available on the company website at basf.com/governance/supervisoryboard/meetings
A significant component of all Supervisory Board meetings was the Board of Executive Directors’ reports on the current business situation with detailed information on sales and earnings development, as well as on opportunities and risks for business development, the status of important current and planned investment projects, developments on the capital markets, and significant managerial measures taken by the Board of Executive Directors in addition to innovation projects. In all meetings, with the exception of the meeting following the Annual Shareholders’ Meeting on May 12, 2017, which exclusively addressed organizational Supervisory Board topics,
Report of the Su-pervisory Board

BASF Report 2017 Corporate Governance
Report of the Supervisory Board 153
the Supervisory Board discussed the further development of the BASF Group’s business activities through acquisitions, divestitures and investment projects. Discussions focused on: – Global consolidation in the crop protection industry and the acquisition of the seed business offered by Bayer
– The acquisition of the polyamide value chain from Solvay – The long-term development of and strategic opportunities for the oil and gas business bundled in the Wintershall group, including the gas transportation business and its combina-tion with DEA’s business in a joint venture with LetterOne, as well as the option of later public listing
– The progress of the Nord Stream 2 pipeline project and the BASF Group’s involvement in financing the project
– The expansion of the battery materials business in Europe, North America and Japan, for example by establishing addi-tional production capacities in cooperation with Toda and a raw materials supply cooperation with Norilsk Nickel
At its meeting on February 22, 2017, the Supervisory Board reviewed and approved the Consolidated Financial Statements, Management’s Report and the proposal for the appropriation of profit for the 2016 business year as presented by the Board of Executive Directors. In addition, it discussed details of the new structure of the Supervisory Board’s compensation and prepared the corresponding resolution for the Annual Shareholders’ Meeting. The Supervisory Board met prior to the Annual Share-holders’ Meeting on May 12, 2017, primarily to prepare for the Annual Shareholders’ Meeting. In addition to strategically significant individual measures, the Supervisory Board also addressed BASF’s strategy and long-term business prospects in individual business areas and regions. This was the focus of its meeting on July 24/25, 2017, at which the Board of Executive Directors provided a status update on the implementation of the “We create chemistry” strategy. The main consultation topics were: – The possibilities and objectives for strategic portfolio development
– Strategic opportunities for the oil and gas business – The development of the Verbund and measures to promote operational excellence
– The long-term development of the automotive industry as one of BASF’s key customer industries and the related strategic business opportunities, especially from the development of electromobility and autonomous driving
– Innovations, especially the status, opportunities and risks arising from the digitalization of industrial processes
At its meeting on October 20, 2017, the Supervisory Board addressed the crop protection and seeds business in detail, including its growth prospects and business risks as well as technology, market and development trends. It was also informed of the new statutory nonfinancial reporting require-ments and how the Board of Executive Directors planned to structure BASF’s nonfinancial statements going forward. In this connection, the Supervisory Board resolved to also have the auditor conduct a substantive audit with limited assurance
for the nonfinancial statements, above and beyond the statutory auditing requirements. At its meeting on December 21, 2017, the Supervisory Board discussed and approved the Board of Executive Directors’ operational and financial planning including the investment budget for 2018, and as usual authorized the Board of Executive Directors to procure the necessary financ-ing in 2018.
Composition and compensation of the Board of Executive Directors
In several meetings in the 2017 business year, the Supervisory Board conferred on, and passed resolutions on, personnel topics in the Board of Executive Directors as well as questions concerning the compensation of the Board of Executive Directors. Based on preparation conducted by the Personnel Committee, it determined the targets for the Board of Executive Directors for the 2017 business year at its meeting on Febru-ary 22, 2017. At its meeting on December 21, 2017, the Supervisory Board discussed at length, based on the counsel of the Personnel Committee, questions relating to the composition of the Board of Executive Directors, succession planning for the Board of Executive Directors, the further development of the compensation system for the Board of Executive Directors as well as the related adjustments to the Board members’ contracts as of January 1, 2018, and evaluated the Board of Executive Directors’ performance in 2017. As part of long-term succession planning, the Supervisory Board named Dr. Martin Brudermüller, currently Vice Chairman of the Board of Executive Directors, as Chairman of the Board of Executive Directors effective at the end of the Annual Shareholders’ Meeting on May 4, 2018. The current Chairman of the Board of Executive Directors, Dr. Kurt Bock, will step down from the Board of Executive Directors by mutual agreement on this date so that he can be elected to the Supervisory Board and appointed as its chairman in 2020. Dr. Kurt Bock agreed on early discontinuance of his contract without severance pay and will receive the contractually agreed interim and pension benefits in accordance with regular expiration of a term on the Board of Executive Directors on this date. Furthermore, the Supervisory Board named the Board of Executive Directors member Dr. Hans-Ulrich Engel as Vice Chairman of the Board of Executive Directors, likewise effective May 4, 2018, and extended the appointments of Dr. Martin Brudermüller, Dr. Hans-Ulrich Engel and Sanjeev Gandhi until the end of the Annual Shareholders’ Meeting in 2023. The number of members of the Board of Executive Directors will be reduced from eight to seven following the 2018 Annual Shareholders’ Meeting. In addition, on December 21, 2017, after a number of preparatory briefings by the Personnel Committee in the meetings prior, the Supervisory Board resolved to amend the compensation system for the Board of Executive Directors and its members’ contracts. The main changes are the introduction of a new performance bonus to make it more long

154 Corporate Governance BASF Report 2017
Report of the Supervisory Board
term and forward-looking in line with the new recommendations of the German Corporate Governance Code, which replaces the annual variable compensation granted to date, as well as the agreement of a contractual clawback clause in the case of a gross breach of the duties pertaining to the Board of Executive Directors. The amended compensation system for the Board of Executive Directors is to be submitted to the Annual Shareholders’ Meeting on May 4, 2018 for approval. All members of the Board of Executive Directors have agreed to the contractual amendment with effect from January 1, 2018.
Committees
The Supervisory Board of BASF SE has four committees: 1. the committee for personnel matters of the Board of Exec-utive Directors and the granting of loans in accordance with section 89(4) of the German Stock Corporation Act (Personnel Committee); 2. the Audit Committee; 3. the Nomination Committee; and 4. the Strategy Committee. Following each Committee meeting, the chairpersons of the Committees reported in detail about the meetings and the activities of the Committees at the subsequent meeting of the Supervisory Board.
For information on the composition of the committees and the tasks assigned to them by the Supervisory Board, see the Corporate Governance Report on page 129
The Personnel Committee met four times during the reporting period. With the exception of one meeting, which one committee member was unable to attend, all committee members attended the meetings. At its meeting on February 22, 2017, the Personnel Committee advised on the targets for the Board of Executive Directors for the 2017 business year. The main focus at the meeting on July 24, 2017 was the development of leadership at the top levels of management below the Board of Executive Directors, as well as long-term succession planning and potential alternate candidates for that Board. The main agenda item at the meeting on October 20, 2017 was the further development of the compensation system for the Board of Executive Directors. Agenda items at the meeting on December 21, 2017 were the performance evaluation of the Board of Executive Directors for 2017, consultation on the profile of skills and expertise and the diversity concept for the Board of Executive Directors and the Supervisory Board, as well as preparations for resolutions by the Supervisory Board on the composition of the Board of Executive Directors. One of the committee’s core tasks at all meetings was continuing the discussion started in 2016 on the further development of the compensation awarded to the Board of Executive Directors and the resulting amendment to Board members’ contracts. The results of the committee’s discussions formed the basis for the amended compensation system for the Board of Executive Directors that was resolved by the Supervisory Board on December 21, 2017. The Audit Committee is responsible for all the tasks listed in section 107(3) sentence 2 of the German Stock Corporation Act
and in section 5.3.2 of the German Corporate Governance Code in the version dated February 7, 2017. Since the 2017 business year, these tasks also include auditing the nonfinancial state-ments of BASF SE and the BASF Group. The Audit Committee met five times during the reporting period. Its core duties were to review BASF SE’s Financial Statements and Consolidated Financial Statements, as well as to discuss the quarterly state-ments and the half-year financial report with the Board of Executive Directors prior to their publication. With the exception of two meetings, which one member did not attend, all committee members participated in the meetings. At the meeting on February 21, 2018, the auditor reported in detail on its audits of BASF SE’s Separate and Consolidated Financial Statements for the 2017 business year, including the corresponding management’s reports, and discussed the results of its audit with the Audit Committee. The committee’s audit also included the nonfinancial statements of BASF SE and the BASF Group, which were part of the management’s reports for the first time in 2017. In preparation for the audit, the Audit Committee had, following a corresponding resolution by the Supervisory Board, additionally engaged KPMG AG Wirtschaftsprüfungsgesellschaft to perform a substantive audit with limited assurance of the nonfinancial statements and to issue an assurance report on this. KPMG also reported in detail on the focus, the procedure and the key findings of this audit. At the meeting on July 24, 2017, the Audit Committee engaged KPMG AG Wirtschaftsprüfungsgesellschaft – the auditor elected by the Annual Shareholders’ Meeting – with the audit for the 2017 reporting year and auditing fees were agreed upon. The focus areas for the annual audit were discussed and defined together with the auditor. The Audit Committee categorically excluded any service relationships between auditor and BASF Group companies outside of the audit of the annual financial statements, including beyond prevailing legal limitations. These services may only be performed upon approval by the Audit Committee. For certain nonaudit services beyond the scope of the audit of the financial reports, the Audit Committee either granted approval for individual cases or authorized the Board of Executive Directors to engage KPMG AG Wirtschaftsprüfungsgesellschaft for such services. The authorization of each service applies for one reporting year and is limited in amount. Other important activities included advising the Board of Executive Directors on accounting issues and the internal control system. The Audit Committee focused on the internal auditing system at the meeting on July 24, 2017, and compliance in the BASF Group on December 20, 2017. In these meetings, the head of the Corporate Audit department and the Chief Compliance Officer reported to the Audit Committee and answered its questions. In all meetings, the Audit Committee also received information on the development of risks from litigation. The Nomination Committee is responsible for preparing candidate proposals for the election of those Supervisory Board members who are elected by the Annual Shareholders’ Meeting. The Nomination Committee is guided by the

BASF Report 2017 Corporate Governance
Report of the Supervisory Board 155
objectives for the composition of the Supervisory Board adopted by the Supervisory Board as well as the profile of skills and expertise and diversity concept for the Supervisory Board resolved at the meeting on December 21, 2017. The Nomination Committee met once in 2017. All committee members attended the meeting. The focus of the meeting was consultation on the preparation of a profile of skills and expertise and diversity concept for the Supervisory Board as a whole, which aim to ensure that – based on a systematic review – individuals are nominated to the Annual Shareholders’ Meeting for election to the Supervisory Board that collectively posess all of the professional and personal competencies and experience that, according to the Supervisory Board’s assessment, are necessary to perform its tasks in full. Another focus of the meeting was discussing the alternate candidates as well as long-term planning and preparations for the succession of the current Chairman of the Supervisory Board with the suggestion to elect the current Chairman of the Board of Executive Directors, Dr. Kurt Bock, as a member of the Supervisory Board and its Chairman after expiry of the statutory cooling-off period of two years following his departure from the Board of Executive Directors. The Strategy Committee met four times in 2017. The Committee was established to consult on strategic options for the further development of the BASF Group and has com-prised six members of the Supervisory Board since May 2017. With the exception of one meeting, which one committee member was unable to attend, all committee members attended the meetings. At its meetings, the Committee addressed in detail options for the strategic further develop-ment of BASF’s portfolio and proposed material acquisitions and divestitures, particularly in the Agricultural Solutions and Oil & Gas segments. The Committee’s discussions and resolu-tions repeatedly dealt with the intended acquisition of the seed business offered by Bayer and the potential combination of the BASF Group’s and LetterOne’s oil and gas businesses in a joint venture, with the intention of later listing it on the stock exchange.
Corporate Governance and Declaration of Conformity
The Supervisory Board places great value on ensuring good corporate governance: In 2017, it was therefore once again intensely occupied with the corporate governance standards practiced in the company and the implementation of the recommendations and suggestions of the German Corporate Governance Code in the version dated February 7, 2017. In addition to the review of BASF’s corporate governance culture, topics of discussion were the implementation of the new recommendations and suggestions of the German Corporate Governance Code as well as the statutory requirements for the Supervisory Board arising from the CSR Directive Implementation Act. Discussions and decisions focused especially on the implementation of the expanded recommendations of the German Corporate Governance
Code on structuring the variable components of the compensation awarded to the Board of Executive Directors, as well as the requirements on the composition of the Supervisory Board and the Board of Executive Directors, which are summarized in the profiles of skills and expertise and diversity concepts for the Supervisory Board and the Board of Executive Directors.
For more information on the profiles of skills and expertise, diversity concepts and composition goals, see page 128 and from page 130 onward
At its meeting of December 21, 2017, the Supervisory Board approved the joint Declaration of Conformity by the Supervisory Board and the Board of Executive Directors in accordance with section 161 of the German Stock Corporation Act. BASF complies with the recommendations of the German Corporate Governance Code in the version dated February 7, 2017, with-out exception. The Corporate Governance Report of the BASF Group provides extensive information on BASF’s corporate governance.
The full Declaration of Conformity is rendered on page 157 and is available to shareholders on the company website at basf.com/en/governance
Independence and efficiency review
An important aspect of good corporate governance is the independence of Supervisory Board members and their freedom from conflicts of interest. According to assessments of the Supervisory Board, eleven of its twelve members can be considered independent within the meaning of the German Corporate Governance Code and the additional criteria defined by the Supervisory Board for evaluating their independence. The criteria used for this evaluation can be found in the Corporate Governance Report on page 131. In cases where Supervisory Board members hold supervisory or management positions at companies with which BASF has business relations, we see no impairment of their independence. The scope of these businesses is relatively marginal and further-more takes place under conditions similar to those of a third party. The Supervisory Board reviews the efficiency of its activities every year in the form of a self-assessment. This took place in 2017 as well, as the Chairman of the Supervisory Board conducted individual dialogs with each Supervisory Board member using a structured questionnaire. Topics especially centered on Supervisory Board meeting agendas, cooperation with the Board of Executive Directors, information supply of the Supervisory Board, the Committees’ duties, composition and work, and cooperation with shareholder and employee representatives. The results of these individual meetings were presented and thoroughly discussed at the Supervisory Board meeting on December 21, 2017. Overall, its members rated the Supervisory Board’s activity as efficient. Independent of the efficiency review, the Audit Committee also conducted a self-assessment of its activities in 2017 based on individual discussions with all of its members. Mate-rial topic areas were the organization and content of the
156 Corporate Governance BASF Report 2017
Report of the Supervisory Board
meetings and the supply of information as the basis of the Committees’ work. No notable need for action was identified.
Separate and Consolidated Financial Statements
KPMG AG Wirtschaftsprüfungsgesellschaft, the auditor elected by the Annual Shareholders’ Meeting for the 2017 reporting year, has audited the Financial Statements of BASF SE and the BASF Group Consolidated Financial Statements, which were prepared in accordance with the International Financial Reporting Standards (IFRS) as adopted by the European Union, and the additional requirements that must be applied in accordance with section 315e(1) of the German Commercial Code (HGB), including the Management’s Report and the accounting records from which they were prepared, and have approved them free of qualification. Furthermore, the auditor certified that the Board of Executive Directors had taken the measures incumbent on it under section 91(2) of the German Stock Corporation Act (AktG) in an appropriate manner. In particular, it had instituted an appropriate information and monitoring system that fulfilled the requirements of the company and is applicable for the early identification of developments that could pose a risk to the continued existence of the BASF Group. The results of the audit as well as the procedure and material findings of the audit of the financial statements are presented in the Auditor’s Report, the content of which has been significantly expanded since the 2017 Financial Statements.
The Auditor’s Report is rendered from page 162 onward
For more information on the auditor, see the Corporate Governance Report on page 134
Beyond the statutory audit of the Financial Statements, KPMG also conducted, on behalf of the Supervisory Board, a substantive audit with limited assurance of the nonfinancial statements (NFSs) for BASF SE and the BASF Group, which are integral parts of the respective management’s reports. On the basis of its audit, KPMG did not raise any objections to the nonfinancial reporting and the satisfaction of the relevant statutory requirements.
The assurance report issued by KPMG on the substantive audit of the NFS can be found at basf.com/nfs-audit
The auditor’s reports were sent in a timely manner to every member of the Supervisory Board. The auditor attended the accounts review meeting of the Audit Committee on Febru- ary 21, 2018, as well as the accounts meeting of the Supervisory Board on February 22, 2018, and reported on the procedure and material findings of its audit, including the key audit matters described in the Auditor’s Report. The auditor also provided detailed explanations of the reports on the day before the accounts meeting of the Supervisory Board. The Audit Committee reviewed the Financial Statements and Management’s Report at its meeting on February 21, 2018, including the reports prepared by the auditor and the
key audit matters specified in the Auditor’s Report, and discussed them in detail with the auditor. The Chairman of the Audit Committee gave a detailed account of the preliminary review at the Supervisory Board meeting on February 22, 2018. On this basis, the Supervisory Board has examined the Financial Statements and Management’s Report of BASF SE for 2017, the proposal by the Board of Executive Directors for the appropriation of profit, and the Consolidated Financial Statements and Management’s Report for 2017. The results of the preliminary review by the Audit Committee and the results of the Supervisory Board’s own examination fully concur with those of the audit. The Supervisory Board sees no grounds for objection to the management and submitted reports. At its accounts meeting on February 22, 2018, the Supervisory Board approved the Financial Statements of BASF SE and the Consolidated Financial Statements of the BASF Group prepared by the Board of Executive Directors, making the 2017 Financial Statements final. The Supervisory Board concurs with the proposal of the Board of Executive Directors regarding the appropriation of profit and the payment of a dividend of €3.10 per share.
Composition of the Supervisory Board
The long-serving Vice Chairman of the Supervisory Board, Robert Oswald, stepped down from the Supervisory Board at the conclusion of the Annual Shareholders’ Meeting on May 12, 2017. He had been a member of the Supervisory Board as an employee representative since October 1, 2000. As the chairman of the Works Council at BASF SE’s Ludwigshafen Site, BASF’s Joint Works Council and the BASF Works Council Europe, Robert Oswald played a significant role in BASF’s development. The Supervisory Board expresses its very sincere thanks to Robert Oswald for his contribution. He was succeeded by Sinischa Horvat, who joined the Supervisory Board as the alternate member appointed by the BASF Works Council Europe on December 4, 2013, in accordance with the Employee Participation Agreement dated November 15, 2007.
For more information on changes within the Supervisory Board, see the Corporate Governance Report on page 131
Thanks
The Supervisory Board wishes to thank all employees of the BASF Group worldwide and the management for their personal contribution in the 2017 business year.
Ludwigshafen, February 22, 2018
The Supervisory Board
Jürgen HambrechtChairman of the Supervisory Board

BASF Report 2017 Corporate Governance
Declaration of Conformity pursuant to section 161 of the German Stock Corporation Act (AktG) 157
Declaration of Conformity pursuant to section 161 of the German Stock Corporation Act (AktG)
Declaration of Conformity 2017 of the Board of Executive Directors and the Supervisory Board of BASF SE
The Board of Executive Directors and the Supervisory Board of BASF SE hereby declare pursuant to section 161 AktG (Stock Corporation Act)
1. The recommendations of the Government Commission on the German Corporate Governance Code as amended on May 5, 2015, published by the Federal Ministry of Justice on June 12, 2015, in the official section of the electronic Federal Gazette, have been complied with since the sub-mission of the last Declaration of Conformity in December 2016.
2. The recommendations of the Government Commission on the German Corporate Governance Code as amended on February 7, 2017, published by the Federal Ministry of Justice on April 24, 2017, in the official section of the electronic Federal Gazette are complied with and will be complied with.
Ludwigshafen, December 2017
The Supervisory Board of BASF SE
The Board of Executive Directorsof BASF SE

158 Corporate Governance BASF Report 2017
Declaration of Corporate Governance
Declaration of Corporate Governance as per section 315d of the German Commercial Code (HGB) in connection with section 289f HGB
The Declaration of Corporate Governance, pursuant to section 315d HGB in connection with section 289f HGB, comprises the subchapters Corporate Governance Report including the description of the diversity concept for the composition of the Board of Executive Directors and the Supervisory Board (except for the disclosures pursuant to section 315a(1) HGB), Compliance and Declaration of Conformity as per section 161 of the German Stock Corporation Act (AktG) in the Corporate Governance chapter. It is a component of the Management’s Report. Pursuant to section 317(2) sentence 6 HGB, the auditor checked that the disclosures according to section 315d HGB were made.
Declaration of Corporate Governance

4Statement by the Board of Executive Directors 161
Independent Auditor’s Report 162
Statement of income 168
Statement of income and expense recognized in equity 169
Balance sheet 170
Statement of cash flows 171
Statement of equity 172
Notes
Policies and scope of consolidation 1 Summary of accounting policies 173 2 Scope of consolidation 184 3 BASF Group List of Shares Held in accordance
with Section 313(2) of the German Commercial Code 190
4 Reporting by segment and region 190Notes on statement of income
5 Earnings per share 194 6 Functional costs 194 7 Other operating income 195 8 Other operating expenses 196 9 Income from companies accounted
for using the equity method 19710 Financial result 19711 Income taxes 19812 Minority interests 20013 Personnel expenses and employees 200
Notes on balance sheet14 Intangible assets 20115 Property, plant and equipment 20516 Investments accounted for using the
equity method and other financial assets 20717 Inventories 20718 Receivables and miscellaneous assets 20819 Capital, reserves and retained earnings 20920 Other comprehensive income 21021 Minority interests 21122 Provisions for pensions and similar
obligations 21123 Other provisions 21724 Liabilities 21825 Other financial obligations 22026 Risks from litigation and claims 22127 Supplementary information on financial
instruments 22228 Leases 228
Other explanatory notes29 Statement of cash flows and capital
structure management 22930 Share price-based compensation program
and BASF incentive share program 23131 Compensation for the Board of
Executive Directors and Supervisory Board 23232 Related-party transactions 23333 Services provided by the external auditor 23434 Declaration of Conformity with the German
Corporate Governance Code 234
To Our Shareholders 5
Management’s Report 17
Corporate Governance 125
Consolidated Financial Statements Supplementary Information on the Oil & Gas Segment 235
Overviews 245
Co
nso
lidat
ed F
inan
cial
Sta
tem
ents

BASF Report 2017 Consolidated Financial Statements
Statement by the Board of Executive Directors 161
Statement by the Board of Executive Directors and assurance pursuant to sections 297(2) and 315(1) of the German Commercial Code (HGB)The Board of Executive Directors of BASF SE is responsible for preparing the Consolidated Financial Statements and Management’s Report of the BASF Group. The BASF Group Consolidated Financial Statements for 2017 were prepared according to the International Financial Reporting Standards (IFRS), which are published by the Inter-national Accounting Standards Board (IASB), London, and have been endorsed by the European Union. We have established effective internal control and steering systems in order to ensure that the BASF Group’s Consoli-dated Financial Statements and Management’s Report comply with applicable accounting rules and to ensure proper corporate reporting. The risk management system we have set up is designed such that the Board of Executive Directors can identify material risks early on and take appropriate defensive measures as necessary. The reliability and effectiveness of the internal con-trol and risk management system are continually audited throughout the Group by our internal audit department.
To the best of our knowledge, and in accordance with the applicable reporting principles, the Consolidated Financial Statements of the BASF Group give a true and fair view of the net assets, financial position and results of operations of the Group, and the Management’s Report of the BASF Group includes a fair review of the development and performance of the business as well as position of the BASF Group, together with a description of the principal opportunities and risks associated with the expected development of the BASF Group.
Ludwigshafen am Rhein, February 21, 2018
Dr. Kurt BockChairman
Dr. Hans-Ulrich EngelChief Financial Officer
Sanjeev Gandhi
Dr. Markus Kamieth
Dr. Martin BrudermüllerVice Chairman
Saori Dubourg
Michael Heinz
Wayne T. Smith

162 Consolidated Financial Statements BASF Report 2017
Independent Auditor’s Report^1
Note: This is a translation of the German original. Solely the original text in German language is authoritative.
Independent Auditor’s Report1
To BASF SE, Ludwigshafen am Rhein
Report on the Audit of the Consolidated Finan-cial Statements and of the Group Management’s Report
OpinionsWe have audited the Consolidated Financial Statements of BASF SE and its subsidiaries (the Group), which comprise the balance sheet as at December 31, 2017, statement of income, statement of income and expense recognized in equity, state-ment of cash flows, statement of equity for the financial year from January 1, 2017 to December 31, 2017 and Notes to the Consolidated Financial Statements, including a summary of significant accounting policies. In addition, we have audited the Group Management’s Report of BASF SE for the financial year from January 1, 2017 to December 31, 2017. In addition, we have been instructed to express an opinion as to whether the Consolidated Financial Statements comply with full IFRS. In accordance with the German legal requirements we have not audited the content of the non-financial statement and the corporate governance statement which are included in the Group Management’s Report and are identified as unaudited other information.
In our opinion, on the basis of the knowledge obtained in the audit, – The accompanying Consolidated Financial Statements comply, in all material respects, with the IFRSs as adopted by the EU, the additional requirements of German commer-cial law pursuant to Section 315e (1) of the German Com-mercial Code (HGB) and full IFRS, and in compliance with these requirements, give a true and fair view of the assets, liabilities, and financial position of the Group as at Decem-ber 31, 2017, and of its financial performance for the financial year from January 1, 2017 to December 31, 2017, and
– The accompanying Group Management’s Report as a whole provides an appropriate view of the Group’s position. In all material respects, this Group Management’s Report is con-sistent with the Consolidated Financial Statements, complies with German legal requirements and appropriately presents the opportunities and risks of future development. Our opinion on the Group Management’s Report does not cover the content of the non-financial statement and the corporate governance statement mentioned above.
Pursuant to Section 322 (3) sentence 1 HGB, we declare that our audit has not led to any reservations relating to the legal compliance of the Consolidated Financial Statements and of the Group Management’s Report.
Basis for the OpinionsWe conducted our audit of the Consolidated Financial Statements and of the Group Management’s Report in accordance with Section 317 HGB and the EU Audit Regula-tion No. 537/2014 (referred to subsequently as “EU Audit
Regulation”) and in compliance with German Generally Accepted Standards for Financial Statement Audits promul-gated by the Institute of Public Auditors in Germany (Institut der Wirtschaftsprüfer, IDW). Our responsibilities under those requirements and principles are further described in the “Auditor’s Responsibilities for the Audit of the Consolidated Financial Statements and of the Management’s Report” section of our auditor’s report. We are independent of the group entities in accordance with the requirements of European law and German commercial and professional law, and we have fulfilled our other German professional responsibilities in accordance with these requirements. In addition, in accor-dance with Article 10 (2) point (f) of the EU Audit Regulation, we declare that we have not provided non-audit services prohibited under Article 5 (1) of the EU Audit Regulation. We believe that the evidence we have obtained is sufficient and appropriate to provide a basis for our opinions on the Consolidated Financial Statements and on the Group Management’s Report.
Key Audit Matters in the Audit of the Consolidated Financial Statements Key audit matters are those matters that, in our professional judgment, were of most significance in our audit of the Consolidated Financial Statements for the financial year from January 1, 2017 to December 31, 2017. These matters were addressed in the context of our audit of the Consolidated Financial Statements as a whole, and in forming our opinion thereon, we do not provide a separate opinion on these matters.
BASF’s oil and gas price scenario: Impact of assumptions relating to estimation uncertain-ties on the recoverability of assets and goodwill
For information on BASF’s oil and gas price scenario, please refer to Note 1.4 to the Consolidated Financial Statements on pages 183 and 184.
Financial statement riskOil and gas price projections are a key factor in the long-term earnings forecasts for the Oil & Gas segment, and thus have a direct impact on the recoverability of the assets recognized in this segment, including the goodwill allocated to the Explora-tion & Production cash-generating unit within this segment. The oil and gas price projections underlying the calculation are based on an internal estimation process.
It is difficult to forecast future price trends given the current high volatility of oil and gas prices. The variety of assumptions underlying the estimation process are subject to significant judgment. This gives rise to the risk that the oil and gas price projections are not within an appropriate range and that the assets of the Oil & Gas segment, including the goodwill allocated to the Exploration & Production cash-generating
1 This is a translation of the German original. Solely the original text in German language is authoritative.

BASF Report 2017 Consolidated Financial Statements
Independent Auditor’s Report^1 163
unit, have not been measured properly. There is also a risk that estimation uncertainties have not been sufficiently disclosed in the Notes to the Consolidated Financial Statements.
Our audit approachIn order to assess its suitability as a basis for calculation, we had the company explain to us how the oil and gas price scenario was determined. Our audit procedures included, among others, an assessment of the completeness and balance of the assumptions used in the estimation process. We critically examined the assumptions for the macro economic parameters, such as the development of demand for oil and gas, fiscal considerations of important crude oil- and gas- producing countries, rising marginal production costs, as well as producers’ investment behavior, and assessed whether these were appropriately reflected in BASF’s oil and gas price scenario. Finally, we compared BASF’s oil and gas price scenario with the published forecasts of industry associations, analysts, international institutions and other market partici-pants.
We satisfied ourselves of the suitability of the estimation process and the resulting forecasts for accounting purposes by comparing BASF’s oil and gas price projections in the past ten years with the actual average annual prices.
We also analyzed, on the basis of alternative scenarios prepared by BASF, the effects of a variation in the oil and gas price scenario on the recoverability of the assets. We satisfied ourselves of the appropriateness of the assumptions underly-ing the alternative scenarios.
Furthermore, we assessed whether the disclosures in the Notes to the Consolidated Financial Statements regarding BASF’s oil and gas price scenario and estimation uncertainties related to the scenario are sufficient and appropriate.
Our observationsThe estimates and assumptions made in the preparation of the company’s internal forecasts are sufficiently documented and justified. The assumptions about oil and gas prices made by the Board of Executive Directors are appropriate in comparison with the published forecasts of industry associations, analysts, international institutions and other market participants. Overall, BASF’s oil and gas price forecasts therefore represent a reasonable basis for calculation.
The explanations in the Notes to the Consolidated Financial Statements on the oil and gas price scenario assumed by BASF as a significant source of estimation uncertainties are sufficiently detailed and appropriate.
Recoverability of goodwill
For information on the accounting principles applied, please refer to Note 1.4 to the Consolidated Financial Statements on pages 178 and 184. The underlying assumptions used in the calculation and the disclosures on the impairment test performed are included in Note 14 to the Consolidated Financial Statements from page 201 onward.
Financial statement riskIntangible assets in the Consolidated Financial Statements of BASF SE include goodwill in the amount of €9,353 million. Goodwill has to be tested for impairment annually and when-ever there is an indication that goodwill may be impaired. The impairment test for the Construction Chemicals, Pigments and Surface Treatment units revealed that a change to the key as-sumptions, which is considered reasonably possible, could lead to the carrying amount exceeding the recoverable amount.
Key assumptions by the Board of Executive Directors are the forecasts for future cash inflows in the detailed planning period, the assumed growth rate for subsequent periods, as well as the cost of capital. These assumptions have a material impact on the recoverability of goodwill. The growth forecasts of the Board of Executive Directors are associated with risks and can be revised in light of volatile raw materials prices and an instable macroeconomic environment. Deviations from the key assumptions, which the Board of Executive Directors consid-ers reasonably possible, would lead to impairments at the above units. There is the risk for the financial statements that impairment has not been identified. In addition, there is also a risk that the Notes to the Consolidated Financial Statements do not contain the required disclosures on the key assump-tions and sensitivities for these units.

164 Consolidated Financial Statements BASF Report 2017
Independent Auditor’s Report^1
Our audit approachWe examined the forecast for future cash inflows in the detailed planning period, in particular with respect to whether the expected development of the relevant sales markets were given appropriate consideration and are consistent with the current budget adopted by the Board of Executive Directors and the Supervisory Board. We compared internal growth forecasts with industry expectations and those of significant competitors. We reviewed whether the assumptions in the budget adopted by the Board of Executive Directors and the Supervisory Board about the future development of margins and the amount of investments are appropriate, focusing on the units for which the Board of Executive Directors considered deviations from the key assumptions to be reasonably possible and where these deviations would lead to the carrying amount of the units exceeding their respective recoverable amounts. Our review of the appropriateness of the budget adopted by the Board of Executive Directors and the Supervisory Board also included a comparison of planning in past business years with the results actually achieved. For selected units, we examined whether reasons for not reaching planned values in the past were given appropriate consideration in current plan-ning, to the extent that this was relevant.
We assessed the appropriateness of the assumed growth rate for the period following the detailed planning period on the basis of industry and macroeconomic studies. We satisfied ourselves of the methodological appropriateness of the calcu-lation and the appropriateness of the weighted cost of capital rates. To this end, we calculated our own expected values for the assumptions and parameters underlying the weighted cost of capital rates and compared these with the assumptions and parameters used. The audit team was supported by our company valuation specialists.
Finally, we assessed the completeness of the disclosures on the key assumptions and the sensitivities.
Our observationsThe assumptions underlying the calculations of the Board of Executive Directors are balanced overall. The disclosures in the notes on the key assumptions and the sensitivities are complete.
Accounting treatment of pension provisions
For information on the accounting principles applied, please refer to Note 1.4 to the Consolidated Financial Statements on page 182. The underlying assumptions used in the measure-ment of pension obligations are presented in the Notes to the Consolidated Financial Statements from page 211 onward.
Financial statement riskAs of December 31, 2017, the Consolidated Financial State-ments of BASF SE contained provisions for pensions and similar obligations of €6,293 million. The net defined benefit
liability of €6,223 million (after taking into account defined benefit assets of overfunded plans in the amount of €70 mil-lion) is derived by subtracting the fair value of the plan assets (€20,648 million) from the defined benefit obligation of the pension obligations for the BASF Group (€26,871 million).
Obligations arising from defined benefit plans are measured on the basis of actuarial assumptions made according to the projected unit credit method. BASF uses external actuaries here. The assumptions applied in the process are determined by BASF. BASF uses a Group-wide, uniform process to deter-mine the discount rates from the market yields on high-quality corporate fixed-rate bonds. As key assumptions, the calcula-tions as of December 31, 2017 are also based on current projections for pension increases and mortality tables, which are updated regularly. The amount of the defined benefit obli-gations is largely based on the estimates and assumptions of the Board of Executive Directors of BASF SE.
Plan assets are measured at fair value. The fair values of plan assets are regularly derived from prices on active markets. If no active market exists, this gives rise to uncertainty or discretion-ary scope in the measurement of the pension assets.
Pension benefits based on insurance models, where the employer generally has a subsidiary liability, are accounted for as defined contribution plans, provided recourse to BASF is very unlikely as of the reporting date. Recognition as defined contribution plans is highly dependent on the assessment of recourse.
There is a risk for the Consolidated Financial Statements that pension obligations and plan assets have not been measured correctly. Furthermore, there is a risk that pension plans have not been classified correctly and must be recognized as defined benefit plans. There is also a risk that the Notes to the Consolidated Financial Statements do not contain the required disclosures on the characteristics of the defined benefit plans and the related risks.
Our audit approachIn a first step, we assessed the structure, implementation and effectiveness of the internal controls to communicate audit- relevant financial information, particularly the underlying frame-work, to the actuary.
In the assessment of the actuarial assumptions and the calcu-lation methods used, the audit team was supported by our actuarial specialists. Our audit procedures included, among others, an assessment of the appropriateness of the process used to determine the discount rate as well as the remeinaing actuarial assumptions. In addition, we verified the accuracy of the resulting obligations based on a selection of specific pension commitments.

BASF Report 2017 Consolidated Financial Statements
Independent Auditor’s Report^1 165
For the assessment of the fair values of plan assets, we had access to, in particular, bank confirmations and financial statements of the banks managing the funds. We also took samples to compare the closing rates of the shares and bonds with external market data. For non-listed investments, we evaluated the design, implementation and effectiveness of the internal controls established by the company to assess the valuation process for these investments. For real estate and alternative investments, we alse verified the processes under-lying the valuation in each case as well as the valuation assumptions and parameters used with the support of our internal specialists.
For pension benefits based on insurance models, where the employer has a subsidiary liability, we satisfied ourselves that the estimates of recourse made by the Board of Executive Directors are sufficiently documented and reasonable to justify recognition as defined contribution plans by comparing cur-rent return projections and minimum interest guarantees.
Furthermore, we evaluated whether the explanations regard-ing the characteristics of defined benefit plans and risks asso-ciated with them in the Notes to the Consolidated Financial Statements are complete, sufficiently detailed and appropriate.
Our observationsThe valuation methods applied by BASF and the assumptions underlying the valuation of the pension obligations and the plan assets are appropriate. Furthermore, the accounting treatment of insurance-based pension plans where the employer has a subsidiary liability is justified. The disclosures in the Notes to the Consolidated Financial Statements on the pension obligations, in particular the characteristics of defined benefit plans and the risks associated with them, are com-plete, sufficiently detailed and appropriate.
Accounting treatment of the oil and gas business
For information on the accounting principles applied, please refer to Note 1.4 to the Consolidated Financial Statements on page 183.
Financial statement riskOn December 7, 2017, BASF and LetterOne signed a letter of intent on the merger of their oil and gas activities in a joint venture. BASF’s oil and gas activities represent a separate, material business area of the BASF Group and are accounted for as a reportable segment.
Assets and liabilities classified as held for sale are presented as separate items in the balance sheet. In addition, the results from discontinued operations are presented as a separate item in the statement of income. The classification of the Oil & Gas segment as a continuing or discontinued operation
in accordance with IFRS 5 depends on a range of criteria, the assessment of which as of the reporting date is a source of judgement for the specific matter.
There is a risk for the Consolidated Financial Statements that the classification of the Oil & Gas segment as a continuing operation is not appropriate, and thus that its presentation in the Consolidated Financial Statements is not correct. With respect to the disclosures in the Notes to the Consolidated Financial Statements on the classification of the Oil & Gas segment as well as on the exercise of judgement, there is a risk that the explanations are not sufficiently detailed or appropriate.
Our audit approachWe assessed whether the classification of the Oil & Gas seg-ment as a continuing operation was performed properly. In addition, we analyzed the agreements entered into in the letter of intent, spoke with members of the Board of Executive Directors and other BASF employees, and evaluated internal and external reports.
Finally, we evaluated whether the explanations in the Notes to the Consolidated Financial Statements on the classification of the Oil & Gas segment are sufficiently detailed and appro-priate.
Our observationsThe classification of the Oil & Gas segment as a continuing operation is appropriate and consistent with IFRS 5. The related explanations in the Notes to the Consolidated Financial Statements are sufficiently detailed and appropriate.
Other information
The Board of Executive Directors is responsible for the other information. The other information comprises: – The unaudited part of the Group Management’s Report described in section “Opinions,” and
– The remaining parts of the BASF Report 2017, with the exception of the audited Consolidated Financial Statements and Group Management’s Report and our auditor’s report.
Our opinions on the Consolidated Financial Statements and on the Group Management’s Report do not cover the other information, and consequently we do not express an opinion or any other form of assurance conclusion thereon.
In connection with our audit, our responsibility is to read the other information and, in so doing, to consider whether the other information – Is materially inconsistent with the Consolidated Financial Statements, with the Group Management’s Report or our knowledge obtained in the audit, or
– Otherwise appears to be materially misstated.

166 Consolidated Financial Statements BASF Report 2017
Independent Auditor’s Report^1
In accordance with our engagement, we performed a separate audit of the nonfinancial statement. For the type, scope and results of this audit, please refer to our audit report dated February 21, 2018.
Responsibilities of the Board of Executive Directors and the Supervisory Board for the Consolidated Financial Statements and the Group Management’s ReportBoard of Executive Directors is responsible for the preparation of the Consolidated Financial Statements that comply, in all material respects, with IFRSs as adopted by the EU, the additional requirements of German commercial law pursuant to Section 315e (1) HGB and full IFRS and that the Con-solidated Financial Statements, in compliance with these requirements, give a true and fair view of the assets, liabilities, financial position, and financial performance of the Group. In addition, the Board of Executive Directors is responsible for such internal control as they have determined necessary to enable the preparation of Consolidated Financial Statements that are free from material misstatement, whether due to fraud or error.
In preparing the Consolidated Financial Statements, the Board of Executive Directors is responsible for assessing the Group’s ability to continue as a going concern. They also have the responsibility for disclosing, as applicable, matters related to going concern. In addition, they are responsible for financial reporting based on the going concern basis of accounting unless there is an intention to liquidate the Group or to cease operations, or there is no realistic alternative but to do so.
Furthermore, the Board of Executive Directors is responsible for the preparation of the Group Management’s Report that, as a whole, provides an appropriate view of the Group’s position and is, in all material respects, consistent with the Con-solidated Financial Statements, complies with German legal requirements, and appropriately presents the opportunities and risks of future development. In addition, the Board of Executive Directors is responsible for such arrangements and measures (systems) as they have considered necessary to enable the preparation of a Group Management’s Report that is in accordance with the applicable German legal require-ments, and to be able to provide sufficient appropriate evi-dence for the assertions in the Group Management’s Report.
The supervisory board is responsible for overseeing the Group’s financial reporting process for the preparation of the Consolidated Financial Statements and of the Group Management’s Report.
Auditor’s Responsibilities for the Audit of the Con-solidated Financial Statements and of the Group Management’s Report Our objectives are to obtain reasonable assurance about whether the Consolidated Financial Statements as a whole are free from material misstatement, whether due to fraud or error, and whether the Group Management’s Report as a whole provides an appropriate view of the Group’s position and, in all material respects, is consistent with the Consolidated Finan-cial Statements and the knowledge obtained in the audit, complies with the German legal requirements and appropri-ately presents the opportunities and risks of future develop-ment, as well as to issue an auditor’s report that includes our opinions on the Consolidated Financial Statements and on the Group Management’s Report.
Reasonable assurance is a high level of assurance, but is not a guarantee that an audit conducted in accordance with Section 317 HGB and the EU Audit Regulation and in compli-ance with German Generally Accepted Standards for Financial Statement Audits promulgated by the Institut der Wirtschafts-prüfer (IDW) will always detect a material misstatement. Misstatements can arise from fraud or error and are consid-ered material if, individually or in the aggregate, they could reasonably be expected to influence the economic decisions of users taken on the basis of these Consolidated Financial Statements and this Group Management’s Report. We exercise professional judgment and maintain professional skepticism throughout the audit. We also: – Identify and assess the risks of material misstatement of the Consolidated Financial Statements and of the Group Management’s Report, whether due to fraud or error, design and perform audit procedures responsive to those risks, and obtain audit evidence that is sufficient and appropriate to provide a basis for our opinions. The risk of not detecting a material misstatement resulting from fraud is higher than for one resulting from error, as fraud may involve collusion, forgery, intentional omissions, misrepresentations, or the override of internal control.
– Obtain an understanding of internal control relevant to the audit of the Consolidated Financial Statements and of arrangements and measures (systems) relevant to the audit of the Group Management’s Report in order to design audit procedures that are appropriate in the circumstances, but not for the purpose of expressing an opinion on the effectiveness of these systems.
– Evaluate the appropriateness of accounting policies used by the Board of Executive Directors and the reasonableness of estimates made by the Board of Executive Directors and related disclosures.
– Conclude on the appropriateness of the Board of Executive Directors’ use of the going concern basis of accounting and, based on the audit evidence obtained, whether a material uncertainty exists related to events or conditions that may cast significant doubt on the Group’s ability to continue as a

BASF Report 2017 Consolidated Financial Statements
Independent Auditor’s Report^1 167
going concern. If we conclude that a material uncertainty exists, we are required to draw attention in the auditor’s report to the related disclosures in the Consolidated Financial Statements and in the Group Management’s Report or, if such disclosures are inadequate, to modify our respective opinions. Our conclusions are based on the audit evidence obtained up to the date of our auditor’s report. However, future events or conditions may cause the Group to cease to be able to continue as a going concern.
– Evaluate the overall presentation, structure and content of the Consolidated Financial Statements, including the disclo-sures, and whether the Consolidated Financial Statements present the underlying transactions and events in a manner that the Consolidated Financial Statements give a true and fair view of the assets, liabilities, financial position and finan-cial performance of the Group in compliance with IFRSs as adopted by the EU, the additional requirements of German commercial law pursuant to Section 315e (1) HGB and full IFRS.
– Obtain sufficient appropriate audit evidence regarding the financial information of the entities or business activities within the Group to express opinions on the Consolidated Financial Statements and on the Group Management’s Report. We are responsible for the direction, supervision and performance of the group audit. We remain solely responsi-ble for our opinions.
– Evaluate the consistency of the Group Management’s Report with the Consolidated Financial Statements, its conformity with law, and the view of the Group’s position it provides.
– Perform audit procedures on the prospective information presented by the Board of Executive Directors in the Group Management’s Report. On the basis of sufficient appropriate audit evidence we evaluate, in particular, the significant assumptions used by the Board of Executive Directors as a basis for the prospective information, and evaluate the prop-er derivation of the prospective information from these assumptions. We do not express a separate opinion on the prospective information and on the assumptions used as a basis. There is a substantial unavoidable risk that future events will differ materially from the prospective information.
We communicate with the audit committee regarding, among other matters, the planned scope and timing of the audit and significant audit findings, including any significant deficiencies in internal control that we identify during our audit. We also provide the audit committee with a statement that we have complied with the relevant independence requirements, and communicate with them all relationships and other mat-ters that may reasonably be thought to bear on our indepen-dence, and where applicable, the related safeguards.
From the matters communicated with the audit committee, we determine those matters that were of most significance in the audit of the Consolidated Financial Statements of the current period and are therefore the key audit matters. We describe these matters in our auditor’s report unless law or regulation precludes public disclosure about the matter.
Other legal and regulatory requirements
Further information pursuant to Article 10 of the EU Audit RegulationWe were elected as group auditor by the annual general meet-ing on May 12, 2017. We were engaged by the Chairwoman of the audit committee on July 24, 2017. We have been the group auditor of BASF SE without interruption since the finan-cial year 2006.
We declare that the opinions expressed in this auditor’s report are consistent with the additional report to the audit committee pursuant to Article 11 of the EU Audit Regulation (long-form audit report).
German public auditor responsible for the engagement
The German public auditor responsible for the engagement is Alexander Bock.
Frankfurt am Main, February 21, 2018
KPMG AGWirtschaftsprüfungsgesellschaft[Original German version signed by:]
Ingmar Rega Wirtschaftsprüfer[German Public Auditor]
Alexander BockWirtschaftsprüfer[German Public Auditor]

168 Consolidated Financial Statements BASF Report 2017
Statement of income
Statement of incomeBASF Group
Statement of income (million €)
Explanations in Note 2017 2016
Sales revenue [4] 64,475 57,550
Cost of sales [6] (43,929) (39,265)
Gross profit on sales 20,546 18,285
Selling expenses [6] (8,262) (7,764)
General administrative expenses [6] (1,412) (1,337)
Research and development expenses [6] (1,888) (1,863)
Other operating income [7] 1,916 1,780
Other operating expenses [8] (2,949) (3,133)
Income from companies accounted for using the equity method [9] 571 307
Income from operations [4] 8,522 6,275
Income from other shareholdings 31 54
Expenses from other shareholdings (60) (71)
Net income from shareholdings (29) (17)
Interest income 226 179
Interest expenses (560) (661)
Interest result (334) (482)
Other financial income 70 97
Other financial expenses (429) (478)
Other financial result (359) (381)
Financial result [10] (722) (880)
Income before taxes and minority interests 7,800 5,395
Income taxes [11] (1,448) (1,140)
Income before minority interests 6,352 4,255
Minority interests [12] (274) (199)
Net income 6,078 4,056
Earnings per share (€) [5] 6.62 4.42
Dilution effect (€) [5] (0.01) (0.01)
Diluted earnings per share (€) [5] 6.61 4.41

BASF Report 2017 Consolidated Financial Statements
Statement of income and expense recognized in equity 169
Statement of income and expense recognized in equityBASF Group
Statement of comprehensive income1 (million €)
2017 2016
BASF GroupShareholders
of BASF SEMinority interests BASF Group
Shareholders of BASF SE
Minority interests
Income before minority interests 6,352 6,078 274 4,255 4,056 199
Remeasurement of defined benefit plans2 1,064 1,064 – (1,839) (1,839) –
Deferred taxes for gains/losses that cannot be reclassified (320) (320) – 553 553 –
Gains/losses that cannot be reclassified after taxes from equity-accounted shareholdings 9 9 – (3) (3) –
Gains/losses that cannot be reclassified 753 753 – (1,289) (1,289) –
Unrealized gains/losses from fair value changes in available-for-sale securities 6 6 – 9 9 –
Reclassifications of realized gains/losses recognized in the income statement – – – – – –
Fair value changes in available-for-sale securities, net3 6 6 – 9 9 –
Unrealized gains/losses from cash flow hedges (48) (48) – (17) (17) –
Reclassifications of realized gains/losses recognized in the income statement 99 99 – (51) (51) –
Cash flow hedges, net3 51 51 – (68) (68) –
Unrealized gains/losses from currency translation (2,051) (1,964) (87) 758 747 11
Deferred taxes for gains/losses that can be reclassified 12 12 – 8 8 –
Gains/losses that can be reclassified after taxes from equity-accounted shareholdings (126) (126) – 100 100 –
Gains/losses that can be reclassified (2,108) (2,021) (87) 807 796 11
Other comprehensive income after taxes (1,355) (1,268) (87) (482) (493) 11
Comprehensive income 4,997 4,810 187 3,773 3,563 210
1 For more information on other comprehensive income, see Note 20 on page 210 2 For more information, see Note 22, “Provisions for pensions and similar obligations,” from page 211 onward 3 For more information, see Note 27, “Supplementary information on financial instruments,” from page 222 onward
Development of income and expense recognized in equity of shareholders of BASF SE (million €)
Other comprehensive income
Remeasure- ment of defined
benefit plans
Foreign currency
translation adjustment
Measurement of securities at fair value
Cash flow hedges
Total income and expense
recog nized in equity
As of January 1, 2017 (5,373) 1,476 32 (149) (4,014)
Additions 1,073 (2,109) 8 68 (960)
Releases − − − − −
Deferred taxes (320) 28 (1) (15) (308)
As of December 31, 2017 (4,620) (605) 39 (96) (5,282)
As of January 1, 2016 (4,084) 652 20 (109) (3,521)
Additions (1,842) 835 14 (61) (1,054)
Releases − − − − −
Deferred taxes 553 (11) (2) 21 561
As of December 31, 2016 (5,373) 1,476 32 (149) (4,014)

170 Consolidated Financial Statements BASF Report 2017
Balance sheet
Balance sheetBASF Group
Assets (million €)
Explanations in Note Dec. 31, 2017 Dec. 31, 2016
Intangible assets [14] 13,594 15,162
Property, plant and equipment [15] 25,258 26,413
Investments accounted for using the equity method [16] 4,715 4,647
Other financial assets [16] 606 605
Deferred tax assets [11] 2,118 2,513
Other receivables and miscellaneous assets [18] 1,332 1,210
Noncurrent assets 47,623 50,550
Inventories [17] 10,303 10,005
Accounts receivable, trade [18] 11,190 10,952
Other receivables and miscellaneous assets [18] 3,105 3,078
Marketable securities 52 536
Cash and cash equivalents1 [1] 6,495 1,375
Current assets 31,145 25,946
Total assets 78,768 76,496
Equity and liabilities (million €)
Explanations in Note Dec. 31, 2017 Dec. 31, 2016
Subscribed capital [19] 1,176 1,176
Capital surplus [19] 3,117 3,130
Retained earnings [19] 34,826 31,515
Other comprehensive income [20] (5,282) (4,014)
Equity of shareholders of BASF SE 33,837 31,807
Minority interests [21] 919 761
Equity 34,756 32,568
Provisions for pensions and similar obligations [22] 6,293 8,209
Other provisions [23] 3,478 3,667
Deferred tax liabilities [11] 2,731 3,317
Financial indebtedness [24] 15,535 12,545
Other liabilities [24] 1,095 873
Noncurrent liabilities 29,132 28,611
Accounts payable, trade 4,971 4,610
Provisions [23] 3,229 2,802
Tax liabilities [11] 1,119 1,288
Financial indebtedness [24] 2,497 3,767
Other liabilities [24] 3,064 2,850
Current liabilities 14,880 15,317
Total equity and liabilities 78,768 76,496
1 For a reconciliation of the amounts in the statement of cash flows with the balance sheet item “cash and cash equivalents,” see page 171

BASF Report 2017 Consolidated Financial Statements
Statement of cash flows 171
Statement of cash flowsBASF Group
Statement of cash flows1 (million €)
2017 2016
Net income 6,078 4,056
Depreciation and amortization of intangible assets, property, plant and equipment and financial assets 4,213 4,291
Changes in inventories (915) (182)
Changes in receivables (870) (640)
Changes in operating liabilities and other provisions 618 926
Changes in pension provisions, defined benefit assets and other items (227) (547)
Gains (–) / losses (+) from disposal of noncurrent assets and securities (112) (187)
Cash provided by operating activities 8,785 7,717
Payments made for property, plant and equipment and intangible assets (3,996) (4,145)
Payments made for financial assets and securities (748) (1,389)
Payments made for acquisitions (150) (2,828)
Payments received for divestitures 177 664
Payments received from the disposal of noncurrent assets and securities 759 1,208
Cash used in investing activities (3,958) (6,490)
Capital increases/repayments and other equity transactions 19 28
Additions to financial and similar liabilities 8,572 7,533
Repayment of financial and similar liabilities (5,324) (6,954)
Dividends paid
To shareholders of BASF SE (2,755) (2,664)
minority shareholders (118) (103)
Cash provided by/used in financing activities 394 (2,160)
Net changes in cash and cash equivalents 5,221 (933)
Change in cash and cash equivalents
From foreign exchange rates (110) 66
changes in scope of consolidation 9 1
Cash and cash equivalents at the beginning of the year 1,375 2,241
Cash and cash equivalents at the end of the year 6,495 1,375
1 More information on the statement of cash flows can be found in the Management’s Report (Financial Position) on page 59.Other information on cash flows can be found in Note 29 on page 229.

172 Consolidated Financial Statements BASF Report 2017
Statement of equity
Statement of equityBASF Group
Statement of equity1 (million €)
Number of shares
outstandingSubscribed
capitalCapital surplus
Retained earnings
Other com-prehensive
income2
Equity of share-
holders of BASF SE
Minority interests Equity
As of January 1, 2017 918,478,694 1,176 3,130 31,515 (4,014) 31,807 761 32,568
Effects of acquisitions achieved in stages − − − − − − − −
Dividend paid − − − (2,755) − (2,755) (118) 3 (2,873)
Net income − − − 6,078 − 6,078 274 6,352
Changes to income and expense recognized directly in equity − − − − (1,268) (1,268) (87) (1,355)
Changes in scope of consolidation and other changes − − (13) 4 (12) − (25) 89 64
As of December 31, 2017 918,478,694 1,176 3,117 34,826 (5,282) 33,837 919 34,756
As of January 1, 2016 918,478,694 1,176 3,141 30,120 (3,521) 30,916 629 31,545
Effects of acquisitions achieved in stages − − − − − − − −
Dividend paid − − − (2,664) − (2,664) (103) 3 (2,767)
Net income − − − 4,056 − 4,056 199 4,255
Changes to income and expense recognized directly in equity − − − − (493) (493) 11 (482)
Changes in scope of consolidation and other changes − − (11) 4 3 − (8) 25 17
As of December 31, 2016 918,478,694 1,176 3,130 31,515 (4,014) 31,807 761 32,568
1 For more information on the items relating to equity, see Notes 19 and 20 from page 209 onward 2 Details are provided in the table “Income and expense recognized in equity” on page 169. 3 Including profit and loss transfers 4 Granting of BASF shares under the BASF share program “plus”

BASF Report 2017 Consolidated Financial Statements
Notes — Policies and scope of consolidation173
Policies and scope of consolidation
1 Summary of accounting policies
1.1 General informationBASF SE (registered at the district trade register, or Amts gericht, for Ludwigshafen am Rhein, number HRB 6000) is a publicly listed corporation headquartered in Ludwigshafen am Rhein, Germany. Its official address is Carl-Bosch-Str. 38, 67056 Ludwigs hafen am Rhein, Germany. The Consolidated Financial Statements of BASF SE as of December 31, 2017 have been prepared in accordance with the International Financial Reporting Standards (IFRS) of the International Accounting Standards Board (IASB) and section 315a (1) of the German Commercial Code (HGB). IFRSs are generally only applied after they have been endorsed by the European Union. For the 2017 fiscal year, all of the binding IFRSs and pronouncements of the International Financial Reporting Interpretations Committee (IFRIC) were applied. The Consolidated Financial Statements are presented in euros. All amounts, including the figures for previous years, are given in million euros unless otherwise indicated. The individual financial statements of the consolidated companies are prepared as of the balance sheet date of the Consolidated Financial Statements. The accounting policies applied are largely the same as those used in 2016, with the exception of any changes arising from the application of new or revised standards. In its meeting on February 19, 2018, the Board of Execu-tive Directors prepared the Consolidated Financial Statements, submitted them to the Supervisory Board for review and approval, and released them for publication.
1.2 Changes in accounting principles
Accounting policies applied for the first time in 2017
Amendments to IAS 7 – Disclosure Initiative The amendments aim to improve the information provided about changes to an entity’s liabilities arising from financing activities. They specify that an entity must disclose changes to financial liabilities and related financial assets for which payments received and payments made are shown under cash provided by/used in financing activities in the statement of cash flows.
For reconciliation reporting, see Note 29 from page 229 onward
Amendments to IAS 12 – Recognition of deferred tax assets for unrealized losses The amendments to IAS 12 mainly aim to clarify how to account for deferred tax assets for unrealized losses related to assets measured at fair value. The application of the amend-ments has no material effect on BASF.
Annual Improvements to IFRSs (2014–2016): Three IFRSs were amended in the Annual Improvements to IFRSs (2014– 2016), of which only the following had to be applied in 2017: In IFRS 12, it was clarified that disclosures pursuant to IFRS 12 generally also apply to an entity’s interests in subsidiaries, joint ventures and associated companies that are classified as held for sale in accordance with IFRS 5, with the exception of the disclosures outlined in IFRS 12.B10–B16 (Financial Informa-tion). The clarification is not expected to have any material effect on BASF.
IFRSs and IFRICs not yet to be considered
The effects on the BASF Group financial statements of the IFRSs and IFRICs not yet in force or not yet endorsed by the European Union in 2017 were reviewed and are explained below.
IFRS 9 – Financial InstrumentsThe IASB published the final version of IFRS 9 – Financial Instruments on July 24, 2014. IFRS 9 contains new require-ments for the classification and measurement of financial instruments, fundamental changes regarding the accounting treatment of impairments of certain assets, and a revised a pproach to hedge accounting. The European Union endorsed the standard on November 29, 2016. First-time adoption of IFRS 9 is effective in the first business year beginning on or after January 1, 2018. Consequently, BASF will apply IFRS 9 for the first time as of January 1, 2018. IFRS 9 retains “amortized cost” and “fair value” as measurement paradigms for financial instruments, and continues to differentiate between changes in fair value recog-nized through profit or loss or other comprehensive income. Whether financial assets are measured at amortized cost or fair value will depend on the business model for managing financial asset portfolios, and on the cash flow condition (the solely payments of principle and interest criterion), that is, the contractual cash flow characteristics of an individual financial asset.
Notes

174 Consolidated Financial Statements BASF Report 2017
Notes — Policies and scope of consolidation
In the future, impairments are to be recognized for financial assets not measured at fair value through profit or loss considering expected credit losses based on the change in the default risk of the counterparties. The impairment approach generally adopts a three-stage model to calculate impairment losses. A simplified approach, which applies to certain financial instruments such as trade accounts receivable, uses a two-stage model to assess impairment losses. IFRS 9 also contains new requirements for the application of hedge accounting to better present an entity’s risk manage-ment activities, in particular with respect to the management of nonfinancial risks. The new requirements for classification and measurement can also have an impact on the accounting treatment of other shareholdings, which must be measured only at fair value in accordance with IFRS 9.B5.2.3 in the future. With the introduction of the cash flow condition in IFRS 9, which must be considered in the classification of financial assets, it could happen that financial assets measured at amortized cost or at fair value through other comprehensive income according to IAS 39 are to be recognized at fair value through profit or loss in the future. At BASF, this will mainly impact securities that are currently classified as available-for-sale financial assets and thus measured at fair value through other comprehensive income. In the future, expected losses on trade accounts receiv-able at BASF will largely be calculated on the basis of internal or external customer ratings and the associated probability of default. Furthermore, the new impairment model is also to be used for further financial instruments, which are not recognized at fair value through profit or loss, such as bank deposits, loan receivables and miscellaneous receivables. Internal and exter-nal ratings for the respective counterparties will also be used as a basis for calculating impairments. Since individual valua-tion allowances were not calculated for the above assets under IAS 39, the first-time adoption of IFRS 9 will lead to additional impairments. With regard to new hedge accounting regulations, BASF assumes that, in principle, all existing hedge accounting relationships can be continued under IFRS 9. In the future, BASF will measure material other sharehold-ings at fair value in accordance with IFRS 9. This is not expected to lead to a material implementation effect. The first-time adoption of IFRS 9 will take place using the modified retrospective method. BASF expects that this will result in a reduction of equity between €30 million and €40 mil-lion, which will be immediately recognized in equity on Janu-ary 1, 2018. This is primarily due to the recognition of impairments to trade accounts receivable. The expected impact constitutes an estimate, which can deviate from the actual impact.
IFRS 15 – Revenues from Contracts with CustomersThe IASB published the new standard on revenue recognition, IFRS 15, on May 28, 2014. The endorsement by the European Union was issued in the third quarter of 2016. The standard particularly aims to standardize existing regulations and thus improve transparency and comparability of financial informa-tion. According to IFRS 15, sales revenue is recognized when control of the agreed-upon goods or services and the benefits obtainable from them are transferred to the customer. Sales revenue is measured at the amount the entity expects to receive in exchange for goods and services. The rules and definitions of IFRS 15 supersede the content of IAS 11, IAS 18, and IFRIC 13. The new standard will be effective for reporting periods beginning on or after January 1, 2018. The potential impact of the new standard, including the subseqent clarifica-tions adopted, on BASF’s net assets, financial position and results of operations, was assessed. For this purpose, a Group- wide analysis was conducted. Its analysis revealed that the balance sheet presentation of sales revenue from licenses, which is realized over a period of time, will change under IFRS 15. This is currently accounted for as deferred income. Under IFRS 15, this will be presented in a new balance sheet item, contract liabilities. A reclassi-fication of approximately €100 million is expected as of Janu-ary 1, 2018 in connection with the transition to IFRS 15. Based on its analyses, BASF does not expect any further material effects on its results of operations or net assets. IFRS 15 will have a minor impact on BASF, as contracts with customers of BASF generally only give rise to a single performance obligation in each case, which is to be fulfilled at a certain point in time. BASF will apply IFRS 15 for the first time from January 1, 2018. The modified retrospective method will be used for first-time adoption. The introduction of the new standard will lead to changes in the balance sheet in the form of the new balance sheet items “contract assets” and “contract liabilities,” as well as additional quantitative and qualitative disclosures in the notes.
IFRS 16 – LeasesThe IASB published the new standard on leasing, IFRS 16, on January 13, 2016. The rules and definitions of IFRS 16 super-sede the content of IAS 17, IFRIC 4, SIC 15 and SIC 27. The standard requires an accounting model for a lessee that recognizes all right-of-use assets and liabilities from lease agreements in the balance sheet, unless the term is twelve months or less or the underlying asset is of low value (up to $5,000). As for the lessor, the new standard substantially carries forward the accounting requirements of IAS 17 – Leases. The European Union endorsed the new standard in the fourth quarter of 2017. The new standard will be effective for report-ing periods beginning on or after January 1, 2019. BASF does not plan on an early adoption of these amendments.

BASF Report 2017 Consolidated Financial Statements
Notes — Policies and scope of consolidation175
BASF has started to analyze the potential effects on its Consolidated Financial Statements and plans to make use of the practical expedients. However, it is assumed that a signifi-cant number of leasing agreements that today represent operating leases are to be reported in the balance sheet. As well as increasing BASF’s total assets, the type of expenses associated with operating leases will change, as IFRS 16 replaces the straight-line expenses for operating leases with a depreciation charge for right-of-use assets and interest expenses on liabilities arising from the lease. BASF plans to recognize the adjustments arising from the transition to IFRS 16 using the modified retrospective method as a cumu-lative effect directly in other retained earnings as of Janu-ary 1, 2019 without a restatement of comparative information.
For more information on leasing, see Note 28 from page 228 onward
Annual Improvements to IFRSs (2014–2016): Three IFRSs were amended in the Annual Improvements to IFRSs (2014– 2016) of which both the following amendments are mandatory as of January 1, 2018: In IAS 28, it was clarified that the elec-tion to measure an investment in an associated company or a joint venture held by an entity that is a venture capital organization or other qualifying entity, can be exercised on an investment-by-investment basis. The short-term exemptions in IFRS 1, Appendix E (IFRS 1.E3–E7) for first-time IFRS users were deleted. The amendments were endorsed by the European Union in the first quarter of 2018. They are not expected to have any material effect on BASF.
Amendments to IAS 28 – Long-term interests in asso-ciates and joint venturesOn October 12, 2017, the IASB published amendments to IAS 28 on long-term interests in associated companies and joint ventures. These amendments clarify that IFRS 9 is to be applied to long-term interests in associated companies or joint ventures that are not accounted for using the equity method. The amendment – subject to E.U. endorsement – is man-datory as of January 1, 2019. The effects are explained under IFRS 9 – Financial Instruments in Note 1.2: Changes in accounting principles.
The IASB issued further amendments to standards and interpretations whose application is not yet mandatory and is still subject to E.U. endorsement. These amendments are unlikely to have a material impact on the reporting of BASF SE. BASF does not plan on early adoption of these amendments.
Amendments to IFRS 10 and IAS 28 – Sale or Contribu-tion of Assets between an Investor and its Associate or Joint VentureThe IASB issued amendments to IFRS 10 and IAS 28 on September 11, 2014. The amendments address a known inconsistency between the requirements of IFRS 10 and IAS 28 (2011) in the case of the sale of an asset to an associated company or a joint venture or the contribution of an asset to an associated company or a joint venture. IASB has postponed the effective date of the changes indefinitely.
Amendments to IFRS 2 – Classification and Measure-ment of Share-Based Payment Transactions: The amendments involve a number of individual issues pertain-ing to the accounting of cash-settled share-based payment transactions. The amendments relate to the calculation of fair value of obligations arising from share-based payment transactions. The amendments are – pending E.U. endorse-ment – to be applied to compensation granted or changed in business years beginning on or after January 1, 2018.
Amendments to IFRS 9 – Financial assets with a prepay-ment feature with negative compensation: The amendments pertain to a limited adjustment of the relevant criteria for the classification of financial assets. Financial assets with a prepayment feature with negative compensation may be recognized under certain conditions at amortized cost or at fair value through other comprehensive income instead of at fair value through profit and loss. The amendments are – subject to E.U. endorsement – effective on January 1, 2019.
Supplementary information on IFRIC 22 – Foreign Cur-rency Transactions and Advance Consideration: IFRIC 22 addresses an application question for IAS 21 – The Effects of Changes in Foreign Exchange Rates. It clarifies the point in time for determining the exchange rate used to translate for-eign-currency transactions containing advance payments that have been made or received. The underlying asset, income or expense is translated using the relevant exchange rate on the date on which the asset or liability resulting from the prepay-ment was first recognized. The interpretation is – pending E.U. endorsement – to be applied in the first reporting period of a business year beginning on or after January 1, 2018.

176 Consolidated Financial Statements BASF Report 2017
Notes — Policies and scope of consolidation
IFRIC 23 – Uncertainty over Income Tax Treatments: IFRIC 23 expands on the requirements in IAS 12 on how to account for uncertainties surrounding the income tax treat-ment of circumstances and transactions. IFRIC 23 is – subject to E.U. endorsement – effective for reporting periods beginning on or after January 1, 2019.
Annual Improvements to IFRSs (2015–2017): Four IFRSs were amended in the Annual Improvements to IFRSs (2015–2017). In IFRS 3, it was clarified that when a party to a joint arrangement obtains control of a business that is a joint oper-ation and had rights to the assets and obligations for the liabil-ities relating to that joint operation immediately before the acquisition date, the transaction is a business combination achieved in stages. The acquirer shall therefore apply the requirements for a business combination achieved in stages, including remeasuring its previously held interest in the joint operation. In IFRS 11, it was clarified that when an entity obtains joint control of a business that is a joint operation and had rights to the assets and obligations for the liabilities relating to that joint operation immediately before the acquisition date, the previ-ously held interest in that business is not to be remeasured. IAS 12 was amended to the extent that all income tax effects of dividend payments must be considered in the same way as the income on which the dividends are based. Finally, in IAS 23, it was determined that when entities borrow funds in general for the acquisition of qualifiying assets that those costs for borrowed capital specifically for the acquisition of qualifying assets should not be considered in the determination of the financing rate until their completion. The amendments are – subject to E.U. endorsement – to be applied for the first time in the reporting period beginning on or after January 1, 2019.
1.3 Group accounting principlesScope of consolidation: The scope of consolidation is based on the application of the standards IFRS 10 and 11. According to IFRS 10, a group consists of a parent entity and the subsidiaries controlled by the parent. “Control” of an investee assumes the simultaneous fulfillment of the following three criteria: – The parent company holds decision-making power over the relevant activities of the investee
– The parent company has rights to variable returns from the investee
– The parent company can use its decision-making power to affect the variable returns
Based on corporate governance and potential supplementary agreements, companies are analyzed for their relevant activities and variable returns, and the link between the vari-able returns and the extent to which their relevant activities could be influenced.
According to IFRS 11, which regulates the accounting of joint arrangements, a distinction must be made between joint ventures and joint operations. In the case of a joint venture, the parties that have joint control of a legally independent company have rights to the net assets of that arrangement. In joint operations, the parties that have joint control have direct rights to the assets and obligations for the liabilities relating to the arrangement. This requirement is particularly fulfilled if the production output of the joint arrangement is almost entirely transferred to the partners, through which the partners guarantee the joint arrangements’ ongoing financing. Companies whose corporate governance structures classify them as joint arrangements are analyzed to determine if they meet the criteria for joint ventures or joint operations as per IFRS 11. Should the arrangement be structured through a separate vehicle, its legal form, contractual arrangements and all other facts and circumstances are reviewed. In addition to BASF SE, the Consolidated Financial Statements include all material subsidiaries on a fully consoli-dated and all material joint operations on a proportionally consolidated basis. Companies whose business is dormant or of low volume, and are of minor importance for the presenta-tion of a true and fair view of the net assets, financial position and results of operations, are not consolidated, but rather are reported under other shareholdings. These companies are carried at amortized cost and are written down in the case of an impairment. The aggregate assets and equity of these companies amount to less than 1% of the corresponding value at the Group level. Joint ventures and associated companies are accounted for using the equity method in the Consolidated Financial Statements. Associated companies are entities in which significant influence can be exercised over their operating and financial policies and which are not subsidiaries, joint ventures or joint operations. In general, this applies to companies in which BASF has an investment of between 20% and 50%. Equity-accounted income is reported as part of income from operations (EBIT). Consolidation methods: Assets and liabilities of consoli-dated companies are uniformly recognized and measured in accordance with the principles described herein. For equity- accounted companies, material deviations in measurement resulting from the application of other accounting principles are adjusted for. Transactions between consolidated companies as well as intercompany profits resulting from trade between con soli-dated companies are eliminated in full; for joint operations, they are proportionally eliminated. Material intercompany profits related to companies accounted for using the equity method are eliminated.

BASF Report 2017 Consolidated Financial Statements
Notes — Policies and scope of consolidation177
Capital consolidation is conducted at the acquisition date according to the purchase method. Initially, all assets, liabilities and additional intangible assets that are to be capitalized are measured at fair value. Finally, the acquisition cost is compared with the proportional share of the net assets acquired at fair value. The resulting positive differences are capitalized as goodwill. Negative differences are reviewed once more, then recognized directly in the income statement. The incidental acquisition costs of a business combination are recognized in the income statement under other operating expenses. Foreign currency translations: The cost of assets acquired in foreign currencies and revenue from sales in foreign currencies are determined by the exchange rate on the date of the transaction. Foreign currency receivables and liabilities are valued at the exchange rates on the balance sheet date. Changes in assets and liabilities arising from foreign currency translation are recognized in the income statement, and reported under other operating expenses or income, other financial result, and in the case of available-for-sale financial assets, in other comprehensive income. Translation of foreign currency financial statements: The translation of foreign currency financial statements depends on the functional currency of the consolidated companies. For companies whose functional currency is not the euro, translation into the reporting currency is based on the closing rate method: Balance sheet items are translated into euros using closing rates on the balance sheet date; expenses and income are translated into euros at monthly average rates and accumulated for the year. The difference between a company’s translated equity at historical rates at the time of acquisition or retention and its equity at closing rates on the balance sheet date is reported separately in equity under other comprehensive income (translation adjustments) and is recognized in income only upon the company’s disposal. For certain companies outside the eurozone or U.S. dollar zone, the euro or U.S. dollar is the functional currency. In such cases, the translation into the functional currency of financial statements prepared in the local currency is done according to the temporal method: All nonmonetary assets and related depreciation and amortization as well as equity are translated at the exchange rate applying to the respective transactions. All other balance sheet items are translated using closing rates on the balance sheet date; other expenses and income are translated at monthly average rates. The resulting translation differences are recognized in the income statement under other operating income or expenses. If necessary, financial statements in the functional currency are translated into the presentation currency according to the closing rate method.
Selected exchange rates (€1 equals)
Closing rates Average rates
Dec. 31, 2017
Dec. 31, 2016
2017
2016
Brazil (BRL) 3.97 3.43 3.60 3.86
China (CNY) 7.80 7.32 7.63 7.35
Great Britain (GBP) 0.89 0.86 0.88 0.82
Japan (JPY) 135.01 123.40 126.68 120.20
Malaysia (MYR) 4.85 4.73 4.85 4.58
Mexico (MXN) 23.66 21.77 21.32 20.67
Norway (NOK) 9.84 9.09 9.33 9.29
Russia (RUB) 69.39 64.30 65.92 74.14
Switzerland (CHF) 1.17 1.07 1.11 1.09
South Korea (KRW) 1,279.61 1,269.36 1,276.52 1,284.18
United States (USD) 1.20 1.05 1.13 1.11
1.4 Accounting policies
Revenue recognition
Revenues from the sale of goods or the rendering of services are recognized upon the transfer of ownership and risk to the buyer. They are measured at the fair value of the consideration received. Sales revenues are reported without consumption taxes. Expected rebates and other trade discounts are ac-crued or deducted. Provisions are recognized according to the principle of individual measurement to cover probable risks related to the return of products, future warranty obligations and other claims. Revenues from the sale of precious metals to industrial customers are recognized at the time of shipment and the corresponding purchase prices are recorded at cost of sales. In the trading of precious metals and their derivatives with broker-traders, where there is usually no physical delivery, revenues are netted against their corresponding costs. Revenues from marketing the natural gas from the Yuzhno Russkoye gas field are treated in the same manner. Income relating to the sale or licensing of technologies or technological expertise are recognized in the income state-ment according to the contractually agreed-upon transfer of the rights and obligations associated with those technologies.
Assets
Acquired intangible assets (excluding goodwill) with defined useful lives are generally measured at cost less straight-line amortization. The useful life is determined using the period of the underlying contract or the period of time over which the intangible asset can be expected to be used.

178 Consolidated Financial Statements BASF Report 2017
Notes — Policies and scope of consolidation
Impairments are recognized if the recoverable amount of the asset is lower than the carrying amount. The recoverable amount is the higher of either fair value less costs to sell or the value in use. The value in use is determined on the basis of future cash inflows and outflows, and the weighted average cost of capital after taxes, depending on tax rates and country-related risks. If the reasons for an impairment no longer exist, the write-downs are reversed up to the value of the asset, had an impairment not been recognized. Depending on the type of intangible asset, amortization is reported under cost of sales, selling expenses, research and development expenses or other operating expenses. Intangible assets with indefinite useful lives are trade names and trademarks that have been acquired as part of acquisitions. These are measured at cost and tested for impairment annually, or if there is an indication that their value has declined. Internally generated intangible assets primarily com-prise internally developed software. Such software and other internally generated assets are measured at cost and amortized over their estimated useful lives. Impairments are recognized if the carrying amount of an asset exceeds the recoverable amount. In addition to those costs directly attributable to the asset, costs of internally generated intangi-ble assets also include an appropriate portion of overhead costs. The estimated useful lives and amortization methods of intangible assets are based on historical values, plans and estimates. The weighted average amortization periods of intangible assets amounted to:
Average amortization in years
2017 2016
Distribution, supply and similar rights 15 14
Product rights, licenses and trademarks 20 19
Know-how, patents and production technologies 15 14
Internally generated intangible assets 4 4
Other rights and values 5 5
Emission rights: Emission right certificates, granted free of charge by the German Emissions Trading Authority (Deutsche Emissionshandelsstelle) or a similar authority in other coun-tries, are recognized on the balance sheet with a value of zero. Certificates purchased on the market are capitalized at cost as intangible assets. Emissions generated create an obligation to surrender the emission certificates. Emission certificates purchased on the market are subsequently measured at fair value, up to a maximum of the amount of the acquisition costs. If the fair value is lower than the carrying amount on the balance sheet date, the emission rights are impaired.
Goodwill is only written down if there is an impairment. Impairment testing takes place once a year and whenever there is an indication of an impairment. Impairment reversals are not conducted for goodwill. Property, plant and equipment are measured at cost less depreciation and impairment over their useful lives. The revaluation method is not applied. Low-value assets are fully written off in the year of acquisition. The cost of self-constructed plants includes direct costs, appropriate allocations of material and production overhead costs, and a share of the general administrative costs of the divisions involved in the construction of the plants. Expenditures related to the scheduled maintenance of large-scale plants are separately capitalized and depreciated using the straight-line method over the period until the next planned turnaround. Costs for the replacement of components are recognized as assets when an additional future benefit is expected. The carrying amount of the replaced components is derecognized. Costs for maintenance and repair as part of normal business operations are recognized as an expense. Both movable and immovable fixed assets are for the most part depreciated using the straight-line method, with the exception of production licenses and plants in the Oil & Gas segment, which are primarily depreciated based on use in accordance with the unit of production method. The estimated useful lives and depreciation methods of property, plant and equipment are based on historical values, plans and estimates. The depreciation methods, useful lives and residual values are reviewed at each balance sheet date. The weighted average depreciation periods were as follows:
Weighted average depreciation in years
2017 2016
Buildings and structural installations 21 22
Machinery and technical equipment 10 10
Long-distance natural gas pipelines 25 25
Miscellaneous equipment and fixtures 6 7
Impairments are recognized if the recoverable amount of the asset is lower than the carrying amount. The measurement is based on fair value less costs to sell or the value in use. The value in use is determined on the basis of future cash inflows and outflows, and the weighted average cost of capital after taxes, depending on tax rates and country-related risks. An impairment is recognized for the difference between the carry-ing amount and the recoverable amount. If the reasons for an impairment no longer exist, the write-downs are reversed up to the value of the asset, had an impairment not been recognized.

BASF Report 2017 Consolidated Financial Statements
Notes — Policies and scope of consolidation179
Investment properties held to realize capital gains or rental income are immaterial. They are valued at the lower of fair value or acquisition cost less depreciation. Leases: A lease is an agreement whereby the lessor conveys to the lessee the right to use an asset for an agreed period of time in return for a payment or series of payments. Leasing contracts are classified as either finance or operating leases. Assets subject to operating leases are not capitalized. Lease payments are recognized in the income statement in the period they are incurred. A lease is classified as a finance lease if it substantially transfers all the risks and rewards related to the leased asset. Assets subject to a finance lease are capitalized at the lower of the fair value of the leased assets or the present value of the minimum lease payments. A leasing liability is recorded in the same amount. The periodic lease payments must be divided into principal and interest components. The principal compo-nent reduces the outstanding liability, while the interest component represents an interest expense. Depreciation takes place over the shorter of the useful life of the asset or the period of the lease. Leases can be embedded within other contracts. If sepa-ration is required under IFRS, then the embedded lease is recorded separately from its host contract and each component of the contract is carried and measured in accor-dance with the applicable regulations. Borrowing costs: Borrowing costs directly incurred as part of the acquisition, construction or production of a qualifying asset are capitalized as part of the acquisition or production cost of that asset. A qualifying asset is an asset for which the time period necessary to make it ready for its intended use or sale is longer than one year. Borrowing costs are capitalized up to the date the asset is ready for its intended use. The borrowing costs were calculated based on a rate of 2.0% (2016: 2.5%) and adjusted on a country-specific basis, if necessary. All other borrowing costs are recognized as an expense in the period in which they are incurred. Government grants: Government grants related to the acquisition or construction of property, plant and equipment reduce the acquisition or construction cost of the respective assets. Other government grants or government assistance are recognized immediately as other operating income or treated as deferred income and dissolved over the underlying period. Investments accounted for using the equity-method: The carrying amounts of these companies are adjusted annually based on the pro rata share of net income, dividends and other changes in equity. Should there be indications of a permanent reduction in the value of an investment, an impair-ment is recognized in the income statement.
Inventories are measured at acquisition cost or cost of conversion based on the weighted average method. If the market price or fair value of the sales product which forms the basis for the net realizable value is lower, then the sales products are written down to this lower value. The net realizable value is the estimated price in the ordinary course of business less the estimated costs of completion and the estimated selling costs. In addition to direct costs, cost of conversion includes an appropriate allocation of production overhead costs based on normal utilization rates of the production plants, provided that they are related to the production process. Pensions, social services and voluntary social benefits are also included, as well as allocations for administrative costs, provided they relate to the production. Borrowing costs are not included in cost of conversion. Inventories may be written down if the prices for the sales products decline, or in cases of a high rate of days sales of inventory (DSI). Write-downs on inventories are reversed if the reasons for them no longer apply. The exception made by IAS 2 for traders is applied to the measurement of precious metal inventories. Accordingly, inventories held exclusively for trading purposes are to be measured at fair value less costs to sell. All changes in value are recognized in the income statement. Deferred taxes: Deferred taxes are recorded for tempo-rary differences between the carrying amount of assets and liabilities in the financial statements and the carrying amounts for tax purposes as well as for tax loss carryforwards and unused tax credits. This also comprises temporary differences arising from business combinations, with the exception of goodwill. Deferred tax assets and liabilities are calculated using the respective country-specific tax rates applicable for the period in which the asset or liability is realized or settled. Tax rate changes enacted or substantively enacted on or before the balance sheet date are taken into consideration. Deferred tax assets are offset against deferred tax liabilities provided they are related to the same taxation authority and have the same maturities. Surpluses of deferred tax assets are only recognized provided that the tax benefits are likely to be realized. The valuation of deferred tax assets is based on the estimated probability of a reversal of the differences and the assessment of the ability to utilize tax loss carryforwards and unused tax credits. This depends on whether future taxable profits will exist during the period in which temporary differences are reversed and in which tax loss carryforwards and unused tax credits can be claimed. The valuation of deferred tax assets is based on internal projections of the future earnings of the particular Group company.

180 Consolidated Financial Statements BASF Report 2017
Notes — Policies and scope of consolidation
Changes in deferred taxes in the balance sheet are recorded as deferred tax expense or income if the underlying trans-action is not to be recognized directly in equity or in income and expenses recognized in equity. For those effects which have been recognized in equity, changes to deferred tax assets and tax liabilities are also recognized directly in equity. Deferred tax liabilities are recognized for differences between the proportional IFRS equity and the tax base of the investment in a consolidated subsidiary if a reversal of these differences is expected in the foreseeable future. Deferred tax liabilities are recognized for dividend distributions which are planned for the following year if these distributions lead to a reversal of temporary differences.
For more information, see Note 11 from page 198 onward
Financial instrumentsFinancial assets and financial liabilities are recognized in the balance sheet when the BASF Group becomes a party to a financial instrument. Financial assets are derecognized when the contractual rights to the cash flows from the financial asset expire or when the financial asset, with all risks and rewards of ownership, is transferred. Financial liabilities are derecognized when the contractual obligations expire, are discharged or cancelled. Regular-way purchases and sales of financial instruments are accounted for using the settlement date; in precious metals trading, the day of trading is used. The fair value of a financial instrument is the amount that would be received to sell an asset or paid to transfer a liability in an orderly transaction between market participants at the measurement date. When pricing on an active market is available, for example share prices, these are used as the basis for the measurement. Otherwise, the measurement is based on internal measurement models using current market parameters or external measurements, for example, from banks. These internal measurements predominantly use the net present value method and option pricing models. If there is objective evidence of a permanent impairment of a financial instrument that is not measured at fair value through profit or loss, an impairment loss is recognized. If the reason for the impairment of loans and receivables as well as held-to-maturity financial instruments no longer exists, the impairment is reversed up to the amortized cost and recog-nized in the income statement. Impairments on financial instruments are booked in separate accounts.
Financial assets and liabilities are divided into the following measurement categories: – Financial assets and liabilities at fair value recognized in the income statement consist of derivatives and other trading instruments. At BASF, this measurement category only includes derivatives. Derivatives are reported in other receivables and miscellaneous assets or other liabilities. BASF does not make use of the fair value option under IAS 39. The calculation of fair values is based on market parameters or measurement models based on such param-eters. In some exceptional cases, the fair value is calculated using parameters which are not observable on the market.
– Loans and receivables comprise financial assets with fixed or determinable payments, which are not quoted on an active market and are not derivatives or classified as avail-able-for-sale. This measurement category includes trade accounts receivable as well as other receivables and loans reported under other receivables and miscellaneous assets. Initial measurement is done at fair value, which generally matches the nominal value of the receivable or loan. Inter-est-free and low-interest long-term loans and receivables are recorded at present value. Subsequent measurement recognized in income is generally made at amortized cost using the effective interest method. If there is objective evidence for an impairment of a receiv-able or loan, an individual valuation allowance is made. When assessing the need for a valuation allowance, regional and sector-specific conditions are considered. In addition, use is made of internal and external ratings as well as the assessments of debt collection agencies and credit insurers, when available. A portion of receivables is covered by credit insurance. Bank guarantees and letters of credit are used to an insignificant extent. Valuation allowances are only recognized for those receivables which are not covered by insurance or other collateral. The valuation allowances for receivables whose insurance includes a deductible are not recognized in excess of the amount of the deductible. Write-downs are based on historical values relating to customer solvency and the age, period overdue, insurance policies and customer-specific risks. In addition, a valuation allowance must be recognized when the contractual condi-tions which form the basis for the receivable are changed through renegotiation in such a way that the present value of the future cash flows decreases. Furthermore, valuation allowances are made on receiv-ables based on transfer risks for certain countries. If, in a subsequent period, the amount of the valuation allowance decreases and the decrease can be related objectively to an event occurring after the valuation allowance was made, then it is reversed in the income statement. Reversals of valuation allowances may not exceed amortized cost. Loans and receivables are derecognized when they are definitively found to be uncollectible.

BASF Report 2017 Consolidated Financial Statements
Notes — Policies and scope of consolidation181
– Held-to-maturity financial assets consist of nonderivative financial assets with fixed or determinable payments and a fixed term, for which there is the ability and intent to hold until maturity, and which do not fall under other valuation categories. Initial measurement is done at fair value, which matches the nominal value in most cases. Subsequent measurement is carried out at amortized cost, using the effective interest method. For BASF, there are no material financial assets that fall under this category.
– Available-for-sale financial assets comprise financial assets which are not derivatives and do not fall under any of the previously stated valuation categories. This measure-ment category comprises shareholdings reported under the item other financial assets which are not accounted for using the equity method as well as short and long-term securities. The measurement is carried out at fair value. Changes in fair value are recognized directly in equity (other comprehen-sive income) and are only recognized in the income state-ment when the assets are disposed of or have been impaired. Subsequent reversals are recognized directly in equity (other comprehensive income). Only in the case of debt instru-ments, reversals are recognized in the income statement up to the amount of the original impairment; reversals above this amount are recognized directly in equity. If the fair value of available-for-sale financial assets decreases below acqui-sition costs, the assets are impaired if the decline in value is material and can be considered lasting. The fair values are determined using market prices. Shareholdings whose fair value cannot be reliably determined are carried at acquisition cost and are written down in the case of an impairment. When determining the value of these shareholdings, the acquisition costs constitute the best estimate of their fair value. This category of shareholdings includes investments in other shareholdings, provided that these shares are not publicly traded. There are no plans to sell significant shares in these shareholdings.
– Financial liabilities which are not derivatives are initially measured at fair value, which normally corresponds to the amount received. Subsequent measurement is carried out at amortized cost, using the effective interest method.
– Cash and cash equivalents consist primarily of cash on hand and bank balances with maturities of less than three months.
Income from interest-bearing assets is recognized on the outstanding receivables on the balance sheet date using interest rates calculated by means of the effective interest method. Dividends from shareholdings not accounted for using the equity method are recognized when the share-holders’ right to receive payment is established.
Derivative financial instruments can be embedded within other contracts. If IFRS requires separation, then the embedded derivative is accounted for separately from its host contract and measured at fair value. Financial guarantees of the BASF Group are contracts that require compensation payments to be made to the guarantee holder if a debtor fails to make payment when due under the terms of the financial guarantee. Financial guaran-tees given by BASF are measured at fair value upon initial recognition. In subsequent periods, financial guarantees are carried at the higher of amortized cost or the best estimate of the present obligation on the reporting date. Cash flow hedge accounting is applied in selected cases to hedge future transactions. The effective portion of the change in fair value of the derivative is thereby recognized directly in equity under other comprehensive income, taking deferred taxes into account. The ineffective portion is recog-nized immediately in the income statement. In the case of future transactions that will lead to a nonfinancial asset or a nonfinancial debt, the cumulative fair value changes in equity are either charged against the acquisition costs on initial recognition or recognized in profit or loss in the reporting period in which the hedged item is recorded in the income statement. For hedges based on financial assets or debts, the cumulative fair value changes of the hedges are transferred from equity to the income statement in the reporting period in which the hedged item is recognized in the income statement. The maturity of the hedging instrument is determined based on the effective date of the future transaction. When fair value hedges are used, the asset or liability is hedged against the risk of a change in fair value. Here, changes in the market value of the derivative financial instruments are recognized in the income statement. Furthermore, the carrying amount of the underlying transaction is adjusted by the profit or loss resulting from the hedged risk, offsetting the effect in the income statement.
Other comprehensive income
The expenses and income shown in other comprehensive income are divided into two categories: Items that will be recognized in the income statement in the future (known as “recycling”) and items that will not be reclassified to the income statement in the future. The first category includes translation adjustments, the measurement of securities at fair value, and changes in the fair value of derivatives held to hedge future cash flows and net investments in a foreign operation. Items in other comprehensive income that will not be reclassified to the income statement at a future date include effects from the remeasurement of defined benefit plans.

182 Consolidated Financial Statements BASF Report 2017
Notes — Policies and scope of consolidation
Debt
Provisions for pensions and similar obligations: Provisions for pensions are based on actuarial computations made according to the projected unit credit method. In doing so, assumptions for valuation parameters include: future develop-ments in compensation, pensions and inflation, employee turnover and the life expectancy of beneficiaries. The resulting obligations are discounted on the balance sheet date using the market yields on high-quality corporate fixed-rate bonds with a minimum of one AA rating. Similar obligations, especially those arising from commitments by North American Group companies to pay the healthcare costs and life insurance premiums of retired staff and their dependents, are reported under provisions for similar obligations. The calculation of pension provisions is based on actuarial reports. Actuarial gains and losses from changes in estimates relating to the actuarial assumptions used to calculate defined benefit obligations, the difference between standardized and actual returns on plan assets, as well as the effects of the asset ceiling are recognized directly in equity as other comprehensive income.
For more information on provisions for pensions and similar obligations, see Note 22 from page 211 onward
Other provisions: Other provisions are recognized when there is a present obligation as a result of a past event and when there is a probable outflow of resources whose amount can be reliably estimated. Provisions are recognized at the probable settlement value. Provisions for German trade income tax, German corpo-rate income tax and similar income taxes are determined and recognized in the amount necessary to meet the expected payment obligations less any prepayments that have been made. Other taxes to be assessed are considered accord-ingly. Provisions are established for certain environmental protection measures and risks if there exists a present legal or constructive obligation arising from a past event, and the expected cash outflow can be estimated with sufficient reliability. Provisions for restoration obligations primarily concern the filling of wells and the removal of production facilities upon the termination of production in the Oil & Gas segment. When the obligation arises, the provision is measured at the present value of the future restoration costs. An asset is capitalized for the same amount as part of the carrying amount of the plant concerned and is depreciated along with the plant. The discount on the provision is unwound annually until the time of the planned restoration.
In addition, other provisions also cover expected costs for rehabilitating contaminated sites, recultivating landfills, removal of environmental contamination from existing production or storage sites and similar measures. If BASF is the only responsible party that can be identified, the provision covers the entire expected claim. At sites operated together with one or more partners, the provision generally covers only BASF’s share of the expected claim. The determination of the amount of the provision is based on the available technical information on the site, the technology used, legal regulations, and official obligations. Provisions are recognized for expected severance payments or similar personnel expenses as well as for demolition expenses and other charges related to restructur-ing measures that have been planned and publicly announced by management. Provisions for long-service and anniversary bonuses are predominantly calculated based on actuarial principles. For contracts signed under early retirement programs, approved supplemental payments are accrued in installments until the end of the exemption phase at the latest. Accounting and measurement follow the German Accounting Standards Committee e.V.’s Application Note 1 (IFRS) of December 2012. Other provisions also cover risks resulting from legal disputes and proceedings, provided the criteria for recognizing a provision are fulfilled. In order to determine the amount of the provisions, the Company takes into consideration the facts related to each case, the size of the claim, claims awarded in similar cases and independent expert advice as well as assumptions regarding the probability of a successful claim and the range of possible claims. The actual costs can deviate from these estimates.
For more information, see Note 26 on page 221
The probable amount required to settle noncurrent provisions is discounted if the effect of discounting is material. In this case, the provision is recognized at present value. Assumptions must be made in determining the discount rate (2017: 2.0%; 2016: 2.5%) used for calculating noncurrent provisions. Financing costs related to unwinding the discount of provisions in subsequent periods are shown in other financial result.
Other accounting policies
Business combinations: In business combinations, the acquired assets and liabilities are recognized at fair value on the date the acquirer effectively obtains control. The fair value of acquired assets and assumed liabilities at the date of exchange, as well as the useful lives of the acquired assets, are determined on the basis of assumptions. The measure-ment is largely based on projected cash flows. The actual cash flows can significantly deviate from these estimates. Indepen-dent external appraisals are used for the purchase price allo-cation of material business combinations. Valuations in the course of business combinations are based on existing infor-mation as of the acquisition date.

BASF Report 2017 Consolidated Financial Statements
Notes — Policies and scope of consolidation183
Groups of assets and liabilities held for sale, that is disposal groups, as well as discontinued operations held for sale: These comprise those assets and directly associated liabilities shown separately on the balance sheet whose sale in the context of a single transaction is highly probable. A transaction is estimated to be highly probable, if there are no significant risks of completion of the transaction, which usually requires the conclusion of binding contracts. The assets and liabilities of disposal groups are recognized at the lower of the sum of their carrying amounts or fair value less costs to sell; this does not apply to assets which do not fall under the valua-tion principles of IFRS 5. Scheduled depreciation of noncurrent assets and the use of the equity method are suspended.
Oil and gas production: Exploration and development expenditures are accounted for using the successful efforts method. Under this method, costs of successful exploratory drilling as well as successful and dry development wells are capitalized. An exploration well is a well located outside of an area with proven oil and gas reserves. A development well is a well which is drilled to the depth of a reservoir of oil or gas within an area with proven reserves. Exploratory drilling is generally reported under construction in progress until its success can be determined. When the presence of hydrocarbons is proven such that the economic development of the field is probable, the costs remain capitalized as suspended well costs. At least once a year, all suspended wells are assessed from an economic, technical and strategic viewpoint to see if development is still intended. If this is not the case, the capitalized costs for the well in question are impaired. When reserves are proven, the exploration wells are reclassified as machinery and technical equipment when production begins. Production costs include all costs incurred to operate, repair and maintain the wells as well as the associated plant and ancillary production equipment, including the associated depreciation. The unit of production method is used to depreciate assets from oil and gas production at the field or reservoir level. Depreciation is generally calculated on the basis of the production of the period in relation to the proven, developed reserves. Exploration expenses pertain exclusively to the Oil & Gas segment and include all costs related to areas with unproven oil or gas deposits. These include costs for the exploration of areas with possible oil or gas deposits, among others. Costs for geological and geophysical investigations are always reported under exploration expenses. In addition, this item includes valuation allowances for capitalized expenses for exploration wells which did not encounter proven reserves. Depreciation of successful exploratory drilling is reported under cost of sales.
An Exploration and Production Sharing Agreement is a type of contract in crude oil and gas concessions whereby the expenses and profits from the exploration, development and production phases are divided between the state and one or more exploration and production companies using defined keys. The revenue BASF is entitled to under such contracts is reported as sales. The intangible asset from the marketing contract for natural gas from the Yuzhno Russkoye natural gas field is amortized based on BASF’s share of the produced and distributed volumes. Intangible assets in the Oil & Gas segment relate primarily to exploration and production rights. During the exploration phase, these are not subject to amortization but are tested for impairment annually. When economic success is determined, the rights are amortized in accordance with the unit of production method.
Use of estimates and assumptions in preparing the Consolidated Financial Statements
The carrying amount of assets, liabilities and provisions, contingent liabilities and other financial obligations in the Consolidated Financial Statements depends on the use of estimates, assumptions and use of discretionary scope. Specific estimates or assumptions used in individual accounting or valuation methods are disclosed in their respective sections. They are based on the circumstances and estimates on the balance sheet date and affect the reported amounts of income and expenses during the reporting periods. These assumptions particularly concern discounted cash flows in the context of impairment tests and purchase price allocations; the determination of useful lives of property, plant and equipment and intangible assets; the carrying amount of shareholdings; and the measurement of provisions for such things as employee benefits, warranties, trade discounts, environmental protection and taxes. Although uncertainty is appropriately incorporated in the valuation factors, actual results can differ from these estimates. The assumptions regarding the long-term development of oil and gas prices are significant for impairment tests in the Oil & Gas segment. The internal company projections are based on an empirical analysis of the global oil and gas supply and demand. Short-term estimates up to three years also consider the current prices on active markets or forward trans-actions. In long-term estimates, assumptions are made regarding factors such as inflation, production quantities and costs as well as energy efficiency and the substitution of energy sources. Using external sources and reports, the oil and gas price estimates are regularly checked for plausibility.

184 Consolidated Financial Statements BASF Report 2017
Notes — Policies and scope of consolidation
2 Scope of consolidation
2.1 Changes in scope of consolidationIn 2017, the scope of consolidation for the Consolidated Financial Statements encompassed 294 companies (2016: 294). Of this number, 10 companies were first-time consolida-tions (2016: 46). Since the beginning of 2017, a total of 10 companies (2016: 10) were deconsolidated due to divestiture, merger, liquidation or immateriality.
First-time consolidations in 2017 comprised: – Five acquired companies with headquarters in the regions Europe and North America
– One newly established company with headquarters in Asia Pacific
– One newly established company with headquarters in the South America, Africa, Middle East region
– Three companies headquartered in Europe that had not been consolidated at the time of the first inclusion in the Consolidated Financial Statements.
First-time consolidations in 2016 comprised: – 33 companies in connection with the acquisition of Chemetall registered in all regions
– Two newly established companies with headquarters in the regions Asia-Pacific and North America
– 11 companies headquartered in all regions which had not been consolidated at the time of the first inclusion in the Consolidated Financial Statements. Thereof eight were newly established in 2016.
While BASF does not hold majority shares in ZAO Gazprom YRGM Trading, BASF is entitled to the earnings of the company due to profit distribution arrangements, so that the company is fully consolidated in the Group Consolidated Financial Statements. A list of companies included in the Consolidated Financial Statements and a list of all companies in which BASF SE has a shareholding as required by section 313(2) of the German Commercial Code is provided in the List of Shares Held .
For more information, see Note 3 on page 190
For more information, see basf.com/en/governance
For planning purposes in 2018, BASF is using an average yearly price for oil of $65/bbl (Brent) and for gas of approxi-mately €16/MWh (roughly $5.5/mmBtu). In line with global growth, the demand for oil and gas will continue to increase. Higher marginal costs of production and the currently modest levels of investment should lead to a significant increase in prices in the medium to long-term. Considering the current high levels of oil inventories and the assumption of a longer-term increase in oil supplies from the United States, the oil price scenario has been adjusted compared with the previous year and is now expected to reach $100 only by 2022. BASF’s gas price scenario assumes only a moderate increase in gas prices in the E.U. in the next few years due to overcapacity in gas liquefaction (LNG). After-wards, a significant increase up to around €30/MWh (approxi-mately $11/mmBTU) is expected by 2025 as a result of further increasing demand and higher costs of new production and liquefaction projects.
Impairment tests on assets are carried out whenever certain triggering events indicate that an impairment may be neces-sary. External triggering events include, for example, changes in customer industries, technologies used and economic downturns. Internal triggering events for an impairment test include lower product profitability, planned restructuring measures or physical damage to assets. Impairment tests are based on a comparison of the carry-ing amount and the recoverable amount. The recoverable amount is the higher of fair value less costs to sell and the value in use. As a rule, value in use is determined using the discounted cash flow method. The estimation of cash flows and the assumptions used consider all information available on
the respective balance sheet date on the future development of the operating business. Actual future developments may vary. Impairment testing relies upon the cash-generating unit’s long-term earnings forecasts, which are based on economic trends. The weighted average cost of capital (WACC) based on the Capital Asset Pricing Model plays an important role in impairment testing. It comprises a risk-free rate, the market risk premium and the spread for the credit risk. Additional important assumptions are the forecasts for the detailed planning period and the terminal growth rates used.
For more information, see Note 14 from page 201 onward
An impairment is recognized if the recoverable amount of the asset is lower than the carrying amount. The impairment of the asset (excluding goodwill) is made in the amount of the differ-ence between these amounts. The goodwill impairment test is based on cash-generating units. At BASF, these largely correspond to the business units, or in individual cases the divisions. If there is a need for a valuation allowance, the existing goodwill is, if necessary, completely written off as a first step. If there is further need for a valuation allowance, this is allocated to the remaining assets of the cash-generating unit. Goodwill impairments are reported under other operating expenses.

BASF Report 2017 Consolidated Financial Statements
Notes — Policies and scope of consolidation185
2.2 Joint Operations
Proportionally consolidated joint operations particularly com-prise: – Ellba C.V., Rotterdam, Netherlands, which is operated jointly with Shell and produces propylene oxide and styrene monomer
– AO Achimgaz, Novy Urengoy, Russia, which is jointly operated with Gazprom for the production of natural gas and condensate
– BASF DOW HPPO Production B.V.B.A., Antwerp, Belgium, which is operated jointly with The Dow Chemical Company to produce propylene oxide
BASF holds a 50% share in each of these companies and controls them jointly with the respective partner. The com-panies sell their products directly to the partners. The partners ensure the ongoing financing of the companies by purchasing the production. They were therefore classified as joint operations in accordance with IFRS 11. A majority of the activities in the Oil & Gas segment’s Exploration & Production business sector take place through joint activities, which are not incorporated in separate com-panies. This primarily relates to activities in Germany, Norway and Argentina. These are generally accounted for as joint operations in accordance with IFRS 11 and contribute the largest part of the sales, depreciation and amortization, and fixed assets in the Oil & Gas segment.
Scope of consolidation
EuropeThereof
GermanyNorth
America Asia Pacific
South America,
Africa, Middle East 2017 2016
As of January 1 154 57 42 71 27 294 258
Thereof proportionally consolidated 6 – – 2 – 8 7
First-time consolidations 5 2 3 1 1 10 46
Thereof proportionally consolidated – – – – – – 1
Deconsolidations 6 3 2 1 1 10 10
Thereof proportionally consolidated – – – – – – –
As of December 31 153 56 43 71 27 294 294
Thereof proportionally consolidated 6 – – 2 – 8 8
Overview of impact of changes to the scope of consolidation (excluding acquisitions and divestitures)
2017 2016
Million € % Million € %
Sales 2 0.0 . 0.0
Noncurrent assets (7) 0.0 5 0.0
Thereof property, plant and equipment 1 0.0 1 0.0
Current assets 1 0.0 (3) 0.0
Thereof cash and cash equivalents (1) 0.0 1 0.1
Assets (6) 0.0 2 0.0
Equity 3 0.0 (2) 0.0
Noncurrent liabilities 8 0.0 . 0.0
Thereof financial indebtedness – – – –
Current liabilities (17) 0.1 4 0.0
Thereof financial indebtedness – – 2 0.1
Total equity and liabilities (6) 0.0 2 0.0
Other financial obligations – – – –

186 Consolidated Financial Statements BASF Report 2017
Notes — Policies and scope of consolidation
2.3 Joint ventures and associated companiesBASF has shareholdings in two material joint ventures. BASF-YPC Company Ltd., Nanjing, China, is operated by BASF together with its partner Sinopec at the Verbund site in Nanjing. BASF’s share is 50%.
Financial information on BASF-YPC Company Ltd., Nanjing, China (100%) (million €)
2017 2016
Balance sheet
Noncurrent assets 1,254 1,515
Current assets 908 842
Thereof marketable securities, cash and cash equivalents 231 190
Assets 2,162 2,357
Equity 1,756 1,760
Noncurrent liabilities 124 204
Thereof financial indebtedness 122 190
Current liabilities 282 393
Thereof financial indebtedness 30 107
Total equity and liabilities 2,162 2,357
Statement of income
Sales 2,761 2,358
Depreciation, amortization and impairments 207 214
Interest income 5 3
Interest expenses 9 23
Income taxes 159 110
Net income 473 332
Carrying amount according to the equity method as of the beginning of the year 881 768
Proportional net income 236 166
Proportional change of other comprehensive income (59) (26)
Total comprehensive income 177 140
Capital measures/dividends/changes in the scope of consolidation/other adjustments (179) (27)
Thereof dividends (179) (27)
Other adjustments of income and expenses – –
Carrying amount according to the equity method as of the end of the year 879 881
W & G Infrastruktur Finanzierungs-GmbH, Kassel, Germany, a joint venture between BASF and Gazprom for the bundling of the regulated gas transportation business (BASF interest: 50%), was established in August 2017. Effective November 30, 2017, GASCADE Gastransport GmbH, Kassel, Germany, which was reported as a material associated company in the previous year, and NEL Gastransport GmbH, Kassel, Ger-many, which was reported as a non-material associated company in the previous year, were transferred from W & G Transport Holding GmbH to W & G Infrastruktur Finanzierungs-GmbH.
Financial information on the W & G Infrastruktur Finanzierungs group, Kassel, Germany (100%) (million €)
2017
Balance sheet
Noncurrent assets 1,181
Current assets 721
Thereof marketable securities, cash and cash equivalents 2
Assets 1,902
Equity 461
Noncurrent liabilities 1,342
Thereof financial indebtedness 923
Current liabilities 99
Thereof financial indebtedness –
Total equity and liabilities 1,902
Statement of income
Sales 560
Depreciation, amortization and impairments 147
Interest income 1
Interest expenses (8)
Income taxes 23
Net income 114
Carrying amount according to the equity method as of the beginning of the year –
Proportional net income1 57
Proportional change of other comprehensive income –
Total comprehensive income1 57
Capital measures/dividends/changes in the scope of consolidation/other adjustments1 608
Thereof dividends (includes profit and loss transfers) (62)
Other adjustments of income and expenses1 (8)
Carrying amount according to the equity method as of the end of the year 657
1 The disclosures also contain effects from the transfer of GASCADE Gastransport GmbH and NEL Gastransport GmbH to W & G Infrastruktur Finanzierungs-GmbH.
Additionally, W & G Infrastruktur Finanzierungs-GmbH has become party to the financing arrangement previously between WIGA Transport Beteiligungs-GmbH & Co. KG and an international banking consortium; besides WIGA Transport Beteiligungs-GmbH & Co. KG, W & G Infrastruktur Finan-zierungs-GmbH functions as a further debtor and assumed €925 million of financial liabilities previously held by WIGA Transport Beteiligungs-GmbH & Co. KG against a transfer of loan receivables to GASCADE Gastransport GmbH and NEL Gastransport GmbH as well as cash. This was deposited in BASF’s cash pool. In doing so, W & G Infrastruktur Finanzierungs-GmbH effectively took over the financing func-tion for both of these companies operating in the regulated gas transportation business.
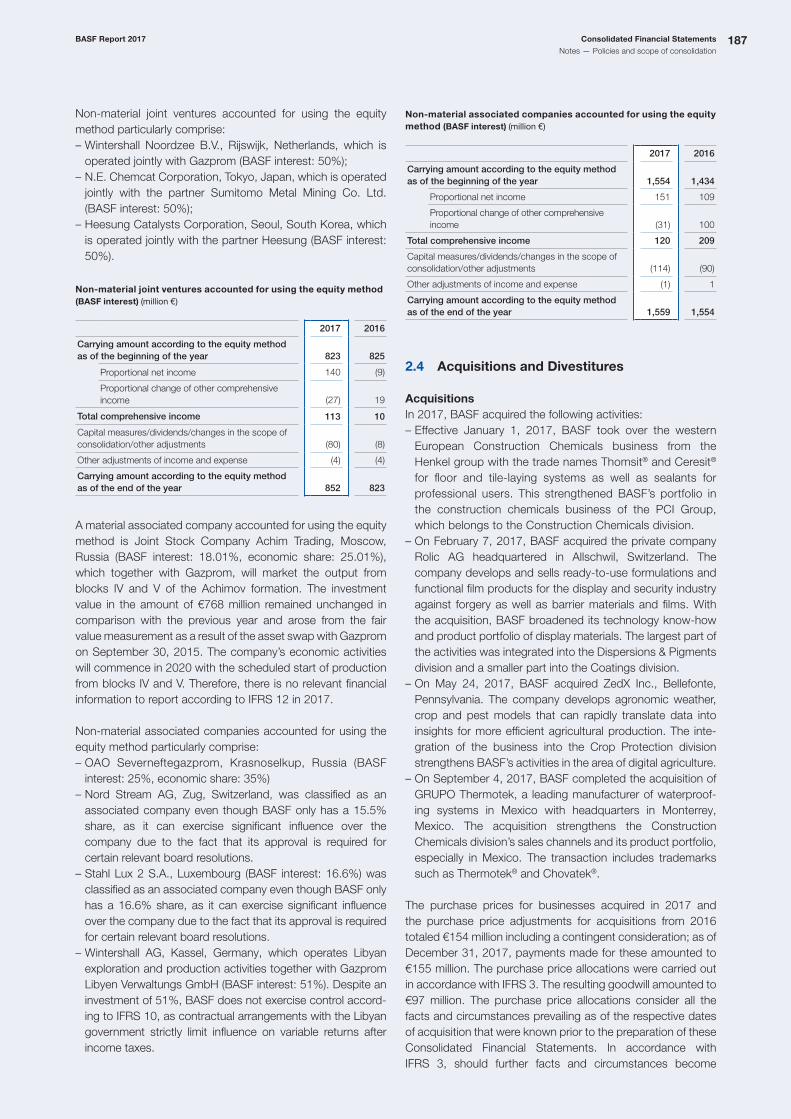
BASF Report 2017 Consolidated Financial Statements
Notes — Policies and scope of consolidation187
Non-material joint ventures accounted for using the equity method particularly comprise: – Wintershall Noordzee B.V., Rijswijk, Netherlands, which is operated jointly with Gazprom (BASF interest: 50%);
– N.E. Chemcat Corporation, Tokyo, Japan, which is operated jointly with the partner Sumitomo Metal Mining Co. Ltd. (BASF interest: 50%);
– Heesung Catalysts Corporation, Seoul, South Korea, which is operated jointly with the partner Heesung (BASF interest: 50%).
Non-material joint ventures accounted for using the equity method (BASF interest) (million €)
2017 2016
Carrying amount according to the equity method as of the beginning of the year 823 825
Proportional net income 140 (9)
Proportional change of other comprehensive income (27) 19
Total comprehensive income 113 10
Capital measures/dividends/changes in the scope of consolidation/other adjustments (80) (8)
Other adjustments of income and expense (4) (4)
Carrying amount according to the equity method as of the end of the year 852 823
A material associated company accounted for using the equity method is Joint Stock Company Achim Trading, Moscow, Russia (BASF interest: 18.01%, economic share: 25.01%), which together with Gazprom, will market the output from blocks IV and V of the Achimov formation. The investment value in the amount of €768 million remained unchanged in comparison with the previous year and arose from the fair value measurement as a result of the asset swap with Gazprom on September 30, 2015. The company’s economic activities will commence in 2020 with the scheduled start of production from blocks IV and V. Therefore, there is no relevant financial information to report according to IFRS 12 in 2017.
Non-material associated companies accounted for using the equity method particularly comprise: – OAO Severneftegazprom, Krasnoselkup, Russia (BASF interest: 25%, economic share: 35%)
– Nord Stream AG, Zug, Switzerland, was classified as an associated company even though BASF only has a 15.5% share, as it can exercise significant influence over the company due to the fact that its approval is required for certain relevant board resolutions.
– Stahl Lux 2 S.A., Luxembourg (BASF interest: 16.6%) was classified as an associated company even though BASF only has a 16.6% share, as it can exercise significant influence over the company due to the fact that its approval is required for certain relevant board resolutions.
– Wintershall AG, Kassel, Germany, which operates Libyan exploration and production activities together with Gazprom Libyen Verwaltungs GmbH (BASF interest: 51%). Despite an investment of 51%, BASF does not exercise control accord-ing to IFRS 10, as contractual arrangements with the Libyan government strictly limit influence on variable returns after income taxes.
Non-material associated companies accounted for using the equity method (BASF interest) (million €)
2017 2016
Carrying amount according to the equity method as of the beginning of the year 1,554 1,434
Proportional net income 151 109
Proportional change of other comprehensive income (31) 100
Total comprehensive income 120 209
Capital measures/dividends/changes in the scope of consolidation/other adjustments (114) (90)
Other adjustments of income and expense (1) 1
Carrying amount according to the equity method as of the end of the year 1,559 1,554
2.4 Acquisitions and Divestitures
AcquisitionsIn 2017, BASF acquired the following activities: – Effective January 1, 2017, BASF took over the western European Construction Chemicals business from the Henkel group with the trade names Thomsit® and Ceresit® for floor and tile-laying systems as well as sealants for professional users. This strengthened BASF’s portfolio in the construction chemicals business of the PCI Group, which belongs to the Construction Chemicals division.
– On February 7, 2017, BASF acquired the private company Rolic AG headquartered in Allschwil, Switzerland. The company develops and sells ready-to-use formulations and functional film products for the display and security industry against forgery as well as barrier materials and films. With the acquisition, BASF broadened its technology know-how and product portfolio of display materials. The largest part of the activities was integrated into the Dispersions & Pigments division and a smaller part into the Coatings division.
– On May 24, 2017, BASF acquired ZedX Inc., Bellefonte, Pennsylvania. The company develops agronomic weather, crop and pest models that can rapidly translate data into insights for more efficient agricultural production. The inte-gration of the business into the Crop Protection division strengthens BASF’s activities in the area of digital agriculture.
– On September 4, 2017, BASF completed the acquisition of GRUPO Thermotek, a leading manufacturer of waterproof-ing systems in Mexico with headquarters in Monterrey, Mexico. The acquisition strengthens the Construction Chemicals division’s sales channels and its product portfolio, especially in Mexico. The transaction includes trademarks such as Thermotek® and Chovatek®.
The purchase prices for businesses acquired in 2017 and the purchase price adjustments for acquisitions from 2016 totaled €154 million including a contingent consideration; as of Decem ber 31, 2017, payments made for these amounted to €155 million. The purchase price allocations were carried out in accordance with IFRS 3. The resulting goodwill amounted to €97 million. The purchase price allocations consider all the facts and circumstances prevailing as of the respective dates of acquisition that were known prior to the preparation of these Consolidated Financial Statements. In accordance with IFRS 3, should further facts and circumstances become

188 Consolidated Financial Statements BASF Report 2017
Notes — Policies and scope of consolidation
known within the 12-month measurement period, the pur-chase price allocation will be adjusted accordingly.
In 2016, BASF acquired the following activities: – On September 26, 2016, BASF concluded the acquisition of Guangdong Yinfan Chemistry (“Yinfan”) in Jiangmen, China, and integrated the business into the Coatings division. This acquisition enabled BASF to expand its portfolio of auto-motive refinish coatings in Asia Pacific with the addition of the Yinfan product range and gain access to a state-of-the-art production plant for automotive refinish coatings in China.
– On December 14, 2016, BASF concluded the acquisition of the global surface treatment provider Chemetall from Albemarle Corp., Charlotte, North Carolina. The acquisition complements the Coating division’s portfolio by adding customized technology and system solutions for the treat-ment of surfaces. The purchase price, after adjustments to the net financial debt and net working capital, amounted to $3.1 billion.
The preliminary purchase price allocation for the acquisition of Chemetall was reviewed at the end of the 12-month measurement period in accordance with IFRS 3 and corrected to reflect more detailed information on tax matters, provisions for pensions and a retroactive purchase price adjustment. This reduced net working capital by €13 million. Taking into account a cash-effective adjustment, the total purchase price rose by €6 million. Overall, the adjustments increased goodwill by €19 million to €1,564 million. The goodwill recognized resulted primarily from sales synergies arising from the expansion of the portfolio, and to a smaller extent from cost synergies. The following overview shows the effects of the acquisi-tions conducted in 2017 and 2016 on the Consolidated Finan-cial Statements. If acquisitions resulted in the transfer of assets or the assumption of additional liabilities, these are shown as a net impact.
DivestituresIn 2017, BASF sold the following activities: – On February 28, 2017, BASF sold its inorganic specialties business to Edgewater Capital Partners LP, Cleveland, Ohio. The transaction comprised the production site in Evans City, Pennsylvania, and the product lines for special alcoholates, boranes and alkali metals manufactured there in the Inter-mediates division.
– On July 17, 2017, BASF sold its Bleaching Clay and Mineral Adsorbents businesses to EP Minerals LLC, based in Reno, Nevada. The divestiture affected one global business unit in the Catalysts division and comprises a production site as well as a bleaching clay mine in Mississippi and the mineral rights sublease for a mine in Arizona. Sixty-six employees transferred to EP Minerals LLC.
– On September 29, 2017, BASF completed the combination of the global leather chemicals business in the Performance Chemicals division with the Stahl group. The transaction comprised the global leather chemicals business, as well as the leather chemicals production site in L’Hospitalet, Spain. Around 210 jobs were affected worldwide, 110 of which were in Asia. Under the terms of the agreement, BASF received a 16% minority interest in the Stahl group as well as a payment; this resulted in special income. Furthermore, in the medium to long term, BASF will supply Stahl with significant volumes of leather chemicals.
– On September 30, 2017, BASF concluded the sale of its production site for electrolytes in Szhou, China, to Shenzhen Capchem Technology Co. Ltd., based in Shenzhen, China. The site was allocated to the Catalysts division.
Effects of acquisitions and changes in the preliminary purchase price allocations
2017 2016
Million € % Million € %
Goodwill 97 1.0 1,552 15.4
Other intangible assets 138 3.3 1,237 24.3
Property, plant and equipment 8 . 155 0.6
Financial assets 3 0.1 45 0.9
Other noncurrent assets (3) (0.1) 20 0.5
Noncurrent assets 243 0.5 3,009 6.0
Current assets 18 0.1 358 1.4
Thereof cash and cash equivalents 5 0.1 81 5.9
Total assets 261 0.3 3,367 4.4
Equity – – – –
Noncurrent liabilities 40 0.1 356 1.2
Thereof financial indebtedness – – – –
Current liabilities 66 0.4 162 1.1
Thereof financial indebtedness – – – –
Total equity and liabilities 106 0.1 518 0.7
Payments made for acquisitions 155 2,849

BASF Report 2017 Consolidated Financial Statements
Notes — Policies and scope of consolidation189
In 2016, BASF sold the following activities: – On June 30, 2016, BASF completed the sale of its global polyolefin catalysts business to W.R. Grace & Co., Columbia, Maryland. The transaction involved technologies, patents, trademarks and the transfer of production plants in Pasadena, Texas, and Tarragona, Spain. Around 170 employees transferred to Grace. These activities had been assigned to the Catalysts division.
– On August 26, 2016, BASF sold its worldwide photoinitiator business in the Dispersions & Pigments division to IGM Resins B.V., Waalwijk, Netherlands. The transaction comprised technology, patents, trademarks, customer relationships, contracts and inventories as well as the
photoinitiator production site in Mortara, Italy. The sale affected 120 employees worldwide.
– On December 14, 2016, BASF sold the Coatings division’s industrial coatings business to the AkzoNobel Group. The transaction included technologies, patents and trademarks, customer relationships, inventories as well as the transfer of two production sites in England and in South Africa.
The following overview shows the effects of the divestitures conducted in 2017 and 2016 in the Consolidated Financial Statements. The line item sales reflects the year-on-year decline resulting from divestitures. The impact on equity relates mainly to gains and losses from divestitures.
Agreed-upon transactionsOn September 18, 2017, BASF signed an agreement with the Solvay group on the acquisition of Solvay’s global polyamide business. Solvay and BASF aim to close the transaction in the third quarter of 2018 after regulatory approvals have been obtained and the consent of a joint venture partner has been received. The acquisition would complement BASF’s engineering plastics portfolio and expand the company’s position as a solutions provider for the transportation, construction and consumer goods industries as well as for other industrial applications. BASF plans to integrate the global polyamide business into the Performance Materials and Monomers divisions. The purchase price on a cash and debt-free basis and excluding other adjustments is €1.6 billion. If the transaction is not concluded, the agreement provides for, subject to certain conditions, a payment of €150 million from BASF to Solvay. On October 13, 2017, BASF announced that it had signed an agreement on the acquisition of significant parts of Bayer’s
seed and non-selective herbicide businesses. The assets to be acquired include Bayer’s global glufosinate-ammonium busi-ness, commercialized under the Liberty®, Basta® and Finale® trademarks, as well as its seed businesses for key row crops in selected markets. The transaction also covers Bayer’s trait research and breeding capabilities for these crops. BASF will acquire the manufacturing sites for glufosinate-ammonium production and formulation in Germany, the United States and Canada, seed breeding facilities in the Americas and Europe as well as trait research facilities in the United States and Europe. With the acquisition, which is expected in the first half of 2018 subject to the closing of Bayer’s acquisition of Monsanto and approval by the relevant authorities, BASF will expand its crop protection business, strengthen the herbicide portfolio and enter into its own seed business in key agricultural markets. More than 1,800 employees are to be transferred to BASF with the acquisition, strengthening the Crop Protection division. The purchase price amounts to €5.9 billion, subject to certain adjustments at closing.
Effects of divestitures
2017 2016
Million € % Million € %
Sales (460) (0.8) (10,718) 1 (15.2)
Noncurrent assets 93 0.2 (234) (0.5)
Thereof property, plant and equipment (50) (0.2) (97) (0.4)
Current assets (48) (0.2) (64) (0.3)
Thereof cash and cash equivalents – – – –
Total assets 45 0.1 (298) (0.4)
Equity 239 0.7 467 1.4
Noncurrent liabilities (13) . (63) (0.2)
Thereof financial indebtedness – – – –
Current liabilities (4) . (1) .
Thereof financial indebtedness – – – –
Total equity and liabilities 222 0.3 403 0.5
Payments received from divestitures 177 701
1 Thereof from the asset swap with Gazprom: €10.244 million (–14.5%)

190 Consolidated Financial Statements BASF Report 2017
Notes — Policies and scope of consolidation
3 BASF Group List of Shares Held in accordance with section 313(2) of the German Commercial Code
The list of consolidated companies and the complete list of all companies in which BASF SE has a share as required by section 313(2) of the German Commercial Code and infor-mation for exemption of subsidiaries from accounting and disclosure obligations are an integral component of the
audited Consolidated Financial Statements submitted to the electronic Federal Gazette. The list of shares held is also published online.
For more information, see basf.com/en/governance
4 Reporting by segment and region
BASF’s business is conducted by thirteen operating divisions aggregated into five segments for reporting purposes. The divisions are allocated to the segments based on their business models. The Chemicals segment comprises the classic chemicals business with basic chemicals and intermediates. The focus is on cost leadership in the value chains, efficient and reliable production and logistics processes, as well as process inno-vation. The segment forms the core of BASF’s Production Verbund and is the starting point for a majority of the value chains. In addition to supplying the chemical industry and numerous other sectors, Chemicals ensures that other BASF segments are supplied with chemicals for producing downstream products. The Chemicals segment is composed of the Petrochemicals, Monomers and Intermediates divisions. The Performance Products segment consists of the Dispersions & Pigments, Care Chemicals, Nutrition & Health and Performance Chemicals divisions. Tailored solutions play a key role. They enable our customers to improve the applica-tion properties of their products or optimize production pro-cesses, for example. Close customer contact and meeting the demanding requirements of a wide range of industries are crucial to business success. As of January 1, 2017, the activities of the Monomers and Dispersions & Pigments divisions for the electronics industry were merged into the global business unit Electronic Materials in the Dispersions & Pigments division within the Performance Products segment. BASF thereby strengthens its position as a strategic partner for the large electronic producers. The 2016 figures have been restated accordingly. The Functional Materials & Solutions segment bundles system solutions, services and innovative products for specific sectors and customers, especially the automotive, electrical,
chemical and construction industries, as well as applications for household, sports and leisure. An in-depth understanding of applications, the development of innovations in close cooperation with customers, and adaptation to different regional needs are key success factors. The segment is made up of the Catalysts, Construction Chemicals, Coatings, and Performance Materials divisions. The Agricultural Solutions segment includes the Crop Protection division, which is active in the areas of chemical and biological crop protection, seed treatment and water management as well as for nutrient supply and combating plant stress. It offers farmers innovative solutions, including those based on digital technologies, combined with practical advice. Plant biotechnology research is not assigned to this segment; it is reported in Other. The Oil & Gas segment comprises the division of the same name and focuses on the exploration and production in oil and gas rich regions in Europe, North Africa, Russia, South America and the Middle East. It benefits from strong partnerships and its technological expertise. In Europe, the segment is also active in the transportation of natural gas together with its Russian partner Gazprom. Activities not assigned to a particular division are reported in Other. These include the sale of raw materials, engineering and other services, rental income and leases, the steering of the BASF Group by corporate headquarters, and cross- divisional corporate research. Cross-divisional corporate research, to which plant biotechnology research also belongs, works on long-term topics of strategic importance to the BASF Group. Furthermore, it focuses on the development of specific key technologies which are of central importance for the divisions.
Intended transactionsOn December 7, 2017, BASF signed a letter of intent with the LetterOne group on the merger of their respective oil and gas businesses in a joint venture, which would operate under the name Wintershall DEA. The definitive transaction agreements are to be negotiated over the coming months; the transaction could close in the second half of 2018, subject to the
customary regulatory approvals. There is no assurance that BASF will enter into definitive transaction agreements with LetterOne or that the intended transaction will be con-summated. Due to this uncertainty, BASF continues to report Oil & Gas as continuing operations.
For more information, see the Management’s report on page 86 onward

BASF Report 2017 Consolidated Financial Statements
Notes — Policies and scope of consolidation191
Earnings from currency conversion that are not allocated to the segments are also reported under Other, as are earnings from the hedging of raw materials prices and foreign currency exchange risks. Furthermore, revenues and expenses from the long-term incentive (LTI) program are reported here. Transfers between the segments are generally executed at adjusted market-based prices which take into account the
higher cost efficiency and lower risk of Group-internal trans-actions. Assets, as well as their depreciation and amortization, are allocated to the segments based on economic control. Assets used by more than one segment are allocated based on the percentage of usage.
Income from operations of Other increased by €292 million year-on-year to minus €799 million. The costs for cross- divisional corporate research decreased by €16 million to €379 million, whereas the costs of corporate headquarters at €224 million were €2 million higher than in the previous year. Income from other businesses rose by €42 million to €81 million. The line item foreign currency results, hedging and other measurement effects increased by €303 million to
minus €28 million. This was due to the provisions for the LTI program: Income in the amount of €68 million arising from their partial release in 2017 contrasted with expenses of €267 mil-lion from additions to provisions in the previous year. The line item miscellaneous income and expenses amounted to minus €249 million compared with minus €182 million in the previous year.
Assets of Other (million €)
December 31, 2017 December 31, 2016
Assets of businesses included in Other 2,007 1,959
Financial assets 606 605
Deferred tax assets 2,118 2,513
Cash and cash equivalents/marketable securities 6,547 1,911
Defined benefit assets 70 66
Other receivables/prepaid expenses 2,328 2,320
Assets of Other 13,676 9,374
Reconciliation reporting Oil & Gas (million €)
2017 2016
Income from operations 1,043 499
Net income from shareholdings 1 6
Other income (126) (74)
Income before taxes and minority interests 918 431
Income taxes (158) 7
Income before minority interests 760 438
Minority interests (41) (76)
Net income 719 362
Income from operations (EBIT) of Other (million €)
2017 2016
Costs for cross-divisional corporate research (379) (395)
Costs of corporate headquarters (224) (222)
Other businesses 81 39
Foreign currency results, hedging and other measurement effects (28) (331)
Miscellaneous income and expenses (249) (182)
Income from operations of Other (799) (1,091)

192 Consolidated Financial Statements BASF Report 2017
Notes — Policies and scope of consolidation
The reconciliation reporting for Oil & Gas reconciles the income from operations in the Oil & Gas segment with the contribution of the segment to the net income of the BASF Group. Income from operations in 2017 increased significantly in comparison with the previous year. This is primarily attributable to the increase in oil and gas prices, a higher earnings contribution from our share in the Yuzhno Russkoje natural gas field, reversals of impairments in Norway and the Netherlands, and the sale of shares in the Aguada Pichana concession in Argentina. In connection with our share in the Yuzhno Russkoye natural gas field, the excess volumes received over the last 10 years prior to 2016 were compensated in the previous year as contractually agreed with our partner,
Gazprom. An impairment regarding the exploration potential in Norway had an offsetting effect. The Oil & Gas segment’s other income relates to income and expenses not included in the segment’s income from operations, interest result and other financial result. As in the previous year, other income largely consisted of currency effects from Group loans. Positive income taxes in 2017 were primarily a result of higher income in Norway.
Segments 2017 (million €)
Chemicals
Perfor- mance
Products
Functional Mate- rials &
Solutions
Agri- cultural
Solutions Oil & Gas OtherBASF Group
Sales 16,331 16,217 20,745 5,696 3,244 2,242 64,475
Intersegmental transfers 6,063 506 805 36 409 (2) 7,817
Sales including intersegmental transfers 22,394 16,723 21,550 5,732 3,653 2,240 72,292
Income from operations 4,208 1,510 1,545 1,015 1,043 (799) 8,522
Assets 13,233 14,432 17,364 8,096 11,967 13,676 78,768
Thereof goodwill 56 2,078 3,718 1,929 1,504 68 9,353
other intangible assets 103 1,048 2,045 208 804 33 4,241
property, plant and equipment 7,497 5,000 4,163 1,366 6,363 869 25,258
investments accounted for using the equity method 1,026 369 393 – 2,556 371 4,715
Debt 4,461 5,419 4,385 1,768 2,222 25,757 44,012
Research and development expenses 128 395 431 507 46 381 1,888
Additions to property, plant and equipment and intangible assets (including acquisitions) 1,149 800 1,056 185 988 186 4,364
Amortization of intangible assets and deprecia tion of property, plant and equipment 1,166 917 706 267 1,026 120 4,202
Thereof impairments and reversals of impairments 129 53 28 2 (79) 7 140
Segments 2016 (million €)
Chemi-cals1
Perfor- mance
Products1
Functional Mate- rials &
Solutions
Agri- cultural
Solutions Oil & Gas OtherBASF Group
Sales 12,905 15,558 18,732 5,569 2,768 2,018 57,550
Intersegmental transfers 4,832 469 736 33 331 1 6,402
Sales including intersegmental transfers 17,737 16,027 19,468 5,602 3,099 2,019 63,952
Income from operations 1,953 1,678 2,199 1,037 499 (1,091) 6,275
Assets 13,124 14,911 17,359 8,899 12,829 9,374 76,496
Thereof goodwill 61 2,228 3,909 2,093 1,712 70 10,073
other intangible assets 136 1,227 2,305 263 1,121 37 5,089
property, plant and equipment 7,929 5,365 4,065 1,543 6,678 833 26,413
investments accounted for using the equity method 1,027 193 423 − 2,581 423 4,647
Debt 4,532 5,840 4,328 1,853 2,190 25,185 43,928
Research and development expenses 145 399 393 489 39 398 1,863
Additions to property, plant and equipment and intangible assets (including acquisitions) 1,185 892 3,679 266 1,115 121 7,258
Amortization of intangible assets and deprecia tion of property, plant and equipment 1,161 899 707 268 1,097 119 4,251
Thereof impairments and reversals of impairments 86 26 152 29 4 16 313
1 On January 1, 2017, the Monomers and Dispersions & Pigments divisions’ activities for the electronics industry were merged into the global Electronic Materials business unit and allocated to the Dispersions & Pigments division. For better comparability, the affected figures for 2016 have been adjusted accordingly.

BASF Report 2017 Consolidated Financial Statements
Notes — Policies and scope of consolidation193
Regions 2017 (million €)
EuropeThereof
GermanyNorth
AmericaAsia
Pacific
South America,
Africa, Middle East
BASF Group
Location of customers
Sales 29,214 8,359 15,357 14,343 5,561 64,475
Share % 45.3 13.0 23.8 22.3 8.6 100.0
Location of companies
Sales 30,778 19,873 15,937 13,658 4,102 64,475
Sales including interregional transfers1 37,987 25,674 18,570 14,534 4,409 75,500
Income from operations 4,742 1,913 1,236 2,209 335 8,522
Assets 43,924 24,631 16,201 13,547 5,096 78,768
Thereof intangible assets 7,167 2,736 4,428 1,499 500 13,594
property, plant and equipment 13,876 7,019 5,281 4,337 1,764 25,258
investments accounted for using the equity method 3,153 989 115 1,447 – 4,715
Additions to property, plant and equipment and intangible assets (including acquisitions) 2,455 1,228 958 711 240 4,364
Amortization of intangible assets and depreciation of property, plant and equipment including impairments and reversals of impairments 2,399 1,234 1,011 516 276 4,202
Regions 2016 (million €)
EuropeThereof
GermanyNorth
AmericaAsia
Pacific
South America,
Africa, Middle East
BASF Group
Location of customers
Sales 26,039 7,412 14,042 12,165 5,304 57,550
Share % 45.3 12.9 24.4 21.1 9.2 100.0
Location of companies
Sales 27,221 17,540 14,682 11,512 4,135 57,550
Sales including interregional transfers1 34,234 23,241 17,060 12,269 4,361 67,924
Income from operations 3,632 1,582 1,113 1,098 432 6,275
Assets 40,086 21,120 17,714 12,869 5,827 76,496
Thereof intangible assets 7,925 3,249 5,048 1,661 528 15,162
property, plant and equipment 13,990 6,915 6,055 4,421 1,947 26,413
investments accounted for using the equity method 3,052 1,120 119 1,476 – 4,647
Additions to property, plant and equipment and intangible assets (including acquisitions) 4,114 2,912 1,424 1,437 283 7,258
Amortization of intangible assets and depreciation of property, plant and equipment including impairments and reversals of impairments 2,526 1,224 1,018 463 244 4,251
1 The sum of sales including interregional transfers for all the regions can differ from the sum of sales including intersegmental transfers for all the segments, as the segments are viewed globally, and therefore shipments and services between regions within the same segment are not classified as transfers.
In the United States, sales to third parties in 2017 amounted to €13,909 million (2016: €12,831 million) according to location of companies and €13,127 million (2016: €11,985 million) according to location of customers.
In the United States, intangible assets, property, plant and equipment, and investments accounted for using the equity method amounted to €9,014 million compared with €10,342 million in the previous year.

194 Consolidated Financial Statements BASF Report 2017
Notes — Notes on statement of income
Notes on statement of income
5 Earnings per share
Earnings per share
2017 2016
Net income million € 6,078 4,056
Weighted-average number of outstanding shares 1,000 918,479 918,479
Earnings per share € 6.62 4.42
Diluted earnings per share € 6.61 4.41
In accordance with IAS 33, a potential dilutive effect must be considered in the diluted earnings per share for those BASF shares which will be granted in the future as a part of the BASF share program “plus.” This applies regardless of the fact that the necessary shares are acquired by third parties on the market on behalf of BASF, and the fact that there are no plans for the issuance of new shares. The dilutive effect of the issue of “plus” shares amounted to €0.01 in 2017 (2016: €0.01).
6 Functional costs
Under the cost-of-sales method, functional costs incurred by the operating functions are determined on the basis of cost center accounting. The functional costs particularly contain the personnel costs, depreciation and amortization accumu-lated on the underlying final cost centers as well as allocated costs within the cost accounting cycle. Operating expenses that cannot be allocated to the functional costs are reported as other operating expenses.
For more information on other operating expenses, see Note 8 from page 196 onward
Cost of sales
Cost of sales includes all production and purchase costs of the company’s own products as well as merchandise which has been sold in the period, particularly plant, energy and personnel costs.
Selling expenses
Selling expenses particularly include marketing and advertising costs, freight costs, packaging costs, distribution manage-ment costs, commissions, and licensing costs.
General administrative expenses
General and administrative expenses primarily include the costs of the central units, the costs of managing business units and divisions, and costs of general management, the Board of Executive Directors and the Supervisory Board.
Research and development expenses
Research and development expenses include the costs result-ing from research projects as well as the necessary license fees for research activities .
For more information on research and development expenses by segment, see Note 4 on page 192

BASF Report 2017 Consolidated Financial Statements
Notes — Notes on statement of income195
7 Other operating income
Million € 2017 2016
Income from the adjustment and reversal of provisions recognized in other operating expenses 74 80
Revenue from miscellaneous revenue-generating activities 178 191
Income from foreign currency and hedging transactions as well as from the measurement of LTI options 110 32
Income from the translation of financial statements in foreign currencies 44 57
Gains on divestitures and the disposal of noncurrent assets 359 667
Reversals of impairment losses on noncurrent assets 189 2
Income from the reversal of valuation allowances for business-related receivables 38 35
Other 924 716
Other operating income 1,916 1,780
Income from the adjustment and reversal of provisions recognized in other operating expenses was largely related to risks from lawsuits and damage claims, closures and restructuring measures, employee obligations, and various other items as part of the normal course of business. Provisions were reversed or adjusted if the circumstances on the balance sheet date were such that utilization was no longer expected, or expected to a lesser extent.
For more information, see Note 8 from page 196 onward
Revenue from miscellaneous revenue-generating activities primarily included income from rentals, catering operations, cultural events and logistics services. Income from foreign currency and hedging trans-actions as well as from the measurement of LTI options pertained to the foreign currency translation of receivables and payables as well as of currency derivatives and other hedging transactions. In 2017, there was also income from the reversal of provisions for the long-term incentive (LTI) program of €68 million. In 2016, by contrast, there was an expense of €267 million arising from the long-term incentive (LTI) program. This was reported under other operating expenses. Income from the translation of financial statements in foreign currencies contained gains from the translation of companies whose local currency is different from the functional currency. Gains on divestitures and the disposal of noncurrent assets in the amount of €195 million resulted from the transfer of the leather chemicals business to the Stahl group. Further income of €75 million resulted from the disposal of shares in oil and gas concessions in Argentina. In the previous year, these particularly included gains amounting to €349 million from the sale of the industrial coatings business to AkzoNobel, Amsterdam, Netherlands. Income of €93 million arose from the sale of the global polyolefin catalysts business to W.R. Grace & Co., Columbia, Maryland. Further income of €83 million resulted from the disposal of BASF’s OLED
intellectual property assets to UDC Ireland Limited, Dublin, Ireland. Income of €72 million pertained to real estate divestitures in several countries. Reversals of impairment losses on noncurrent assets amounted to €189 million in 2017. These primarily concerned oil and gas fields in Norway. Income from the reversal of valuation allowances for business-related receivables resulted mainly from the settlement of customer-related receivables for which a valuation allowance had been recorded. Other income included government grants and govern-ment assistance from several countries amounting to €133 million in 2017 and €156 million in 2016. In both years, these were primarily attributable to price compensation from the Argentinian government for gas producers, which was introduced in connection with the New Gas Price Scheme (NGPS) in response to the lower, partly locally regulated gas prices. Further income resulted from refunds and compensation payments in the amount of €431 million in 2017 and €291 million in 2016. In 2017, these largely included insurance refunds for the damages caused by the fire at the North Har-bor in Ludwigshafen, Germany. In the previous year, these were predominantly due to insurance refunds arising from a plant outage at the Ellba C.V. joint operation in Moerdijk, Netherlands. Moreover, income in both years was related to gains from precious metal trading, refunds of consumption taxes and a number of additional items.

196 Consolidated Financial Statements BASF Report 2017
Notes — Notes on statement of income
Expenses for restructuring and integration measures were primarily related to severance payments amounting to €83 mil-lion in 2017 and €190 million in 2016. Further expenses of €38 million concerned the Coatings division in connection with the purchase of the global surface technology provider Chemetall. In the Care Chemicals division, expenses were incurred for restructuring in the USA in the amount of €12 mil-lion and €15 million in the Construction Chemicals division for restructuring in Europe. Furthermore, expenses of €10 million concerned the Crop Protection division in relation to the acquisition of significant parts of the seed and non-selective herbicide businesses from Bayer AG, Leverkusen, Germany. Expenses of €27 million in 2017 and €39 million in 2016 arose from the outsourcing of the computer centers. In the previous year, expenses had primarily affected the Petrochemicals division in the amount of €37 million and the Dispersions & Pigments division in the amount of €25 million. Expenses arose from environmental protection and safety measures, costs of demolition, removal and project costs that are not subject to mandatory capitalization according to IFRS. Expenses for demolition, removal and project planning totaled €279 million in 2017 and €375 million in 2016. These especially pertained to the Ludwigshafen site in both years. Further expenses of €54 million in 2017 and €61 million in 2016 arose from the addition to environmental provisions. In both years, these concerned several discontin-ued sites in North America. In the previous year, expenses were also incurred for landfills in Germany.
Amortization, depreciation and impairments of noncurrent assets arose from impairments in the Oil & Gas segment in the amount of €83 million in 2017. The Performance Products segment posted impairments of €23 million in 2017 and €6 million in 2016. Further impairments of €10 million con-cerned the Functional Materials & Solutions segment in 2017 and €124 million in 2016. The previous year had recorded €67 million in impairments in the Chemicals segment and €24 million in the Agricultural Solutions segment. Costs from miscellaneous revenue-generating activities concerned the respective item presented in other operating income.
For more information, see Note 7 on page 195 onward
Expenses from foreign-currency and hedging trans-actions as well as from the measurement of LTI options were related to foreign currency translations of receivables and payables as well as changes in the fair value of currency derivatives and other hedging transactions. In comparison with the previous year, lower expenses for the hedging of planned sales were posted due to the depreciation of the U.S. dollar relative to the euro as well as lower provisions for the Long-Term-Incentive program.
For more information, see Note 7 on page 195 onward
Losses from divestitures and the disposal of noncur-rent assets of €70 million resulted largely from portfolio measures in North America in 2017. Further expenses of €19 million were incurred in connection with the divestiture of the global industrial coatings business to the AkzoNobel Group in December 2016. In the previous year, losses of €17 million had arisen from the reduction in disposal gains from the asset swap with Gazprom as part of the final purchase price allocation. Expenses from the addition of valuation allowances for business-related receivables decreased by €25 million compared with the previous year. This was predominantly due to lower additions in the region South America, Africa, Middle East.
8 Other operating expenses
Million € 2017 2016
Restructuring and integration measures 362 482
Environmental protection and safety measures, costs of demolition, removal and project costs that are not subject to mandatory capitalization 375 464
Amortization, depreciation and impairments of noncurrent assets 311 337
Costs from miscellaneous revenue-generating activities 163 179
Expenses from foreign-currency and hedging transactions as well as from the measurement of LTI options 204 530
Losses from the translation of financial statements in foreign currencies 51 17
Losses from divestitures and the disposal of noncurrent assets 106 43
Oil and gas exploration expenses 104 94
Expenses from the addition of valuation allowances for business-related receivables 81 106
Expenses from the consumption of inventories measured at market value and the derecognition of obsolete inventory 220 277
Other 972 604
Other operating expenses 2,949 3,133

BASF Report 2017 Consolidated Financial Statements
Notes — Notes on statement of income197
9 Income from companies accounted for using the equity method
Million € 2017 2016
Proportional net income 584 317
Thereof joint ventures 433 157
associated companies 151 160
Other adjustments of income and expense (13) (10)
Thereof joint ventures (12) (4)
associated companies (1) (6)
Income from companies accounted for using the equity method 571 307
Income from companies accounted for using the equity method increased by a total of €264 million in 2017, primarily due to higher earnings in the Oil & Gas segment, particularly at
Wintershall Noordzee B.V., Rijswijk, Netherlands. BASF-YPC Company Ltd., Nanjing, China, also contributed significantly to this increase.
In both years, expenses under Other included expenses from attorneys’ fees for litigation cases as well as from REACH, the provision of services, and the implementation of further projects. Expenses of €79 million were also recognized for a
product liability case in the Chemicals segment in 2017. Moreover, 2016 contained expenses of €27 million from the fire damage at the Ludwigshafen North Harbor, Germany.
10 Financial result
Million € 2017 2016
Dividends and similar income 22 39
Income from the disposal of shareholdings 5 9
Income from profit transfer agreements 3 6
Income from tax allocation to participating interests 1 –
Income from other shareholdings 31 54
Expenses from loss transfer agreements (43) (18)
Write-downs on/losses from the sale of shareholdings (17) (53)
Expenses from other shareholdings (60) (71)
Net income from shareholdings (29) (17)
Interest income from cash and cash equivalents 188 159
Interest and dividend income from securities and loans 38 20
Interest income 226 179
Interest expenses (560) (661)
Interest result (334) (482)
Net interest income from overfunded pension plans and similar obligations 2 5
Income from the capitalization of borrowing costs 68 92
Miscellaneous financial income – –
Other financial income 70 97
Write-downs on/losses from the disposal of securities and loans (3) (10)
Net interest expense from underfunded pension plans and similar obligations (175) (183)
Net interest expense from other long-term personnel obligations (1) (7)
Unwinding the discount on other noncurrent liabilities (36) (47)
Miscellaneous financial expenses (214) (231)
Other financial expenses (429) (478)
Other financial result (359) (381)
Financial result (722) (880)

198 Consolidated Financial Statements BASF Report 2017
Notes — Notes on statement of income
11 Income taxes
In Germany, a uniform corporate income tax rate of 15.0% as well as a solidarity surcharge of 5.5% thereon is levied on all paid out and retained earnings. In addition to corporate income tax, income generated in Germany is subject to a trade tax that varies depending on the municipality in which the company is represented. Due to a constant rate of assessment for Ludwigshafen, Germany, in 2017, the weighted average trade tax rate was 14.1% (2016: 14.1%).
The 30% rate used to calculate deferred taxes for German Group companies remained unchanged in 2017. The profits of foreign Group companies are assessed using the tax rates applicable in their respective countries. These are also generally used to calculate deferred taxes to the extent that tax rate adjustments for the future have not yet been enacted.
The interest result improved by €148 million compared with the previous year from minus €482 million to minus €334 mil-lion as a result of higher interest income and lower interest expenses. Higher interest income arose particularly from interest rate and currency swaps to hedge BASF bonds as well as loans granted in connection with the financing of the Nord Stream 2 project. The decrease in interest expenses was largely due to lower liabilities to banks, commercial papers and related hedging transactions. The net interest expense from underfunded pension plans and similar obligations decreased in comparison with the previous year, as a result of the reduced net defined benefit liability as of December 31, 2016. The net interest expenses
for the respective business year are based on the discount rate and the defined benefit obligation at the beginning of the year. In comparison with 2016, income from the capitalization of borrowing costs declined due to the start up of major investment projects. The decline in other financial expenses was mostly attributable to lower costs for the hedging of loans in U.S. dollars.
The current tax expense for corporate income tax, solidarity surcharge and trade taxes (Germany) decreased due to lower income of the subsidiary companies in Germany. The changes in temporary differences were largely due to realization and currency effects in connection with provisions for pensions, financial liabilites, and intangible assets.
Changes in valuation allowances on deferred tax assets for tax loss carryforwards resulted in income of €6 million in 2017 and expenses of €7 million in 2016. Other taxes included real estate taxes and other compa-rable taxes totaling €107 million in 2017 and €109 million in 2016.
Million € 2017 2016
Current tax expense 1,832 1,654
Corporate income tax, solidarity surcharge and trade taxes (Germany) 464 589
Foreign income tax 1,438 1,184
Taxes for prior years (70) (119)
Deferred tax expense (+) / income (–) (384) (514)
From changes in temporary differences 30 (473)
From changes in tax loss carryforwards / unused tax credits (3) (43)
From changes in the tax rate (416) (6)
From valuation allowances on deferred tax assets 5 8
Income taxes 1,448 1,140
Other taxes as well as sales and consumption taxes 260 272
Tax expense 1,708 1,412
Tax expense

BASF Report 2017 Consolidated Financial Statements
Notes — Notes on statement of income199
Reconciliation of the income taxes and the effective tax rate
2017 2016
Million € % Million € %
Income before taxes and minority interests 7,800 – 5,395 –
Expected tax based on German corporate income tax (15%) 1,172 15.0 810 15.0
Solidarity surcharge 18 0.2 13 0.2
German trade tax 312 4.0 236 4.4
Foreign tax-rate differential 707 9.1 402 7.5
Tax-exempt income (20) (0.3) (46) (0.9)
Nondeductible expenses 66 0.8 76 1.4
Income after taxes of companies accounted for using the equity method (Income after taxes) (86) (1.1) (46) (0.9)
Taxes for prior years (70) (0.9) (119) (2.2)
Deferred tax liabilities for the future reversal of temporary differences associated with shares in participating interests (1) 0.0 (2) 0.0
Changes in the tax rate (416) (5.3) (6) (0.1)
Other (234) (2.9) (178) (3.3)
Income taxes/effective tax rate 1,448 18.6 1,140 21.1
The BASF Group tax rate amounted to 18.6% in 2017 (2016: 21.1%). The lower tax rates resulting from the tax reform in the United States led to deferred tax income in the amount of €379 million. The foreign tax-rate differential increased due to improve-ment in earnings in countries with a high tax rate, particularly in Norway, in the Exploration & Production business sector, and in Belgium. In Other, foreign currency translation differences from the valuation of differences to the tax values as well as additional tax depreciation on oil and gas production facilities in Norway led to tax income.
Taxes for prior years primarily included reversals of long-term tax provisions. Future reversals of temporary differences for shares in investments that are assumed to have a planning horizon of one year led to deferred tax income of €1 million in 2017 (2016: €2 million).
Deferred taxes
Deferred tax assets and liabilities (million €)
Deferred tax assets Deferred tax liabilities
2017 2016 2017 2016
Intangible assets 77 90 1,261 1,719
Property, plant and equipment 171 180 2,635 3,336
Financial assets 10 51 49 84
Inventories and accounts receivable 363 348 432 498
Provisions for pensions 2,603 3,028 617 431
Other provisions and liabilities 1,131 1,446 156 170
Tax loss carryforwards 222 279 – –
Other 42 107 82 95
Netting (2,501) (3,016) (2,501) (3,016)
Total 2,118 2,513 2,731 3,317

200 Consolidated Financial Statements BASF Report 2017
Notes — Notes on statement of income
Deferred taxes result from temporary differences between tax balances and the measurement of assets and liabilities according to IFRS as well as from tax loss carryforwards and unused tax credits. The remeasurement of all the assets and liabilities associated with acquisitions according to IFRS 3 has resulted in significant deviations between fair values and the values in the tax accounts. This leads primarily to deferred tax liabilities. Undistributed earnings of subsidiaries resulted in tempo-rary differences of €10,490 million in 2017 (2016: €8,905 mil-lion) for which deferred tax liabilities were not recognized, as they are either not subject to taxation on payout or they are expected to be reinvested for indefinite periods of time. Changes in valuation allowances on deferred tax assets amounted to €92 million, compared with €80 million in 2016. Thereof €24 million (2016: €30 million) pertained to tax loss carryforwards.
Tax loss carryforwards
The regional distribution of tax loss carryforwards is as follows:
Tax loss carryforwards (million €)
Tax loss carryforwards
Deferred tax assets
2017 2016 2017 2016
Germany – 1 – –
Foreign 1,485 2,383 222 279
Total 1,485 2,384 222 279
Tax loss carryforwards exist in all regions, especially in Europe and Asia. German tax losses may be carried forward indefinitely. In foreign countries, tax loss carryforwards are in some cases only possible for a limited period of time. The bulk of the tax loss carryforwards will expire in Europe by 2018 and in Asia by 2022. No deferred tax assets were recognized for tax loss carryforwards of €804 million (2016: €1,478 million).
Tax obligations
Tax obligations primarily include assessed income taxes and other taxes as well as estimated income taxes not yet assessed for the current year. Tax obligations amounted to €1,119 million in 2017 (2016: €1,288 million).
12 Minority interests
Million € 2017 2016
Minority interests in profits 299 229
Minority interests in losses (25) (30)
Total 274 199
Compared with the same period of 2016, higher minority interests in profits in 2017 arose particularly due to increased TDI and MDI sales prices and margins at Shanghai BASF Polyurethane Company Ltd., Shanghai, China.
For more information on minority interests in consolidated companies, see Note 21 on page 211
13 Personnel expenses and employees
Personnel expenses
The BASF Group spent €10,610 million on wages and salaries, social security contributions and expenses for pensions and assistance in 2017 (2016: €10,165 million). This represented an increase in personnel expenses of 4.4%. Besides wage and salary increases, this was particularly due to an increase in the average number of employees due to the acquisition of Chemetall. Countering this were the partial reversal of provi-sions for the Long Term Incentive (LTI) program as well as currency effects.
Personnel expenses (million €)
2017 2016
Wages and salaries 8,471 8,170
Social security contributions and expenses for pensions and assistance 2,139 1,995
Thereof for pension benefits 705 627
Personnel expenses 10,610 10,165

BASF Report 2017 Consolidated Financial Statements
Notes — Notes on balance sheet201
Number of employees
As of December 31, 2017, the number of employees rose to 115,490 employees compared with 113,830 employees as of December 31, 2016. It was distributed over the regions as follows:
Number of employees as of December 31
2017 2016
Europe 71,653 70,784
Thereof Germany 54,020 53,318
North America 18,295 17,583
Asia Pacific 18,256 18,156
South America, Africa, Middle East 7,286 7,307
BASF Group 115,490 113,830
Thereof apprentices and trainees 3,103 3,120
temporary staff 2,550 2,334
Employees from joint operations are included in the number of employees at year end relative to BASF’s share in the respec-tive company. In total, this included 472 employees in 2017 (2016: 432 employees).
The average number of employees was distributed over the regions as follows:
Average number of employees
2017 2016
Europe 71,043 69,873
Thereof Germany 53,390 52,608
North America 17,871 17,308
Asia Pacific 18,132 17,473
South America, Africa, Middle East 7,287 7,321
BASF Group 114,333 111,975
Thereof apprentices and trainees 2,793 2,838
temporary staff 2,691 2,365
Employees from joint operations are included in the average number of employees relative to BASF’s share in the com pany. This comprised a total of 437 employees (2016: 404 employ-ees).
Notes on balance sheet
14 Intangible assets
The goodwill of BASF is allocated to 24 cash-generating units (2016: 22), which are defined either on the basis of business units or on a higher level. Annual impairment testing took place in the fourth quarter of the year on the basis of the cash-generating units. Recoverable amounts were determined in most cases using the value in use. This was done using plans approved by company management and their respective cash flows, generally for the next five years. Thereafter, a terminal value was calculated using a forward projection from the last detailed planning year as a perpetual annuity. The planning is based on experience, current performance and management’s best possible estimates on the future development of individual parameters, such as raw materials prices and profit margins. Oil and gas prices are also among the main input parameters that provide the basis for the forecast of cash flows in the current financial plans. Market assumptions regarding, for example, economic development and market growth are included based on external macroeconomic sources as well as sources specific to the industry. The required discounting of cash flows for impairment testing is calculated with the weighted average cost of capital rate after tax, which is determined using the Capital Asset Pricing Model. It comprises a risk-free rate, a market risk premium, and a spread for credit risk based on the respective industry-specific peer group. The calculation also takes into account capital structure and the beta factor of the respective peer group as well as the average tax rate of each cash- generating unit. Impairment tests of the units (excluding Exploration & Production in the Oil & Gas segment) were conducted assuming a weighted average cost of capital rate
after taxes between 5.69% and 8.2% (2016: between 5.07% and 8.01%). This represents a weighted average cost of capital rate before taxes of between 7.13% and 11.31% (2016: between 6.43% and 10.77%). A valuation model based on a field-related valuation approach has been used, for the unit Exploration & Production in the Oil & Gas segment since the business year 2016, which considers the expected cash flows as well as the tax payments in the individual countries. The period under consideration includes the planned license terms and the production profiles of the included oil and gas fields. Furthermore, instead of using a single weighted average cost of capital rate, the country risk and the specific tax rate is considered in each case: this leads to a more precise calculation of the recoverable amount. Considering these parameters, the capital rate after taxes varied between 7.92% and 12.85% (2016: between 7.5% and 13.76%) and before taxes between 11.32% and 20.07% (2016: between 10.96% and 37.68%). After determining the recoverable amount of the cash- generating units, it was determined for the large majority of them that reasonable possible deviations from the key assumptions would not lead to the carrying amounts of the units exceeding their respective recoverable amounts. For the goodwill of the Construction Chemicals division and the cash-generating units Pigments in the Dispersions & Pigments division, as well as Surface Treatment in the Coatings division, this is not the case.

202 Consolidated Financial Statements BASF Report 2017
Notes — Notes on balance sheet
Goodwill of cash-generating units (million €)
2017 2016
Cash-generating unit Goodwill Growth rate1 Goodwill Growth rate1
Crop Protection division 1,929 2.0% 2,093 2.0%
Exploration & Production in the Oil & Gas segment 1,504 – 1,712 –
Catalysts division (excluding battery materials) 1,285 2.0% 1,390 2.0%
Construction Chemicals division 732 2.0% 735 1.5%
Personal care ingredients in the Care Chemicals division 499 2.0% 531 2.0%
Pigments in the Dispersions & Pigments division 389 1.5% 431 2.0%
Surface Treatment in the Coatings division 1,490 2.0% 1,555 –
Other cash-generating units 1,525 0.0–2.0% 1,626 0.0–2.0%
Goodwill as of December 31 9,353 10,073
1 Growth rates used in impairment tests to determine terminal values in accordance with IAS 36
In the 2017 business year, the recoverable amount of the Construction Chemicals unit exceeded the carrying amount by around €408 million. The weighted average cost of capital rate after taxes used for impairment testing was 8.2% (2016: 8.01%). The recoverable amount would equal the unit’s carrying amount if the weighted average cost of capital rate increased by 0.98 percentage points (2016: by 0.69 percent-age points) or if income from operations of the last detailed planning year – as the basis for the terminal value – were lower by 15.97% (2016: by 12.0%). In 2017, the recoverable amount of Pigments exceeded the carrying amount by €9 million. The weighted average cost of capital rate after taxes used for impairment testing was 6.05% (2016: 5.09%). The recoverable amount would equal the unit’s carrying amount if the weighted average cost of capital rate increased by 0.04 percentage points (2016: by 0.51 percentage points) or if income from operations of the last
detailed planning year – as the basis for the terminal value – were lower by 0.81% (2016: by 13.78%). An impairment test for the Surface Treatment unit in the Coatings division was carried out for the first time in the business year 2017 (acquisition in December 2016). In 2017, the recoverable amount of this unit exceeded the carrying amount by €100 million. The weighted average cost of capital rate after taxes used for the impairment testing of this unit was 8.19% (2016: –). The recoverable amount would equal the unit’s carrying amount if the weighted average cost of capital rate increased by 0.2 percentage points (2016: –) or if income from operations of the last detailed planning year – as the basis for the terminal value – were 6.1% lower (2016: –).
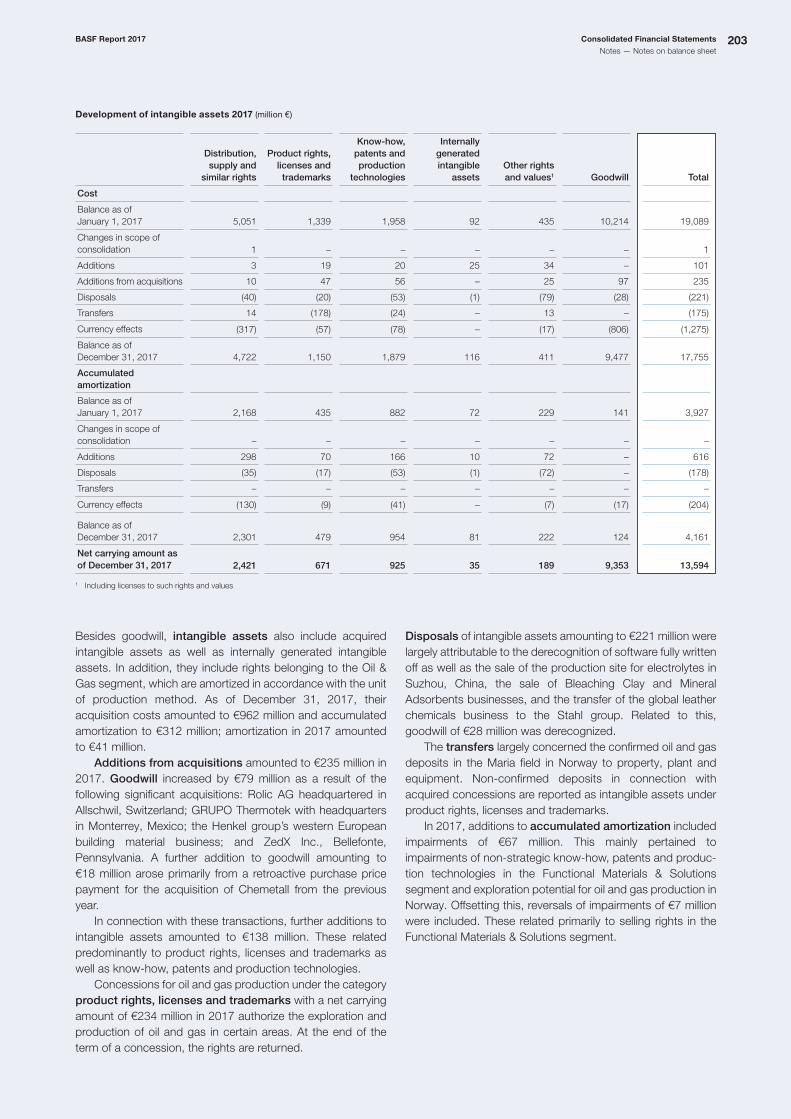
BASF Report 2017 Consolidated Financial Statements
Notes — Notes on balance sheet203
Development of intangible assets 2017 (million €)
Distribution, supply and
similar rights
Product rights, licenses and trademarks
Know-how, patents and production
technologies
Internally generated intangible
assetsOther rights and values1 Goodwill Total
Cost
Balance as of January 1, 2017 5,051 1,339 1,958 92 435 10,214 19,089
Changes in scope of consolidation 1 – – – – – 1
Additions 3 19 20 25 34 – 101
Additions from acquisitions 10 47 56 – 25 97 235
Disposals (40) (20) (53) (1) (79) (28) (221)
Transfers 14 (178) (24) – 13 – (175)
Currency effects (317) (57) (78) – (17) (806) (1,275)
Balance as of December 31, 2017 4,722 1,150 1,879 116 411 9,477 17,755
Accumulated amortization
Balance as of January 1, 2017 2,168 435 882 72 229 141 3,927
Changes in scope of consolidation – – – – – – –
Additions 298 70 166 10 72 – 616
Disposals (35) (17) (53) (1) (72) – (178)
Transfers – – – – – – –
Currency effects (130) (9) (41) – (7) (17) (204)
Balance as of December 31, 2017 2,301 479 954 81 222 124 4,161
Net carrying amount as of December 31, 2017 2,421 671 925 35 189 9,353 13,594
1 Including licenses to such rights and values
Besides goodwill, intangible assets also include acquired intangible assets as well as internally generated intangible assets. In addition, they include rights belonging to the Oil & Gas segment, which are amortized in accordance with the unit of production method. As of December 31, 2017, their acquisition costs amounted to €962 million and accumulated amortization to €312 million; amortization in 2017 amounted to €41 million. Additions from acquisitions amounted to €235 million in 2017. Goodwill increased by €79 million as a result of the following significant acquisitions: Rolic AG headquartered in Allschwil, Switzerland; GRUPO Thermotek with headquarters in Monterrey, Mexico; the Henkel group’s western European building material business; and ZedX Inc., Bellefonte, Pennsylvania. A further addition to goodwill amounting to €18 million arose primarily from a retroactive purchase price payment for the acquisition of Chemetall from the previous year. In connection with these transactions, further additions to intangible assets amounted to €138 million. These related predominantly to product rights, licenses and trademarks as well as know-how, patents and production technologies. Concessions for oil and gas production under the category product rights, licenses and trademarks with a net carrying amount of €234 million in 2017 authorize the exploration and production of oil and gas in certain areas. At the end of the term of a concession, the rights are returned.
Disposals of intangible assets amounting to €221 million were largely attributable to the derecognition of software fully written off as well as the sale of the production site for electrolytes in Suzhou, China, the sale of Bleaching Clay and Mineral Adsorbents businesses, and the transfer of the global leather chemicals business to the Stahl group. Related to this, goodwill of €28 million was derecognized. The transfers largely concerned the confirmed oil and gas deposits in the Maria field in Norway to property, plant and equipment. Non-confirmed deposits in connection with acquired concessions are reported as intangible assets under product rights, licenses and trademarks. In 2017, additions to accumulated amortization included impairments of €67 million. This mainly pertained to impairments of non-strategic know-how, patents and produc-tion technologies in the Functional Materials & Solutions segment and exploration potential for oil and gas production in Norway. Offsetting this, reversals of impairments of €7 million were included. These related primarily to selling rights in the Functional Materials & Solutions segment.

204 Consolidated Financial Statements BASF Report 2017
Notes — Notes on balance sheet
Besides goodwill, intangible assets also include acquired intangible assets as well as internally generated intangible assets. In addition, they include rights belonging to the Oil & Gas segment, which are amortized in accordance with the unit of production method. As of December 31, 2016, their acqui-sition costs amounted to €1,029 million and accumulated amortization to €328 million; amortization in 2016 amounted to €19 million. Additions from acquisitions amounted to €2,789 million in 2016. Significant acquisitions comprising the purchase of the global surface treatment provider Chemetall from Albe-marle Corp., Charlotte, North Carolina, and the automotive refinishing business from Guangdong Yinfan Chemistry, Jiangmen, China, led to an increase of goodwill in the amount of €1,552 million. In connection with these transactions, additions to intangible assets amounted to €1,237 million. These were primarily related to customer relationships and production technologies.
Disposals of intangible assets in the amount of €21 million were largely attributable to the sale of the 25% share in the Byrding field to Statoil and the divestiture of the global photoinitiator business as well as the global polyolefin catalysts business. Related to this, goodwill of €64 million was derecognized. Concessions for oil and gas production under the category product rights, licenses and trademarks with a net carrying amount of €466 million in 2016 authorize the exploration and production of oil and gas in certain areas. At the end of the term of a concession, the rights are returned. In 2016, additions to accumulated amortization included impairments of €61 million. This primarily affected impairments relating to production technologies and distribution rights in the Functional Materials & Solutions segment in the amount of €51 million.
Development of intangible assets 2016 (million €)
Distribution, supply and
similar rights
Product rights, licenses and trademarks
Know-how, patents and production
technologies
Internally generated intangible
assetsOther rights and values1 Goodwill Total
Cost
Balance as of January 1, 2016 4,063 1,318 1,951 91 450 8,500 16,373
Changes in scope of consolidation – – – – – 2 2
Additions – 18 39 10 25 – 92
Additions from acquisitions 1,082 44 108 – 3 1,552 2,789
Disposals (343) (39) (149) (9) (60) (64) (664)
Transfers (2) (16) (12) – 13 – (17)
Currency effects 251 14 21 – 4 224 514
Balance as of December 31, 2016 5,051 1,339 1,958 92 435 10,214 19,089
Accumulated amortization
Balance as of January 1, 2016 2,160 411 865 67 196 137 3,836
Changes in scope of consolidation
Additions 260 47 153 14 86 – 560
Disposals (339) (24) (146) (9) (55) – (573)
Transfers (1) – – – – – (1)
Currency effects 88 1 10 – 2 4 105
Balance as of December 31, 2016 2,168 435 882 72 229 141 3,927
Net carrying amount as of December 31, 2016 2,883 904 1,076 20 206 10,073 15,162
1 Including licenses to such rights and values

BASF Report 2017 Consolidated Financial Statements
Notes — Notes on balance sheet205
15 Property, plant and equipment
Machinery and technical equipment contain oil and gas deposits, including related wells, production facilities and
further infrastructure, which are depreciated according to the unit of production method.
Development of property, plant and equipment 2017 (million €)
Land, land rights and buildings
Machinery and technical
equipment
Thereof depre-ciation accor-
ding to the unit of production
method
Miscellaneous equipment and
fixturesConstruction in
progress Total
Cost
Balance as of January 1, 2017 11,257 49,893 7,180 4,437 5,989 71,576
Changes in scope of consolidation – 14 – – 1 15
Additions 171 1,292 450 272 2,285 4,020
Additions from acquisitions – 7 – 1 – 8
Disposals (131) (825) (17) (280) (36) (1,272)
Transfers 367 2,635 890 128 (2,945) 185
Currency effects (495) (2,458) (563) (171) (495) (3,619)
Balance as of December 31, 2017 11,169 50,558 7,940 4,387 4,799 70,913
Accumulated depreciation
Balance as of January 1, 2017 5,969 35,655 3,711 3,308 231 45,163
Changes in scope of consolidation – 14 – – – 14
Additions 385 2,878 931 335 (12) 3,586
Disposals (95) (761) (3) (266) (32) (1,154)
Transfers – (50) – (1) 53 2
Currency effects (194) (1,626) (310) (112) (24) (1,956)
Balance as of December 31, 2017 6,065 36,110 4,329 3,264 216 45,655
Net carrying amount as of December 31, 2017 5,104 14,448 3,611 1,123 4,583 25,258
Additions to property, plant and equipment arising from investment projects amounted to €4,020 million in 2017. Material investments included the acetylene plant currently under construction as well as plants for the production of catalysts in Ludwigshafen, Germany. Additions also com-prised the construction of an aroma ingredients complex in Kuantan, Malaysia, and the modification of production plants for plasticizers in Pasadena, Texas, which have already partly started up. Material investments were also made for the con-struction of oil and gas facilities and wells in Europe and South America. Furthermore, investments were particularly made at the sites in Ludwigshafen, Germany; Antwerp, Belgium; Shanghai, China; Freeport, Texas; Geismar, Louisiana; and Port Arthur, Texas. Government grants for the funding of investment measures reduced asset additions by €9 million. Acquisitions led to an increase in property, plant and equipment in the amount of €8 million primarily from the acqui-sition of GRUPO Thermotek in Monterrey, Mexico. In 2017, impairments of €262 million were included in accumulated depreciation. These pertained largely to machinery and technical equipment and resulted primarily from the full impairment of a production plant in the Chemicals segment due to overcapacities. The recoverable amount equaled value in use and the weighted average cost of capital rate before taxes was 10.27%.
Depreciation also included impairments in the Oil & Gas segment, which were overcompensated by reversals in the same segment. These primarily concerned construction in progress. In total, reversals of impairments in additions to accumulated depreciation amounted to €182 million. Disposals of property, plant and equipment were largely attributable to the sale of the Bleaching Clay and Mineral Adsorbents businesses; the production site for electrolytes in Suzhou, China; the inorganic specialties business; and the leather chemicals business.
For more information on divestitures, see Note 2.4 from page 187 onward
The transfers largely concerned the confirmed oil and gas deposits in the Maria field in Norway from intangible assets to machinery and technical equipment. Currency effects reduced property, plant and equipment by €1,663 million and arose mainly from the depreciation of the U.S. dollar relative to the euro.

206 Consolidated Financial Statements BASF Report 2017
Notes — Notes on balance sheet
Development of property, plant and equipment 2016 (million €)
Land, land rights and buildings
Machinery and technical
equipment
Thereof depre-ciation accor-
ding to the unit of production
method
Miscellaneous equipment and
fixturesConstruction in
progress Total
Cost
Balance as of January 1, 2016 10,711 45,805 5,972 4,216 6,502 67,234
Changes in scope of consolidation (1) – – 2 – 1
Additions 183 1,300 309 203 2,536 4,222
Additions from acquisitions 77 54 – 18 6 155
Disposals (194) (760) (30) (213) (88) (1,255)
Transfers 322 2,796 716 165 (3,145) 138
Currency effects 159 698 213 46 178 1,081
Balance as of December 31, 2016 11,257 49,893 7,180 4,437 5,989 71,576
Accumulated depreciation
Balance as of January 1, 2016 5,637 32,965 2,827 3,152 220 41,974
Changes in scope of consolidation (1) – – – – (1)
Additions 376 2,930 939 307 78 3,691
Disposals (100) (658) (28) (182) (73) (1,013)
Transfers (1) 1 – 1 – 1
Currency effects 58 417 (27) 30 6 511
Balance as of December 31, 2016 5,969 35,655 3,711 3,308 231 45,163
Net carrying amount as of December 31, 2016 5,288 14,238 3,469 1,129 5,758 26,413
Additions to property, plant and equipment arising from investment projects amounted to €4,222 million in 2016. Material investments were primarily related to the construction of an integrated aroma ingredients complex in Kuantan, Malaysia, the TDI complex in Ludwigshafen, Germany, and the expansion of the dicamba plant in Beaumont, Texas, which were partially started up in 2016. Further material asset additions included the construction of an ammonia plant in Freeport, Texas, and oil and gas production facilities and wells in Europe and South America. In addition, investments for expansion purposes were particularly made at the sites in Ludwigshafen, Germany; Geismar, Louisiana; Port Arthur, Texas; and Antwerp, Belgium. Government grants of €1 million were deducted from asset additions. Due to acquisitions, property, plant and equipment rose by €155 million primarily from the acquisition of the global surface treatment provider Chemetall from Albemarle Corp., Charlotte, North Carolina. In 2016, impairments of €254 million were included in accumulated depreciation. These pertained largely to
impairments of €133 million on machinery and technical equipment as well as buildings due to the new strategic direction of individual businesses in the Chemicals and Functional Materials & Solutions segments. The recoverable amount of these assets equals their value in use amounting to €72 million. The weighted average cost of capital rate before taxes applied ranged between 9.4% and 12.8%. In 2016, additions to accumulated depreciation contained reversals of impairments of €2 million. Disposals of property, plant and equipment were largely attributable to the sale of assets of the global polyolefin catalysts business to W.R. Grace & Co., Columbia, Maryland; the sale of the worldwide photoinitiator business to IGM Resins B.V., Waalwijk, Netherlands; the sale of the 25% share in the Byrding field to Statoil; and the sale of industrial coatings business to the AkzoNobel Group. Currency effects arose particularly from the appreciation of the U.S. dollar as well as the Brazilian real relative to the euro.

BASF Report 2017 Consolidated Financial Statements
Notes — Notes on balance sheet207
16 Investments accounted for using the equity method and other financial assets
Investments accounted for using the equity method (million €)
2017 2016
Balance as of January 1 4,647 4,436
Changes in scope of consolidation (50) –
Additions 223 152
Disposals (82) (1)
Transfers 120 (27)
Currency effects (143) 87
Net carrying amount as of December 31 4,715 4,647
Other financial assets (million €)
December 31, 2017 December 31, 2016
Other shareholdings 482 468
Long-term securities 124 137
Other financial assets 606 605
Changes in the scope of consolidation arose particularly from the first-time consolidation of a company. Additions arose from the completed combination of the global leather chemicals business with the Stahl group on September 29, 2017. In connection with this, BASF received a 16.6% share in Stahl Lux 2 S.A., Luxembourg. Additions also included capital increases amounting to €34 million.
A significant component of the disposals totaling €82 million was the capital reduction at W & G Infrastruktur Finan-zierungs-GmbH, Kassel, Germany. Besides the net income of investments accounted for us-ing the equity method, transfers include dividend distributions and other comprehensive income of the companies.
For a detailed overview of income from companies accounted for using the equity method, see Note 9 on page 197
17 Inventories
Million € December 31, 2017 December 31, 2016
Raw materials and factory supplies 3,255 3,107
Work-in-process, finished goods and merchandise 6,979 6,808
Advance payments and services-in-process 69 90
Inventories 10,303 10,005
Work-in-process, finished goods and merchandise are combined into one item due to the production conditions in the chemical industry. Services-in-process primarily relate to services not invoiced as of the balance sheet date. Cost of sales included inventories recognized as an expense amounting to €29,941 million in 2017, and €26,048 million in 2016.
A reversal of a write-down on inventory was recognized in the amount of €18 million in 2017 and a write-down in the amount of €43 million in 2016. Of total inventories, €863 million was measured at net realizable value in 2017 and €836 million in 2016.

208 Consolidated Financial Statements BASF Report 2017
Notes — Notes on balance sheet
18 Receivables and miscellaneous assets
Other receivables and miscellaneous assets (million €)
December 31, 2017 December 31, 2016
Noncurrent Current Noncurrent Current
Loans and interest receivables 782 245 568 250
Derivatives with positive fair values 91 321 176 342
Receivables from finance leases 25 4 29 5
Insurance compensation receivables 0 41 6 14
Miscellaneous 111 329 126 406
Other receivables and assets which qualify as financial instruments 1,009 940 905 1,017
Prepaid expenses 54 249 62 258
Defined benefit assets 70 – 66 –
Tax refund claims 125 787 114 747
Employee receivables – 8 – 10
Precious metal trading items – 746 – 690
Miscellaneous 74 375 63 356
Other receivables and assets which do not qualify as financial instruments 323 2,165 305 2,061
Other receivables and miscellaneous assets 1,332 3,105 1,210 3,078
The increase in noncurrent loans and interest receivables was predominantly due to the loan in the amount of €325 million granted by Wintershall Nederland Transport and Trading B.V., Rijswijk, Netherlands, to Nord Stream 2 AG, and the loan in the amount of €140 million granted by W & G Trans-port Holding GmbH, Kassel, Germany, to W & G Infrastruktur Finanzierungs-GmbH, Kassel, Germany, in 2017. In 2017, the loans granted by the fully consolidated WIGA Transport Betei-ligungs-GmbH & Co. KG, Kassel, Germany, to NEL Gastrans-port GmbH, Kassel, Germany, and GASCADE Gastransport GmbH, Kassel, Germany were transferred to the W & G Infra-struktur Finanzierungs-GmbH, which is accounted for using the equity method, and had an offsetting effect of €259 million. In addition to the loans granted already mentioned, there were particularly loans and interest receivables from BASF Belgium Coordination Center Comm. V. Antwerp, Belgium, to finance the business expansion of Asian companies, and receivables in favor of BASF SE from the BASF Pensionskasse VVaG.
The reduction of noncurrent derivatives with positive fair values primarily affected the market valuation of combined interest rate and currency swaps. The change in current derivatives with positive fair market values was largely attributable to the lower fair values of precious metal and foreign currency derivatives. Prepaid expenses in 2017 included prepayments of €62 million related to operating activities compared with €64 million in 2016, as well as €50 million in prepayments for insurance in 2017 compared with €54 million in 2016. Prepayments for license costs decreased from €48 million in 2016 to €42 million in 2017. The increase in current tax refund claims can largely be traced back to the rise in open income tax receivables. Precious metal trading items primarily comprise physical items and precious metal accounts as well as long positions in precious metals, which are largely hedged through sales or derivatives.
Valuation allowances for receivables 2017 (million €)
Balance as of January 1,
2017
Additions recognized in
income
Reversals recognized in
income
Additions not recognized in
income
Reversals not recognized in
income
Balance as of December 31,
2017
Accounts receivable, trade 370 80 38 12 75 349
Other receivables 118 10 6 – 10 112
Total 488 90 44 12 85 461

BASF Report 2017 Consolidated Financial Statements
Notes — Notes on balance sheet209
Changes recognized in income contained individual valuation allowances, group-wise individual valuation allowances and valuation allowances due to transfer risks. Changes not recognized in income were primarily related to changes in the scope of consolidation, translation adjust-ments and derecognition of uncollectible receivables. In the current economic environment, BASF has not observed any material changes in the credit quality of its receivables. In 2017, individual valuation allowances of €61 million were recognized for accounts receivable, trade, and €15 million were reversed. In 2016, individual valuation allowances of €71 million were recognized for trade accounts receivable and valuation allowances of €22 million were reversed.
At BASF, a comprehensive, global credit insurance program covers trade accounts receivable. As part of a global excess of loss policy, future bad debts are insured for essentially all BASF Group companies excluding joint ventures. No compen-sation claims were incurred in either 2016 or 2017. In 2017, individual valuation allowances of €10 million were recognized for other receivables and €6 million were reversed. In 2016, individual valuation allowances of €27 mil-lion were recognized for other receivables and €1 million was reversed.
Aging analysis of accounts receivable, trade (million €)
December 31, 2017 December 31, 2016
Gross value Valuation allowances Gross value Valuation allowances
Not yet due 10,449 35 10,295 26
Past due less than 30 days 527 1 381 2
Past due between 30 and 89 days 115 6 159 8
Past due more than 90 days 448 307 487 334
Total 11,539 349 11,322 370
As of December 31, 2017, there were no material other receivables classified as financial instruments that were overdue and for which no valuation allowance was made.
Valuation allowances for receivables 2016 (million €)
Balance as of January 1,
2016
Additions recognized in
income
Reversals recognized in
income
Additions not recognized in
income
Reversals not recognized in
income
Balance as of December 31,
2016
Accounts receivable, trade 298 106 35 40 39 370
Other receivables 75 27 1 24 7 118
Total 373 133 36 64 46 488
19 Capital, reserves and retained earnings
Authorized capital
At the Annual Shareholders’ Meeting on May 2, 2014, share-holders authorized the Board of Executive Directors, with the approval of the Supervisory Board, to increase the subscribed capital by issuing new registered shares up to a total of €500 million against cash or contributions in kind through May 1, 2019. The Board of Executive Directors is empowered, following the approval of the Supervisory Board, to decide on the exclusion of shareholders’ subscription rights for these new shares in certain predefined cases covered by the enabling resolution. Until now, this option has not been exercised and no new shares have been issued. BASF SE has only issued fully paid-up registered shares with no par value. There are no preferences or other restric-tions. BASF SE does not hold any treasury shares.
Conditional capital
At the Annual Shareholders’ Meeting of May 12, 2017, shareholders authorized the Board of Executive Directors, with the approval of the Supervisory Board, to issue, on a one-off basis or in portions on more than one occasion, bearer or registered convertible bonds and/or bonds with warrants, or combinations of these instruments, with or without maturity limitations up to a nominal value of €10 billion through May 11, 2022. The calculated portion of the share capital represented by the BASF shares to be issued in connection with the debt instruments issued under this authorization may not exceed 10% of the share capital. To this effect, the share capital was increased conditionally by up to €117,565,184 by issuing a maximum of 91,847,800 new registered BASF shares. The conditional capital increase will only be carried out to the extent to which holders of convertible bonds, or warrants attached to bonds with

210 Consolidated Financial Statements BASF Report 2017
Notes — Notes on balance sheet
20 Other comprehensive income
Translation adjustments
Especially the increase in the value of the euro, relative to the U.S. dollar, in 2017 led to a decrease of €2.081 million in the translation adjustment to minus €605 million.
Cash flow hedges
Hedging future cash flows at Nord Stream AG, Zug, Switzer-land, a company accounted for using the equity method, resulted in a change of minus €17 million in 2017 and of minus €7 million in 2016.
For more information on cash flow hedge accounting, see Note 27.4 from page 227 onward
Remeasurement of defined benefit plans
In 2017, other comprehensive income increased by €1,073 million before taxes due to the positive development of plan assets. In 2016, the change amounting to minus €1,842 million was particularly due to the increase in defined benefit obligations, which resulted from the significant decrease in the discount rate over the course of the year.
For more information on the remeasurement of defined benefit plans, see Note 22 from page 211 onward
warrants issued, exercise their conversion or option rights. Until now, this authorization has not been exercised.
Authorization of share buybacks
At the Annual Shareholders’ Meeting of May 12, 2017, shareholders authorized the Board of Executive Directors to buy back shares up until May 11, 2022, in accordance with section 71(1) no. 8 of the German Stock Corporation Act. The buyback cannot exceed 10% of the company’s share capital at the time the resolution was passed and can take place via the stock exchange, a public purchase offer addressed to all shareholders, or a public request to the shareholders to submit sales offers. Until now, this authorization has not been exercised.
Reserves and retained earnings
Capital surplus includes effects from BASF’s share program, premiums from capital increases and consideration for warrants and negative goodwill from the capital consolidation resulting from acquisitions of subsidiaries in exchange for the issue of BASF SE shares at par value.
Million €Dec. 31,
2017Dec. 31,
2016
Legal reserves 678 625
Other retained earnings 34.148 30.890
Retained earnings 34.826 31.515
Transfers from other retained earnings increased legal reserves by €53 million in 2017 (2016: €31 million). The acquisition of shares in companies which BASF already controls or which are included as a joint arrangement in the Consolidated Financial Statements is treated as a transaction between shareholders, as long as this does not lead to a change in the consolidation method. There were no transactions of this type in 2017, as in the previous year.
Payment of dividends
In accordance with the resolution of the Annual Shareholders’ Meeting on May 12, 2017, BASF SE paid a dividend of €3.00 per share from the retained profit of the 2016 fiscal year. With 918,478,694 qualifying shares, this represented total divi-dends of €2,755,436,082.00. The remaining €53,131,213.65 in retained profits was recorded under retained earnings.

BASF Report 2017 Consolidated Financial Statements
Notes — Notes on balance sheet211
22 Provisions for pensions and similar obligations
In addition to state pension plans, most employees are granted company pension benefits from either defined contribution or defined benefit plans. Benefits generally depend on years of service, contributions or compensation, and take into con sideration the legal framework of labor, tax and social security laws of the countries where the companies are located. To limit the risks of changing financial market conditions as well as demographic developments, employees have been almost exclusively offered defined contribution plans for future years of service in recent years. The Group Pension Committee monitors the risks of all pension plans of the Group. In this context, it issues guidelines regarding the governance and risk management of pension plans, particularly with regard to the funding of the pension plans and the portfolio structure of the existing plan assets. The organization, responsibilities, strategy, implementation and reporting requirements are documented for the units involved.
Economic and legal environment of the plans
In some countries – especially in Germany, the United King-dom, Switzerland and Belgium – there are pension obligations subject to government supervision or similar legal restrictions. For example, there are minimum funding requirements to cover pension obligations, which are based on actuarial assumptions that may differ from those in IAS 19. Furthermore, there are restrictions in qualitative and quantitative terms relating to parts of the plan assets for the investment in certain asset categories. This could result in fluctuating employer contributions, financing requirements and the assumption of obligations in favor of the pension funds to comply with the regulatory requirements.
The obligations and the plan assets used to fund the obliga-tions are exposed to demographic, legal and economic risks. Economic risks are primarily due to unforeseen developments on commodity and capital markets. They affect, for example, pension adjustments based on the level of inflation in Germany and in the United Kingdom, as well as the impact of the discount rate on the amount of the defined benefit obligation. In previous years, measures taken to close plans with defined benefits for future service, especially benefits based on final pay promises and the assumption of healthcare costs for former employees, however, led to a reduction in risk with regard to future benefit levels. The strategy of the BASF Group with regard to financing pension commitments is aligned with country-specific supervisory and tax regulations. In some countries, pension benefits were granted for which the employer has a subsidiary liability. Pension benefits in a number of countries include minimum interest guarantees to a limited extent. If the pension fund cannot generate the income needed to service the minimum guarantee, this must be provided by the employer under the subsidiary liability. To the extent that recourse to the employer is unlikely based on the structure and provision of the pension benefits as well as the asset situation of the pension fund, these plans are treated as defined contribution plans.
21 Minority interests
December 31, 2017 December 31, 2016
Equity interest Equity interest
Group company Partner % Million € % Million €
WIGA Transport Beteiligungs-GmbH & Co. KG,W & G Transport Holding GmbH1, OPAL Gastransport GmbH & Co. KG1
Gazprom Germania GmbH, Berlin, Germany
49.98 1 71
49.98 1 (43)
BASF India Ltd., Mumbai, India Free float 26.67 39 26.67 36
BASF PETRONAS Chemicals Sdn. Bhd., Shah Alam, Malaysia
PETRONAS Chemicals Group Berhad, Kuala Lumpur, Malaysia 40.00 198 40.00 235
BASF TOTAL Petrochemicals LLC, Port Arthur, Texas Total Petrochemicals & Refining USA, Inc., Houston, Texas 40.00 243 40.00 260
Shanghai BASF Polyurethane Company Ltd., Shanghai, China
Shanghai Huayi (Group) Company, Shanghai, China, and Sinopec Shanghai Gaoqiao Petrochemical Corporation, Shanghai, China 30.00 199
30.00 95
BASF TODA Battery Materials, LLC, Tokyo, Japan TODA KOGYO CORP., Hiroshima, Japan 34.00 26 34.00 34
BASF Shanghai Coatings Co. Ltd., Shanghai, China Shanghai Huayi Fine Chemical Co., Ltd,Shanghai, China 40.00 57 40.00 56
Other 86 88
Total 919 761
1 Equity interest in W & G Transportation Holding GmbH and OPAL Gastransport GmbH & Co. KG: 50.03 %; voting rights and portion of earnings: 49.98 %
212 Consolidated Financial Statements BASF Report 2017
Notes — Notes on balance sheet
Description of the defined benefit plans
The typical plan structure in the individual countries is described in the following. Different arrangements may exist, in particular due to the assumption of plans as part of acquisi-tions; however, these do not have any material impact on the description of plans in the individual countries.
Germany For BASF SE and German Group companies, a basic level of benefits is provided by BASF Pensionskasse VVaG, a legally independent funded plan, which is financed by contributions of employees and the employer as well as the return on plan assets. BASF SE ensures the necessary contributions to adequately finance the benefits promised by BASF Pensions-kasse VVaG. Some of the benefits financed via the BASF Pensions kasse VVaG are subject to adjustments that must be borne by its member companies to the extent that these cannot be borne by BASF Pensionskasse VVaG due to the regulations imposed by the German supervisory authority. In 2004, the basic benefits plan at BASF was closed for newly hired employees at German BASF companies and replaced by a defined contribution plan. At BASF SE, occupational pension promises that exceed the basic level of benefits are financed under a contractual trust arrangement by BASF Pensionstreu-hand e.V.; at German Group companies, these benefits are almost exclusively financed via pension provisions. The benefits are largely based on cash balance plans. Furthermore, employees are given the option of participating in various deferred compensation schemes.
United States Employees are granted benefits based on defined contribution plans. Since 2010, the existing defined benefit plans were closed to further increases in benefits based on future years of service, and benefits earned in the past have been frozen. There is no entitlement to pension adjustments to compensate for cost-of-living increases. The legal and regulatory frameworks governing the plans are based on the U.S. Employee Retirement Income Security Act (ERISA), which requires the plan sponsor to ensure a minimum funding level. Any employer contributions necessary to meet the minimum funding level would be based on the results of an actuarial valuation. Furthermore, there are unfunded pension plans that are not subject to ERISA.
Additional similar obligations arise from plans which assume the healthcare costs and life insurance premiums of retired employees and their dependents. Such plans are closed to new entrants since 2007. In addition, the amount of the benefits for such plans is frozen.
Switzerland The employees of the BASF Group in Switzerland receive a company pension, which is financed through a pension fund by employer and employee contributions as well as the return on assets. The pension plan is accounted for as a defined benefit plan, as the obligatory minimum pension guaranteed by law according to the Swiss law “Berufliche Vorsorge (BVG)” is included in the scheme. All benefits vest immediately. According to government regulations, the employer is obligat-ed to make contributions, so that the pension funds are able to grant minimum benefits guaranteed by law. The pension funds are managed by boards, where employer and employees are equally represented, which steer and monitor the benefit plans and assets.
United Kingdom Employees are granted benefits based on a defined contribu-tion plan. The BASF Group maintains defined benefit plans in the United Kingdom, which were closed for further increases in benefit from future years of service. Adjustments to compen-sate for increases in the cost of living until the beginning of retirement are legally required for beneficiaries of defined benefit plans. The financing of the pension plans is determined by the provisions of the regulatory authority for pensions and the relevant social and labor law requirements. The defined benefit plans are administered by a trust company, whose Board of Trustees, according to the trustee agreement and law, represents the interests of the beneficiaries and ensures that the benefits can be paid in the future. The required funding is determined using technical valuations according to local regulations every three years.
Other countries In the case of subsidiaries in other countries, defined benefits are covered in some cases by pension provisions, but mainly by external insurance companies or pension funds.

BASF Report 2017 Consolidated Financial Statements
Notes — Notes on balance sheet213
Actuarial assumptions
The valuation of the defined benefit obligation is largely based on the following assumptions:
Assumptions used to determine the defined benefit obligation as of December 31
Germany United States SwitzerlandUnited
Kingdom
2017 2016 2017 2016 2017 2016 2017 2016
Discount rate 1.90 1.80 3.60 4.00 0.50 0.60 2.60 2.80
Projected pension increase 1.50 1.50 – – – – 3.10 3.10
Assumptions used to determine expenses for pension benefits in the respective business year
Germany United States SwitzerlandUnited
Kingdom
2017 2016 2017 2016 2017 2016 2017 2016
Discount rate 1.80 2.50 4.00 4.20 0.60 0.80 2.80 4.00
Projected pension increase 1.50 1.50 – – – – 3.10 2.90
The assumptions used to ascertain the defined benefit obligation as of December 31 are used in the following year to determine the expenses for pension plans. A Group-wide, uniform procedure is used to determine the discount rates used for the valuation of material pension obligations of the BASF Group. Accordingly, the discount rates were derived from the yields on corporate bonds in the respective currency zones with an issuing volume of more than 100 million units of the respective currency with a minimum rating of AA– up to AA+ from at least one of the three rating agencies: Fitch, Moody’s, or Standard & Poor’s. The valuation of the defined benefit obligation is generally made using the most recent actuarial mortality tables as of December 31 of the respective business year, which in Germany and the United States are derived from
the BASF Group population and were last updated for the pension obligations in Germany in 2015 and for the pension obligations in the United States in 2014.
Actuarial mortality tables (significant countries) as of Dec. 31, 2017
Germany Heubeck Richttafeln 2005G (modified)
United States RP-2014 (modified) with MP-2014 generational projection
Switzerland BVG 2015 generational
United Kingdom S1PxA (standard actuarial mortality tables for self-administered plans (SAPS))
A change in the material actuarial assumptions would have the following effects on the defined benefit obligation:
Sensitivity of the defined benefit obligation as of December 31 (million €)
Increase by 0.5 percentage points Decrease by 0.5 percentage points
2017 2016 2017 2016
Discount rate (1,930) (1,990) 2,200 2,270
Projected pension increase 1,240 1,175 (1,130) (1,110)
An alternative valuation of the defined benefit obligation was conducted in order to determine how changes in the underly-ing assumptions would influence the amount of the defined benefit obligation. A linear extrapolation of these amounts
based on alternative changes in the assumptions as well as an addition of combined changes in the individual assumptions is not possible.
Sensitivity analysis

214 Consolidated Financial Statements BASF Report 2017
Notes — Notes on balance sheet
Development of defined benefit obligation (million €)
2017 2016
Defined benefit obligation as of January 1 27,603 24,861
Current service cost 400 360
Interest cost 568 671
Benefits paid (1,048) (1,024)
Participants’ contributions 48 49
Actuarial gains/losses
for adjustments relating to financial assumptions 1 2,571
adjustments relating to demographic assumptions (2) (20)
experience adjustments (5) 66
Effects from acquisitions and divestitures 8 148
Past service cost 2 (14)
Plan settlements – –
Other changes 124 (2)
Currency effects (828) (63)
Defined benefit obligation as of December 31 26,871 27,603
As of December 31, 2017, the weighted average duration of the defined benefit obligation amounted to 15.5 years (previous year: 15.7 years).
Composition of expenses for pension benefits (million €)
2017 2016
Expenses for defined benefit plans 402 346
Expenses for defined contribution plans 303 281
Expenses for pension benefits (recognized in income from operations) 705 627
Net interest expenses from underfunded pension plans and similar obligations 175 183
Net interest income from overfunded pension plans (2) (5)
Interest cost for the asset ceiling – –
Expenses for pension benefits (recognized in the financial result) 173 178
Explanation of the amounts in the statement of income and balance sheet
The net interest on the defined benefit liability is recognized in the financial result. This results from the difference between the interest cost of the defined benefit obligation and the standardized return on plan assets as well as the interest cost for the asset ceiling. The expected contribution payments and
benefits paid over the course of the business year are considered in the determination of net interest. Net interest expense of the respective business year is based on the discount rate and the defined benefit obligation at the beginning of the year.

BASF Report 2017 Consolidated Financial Statements
Notes — Notes on balance sheet215
Development of plan assets (million €)
2017 2016
Plan assets as of January 1 19,460 18,681
Standardized return on plan assets 393 492
Deviation between actual and standardized return on plan assets 1,067 775
Employer contributions 1,102 207
Participants’ contributions 48 49
Benefits paid (919) (627)
Effects from acquisitions and divestitures (2) 64
Past service cost – –
Plan settlements – –
Other changes 106 (20)
Currency effects (607) (161)
Plan assets as of December 31 20,648 19,460
The standardized return on plan assets is calculated by multiplying plan assets at the beginning of the year with the discount rate used for existing defined benefit obligations at the beginning of the year, taking into account benefit and contribution payments expected to be made during the year. The expected contribution payments for 2018 amount to approximately €200 million.
Special contributions were made in 2017 to improve the fund-ing levels of the plans. These primarily related to BASF Pen-sionstreuhand e.V. (€500 million), BASF Pensions kasse VVaG (€317 million) and the U.S. plans ($143 million).
Development of the net defined benefit liability (million €)
2017 2016
Net defined benefit liability as of January 1 (8,143) (6,180)
Current service cost (400) (360)
Interest cost (568) (671)
Standardized return on plan assets 393 492
Deviation between actual and standardized return on plan assets 1,067 775
Actuarial gains/losses of the defined benefit obligation 6 (2,617)
Changes in asset ceiling recognized directly in equity – –
Benefits paid by unfunded plans 129 397
Employer contributions 1,102 207
Effects from acquisitions and divestitures (10) (84)
Past service cost (2) 14
Other changes (18) (18)
Currency effects 221 (98)
Net defined benefit liability as of December 31 (6,223) (8,143)
Thereof defined benefit assets 70 66
provisions for pensions and similar obligations (6,293) (8,209)
Regional allocation of defined benefit plans as of December 31 (million €)
Pension obligations Plan assets Net defined benefit liability
2017 2016 2017 2016 2017 2016
Germany 18,104 18,242 13,576 12,282 (4,528) (5,960)
United States 4,053 4,524 2,687 2,806 (1,366) (1,718)
Switzerland 2,070 2,272 1,889 1,974 (181) (298)
United Kingdom 1,884 1,909 1,880 1,898 (4) (11)
Other 760 656 616 500 (144) (156)
Total 26,871 27,603 20,648 19,460 (6,223) (8,143)

216 Consolidated Financial Statements BASF Report 2017
Notes — Notes on balance sheet
Current funding situation of the pension plans as of December 31 (million €)
2017 2016
Defined benefit obligation Plan assets
Defined benefit obligation Plan assets
Unfunded pension plans 2,814 – 2,869 –
Funded pension plans 24,057 20,648 24,734 19,460
Total 26,871 20,648 27,603 19,460
Defined contribution plans and government pensions
The contributions to defined-contribution plans contained in income from operations amounted to €303 million in 2017 and €281 million in 2016.
Contributions to government pension plans were €592 million in 2017 and €590 million in 2016.
Explanations regarding plan assets
The target asset allocation has been defined by using asset liability studies and is reviewed regularly. Accordingly, plan assets are aligned with the long-term development of the obligations, taking into consideration the risks associated with the specific asset classes and the regulations relating to the investment of plan assets. The existing portfolio structure is oriented towards the target asset allocation. In addition, current market assessments are taken into consideration. In order to mitigate risks and maximize returns, a widely spread global portfolio of individual assets is held. Liability-driven investment (LDI) techniques, such as hedg-ing the risk of changes in interest rates and inflation, are used in some pension plans, especially in the U.K. and U.S. plans.
Structure of plan assets (%)
2017 2016
Equities 29 28
Debt instruments 52 53
Thereof for government debtors 16 16
for other debtors 36 37
Real estate 3 4
Alternative investments 15 15
Cash and cash equivalents 1 –
Total 100 100
The asset class debt instruments comprises promissory notes and debentures (Pfandbriefe) in addition to corporate and government bonds. Government bonds primarily concern bonds from those countries enjoying the highest credit ratings, such as the United States, United Kingdom, Germany and Switzerland. Corporate bonds mainly comprise invest-ment-grade bonds, whereby particular high-yield bonds are
also held to a limited extent. In connection with the ongoing monitoring of default risk based on a given risk budget and on the continuous observation of the development of the credit-worthiness of issuers, an adjustment of plan asset allocation to a revised market assessment may be made, if necessary. Alternative investments largely comprise investments in private equity, absolute return funds and senior secured loans. Almost all of the equities are priced on active markets. The category debt instruments includes promissory notes and debentures (Pfandbriefe), which were acquired through private placements with a market value in the amount of €575 million as of December 31, 2017, and €853 million as of December 31, 2016. For such securities, especially those held by domestic pension plans, there is no active market. The capital market compensates for this lack of fungibility with yield premiums depending on the maturity. With only a few exceptions, there is no active market for plan assets in real estate and alternative investments. Plan assets contained securities issued by BASF Group companies with a market value of €15 million in 2017 and €16 million in 2016. The market value of the properties of l egally independent pension funds rented to BASF Group companies amounted to €111 million on December 31, 2017, and €117 million on December 31, 2016. Since 2010 there has been an agreement between BASF SE and BASF Pensionskasse about the granting of profit participation capital with a nominal value of €80 million, which is used to strengthen the financing of the BASF Pen-sionskasse. In 2017, a number of special endowments were provided to improve the funding levels of the plans. No material transactions beyond this took place between the legally independent pension funds and BASF Group companies in 2017. The funding of the plans was as follows:

BASF Report 2017 Consolidated Financial Statements
Notes — Notes on balance sheet217
23 Other provisions
December 31, 2017 December 31, 2016
Million € Thereof current Thereof current
Restoration obligations 1,296 17 1,297 29
Environmental protection and remediation costs 600 112 588 116
Employee obligations 2,173 1,553 1,933 1,217
Obligations from sales and purchase contracts 1,080 1,070 928 919
Restructuring measures 143 119 208 161
Litigation, damage claims, warranties and similar commitments 103 48 109 37
Other 1,312 310 1,406 323
Total 6,707 3,229 6,469 2,802
Restoration obligations primarily relate to the estimated costs for the filling of wells and the removal of production equipment after the end of production in the Oil & Gas segment. Provisions for environmental protection and remedia-tion costs cover expected costs for rehabilitating conta-minated sites, recultivating landfills, removal of environmental contamination at existing production or storage sites and similar measures. Provisions for employee obligations primarily include obligations for the granting of long-service bonuses and anniversary payments, variable compensation including associated social security contributions, as well as provisions for early retirement programs for employees nearing retirement. The increase was primarily attributable to higher accruals for variable compensation components.
For more information on provisions for the long-term incentive program, see Note 30 from page 231 onward
Obligations from sales and purchase contracts largely include obligations arising from rebates granted and other price discounts in the Agricultural Solutions segment, warranties and product liability, sales commissions, expected losses on contracts. The increase in provisions resulted from higher accruals for rebate programs and for product liabilities.
The restructuring measures provisions include severance payments to departing employees as well as expected costs for site closures, including the costs for demolition and similar measures. Provisions for litigation, damage claims, warranties and similar commitments contain anticipated expenses from lawsuits in which BASF is the defendant party, as well as obligations under damage claims against BASF and fines. Other largely includes noncurrent tax provisions. The following table shows the development of other provisions by category. Other changes include changes in the scope of consolidation, divestitures, currency effects and the reclassification of obligations to liabilities when the amount and timing of these obligations become known.
Development of other provisions in 2017 (million €)
Jan. 1, 2017 Additions
Unwinding of the
discount Utilization ReversalsOther
changesDec. 31,
2017
Restoration obligations 1,297 108 29 (30) (21) (87) 1,296
Environmental protection and remediation costs 588 111 3 (60) (5) (37) 600
Employee obligations 1,933 1,720 2 (1,235) (154) (93) 2,173
Obligations from sales and purchase contracts 928 1,027 – (681) (66) (128) 1,080
Restructuring measures 208 35 – (65) (22) (13) 143
Litigation, damage claims, warranties and similar commitments 109 54 – (24) (24) (12) 103
Other 1,406 264 1 (225) (85) (49) 1,312
Total 6,469 3,319 35 (2,320) (377) (419) 6,707
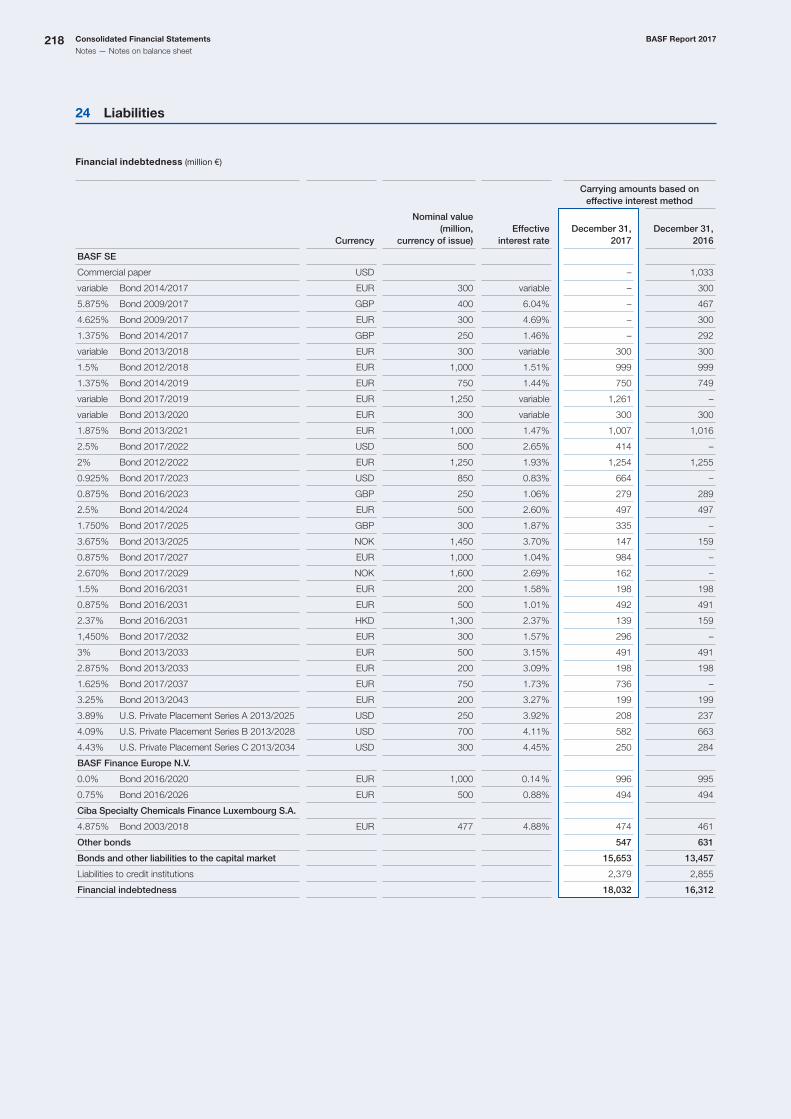
218 Consolidated Financial Statements BASF Report 2017
Notes — Notes on balance sheet
24 Liabilities
Financial indebtedness (million €)
Carrying amounts based on effective interest method
Currency
Nominal value (million,
currency of issue)Effective
interest rateDecember 31,
2017December 31,
2016
BASF SE
Commercial paper USD – 1,033
variable Bond 2014/2017 EUR 300 variable – 300
5.875% Bond 2009/2017 GBP 400 6.04% – 467
4.625% Bond 2009/2017 EUR 300 4.69% – 300
1.375% Bond 2014/2017 GBP 250 1.46% – 292
variable Bond 2013/2018 EUR 300 variable 300 300
1.5% Bond 2012/2018 EUR 1,000 1.51% 999 999
1.375% Bond 2014/2019 EUR 750 1.44% 750 749
variable Bond 2017/2019 EUR 1,250 variable 1,261 –
variable Bond 2013/2020 EUR 300 variable 300 300
1.875% Bond 2013/2021 EUR 1,000 1.47% 1,007 1,016
2.5% Bond 2017/2022 USD 500 2.65% 414 –
2% Bond 2012/2022 EUR 1,250 1.93% 1,254 1,255
0.925% Bond 2017/2023 USD 850 0.83% 664 –
0.875% Bond 2016/2023 GBP 250 1.06% 279 289
2.5% Bond 2014/2024 EUR 500 2.60% 497 497
1.750% Bond 2017/2025 GBP 300 1.87% 335 –
3.675% Bond 2013/2025 NOK 1,450 3.70% 147 159
0.875% Bond 2017/2027 EUR 1,000 1.04% 984 –
2.670% Bond 2017/2029 NOK 1,600 2.69% 162 –
1.5% Bond 2016/2031 EUR 200 1.58% 198 198
0.875% Bond 2016/2031 EUR 500 1.01% 492 491
2.37% Bond 2016/2031 HKD 1,300 2.37% 139 159
1,450% Bond 2017/2032 EUR 300 1.57% 296 –
3% Bond 2013/2033 EUR 500 3.15% 491 491
2.875% Bond 2013/2033 EUR 200 3.09% 198 198
1.625% Bond 2017/2037 EUR 750 1.73% 736 –
3.25% Bond 2013/2043 EUR 200 3.27% 199 199
3.89% U.S. Private Placement Series A 2013/2025 USD 250 3.92% 208 237
4.09% U.S. Private Placement Series B 2013/2028 USD 700 4.11% 582 663
4.43% U.S. Private Placement Series C 2013/2034 USD 300 4.45% 250 284
BASF Finance Europe N.V.
0.0% Bond 2016/2020 EUR 1,000 0.14 % 996 995
0.75% Bond 2016/2026 EUR 500 0.88% 494 494
Ciba Specialty Chemicals Finance Luxembourg S.A.
4.875% Bond 2003/2018 EUR 477 4.88% 474 461
Other bonds 547 631
Bonds and other liabilities to the capital market 15,653 13,457
Liabilities to credit institutions 2,379 2,855
Financial indebtedness 18,032 16,312

BASF Report 2017 Consolidated Financial Statements
Notes — Notes on balance sheet219
Breakdown of financial indebtedness by currency (million €)
December 31, 2017 December 31, 2016
Euro 13,326 10,897
U.S. dollar 2,922 3,346
British pound 614 1,048
Norwegian krone 309 159
Hong Kong dollar 139 159
Argentinian peso 137 194
Chinese renminbi 127 118
South African rand 73 28
Turkish lira 65 59
Ukrainian hryvnia 63 55
Japanese yen 58 –
Brazilian real 53 113
Indonesian rupiah 43 29
Other currencies 103 107
Total 18,032 16,312
Maturities of financial indebtedness (million €)
December 31, 2017 December 31, 2016
Following year 1 2,497 3,767
Following year 2 2,052 1,887
Following year 3 1,845 2,115
Following year 4 1,140 1,304
Following year 5 1,781 1,049
Following year 6 and maturities beyond this year 8,717 6,190
Total 18,032 16,312
Other bonds
Other bonds consist primarily of industrial revenue and pollution control bonds of the BASF Corporation group that were used to finance investments in the United States. Both the weighted-average interest rate of these bonds as well as their weighted-average effective interest rate amounted to 3.1% in 2017 and 2.1% in 2016. The average residual term amounted to 183 months as of December 31, 2017 (Decem-ber 31, 2016: 195 months).
Liabilities to credit institutions
In order to finance the natural gas transportation business, a €1,650 million loan was incurred with a 5-year term at an interest rate of 1.08% in 2014. In 2017, €925 million of this amount was transferred to the newly established company W & G Infrastruktur Finanzierungs-GmbH, Kassel, Germany, accounted for using the equity method, to finance the natural gas transportation companies, GASCADE Gastranport GmbH, Kassel, Germany, and NEL Gastransport GmbH, Kassel, Germany, which are also accounted for using the equity method. The weighted average interest rate on loans amounted to 4.1% in 2017 compared with 4.5% in 2016.
Unused credit lines
BASF SE had committed and unused credit lines with variable interest rates amounting to €6,000 million both as of Decem-ber 31, 2017 and as of December 31, 2016.

220 Consolidated Financial Statements BASF Report 2017
Notes — Notes on balance sheet
Other liabilities (million €)
December 31, 2017 December 31, 2016
Noncurrent Current Noncurrent Current
Derivatives with negative fair values 290 274 78 571
Liabilities from finance leases 99 25 84 22
Loan and interest liabilities 283 212 280 199
Miscellaneous liabilities 94 1,289 97 791
Other liabilities which qualify as financial instruments 766 1,800 539 1,583
Advances received on orders – 564 – 556
Liabilities related to social security 67 77 95 68
Employee liabilities 28 253 45 310
Liabilities from precious metal trading positions – 17 – 13
Deferred income 197 78 171 66
Miscellaneous liabilities 37 275 23 254
Other liabilities which do not qualify as financial instruments 329 1,264 334 1,267
Other liabilities 1,095 3,064 873 2,850
Other liabilities
The increase in current other liabilities was primarily due to cash deposits from group companies accounted for using the equity method, which are reported under miscellaneous lia-bilities. Current derivatives with negative fair values decreased due to negative fair market values arising from foreign currency hedging. By contrast, the noncurrent negative fair values increased. This related primarily to higher negative fair values from hedging using combined interest and cross-currency swaps involving USD, GBP and HKD bonds.
For more information on financial risks and derivative instruments, see Note 27 from page 222 onward
For more information on liabilities arising from leasing contracts, see Note 28 from page 228 onward
Secured liabilities (million €)
Dec. 31, 2017
Dec. 31, 2016
Liabilities to credit institutions 22 24
Accounts payable, trade 6 6
Other liabilities 169 63
Secured liabilities 197 93
Liabilities to credit institutions were secured primarily with registered land charges. The increase in secured other liabili-ties compared with December 31, 2016, is primarily attribut-able to higher collateral for derivative instruments with negative fair values. As in the previous year, there were no secured contingent liabilities in 2017.
25 Other financial obligations
The figures listed below are stated at nominal value:
Million € December 31, 2017 December 31, 2016
Bills of exchange 9 9
Guarantees 11 12
Warranties 49 43
Collateral granted on behalf of third-party liabilities 1 1
Initiated investment projects 4,109 5,394
Thereof purchase commitments 1,045 1,391
for the purchase of intangible assets 16 7
Payment and loan commitments and other financial obligations 19 25
BASF provides unlimited guarantees, particularly to the Danish government as well as the state-owned company Nordsøfon-den, as a precondition for the exploration for and production of hydrocarbons in the Danish concession area by the joint ven-ture Wintershall Noordzee B.V., Rijswijk, Netherlands. Partially
countering the possible 100% liability of BASF arising from these guarantees are the 50% guarantees of the joint-venture partner in favor of BASF. Drawing on these guarantees was not foreseeable as of December 31, 2017.

BASF Report 2017 Consolidated Financial Statements
Notes — Notes on balance sheet221
26 Risks from litigation and claims
In the arbitration proceedings initiated in May 2013, Metrogas S.A., Chile, claims damages valued in an amount of €227 million as a result of insufficient gas deliveries against Wintershall Energía S.A., Argentina (WIAR), Total Austral S.A., Argentina, and Pan American Energy LLC, Argentina. The defendants, as sellers, concluded a natural gas supply contract with Metrogas in 1997. WIAR’s share of supply in the contract is 37,5%. After the resignation of the chairman of the Arbitral Tribunal in mid-2016, the International Chamber of Commerce (ICC) nominated a new Arbitral Tribunal that pursued the arbitration proceedings during 2017. The hearing took place in April 2017. On February 2, 2018, the Arbitral Tribunal dismissed the Metrogas claim in its entirety and imposed the procedural costs on Metrogas. BASF Corporation has potential liability under the Comprehensive Response, Compensation and Liability Act of 1980, as amended, and related state laws for investigation and cleanup at certain sites. The Lower Passaic River Study Area (LPRSA) is one such site comprising the lower 17 miles of the Passaic River in New Jersey. BASF Corporation and more than 60 other companies (collectively, the Lower Passaic River Study Area Cooperating Parties Group or CPG) are conduct-ing a remedial investigation / feasibility study (RI/FS) of the LPRSA. In 2016, the United States Environmental Protection Agency (USEPA) selected a final remedy for the lower 8 miles of the LPRSA. An agreement with USEPA on work in the upper portion of the LPRSA may occur as early as 2018.
Between November 2014 and March 2015, a putative class action lawsuit and several additional lawsuits were filed in the United States District Court of the Southern District of New York against BASF Metals Limited (BML), based in the United Kingdom, along with other defendants, alleging violations of antitrust and commodities laws stemming from the price discovery process for platinum and palladium. The lawsuits were consolidated, and a Second Consolidated Amended Class Action Complaint was eventually filed in July 2015. This Complaint also names as a defendant, among others, BASF Corporation. On September 21, 2015, the defendants filed a Joint Motion to Dismiss the Second Consolidated Amended Class Action Complaint, and BML and BASF Cor-poration filed individual motions to dismiss. On March 28, 2017, the Court dismissed the Second Consolidated Amended Class Action Complaint against BASF Corporation and BML on jurisdictional grounds. On May 15, 2017, the plaintiffs filed an amended Complaint that renews allegations against defendants and BML, while BASF Corporation is not named as a defendant. The defendants filed a renewed Joint Motion to Dismiss and BML filed a renewed Motion to Dismiss. A pro se complaint filed in September 2015 was dismissed by the U.S. District Court on October 19, 2017. The plaintiff filed an appeal to the U.S. Court of Appeals on November 19, 2017. Furthermore, BASF SE and its affiliated companies are defendants in or parties to a variety of judicial, arbitrational or regulatory proceedings on a recurring basis. To our current knowledge, none of these proceedings will have a material effect on the economic situation of BASF.
Assets used under long-term leases
Assets used under long-term leases primarily concerned buildings and IT infrastructure.
For more information on liabilities arising from leasing contracts, see Note 28 from page 228 onward
Obligations arising from long-term leases (excluding finance leases) (million €)
2018 362
2019 273
2020 207
2021 137
2022 111
2023 and maturities beyond this year 320
Total 1,410
Obligations arising from purchase contracts
Obligations arising from purchase contracts resulted primarily from long-term purchase obligations for raw materials. Firm purchase obligations as of December 31, 2017, were as follows:
Obligations arising from purchase contracts (million €)
2018 7,306
2019 4,776
2020 2,688
2021 2,374
2022 2,362
2023 and maturities beyond this year 7,112
Total 26,618
Further possible obligations arising from agreements existing as of December 31, 2017 are shown in 2.4: Acquisitions and divestitures.

222 Consolidated Financial Statements BASF Report 2017
Notes — Notes on balance sheet
27 Supplementary information on financial instruments
27.1 Financial risks
Market risks
Foreign currency risks: Changes in exchange rates could lead to losses in the value of financial instruments and adverse changes in future cash flows from planned transactions. For-eign currency risks from financial instruments result from the translation at the closing rate of financial receivables, loans, securities, cash and financial liabilities into the functional cur-rency of the respective Group company. Foreign currency contracts in a variety of currencies are used to hedge foreign exchange risks from nonderivative financial instruments and planned transactions. The foreign currency risk exposure corresponds to the net amount of the nominal volume of the primary and the deriva-tive financial instruments which are exposed to currency risks. In addition, planned purchase and sales transactions of the respective following year are included, if they fall under the currency risk management system. Long and short positions in the same currency are offset against each other. The sensitivity analysis is conducted by simulating a 10% appreciation of the respective functional currency against the other currencies. The effect on BASF’s income before taxes and minority interests would have been minus €252 million as of December 31, 2017, and minus €300 million as of Decem-ber 31, 2016. The effect from the items designated under hedge accounting would have increased the equity of the shareholders of BASF SE before income taxes by €46 million as of December 31, 2017 (2016: increase of €24 million). This only refers to transactions in U.S. dollars. The foreign currency risk exposure amounted to €1,976 million as of December 31, 2017 and €2,113 million as of December 31, 2016.
Exposure and sensitivity by currency (million €)
December 31, 2017 December 31, 2016
Exposure Sensitivity Exposure Sensitivity
USD 1,410 (143) 1,849 (241)
Other 566 (63) 264 (35)
Total 1,976 (206) 2,113 (276)
Due to the use of options to hedge currency risks, the sensitivity analysis is not a linear function of the assumed changes in exchange rates. Interest rate risks: Interest rate risks result from changes in prevailing market interest rates, which can cause a change in the fair value of fixed-rate instruments, and changes in the interest payments of variable-rate instruments. To hedge these risks, interest rate swaps and combined interest rate and currency derivatives are used. While these risks are relevant to the financing activities of BASF, they are not of material significance for BASF’s operating activities. The variable interest exposure, which also includes fixed rate bonds set to mature in the following year, amounted to minus €986 million as of December 31, 2017 (2016: minus €2,447 million). An increase in all relevant interest rates by one percentage point would have raised income before taxes and minority interests by €4 million as of December 31, 2017, and raised income before taxes and minority interests by €1 million as of December 31, 2016. The effect from the items designated under hedge accounting would have increased the equity of the shareholders of BASF SE before income taxes by €9 mil-lion as of December 31, 2017 (2016: increase of €16 million).
Carrying amount of nonderivative interest-bearing financial instruments (million €)
December 31, 2017 December 31, 2016
Fixed interest rate
Variable interest rate
Fixed interest rate
Variable interest rate
Loans 569 439 208 610
Securities 88 87 105 568
Financial indebtedness 14,703 3,329 12,564 3,748
Nominal and fair values of interest rate swaps and combined interest and cross-currency swaps (million €)
December 31, 2017 December 31, 2016
Nominal value Fair value Nominal value Fair value
Interest rate swaps 600 (13) 1,700 (27)
Thereof payer swaps 600 (13) 1,700 (27)
Combined interest and cross-currency swaps 3,337 (175) 2,745 45
Thereof fixed rate 3,337 (175) 2,476 121

BASF Report 2017 Consolidated Financial Statements
Notes — Notes on balance sheet223
Commodity price risks: Some of BASF’s divisions are exposed to strong fluctuations in raw materials prices. These result primarily from raw materials (for example naphtha, propylene, benzene, lauric oils, cyclohexane, methanol, natural gas, butadiene, LPG condensate and ammonia) as well as from precious metals. BASF takes the following measures to reduce price risks associated with the purchase of raw materials: – BASF uses commodity derivatives to hedge the risks from the volatility of raw materials prices. These are primarily options and swaps on crude oil, oil products and natural gas.
– In the Oil & Gas segment, risks to margins arise in volatile markets when purchase and sales contracts are priced differently. Corresponding oil and gas derivatives are used to hedge these risks.
– The Catalysts division enters into both short-term and long-term purchase contracts with precious metal producers. It also buys precious metals on spot markets from a variety of business partners. The price risk from precious metals purchased to be sold on to third parties, or for use in the production of catalysts, is hedged using derivative instruments. This is mainly done using forward contracts which are settled by either entering into offsetting contracts or by delivering the precious metals.
– In the Crop Protection division, the sales prices of products are sometimes coupled to the price of certain agricultural commodities. To hedge the resulting risks, derivatives on agricultural commodities are concluded.
In addition, BASF holds limited unhedged precious metal and oil product positions, which can also include derivatives, for trading on its own account. The value of these positions is exposed to market price volatility and is subject to constant monitoring. In connection with CO2 emissions trading, various types of CO2 certificates are purchased and sold using forward contracts. The goal of these transactions is to benefit from market price differences. These deals are settled by physical delivery. As of December 31, 2017 and as of December 31, 2016, there were no deals outstanding. By holding commodity derivatives and precious metal trading positions, BASF is exposed to price risks. The valua-tion of commodity derivatives and precious metal trading positions at fair value means that adverse changes in market prices could negatively affect the earnings and equity of BASF. BASF performs value-at-risk analyses for all commodity derivatives and precious metals trading positions. Using the value-at-risk analysis, we continually quantify market risk and forecast the maximum possible loss within a given confidence interval over a defined period. The value-at-risk calculation is based on a confidence interval of 95% and a holding period of one day. The value-at-risk calculation for precious metals is based on a confidence interval of 99%. BASF uses the variance-covariance approach. BASF uses value at risk as a supplement to other risk management tools. Besides value at risk, BASF sets volume-based limits as well as exposure and stop-loss limits.
Exposure to commodity derivatives (million €)
December 31, 2017 December 31, 2016
ExposureValue at
Risk ExposureValue at
Risk
Crude oil, oil products and natural gas 90 1 6 1
Precious metals 36 2 5 1
Emission certificates – – – –
Agricultural commodities 0 0 (40) 0
Total 126 3 (29) 2
The exposure corresponds to the net amount of all long and short positions of the respective commodity category.
For more information regarding financial risks and BASF’s risk manage-ment, see the Opportunities and risks report in the Management’s Report from page 111 onward
Default and credit risk
Default and credit risks arise when counterparties do not fulfill their contractual obligations. BASF regularly analyzes the creditworthiness of each significant debtor and grants credit limits on the basis of this analysis. Due to the global activities and diversified customer structure of the BASF Group, there is no significant concentration of default risk. The carrying amount of all receivables, loans and interest-bearing securities plus the nominal value of other financial obligations subject to default risk represents the maximum default risk for BASF.
For more information on credit risks, see Note 18 from page 208 onward
Liquidity risks
BASF promptly recognizes any risks from cash flow fluctua-tions as part of the liquidity planning. BASF has ready access to sufficient liquid funds from our ongoing commercial paper program and confirmed lines of credit from banks.
27.2 Maturity analysisThe interest and principal payments as well as other payments for derivative financial instruments are relevant for the presen-tation of the maturities of the contractual cash flows from financial liabilities. Future cash flows are not discounted here. Derivatives are included using their net cash flows, provided they have a negative fair value and therefore represent a liability. Derivatives with positive fair values are assets and are therefore not considered. Trade accounts payable are generally interest-free and due within one year. Therefore, the carrying amount of trade accounts payable equals the sum of future cash flows.

224 Consolidated Financial Statements BASF Report 2017
Notes — Notes on balance sheet
Maturities of contractual cash flows from financial liabilities as of December 31, 2017 (million €)
Bonds and other liabilities to the capital market
Liabilities to credit
institutions
Liabilities resulting from
derivative finan-cial instruments
Miscellaneous liabilities Total
2018 2,097 698 180 1,578 4,553
2019 2,237 34 70 80 2,421
2020 1,527 541 8 82 2,158
2021 1,219 132 – 46 1,397
2022 1,865 113 50 38 2,066
2023 and thereafter 9,234 861 225 278 10,598
Total 18,179 2,379 533 2,102 23,193
Maturities of contractual cash flows from financial liabilities as of December 31, 2016 (million €)
Bonds and other liabilities to the capital market
Liabilities to credit
institutions
Liabilities resulting from
derivative finan-cial instruments
Miscellaneous liabilities Total
2017 2,687 1,356 561 1,097 5,701
2018 2,025 128 15 88 2,256
2019 936 1,368 11 47 2,362
2020 1,475 10 13 53 1,551
2021 1,163 5 – 81 1,249
2022 and thereafter 7,269 4 60 305 7,638
Total 15,555 2,871 660 1,671 20,757
27.3 Classes and categories of financial instru-ments
For trade accounts receivable, other receivables and miscella-neous assets, loans, cash and cash equivalents, as well as trade accounts payable and other liabilities, the carrying amount approximates the fair value. Shareholdings which are not traded on an active market and whose fair value could not be reliably determined are recognized at amortized cost and are reported under other financial assets.
The fair value of financial indebtedness is determined on the basis of interbank interest rates. The difference between carry-ing amounts and fair values results primarily from changes in market interest rates.

BASF Report 2017 Consolidated Financial Statements
Notes — Notes on balance sheet225
Carrying amounts and fair values of financial instruments as of December 31, 2017 (million €)
Carrying amount
Total carrying amount within
scope of application of
IFRS 7
Valuation category in
accordance with IAS 392 Fair value
Thereof fair value
level 13
Thereof fair value
level 24
Thereof fair value
level 35
Shareholdings1 482 482 Afs – – – –
Receivables from finance leases 29 29 n/a 29 – – –
Accounts receivable, trade 11,190 11,190 LaR 11,190 – – –
Derivatives – no hedge accounting 340 340 aFVtPL 340 14 326 –
Derivatives – with hedge accounting 72 72 n/a 72 – 72 –
Other receivables and other assets6 3,996 1,508 LaR 1,508 – – –
Securities 175 175 Afs 175 175 – –
Securities 1 1 Htm – – – –
Cash and cash equivalents 6,495 6,495 LaR 6,495 6,495 – –
Total assets 22,780 20,292 19,809 6,684 398 –
Bonds 15,653 15,653 AmC 16,406 – – –
Commercial paper – – AmC – – – –
Liabilities to credit institutions 2,379 2,379 AmC 2,379 – – –
Liabilities from finance leases 124 124 n/a 124 – – –
Accounts payable, trade 4,971 4,971 AmC 4,971 – – –
Derivatives – no hedge accounting 551 551 aFVtPL 551 36 515 –
Derivatives – with hedge accounting 13 13 n/a 13 – 13 –
Other liabilities 6 3,471 1,878 AmC 1,878 – – –
Total liabilities 27,162 25,569 26,322 36 528 –
Carrying amounts and fair values of financial instruments as of December 31, 2016 (million €)
Carrying amount
Total carrying amount within
scope of application of
IFRS 7
Valuation category in
accordance with IAS 392 Fair value
Thereof fair value
level 13
Thereof fair value
level 24
Thereof fair value
level 35
Shareholdings1 468 468 Afs – – – –
Receivables from finance leases 34 34 n/a 34 – – –
Accounts receivable, trade 10,952 10,952 LaR 10,952 – – –
Derivatives – no hedge accounting 346 346 aFVtPL 346 14 332 –
Derivatives – with hedge accounting 172 172 n/a 172 – 172 –
Other receivables and other assets6 3,736 1,370 LaR 1,370 – – –
Securities 672 672 Afs 672 672 – –
Securities 1 1 Htm – – – –
Cash and cash equivalents 1,375 1,375 LaR 1,375 1,375 – –
Total assets 17,756 15,390 14,921 2,061 504 –
Bonds 12,424 12,424 AmC 13,144 – – –
Commercial paper 1,033 1,033 AmC 1,033 – – –
Liabilities to credit institutions 2,855 2,855 AmC 2,855 – – –
Liabilities from finance leases 106 106 n/a 106 – – –
Accounts payable, trade 4,610 4,610 AmC 4,610 – – –
Derivatives – no hedge accounting 623 623 aFVtPL 623 0 623 –
Derivatives – with hedge accounting 26 26 n/a 26 – 26 –
Other liabilities 6 2,968 1,367 AmC 1,367 – – –
Total liabilities 24,645 23,044 23,764 0 649 –
1 The difference between carrying amount and fair value results from shareholdings measured at acquisition cost, for which the fair value could not be reliably determined (2017: €482 million; 2016: €468 million).
2 Afs: available-for-sale (category: available-for-sale financial assets); LaR: loans and receivables (category: loans and receivables); aFVtPL: at-fair-value-through-profit-or-loss (catego-ry: financial assets and liabilities at fair value recognized in the income statement); AmC: amortized cost (category: financial liabilities which are not derivatives); Htm: Held-to-maturity (category: financial assets held to maturity); a more detailed description of the categories can be found in Note 1 from page 173 onward.
3 Determination of the fair value based on quoted, unadjusted prices on active markets4 Determination of the fair value based on parameters for which directly or indirectly quoted prices on active markets are available5 Determination of the fair value based on parameters for which there is no observable market data6 Not including separately shown derivatives as well as receivables and liabilities from finance leases

226 Consolidated Financial Statements BASF Report 2017
Notes — Notes on balance sheet
The table “Offsetting of financial assets and financial liabilities” shows the extent to which financial assets and financial liabili-ties are offset in the balance sheet, as well as potential effects from the offsetting of instruments subject to a legally enforce-able global netting agreement or similar agreement. For posi-tive fair values of combined interest and cross-currency swaps, the respective counterparties provided cash collaterals in corresponding amounts to the outstanding fair values. Deviations from the derivatives with positive fair values and derivatives with negative fair values reported in other receiv-ables and other liabilities at the end of 2017 and 2016 arose from derivatives not subject to any netting agreements as well as from embedded derivatives and are therefore not included in the table above.
Net gains and losses from financial instruments comprise the results of valuations, the amortization of discounts, the recog-nition and reversal of impairments, results from the translation of foreign currencies as well as interest, dividends and all other effects on the earnings resulting from financial instruments. The line item financial instruments at fair value through profit or loss contains only those gains and losses from instruments which are not designated as hedging instruments as defined by IAS 39. Net gains or net losses from available-for-sale financial assets contain income and expenses from write-downs/reversals of write-downs, interest, dividends and the reclassification of valuation effects from equity on the sale of the securities and shareholdings.
Offsetting of financial assets and financial liabilities as of December 31, 2017 (million €)
Amounts which can be offset Amounts which cannot be offset
Gross amount Amount offset Net amount
Due to global netting
agreements
Relating to financial
collateralPotential
net amount
Derivatives with positive fair values 376 (39) 337 (55) (10) 272
Derivatives with negative fair values (373) (39) (412) (55) (139) (606)
Offsetting of financial assets and financial liabilities as of December 31, 2016 (million €)
Amounts which can be offset Amounts which cannot be offset
Gross amount Amount offset Net amount
Due to global netting
agreements
Relating to financial
collateralPotential
net amount
Derivatives with positive fair values 491 (46) 445 (101) (124) 220
Derivatives with negative fair values 515 (46) 469 (101) (47) 321
Net gains and losses from financial instruments (million €)
2017 2016
Loans and receivables (311) (166)
Thereof interest result 90 74
Available-for-sale financial assets (24) 22
Thereof interest result 2 2
Financial liabilities measured at amortized cost 249 (124)
Thereof interest result (359) (390)
Financial instruments at fair value through profit or loss (396) (558)
The decrease in net losses from financial liabilities measured at amortized cost primarily arose from the currency translation of financing-related liabilities denominated in foreign currencies, which resulted in a higher translation gain in 2017 than in the previous year. There was also a decline in the net loss for financial instruments measured at fair value through profit or loss. This development is primarily due to realized and unrealized results from derivatives to hedge foreign currency transactions. Countering this was a higher net loss from loans
and receivables largely attributable to the foreign currency translation of receivables.
The gains and losses from the valuation of securities and shareholdings recognized in the equity of the shareholders of BASF SE are shown in the Statement of income and expense recognized in equity on page 169.

BASF Report 2017 Consolidated Financial Statements
Notes — Notes on balance sheet227
27.4 Derivative instruments and hedge accounting
The use of derivative instruments
BASF is exposed to foreign-currency, interest-rate and commodity-price risks during the normal course of business. These risks are hedged through a centrally determined strategy employing derivative instruments. Hedging is only employed for underlying items from the operating business, cash investments, and financing as well as for planned sales, raw material purchases and capital measures. The risks from the underlying transactions and the derivatives are constantly monitored. Where derivatives have a positive market value, BASF is exposed to credit risks from derivative transactions in the event of nonperformance of the other party. To minimize
the default risk on derivatives with positive market values, transactions are exclusively conducted with creditworthy banks and partners and are subject to predefined credit limits. To ensure effective risk management, risk positions are centralized at BASF SE and certain Group companies. The contracting and execution of derivative financial instruments for hedging purposes are conducted according to internal guidelines, and subject to strict control mechanisms. The fair values of derivative financial instruments are calculated using valuation models which use input parameters observable on the market. Exceptions to this are some commodity derivatives, whose valuation is based directly on market prices.
Fair value of derivative instruments (million €)
December 31, 2017 December 31, 2016
Foreign currency forward contracts 65 (163)
Foreign currency options 37 15
Foreign currency derivatives 102 (148)
Thereof designated hedging instruments as defined by IAS 39 (hedge accounting) 34 3
Interest rate swaps (13) (27)
Thereof designated hedging instruments as defined by IAS 39 (hedge accounting) (13) (21)
Combined interest and cross-currency swaps (175) 45
Thereof designated hedging instruments as defined by IAS 39 (hedge accounting) 38 163
Interest derivatives (188) 18
Commodity derivatives (66) (1)
Thereof designated hedging instruments as defined by IAS 39 (hedge accounting) 1 1
Derivative financial instruments (152) (131)
Cash flow hedge accounting
Some of the planned purchases of naphtha are hedged using swaps and options on oil and oil products. For the reporting of these hedges in the Consolidated Financial Statements of the BASF Group, no hedge accounting was applied in 2017 and in 2016. Cash flow hedge accounting continues to be used to a minor extent for natural gas purchases, so that gains and losses from hedging instruments are initially recognized in equity. Gains and losses from hedging instruments are included in cost of sales at the point in time at which the hedged item is recognized in profit or loss. The planned transactions and their effect on earnings occur in the year following the balance sheet date. In 2017, effective changes in the fair value of hedging instruments of €200,000 (2016: €1 million) were recognized in the equity of the shareholders of BASF SE. In 2017, effective changes in the fair value of hedging instruments of €300,000 were derecog-nized from the equity of shareholders of BASF SE and recog-nized in other operating income (2016: €1 million). The ineffec-tive part in the change in value of the hedge amounted to minus €100,000 in 2017 and minus €1 million in 2016. These amounts were reported in the income statement in other operating expenses.
BASF also uses cash flow hedge accounting for some foreign currency derivatives to hedge planned sales denominated in U.S. dollars. The impact on earnings from the underlying transactions occurs in 2018. In 2017, the effective change in values of the hedges was €71 million (2016: €9 million), which was recognized in the equity of the shareholders of BASF SE. A total of €44 million (2016: €11 million) was derecognized from the equity of shareholders of BASF SE and was recognized in income from foreign currency and hedging transactions. The hedges were entirely effective. To hedge foreign currency risk which existed for a part of the U.S. dollar-denominated purchase price for the acquisition of Chemetall, BASF used options and foreign currency forward contracts in the previous year. These were designated as hedging instruments and led to effective changes in the amount of €97 million, which was recognized in the equity of the shareholders of BASF SE. Upon completion of the trans-action in December 2016, this amount was derecognized from the equity of the shareholders of BASF SE reducing the purchase price accordingly and along with that the resulting goodwill arising from the transaction. The ineffective part of the fair value changes of the hedging instruments amounted to minus €10 million and was recognized in other operating expenses.

228 Consolidated Financial Statements BASF Report 2017
Notes — Notes on balance sheet
In the current business year and in the previous year, no additional lease payments exceeding minimum lease payments were recognized in the income statement due to contractual conditions for finance leases. In 2017 and in the
previous year, leasing liabilities were not offset by any future minimum lease payments from subleases.
Liabilities from finance leases (million €)
December 31, 2017 December 31, 2016
Minimum lease payments Interest portion Leasing liability
Minimum lease payments Interest portion Leasing liability
Following year 1 32 5 27 28 5 23
Following year 2 37 5 32 30 4 26
Following year 3 22 4 18 19 4 15
Following year 4 19 3 16 17 3 14
Following year 5 12 2 10 12 3 9
More than 5 years 26 5 21 35 14 21
Total 148 24 124 141 33 108
28 Leases
Leased assets
Property, plant and equipment include assets which are considered to be economically owned through a finance lease. They primarily concern the following items:
Leased assets (million €)
December 31, 2017 December 31, 2016
Acquisition cost Net book value Acquisition cost Net book value
Land, land rights and buildings 22 9 46 26
Machinery and technical equipment 118 43 136 43
Miscellaneous equipment and fixtures 113 44 59 25
Total 253 96 241 94
The interest rate risk of the floating rate notes issued by BASF SE in 2013 was hedged using interest rate swaps. The bond and the interest rate swaps were designated in a hedg-ing relationship. The effective changes in the fair value of the hedging instruments amounting to €6 million were recognized in equity of the shareholders of BASF SE in 2017. In the previ-ous year, the variable interest bond issued in 2014 and expired in 2017 was also hedged by interest rate swaps. The effective changes in the fair value recognized in equity of the sharehold-ers of BASF SE amounted to €6 million in 2016. There were no ineffective parts in either year.
Furthermore, BASF SE’s fixed-rate U.S. private placement of $1.25 billion, issued in 2013, was converted into euros using currency swaps. This hedge was designated as a cash flow hedge. The hedge was entirely effective. In 2017, this resulted in changes in fair value of minus €125 million, which were recognized in the equity of the shareholders of BASF SE (2016: minus €33 million). In 2017, €144 million was derecog-nized from other comprehensive income and recorded as an expense in the financial result (2016: €38 million income in financial result).

BASF Report 2017 Consolidated Financial Statements
Notes — Other explanatory notes229
Other explanatory notes
29 Statement of cash flows and capital structure management
Statement of cash flows
Cash provided by operating activities contained the following payments:
Million € 2017 2016
Income tax payments 2,147 1,495
Interest payments 409 459
Dividends received 498 225
Interest payments comprised interest payments received of €161 million (2016: €156 million) and interest paid of €570 mil-lion (2016: €615 million). In 2017, BASF SE transferred securities in the amount of €500 million to BASF Pensionstreuhand e.V., Ludwigshafen, Germany. This transfer was not cash effective and therefore had no effect on the statement of cash flows. In 2016, cash provided by operating activities included €262 million in pension benefits paid, which are covered by a contractual trust arrangement. Cash used in investing activities included €150 million in payments made for acquisitions (2016: €2,828 million). In the previous year, payments had especially been made for the acquisition of the global surface treatment provider Chemetall from Albemarle Corp., Charlotte, North Carolina.
Payments of €177 million were received for divestitures in 2017 (2016: €664 million). In the previous year, payments had been received primarily from the sale of the Coatings division’s industrial coatings business to the AkzoNobel Group and from the sale of the global polyolefin catalysts business to W.R. Grace & Co., Columbia, Maryland. The payments made for property, plant and equipment, and intangible assets in the amount of €3,996 million included investments for 2017, to the extent that they already had an effect on cash. Cash and cash equivalents were not subject to any utilization restrictions, as in the previous year.
For more information on cash flow from acquisitions and divestitures, see Note 2.4 from page 187 onward
In addition, BASF is a lessee under operating lease contracts. The lease commitments totaling €1,410 million in 2017 (2016: €1,513 million) are due in the following years:
Commitments from operating lease contracts (million €)
Nominal value of the future minimum lease payments
Dec. 31, 2017 Dec. 31, 2016
Less than 1 year 362 360
1-5 years 728 757
More than 5 years 320 396
Total 1,410 1,513
Future minimum lease payments from subleasing contracts based on existing agreements amounted to €10 million in 2017 (2016: €12 million). In 2017, minimum lease payments of €448 million (2016: €446 million) were included in income from operations. In 2017, conditional lease payments of €1 million (2016: €1 mil-lion) were also included in income from operations. Further-more, sublease payments of €3 million were included in income from operations in 2017 (2016: €4 million).
BASF as lessor
BASF acts as a lessor for finance leases to a minor extent only. Receivables on finance leases were €29 million in 2017 (2016: €33 million). In 2017, claims arising from operating leases amounted to €93 million (2016: €89 million).
Future minimum lease payments to BASF from operating lease contracts (million €)
Nominal value of the future minimum lease payments
Dec. 31, 2017 Dec. 31, 2016
Less than 1 year 19 17
1-5 years 50 49
More than 5 years 24 23
Total 93 89

230 Consolidated Financial Statements BASF Report 2017
Notes — Other explanatory notes
Reconciliation according to IAS 7 (million €)
31.12.2016 Cash-effective in cash provi-ded by/used
in fiancing activities
Non-cash effective changes 31.12.2017
Acquisitions/divestitures/
changes in the scope of
consolidationCurrency
effects Other effectsChanges in
fair value
Financial indebtedness 16,312 2,330 4 (631) 17 – 18,032
Loan liabilities 357 (4) 29 (6) – – 376
Liabilities from finance leases 106 (31) – (5) 54 1 – 124
Other financing-related liabilities 516 542 (23) (3) 26 – 1,058
Financial and similar liabilities 17,291 2,837 10 (645) 97 – 19,590
Assets/liabilities from hedging transactions 205 411 – – – (734) (118)
Total 17,496 3,248 10 (645) 97 (734) 19,472
1 Includes additions from leasing contracts
The reconciliation shows changes in such financial liabilities and hedging transactions for which payments received and made are shown under cash provided by/used in financing activities in the statement of cash flows. Loan liabilities do not contain any interest components. Other financing-related liabilities primarily comprise liabilities from accounts used for cash pooling with BASF companies not included in the Consolidated Financial Statements. They are reported in miscellaneous liabilities within the balance sheet item other liabilities which qualify as financial instruments. The assets/liabilities relating to hedging transactions form part of the balance sheet item derivatives with positive or negative fair values and include only those transactions which hedge risks arising from financial indebtedness and financ-ing-related liabilities secured by micro hedges.
For more information on receivables and miscellaneous assets, see Note 18 from page 208 onward
For more information on liabilities, see Note 24 from page 218 onward
Capital structure management
The aim of capital structure management is to maintain the financial flexibility needed to further develop BASF’s business portfolio and take advantage of strategic opportunities. The objectives of the company’s financing policy are to secure solvency, limit financial risks and optimize the cost of capital. Capital structure management focuses on meeting the requirements needed to ensure unrestricted access to capital markets and a solid A rating. BASF’s capital structure is managed using selected financial ratios, such as dynamic debt ratios, as part of the company’s financial planning.
The equity of the BASF Group as reported in the balance sheet amounted to €34,756 million as of December 31, 2017 (December 31, 2016: €32,568 million); the equity ratio was 44.1% on December 31, 2017 (December 31, 2016: 42.6%). BASF prefers to access external financing on the capital markets. A commercial paper program is used for short-term financing, while corporate bonds are used for financing in the medium and long term. These are issued in euros and other currencies with different maturities. The goal is to create a balanced maturity profile, achieve a diverse range of investors and optimize our debt capital financing conditions. Currently, BASF has the following ratings, which were most recently confirmed in the fourth quarter of 2017 (Moody’s: December 19, 2017; Standard & Poor’s and Scope: Octo-ber 18, 2017).
Dec. 31, 2017
Noncurrent financial
indebtedness
Current financial
indebtedness Outlook
Moody’s A1 P-1 stable
Standard & Poor’s A A-1 stable
Scope A S-1 stable
Dec. 31, 2016
Noncurrent financial
indebtedness
Current financial
indebtedness Outlook
Moody’s A1 P-1 stable
Standard & Poor’s A A-1 stable
Scope A S-1 stable
BASF strives to maintain at least a solid A rating, which ensures unrestricted access to financial and capital markets.
For more information on financing policy and the Statement of Cash Flows, see the Management’s Report from page 58 onward

BASF Report 2017 Consolidated Financial Statements
Notes — Other explanatory notes231
30 Share price-based compensation program and BASF incentive share program
Share price-based compensation program
In 2017, BASF continued its share price-based compensation program known as the long-term incentive (LTI) program for the BASF Group, which has been in place since 1999. Approximately 1,200 people, in particular the Board of Executive Directors and senior executives, are currently eligible to participate in this program. This program provides for the granting of virtual options, which are settled in cash when exercised. Participation in the LTI program is voluntary. In order to take part in the program, a participant must make a personal investment: A participant must hold BASF shares amounting to 10% to 30% of his or her individual variable compensation for a two-year period from the granting of the option (holding period). The number of shares to be held is determined by the amount of variable compensation and the volume-weighted average market price for BASF shares on the first business day after the Annual Shareholders’ Meeting, which was €87.84 on May 15, 2017. The participant receives four option rights per invested share. Each option consists of two parts, right A and right B, which may be exercised if defined thresholds have been met: The threshold of right A is met if the price of the BASF share has increased by more than 30% in comparison with the base price (absolute threshold). The value of right A is the difference between the market price of BASF shares on the exercise date and the base price; it is limited to 100% of the base price. If the cumulative percentage performance of BASF shares exceeds the percentage performance of the MSCI World Chemicals IndexSM (MSCI Chemicals), right B may be exercised (relative threshold). The value of right B is the base price of the option multiplied by twice the percentage outperformance of BASF shares compared with the MSCI Chemicals Index on the exer-cise date. It is limited to the closing price on the date of exer-cise minus the computed nominal value of BASF shares. Beginning with the 2013 LTI program, right B is only valuable if the price of BASF shares at least corresponds with the base price. The options of the LTI program 2017 were granted on July 1, 2017, and may be exercised following a two-year vest-ing period, between July 1, 2019, and June 30, 2025. During the exercise period, there are certain times (closed periods) during which the options may not be exercised. Each option can only be exercised in full. This means that one of the per-formance targets must be surpassed. If the other performance target is not surpassed and the option is exercised, the other option right lapses. A participant’s maximum gain from exer-cising an option is limited to five times the original individual investment starting with the 2013 LTI program. The maximum gain from exercising an option is limited to 10 times the original individual investment for programs from previous years. Option rights are nontransferable and are forfeited if the option hold-ers no longer work for BASF or have sold part of their individual investment before the expiry of the two-year vesting period. They remain valid in the case of retirement. For the members of the Board of Executive Directors, the long-term orientation of the program is significantly strengthened compared with the conditions applying to the other participants. The members of
the Board of Executive Directors are required to participate in the LTI program with at least 10% of their actual annual variable compensation. In view of this binding personal investment (in the form of BASF shares), an extended holding period of four years applies. Members of the Board of Executive Directors may only exercise their options at least four years after they have been granted (vesting period). The 2010 to 2016 programs were structured in a similar way to the LTI program 2017. The models used in the valuation of the option plans are based on the arbitrage-free valuation model according to Black-Scholes. The fair values of the options are determined using the binomial model.
Fair value of options and parameters used as of December 31, 2017
LTI program of the year
2017 2016
Fair value € 33.87 41.23
Dividend yield % 3.38 3.38
Risk-free interest rate % 0.19 0.05
Volatility BASF share % 23.63 23.11
Volatility MSCI Chemicals % 14.22 14.34
Correlation BASF share price: MSCI Chemicals % 73.41 76.13
The stated fair values and the valuation parameters relate to the LTI programs 2017 and 2016. The fair value calculation was based on the assumption that options will be exercised in a manner dependent on their potential gains. For the programs from preceding years, corresponding fair values were com-puted and valuation parameters were used. Volatility was determined on the basis of the monthly closing prices over a historical period corresponding to the remaining term of the options. The number of options granted amounted to 1,461,113 in 2017 (2016: 1,710,404). As a result of a resolution by the Board of Executive Directors in 2002 to settle options in cash, options outstanding from the LTI programs 2010 to 2017 were valued with the fair value as of December 31, 2017. A proportionate provision is recorded for programs in the vesting period. The LTI provision decreased from €464 million as of December 31, 2016 to €347 million as of December 31, 2017 due to lower fair values of the outstanding option rights. The utilization of provisions amounted to €49 million in 2017 (2016: €25 million). Income arising from the reversal of provisions amounted to €68 million in 2017. The previous year had included an expense of €267 million. The total intrinsic value of the exercisable options amounted to €145 million as of December 31, 2017 and €167 million as of December 31, 2016.

232 Consolidated Financial Statements BASF Report 2017
Notes — Other explanatory notes
BASF incentive share program
The “plus” incentive share program was introduced in 1999 and is currently available to employees in Germany, other European countries and Mexico. Simultaneous participation in both the “plus” program and the LTI program is not allowed. Employees who participate in the BASF incentive share program “plus” acquire shares in BASF from their variable compensation. For every 10 BASF shares purchased in the program, a participant receives one BASF share at no cost after one, three, five, seven and ten years of holding the BASF shares. As a rule, the first and second block of ten shares entitles the participant to receive one BASF share at no extra cost in each of the next 10 years. The right to receive free BASF shares lapses if a participant sells the individual investment in BASF shares, if the participant stops working for the Company or one year after retirement. The number of free shares to be granted has developed as follows:
Number of free shares to be granted (shares)
2017 2016
As of January 1 2,849,723 2,829,521
Newly acquired entitlements 570,465 637,610
Bonus shares issued (479,111) (519,984)
Lapsed entitlements (129,630) (97,424)
As of December 31 2,811,447 2,849,723
The free shares to be provided by the Company are measured at the fair value on the grant date. Fair value is determined on the basis of the stock price of BASF shares, taking into account the present value of dividends, which are not paid during the term of the program. The weighted-average fair value on the grant date amounted to €86.02 for the 2017 program, and €67.90 for the 2016 program. The fair value of the free shares to be granted is recognized as an expense with a corresponding increase in capital surplus over the term of the program. Personnel expenses of €28 million were recorded in 2017 for the BASF incentive share program “plus” (2016: €28 million).
Performance-related compensation for the Board of Executive Directors is based on the return on assets adjusted for special effects, as well as the performance of the entire Board. Return on assets corresponds to income before taxes and minority interests plus interest expenses as a percentage of average assets. The members of the Board of Executive Directors were granted 127,276 options under the long -term incentive (LTI) program in 2017.
The market valuation of the options of active and former mem-bers of the Board resulted in income of €5.8 million in 2017. In 2016, the market valuation of the options resulted in expenses of €30.7 million.
For more information on the compensation of members of the Board of Executive Directors, see the Compensation Report from page 140 onward
For more information on the members of the Supervisory Board and Board of Executive Directors, including their memberships on other boards, see page 137 onward
31 Compensation for the Board of Executive Directors and Supervisory Board
Million € 2017 2016
Performance-related and not performance-related cash compensation for the Board of Executive Directors 24.8 17.4
Fair value of options granted to the Board of Executive Directors in the fiscal year as of grant date 2.7 4.0
Total compensation for the Board of Executive Directors 27.5 21.4
Service costs for members of the Board of Executive Directors 7.0 3.3
Compensation for the Supervisory Board 3.3 3.0
Total compensation for former members of the Board of Executive Directors and their surviving dependents1 7.6 15.9
Pension provisions for former members of the Board of Executive Directors and their surviving dependents 144.3 150.4
Guarantees assumed for members of the Board of Executive Directors and the Supervisory Board – –
1 Compensation for Dr. Harald Schwager and Margret Suckale from their active membership on the Board of Executive Directors in 2017 is included under total compensation for former members of the Board of Executive Directors

BASF Report 2017 Consolidated Financial Statements
Notes — Other explanatory notes233
Trade accounts receivable from / trade accounts payable to related parties (million €)
Accounts receivable, trade Accounts payable, trade
December 31, 2017 December 31, 2016 December 31, 2017 December 31, 2016
Nonconsolidated subsidiaries 136 135 77 73
Joint ventures 69 76 75 92
Associated companies 71 55 29 44
Other receivables and liabilities with related parties (million €)
Other receivables Other liabilities
December 31, 2017 December 31, 2016 December 31, 2017 December 31, 2016
Nonconsolidated subsidiaries 172 176 180 178
Joint ventures 306 196 734 97
Associated companies 73 390 236 258
A related party is a natural person or legal entity which can exert influence on the BASF Group or over which the BASF Group exercises control or joint control or a significant influence. In particular, this comprises nonconsolidated subsidiaries, joint ventures and associated companies. The following tables show the volume of business with related parties that are included at amortized cost or accounted for using the equity method.
Sales to related parties (million €)
2017 2016
Nonconsolidated subsidiaries 413 395
Joint ventures 379 317
Associated companies 307 245
32 Related-party transactions
Sales and trade accounts receivable from and trade accounts payable to related parties mainly included business with own products and merchandise, agency and licensing businesses, and other operating business. Other receivables and liabilities primarily arose from financing activities, from accounts used for cash pooling, outstanding dividend payments, profit-and-loss transfer agreements, and other finance-related and operating activities and transactions. The decline in other receivables from associated compa-nies and the increase in other receivables from joint ventures was largely due to the transfer of the financing function for the regulated gas transportation activities to the newly established joint venture W & G Infrastruktur Finanzierungs-GmbH, Kassel, Germany. Receivables from the associated companies GASCADE Gastransport GmbH, Kassel, Germany, and NEL Gastransport GmbH, Kassel, Germany, in the amount of €259 million were transferred to W & G Infrastruktur Finan-zierungs-GmbH and a loan of €140 million was granted to it. The cash that was also transferred to the joint venture was deposited in the BASF Group’s cash pool and led to an increase of €665 million in other liabilities from joint ventures.
For more information, see Note 2.3 from page 186 onward
The €22 million decline in other liabilities from associated companies in 2017 was largely due to other financing-related liabilities. Since the transfer of the global leather chemicals business to the Stahl group on September 29, 2017, BASF holds a minority interest in the parent company of the Stahl group, in which it can exercise significant influence. Sales, receivables, trade accounts receivable and other obligations resulting from transactions with Stahl group since then are included in the tables above in the values for associated companies in 2017. The outstanding balances toward related parties were generally not secured and settled in cash. The balance of valuation allowances for trade accounts receivable from associated companies rose from €1 million as of Decem-ber 31, 2016 to €9 million as of December 31, 2017. Of this amount, €5 million was recognized as an expense in 2017 (2016: €1 million). The balance of valuation allowances for other receivables from nonconsolidated subsidiaries decreased from €79 million as of December 31, 2016 to €74 million as of December 31, 2017. Of this amount, €1 million was recognized as an expense in 2017 (2016: €26 million).

234 Consolidated Financial Statements BASF Report 2017
Notes — Other explanatory notes
There were obligations from guarantees and other financial obligations at BASF in favor of nonconsolidated subsidiaries in the amount of €5 million as of December 31, 2017 (Decem-ber 31, 2016: €3 million) and in favor of associated companies in the amount of €23 million as of December 31, 2017 (Decem-ber 31, 2016: €21 million). There were no obligations arising from purchase contracts with associated companies as of December 31, 2017; as of December 31, 2016, these amounted to €26 million. Obliga-tions arising from purchase contracts with joint ventures amounted to €3 million as of December 31, 2017, whereas there were no corresponding obligations as of December 31, 2016. Effective December 31, 2017, the present value of the outstanding minimum rental payments for an office building including parking area payable by BASF SE to BASF Pen-sionskasse VVaG for the nonterminable basic rental period to 2029 amounted to €55 million.
There were no reportable related party transactions with members of the Board of Executive Directors or the Supervisory Board and their related parties in 2017.
For more information on subsidiaries, joint ventures and associated companies, see the BASF Group List of Shares Held on page 190
For more information on other financial obligations in favor of joint ventures, see Note 25 from page 220 onward
For more information about defined benefit plants, the division of risk between group companies (including non-consolidated subsidiaries), see Note 22, “Provisions for pensions and similar obligations,” from page 211 onward
For more information on the members of the Board of Executive Directors and the Supervisory Board, see Management and Supervisory Boards and Compensation Report from page 137 onward
33 Services provided by the external auditor
BASF Group companies have used the following services from KPMG:
Million € 2017 2016
Annual audit 18.6 17.5
Thereof domestic 6.4 6.4
Audit-related services 0.4 0.6
Thereof domestic 0.1 0.3
Tax consultation services 0.2 0.1
Thereof domestic 0.1 –
Other services 0.1 0.3
Thereof domestic – 0.3
Total 19.3 18.5
The services provided by the external auditor mainly include services for the annual audit, and to a lesser extent, confirma-tion services, tax consultation services and other services. The line item annual audit related to expenses for the audit of the Consolidated Financial Statements of the BASF Group as well as the legally required financial statements of BASF SE and its consolidated subsidiary companies and joint opera-
tions. Tax consultation services pertained especially to the fees for the finalization of unfiled tax returns for companies acquired in 2016. Fees for other services primarily included project-related audits in connection with regulatory demands as well as other confirmation services.
34 Declaration of Conformity with the German Corporate Governance Code
Declaration pursuant to section 161 AktG (Stock Corporation Act)
The annual Declaration of Conformity with the German Gover-nance Code according to section 161 of the German Stock
Corporation Act was signed by the Board of Executive Direc-tors and the Supervisory Board of BASF SE in December 2017, and is published online.
For more information, see basf.com/en/governance

5Supplementary Information on the Oil & Gas Segment 237
Oil
& G
as
To Our Shareholders 5
Management’s Report 17
Corporate Governance 125
Consolidated Financial Statements 159
Supplementary Information on the Oil & Gas Segment Overviews 245


BASF Report 2017 Supplementary Information on the Oil & Gas Segment 237
Supplementary Information on the Oil & Gas Segment(Unaudited)
The following provides supplementary information on the Exploration & Production business sector of the Oil & Gas segment. In the absence of detailed disclosure rules in this area under the International Financial Reporting Standards (IFRS), the presentation is based on the FASB standard Extractive Activities – Oil and Gas (Topic 932), which is a fur-ther development of SFAS 69. In the following sections, the determination of the amounts complies with the metrics set out by IFRS that underlie the BASF Group Consolidated Finan-cial Statements: Operating income from oil and gas-producing activities; Period expenditures for acquisition, exploration and development of oil and gas deposits; Capitalized costs relating to oil and gas producing activities; and Capitalized exploration drilling: suspended well costs. The definition of companies accounted for using the equity method also follows the approach of the Consolidated Financial Statements. The cash flow from the Yuzhno Russkoye project is shown in the fully consolidated company responsible for marketing the gas. According to Topic 932, the current economic conditions were considered in the determination of oil and gas reserves as well as the standardized calculation of discounted net cash flows. The prices used are valued at the average price calcu-lated from the prices on the first day of the month for the past 12 months. Expected proven reserves and the resulting future net cash flows can vary significantly from the current estimates. Furthermore, the realized prices and costs and the actual cash flows resulting therefrom may differ from the estimate in amount and distribution over time. Therefore, the values pre-sented should not be interpreted as a prediction of future cash flows, nor in their sum as the current value of the company. Furthermore, different prices, costs and volume estimates are used for operational decisions as well as for the prepara-tion of the Consolidated Financial Statements. Therefore, the reserves and net cash flows shown are not comparable with statements and values in the Consolidated Financial State-ments. According to the requirements in Topic 932, regions with more than a 15% share of total reserves must be shown sep-arately. Therefore, the regions in the supplementary informa-tion differ from those presented in the Group Consolidated Financial Statements. Aside from the countries Germany and Russia, this includes the regions: Rest of Europe; North Africa/Middle East; as well as South America.
The regions include the following countries with operating activities:
RegionExploration & Production Exploration
Rest of Europe United Kingdom, the Netherlands, Norway, Denmark
North Africa / Middle East Libya Abu Dhabi
South America Argentina
Oil and gas reserves
Proven oil and gas reserves are the volumes of crude oil, natural gas and condensate that, according to the geological, engineering and economic conditions prevailing at the balance sheet date, can be produced in future years. Accordingly, reserve estimates based on this data could be materially dif-ferent from the volumes that are ultimately recovered. To reduce uncertainties, BASF works together with independent, internationally recognized reserve auditors to perform recur-ring reserves audits of its major crude oil and natural gas fields. The tables on the following pages show the company’s estimated proven and proven developed reserves as of December 31, 2016, and 2017, as well as changes attribut-able to production or other factors.

238 Supplementary Information on the Oil & Gas Segment BASF Report 2017
Oil 2017
Consolidated and equity-accounted companies GermanyRest of Europe Russia
North Africa, Middle East
South America
Total Group
Thereof at equity
Proven developed and undeveloped oil reserves as of January 1, in million barrels (MMbbl) 36 127 184 86 7 440 89
Revisions and other changes 4 29 49 3 3 88 1
Extensions and discoveries – – – – – – –
Purchase/sale of reserves – – – – – – –
Production 6 20 15 7 2 50 8
Proven reserves as of December 31 34 136 218 82 8 478 82
Thereof equity-accounted companies – 2 4 76 – 82 82
Proven developed reserves as of December 31 33 111 166 72 8 390 72
Thereof equity-accounted companies – – 4 68 – 72 72
Gas 2017
Consolidated and equity-accounted companies GermanyRest of Europe Russia
North Africa, Middle East
South America
Total Group
Thereof at equity
Developed and undeveloped gas reserves as of January 1, in million barrels of oil equivalent (MMBOE) 23 111 885 9 154 1,182 520
Revisions and other changes (1) 21 97 (1) 10 126 3
Extensions and discoveries – 4 – – – 4 –
Purchase/sale of reserves – – – – – – –
Production 3 12 75 – 24 114 57
Proven reserves as of December 31 19 124 907 8 140 1,198 466
Thereof equity-accounted companies – 7 451 8 – 466 466
Proven developed reserves as of December 31 19 55 622 8 114 818 305
Thereof equity-accounted companies – 6 291 8 – 305 305

BASF Report 2017 Supplementary Information on the Oil & Gas Segment 239
Oil 2016
Consolidated and equity-accounted companies GermanyRest of Europe Russia
North Africa, Middle East
South America
Total Group
Thereof at equity
Proven developed and undeveloped oil reserves as of January 1, in million barrels (MMbbl) 42 144 193 96 9 484 96
Revisions and other changes – 5 6 (7) – 4 (3)
Extensions and discoveries – – – – – – –
Purchase/sale of reserves – – – – – – –
Production 6 22 15 3 2 48 4
Proven reserves as of December 31 36 127 184 86 7 440 89
Thereof equity-accounted companies – 1 6 82 – 89 89
Proven developed reserves as of December 31 32 60 144 77 7 320 80
Thereof equity-accounted companies – – 6 74 – 80 80
Gas 2016
Consolidated and equity-accounted companies GermanyRest of Europe Russia
North Africa, Middle East
South America
Total Group
Thereof at equity
Developed and undeveloped gas reserves as of January 1, in million barrels of oil equivalent (MMBOE) 24 118 940 11 167 1,260 572
Revisions and other changes 3 8 19 (2) 11 39 6
Extensions and discoveries – – – – – – –
Purchase/sale of reserves – – – – – – –
Production 4 15 74 – 24 117 58
Proven reserves as of December 31 23 111 885 9 154 1,182 520
Thereof equity-accounted companies – 6 505 9 – 520 520
Proven developed reserves as of December 31 23 50 628 8 147 856 360
Thereof equity-accounted companies – 6 346 8 – 360 360

240 Supplementary Information on the Oil & Gas Segment BASF Report 2017
2017 (million €)
Fully consolidated companies GermanyRest of Europe Russia
North Africa, Middle East
South America
Total Group
Sales crude oil (including condensate and LPG) 249 766 116 50 80 1,261
Sales natural gas 67 298 263 – 438 1,066
Local duties (royalties, export, etc.) 47 – – – 79 126
Net revenue (less duties) 269 1,064 379 50 439 2,201
Production costs 118 231 33 10 158 550
Exploration expenses and technology 6 82 15 22 24 149
Depreciation, amortization and impairment 101 587 20 10 154 872
Other (1) 16 25 8 (163) (115)
Operating income before taxes 45 148 286 – 266 745
Income taxes 13 47 64 18 94 236
Operating income after taxes 32 101 222 (18) 172 509
Net income of equity-accounted companies – 79 49 4 – 132
2016 (million €)
Fully consolidated companies GermanyRest of Europe Russia
North Africa, Middle East
South America
Total Group
Sales crude oil (including condensate and LPG) 202 680 74 56 94 1,106
Sales natural gas 75 291 166 – 413 945
Local duties (royalties, export, etc.) 40 – – – 91 131
Net revenue (less duties) 237 971 240 56 416 1,920
Production costs 108 264 33 13 145 563
Exploration expenses and technology 5 81 9 20 15 130
Depreciation, amortization and impairment 109 692 14 12 137 964
Other 4 43 18 6 (120) (49)
Operating income before taxes 11 (109) 166 5 239 312
Income taxes 3 3 25 23 85 139
Operating income after taxes 8 (112) 141 (18) 154 173
Net income of equity-accounted companies – (63) 77 (40) – (26)
Operating income from oil and gas-producing activities
Operating income represents only those revenues and expenses directly associated with oil, condensate and gas production. This partially results in significant differences to the
figures shown for the Oil & Gas segment. Significant deviations exist in sales revenues that do not include sales from mer-chandise and services as well as the financing and corporate overhead costs not included there. Income taxes were com-puted using currently applicable local income tax rates.

BASF Report 2017 Supplementary Information on the Oil & Gas Segment 241
Period expenditures for acquisition, exploration and development of oil and gas deposits
Period expenditures include all amounts incurred in connection with the acquisition, exploration or development of oil and gas deposits, regardless of whether these were capitalized or expensed.
2017 (million €)
Fully consolidated companies GermanyRest of Europe Russia
North Africa, Middle East
South America
Total Group
Acquisition expenditures – – – – – –
For proven reserves – – – – – –
For unproven reserves – – – – – –
Exploration and technology expenditures 6 49 12 33 31 131
Development expenditures 57 645 75 3 134 914
Total expenditures 63 694 87 36 165 1,045
Total expenditures at equity-accounted companies – 21 18 (5) – 34
2016 (million €)
Fully consolidated companies GermanyRest of Europe Russia
North Africa, Middle East
South America
Total Group
Acquisition expenditures – – – – 8 8
For proven reserves – – – – – –
For unproven reserves – – – – 8 8
Exploration and technology expenditures 15 111 9 29 20 184
Development expenditures 66 629 73 1 194 963
Total expenditures 81 740 82 30 222 1,155
Total expenditures at equity-accounted companies – 87 19 – – 106
Capitalized costs relating to oil and gas producing activities
Capitalized costs represent total expenditures on proven and unproven oil and gas deposits including the related accumulated depreciation and amortization.
2017 (million €)
Fully consolidated companies GermanyRest of Europe Russia
North Africa, Middle East
South America
Total Group
Proven oil and gas reserves 1,029 5,866 1,530 140 1,757 10,322
Unproven oil and gas reserves 34 301 – 132 412 879
Equipment and miscellaneous 888 6 – – – 894
Total gross assets 1,951 6,173 1,530 272 2,169 12,095
Accumulated depreciation, amortization and impairments (1,436) (2,487) (391) (195) (1,193) (5,702)
Total net assets 515 3,686 1,139 77 976 6,393
Investments in equity-accounted companies – 307 1,130 97 – 1,534
2016 (million €)
Fully consolidated companies GermanyRest of Europe Russia
North Africa, Middle East
South America
Total Group
Proven oil and gas reserves 978 6,023 1,577 156 1,733 10,467
Unproven oil and gas reserves 45 525 – 126 297 993
Equipment and miscellaneous 858 47 – – – 905
Total gross assets 1,881 6,595 1,577 282 2,030 12,365
Accumulated depreciation, amortization and impairments (1,335) (2,429) (364) (209) (1,044) (5,381)
Total net assets 546 4,166 1,213 73 986 6,984
Investments in equity-accounted companies – 228 1,197 93 – 1,518

242 Supplementary Information on the Oil & Gas Segment BASF Report 2017
Capitalized exploration drilling: Suspended well costs
Exploratory drilling costs are capitalized until the drilling of the well is complete. If hydrocarbon resources are found whose commercial development is possible, the costs continue to be capitalized as construction in progress, subject to further appraisal activity that may include the drilling of further wells. Management evaluates all such capitalized costs at least once a year from both a technical and economic perspective to confirm the continued intent to develop or otherwise extract value from the discovery. If this is no longer the case, the relevant costs are written off. If proven reserves of oil or natural gas are determined and development is sanctioned, however, the relevant expenses are transferred within property, plant and equipment to machinery and technical equipment. Impair-ments for unsuccessful exploration wells are recognized in exploration expenses. The following table indicates the changes in capitalized exploration drilling. The last row shows the year-end value for equity- accounted companies.
Capitalized exploration drilling (million €)
Fully consolidated companies 2017 2016
As of January 1 411 423
Additions to exploration drilling of the year 32 103
Capitalized exploration drilling charged to expense (34) (49)
Reclassification of successful exploration drilling (75) (75)
Translation effect (31) 9
As of December 31 303 411
Equity-accounted companies as of December 31 164 212
The following table provides an overview of the capitalization period, amounts capitalized for exploration drilling, and the number of suspended exploration wells.
Capitalized exploration drilling (million €)
Fully consolidated companies 2017 2016
Wells for which drilling is not complete 4 37
Wells capitalized less than one year 35 71
Wells capitalized more than one year 264 303
Total 303 411
Number of exploration wells in construction in progress 31 36
Number of exploration wells in construction in progress at equity-accounted companies as of December 31 23 27
Standardized measure of discounted future net cash flows relating to proven oil and gas reserves
The following information was determined based on the provi-sions of the standard Extractive Activities – Oil and Gas (Topic 932) published by FASB. Based on this, a standardized measure of discounted future net cash flows with the relevant revenues, costs and income tax rates is to be made. The proven reserves are valued at the average price calculated from the prices on the first day of the month for the past busi-ness year. The values thus determined are discounted at a 10% annual discount rate.

BASF Report 2017 Supplementary Information on the Oil & Gas Segment 243
Standardized measure of discounted future net cash flows 2017 (million €)
Consolidated and equity-accounted companies Germany
Rest of Europe Russia
North Africa, Middle East
South America
Total Group
Thereof at equity
Future revenues 1,538 9,543 6,556 3,476 3,362 24,475 3,561
Future production/development costs 1,486 4,767 1,786 1,173 1,562 10,774 1,426
Future income taxes (22) 2,589 966 2,089 491 6,113 2,002
Future net cash flows, not discounted 74 2,187 3,804 214 1,309 7,588 133
10% discount rate (96) 379 1,544 38 285 2,150 (1)
Standardized measure of discounted future net cash flows 170 1,808 2,260 176 1,024 5,438 134
Thereof equity-accounted companies – (27) 26 135 – 134 134
Standardized measure of discounted future net cash flows 2016 (million €)
Consolidated and equity-accounted companies Germany
Rest of Europe Russia
North Africa, Middle East
South America
Total Group
Thereof at equity
Future revenues 1,365 6,975 5,732 3,478 3,428 20,978 3,610
Future production/development costs 1,549 5,264 1,633 1,378 1,203 11,027 1,582
Future income taxes (120) 164 690 1,937 570 3,241 1,933
Future net cash flows, not discounted (64) 1,547 3,409 163 1,655 6,710 95
10% discount rate (132) 527 1,278 59 508 2,240 13
Standardized measure of discounted future net cash flows 68 1,020 2,131 104 1,147 4,470 82
Thereof equity-accounted companies – (42) 25 99 – 82 82

244 Supplementary Information on the Oil & Gas Segment BASF Report 2017
Summary of changes in standardized measure of discounted future net cash flows 2017 (million €)
Consolidated companies and equity-accounted companies Germany
Rest of Europe Russia
North Africa, Middle East
South America
Total Group
Thereof at equity
As of January 1 68 1,020 2,131 104 1,147 4,470 82
Sales of oil and gas produced, net of production costs in the current period (151) (868) (488) (104) (282) (1,893) (94)
Net changes in prices and production costs at balance sheet date 242 1,410 474 205 (74) 2,257 143
Net changes from extensions, discoveries and improved recovery, less related costs – – – – – – –
Revisions of previous reserves estimates 46 973 248 90 105 1,462 72
Investments in the period 67 652 79 – 134 932 7
Changes in estimated investments in future periods (41) 286 (278) (27) (187) (247) (44)
Purchase/sale of reserves – – – – – – –
Net change in income taxes (61) (1,779) (145) (227) 41 (2,171) (163)
Accretion of discount – 115 239 135 140 629 131
Other – (1) – – – (1) –
Standardized measure of discounted future net cash flows as of December 31 170 1,808 2,260 176 1,024 5,438 134
Thereof equity-accounted companies – (27) 26 135 – 134 134
Summary of changes in standardized measure of discounted future net cash flows 2016 (million €)
Consolidated companies and equity-accounted companies Germany
Rest of Europe Russia
North Africa, Middle East
South America
Total Group
Thereof at equity
As of January 1 209 1,405 3,025 304 1,351 6,294 346
Sales of oil and gas produced, net of production costs in the current period (130) (747) (380) (97) (280) (1,634) (105)
Net changes in prices and production costs at balance sheet date (186) (1,416) (1,292) (482) (242) (3,618) (572)
Net changes from extensions, discoveries and improved recovery, less related costs – – – – – – –
Revisions of previous reserves estimates 30 283 68 (175) 78 284 (172)
Investments in the period 67 702 87 – 144 1,000 79
Changes in estimated investments in future periods 2 (39) 63 24 (182) (132) (27)
Purchase/sale of reserves – – – – – – –
Net change in income taxes 59 625 212 347 116 1,359 351
Accretion of discount 17 207 348 183 171 926 182
Other – – – – (9) (9) –
Standardized measure of discounted future net cash flows as of December 31 68 1,020 2,131 104 1,147 4,470 82
Thereof equity-accounted companies – (42) 25 99 – 82 82

6Ten-year summary 247
Trademarks 249
Glossary 250
Üb
ersi
chte
n
To Our Shareholders 5
Management’s Report 17
Corporate Governance 125
Consolidated Financial Statements 159
Supplementary Information on the Oil & Gas Segment 235
Overviews


BASF Report 2017 Overviews
Ten-year summary 247
Ten-year summary
Million € 2008 2009 2010 2011 20121 20132 2014 2015 2016 2017
Sales and earnings
Sales 62,304 50,693 63,873 73,497 72,129 73,973 74,326 70,449 57,550 64,475
Income from operations (EBIT) 6,463 3,677 7,761 8,586 6,742 7,160 7,626 6,248 6,275 8,522
Income before taxes 5,976 3,079 7,373 8,970 5,977 6,600 7,203 5,548 5,395 7,800
Income before minority interests 3,305 1,655 5,074 6,603 5,067 5,113 5,492 4,301 4,255 6,352
Net income 2,912 1,410 4,557 6,188 4,819 4,792 5,155 3,987 4,056 6,078
Income from operations before depreciation and amortization (EBITDA) 9,562 7,388 11,131 11,993 10,009 10,432 11,043 10,649 10,526 12,724
EBIT before special items 6,856 4,852 8,138 8,447 6,647 7,077 7,357 6,739 6,309 8,328
EBIT after cost of capital 1,621 (226) 3,500 2,551 1,164 1,768 1,368 194 1,136 2,727
Capital expenditures, depreciation and amortization
Additions to property, plant and equipment and intangible assets 3,634 5,972 5,304 3,646 5,263 7,726 7,285 6,013 7,258 4,364
Thereof property, plant and equipment 2,809 4,126 3,294 3,199 4,084 6,428 6,369 5,742 4,377 4,028
Depreciation and amortization of property, plant and equipment and intangible assets 3,099 3,711 3,370 3,407 3,267 3,272 3,417 4,401 4,251 4,202
Thereof property, plant and equipment 2,481 2,614 2,667 2,618 2,594 2,631 2,770 3,600 3,691 3,586
Number of employees
At year-end 96,924 104,779 109,140 111,141 110,782 112,206 113,292 112,435 113,830 115,490
Annual average 95,885 103,612 104,043 110,403 109,969 111,844 112,644 113,249 111,975 114,333
Personnel expenses 6,364 7,107 8,228 8,576 8,963 9,285 9,224 9,982 10,165 10,610
Research and development expenses 1,355 1,398 1,492 1,605 1,732 1,849 1,884 1,953 1,863 1,888
Key data
Earnings per share3 € 3.13 1.54 4.96 6.74 5.25 5.22 5.61 4.34 4.42 6.62
Adjusted earnings per share3 € 3.85 3.01 5.73 6.26 5.64 5.31 5.44 5.00 4.83 6.44
Cash provided by operating activities4 5,023 5,693 6,460 7,105 6,602 8,100 6,958 9,446 7,717 8,785
EBITDA margin % 15.3 14.6 17.4 16.3 13.9 14.1 14.9 15.1 18.3 19.7
Return on assets % 13.5 7.5 14.7 16.1 11.0 11.5 11.7 8.7 8.2 10.8
Return on equity after tax % 17.0 8.9 24.6 27.5 19.9 19.2 19.7 14.4 13.3 18.9
Appropriation of profits
Net income of BASF SE5 2,982 2,176 3,737 3,506 2,880 2,826 5,853 2,158 2,808 3,130
Dividend 1,791 1,561 2,021 2,296 2,388 2,480 2,572 2,664 2,755 2,847
Dividend per share3 € 1.95 1.70 2.20 2.50 2.60 2.70 2.80 2.90 3.00 3.10
Number of shares as of December 313,6 million 918.5 918.5 918.5 918.5 918.5 918.5 918.5 918.5 918.5 918.5
1 We have applied International Reporting Standards IFRS 10 and 11 as well as International Accounting Standard 19 (revised) since January 1, 2013. Figures for 2012 have been restated; no restatement was made for 2011 and earlier.
2 Figures for 2013 have been adjusted to reflect the dissolution of the natural gas trading business disposal group. 3 We conducted a two-for-one stock split in the second quarter of 2008. 4 Includes the change in reporting from 2009 onward of the effects of regular extensions of U.S. dollar hedging transactions 5 Calculated in accordance with German GAAP 6 After deduction of repurchased shares earmarked for cancellation

248 Overviews BASF Report 2017
Ten-year summary
Balance sheet (IFRS)
Million € 2008 2009 2010 2011 20121 20132 2014 2015 2016 2017
Intangible assets 9,889 10,449 12,245 11,919 12,193 12,324 12,967 12,537 15,162 13,594
Property, plant and equipment 15,032 16,285 17,241 17,966 16,610 19,229 23,496 25,260 26,413 25,258
Investments accounted for using the equity method 1,146 1,340 1,328 1,852 3,459 4,174 3,245 4,436 4,647 4,715
Other financial assets 1,947 1,619 1,953 848 613 643 540 526 605 606
Deferred taxes 930 1,042 1,112 941 1,473 1,006 2,193 1,791 2,513 2,118
Other receivables and miscellaneous noncurrent assets 642 946 653 561 911 877 1,498 1,720 1,210 1,332
Noncurrent assets 29,586 31,681 34,532 34,087 35,259 38,253 43,939 46,270 50,550 47,623
Inventories 6,763 6,776 8,688 10,059 9,581 10,160 11,266 9,693 10,005 10,303
Accounts receivable, trade 7,752 7,738 10,167 10,886 9,506 10,233 10,385 9,516 10,952 11,190
Other receivables and miscellaneous current assets 3,948 3,223 3,883 3,781 3,455 3,714 4,032 3,095 3,078 3,105
Marketable securities 35 15 16 19 14 17 19 21 536 52
Cash and cash equivalents 2,776 1,835 1,493 2,048 1,647 1,827 1,718 2,241 1,375 6,495
Assets of disposal groups – – 614 295 3,264 – − − − −
Current assets 21,274 19,587 24,861 27,088 27,467 25,951 27,420 24,566 25,946 31,145
Total assets 50,860 51,268 59,393 61,175 62,726 64,204 71,359 70,836 76,496 78,768
Subscribed capital 1,176 1,176 1,176 1,176 1,176 1,176 1,176 1,176 1,176 1,176
Capital surplus 3,241 3,229 3,216 3,203 3,188 3,165 3,143 3,141 3,130 3,117
Retained earnings 13,250 12,916 15,817 19,446 23,708 26,102 28,777 30,120 31,515 34,826
Other comprehensive income (96) 156 1,195 314 (3,461) (3,400) (5,482) (3,521) (4,014) (5,282)
Minority interests 1,151 1,132 1,253 1,246 1,010 630 581 629 761 919
Equity 18,722 18,609 22,657 25,385 25,621 27,673 28,195 31,545 32,568 34,756
Provisions for pensions and similar obligations 1,712 2,255 2,778 3,189 5,421 3,727 7,313 6,313 8,209 6,293
Other provisions 2,757 3,289 3,352 3,335 2,925 3,226 3,502 3,369 3,667 3,478
Deferred taxes 2,167 2,093 2,467 2,628 2,234 2,894 3,420 3,381 3,317 2,731
Financial indebtedness 8,290 12,444 11,670 9,019 8,704 11,151 11,839 11,123 12,545 15,535
Other liabilities 917 898 901 1,142 1,111 1,194 1,197 869 873 1,095
Noncurrent liabilities 15,843 20,979 21,168 19,313 20,395 22,192 27,271 25,055 28,611 29,132
Accounts payable, trade 2,734 2,786 4,738 5,121 4,502 5,153 4,861 4,020 4,610 4,971
Provisions 3,043 3,276 3,324 3,210 2,628 2,670 2,844 2,540 2,802 3,229
Tax liabilities 860 1,003 1,140 1,038 870 968 1,079 1,082 1,288 1,119
Financial indebtedness 6,224 2,375 3,369 3,985 4,094 3,256 3,545 4,074 3,767 2,497
Other liabilities 3,434 2,240 2,802 3,036 2,623 2,292 3,564 2,520 2,850 3,064
Liabilities of disposal groups – – 195 87 1,993 – − − − −
Current liabilities 16,295 11,680 15,568 16,477 16,710 14,339 15,893 14,236 15,317 14,880
Total equity and liabilities 50,860 51,268 59,393 61,175 62,726 64,204 71,359 70,836 76,496 78,768
1 We have applied International Reporting Standards IFRS 10 and 11 as well as International Accounting Standard 19 (revised) since January 1, 2013. Figures for 2012 have been restated; no restatement was made for 2011 and earlier.
2 Figures for 2013 have been adjusted to reflect the dissolution of the natural gas trading business disposal group.

BASF Report 2017 Overviews
Trademarks 249
Trademarks1
ADLITE® reg. trademark of BASF Group
ACRONAL® reg. trademark of BASF Group
AgCelence® reg. trademark of BASF Group
BASONAT® reg. trademark of BASF Group
Basta® reg. trademark of Bayer Group
BOROCAT® reg. trademark of BASF Group
CELLASTO® reg. trademark of BASF Group
CERESIT® reg. trademark of Henkel AG
CHIMASSORB® reg. trademark of BASF Group
CHOVATEK® reg. trademark of BASF Group
CLEARFIELD® reg. trademark of BASF Group
CREATOR SPACE® reg. trademark of BASF Group
DERMAGENIST® reg. trademark of BASF Group
ENGENIA® reg. trademark of BASF Group
ESPAÇO ECO® reg. trademark of BASF Group
F 500® reg. trademark of BASF Group
Finale® reg. trademark of Bayer Group
Formaldpure® reg. trademark of BASF Group
FLO RITE® reg. trademark of BASF Group
FSC® reg. trademark of Forest
Stewardship Council
HYDRAULAN® reg. trademark of BASF Group
HySorb® reg. trademark of BASF Group
INITIUM® reg. trademark of BASF Group
INSCALIS® reg. trademark of BASF Group
INTEGRAL® reg. trademark of BASF Group
INTERCEPTOR® reg. trademark of BASF Group
InVigor® reg. trademark of Bayer Group
IRGAFOS® reg. trademark of BASF Group
IRGANOX® reg. trademark of BASF Group
KIXOR® reg. trademark of BASF Group
Liberty® reg. trademark of Bayer Group
LibertyLink® reg. trademark of Bayer Group
LIMUS® reg. trademark of BASF Group
MAGLIS® reg. trademark of BASF Group
NEALTA® reg. trademark of BASF Group
NODULATOR® reg. trademark of BASF Group
OASE® reg. trademark of BASF Group
POLYTHF® reg. trademark of BASF Group
Responsible Care® reg. trademark of Conseil
Européen de l’Industrie Chimique
REVYSOL® reg. trademark of BASF Group
SAVIVA® reg. trademark of BASF Group
SERIFEL® reg. trademark of BASF Group
Sustainable Solution Steering® reg. trademark of BASF Group
SYSTIVA® reg. trademark of BASF Group
TERMIDOR® reg. trademark of BASF Group
THERMOTEK® reg. trademark of BASF Group
THOMSIT® reg. trademark of BASF Group
TINUVIN® reg. trademark of BASF Group
ULTRADUR® reg. trademark of BASF Group
ULTRAFORM® reg. trademark of BASF Group
ULTRAMID® reg. trademark of BASF Group
ULTRASON® reg. trademark of BASF Group
VELONDIS® reg. trademark of BASF Group
VIZURA® reg. trademark of BASF Group
VAULT® reg. trademark of BASF Group
XEMIUM® reg. trademark of BASF Group
1 Trademarks are not registered in all countries.

250 Overviews BASF Report 2017
Glossary
Glossary
A
Associated companiesAssociated companies are entities in which significant influence can be exercised over their operating and financial policies and which are not subsidiaries, joint ventures or joint operations. In general, this applies to companies in which BASF has an investment of between 20% and 50%.
AuditsAudits are a strategic tool for monitoring and directing standards. During a site or plant audit, clearly defined criteria are used to create a profile on topics such as environment, safety or health.
B
Barrel of oil equivalent (BOE)A barrel of oil equivalent (BOE) is an international unit of measure-ment for comparing the energy content of different fuels. It is equal to one barrel of crude oil, or 6,000 cubic feet (169 cubic meters) of natural gas.
BiotechnologyBiotechnology includes all processes and products that make use of living organisms, such as bacteria and yeasts, or their cellular con-stituents.
BDOBDO stands for 1,4-Butanediol and is a BASF intermediate. BDO and its derivatives are used for producing plastics, solvents, elec-tronic chemicals and elastic fibers.
C
CDPThe international nonprofit organization CDP (formerly the Carbon Disclosure Project) analyzes environmental data of companies. The CDP’s indexes serve as assessment tools for investors.
CO2 equivalentsCO2 equivalents are units for measuring the impact of greenhouse gas emissions on the greenhouse effect. A factor known as the global warming potential (GWP) shows the impact of the individual gases compared with CO2 as the reference value.
Commercial paper programThe commercial paper program is a framework agreement between BASF and banks regarding the issuing of debt obligations on the financial market (commercial paper). The commercial paper is issued under a rolling program for which the terms can be deter-mined individually. This requires a good rating.
Competency ModelBASF’s Competency Model is derived from its strategic principles and corporate values and translates these into specific day-to-day behavioral standards. It is applicable worldwide, creating a common framework for the conduct of all BASF employees and leaders to enable us to reach our shared goals. The eight competencies are: Drive Innovation, Collaborate for Achievement, Embrace Diversity, Communicate Effectively, Drive Sustainable Solutions, Develop Self and Others, Act with Entrepreneurial Drive, Demonstrate Customer Focus.
ComplianceCompliance is an important element of corporate governance. It refers to the company’s behavior in accordance with laws, guide-lines and voluntary codices.
D
Dodd-Frank ActThe Dodd-Frank Act issued in 2010 comprises accounting and disclosure obligations for publicly listed U.S. companies regarding the use of certain raw materials that come from the Democratic Republic of the Congo or its bordering countries. The companies must prove that the materials they use do not come from mines in these conflict areas. The definition of conflict minerals as per the Dodd-Frank Act includes the following materials and their deriva-tives: Columbitetantalite (coltan), cassiterite, wolframite and gold.
E
EBITEarnings before interest and taxes (EBIT): At BASF, EBIT corre-sponds to income from operations.
EBIT after cost of capitalEBIT after cost of capital is calculated by deducting the cost of capital from the EBIT of the operating divisions. The cost of capital thereby reflects the shareholders’ expectations regarding return (in the form of dividends or share price increases) and interest payable to creditors. If the EBIT after cost of capital has a positive value, we have earned a premium on our cost of capital.
EBITDAEarnings before interest, taxes, depreciation and amortization (EBITDA): At BASF, EBITDA corresponds to income from operations before depreciation and amortization (impairments and reversals of impairments).
EBITDA margin The EBITDA margin is the margin that we earn on sales from our operating activities before depreciation and amortization. It is calcu-lated as income from operations before depreciation, amortization and valuation allowances as a percentage of sales.

BASF Report 2017 Overviews
Glossary 251
Eco-Efficiency AnalysisThe Eco-Efficiency Analysis is a method developed by BASF for assessing the economic and environmental aspects of products and processes. The aim is to compare products with regard to profit-ability and environmental compatibility.
Enhanced Oil Recovery (EOR)Enhanced oil recovery (EOR) methods, also called tertiary recovery or tertiary production methods, are used to increase the recovery factor from oil reservoirs. Different technologies are employed depending on reservoir conditions; a distinction is generally made between thermal and chemical EOR and miscible gas flooding, which makes use of gases such as carbon dioxide.
Emerging marketsWe define the emerging markets as Greater China, the ASEAN countries (Brunei, Indonesia, Malaysia, Myanmar, Cambodia, Laos, the Philippines, Singapore, Thailand, Vietnam), India, Pakistan and Bangladesh; Central and South America; eastern Europe; the Middle East, Turkey and Africa.
Equity methodThe equity method is used to account for shareholdings in joint ventures and associated companies. Based on the acquisition costs of the shareholding as of the acquisition date, the carrying amount is continuously adjusted to the changes in equity of the company in which the share is held.
European Water Stewardship (EWS) StandardThe European Water Stewardship (EWS) Standard enables busi-nesses and agriculture to assess the sustainability of their water management practices. The criteria are water abstraction volumes, water quality, conservation of biodiversity and water governance. The Europe-wide standard came into force at the end of 2011 and was developed by nongovernmental organizations, governments and businesses under the direction of the independent organization European Water Partnership (EWP).
ExplorationExploration refers to the search for mineral resources, such as crude oil or natural gas, in the Earth’s crust. The exploration process involves using suitable geophysical methods to find structures that may contain oil and gas, then proving a possible discovery by means of exploratory drilling.
F
Field developmentField development is the term for the installation of production facilities and the drilling of production wells for the commercial exploitation of oil and natural gas deposits.
FormulationFormulation describes the combination of one or more active substances with excipients like emulsifiers, stabilizers and other inactive components in order to improve the applicability and effec-tiveness of various products, such as cosmetics, pharmaceuticals, agricultural chemicals, paints and coatings.
Free cash flow Free cash flow is cash provided by operating activities less pay-ments made for property, plant and equipment and intangible assets.
G
Global CompactIn the United Nations Global Compact network, nongovernmental organizations, companies, international business and employee representatives, scientists and politicians work on aligning global business with the principles of sustainable development.
Global Product Strategy (GPS)The Global Product Strategy aims to establish global product stewardship standards and practices for companies. The program, initiated by the International Council of Chemical Associations, strives to ensure the safe handling of chemicals by reducing existing differences in risk assessment.
Global Reporting Initiative (GRI)The Global Reporting Initiative is a multistakeholder organization. It was established in 1997 with the aim of developing a guideline for companies’ and organizations’ voluntary reporting on their eco-nomic, environmental and social activities. The GRI Guidelines became global GRI Standards in 2016.
Greenhouse Gas Protocol (GHG Protocol)The Greenhouse Gas Protocol, used by many companies in different sectors as well as nongovernmental organizations and govern-ments, is a globally recognized standard to quantify and manage greenhouse gas emissions. The reporting standards and recom-mendations for implementing projects to reduce emissions are jointly developed by companies, nongovernmental organizations and governments under the guidance of the World Resources Insti-tute and the World Business Council for Sustainable Development.
H
Health Performance Index (HPI)The Health Performance Index is an indicator developed by BASF to provide more detailed insight into our approach to health manage-ment. It comprises five components: confirmed occupational diseases, medical emergency drills, first aid, preventive medicine and health promotion.
I
IASIAS stands for International Accounting Standards (see also IFRS).
IFRSThe International Financial Reporting Standards (until 2001: Interna-tional Accounting Standards, IAS) are developed and published by the International Accounting Standards Board, headquartered in London, England. The “IAS Regulation” made the application of IFRSs mandatory for listed companies headquartered in the Euro-pean Union starting in 2005.

252 Overviews BASF Report 2017
Glossary
ILO Core Labor StandardsThe ILO Core Labor Standards are set out in a declaration of the International Labor Organization (ILO), comprising eight conventions that set minimum requirements for decent working conditions.
ISO 9001ISO 9001 is an international standard developed by the International Organization for Standardization (ISO) that determines minimum requirements for a quality management system for voluntary certifi-cation.
ISO 14001ISO 14001 is an international standard developed by the Interna-tional Organization for Standardization (ISO) that determines the general requirements for an environmental management system for voluntary certification.
ISO 19011ISO 19011 is an international standard developed by the International Organization for Standardization (ISO) that determines requirements for audits of quality management and environmental management systems.
ISO 50001ISO 50001 is an international standard developed by the International Organization for Standardization (ISO) that determines the general requirements for an energy management system for voluntary certi-fication.
J
Joint ArrangementA joint arrangement refers to joint ventures and joint operations, and describes a jointly controlled arrangement of two or more parties. This arrangement exists if decisions about relevant activities require the unanimous consent of all parties sharing control.
Joint OperationA joint operation is a joint arrangement in which the parties that share control have direct rights to the assets and liabilities relating to the arrangement. For joint operations, the proportional share of assets, liabilities, income and expenses are reported in the BASF Group Consolidated Financial Statements.
Joint VentureA joint venture is a joint arrangement in which the parties that have joint control of a legally independent entity have rights to the net assets of that arrangement. Joint ventures are accounted for using the equity method in the BASF Group Consolidated Financial State-ments.
L
Long-term incentive program (LTI)The long-term incentive program is a share price-based compensa-tion program primarily for senior executives of the BASF Group and members of the Board of Executive Directors. The program aims to tie a portion of the participants’ annual variable compensation to the long-term, absolute and relative performance of BASF shares by making an individual investment in the company’s stock.
M
Materiality analysis/material aspectsBASF uses the materiality analysis to determine the significance of sustainability topics based on internal analyses and the expectations of external stakeholders.
MDIMDI stands for diphenylmethane diisocyanate and is one of the most important raw materials for the production of polyurethane. This plastic is used for applications ranging from the soles of high-tech running shoes and shock absorbers for vehicle engines to insu-lation for refrigerators and buildings.
Million British thermal unit (mmBtu)The British thermal unit (Btu) is a unit of energy observed in the Anglo-American measuring system. It is used for indicating values such as the energy content of gas. One mmBtu (million British thermal units) is equal to approximately 1,003 cubic feet of gas or 28 cubic meters of gas.
Monitoring systemMonitoring systems and tools serve to measure and ensure the adherence to standards. One area that is monitored is our voluntary commitments, such as the adherence to human rights and interna-tionally recognized labor standards.
MSCI World Chemicals IndexThe MSCI World Chemicals Index is a stock index that includes the world’s biggest chemical companies. It measures the performance of the companies in the index in their respective national currencies, thus considerably reducing currency effects.
N
NanomaterialsThe International Organization for Standardization defines nano-materials as materials with one or more external dimensions on a nanoscale or with internal structure or surface structure on a nanoscale. For regulatory purposes, there are additional definitions for nanomaterials worldwide
NaphthaNaphtha is petroleum that is produced during oil refining. Heavy naphtha is the starting point for gasoline production. Light naphtha is the most important feedstock for steam crackers.
BASF Report 2017 Overviews
Glossary 253
NMVOC (Nonmethane Volatile Organic Compounds)VOCs (volatile organic compounds) are organic substances that are present in the air as gas at low temperatures. These include some hydrocarbons, alcohols, aldehydes and organic acids. NMVOCs are VOCs from which methane is excluded.
O
OHSAS 18001The Occupational Health and Safety Assessment Series (OHSAS) includes the standard OHSAS 18001, which contains a manage-ment system for occupational safety. This system can be integrated into an existing quality and environmental protection management system and certified accordingly.
P
Peak sales potentialThe peak sales potential of the crop protection pipeline describes the total peak sales generated for individual products in the research and development pipeline. Peak sales are the highest sales value to be expected from one year. The pipeline comprises innovative active ingredients and system solutions that have been on the market since 2017 or will be launched on the market by 2027.
Propylene oxide (PO)Propylene oxide (PO), a very reactive compound, is generated by the oxidation of propylene and is used as basic chemical for further processing in the chemical industry.
R
REACHREACH is a European Union regulatory framework for the registra-tion, evaluation and authorization of chemicals, and will be imple-mented gradually until 2018. Companies are obligated to collect data on the properties and uses of produced and imported substances and to assess any risks. The European Chemicals Agency reviews the submitted dossiers and, if applicable, requests additional information.
Renewable resourcesThe term renewable resources refers to components from biomass that originate from different sources (plants and microorganisms, for example), and are used for industrial purposes. Renewable resources are used for manufacturing numerous products.
Responsible Care®
Responsible Care® refers to a worldwide initiative by the chemical industry to continuously improve its performance in the areas of environmental protection, health and safety.
RetentionProfits generated can be used in two ways: distribution to share-holders or retention within the company.
Return on assetsReturn on assets describes the return we make on the average assets employed during the year and reflects this return indepen-dent of the capital structure. It is calculated as income before taxes and minority interests plus interest expenses as a percentage of average assets.
ROCEReturn on capital employed (ROCE) is a measure of the profitability of our operations. We calculate this indicator as the EBIT generated by the operating divisions as a percentage of the average cost of capital basis. The average cost of capital basis corresponds to the operating assets of the segments used to determine the cost of capital plus the customer and supplier financing not included there and is calculated using the month-end figures in each case.
S
Special itemsSpecial items arise from the integration of acquired businesses, restructuring measures, impairments, gains or losses resulting from divestitures and sales of shareholdings, and other expenses and income that arise outside of ordinary business activities.
Spot market (cash market)A spot market is a market where an agreed-upon deal, including delivery, acceptance and payment, occurs immediately, as opposed to forward contracts, where the delivery, acceptance and payment occurs at a point in time after the conclusion of the deal.
Steam crackerA steam cracker is a plant in which steam is used to “crack” naphtha (petroleum) or natural gas. The resulting petrochemicals are the raw materials used to produce most of BASF’s products.
Sustainable Solution Steering®
We use Sustainable Solution Steering® to review and guide our port-folio in terms of sustainability. The four categories – Accelerators, Performers, Transitioners and Challenged – indicate how our products and solutions already comply with sustainability requirements and how we can increase their contribution.
T
TDITDI stands for toluene diisocyanate and is a raw material for the production of polyurethane. It is used primarily in the automotive industry (for example, in seat cushions and interiors) and the furni-ture industry (for example, for flexible foams for mattresses or cushioning, or in wood coating).
TUISTUIS is a German transport accident information and emergency response system jointly operated by around 130 chemical compa-nies. The member companies can be reached by the public author-ities at any time and provide assistance over the telephone, expert on-site advice or special technical equipment.

254 Overviews BASF Report 2017
Glossary
V
Value chain A value chain describes the successive steps in a production pro-cess: from raw materials through various intermediate steps, such as transportation and production, to the finished product.
VerbundIn the BASF Verbund (pronounced “fair-boond”), production facili-ties, energy flow, logistics and infrastructure are intelligently net-worked with each other in order to increase production yields, save resources and energy, and reduce logistics costs. We also make use of the Verbund principle for more than production, applying it for technologies, knowledge, employees, customers, and partners, as well.
W
Water stress areasWater stress areas are areas in which water represents a scarce resource, and where people abstract more than 60% of the water available. The most important factors leading to water scarcity are: low precipitation, high temperatures, low air humidity, unfavorable soil properties and high water abstraction rates.

BA
SF
Gro
up 2
017
at a
gla
nce
This report is printed on FSC® certified real art paper.
Publisher: BASF SE Communications & Government Relations 67056 Ludwigshafen
Printing: Kunst- und Werbedruck, Bad Oeynhausen
Photography:
Cover and page 1: Detlef Schmalow
Board of Executive Directors and Supervisory Board: Andreas Pohlmann

Re
po
rt 2
01
7
Published on February 27, 2018
You can find this and other BASF publications online at basf.com
You can also order the reports:
– By phone: +49 621 60-99001– Online: basf.com/publications
General inquiries Phone: +49 621 60-0, email: [email protected]
Media RelationsJens Fey, phone: +49 621 60-99123
Sustainability Relations Thorsten Pinkepank, phone: +49 621 60-41976
Investor Relations Dr. Stefanie Wettberg, phone: +49 621 60-48002
Internet basf.com
ContactFurther information
CO
MC
180
2 E
ISS
N 1
866-
9387
BASF supports the chemical industry’s global Responsible Care initiative.
Quarterly Statement, 1st Quarter 2018 / Annual Shareholders’ Meeting 2018
May 4, 2018Half-Year Financial Report 2018
July 27, 2018Quarterly Statement, 3rd Quarter 2018
October 26, 2018BASF Report 2018
February 26, 2019Quarterly Statement, 1st Quarter 2019 / Annual Shareholders’ Meeting 2019
May 3, 2019