bently case study-1
TRANSCRIPT

7/21/2019 Bently Case Study-1
http://slidepdf.com/reader/full/bently-case-study-1 1/16
CASE HISTORY
PAYBACK PROFILE
Ulf SandbackaManager, Testing & Inspections
UPM Wisaforest
Petri NohynekSales Engineer, Bently Nevada® Asset Condition Monitoring
GE Energy
Condition Monitoring Pays Off for Finnish Pulp & Paper MillHow UPM Wisaforest Uses System 1® Software
for Improved Asset Management
Introduction
This article explores the use of System 1® software in
conjunction with Trendmaster® Pro data acquisition
hardware at a pulp and paper mill in Finland. Applied to
nearly 50 discrete pieces of process machinery through-
out the mill, the system has only been in operation since
April 2004, yet has already been instrumental in identify-
ing and solving more than ten separate machinery
problems. An overview of the facility and the online con-
dition monitoring system is presented, along with five
case histories illustrating how equipment malfunctions
are being identified and resolved.
Background
UPM-Kymmene’s Wisaforest facility is a pulp and paper
mill situated on the Gulf of Bothnia’s coast in Pietarsaari,
Finland. The pulp mill was originally constructed in 1935
and was designed around a sulfite process. The plant
was switched to a kraft process during a 1962 rebuild,
and then in 1976 underwent major upgrades to the
hardwood and softwood pulp lines. Production capacity
today is 800,000 Air Dried tons per annum (ADt/a) of
pulp and 180,000 ADt/a of kraft and sack papers. The
mill generates its own power and is entirely self-
sufficient in this respect. It utilizes two production lines
throughout, with exception of the new recovery island
(WISA 800 REC project), discussed next.
The new recovery island at UPM-Kymmene’s
Wisaforest pulp and paper mill in Pietarsaari,
Finland. The result of the WISA 800 REC project,
the new unit boosted the mill’s pulp output to
800,000 ADt/a while decreasing environmental
discharge to best-available-technology levels.

7/21/2019 Bently Case Study-1
http://slidepdf.com/reader/full/bently-case-study-1 2/16
[Vol .25 No.2 2005] ORBIT 35
CASE HISTORY
PAYBACK PROFILE
WISA 800 REC Project
The WISA 800 REC (RECovery) project had several goals,
summarized in Table 1. The project entailed a single line
to replace the mill’s two previous recovery lines, which
were in bad mechanical condition and date from 1962
and 1975-1976, respectively. This new line is sized to
meet the mill’s pulp production capacity of 800,000
ADt/a. To achieve this capacity, the two existing fibre
lines were improved, resulting in better strength proper-
ties of the pulp. Additionally, a new sawdust cooking line
was added, providing more flexibility in the raw material
base by allowing the use of sawdust as feedstock for
selected pulp qualities, rather than burning it as had
been done previously. This delivers both environmental
advantages (fewer emissions) and process advantages
by allowing the mill to draw from a larger pool of locally
available sources for pulp feedstock.
In addition to the goals for the WISA 800 REC project,
the scope was likewise very extensive as summarized in
Table 2. The main equipment suppliers for the recovery
island were Andritz Corporation for much of the process
equipment, Siemens AG for the main turbo-generator,
and Metso Automation for the process control system.
For the condition monitoring (CM) system, GE Energy was
chosen to supply their Bently Nevada® solutions consist-
ing of System 1 software, Trendmaster Pro hardware,
and a 3500 monitoring system. Startup of the new recov-
ery departments occurred on-schedule in April 2004.
Table 1 –
GOALS OF WISA 800 REC PROJECT
• Become one of the most cost-efficient pulp mills
in Europe
• Increase pulp capacity to 800,000 ADt/a
• Decrease the environmental discharge levels to
best-available-technology
• Replace old and worn out equipment.
• Expand raw material options by using sawdust
for pulp production (instead of burning it)
Table 2 –
SCOPE OF WISA 800 REC PROJECT
• Service Module B
office building, control room, maintenance rooms
• Evaporation Plant
7+ stages, (1,050 tons H2O per hour, 82 - 85 % drysolids)
• Recovery Boiler
steam production 180 – 205 kg/s, 92 – 102 bar,
492 – 505 °C, 4,450 tons dry solids per day
• Back-Pressure Turbine-Generator*
143 MW
• Causticising Plant
10,000 m3/day white liquor
• Lime Kiln
750 tons of CaO per day
• Steam Condensate Treatment
200 litres per second
• Tall Oil Plant
192 tons per day
* According to Siemens AG, this is the world’s largest back-
pressure turbine generator used in the pulp & paper industry.

7/21/2019 Bently Case Study-1
http://slidepdf.com/reader/full/bently-case-study-1 3/16
CASE HISTORY
PAYBACK PROFILE
The Lime Kiln rotates at extremely slow
speeds (~10 rpm) on supporting rolls that
use fluid-film bearings.
Table 3 –
CONDITION MONITORING SYSTEM SUMMARY
Department Number
of Machines Machine Types Monitoring System
Evaporation 6 pumps, mixers, fan Trendmaster Pro
Recausticizing 18 pumps, compressors, mixers, filters, fan Trendmaster Pro
Recovery Boiler 14 pumps, mixers, fans Trendmaster Pro
Lime Kiln 11 pumps, mixers, filters, fans, lime kiln, Trendmaster Pro
supporting rolls and drives
Turbo-Generator 1 143 MW back-pressure steam turbine 3500 Series

7/21/2019 Bently Case Study-1
http://slidepdf.com/reader/full/bently-case-study-1 4/16
[Vol .25 No.2 2005] ORBIT 37
CASE HISTORY
PAYBACK PROFILE
The Condition Monitoring System
Employees working with the WISA 800 REC project
defined the scope of the CM system. Production line
leaders, assisted by the maintenance department, first
defined the machines that were most critical for the plant
production. Once the machines to be addressed were
determined, the appropriate monitoring technology was
then identified. The results of the plant’s evaluation are
summarized in Table 3.
Large, high-speed turbomachinery generally warrants aconventional rack-based continuous monitoring system,
and the plant chose Bently Nevada proximity probes
coupled with the 3500 Series Machinery Protection
System. With exception of the lime kiln, as discussed
below, all other machinery uses rolling element bearings
and is more appropriately addressed by a monitoring
system using a scanning architecture. Accelerometers
(Bently Nevada 200350) were deemed appropriate
for these machines, linked to the Bently Nevada
Trendmaster Pro system. Both the 3500 and
Trendmaster hardware were equipped with System 1
software connectivity, allowing these systems to be
linked into a common diagnostic platform.
[Editor’s Note: For additional information on the classification of
machinery criticality and selection of corresponding monitoring
technology, please refer to the article Trendmaster Goes Pro in
the Second Quarter 2004 issue of ORBIT, pp 30-47.]
The massive bearings on the lime kiln supporting rolls
are fluid-film type and the rotational speed is very low
(approximately 10 rpm). Initially, the plant determined
that these 16 bearings would use X-Y proximity probes
for vibration monitoring. However, this decision was
made late in the project, after the kiln had been supplied
and installed, making transducer retrofits considerably
more difficult than if this had been specified to the OEM
for factory installation of probes. Consequently, it was
necessary to equip these bearings with accelerometer
transducers. It was recognized that this was not an ideal
application, but project constraints dictated this compro-
mise. In order to provide rpm and phase reference
information, Keyphasor® transducers were installed
observing a suitable shaft discontinuity on each clutch.
Wisaforest selected three experienced CM technicians
to be the primary users for the condition monitoring
system, and these individuals have full configuration
privileges for the entire system. In addition, there are five
display licenses at the plant, one permitting a display
client in the control room, and four for various mainte-
nance and operations personnel elsewhere in the plant.
Project Execution
The project startup meeting was held on 3 December
2003. One of the first items that needed to be defined
was the total number of measurement points. This
number would determine how many Trendmaster Pro
Dynamic Scanning Modules (DSMs) would be required,
as each DSM can handle multiple transducer inputs. The
number of DSMs required represents a balance between
wiring costs, DSM costs, and scanning times. For this rea-
son, each application must be evaluated on a case-by-
case basis. While a single, centrally located DSM can
handle hundreds of measurement points, the wiring
costs can be quite high. In addition, the more points
assigned to a single DSM, the slower the scanning time
will be as it must multiplex among all its inputs. The most
economical solution is often to install multiple DSMs,
where a cluster of measurement points occur, and then
to link the DSMs using conventional wired or wireless
Ethernet. Due to the small bandwidth requirements, this
can often be achieved over existing plant networksrather than requiring a dedicated CM network.
For the WISA 800 REC project, it was determined that
10 DSMs would be the optimal number, reflecting the
appropriate balance of wiring costs, hardware costs,
and scanning times. Next, the locations for these DSMs
were determined. This will vary from one application to
the next based on wiring topology, availability of power
and network connections, and other factors. The final step

7/21/2019 Bently Case Study-1
http://slidepdf.com/reader/full/bently-case-study-1 5/16
CASE HISTORY
PAYBACK PROFILE
was to determine project installation scope. It was decided
that Wisaforest would be responsible for providing all
Local Area Network (LAN) connections along with locally
available power at each DSM location. The GE Energy
team would be responsible for installing all sensors,
cabling, cabling shields, junction boxes, and DSMs. In
addition, they would be responsible for the installation
and configuration of the System 1 software along with
integration to the plant’s process control system.
When field hardware installation was approximately
20% complete, System 1 software installation com-
menced. A significant element of the overall project was
to configure the software with appropriate monitoring
parameters such as alarm settings, frequency bands,
point labeling, and many other details. The machines in
the facility vary from one another in many ways includ-
ing operating speed (1 – 3000 rpm), drive mechanism
(direct, belt, and gear), and operating mode (constant
speed, variable speed, constant load, variable load).
This entails a high level of cooperation between numer-
ous suppliers, plant personnel, and GE Energy to
determine and document the correct values for all set-
tings, and then enter these values into the software’s
configuration screens.
In addition to the items already noted, a project of this
magnitude entails many other details, a few of which
are summarized below:
• Server model and its installation location
• Determination of LAN type (copper or fiber) and
connections thereto
• Labeling of cables and sensors
• System wiring topology
• Interconnection of DSM hardware and 3500 System
to System 1
• Ongoing dialog with machinery OEMs
• External computer support

7/21/2019 Bently Case Study-1
http://slidepdf.com/reader/full/bently-case-study-1 6/16
[Vol .25 No.2 2005] ORBIT 39
CASE HISTORY
PAYBACK PROFILE
• Coordination of machine test schedules with readiness
of CM system, allowing analysis of start-up data
• Integration with process control system and appro-
priate data types for display to operators
The last bullet in the above list merits additional discus-
sion. Originally, the project scope did not include an
interface between the process control system and
System 1 software. However, as the usage scenarios of
the CM system were further defined, the ability for oper-
ators to view basic condition information using their
process control system was deemed important, while
still providing in-depth diagnostic capabilities for rotating
machinery engineers via System 1 software’s user inter-
face. This resulted in two primary user interfaces: one for
operators, and one for machinery specialists. A bi-direc-
tional OPC link was used for this interface, allowing the
plant to not only import direct amplitudes and alarms
from the System 1 platform into the DCS, but also to
export numerous process variables from the DCS into the
System 1 database.
[Editor’s Note: You can read more about the usefulness of
process data correlation in a CM system and the importance of
making select CM data viewable in the plant control system in
the article Best Practices for Asset Condition Management in the
Third Quarter 2001 issue of ORBIT, pp. 46-47.]
Taking the New Recovery Unitinto Operation
As anyone who has been involved in a plant startup can
attest, one of the most crucial times for the CM system is
when machines are tested and brought online for thefirst time. Problems that may not have been apparent
at the factory may surface, or the installation of the
machine may have introduced problems (e.g., alignment,
piping strain, lube contamination, etc.). Consequently, a
very important aspect of the project was to ensure that
the CM system was configured and ready for use as
each machine was started up.
The first test runs for the new recovery unit started on
12 February 2004. Through careful advance planning
and schedule coordination, the CM system was ready to
begin monitoring these machines. As other machines
were subsequently brought online, the System 1 configu-
ration and commissioning were coordinated to coincide
with their start-up dates as well.
By 1 April 2004, when the new recovery unit officiallybegan full-time operation, all measurement points had
already been collecting data for several weeks.
Subsequently, the team turned its attention to “fine
tuning” alarm levels and other system configuration
settings, now that actual data was available from the
operating machines. During these adjustments, no
machine failures could be allowed, and faulty operating
conditions needed to remain visible. Wisaforest and
GE Energy worked collaboratively to successfully accom-
plish these objectives in a timely fashion.
As previously mentioned, although the plant started full-
time operation on 1 April, machinery testing commenced
several weeks prior to that date. During this start-up
phase, a number of machinery problems were identified
by the CM system, allowing proactive intervention and
remedy – even before the entire plant went “live.” This
early payback of the system and its usefulness during
startup activities had been a high priority for the
Wisaforest project team and was part of the justification
for installing the system in the first place. All participantswere extremely pleased that the system demonstrated
its value so early in the project. After full-time operation
commenced, the system continued to deliver value by
logging many other machinery “saves.” Several of these
saves are summarized next.
7/21/2019 Bently Case Study-1
http://slidepdf.com/reader/full/bently-case-study-1 7/16
40 ORBIT [Vol .25 No.2 2005]
CASE HISTORY
PAYBACK PROFILE
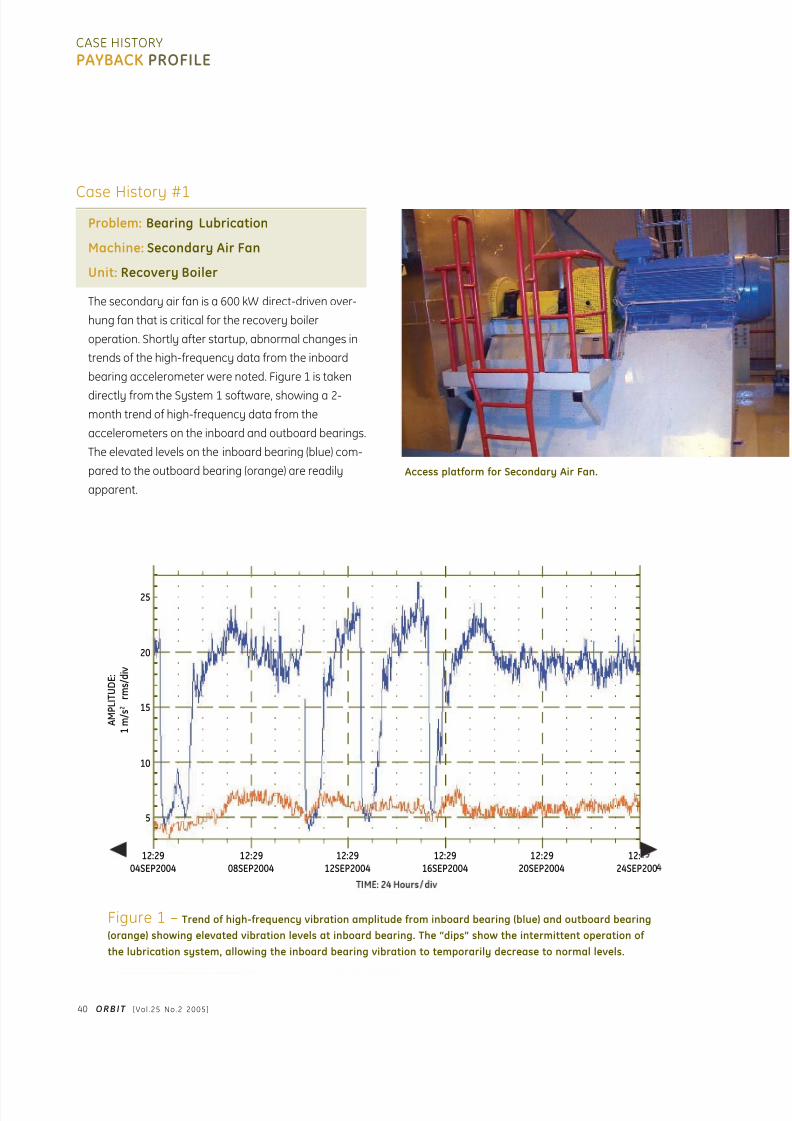
Case History #1Problem: Bearing Lubrication
Machine: Secondary Air Fan
Unit: Recovery Boiler
The secondary air fan is a 600 kW direct-driven over-
hung fan that is critical for the recovery boiler
operation. Shortly after startup, abnormal changes in
trends of the high-frequency data from the inboard
bearing accelerometer were noted. Figure 1 is taken
directly from the System 1 software, showing a 2-
month trend of high-frequency data from the
accelerometers on the inboard and outboard bearings.
The elevated levels on the inboard bearing (blue) com-
pared to the outboard bearing (orange) are readily
apparent.
12:2904SEP2004
12:2908SEP2004
12:2912SEP2004
12:2916SEP2004
12:2920SEP2004
12:24SEP200
25
20
15
10
5
A M P L I T U D E :
1 m / s 2
r m s / d i v
Figure 1 – Trend of high-frequency vibration amplitude from inboard bearing (blue) and outboard bearing
(orange) showing elevated vibration levels at inboard bearing. The “dips” show the intermittent operation of
the lubrication system, allowing the inboard bearing vibration to temporarily decrease to normal levels.
Access platform for Secondary Air Fan.

7/21/2019 Bently Case Study-1
http://slidepdf.com/reader/full/bently-case-study-1 8/16
[Vol .25 No.2 2005] ORBIT 41
CASE HISTORY
PAYBACK PROFILE
Spectral analysis suggested that the bearing’s outerring was wearing prematurely, and the root cause was
ultimately traced to problems with the bearing lubrica-
tion system. The prominent “dips” in the trend plot
correspond to intermittent operation of the lubrication
system, showing a marked decrease in vibration for
the inboard bearing when lubrication was flowing
properly.
Even though root cause was identified, implementing
the changes to the lubrication system was a lengthy
process, and the machine was required to operate inthe interim. Thus, although the bearing had to be
replaced twice during the first six months, the CM
system proved very useful in scheduling these
replacements, allowing the plant to monitor bearing
degradation closely and intervene at the right times,
before catastrophic bearing failure and collateral
machine damage occurred. Also, these outages could
be planned, allowing the bearing change-outs to be
performed when impact to production was minimized.
Case History #2
Problem: Resonance
Machine: Lime Kiln Driver
Unit: Lime Kiln
The lime kiln is a large machine, approximately 4.7
meters (15.4 feet) in diameter and 135 meters (443
feet) long, with extremely slow rotational speeds (as
low as 5 rpm). Two drivers provide rotational power,
and, depending on production conditions, the kilnmust run at different operating speeds. When the kiln
ran at higher speeds, higher vibration levels were
noted, occurring predominately at 2X. This led plant
personnel to initially conclude it was an alignment
problem, but realignment of the drivers did not correct
the situation and vibration levels remained elevated. A
re-examination of the vibration data was conducted,
this time by looking at phase and rpm data in addition
to amplitude and frequency (Figure 2 and Table 4).
One of two drives for the plant’s massive Lime Kiln.
THE CM SYSTEM PROVED
VERY USEFUL IN
SCHEDULING THESE
REPLACEMENTS, ALLOWING THE
PLANT TO MONITORBEARING DEGRADATION
CLOSELY AND INTERVENE AT
THE RIGHT TIMES.
7/21/2019 Bently Case Study-1
http://slidepdf.com/reader/full/bently-case-study-1 9/16
42 ORBIT [Vol .25 No.2 2005]
CASE HISTORY
PAYBACK PROFILE
07:1715AUG2004
07:1716AUG2004
07:1714AUG2004
07:1713AUG2004
07:1712AUG2004
07:1711AUG2004
07:1710AUG2004
07:1709AUG2004
09AUG200407:17
10AUG200407:17
11AUG200407:17
12AUG200407:17
13AUG200407:17
14AUG200407:17
15AUG200407:17
16AUG200407:17
TIME: 8 Hours/ div
360
270
180
90
0
20
25
0
5
10
15
P H A S E L A G :
1 5 d e g / d i v
A M P L I T U D E
:
1 5 m m / s r m s / d i v
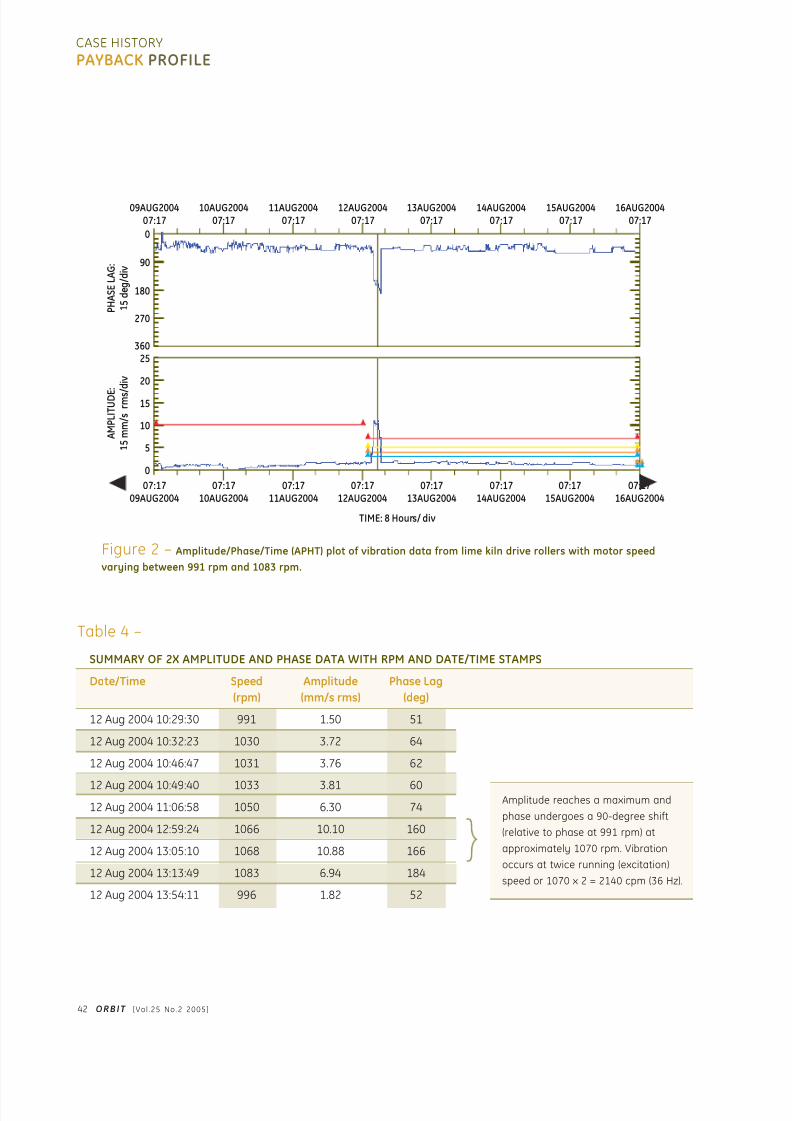
Figure 2 – Amplitude/Phase/Time (APHT) plot of vibration data from lime kiln drive rollers with motor speed
varying between 991 rpm and 1083 rpm.
Amplitude reaches a maximum and
phase undergoes a 90-degree shift
(relative to phase at 991 rpm) at
approximately 1070 rpm. Vibration
occurs at twice running (excitation)
speed or 1070 x 2 = 2140 cpm (36 Hz).
Table 4 –
SUMMARY OF 2X AMPLITUDE AND PHASE DATA WITH RPM AND DATE/TIME STAMPS
Date/Time Speed Amplitude Phase Lag
(rpm) (mm/s rms) (deg)
12 Aug 2004 10:29:30 991 1.50 51
12 Aug 2004 10:32:23 1030 3.72 64
12 Aug 2004 10:46:47 1031 3.76 62
12 Aug 2004 10:49:40 1033 3.81 60
12 Aug 2004 11:06:58 1050 6.30 74
12 Aug 2004 12:59:24 1066 10.10 160
12 Aug 2004 13:05:10 1068 10.88 166
12 Aug 2004 13:13:49 1083 6.94 184
12 Aug 2004 13:54:11 996 1.82 52

7/21/2019 Bently Case Study-1
http://slidepdf.com/reader/full/bently-case-study-1 10/16
[Vol .25 No.2 2005] ORBIT 43
CASE HISTORY
PAYBACK PROFILE
Figure 2 is an Amplitude/Phase/Time (APHT) plot
where the horizontal axis is time. It has characteristics
very similar to a Bode plot, whose horizontal axis is
machine speed rather than time; namely, if the
machine speed is changing markedly with time, an
APHT plot can show a resonance response, just as
a Bode plot. The classic features of resonance aretwo-fold: First, the filtered (1X, 2X, etc.) amplitude will
increase to a maximum at a rotational speed that
excites the resonance, and then will decrease as the
machine speed goes above this frequency. Second,
the phase lag will undergo a 180-degree shift, gener-
ally passing through approximately 90 degrees at the
point of resonance.
While Figure 2 does not label each individual data
point with its corresponding rpm, System 1 software is
capable of providing this information as a tabular out-put. The points clustered between 10AM and 2PM on
12 August 2004 showed the most dramatic shifts in
amplitude and phase, and coincided with a change
on the kiln from low-speed operation to high-speed
operation and back again. A tabular output of the data
points in Figure 2 was generated, and a subset of this
data is summarized in Table 4, clearly showing the
correlation between amplitude/phase changes and
running speed, and helping to confirm a structural
resonance at approximately 36 Hz.
During subsequent maintenance on the unit, the sup-
ports for the drivers were stiffened and strengthened,
raising the resonant frequency of the structure and
eliminating the vibration problems.
[Editor’s Note: Resonance is a well-understood phenomenon
in machines and structures, and operation of rotating
machinery at a running speed that coincides with a reso-
nance is never done deliberately. Sustained operation at a
structural resonance frequency can result in very high v ibra-tion amplitudes, fatiguing connections and components, and
prematurely wearing the entire machine. However, as this
case history shows, it can be equally damaging to operate
a machine at a speed that coincides with one-half of the res-
onant frequency – allowing the normally small 2X vibrations
generated by the machine to excite this resonance.
Resolution of this problem was instrumental in ensuring
the kiln could achieve expected maintenance intervals and
maximum useful life.]
Case History #3
Problem: Bearing Failure
Machine: Exhaust Gas Fan
Unit: Recovery Boiler
The official dedication for the WISA 800 production
unit took place on 24 August 2004. The Prime Minister
of Finland was in attendance, and, as part of the cere-
monies, pushed the “maximum operation” button,
allowing the recovery boiler to reach world-record
production capacity for a time. This mode of operationrequired the exhaust gas fans to run faster, and the CM
group began to notice an increase in 2X vibration
amplitudes on fan #3, as evident in the APHT plot of
Figure 3.
Access platform for Exhaust Gas Fan #3.
THE PRIME MINISTER OF
FINLAND, PUSHED THE
“MAXIMUM OPERATION” BUTTON.

7/21/2019 Bently Case Study-1
http://slidepdf.com/reader/full/bently-case-study-1 11/16
44 ORBIT [Vol .25 No.2 2005]
CASE HISTORY
PAYBACK PROFILE
14:3331AUG2004
14:3324AUG2004
14:3317AUG2004
14:3310AUG2004
10AUG200414:33
17AUG200414:33
24AUG200414:33
31AUG200414:33
360
300
240
180
120
60
0.0
0.2
0.4
0.6
P H A S E L A G :
3 0 d e g / d i v
A M
P L I T U D E :
0 . 5
m m / s r m s / d i v
Figure 3 – Amplitude/Phase/Time (APHT) plot of 2X vibration data from outboard bearing accelerometer
on Exhaust Gas Fan #3. Note that amplitudes prior to the cursor location on the plot were so low that phase
readings would not trigger consistently; as vibration amplitudes increased, phase readings stabilized.
0 200 400 600
5
0
5
A C C O U P L E D
1 m / s 2 / d i v
50 ms/div
Figure 4 – Unfiltered timebase plot from outboard bearing accelerometer on Exhaust Gas Fan #3.
Note characteristic “ringing” phenomena as inner race defect is impacted by rolling elements.

7/21/2019 Bently Case Study-1
http://slidepdf.com/reader/full/bently-case-study-1 12/16
[Vol .25 No.2 2005] ORBIT 45
CASE HISTORY
PAYBACK PROFILE
Closer examination revealed that the outboard bear-
ing of fan #3 had likely sustained a crack in the inner
ring, which can be noted in the timebase of Figure 4.
The characteristic “ringing” phenomenon observable
in the timebase occurs at the inner ring defect fre-
quency as the cracked inner ring repetitively rotates
through the load zone and the rolling elements contact
it with greatest force.
Subsequent to that event, the bearing has been moni-
tored closely, allowing operations to continue withoutreplacing the bearing. The defect does not appear to
be progressing and is not serious enough to necessi-
tate a bearing replacement until a more convenient
time can be scheduled.
[Editor’s Note: It is not clear whether an invoice for a new
bearing will be sent to the Finnish Prime Minister’s office.]
Case History #4
Problem: Faulty Coupling
Machine: White Liquor Pump
Unit: Recausticizing
A typical pulp mill has hundreds of pumps. At
Wisaforest, 15 of these were deemed suitably
important to connect to the CM system. In late May
2004, as shown in Figure 5, increased vibration levels
were noted on the motor driving the white liquor
pump. Further analysis revealed that the rubber
element in the coupling had deteriorated, allowing
metal-to-metal impacting. The coupling was subse-
quently repaired and vibration levels returned to
normal.
White Liquor Pump showing motor and coupling guard.
FOR WISAFOREST,
THE ECONOMIC BENEFITS
HAVE SUBSTANTIALLY
EXCEEDED
EXPECTATIONS…RESULTING IN AN
ESTIMATED PAYBACK TIME
FOR THEIR INVESTMENT OF
JUST 8 WEEKS.

7/21/2019 Bently Case Study-1
http://slidepdf.com/reader/full/bently-case-study-1 13/16
46 ORBIT [Vol .25 No.2 2005]
CASE HISTORY
PAYBACK PROFILE
Case History #5
Problem: Bearing Deterioration
Machine: Mixer Adjacent to Rotary Filter
Unit: Recausticizing
Rotary filters are one of the most difficult machines to
monitor since their rotational speed can be extremely
low – as little as 0.5 rpm. The bearings are fitted with
accelerometers and acceleration enveloping is one of
the signal processing techniques used to help identifydegradation and other anomalies.
In early September 2004, the CM group began to
notice increased vibration levels on the filter ’s inboard
bearing, observable in both the enveloped amplitude
and the high-frequency amplitude trends (Figure 6).
14:3315JUN2004
14:3322JUN2004
14:3308JUN2004
TIME: 24 Hours/div
14:3301JUN2004
14:3327MAY2004
14:3318MAY2004
18MAY200414:33
25MAY200414:33
01JUN200414:33
08JUN200414:33
15JUN200414:33
22JUN200414:33
360
300
240
180
120
60
0
0.0
0.5
1.0
P H A S E L A G :
3 0 d e g / d i v
A M P
L I T U D E :
0 . 1
m m
/ s r m s / d i v
Figure 5 – Amplitude/Phase/Time plot of 2X data from accelerometer on motor driving the white liquor pump.
Note abrupt increase in vibration amplitude beginning on 30 May 2004. A deteriorated coupling insert was found
to be the cause, and was replaced on 1 June 2004, returning vibration levels to normal values.
The rotary filter. Accelerometers were mounted on the filter
bearings and the gearbox (green, upper right); however, the
problem was traced to an unmonitored mixer underneath
the filter (concealed in lower left corner of photo).

7/21/2019 Bently Case Study-1
http://slidepdf.com/reader/full/bently-case-study-1 14/16
[Vol .25 No.2 2005] ORBIT 47
CASE HISTORY
PAYBACK PROFILE
13:47
08OCT2004
13:47
10SEP2004
13:47
13AUG2004
13:47
16JUL2004
13:47
18JUN2004
13:47
21MAY2004
13:47
23APR2004
TIME: 7 Days/ div
1.2
0.8
0.6
1.0
0.4
0.2
0.0
A M P L I T U D E :
0 . 0
5 E n v m / s 2
p k / d i v
13:4708OCT2004
13:4710SEP2004
13:4713AUG2004
13:4716JUL2004
13:4718JUN2004
13:4721MAY2004
13:4723APR2004
TIME: 7 Days/ div
1.5
1.0
0.5
0.0
A M P L I T U D E :
0 . 1
m / s 2
p k / d i v
Figure 6 – Amplitude trends from rotary filter bearing accelerometer showing high-frequency acceleration
(top) and enveloped acceleration (bottom). Note increased amplitudes in both signals beginning on
approximately 3 September 2004.

7/21/2019 Bently Case Study-1
http://slidepdf.com/reader/full/bently-case-study-1 15/16
48 ORBIT [Vol .25 No.2 2005]
CASE HISTORY
PAYBACK PROFILE
The enveloped acceleration timebase (Figure 7)
showed very clear evidence of periodic impacting, but
examination of the spectral components did not yield
any frequencies corresponding to the bearing geome-
tries or rotative speeds of the filter or its gearbox. A
visual examination of the filter gave the reason: it was
not the filter at all, but rather a separate mixer, located
below the filter, with a damaged bearing. Although the
mixer was a totally unmonitored machine, the impact
vibrations occurring from its faulty bearing were being
mechanically coupled into the accelerometer on the
filter bearing, located nearby. The root cause was
found to be broken lubrication piping feeding the mixer
bearing, which was subsequently repaired. However,
the bearing had been irreparably damaged and had to
be replaced. This case history is particularly notewor-
thy in that it demonstrated the sensitivity of the moni-
toring system to detect changes in even unmonitored
machinery. While certainly not recommended as a
deliberate CM strategy, it was an unexpected – and,
as it turned out – valuable fringe benefit.
Payback
While the users of the CM system are very pleased with
its diagnostic capabilities, it is important that we are able
to continually justify to plant management and opera-
tions the value of condition monitoring and diagnostics
in general. For Wisaforest, this translates to economic
benefits, and those benefits have substantially exceeded
expectations. Several of the machines highlighted in
these case histories have a critical role: they will cause
a complete stop in plant production if they do not run,
0 2010 30
1
0
1
A C C O U P L E D
0 . 2
E n v m / s 2 / d i v
2k ms/div
-0.02+3135.94 ms
0.32 hertz
Figure 7 – Timebase plot of enveloped acceleration showing clear evidence of impacting. Spectral analysis
yielded frequencies that did not coincide with bearings used on the rotary filter, leading the plant to look for
faults elsewhere.

7/21/2019 Bently Case Study-1
http://slidepdf.com/reader/full/bently-case-study-1 16/16
CASE HISTORY
PAYBACK PROFILE
representing substantial lost production costs. Plant per-
sonnel have avoided several total outages through use of
the system, resulting in an estimated payback time for
their investment of just 8 weeks.
Both the maintenance and production departments now
view the system as far more than just a tool for strength-
ening preventive maintenance capabilities – it is viewedas a tool for increasing the mill productivity. Strong credi-
bility has been established with management regarding
the value of condition monitoring and its role in ensuring
plant uptime, leading the plant to consider expanding the
system to additional equipment.
Summary
Wisaforest is achieving ongoing success with their CM
system for several reasons:
• Proven, quality technology from a knowledgeablesupplier was chosen as the basis for the plant’s
CM program.
• The plant enlisted the assistance of the supplier to
help install and implement the technology correctly.
• Adequate transducers were installed where feasible,
including speed/phase, rather than just vibration,
allowing confirmation of faults that would have been
difficult or impossible to isolate when limited to only
amplitude and frequency data (e.g., case history #2).
• Start-up activities were coordinated to include the
condition monitoring system as “must have” capabili-
ties before a machine was brought online.
• Plant management made certain that everyone
understood the CM program’s goals and objectives,
and that there was buy-in from all parties. This helped
ensure that the system would be used proactively and
consistently.
• The CM system was integrated with the process con-
trol system, allowing operators to have early visibility
to developing conditions, and allowing process data to
be available for correlation with vibration data when
performing in-depth diagnostics.
• Results were documented, allowing the users to quan-
tify the system’s value to management and other
stakeholders in the plant.
Consequently, the WISA 800 REC project has led to not
only a world-class facility, but world-class asset man-
agement practices and world-class results.
STRONG CREDIBILITY HAS BEEN ESTABLISHED WITH
MANAGEMENT REGARDING THE VALUE OF
CONDITION MONITORING.