ber science network requirements · ber science network requirements workshop biological and...
TRANSCRIPT
BER Science NetworkRequirements
Report of the Biological and EnvironmentalResearch Network Requirements Workshop
Conducted July 26 and 27, 2007

BER Science Network Requirements Workshop Biological and Environmental Research Program Office, DOE Office of Science
Energy Sciences Network Bethesda, MD – July 26 and 27, 2007
ESnet is funded by the US Dept. of Energy, Office of Science, Advanced Scientific Computing Research (ASCR) program. Dan Hitchcock is the ESnet Program Manager. ESnet is operated by Lawrence Berkeley National Laboratory, which is operated by the University of California for the US Department of Energy under contract DE-AC02-05CH11231. This work was supported by the Directors of the Office of Science, Office of Advanced Scientific Computing Research, Facilities Division, and the Office of Biological & Environmental Research. This is LBNL report LBNL/PUB-988.

2
Participants and Contributors
Dave Bader, LLNL (Climate) Raymond Bair, ANL (Comp Bio)
Anjuli Bamzai, DOE/SC BER Paul Bayer, DOE/SC BER
David Bernholdt, ORNL (Earth System Grid) Lawrence Buja, NCAR (Climate) Alice Cialella, BNL (ARM Data)
Eli Dart, ESnet (Networking) Eric Davis, LLNL (Climate) Bert DeJong, PNNL (EMSL)
Dick Eagan, ANL (ARM) Yakov Golder, JGI (Comp Bio) Dave Goodwin, DOE/SC ASCR
Daniel Hitchcock, DOE/SC/ASCR (ASCR Program Office) William Johnston, ESnet (Networking)
Phil Jones, LANL (Climate) Raymond McCord, ORNL (ARM)
Steve Meacham, NSF George Michaels, PNNL (Comp Bio)
Kevin Regimbal, PNNL (EMSL) Mike Sayre, NIH
Harris Shapiro, LBNL (JGI) Ellen Stechel, ASCAC
Brian Tierney, LBNL (Networking) Lee Tsengdar, NASA (Geosciences)
Mike Wehner, LBNL (Climate) Trey White, ORNL (Climate)
Editors Eli Dart, ESnet Engineering Group – [email protected]
Brian Tierney, LBNL Distributed Systems Department – [email protected]
3
Contents
1 Executive Summary .................................................................................................... 4
2 DOE Biological and Environmental Research Facilities and Programs..................... 5
2.1 Atmospheric Radiation Measurement (ARM) Program and the ARM Climate Research Facility (ACRF)................................................................................... 5
2.2 Climate Science – Large Simulations and Collaborative Tools ....................... 10
2.3 The Earth System Grid...................................................................................... 12
2.4 Environmental Molecular Sciences Laboratory, PNNL ................................... 17
2.5 Joint Genome Institute, Walnut Creek, CA ...................................................... 23
2.6 National Center for Atmospheric Research, Boulder, Colorado. ..................... 27
3 Issues......................................................................................................................... 32
4 Overall Summary and Conclusions .......................................................................... 33
5 Acknowledgements................................................................................................... 34

4
1 Executive Summary The Energy Sciences Network (ESnet) is the primary provider of network connectivity for the US Department of Energy Office of Science, the single largest supporter of basic research in the physical sciences in the United States of America. In support of the Office of Science programs, ESnet regularly updates and refreshes its understanding of the networking requirements of the instruments, facilities, scientists, and science programs that it serves. This focus has helped ESnet to be a highly successful enabler of scientific discovery for over 20 years.
In July 2007, ESnet and the Biological and Environmental Research (BER) Program Office of the DOE Office of Science organized a workshop to characterize the networking requirements of the science programs funded by the BER Program Office. These included several large programs and facilities, including Atmospheric Radiation Measurement (ARM) Program and the ARM Climate Research Facility (ACRF), Bioinformatics and Life Sciences Programs, Climate Sciences Programs, the Environmental Molecular Sciences Laboratory at PNNL, the Joint Genome Institute (JGI). National Center for Atmospheric Research (NCAR) also participated in the workshop and contributed a section to this report due to the fact that a large distributed data repository for climate data will be established at NERSC, ORNL and NCAR, and this will have an effect on ESnet.
Workshop participants were asked to codify their requirements in a “case study” format, which summarizes the instruments and facilities necessary for the science and the process by which the science is done, with emphasis on the network services needed and the way in which the network is used. Participants were asked to consider three time scales in their case studies – the near term (immediately and up to 12 months in the future), the medium term (3-5 years in the future), and the long term (greater than 5 years in the future).
In addition to achieving its goal of collecting and characterizing the network requirements of the science endeavors funded by the BER Program Office, the workshop emphasized some additional points. These included the need for a future ESnet presence in the Denver area, a desire for ESnet to continue support of collaboration services, and the need for ESnet to support dedicated bandwidth or “virtual circuit” services.
In addition, it is clear that the BER facilities are going to experience significant growth in data production over the next 5 years. The reasons for this vary (model resolution and supercomputer allocations for climate, detector upgrades for EMSL and ARM, sequencing hardware upgrades for JGI), but all indicators point to significant growth in data volumes over the near to medium term. This growth in data volume, combined with the ever-expanding scope of scientific collaboration, will continue to demand ever-increasing bandwidth, reliability and service richness from the networks that support DOE science.
5
2 DOE Biological and Environmental Research Facilities and Programs
All of the major DOE BER-funded activities were represented at the workshop. The following sections described the data and networking requirements of each of these facilities.
2.1 Atmospheric Radiation Measurement (ARM) Program and the ARM Climate Research Facility (ACRF)
Background ARM is a long-term measurement program funded by CCRD of BER in DOE that focuses on measuring the following:
• Cloud properties: microphysics (phases of water), optical properties, and patterns of occurrence
• Sunlight energy “fate”: radiative flux transfer, heating rate profiles, components of reflected and absorbed radiant energy, direct and diffuse light
• Atmospheric state: profiles of temperature, water vapor, wind, and aerosols
• Surface properties: Surface fluxes, soil conditions
The Program is building a “climatology” (multi-year record) of these measurements so that parameters for cloud formation and sunlight energy fate can be improved in global circulation models (GCMs). The GCM models are used for the prediction of future climate patterns. Cloud formation and sunlight energy fate are thought to be the source of some of the largest uncertainties in these models and long-term climate forecasts.
ARM field sites are located in Oklahoma / Kansas, North Slope of Alaska, Tropical Western Pacific (Manus and Nauru Islands and Darwin Australia). The ARM mobile facility is currently located in Germany, and soon to be in China. Formerly it was in Niger, Africa and Coastal California. Data Systems are located at PNNL, BNL, ORNL. The program has ties with NOAA, NASA, and ECMWF, and the user community is mostly in the US, but also globally distributed.
A distinct aspect of the ARM data collection is that it is continuous and has essentially the same parameters for its entire history. Most other studies in this aspect of Atmospheric Science are short-term case studies of only a few weeks or months.
The users of the ACRF data and network resources include: ARM facility personnel (for initial data collection, internal transfer, processing, and storage); and the research community (for access / download / use of documentation and data).
The user community is globally distributed. It can be divided into the following categories: persons from DOE facilities, persons outside DOE but within the US, persons from universities, and persons from foreign countries.
6
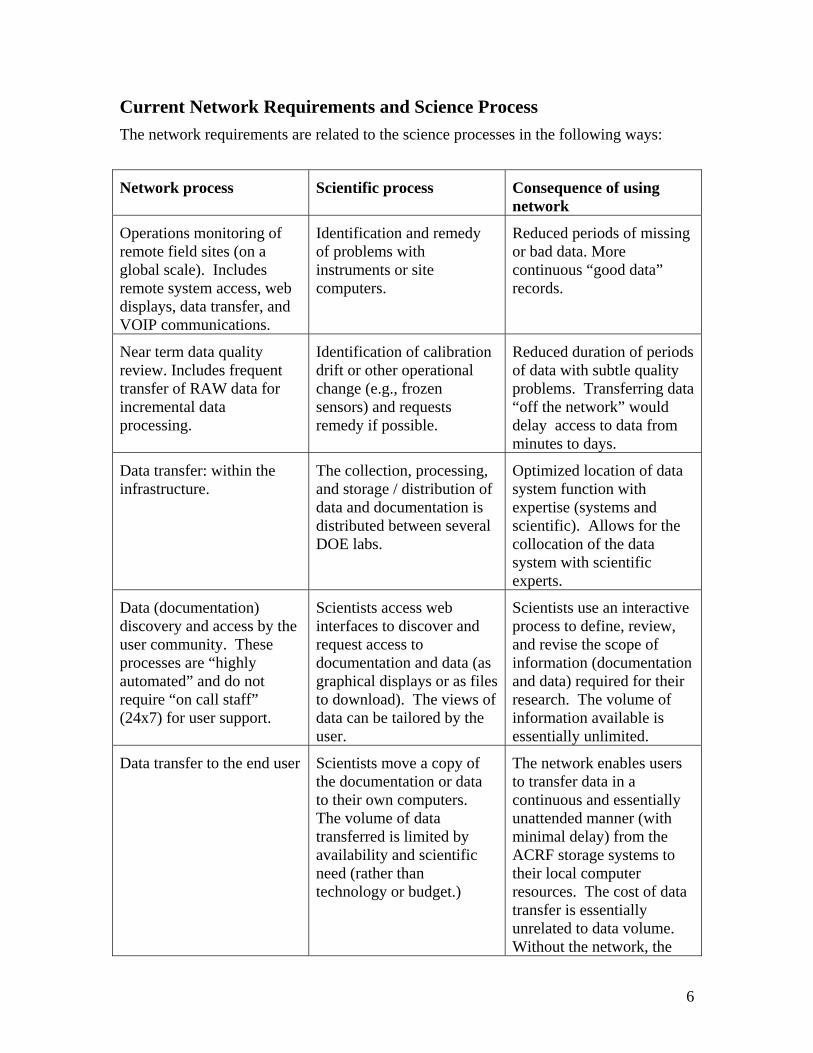
Current Network Requirements and Science Process The network requirements are related to the science processes in the following ways:
Network process Scientific process Consequence of using network
Operations monitoring of remote field sites (on a global scale). Includes remote system access, web displays, data transfer, and VOIP communications.
Identification and remedy of problems with instruments or site computers.
Reduced periods of missing or bad data. More continuous “good data” records.
Near term data quality review. Includes frequent transfer of RAW data for incremental data processing.
Identification of calibration drift or other operational change (e.g., frozen sensors) and requests remedy if possible.
Reduced duration of periods of data with subtle quality problems. Transferring data “off the network” would delay access to data from minutes to days.
Data transfer: within the infrastructure.
The collection, processing, and storage / distribution of data and documentation is distributed between several DOE labs.
Optimized location of data system function with expertise (systems and scientific). Allows for the collocation of the data system with scientific experts.
Data (documentation) discovery and access by the user community. These processes are “highly automated” and do not require “on call staff” (24x7) for user support.
Scientists access web interfaces to discover and request access to documentation and data (as graphical displays or as files to download). The views of data can be tailored by the user.
Scientists use an interactive process to define, review, and revise the scope of information (documentation and data) required for their research. The volume of information available is essentially unlimited.
Data transfer to the end user Scientists move a copy of the documentation or data to their own computers. The volume of data transferred is limited by availability and scientific need (rather than technology or budget.)
The network enables users to transfer data in a continuous and essentially unattended manner (with minimal delay) from the ACRF storage systems to their local computer resources. The cost of data transfer is essentially unrelated to data volume. Without the network, the

7
timing of data transfer would depend on shipping schedules and the cost would be greater (more labor intensive) for both the infrastructure and the scientists.
Establishing a “presence” in the research community.
The network is now routinely used to identify the existence and relevance of scientific information. The exchange and aggregation of scientific information is a critical component of the scientific method.
The network enables more continuity in establishing existence, availability, and relevance of information for scientific research. The cycle time between collection and use of information is substantially reduced by the network. Overall research productivity is increased.
A quantitative view of network usage by ARM can be summarized by the following statistics:
Statistic Number of files (transactions)
Number of MB
(data volume)
New data stored 75,000 / month
Range: 45K – 265K
2,200 GB / month
Range: 1,500 – 2,700 GB
Data requested 200,000 / month
Range (past year):
100K - 500K
1,500 GB / month
Range (past year):
700 – 2,800 GB
Total data stored (14 year history)
8,000,000 101 TB
Total data requested 17,000,000 78 TB

8
Network Requirements and Science Process – the next 5 years The following changes are expected within the next 5 years:
• The volume of data (flow and stored) will continue to double every 2.5 – 3 years. o This is largely driven by the “power of the desktop computer”, as
implemented in the lab or field for data collection or by the data user for analysis.
o The advantages of network functions for science (described above) will be utilized more as the costs for faster capacity continue to decline.
o It is also driven by the need to analyze larger scale problems. o The historical pattern of growth for the ARM Archive supports this
expectation. • Changes in network requirements can result “suddenly”.
o The recent history of ACRF contains several instances where the upgrade of one instrument for more observational intensity resulted in a “one-time” increase in the data volume by 2-5X for an entire site. Increased observational intensity can include: More channels of observation, more intervals on a vertical profile, changes from 1D to 2D or 2D to 3D, or more measurements cycles per time interval. It is common for several of these dimensions to increase at the same time.
• The complexity of data access will increase. o All users will be accustomed to accessing data by way of the Internet. o Their access will be more specific (in some cases) and will be enabled by
more complex processes (e.g., web services, automated remote data access functions)
• The integration of modeled (simulated) results and measured results will become more common.
o In environmental science, observations are “spotty” in comparison to the monitoring of the entire “system.” Therefore, modeling is important to “fill in” the observations. Conversely, greater volumes of data will become important to models.
o Measurement intensity (temporal and spatially) will begin to overlap with modeled “results,” as measurements become more widespread and model resolution approaches a finer scale
o Efforts to “simulate” measurement observations from model results are just beginning and will make measurement and model information more seamless for some scientific purposes. Conversely the assimilation of measurements into the modeling process will also close the gap between observed and simulated results.
• More collaboration between scientists regionally and globally will occur. o The impacts of climate change appear to be accelerating (my personal
opinion). Therefore, it is likely the scientists working on larger regions (large watersheds, continents, globally) will begin to work jointly on these large-scale problems.

9
o The exchange of information about a region between scientists located across the region will increase, as large-scale assessments are more common.
Beyond 5 years – future needs and scientific direction The trends beyond 5 years are likely to be very similar to those described for the next 5 years. While there will be some reduction of information flow on the network from the implementation of more specific data access functions, the demand for more information as input into the research will offset this reduction. The ability of the instruments and data collection hardware to record larger quantities of data will also offset the more specialized data access requests. More specialized data requests may also result in more complex patterns of network communications (requirements to synchronize communications between multiple systems).
A final perspective to consider for facilities like ACRF is their cumulative “nature”. The climate change research is not focused just on recent results, but rather on the entire aggregation of information available. A climate problem is solved by examining the “climatology” (or historical summary) of the available atmospheric information. Continued growth in data generation and access are predicted regardless of improved efficiencies in data selection.
Summary Table Anticipated Requirements Time
Frame Science Instruments and
Facilities Process of Science Network Network Services
Near-term data collected from ARM field sites
data collection, processing, storage, and made available for download to research community
1-2 Gbps data transfer services
5 years data rates double every 2.5 – 3 years
4-6 Gbps
5+ years 8-12 Gbps
10
2.2 Climate Science – Large Simulations and Collaborative Tools
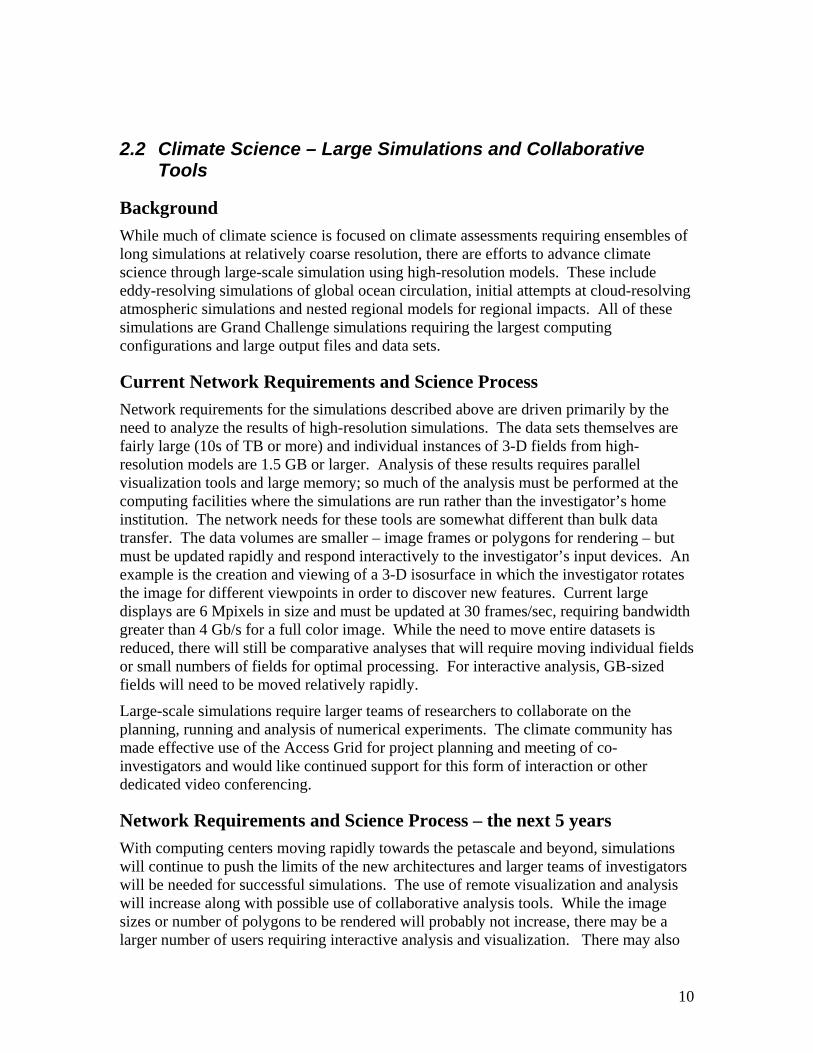
Background While much of climate science is focused on climate assessments requiring ensembles of long simulations at relatively coarse resolution, there are efforts to advance climate science through large-scale simulation using high-resolution models. These include eddy-resolving simulations of global ocean circulation, initial attempts at cloud-resolving atmospheric simulations and nested regional models for regional impacts. All of these simulations are Grand Challenge simulations requiring the largest computing configurations and large output files and data sets.
Current Network Requirements and Science Process Network requirements for the simulations described above are driven primarily by the need to analyze the results of high-resolution simulations. The data sets themselves are fairly large (10s of TB or more) and individual instances of 3-D fields from high-resolution models are 1.5 GB or larger. Analysis of these results requires parallel visualization tools and large memory; so much of the analysis must be performed at the computing facilities where the simulations are run rather than the investigator’s home institution. The network needs for these tools are somewhat different than bulk data transfer. The data volumes are smaller – image frames or polygons for rendering – but must be updated rapidly and respond interactively to the investigator’s input devices. An example is the creation and viewing of a 3-D isosurface in which the investigator rotates the image for different viewpoints in order to discover new features. Current large displays are 6 Mpixels in size and must be updated at 30 frames/sec, requiring bandwidth greater than 4 Gb/s for a full color image. While the need to move entire datasets is reduced, there will still be comparative analyses that will require moving individual fields or small numbers of fields for optimal processing. For interactive analysis, GB-sized fields will need to be moved relatively rapidly.
Large-scale simulations require larger teams of researchers to collaborate on the planning, running and analysis of numerical experiments. The climate community has made effective use of the Access Grid for project planning and meeting of co-investigators and would like continued support for this form of interaction or other dedicated video conferencing.
Network Requirements and Science Process – the next 5 years With computing centers moving rapidly towards the petascale and beyond, simulations will continue to push the limits of the new architectures and larger teams of investigators will be needed for successful simulations. The use of remote visualization and analysis will increase along with possible use of collaborative analysis tools. While the image sizes or number of polygons to be rendered will probably not increase, there may be a larger number of users requiring interactive analysis and visualization. There may also

11
be some experimentation with large-scale remote visualization (e.g. driving a local power wall from a remote supercomputer) as data sets increase to the point where pixel resolution on current monitors is inadequate to resolve simulation features.
Beyond 5 years – future needs and scientific direction In the future, we will continue to push simulations toward the highest resolutions achievable and will continue to increase the sizes of output datasets. Again, distance visualization will play an increasingly important role. Collaborative analysis tools may also begin to enter the picture in this time frame, allowing multiple investigators to interact at the same time with a dataset and discuss what they are observing and simulating.
Summary Table Anticipated Requirements
Time Frame
Science Instruments and
Facilities Process of Science Network Network Services
Near-term Leadership computing facilities
Large-scale simulations, including high-resolution climate simulations to increase the fidelity of climate models
Remote visualization and analysis tools
4 Gbps LAN
1 Gbps WAN
Dedicated pipes?
Access Grid or other collaborative services
5 years Leadership computing facilities
Large-scale simulation
Remote visualization and analysis
Collaborative analysis tools
Larger teams, more individuals requiring remote interactive analysis
5-20 Gbps LAN
2-5 Gbps WAN
same
5+ years Leadership computing facilities
Same as above 20-50 Gbps LAN
5-10 Gbps WAN
same

12
2.3 The Earth System Grid
Background The Earth System Grid (ESG) has been supported by the DOE SciDAC program (OASCR and BER) to develop a data grid for the distribution of climate modeling data. Production climate simulation is a computationally intensive activity, carried out at a few large computer centers around the country, many of which are operated by the DOE. The resulting data is of interest, depending on the circumstances, to the developers of the climate models, those interested in analyzing the simulation results, and eventually to those interested in the impacts of climate change and even policymakers. Prior to ESG, a time-intensive and error-prone process was necessary for an interested researcher to locate and retrieve data of interest – assuming they had (or could obtain) access to the center at which the data was stored. The fundamental mission of the ESG is to provide a (virtual) central location to serve as a clearinghouse for climate modeling data, providing researchers “one stop shopping” for the discovery and download of a broad range of simulation results.
Current Network Requirements and Science Process The current ESG architecture includes multiple portals. The Community Climate System Model (CCSM) portal, hosted at the National Center for Atmospheric Research (NCAR), communicates with data servers located at the archive sites (LANL, LBNL/NERSC, NCAR, and ORNL). User requests for data, made through the portal, result in data being retrieved from the appropriate archive (tertiary storage or local disk) and relayed to the main portal for subsequent delivery to the user.
A second portal at LLNL supports the Intergovernmental Panel on Climate Change (IPCC) activity, with data consolidated there by shipping disk arrays to the original data sites around the world. A third portal at ORNL supports the Leadership Computing Facility’s Computational Climate End Station (CCES) project, and is beginning to publish data from the Carbon Land Model Intercomparison Project (C-LAMP). User requests at the standalone portals are answered directly from locally-stored data.
The ESG enterprise, therefore, uses ESnet both internally (to convey data from archive sites to the NCAR portal), and for delivery of data to end-users (from the LLNL and ORNL portals, and for those end-users served by ESnet). The total data holdings of the ESG exceed 250 TB in 1 million files. To date, more than 270 TB of data in more than 1 million files have been delivered to users, predominately from the 35 TB CMIP3 data collection created for the IPCC 4th Assessment Report (AR4). Downloads from the ESG currently average more than 500 GB/day.

13
Network Requirements and Science Process – the next 5 years During the next five years, development and use of the ESG are driven by three primary customers:
• The Community Climate System Model team, and their data dissemination needs in conjunction with development and testing of the CCSM,
• The Computational Climate End Station (CCES) at the National Leadership Computing Facility at ORNL, which provides significant computational resources for climate simulation, and
• The IPCC 5th Assessment Report (AR5), which is expected to be completed in 2010.
The IPCC AR5, together with clear interest within the earth systems community in integration of climate modeling data with other types of data, are the strongest drivers in the development of the next generation ESG architecture. Two major themes in the next generation of the ESG are federation and on server-side analysis. The increasing size of individual data sets (due to advances in the science), and expected broader participation in international activities like AR5 have given us the requirement that data be published where it is produced to the maximum extent possible. Rather than consolidating data in a single location, we expect to have a federation of 25 or more sites across the globe running a combination of ESG and local software, making available data under the IPCC and other efforts. Also because of increasing data volumes, we are planning to provide users more precisely the data they want rather than the raw data set(s) from which it can be derived by developing processing capabilities that operate at the server, before the data is sent over the network. Typical requests would include geographical or temporal subsets of the data, or specific variables from among the many produced by the models.
More sophisticated processing might involve averages or other derived data products.
The community has some fairly sophisticated tools available that will be integrated into the ESG environment. Our capabilities for server-side processing will most likely be limited by the computing resources available at the participating sites.
The next-generation ESG environment will lead to some changes in patterns of network utilization. The infrastructure and mechanics associated with large-scale federation of ESG nodes will place “real time” demands on the network (high availability, frequent transmissions, small payloads), as authentication and authorization transactions are referred from various ESG servers to the user’s “home” ESG site and logging and monitoring information are collected. The increased level of distribution of the data, and the intent to deliver to users from the archive site rather than funneling all data through a portal will mean that ESnet will probably carry a lower proportion of the total volume of data the ESG delivers to users than it does currently. However internal network usage may increase.
One analysis capability we expect to offer on the server side is intercomparison, in which results of two simulation runs are compared “side by side”, requiring the server to access both sets of data simultaneously. In general, the data sets of interest could be at different
14
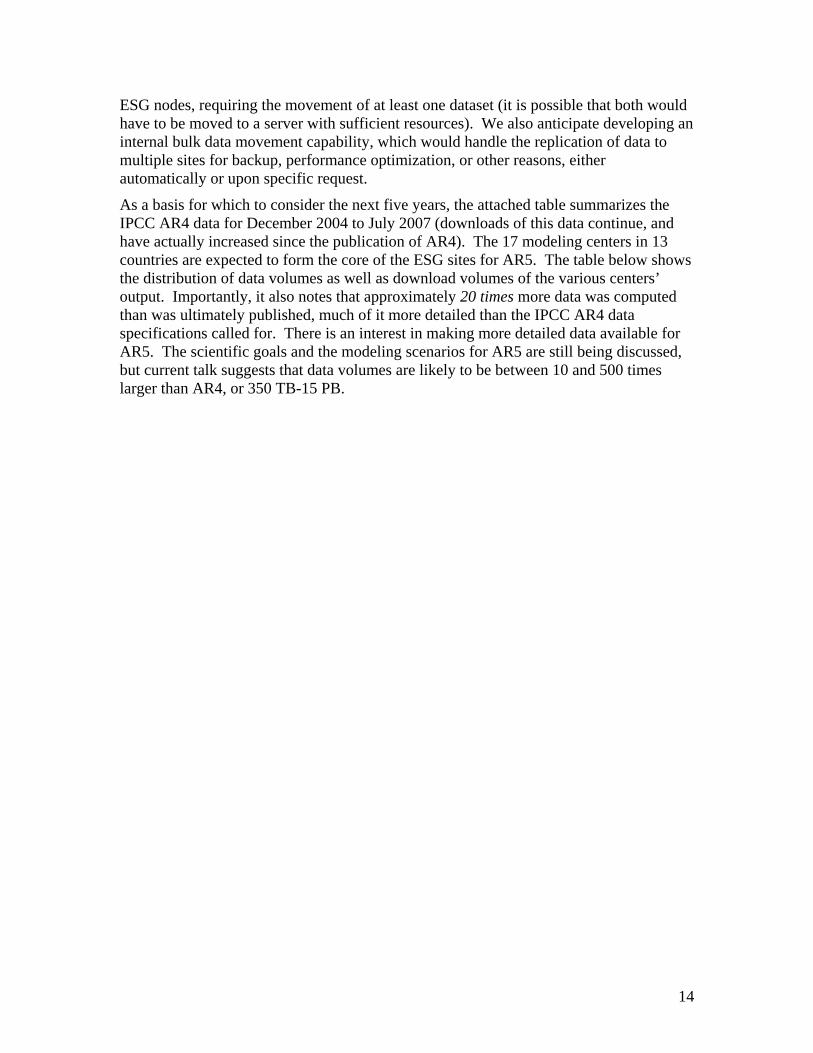
ESG nodes, requiring the movement of at least one dataset (it is possible that both would have to be moved to a server with sufficient resources). We also anticipate developing an internal bulk data movement capability, which would handle the replication of data to multiple sites for backup, performance optimization, or other reasons, either automatically or upon specific request.
As a basis for which to consider the next five years, the attached table summarizes the IPCC AR4 data for December 2004 to July 2007 (downloads of this data continue, and have actually increased since the publication of AR4). The 17 modeling centers in 13 countries are expected to form the core of the ESG sites for AR5. The table below shows the distribution of data volumes as well as download volumes of the various centers’ output. Importantly, it also notes that approximately 20 times more data was computed than was ultimately published, much of it more detailed than the IPCC AR4 data specifications called for. There is an interest in making more detailed data available for AR5. The scientific goals and the modeling scenarios for AR5 are still being discussed, but current talk suggests that data volumes are likely to be between 10 and 500 times larger than AR4, or 350 TB-15 PB.

15
Summary of Data Volume by Center
Country Modeling Center
Published
Data (GB)
Published
Experi-ments
Computed
Data (GB)
Downloaded
Data (GB)
Australia CSIRO Atmospheric Research 2,088 67% 3,700 14,086
Canada Canadian Centre for Climate Modelling & Analysis 2,071 75% 34,400 15,946
China Beijing Climate Center 352 50% 12,500 3,828
China LASG / Institute of Atmospheric Physics 2,868 58% 15,000 13,523
France Institut Pierre Simon Laplace 998 92% 50,000 6,917
France Météo-France / Centre National de Recherches Météorologiques 999 75% 16,500 9,336
Germany Max Planck Institute for Meteorology 2,700 92% 115,000 23,333
Germany / Korea
Meteorological Institute of the University of Bonn,. 477 75% 5,100 2,935
Italy Instituto Nazionale di Geofisica e Vulcanologia 1,472 - 5,445
Japan
Center for Climate System Research (The University of Tokyo),) 3,990 79% 100,000 33,069
Japan Meteorological Research Institute 1,025 100% - 9,978
Norway Bjerknes Centre for Climate Research 863 58% 22,180 6,975
Russia Institute for Numerical Mathematics 368 92% 500 2,801
UK
Hadley Centre for Climate Prediction and Research / Met Office 975 71% - 12,543
USA NASA / Goddard Institute for Space Studies 1,097 53% 3,250 12,445
USA National Center for Atmospheric Research 9,174 92% 122,640 57,884
USA
US Dept. of Commerce / NOAA / Geophysical Fluid Dynamics Laboratory 3,516 75% 155,000 32,639
12 17 35,033 71% 655,770 263,684
16
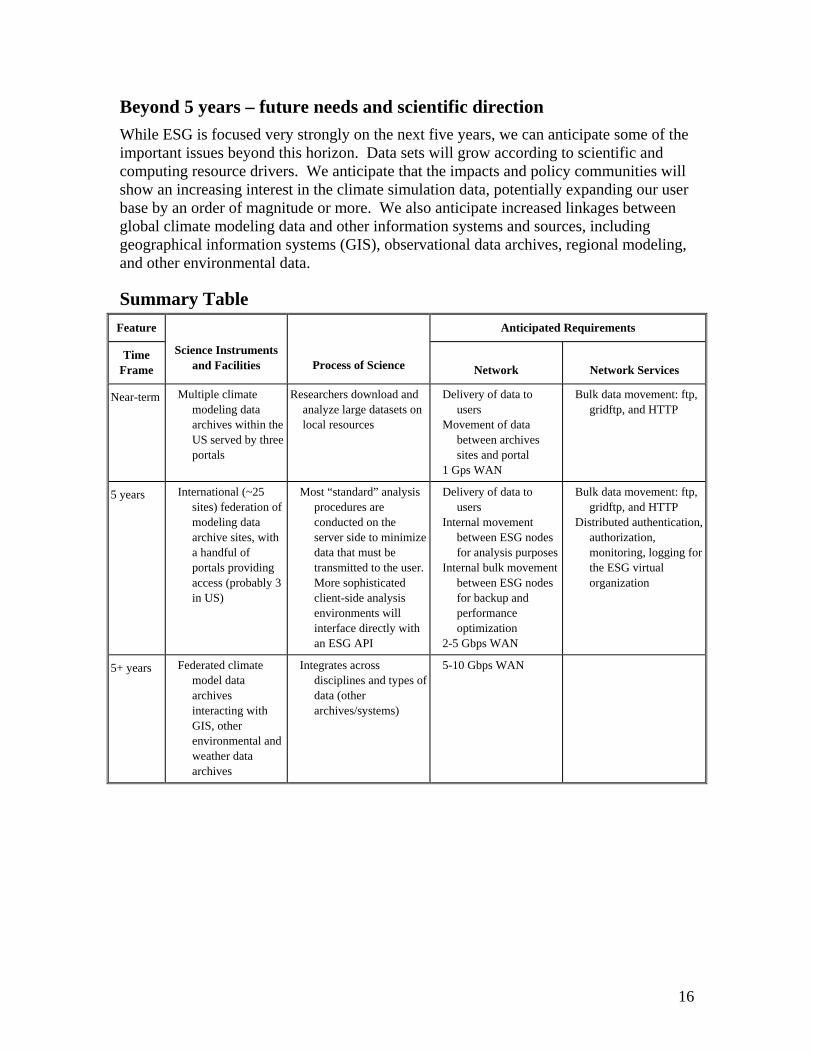
Beyond 5 years – future needs and scientific direction While ESG is focused very strongly on the next five years, we can anticipate some of the important issues beyond this horizon. Data sets will grow according to scientific and computing resource drivers. We anticipate that the impacts and policy communities will show an increasing interest in the climate simulation data, potentially expanding our user base by an order of magnitude or more. We also anticipate increased linkages between global climate modeling data and other information systems and sources, including geographical information systems (GIS), observational data archives, regional modeling, and other environmental data.
Summary Table Feature Anticipated Requirements
Time Frame
Science Instruments and Facilities Process of Science Network Network Services
Near-term Multiple climate modeling data archives within the US served by three portals
Researchers download and analyze large datasets on local resources
Delivery of data to users
Movement of data between archives sites and portal
1 Gps WAN
Bulk data movement: ftp, gridftp, and HTTP
5 years International (~25 sites) federation of modeling data archive sites, with a handful of portals providing access (probably 3 in US)
Most “standard” analysis procedures are conducted on the server side to minimize data that must be transmitted to the user. More sophisticated client-side analysis environments will interface directly with an ESG API
Delivery of data to users
Internal movement between ESG nodes for analysis purposes
Internal bulk movement between ESG nodes for backup and performance optimization
2-5 Gbps WAN
Bulk data movement: ftp, gridftp, and HTTP
Distributed authentication, authorization, monitoring, logging for the ESG virtual organization
5+ years Federated climate model data archives interacting with GIS, other environmental and weather data archives
Integrates across disciplines and types of data (other archives/systems)
5-10 Gbps WAN

17
2.4 Environmental Molecular Sciences Laboratory, PNNL
Background: The Environmental Molecular Sciences Laboratory (EMSL), a national scientific user facility at Pacific Northwest National Laboratory (PNNL), provides integrated experimental and computational resources for discovery and technological innovation in the environmental molecular sciences to support the needs of the U.S. Department of Energy (DOE) and the nation. EMSL, located in Richland, Washington, is operated by PNNL for DOE’s Office of Biological and Environmental Research. The user facility is the cornerstone of DOE’s commitment to provide world-class research capabilities for enabling fundamental research on physical, chemical, and biological processes. A more thorough understanding of these processes lays the foundation for new solutions to environmental problems and other critical issues. Equipped with more than 100 major instrument systems for use by the research community, EMSL facilitates multidisciplinary approaches to complex scientific problems and provides a climate for advancement and education in the molecular and computational sciences.
Current Network Requirements and Science Process EMSL offers, at one location, a comprehensive array of leading-edge resources available on a peer-reviewed proposal basis. Each year, EMSL issues calls for proposals focused on scientific themes aligned with the EMSL mission as well as capability-based calls aimed at using EMSL’s unique capabilities. Additionally, users are free to submit proposals at any time through the open call process. To best meet their own special needs, users may define combinations of equipment and capabilities from six research facilities housed in EMSL. EMSL staff work with users to expedite access to the facilities and enhance the user’s experience. EMSL’s six research facilities and associated capabilities are described below.
Chemistry and Physics of Complex Systems Facility (CPCS) fosters fundamental research in the natural sciences to provide the basis for new and improved energy technologies and for understanding and mitigating the environmental impacts of energy use and contaminant releases. Instrumentation located in this facility includes:
• high-intensity and high-sensitivity surface chemistry systems • high-resolution single molecule/particle/cell spectroscopy • high-resolution infrared and photoelectron spectroscopy • molecular beam, laser and mass spectrometry techniques • environmental scanning electron microscope.
18
Environmental Spectroscopy and Biogeochemistry Facility (ESB) is involved in experimental and modeling studies of chemical phenomena and mechanisms on mineral and microbe surfaces and on complex heterogeneous environmental materials from soils, sediments, and groundwater zones. Instrumentation located in this facility includes:
• laser-induced fluorescence, Raman, and ultraviolet-visible spectrometers, streak camera, confocal microscope, and lasers
• near-mid-far Fourier transform infrared spectrometer/microscope • Mossbauer and electron paramagnetic resonance spectrometers • scanning tunneling and atomic force microscopes • multi-fluid flow/transport cells • geochemistry molecular modeling software • general analytical equipment.
High-Field Magnetic Resonance Facility (HFMRF) provides state-of-the-art nuclear magnetic resonance (NMR) and electron paramagnetic resonance (EPR) instrumentation for determining molecular structures that impact environmental remediation and biological health effects. Instrumentation located in this facility includes:
• NMR spectrometers (ranging from 900 to 300 MHz) and one pulsed EPR spectrometer, with capabilities in high-field liquid-state, solid-state and micro imaging techniques
• low-temperature probes for metallo-protein chemistry and structure • high-temperature and in-situ probes for catalytic materials • radionuclide-capable NMR • combined optical and magnetic resonance confocal microscope • virtual NMR capability to enable use and collaboration with EMSL scientists for
remote users via secure shell over the internet.
High-Performance Mass Spectrometry Facility (HPMSF) provides leading mass spectrometry capabilities that focus on global proteomics research and allow visualization and analyses of cellular proteins. Instrumentation located in this facility includes:
• four Fourier-transform ion cyclotron resonance mass spectrometers, 7, 9.4, 11.5, and 12 tesla with electrospray ionization sources
• Waters Q-Tof quadrupole time-of-flight mass spectrometer • five Finnigan LCQ and four LTQ ion trap spectrometers • ultra-high pressure liquid chromatographs • four Finnigan LTQ linear ion traps • three Orbitrap™ tandem mass spectrometers.
Interfacial and Nanoscale Science Facility (INSF) provides cutting-edge capabilities and scientific expertise to design surfaces, interfaces, and thin films for selective chemical and physical properties. Instrumentation located in this facility includes:
• molecular beam epitaxy, chemical vapor and sputter deposition • state-of-the-art surface science tools • high-pressure catalytic reactors interfaced with surface chemistry systems • ion beam modification and analysis capabilities • electron microscopes and x-ray diffraction instrumentation • ultra-high vacuum, liquid, and ambient environment scanning probes
19
• research tools for microfabrication, clean-room, and advanced electrochemical capabilities
• sensor and nanobiotechnology facilities.
Molecular Science Computing Facility (MSCF) provides scientific expertise, massively scalable software, and a high-performance supercomputer in support of a wide range of environmental molecular science. Instrumentation located in this facility includes:
• 1960-processor system with 9.7 terabytes of memory, 11.7 teraflops. This will be replaced by 2310 node cluster in the summer of 2008 with a total of 37 TB of memory and 162 teraflops.
• 750+ terabytes of archive storage.
• Molecular Science Software Suite, including NWChem, Extensible Computational Chemistry Environment, and Global Array Toolkit.
Researchers request access to EMSL facilities by submitting proposals via EMSL’s proposal system at www.emsl.pnl.gov. Proposed research is peer-reviewed for:
• scientific merit and quality of proposed research. • relevance to EMSL’s mission. • relevance to EMSL science themes. • relevance to EMSL resources (appropriateness for the facilities or capabilities
being requested) • potential to contribute significantly to highly cited publications.
Related to network requirements, ever larger data volumes generated by these systems, more users, and extensive collaborations affect network usage. Users also tend to require fast turnaround of data, which implies peak bandwidth is a factor in accessing data in a timely fashion.
Network Requirements and Science Process – the Next 5 Years The vision that directed the development of EMSL has led to significant scientific progress. EMSL plans to maintain its scientific impact during its second decade of operation by focusing attention and capability development in specific areas identified as high-priority science themes. These science themes help define and direct development of key capabilities and collections of user projects that can have significant impacts on important areas of environmental molecular science that are critical to DOE and the nation.
With these factors in mind, EMSL, in collaboration with the scientific community, DOE’s Office of Biological and Environmental Research leadership, and EMSL’s Science Advisory Committee selected four science themes:
• Atmospheric Aerosol Chemistry • Biological Interactions and Dynamics • Geochemistry/Biogeochemistry and Subsurface Science • Science of Interfacial Phenomena.

20
EMSL anticipates greater activity and dependence on the network as increased data volumes, more users, and extensive collaborations continue to impact network usage. A data management plan is being put in place that will emphasize user access to data from EMSL instruments. In addition, new capabilities in high throughput imaging and proteomics are being implemented, which are expected to increase the volume of acquired data significantly. It is anticipated that the archived proteomics data will be accessed with increasing frequency as its use in gene annotation becomes more common. Thus the volume of accessed data should increase by several fold in the next several years. Peak bandwidth to allow timely access to remote instrumentation will also continue to be a factor.
Beyond 5 Years – Future Needs and Scientific Direction As EMSL’s user research expands and matures, guided by the science themes, new and enhanced capabilities will be developed. Additionally; existing systems will be modified to support the needs of the user community. These developments are expected to generate a significant increase in data volumes due to the advances in computational capability. The creation of a planned Systems Microbiology and Extremophile Research Facility will significantly increase the numbers of complex biological samples analyzed by the EMSL, with an attendant increase in data volumes.
This growth in computational capability, embedded in all instruments, has fueled the development of many new systems both internally developed and commercially available. A new generation of mass spectrometers for proteomics applications are being developed that should increase sample throughput and data output by two orders of magnitude. Access to the massive sets of data generated by these new instruments will significantly increase network requirements.
Strong integration of data from multiple scientific domains to allow users to address systems-level problems will require EMSL to manage and integrate multi-petabyte-scale datasets. This will require the development of complex workflows accessing data generated and stored at EMSL with data from other user facility and research laboratories, which will significantly impact network requirements.
21
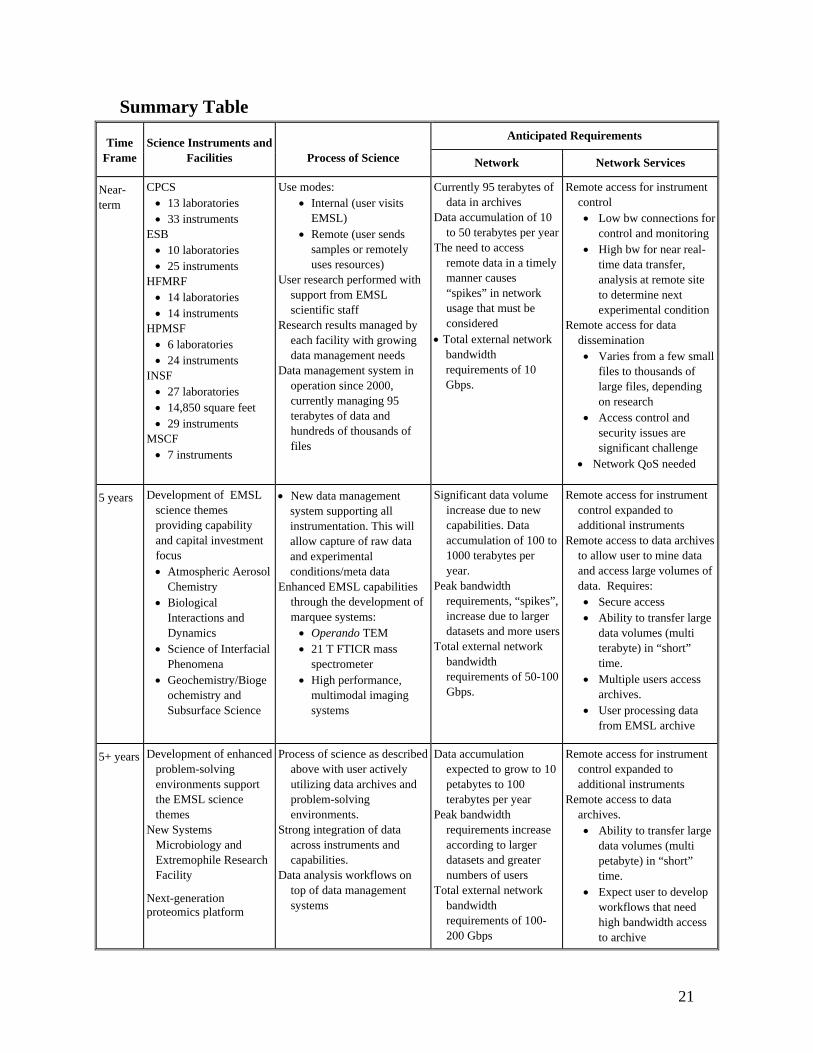
Summary Table Anticipated Requirements Time
Frame Science Instruments and
Facilities Process of Science Network Network Services
Near-term
CPCS • 13 laboratories • 33 instruments
ESB • 10 laboratories • 25 instruments
HFMRF • 14 laboratories • 14 instruments
HPMSF • 6 laboratories • 24 instruments
INSF • 27 laboratories • 14,850 square feet • 29 instruments
MSCF • 7 instruments
Use modes: • Internal (user visits
EMSL) • Remote (user sends
samples or remotely uses resources)
User research performed with support from EMSL scientific staff
Research results managed by each facility with growing data management needs
Data management system in operation since 2000, currently managing 95 terabytes of data and hundreds of thousands of files
Currently 95 terabytes of data in archives
Data accumulation of 10 to 50 terabytes per year
The need to access remote data in a timely manner causes “spikes” in network usage that must be considered
• Total external network bandwidth requirements of 10 Gbps.
Remote access for instrument control • Low bw connections for
control and monitoring • High bw for near real-
time data transfer, analysis at remote site to determine next experimental condition
Remote access for data dissemination • Varies from a few small
files to thousands of large files, depending on research
• Access control and security issues are significant challenge
• Network QoS needed
5 years Development of EMSL science themes providing capability and capital investment focus • Atmospheric Aerosol
Chemistry • Biological
Interactions and Dynamics
• Science of Interfacial Phenomena
• Geochemistry/Biogeochemistry and Subsurface Science
• New data management system supporting all instrumentation. This will allow capture of raw data and experimental conditions/meta data
Enhanced EMSL capabilities through the development of marquee systems: • Operando TEM • 21 T FTICR mass
spectrometer • High performance,
multimodal imaging systems
Significant data volume increase due to new capabilities. Data accumulation of 100 to 1000 terabytes per year.
Peak bandwidth requirements, “spikes”, increase due to larger datasets and more users
Total external network bandwidth requirements of 50-100 Gbps.
Remote access for instrument control expanded to additional instruments
Remote access to data archives to allow user to mine data and access large volumes of data. Requires: • Secure access • Ability to transfer large
data volumes (multi terabyte) in “short” time.
• Multiple users access archives.
• User processing data from EMSL archive
5+ years Development of enhanced problem-solving environments support the EMSL science themes
New Systems Microbiology and Extremophile Research Facility
Next-generation proteomics platform
Process of science as described above with user actively utilizing data archives and problem-solving environments.
Strong integration of data across instruments and capabilities.
Data analysis workflows on top of data management systems
Data accumulation expected to grow to 10 petabytes to 100 terabytes per year
Peak bandwidth requirements increase according to larger datasets and greater numbers of users
Total external network bandwidth requirements of 100-200 Gbps
Remote access for instrument control expanded to additional instruments
Remote access to data archives. • Ability to transfer large
data volumes (multi petabyte) in “short” time.
• Expect user to develop workflows that need high bandwidth access to archive

22
General Networking Issues and Comments: • Approximately 50 percent of EMSL users are from academia. Good
interconnectivity with Internet/Internet 2 is necessary. • Data is currently disseminated to user through a number of mechanisms, including
CDs/DVDs, Thumb drives, FTP / Web sites, and FedEx disk drives. • Quality of service is required for remote control of instruments. Those needs
should have priority over high bandwidth needs. • Ease of use is advanced network services is very important. • Systems Biology may dramatically change the remote data access need. Large
datasets are accumulating at multiple sites. The process of analyzing these data may require access to many of these data stores. Will likely need a balance of onsite computational resources to pre-process close to large datasets and ability to transfer the data directly.
• Peak bandwidth to allow timely access to remote repositories must be considered as data volumes and user numbers increase with time.

23
2.5 Joint Genome Institute, Walnut Creek, CA
Background The primary focus of the Joint Genome Institute (JGI) is the production of various types of genomic sequence data. These span a wide range of organism and environment types, from potential bioenergy feedstock plants, to prokaryotic communities that could facilitate the digestion of cellulosic material, to strains of yeast with high rates of fermentation.
The bulk of the JGI’s data is in the form of whole-genome shotgun (WGS) sequencing, for use in genome assembly and annotation. Smaller amounts (~5%) are expressed sequence tags (ESTs), used to identify transcribed gene sequences and so facilitate annotation and more custom downstream analysis.
Presently, the JGI generates most of its sequence data using capillary electrophoresis (CE), a.k.a. Sanger sequencing. The JGI is in the process of investigating the logistics of switching to a variety of new sequencing platforms, which offer the possibilities of much greater volumes of data at greatly reduced costs. This transition, involving the development of new laboratory protocols, data handling mechanisms, assembly algorithms, and analysis tools, is expected to dominate the next five-year time frame.
Current Network Requirements and Science Process • Sequence Data Management
• Current Sequencing Technology The JGI currently generates 2.3 gigabases of sequence per month using the Sanger platform. Including raw data files, this translates into approximately 1 terabyte of data per month, which is transferred over the network to NERSC for off-line archiving. This data is retrieved from NERSC only rarely and so there is no significant download component. Additionally about 200 GB per month of SCF files are transferred to the National Center for Biotechnology Information (NCBI) in Bethesda, MD.
• New Sequencing Technologies The JGI is currently at the beginning of its investigations of how to incorporate the next generation of sequencing machine into its production processes. These new machines can be separated into two categories, based on the volumes of data they produce: • The 454 platform
This sequencing platform has just started limited production operations. This platform presently produces moderately sized sequence fragments: ~100 bases for the initial production, ~250 bases for the second soon-to-be production version. The JGI has one machine from each version, which together produce approximately 1.2 gigabases of sequence data per month, corresponding to 150 gigabytes of raw data. Additionally about 10 GB per month of SFF files are transferred to NCBI.

24
• The Illumina (formerly Solexa) platform This sequencing platform is not yet in production. R&D runs produce 4.5 – 7.5 gigabases of sequence per month, corresponding to 4.5 terabytes of raw data plus 1.5 terabytes of processed data. While it would be desirable to archive all of this data (at least during the R&D phase), it is not yet clear if transferring it to NERSC will be feasible, given the JGI’s current internal network infrastructure. How NCBI will handle the submission of such data is also not yet clear. The JGI can store the raw data locally for 1 month, and on tape for 18 months. The JGI can store the processed data for about the next six months, at which point a decision will need to be made regarding archival strategy.
• Other Sequencing Platforms The JGI is considering whether to procure an ABI SOLiD sequencing machine. Its expected rate of production data generation is approximately 25 raw terabytes of data per month. While it would be desirable to archive all of this data (at least during the R&D phase), it is not yet clear if transferring it to NERSC will be feasible, given the JGI’s current internal network infrastructure. How NCBI will handle the submission of such data is also not yet clear.
• Draft Genome Assembly (Eukaryotes) • The Assembly Process
The existing assembler’s total disk usage follows a rough power law relation, with an exponent of about 1.14. All of this data doesn’t need to be transferred across the local network at once, and the needed transfer rate depends critically on the type of assembly algorithm used. Currently, local network bandwidth is a limiting step mainly during the graph layout stage, when all of the data needs to be accessed at once.
Sample data volumes that would need to be moved around over the course of an assembly are:
Genome Size (Megabases)
Number per Year Approximate Run-Time
Data Volume per Genome
50 20 < 1 day 25 gigabytes
100 10 1 - 2 days 55 gigabytes
500 3 – 4 3 – 5 days 344 gigabytes
1,000 1 – 2 5 – 7 days 758 gigabytes
1,500 1 – 2 7 – 10 days 1.2 terabytes
• Assembled Data (Eukaryotes)
Eukaryotic assemblies are eventually deposited in NCBI, but are also posted on the JGI’s web portal. Basic assembly data is only ~10 gigabytes/year, at most.

25
Even allowing for a factor of 10 to account for any needed supporting data, this is still much less than the network requirements for depositing and archiving the raw data. External users downloading assemblies would likely need comparable amounts of bandwidth.
• Raw Data Transfers (External Users) In almost all cases, external users download raw sequence files from NCBI. However, external users typically don’t download the raw data. Instead, they retrieve the processed data, which for Sanger sequence is about 35 times the genome size. So for a 100-megabase genome, about 3.5 gigabases of data would need to be transferred over the network. The largest JGI genome (1.6 gigabases) would require transferring about 56 gigabytes of data.
• Assembly Visualization (Eukaryotes) There is not yet a reliable estimate of the current needed rate of data transfer for assembly visualization.
At the present time, it is not feasible to have external users visualize assembly data using a client/server model. Instead, it is expected that users will download any of the to-be-visualized data and run any visualization tools locally. As a result, this use case is a subset of the ones listed above.
• Integrated Microbial Genomes (IMG) web portal This web-based system allows external users to investigate and compare a large number of prokaryotic, eukaryotic, plasmid, and virus genomes. It presently gets about 300,000 – 400,000 hits/month, with an average bandwidth of 12 gigabytes per month. Over the next year, an increase in external users of a factor of 10 is plausible.
Network Requirements and Science Process – the next 5 years 1. Sequence Data Management
50 454 machines: 7.5 terabytes/month of raw data, at current rates of generation. As the platform matures, this could increase by as much as another factor of 2–5.
50 Illumina machines: 300 terabytes/month of raw data, at current rates of generation. As the platform matures, this could increase by as much as another factor of 5-10.
50 ABI SOLiD machines: 1,250 terabytes/months of raw data, at current rates of generation. As the platform matures, this could increase by as much as another factor of 5-10.
Helicos: 70 terabytes of raw data per run (~1 week) per machine, perhaps 300 terabytes of data per month per machine. So 50 machines would correspond to 15 petabytes/month of raw data.
2. Draft Genome Assembly It is difficult to estimates of the numbers of different types of genome that are expected to be assembled at the JGI over the next five years, as this will depend on which new sequencing platform is selected. The volumes of each type of data produced will depend on which platform(s) end up being most useful for the different types of project and analysis.
26
Visualization will depend on whether users need to access the raw sequence data in real-time, or whether a higher-level summary will suffice. In either case, due to expected large CPU and memory requirements, only local access to the data will likely be supported for visualization.
3. Integrated Microbial Genomes (IMG) web portal Over the next five years, an increase in a factor of at least 100 is plausible, through a combination of the increase in the number of organisms in the system (a factor of at least 10), plus an increase in the number of per-project users. Based on existing usage, this would increase the bandwidth requirements to at least 1.2 terabytes/month.
Beyond 5 years – future needs and scientific direction The data rates beyond 5 years are currently unknown and will vary dramatically based on what type of sequencing machine is acquired.
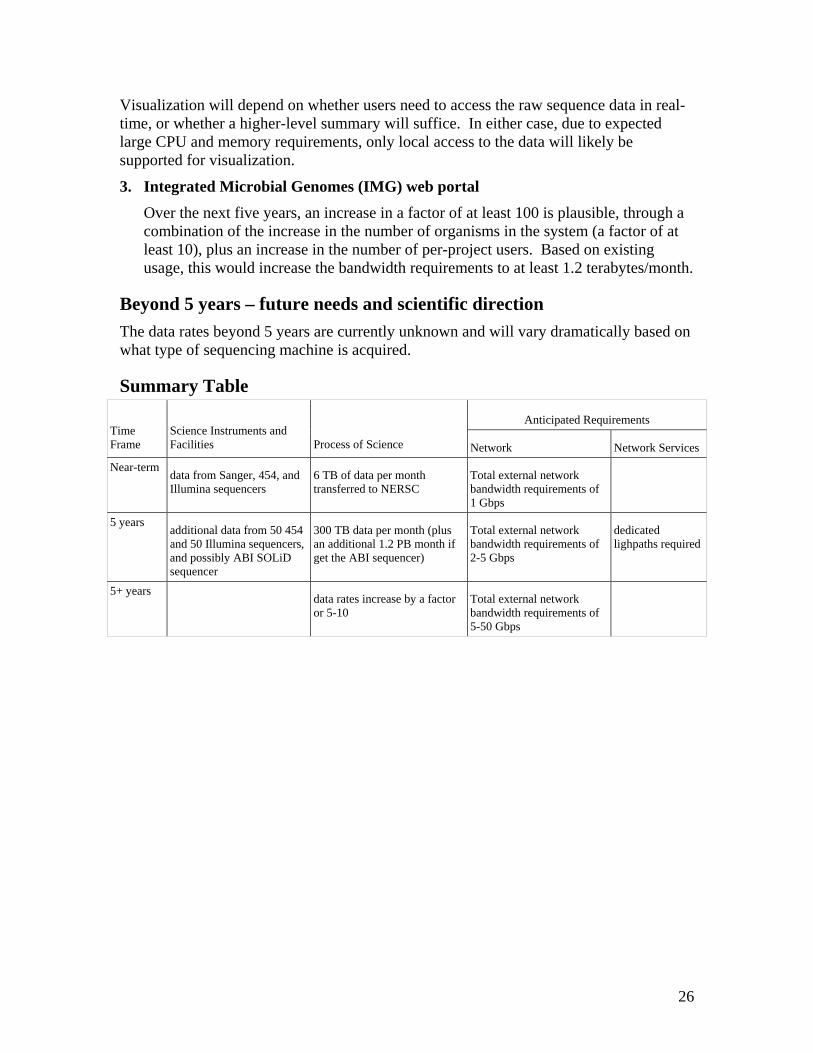
Summary Table
Anticipated Requirements Time Frame
Science Instruments and Facilities Process of Science Network Network Services
Near-term data from Sanger, 454, and Illumina sequencers
6 TB of data per month transferred to NERSC
Total external network bandwidth requirements of 1 Gbps
5 years additional data from 50 454 and 50 Illumina sequencers, and possibly ABI SOLiD sequencer
300 TB data per month (plus an additional 1.2 PB month if get the ABI sequencer)
Total external network bandwidth requirements of 2-5 Gbps
dedicated lighpaths required
5+ years data rates increase by a factor
or 5-10 Total external network bandwidth requirements of 5-50 Gbps
27
2.6 National Center for Atmospheric Research, Boulder, Colorado.
Background NCAR is a Federally Funded Research and Development Center supported by the Geosciences division of the National Science Foundation to carry out basic and applied research in the atmospheric and related sciences. Advanced networking is central to almost every NCAR project, from international field campaigns coordinating satellites, aircraft, ground stations, and real-time meteorological data distribution, to remote instrument and supercomputer control and data collection, and generating, archiving and distributing of scientific observational/model data collections. NCAR is a charter member of the National Lambda Rail (NLR), is connected to Internet2 (I2), recently joined the NSF Teragrid, and manages the Boulder Research and Administration Network (BRAN) and the Bi-State Optical Network (BiSON) fiber optic networks. NCAR is currently connected to the Front Range GigaPoP (FRGP), which UCAR manages, via a fiber optic path currently running a 10 Gb/sec lambda to the FRGP providing I2, NLR, TransitRail (TR), commodity Internet, and intra-FRGP services, and a 10 Gb/sec lambda for Teragrid connectivity. A third 10 Gb/sec lambda will be added to serve the new remote NCAR Supercomputer Center (NSC) planned to be located in Cheyenne, Wyoming when it comes online as planned in 2012.
Over the past five years there has been considerable consolidation of the NLR/I2/Teragrid/ESnet fiber as Level3 Communications has acquired increasing amounts of national fiber. In UCAR’s case, all four national research networks are collocated in the same Level3-owned and operated building in Denver that services the fiber optic path to NCAR. This has made it very easy to add new network connections to NCAR’s existing infrastructure.
Much of the network traffic originates or terminates with the NCAR Mass Storage System (MSS). Organizational policy scales MSS funding with the computational power on the NCAR machine room floor. Recently MSS storage passed 4 petabytes and our rate of growth of the MSS is increasing with time, approximately doubling every two years. Current efforts are being made to restrict MSS usage to data generated by the NCAR supercomputers.
Current Network Requirements and Science Process One of NCAR’s flagship projects is the Community Climate System Model (CCSM), a collaborative effort between NSF, DOE and NASA to develop, deploy and support a global coupled climate model to carry out climate change simulations in the context of evolving natural environmental and anthropogenic influences
CCSM Development:
The CCSM development effort is consists of a multiple, geographically distributed development teams: NCAR’s CCSM Software Engineering Group (CSEG), DOE’s
28
SciDAC teams at LANL, ORNL, ANL, Berkeley, NERSC and the NASA’s ESMF group. These development teams tend to work in parallel at their own institutions with little need for real-time interconnection.
Model Production.
We currently run our climate model to and store the output data at NCAR, ORNL, NERSC and PCMDI. We also collaborate with many outside institutions, such as US and foreign universities, and the Japanese Earth Simulator. During our most recent climate modeling campaign, the IPCC AR4, highly reliable networks were essential in carrying out the simulations and distributing the data. With the broad public acceptance of the IPCC AR4 report, our research group moving on beyond the basic IPCC scenarios and into new areas of climate change involving emissions reduction, energy policy, adaptation, mitigation and decision support, focused on providing climate knowledge-support for societal decision-makers. This is requiring us to make new partnership with, and supply data to, local, regional, national and international stakeholders. We will also be right at higher resolutions with more complex models increasing the demand for both network bandwidth and advanced server-side processing.
Model support and data distribution
The CCSM source code and forcing data are distributed via the ESG portal at NCAR. Output data from our large model campaigns such as IPCC are also distributed freely internationally via the ESG. The PCMDI IPCC data experience has been a great improvement over previous IPCC data distribution centers.
Our data visualization is a mixture of local and remote processing. Our group tends not to do much real-time visualization of our simulations. The CCSM has a standardized analysis package that is ported and run in each location (NCAR, ORNL, NERSC). Where possible, we try to make all of our visualizations local to the data. However, often there is a need to compare results from one simulation with those from another simulation run at a different site. In that case, heavily reduced data summaries are assembled in one location and plotted.
The CCSM data management policy
The large interagency coordination has made it necessary to develop project and data management policies. The CCSM data management plan specifically states “CSM data created at NCAR under NSF support will be archived on the NCAR Mass Storage System (MSS). CCSM data generated at non-NCAR facilities should be archived at either the site of generation or its associated data archive center.”
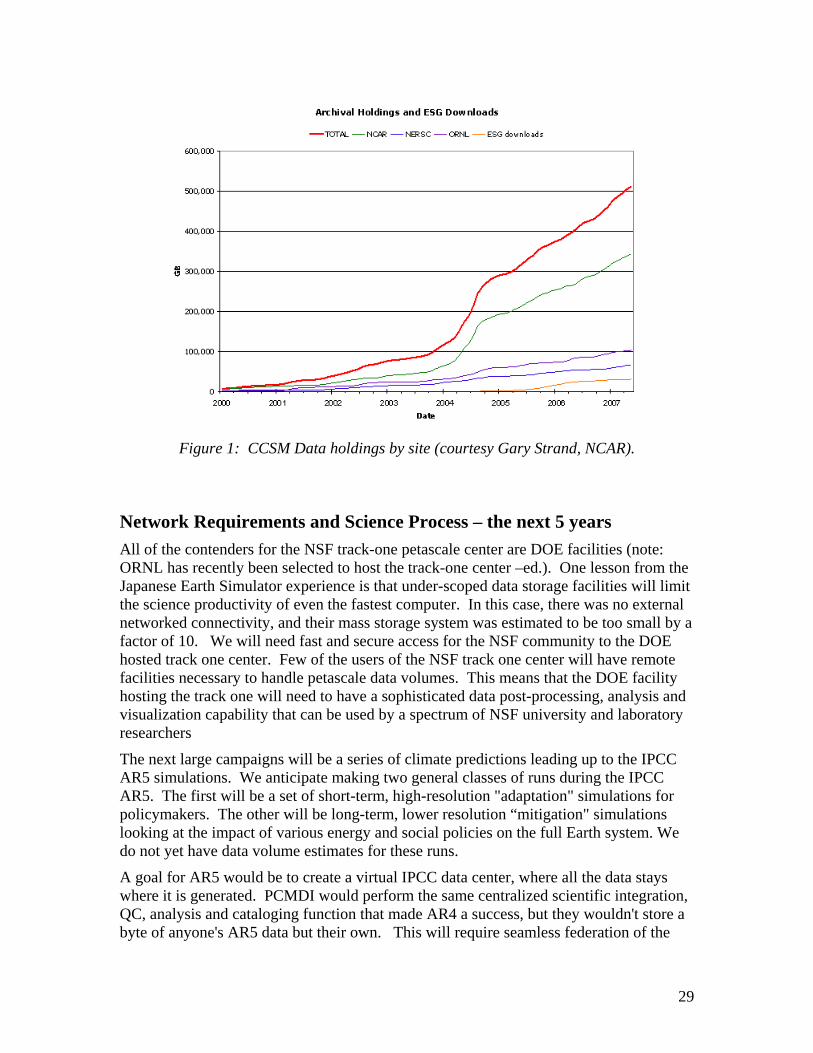
In addition to keeping the NCAR MSS from being flooded with data generated elsewhere (such as the large ingest of Earth Simulator data in 2004 as shown in Figure 1), this policy promotes the development of distributed data middleware services such as ESG. Publicly putting all our eggs in the ESG basket has had a number of positive outcomes: it allows us to focus on what we do best, modeling; it helps ESG demonstrate that it is needed and it has forced us to develop our metadata to the point where our data can easily be published to the net and is easily understood by other software packages such as GIS ArcInfo.
29
Figure 1: CCSM Data holdings by site (courtesy Gary Strand, NCAR).
Network Requirements and Science Process – the next 5 years All of the contenders for the NSF track-one petascale center are DOE facilities (note: ORNL has recently been selected to host the track-one center –ed.). One lesson from the Japanese Earth Simulator experience is that under-scoped data storage facilities will limit the science productivity of even the fastest computer. In this case, there was no external networked connectivity, and their mass storage system was estimated to be too small by a factor of 10. We will need fast and secure access for the NSF community to the DOE hosted track one center. Few of the users of the NSF track one center will have remote facilities necessary to handle petascale data volumes. This means that the DOE facility hosting the track one will need to have a sophisticated data post-processing, analysis and visualization capability that can be used by a spectrum of NSF university and laboratory researchers
The next large campaigns will be a series of climate predictions leading up to the IPCC AR5 simulations. We anticipate making two general classes of runs during the IPCC AR5. The first will be a set of short-term, high-resolution "adaptation" simulations for policymakers. The other will be long-term, lower resolution “mitigation" simulations looking at the impact of various energy and social policies on the full Earth system. We do not yet have data volume estimates for these runs.
A goal for AR5 would be to create a virtual IPCC data center, where all the data stays where it is generated. PCMDI would perform the same centralized scientific integration, QC, analysis and cataloging function that made AR4 a success, but they wouldn't store a byte of anyone's AR5 data but their own. This will require seamless federation of the

30
DOE/NSF datacenters and will provide an incentive for the different centers to provide robust distributed data services, with ESG as the model.
Our primary goal in the next five years is to get out of the business of moving raw model data between institutions as we make large climate simulations. For this, we will need secure, high-reliability (though not necessarily ultra-high-bandwidth), inter-institution access and continued investment in distributed data middleware, such as the ESG, that will allow server-side processing and analysis. This will allow us to set up virtual data centers and move just the RIGHT subset of the data to the scientists, rather than using the brute force method of moving ALL the data whenever a user needs any of the data.
We also anticipate collaborations with much wider spread of disciplines that we currently interact with. As we bring in economic, health and social sectors we will need appropriate data presentation and delivery systems.
Beyond 5 years – future needs and scientific direction This period will see us well into the petascale computing era, where we anticipate running much higher resolution models, containing a much or richer suite of model components.
Looking to the petascale, NCAR’s current computing-storage ratio of about 20 bytes per megaflop (Figure 2) means that a petascale machine used at 10% efficiency would generate 62 petabytes of data per year:
100TFlop * 20bytes/Mflop/sec * 2e7 sec/yr * 1E6Mflop/Tflop / 1e15bytes/Pbyte = 62 Pbyte/yr
Figure 2: NCAR MSS Volume vs. NCAR Computing speed
(courtesy Tom Bettge, NCAR).

31
In our climate model simulations we typically try to serve 5%-10% of the data volume over the network (the percentage of ESG data vs. Total data in Figure 2 is 5.9%). To do so would require scaling both mass storage and data services by an order of magnitude above current levels. It also demonstrates the need to have mature distributed data services in place by this time to reduce the network traffic to manageable levels.
Current usage patterns show that the large climate modeling campaigns occur in bursts. This implies that rather than needing dedicated full-time high-bandwidth networks, an approach using flexible network allocation (Dynamic Wave Provisioning) to supply network bandwidth on an as-needed basis would be optimal.
NCAR Summary Development of the network services for the next five years and beyond will need to balance increases in network bandwidth with matching, if not greater, investment into the software infrastructure that makes efficient use of these pipes and minimize the need for bulk data transfers.
Summary Table Anticipated Requirements
Time Frame
Science Instruments and Facilities Process of Science Network
Network Services and Middleware
Near-term Distributed
Development teams, Production simulations
at NCAR, ORNL, NERSC
ESG Data services at NCAR, ORNL, NERSC, PCMDI
Distributed simulation sites
Use ESG services to serve data from different locations.
IPCC AR4 data mailed to PCMDI
-International data distribution
10 Gb/s on NLR 10 Gb/s on Teragrid 100-500 Mbps on
ESnet
We publish all of our data via the ESG.
We allow access to our MSS through ESG
5 years Access to multiple petascale sites across the US.
International collaborations
Earth System Model era Policy relevant simulations
with many interdisciplinary interactions.
Secure, redundant Transparent cross-
agency networking Added connectivity to
new NCAR and NSF Track 1-2-3 centers (NLR)
1-3 Gbps on ESnet
Virtual data centers with global cataloging
Remote/automated data postprocessing, analysis and visualization
5+ years Petascale moving to Exascale
International collaborations
Cloud system and cloud resolving ESMs
On-demand network allocation.
5-10 Gbps on ESnet
Interagency/international ESG services

32
3 Issues The following issues were reported at the workshop.
Security Issues The ARM Project reported the following security issue:
A critical topic that is not addressed is the “intersection” between network performance and network (computer) security. For many reasons, the demands and constraints of network and computer security are increasing. Increases in threats to network and computer integrity are real. However, many aspects of security are reducing the performance of the network. This appears to occur because additional differentiation is needed between authentication, privacy /protection, and integrity of network processes. For example, authentication (login / password, etc) needs to be protected, encrypted, private, etc. so that it cannot be “stolen” while on the Internet. However, once this step is completed, the network transfers of data or documentation may not need the same level of protection accorded to the authentication credentials. For the ACRF use case, we would like some assurance that we know who we are interacting with. Once the interaction is enabled, all of the information being exchanged is “open” and does not need protection. Current security approaches use the same level of protection for all phases of network transactions. This protection strategy adds significant “overhead” to the volume network information for data transfer and requires extra computation at each end of the network path. This is one of many example of reduced network “performance” from undifferentiated network protection schemes.
One possible solution to the data transfer performance issue outlined above is to use a tool such as the DOE-funded GridFTP utility that authenticates securely and uses high-performance data transfer methods (see http://fasterdata.es.net/).
Connectivity Issues The EMSL project requested the following:
It would be ideal if ESnet has capability to carry 'dedicated' traffic (tunnels or dedicated lambda) to allow replication of large datasets to alternate sites (for example, MSCF could host tape library for National Energy Research Scientific Computing Center backups and vice versa) to improve business continuity posture for critical scientific databases.
This capability is a goal of the ESnet OSCARS project, currently under development – see http://www.es.net/oscars/ for more information.
33
4 Overall Summary and Conclusions The combination of instruments, facilities and science process represented by the BER research portfolio will consume significant networking resources over the next 5 years. The BER instruments and facilities tend to be data producers – the data must often be sent to their users’ remote sites. As instruments are upgraded, and the supercomputer centers move into the petascale era, the science funded by BER could produce and/or consume 100 Gbps or more of network resources in aggregate in the next 5 years. Since many of the users of these instruments and facilities are from academia, there is a clear requirement for flexible, expandable, robust peering with university networks (i.e. Internet2) in addition to the need for high-bandwidth connectivity to the laboratories that house the instruments.
It is also clear that several aspects of the BER science portfolio are undergoing significant changes in the next 5 years. Examples of this include the upgrades of genome sequencing equipment at JGI, and the shift to the Earth System Grid by the climate community as a means of data distribution. These changes will affect network traffic patterns and volumes, and should be tracked by ESnet. Several BER facilities are also in the midst of planning or implementing major upgrades.
In addition, several participants expressed a need for bandwidth and service guarantees, or bandwidth on demand – this is the purpose of the ESnet OSCARS project, currently in early production deployment. ESnet plans to continue the development of OSCARS, and to deploy it as a fully supported production service.
Action Items The action items for ESnet that came out of this workshop include:
• Track developments in the climate research community and the Earth Systems Grid, monitor where the largest and most popular sources of data are located, and adjust projected data rates as necessary.
• Monitor progress of NCAR’s new data center in Cheyenne, Wyoming, and add or upgrade network peering points (e.g. in the Denver area) as necessary.
• Monitor JGI’s acquisition of new Gene Sequencing platforms, and adjust projected data rates as necessary.
• Monitor EMSL’s acquisition of new instruments with the various EMSL facilities, and adjust projected data rates as necessary.
• Continue development and deployment of the ESnet On-demand Secure Circuits and Advance Reservation System (OSCARS - http://www.es.net/oscars/)
• Continue to add content to the web site http://fasterdata.es.net and continue to help users with end-to-end data transport issues
34
5 Acknowledgements This work would not have been possible without the contributions and participation of those who provided information and attended the workshop. ESnet would also like to thank the BER and ASCR program offices for their help in organizing the workshop and providing insight into the science supported by the BER program. In addition, the LBNL conference support and logistics staff was very helpful.
ESnet is funded by the US Dept. of Energy, Office of Science, Advanced Scientific Computing Research (ASCR) program. Dan Hitchcock is the ESnet Program Manager. ESnet is operated by Lawrence Berkeley National Laboratory, which is operated by the University of California for the US Department of Energy under contract DE-AC02-05CH11231. This work was supported by the Directors of the Office of Science, Office of Advanced Scientific Computing Research, Facilities Division, and the Office of Biological & Environmental Research. This is LBNL report LBNL/PUB-988.