beyond sensing: multi-ghz realtime spectrum analyticsbeyond sensing: multi-ghz realtime spectrum...
TRANSCRIPT

This paper is included in the Proceedings of the 12th USENIX Symposium on Networked Systems
Design and Implementation (NSDI ’15).May 4–6, 2015 • Oakland, CA, USA
ISBN 978-1-931971-218
Open Access to the Proceedings of the 12th USENIX Symposium on
Networked Systems Design and Implementation (NSDI ’15)
is sponsored by USENIX
Beyond Sensing: Multi-GHz Realtime Spectrum Analytics
Lixin Shi, Massachusetts Institute of Technology; Paramvir Bahl, Microsoft Research Redmond; Dina Katabi, Massachusetts Institute of Technology
https://www.usenix.org/conference/nsdi15/technical-sessions/presentation/shi

USENIX Association 12th USENIX Symposium on Networked Systems Design and Implementation (NSDI ’15) 159
Beyond Sensing: Multi-GHz Realtime Spectrum AnalyticsLixin Shi∗ Paramvir Bahl† Dina Katabi∗
*Massachusetts Institute of Technology, {lixin, dina}@csail.mit.edu† Microsoft Research, Redmond, WA, [email protected]
Abstract – Spectrum sensing has been an active re-search area for the past two decades. Nonetheless, cur-rent spectrum sensing systems provide only coarse oc-cupancy data. They lack information about the detailedsignal patterns in each band and can easily miss fleetingsignals like radar.
This paper presents SpecInsight, a system for acquir-ing a detailed view of 4 GHz of spectrum in realtime.SpecInsight’s design addresses the intrinsic conflict be-tween the need to quickly scan a wide spectrum andthe desire to obtain very detailed information about eachband. Its key enabler is a learned database of signal pat-terns and a new scheduling algorithm that leverages thesepatterns to identify when to sample each band to maxi-mize the probability of sensing active signals.
SpecInsight is implemented using off-the-shelf USRPradios with only tens of MHz of instantaneous band-width, but it is able to sense 4 GHz of spectrum, andcapture very low duty-cycle signals in the radar band.Using SpecInsight, we perform a large-scale study of thespectrum in 7 locations in the US that span major citiesand suburban areas, and build a first-of-its-kind databaseof spectrum usage patterns.
1 INTRODUCTION
There has been a significant interest over the pasttwo decades in sensing the wireless spectrum and under-standing how it is used [32, 34, 16]. Spectrum sensinghas been a recurring topic not only for the research com-munity [6, 26], but also for the government [29, 9], themilitary [1], and industry [20, 21]. Despite all of these ef-forts, our understanding of the wireless spectrum is stillquite limited. State-of-the-art sensing equipment provideonly coarse information of spectrum occupancy. Con-sider for example the Microsoft Spectrum Observatory(MSO), a state-of-the-art large-scale system for track-ing spectrum usage [21]. Fig. 1(a) shows a typical MSOspectrum report. The figure reveals important informa-tion about spectrum occupancy, over a span of multi-ple GHz. Yet, the figure also misses informative detailsabout how the spectrum is used. If one focuses the sens-ing resources on a single band and continuously listensto that band, one would discover that the above reporthas missed the fleeting (low duty-cycle) signal in the
radar band around 3.5 to 3.6 GHz, which is shown inFig. 1(c). In fact, not only did it miss the presence of thesignal but it also missed how the signal uses the spectrum– i.e., its periodicity in time and its span in frequency.There are many signals that are missed in the MSO re-port. Fig. 1(b) shows another example. The band is usedby the Air Force Satellite Control Network. The signal inthe figure is difficult to catch since it hops in a 45 MHzband, occupying only 1 kHz at a time, i.e., its occupancyis 2×10⁻⁵.
Learning the details of how the spectrum is used –e.g., the time-frequency utilization patterns in Fig. 1(b)and Fig. 1(c) – is fundamental to the design of dynamicspectrum access (DSA) systems as it can significantly in-crease the opportunity for spectrum sharing by leverag-ing signal periodicity. A band that has a periodic occu-pancy like the one in Fig. 1(c) can be easily time mul-tiplexed with secondary users. The information can alsoreveal breaches of spectrum regulations by detecting ab-normal utilization patterns, which would be invisible incoarse occupancy reports. The utilization patterns couldalso provide insight into the diverse technologies occu-pying the spectrum. The research community may knowthe technologies in the ISM and Cellular bands. Yet, thevast majority of the spectrum is occupied by undocu-mented technologies (e.g., radios in government bands),which are little known to the research community.
However, obtaining detailed spectrum utilization pat-terns is challenging, particularly for low occupancy sig-nals like those in Fig. 1. Sensing hardware has limitedbandwidth and cannot acquire multiple GHz in realtime.Therefore, spectrum sensing platforms like those usedby Microsoft resort to sequential scanning of the spec-trum; they hop from one band to the next, sensing onlytens of MHz at any moment [21]. As a result, they obtainonly high level occupancy statistics; but they can neitherdetect the low-occupancy signals nor identify their uti-lization patterns. Scaling the sensing system to a GHz-wide bandwidth, while obtaining fine-grained informa-tion about each band, is a significant challenge that re-mains unaddressed by past work.
This paper introduces SpecInsight, a multi-GHz spec-trum sensing system that reveals the detailed patterns ofspectrum utilization in real-time. Underlying our design
1

160 12th USENIX Symposium on Networked Systems Design and Implementation (NSDI ’15) USENIX Association
0
20
40
60
80
100
0 0.5 1 1.5 2 2.5 3 3.5 4 4.5
Occu
pa
ncy %
Frequency (GHz)
(c): 3.5GHz-3.6GHz(b): 1755MHz-1800MHz
(a) Microsoft Spectrum Observatory: the average occupancy at the Redmond station (with RfEye device) for one week (08/03/2013 – 08/09/2013)
0 1 2
Time (Day)
1755
1800
Fre
qu
en
cy (
MH
z)
(b) Army and Air Force Band (1755 MHz-1800 MHz)
0 1 2
Time (Day)
3500
3600
Fre
quency (
MH
z)
(c) Radar Band (3.5GHz-3.6GHz)
Figure 1: Occupancy vs. Realtime Spectrum Patterns: The top graph shows an occupancy report obtained by the Microsoft Spectrum Observatory(MSO). Today’s sensing reports can easily miss low occupancy signals. For example, the report in (a) has missed the Air Force Signal in (b) andthe radar signal in (c). Graphs(b&c) are examples of SpecInsight’s output, which captures the spectrum time-frequency patterns. The patterns arevisualized as intensity maps, where the vertical and horizontal axes represent frequency and time respectively.
is a basic insight that any sensing system using a com-modity radio is limited to tens of MHz at a time, andhence will have to sample the multi-GHz spectrum. Thequestion, however, is: Which bands should we sample atwhat times in order to minimize the probability of miss-ing active signals?
We address this question by observing that many spec-trum bands are used according to some time-frequencypatterns (e.g., always-on in time and frequency, always-on but hopping periodically in frequency, periodic intime but fixed in frequency, etc.). By learning these pat-terns, SpecInsight can schedule its scans of the variousspectrum bands so as to maximize the probability that itwill detect the presence, absence, and variation of spec-trum utilization patterns, in every band.
SpecInsight implements this design principle in twophases. First, SpecInsight has an innovative algorithmfor learning spectrum utilization patterns. In contrast topast work on detecting WiFi or other technologies in theISM band, our algorithm has to search for previously un-known patterns without making assumptions about thetechnologies occupying a particular band. The output ofthe algorithm is used to populate a database of spectrumpatterns and their locations. Second, SpecInsight has asmart scheduling algorithm that leverages the spectrumpatterns in the database to sense multiple GHz usingonly tens of MHz of bandwidth, and still output the de-tailed spectrum utilization patterns as they occur in real-time. The algorithm is formalized as a multi-armed ban-dit game [11] in order to balance the tradeoffs betweenexploitation of known patterns and exploration of newand changing spectrum dynamics.
Implementation & Results: We have implementedSpecInsight using two USRP radios [8], equipped withthe SBX and WBX daughterboards.1 Our prototypesenses over 4 GHz of spectrum, from 50 MHz to4.4 GHz. We have compared SpecInsight with a setupthat uses exactly the same hardware but sequentiallyscans the spectrum (similar to the Microsoft SpectrumObservatory). Our results show that the probability ofmissing active signals is 10× lower with SpecInsightwhen compared to sequential scanning.
We have used the prototype to sense the spectrum inseven locations, including three major US cities and foursuburban areas. We report the results of analyzing oneweek of data from each location and comparing theirspectrum patterns. Our main findings are:
• Large swaths of the spectrum may appear completelyempty when they actually have active signals. In par-ticular, about 39% of the bandwidth below 4.4 GHz isused by signals whose occupancy is less than 0.0001,and hence are typically invisible to sequential scan-ning.
• One may think that the common way the spectrum isused is highly dynamic – i.e., a source may transmitat any time. We found that about 65% of the spec-trum utilization patterns are either always on, or trans-mit periodically. Further, among the dynamic patterns,only 5% are highly dynamic2. Thus, knowing the spec-
1The use of two radios is not fundamental to our design but ratherimposed by the range of frequencies of the USRP daughterboards.
2Defined as having a standard deviation of when the signal will nextappear that exceeds 200ms.
2
USENIX Association 12th USENIX Symposium on Networked Systems Design and Implementation (NSDI ’15) 161
trum patterns is highly useful for smart scheduling ofsensing activities.
Contributions
• SpecInsight is, to our knowledge, the first spectrumsensing system capable of detecting and tracking fleet-ing signals (whose occupancy is ~10−5) in multi-GHzspectrum, while using only tens of MHz of instanta-neous bandwidth. Past systems have not been able tocombine specificity with scalability: they either pro-vide detailed spectrum occupancy in a single band,e.g., ISM [25, 14], or they obtain coarse occupancydata but miss low-occupancy signals like those in Fig-ures 1b and 1c [21].
• SpecInsight introduces an innovative algorithm forlearning spectrum usage patterns, and a smart schedul-ing algorithm for tracking the presence, absence, andvariations of these patterns in realtime over a widebandwidth of 4 GHz.
• The paper presents a large scale study of spectrum us-age patterns in 7 US locations that span urban and sub-urban areas, illustrating which signal patterns appearin which parts of the spectrum.
2 RELATED WORK
Past work on spectrum sensing may be divided intonarrow-band and wide-band techniques. Narrow-bandtechniques assume the radio bandwidth is at least as wideas the sensed band. They focus on ways to accuratelydetect a signal. They may use energy level [31], cyclo-stationarity [14], signal waveform [34], wavelet trans-form [27], or response to interference [23]. Wide-bandsensing techniques try to cover a wide spectrum signifi-cantly larger than the radio’s own bandwidth. The tradi-tional approach scans the spectrum sequentially and re-ports average occupancy [21, 34]. Some recent proposalsexploit the sparsity of spectrum utilization to sense thespectrum without sampling it at the Nyquist rate, lever-aging techniques like compressive sensing [24, 4] or thesparse FFT [12, 10, 13]. For example, BigBand [13] isable to recover the full signals in the spectrum, but undera sparsity assumption that only a small fraction of thespectrum is occupied, so it cannot be used in crowdedspectrums, e.g., under 1.5GHz. Another scheme, Quick-Sense [33], employs a hierarchical search algorithm andanalog filters to sense the white spaces, which spans onlyhundreds of MHz where the wireless technologies aremostly documented.
SpecInsight is a wide-band spectrum sensing technol-ogy. SpecInsight, however, differs from the above workin that it does not need sparsity assumptions or customanalog filters. Additionally, SpecInsight covers a wider
band than this prior work and provides details of the us-age patterns in each band (frequency hopping, periodic,continuous in time but not in frequency, etc. ).
SpecInsight also builds on past work that proposed theuse of sensing history for dynamic spectrum access [34].Specifically, a series of theory papers [17, 36] models thebehavior of primary users as a Markov process [36] andpredicts future opportunities for dynamic spectrum ac-cess. SpecInsight differs from these past proposals bothin objective and technique. Specifically, while they fo-cus on finding some portion of the spectrum that is idle,SpecInsight focuses on exhaustively characterizing allactive signals in the entire spectrum. As a result, the al-gorithms SpecInsight uses for characterizing historicalpatterns and scheduling sensing operations differ fromthe models in past work. Also, SpecInsight is focused onpractical system design and empirical data and is sup-ported by a spectrum study that spans multiple locationsin the US.
Another line of work focuses on collaborative sens-ing, where different nodes share spectrum data in orderto cover a large geographical area. For example, Spec-Net [16] uses spectrum analyzers in different locations tosense the spectrum and share their results; V-Scope [35]mounts spectrum sensors on public vehicles and lever-ages mobility to enable large-area sensing of the whitespaces. SpecInsight complements these systems by en-abling multi-GHz spectrum sensing on relatively low-cost and easily accessible USRP radios.
Our work is also related to past literature on signalfeature extraction. Many of these systems are focused onthe ISM band with the objective of identifying WiFi in-terferers [19, 25, 14]. SpecInsight builds on the idea ofsignal feature extraction. However, it differs both in thefeatures it extracts and the algorithm it uses to extractthem. These differences stem from SpecInsight’s use offeatures to identify spectrum utilization patterns that canbe leveraged for smart scheduling of sensing operations,rather than to identify particular technologies. Addition-ally, SpecInsight spans a 40× wider band than the ISMband, and hence has to deal with a greater diversity ofwireless techniques, of which the majority are undocu-mented.
Finally, our work supplements past work on large-scale spectrum measurements [6, 18, 26, 15]. First, ourfindings about spectrum occupancy and usage confirmmany past spectrum observations; Second, by enablingwide-band spectrum sensing on low-cost devices, we be-lieve SpecInsight opens up the possibility of even largerscale spectrum measurements.
3 SPECINSIGHT’S DESIGN
The goal in designing SpecInsight is to build a tool forsensing spectrum usage, extracting occupancy patterns,
3

162 12th USENIX Symposium on Networked Systems Design and Implementation (NSDI ’15) USENIX Association
LearningSpectrumPatterns
SchedulingBasedonthePatterns
LearningPhase
SensingPhase
PatternDatabase
…
Pattern2
Pattern1
Figure 2: Flowchart of SpecInsight’s Architecture: SpecInsight hastwo phases: the learning phase and the sensing phase. In the learningphase, SpecInsight extracts and learns the patterns in the spectrum andinitializes the pattern database; in the sensing phase, SpecInsight usesthe learned patterns to schedule when to sense each band. The patterndatabase stores and maintains the learned patterns, which are represen-tative frequency-time blocks of the underlying signal.
and detecting their repeated occurrences. Its key featureis the ability to provide realtime occupancy informationof 4 GHz of spectrum using inexpensive commodity ra-dios whose realtime bandwidth is limited to tens of MHz(e.g., USRPs). Anyone can download the SpecInsightsoftware, deploy it on a USRP radio, and start sensingGHz of spectrum in their location.It not only senses alarge bandwidth, but also provides finer details at eachfrequency, so that domain experts in each band can lookinto the spectrum patterns captured by SpecInsight forfurther analysis. We envision that such a system will helpmake wide-band spectrum sensing ubiquitous.
SpecInsight operates in two phases: a learning phaseand a sensing phase. During the learning phase, SpecIn-sight sequentially scans the entire spectrum. It uses thecollected data to extract and learn the different usage pat-terns which it then stores in a pattern database as shownin Fig. 2. Once the database has been populated with theusage patterns of each frequency band, SpecInsight goesinto the sensing phase. It uses a smart scheduling algo-rithm to pick the best frequency band to sense based onthe learned patterns. SpecInsight then collects signals inthe chosen band and uses a pattern recognition algorithmto decide if the signals belong to a known usage pattern.If not, SpecInsight continues sensing that frequency bandfor an extended period to learn new usage patterns andupdate the pattern database.
What are the patterns? Spectrum patterns are a keyconcept in SpecInsight’s design. A pattern is a represen-tative time-frequency block which characterizes the un-derlying signal in both time and frequency dimensions.In the example of Fig. 2, pattern 1 spans the whole fre-quency bandwidth but is narrow in time, while pattern 2reveals a utilization that is continuous in time but occu-pies a narrow bandwidth in frequency. The question nowis, how do we determine the frequency and time widthsof these blocks? On the frequency axis, SpecInsight sets
FCCBand
Pattern1
Pattern2
CDF
Step1:ExtractthepatternsStep2:Detectthe
distributionofoccurrences
CDF
Figure 3: SpecInsight’s Learning Phase: To extract pattern informa-tion in any given FCC band, SpecInsight employs two steps in thelearning phase: 1) extract the patterns; 2) detect the distribution of oc-currences of the patterns. The patterns extracted by SpecInsight, aswell as the distributions of their occurrences are stored in the patterndatabase.
the frequency range of a given pattern equal to one blockin the FCC spectrum allocation table [2]. On the timeaxis, SpecInsight is presented with a trade-off: a shortduration allows us to better detect fleeting signals whilea long duration allows us to capture longer signals thatrepeat at a much larger time granularity. To be able tocapture both types of signals, SpecInsight uses both shortand long time durations. Specifically, in our implemen-tation, we use durations of 5 ms and 50 µs.
For each time-frequency block as defined above,SpecInsight normalizes its power so that the maximumpower is equal to 1. This is necessary since two wirelessusers with the same usage pattern can have significantlydifferent power levels due to different signal attenuationsfrom these users to SpecInsight’s sensing antenna. Thus,if we do not normalize, two time-frequency blocks withthe same usage pattern can be misidentified as two differ-ent patterns. Normalizing also allows us to match time-frequency blocks measured at different spatial locationswhich allows us to discover similar usage patterns acrossdifferent urban and suburban areas.
Next, we describe how SpecInsight learns these pat-terns and uses them to schedule its sensing of each band.
4 THE LEARNING PHASE
In the learning phase, SpecInsight extracts and learnsinformation of the spectrum patterns. This process issummarized by Fig. 3. Since SpecInsight divides the fre-quency spectrum into FCC bands according to the FCCallocation table, we focus only on a single FCC band inthe following discussions. First, SpecInsight extracts pat-terns that exist in this band. Because some FCC bands(e.g., the ISM band) are shared by different types of sig-nals, there might be more than one signal pattern in theband. In this case, SpecInsight extracts and records all ofthe patterns it can capture. Second, as shown in Fig. 3,SpecInsight keeps track of when each pattern repeats it-
4
USENIX Association 12th USENIX Symposium on Networked Systems Design and Implementation (NSDI ’15) 163
t
TimeSamples
NoiseClustering
TimeFrequencySamples
Windowed
FFT
Dividing
Cluster
f
tPatterns
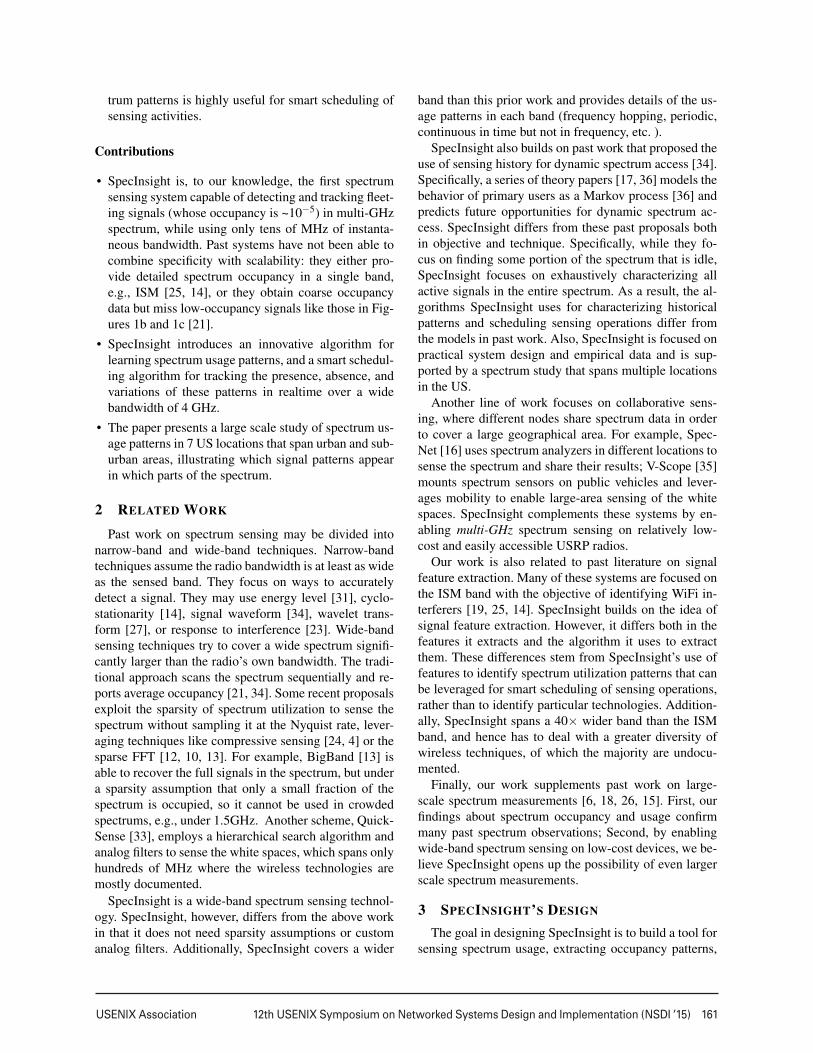
Figure 4: How SpecInsight Extracts Patterns in One FCC Band
self and draws the distribution of the time intervals be-tween different occurrences of the same pattern. This dis-tribution characterizes the timing properties of the un-derlying signal, e.g., a fixed-cycle signal would have aconcentrated distribution while a dynamic signal wouldhave a scattered distribution. SpecInsight stores the listof existing patterns and its corresponding distribution ofoccurrences in the spectrum pattern database. In the fol-lowing two subsections §4.1 and §4.2, we describe thesetwo steps in detail.
4.1 Extracting the Patterns
Fig. 4 outlines how SpecInsight extracts the patternsand identifies patterns from noises in a given FCC band.Since patterns are in the form of time-frequency blocksof signals, SpecInsight needs to first transform the I/Qtime samples output 3 by the sensing hardware into two-dimensional time-frequency samples. SpecInsight doesthis by taking the FFTs over a sequence of successivetime windows to obtain time-frequency blocks.4 How-ever, not all time-frequency blocks extracted by SpecIn-sight represent actual signals. Some of them might just benoise. So, how can SpecInsight tell signal patterns apartfrom noise? The intuition is that wireless signals intrin-sically have certain regularities in the way that they usethe spectrum, which are reflected by the time-frequencyblocks SpecInsight extracts. On the other hand, noise israndom. So if we run a clustering algorithm on the time-frequency blocks collected by SpecInsight, signal pat-terns will be clustered and noise will be filtered out. 5
There may be multiple spectrum patterns in the sameFCC band. In such scenarios, the clustering algorithmcan also distinguish between the different patterns, i.e.,blocks belonging to each utilization pattern are clusteredtogether and separated from others. This is essential forSpecInsight’s sensing phase, because the smart schedul-ing algorithm has different scheduling strategies for sig-nals with different patterns (e.g., fixed-cycle or dynamic
3I/Q samples are the real and imaginary parts of the time samples.4SpecInsight also squares the magnitude since blocks are repre-
sented in terms of their powers.5Some signals like the direct spread-spectrum signals which are be-
low the noise floor will not be captured by SpecInsight. However, with-out prior knowledge of the spreading codes, any energy-based detectionwill likely miss these signals.
block1 block2
Freq
uency
time
Freq
uency
block1 block2 time
(a) Two time-frequency blocksof a fleeting signal
(b) Two time-frequency blocksof a frequency-hopping signal
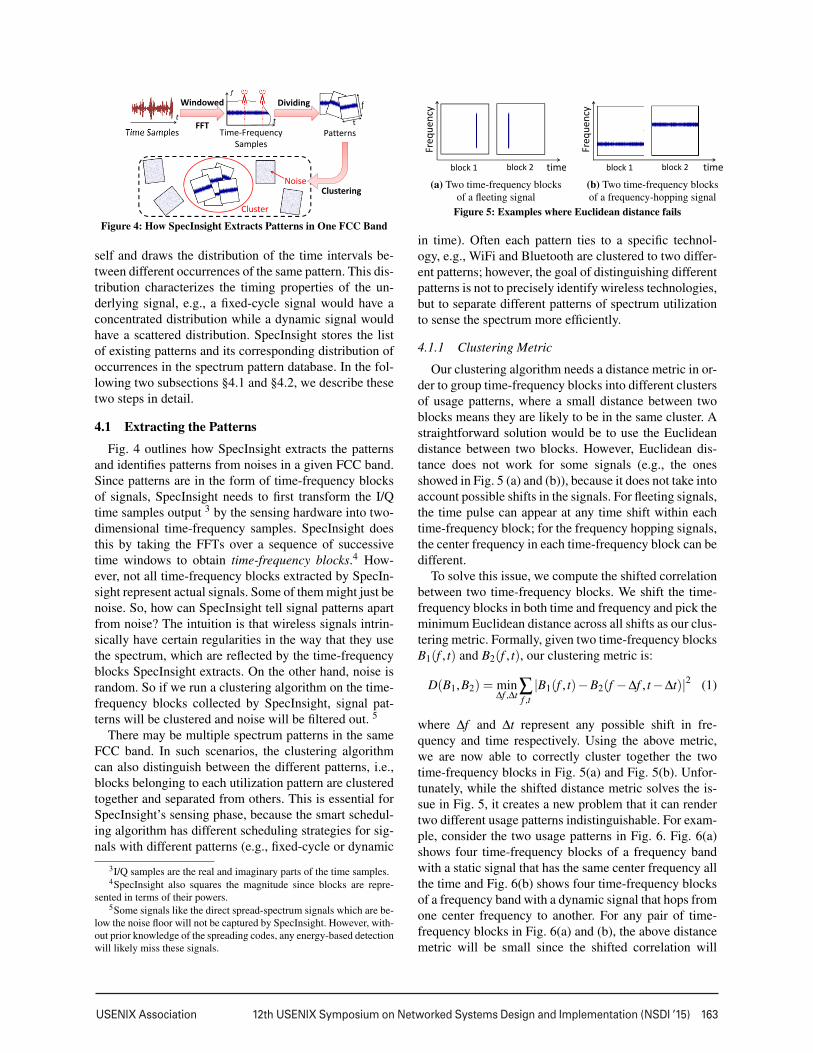
Figure 5: Examples where Euclidean distance fails
in time). Often each pattern ties to a specific technol-ogy, e.g., WiFi and Bluetooth are clustered to two differ-ent patterns; however, the goal of distinguishing differentpatterns is not to precisely identify wireless technologies,but to separate different patterns of spectrum utilizationto sense the spectrum more efficiently.
4.1.1 Clustering Metric
Our clustering algorithm needs a distance metric in or-der to group time-frequency blocks into different clustersof usage patterns, where a small distance between twoblocks means they are likely to be in the same cluster. Astraightforward solution would be to use the Euclideandistance between two blocks. However, Euclidean dis-tance does not work for some signals (e.g., the onesshowed in Fig. 5 (a) and (b)), because it does not take intoaccount possible shifts in the signals. For fleeting signals,the time pulse can appear at any time shift within eachtime-frequency block; for the frequency hopping signals,the center frequency in each time-frequency block can bedifferent.
To solve this issue, we compute the shifted correlationbetween two time-frequency blocks. We shift the time-frequency blocks in both time and frequency and pick theminimum Euclidean distance across all shifts as our clus-tering metric. Formally, given two time-frequency blocksB1(f , t) and B2(f , t), our clustering metric is:
D(B1,B2) = min∆f ,∆t
∑f ,t|B1(f , t)−B2(f −∆f , t−∆t)|2 (1)
where ∆f and ∆t represent any possible shift in fre-quency and time respectively. Using the above metric,we are now able to correctly cluster together the twotime-frequency blocks in Fig. 5(a) and Fig. 5(b). Unfor-tunately, while the shifted distance metric solves the is-sue in Fig. 5, it creates a new problem that it can rendertwo different usage patterns indistinguishable. For exam-ple, consider the two usage patterns in Fig. 6. Fig. 6(a)shows four time-frequency blocks of a frequency bandwith a static signal that has the same center frequency allthe time and Fig. 6(b) shows four time-frequency blocksof a frequency band with a dynamic signal that hops fromone center frequency to another. For any pair of time-frequency blocks in Fig. 6(a) and (b), the above distancemetric will be small since the shifted correlation will
5

164 12th USENIX Symposium on Networked Systems Design and Implementation (NSDI ’15) USENIX Association
Freq
uency
timeblock1 block2 block3 block4(a) A static signal that has a constant center frequency
Freq
uency
time(b) A frequency Hopping signal with different center frequencies
Freq
uency
timeLarge shift Small shifts
(c) Aligning the time-frequency blocks of a frequency hopping signalFigure 6: The Shifted Euclidean Distance
align the center frequencies in the blocks with the hop-ping signal (demonstrated in Fig. 6(c)). Hence, all thesetime-frequency blocks will be clustered together as thesame pattern, while they are actually different signals.
To solve this problem, we constrain the time andfrequency shift of the time-frequency block to a smallrange. Instead of computing the Euclidean distance inEq. 1 for all values of ∆t and ∆f , we compute it onlyfor a small range of ∆t and ∆f . To see how this approachcan solve this problem, consider again the four blocks(B1,B2,B3, and B4) which contain a frequency hoppingsignal shown in Fig. 6(b). By constraining the shift, thedistance metric between blocks B1 and B2 now becomeslarge because the center frequencies in B1 and B2 are farapart and cannot be aligned with a small shift as can beseen from Fig. 6. However, the distance metric betweenblocks B1 and B3 remains small since the center frequen-cies are near and can be aligned with a small shift. Thus,for a frequency hopping pattern, some pairs of blockswill have a small distance metric and some pairs willhave a large distance metric. This will allow us to dis-tinguish this usage pattern from the static usage patternshown in Fig. 6(a) where all pairs of blocks have thesame small distance metric.
The main question, however, becomes: If two time-frequency blocks like B1 and B2 in Fig. 6(b) have a largedistance metric, how can we still cluster them together?Although B1 and B2 have a large distance metric, theyare linked together via a chain of blocks that have smalldistance metrics. In other words, B1 has a small distancemetric with B3 which in turn has a small distance metricwith B4 which has a small metric with B2. Thus, althoughsome of these blocks have large distance metric, they arestill linked together via a chain structure which allows us
to cluster them correctly as we will discuss in §4.1.2.
4.1.2 Clustering Algorithm
Machine learning provides us with a rich body of clus-tering algorithms. However, many of the well-knownclustering algorithms such as the k-means do not workfor this application. These algorithms are going to clus-ter together time-frequency blocks that have a small dis-tance metric. As a result, they are not capable of cap-turing the chain structure cluster described above, wheretwo blocks can have a large distance metric and yet be-long to the same cluster. Thus, we need a clustering algo-rithm that is capable of clustering these chain structures.
To this end, we use the OPTICS algorithm [5]. This al-gorithm achieves exactly the above goal. At a high level,OPTICS is built on the concept of “reachability”. Twotime-frequency blocks are directly linked together if theyhave a small distance metric. Two other blocks B1 and B2belong to the same cluster if there is a path of blocks thatlinks B1 to B2. For example, in Fig. 6(b), the path wasB1,B3,B4,B2. Thus, a cluster can be interpreted as a setof time-frequency blocks such that any pair of blocks canreach each other. Another advantage of the OPTICS al-gorithm over the k-means is that it does not require thenumber of clusters as an input. For the exact details ofthe OPTICS algorithm, we refer the reader to [5].
SpecInsight uses the OPTICS algorithm in two places:
• During the learning phase: SpecInsight runs the fullOPTICS algorithm to cluster the collected usage pat-terns and establish a pool of patterns. The number andtypes of classes is data dependent. In §8, we describethe classes of usage patterns which are revealed by ourexperiments.
• During the sensing phase: SpecInsight uses OPTICSto cluster the newly sensed usage pattern and deter-mine whether they belong to an already learned clusterof usage patterns or they form a new cluster of patternsthat needs to be added to the pattern database.
4.2 Detecting the Distribution of Occurrences
Once SpecInsight extracts and identifies a specific pat-tern, it tracks the different times when the pattern recursand builds an occurrence distribution (step 2 in Fig. 3).SpecInsight defines the pattern interval τ as the time be-tween two consecutive occurrences of the pattern, andthe distribution of occurrences is defined as the statisti-cal distribution of the pattern interval τ . It can be char-acterized by its mean µ and standard deviation σ , whichSpecInsight computes over multiple measurements.
These statistics µ and σ are necessary to sense thespectrum efficiently. The mean µ determines the periodof the pattern, and the standard deviation σ measureshow dynamic the signal is. Thus, µ can be used to decide
6
USENIX Association 12th USENIX Symposium on Networked Systems Design and Implementation (NSDI ’15) 165
632
638
0 1Time (s)
F
requency
(M
Hz)
(a) An Always-on Signal (White Spaces Channel 41)
0 1Time (s)
951.9
952.1
Fre
qu
en
cy
(M
Hz)
(b) Fixed Cycle Signals (951.9 MHz - 952.1 MHz)
0 1Time (s)
435.5
436.0
Fre
qu
en
cy
(M
Hz)
(c) A Dynamic Signal (940 MHz - 940.5 MHz)
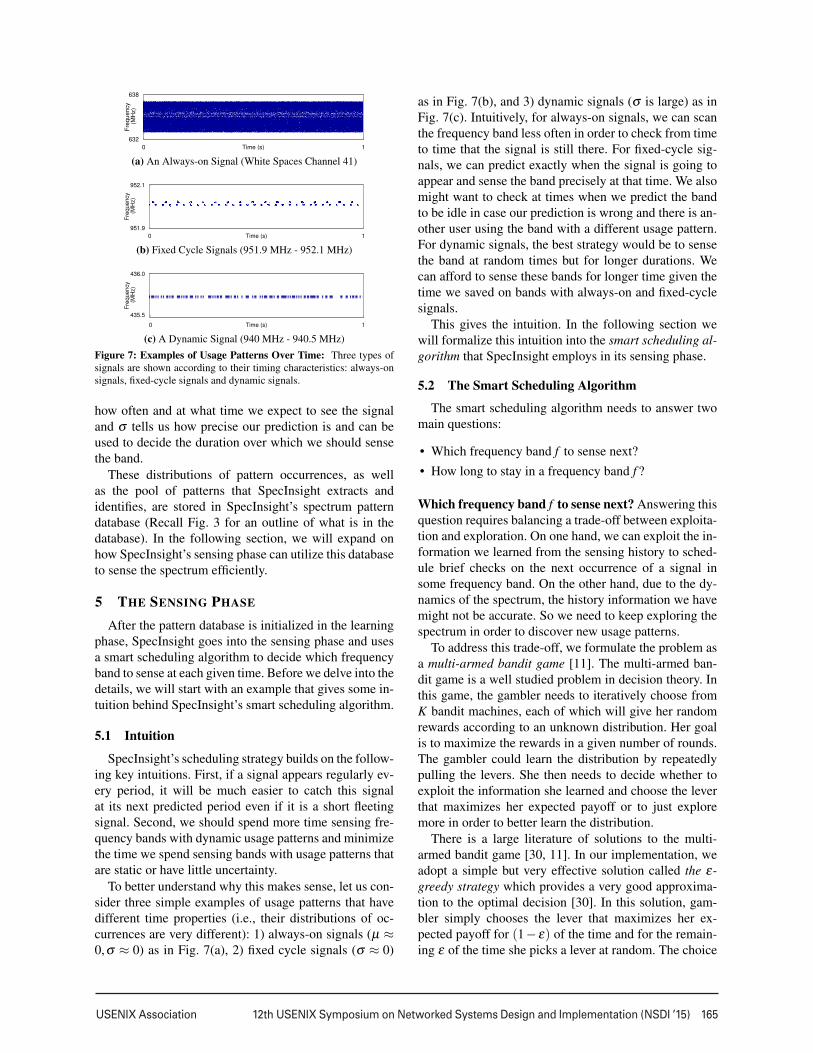
Figure 7: Examples of Usage Patterns Over Time: Three types ofsignals are shown according to their timing characteristics: always-onsignals, fixed-cycle signals and dynamic signals.
how often and at what time we expect to see the signaland σ tells us how precise our prediction is and can beused to decide the duration over which we should sensethe band.
These distributions of pattern occurrences, as wellas the pool of patterns that SpecInsight extracts andidentifies, are stored in SpecInsight’s spectrum patterndatabase (Recall Fig. 3 for an outline of what is in thedatabase). In the following section, we will expand onhow SpecInsight’s sensing phase can utilize this databaseto sense the spectrum efficiently.
5 THE SENSING PHASE
After the pattern database is initialized in the learningphase, SpecInsight goes into the sensing phase and usesa smart scheduling algorithm to decide which frequencyband to sense at each given time. Before we delve into thedetails, we will start with an example that gives some in-tuition behind SpecInsight’s smart scheduling algorithm.
5.1 Intuition
SpecInsight’s scheduling strategy builds on the follow-ing key intuitions. First, if a signal appears regularly ev-ery period, it will be much easier to catch this signalat its next predicted period even if it is a short fleetingsignal. Second, we should spend more time sensing fre-quency bands with dynamic usage patterns and minimizethe time we spend sensing bands with usage patterns thatare static or have little uncertainty.
To better understand why this makes sense, let us con-sider three simple examples of usage patterns that havedifferent time properties (i.e., their distributions of oc-currences are very different): 1) always-on signals (µ ≈0,σ ≈ 0) as in Fig. 7(a), 2) fixed cycle signals (σ ≈ 0)
as in Fig. 7(b), and 3) dynamic signals (σ is large) as inFig. 7(c). Intuitively, for always-on signals, we can scanthe frequency band less often in order to check from timeto time that the signal is still there. For fixed-cycle sig-nals, we can predict exactly when the signal is going toappear and sense the band precisely at that time. We alsomight want to check at times when we predict the bandto be idle in case our prediction is wrong and there is an-other user using the band with a different usage pattern.For dynamic signals, the best strategy would be to sensethe band at random times but for longer durations. Wecan afford to sense these bands for longer time given thetime we saved on bands with always-on and fixed-cyclesignals.
This gives the intuition. In the following section wewill formalize this intuition into the smart scheduling al-gorithm that SpecInsight employs in its sensing phase.
5.2 The Smart Scheduling Algorithm
The smart scheduling algorithm needs to answer twomain questions:
• Which frequency band f to sense next?• How long to stay in a frequency band f ?
Which frequency band f to sense next? Answering thisquestion requires balancing a trade-off between exploita-tion and exploration. On one hand, we can exploit the in-formation we learned from the sensing history to sched-ule brief checks on the next occurrence of a signal insome frequency band. On the other hand, due to the dy-namics of the spectrum, the history information we havemight not be accurate. So we need to keep exploring thespectrum in order to discover new usage patterns.
To address this trade-off, we formulate the problem asa multi-armed bandit game [11]. The multi-armed ban-dit game is a well studied problem in decision theory. Inthis game, the gambler needs to iteratively choose fromK bandit machines, each of which will give her randomrewards according to an unknown distribution. Her goalis to maximize the rewards in a given number of rounds.The gambler could learn the distribution by repeatedlypulling the levers. She then needs to decide whether toexploit the information she learned and choose the leverthat maximizes her expected payoff or to just exploremore in order to better learn the distribution.
There is a large literature of solutions to the multi-armed bandit game [30, 11]. In our implementation, weadopt a simple but very effective solution called the ε-greedy strategy which provides a very good approxima-tion to the optimal decision [30]. In this solution, gam-bler simply chooses the lever that maximizes her ex-pected payoff for (1− ε) of the time and for the remain-ing ε of the time she picks a lever at random. The choice
7

166 12th USENIX Symposium on Networked Systems Design and Implementation (NSDI ’15) USENIX Association
1
� � � �
Last appearance
1stPrediction
2ndPrediction
�time
⋯time
Freq
uency
Band
Reward
Functio
n⋯� � ��
� � � � � � ��
� � �� � �� � �
� �� � � � � �
� � �
�
�
Figure 8: The Reward Function: The reward function Rf (t) showshow near we are to the next signal appearance. It is zero at the begin-ning of a predicted period and one at the end, while linearly increasingas we get nearer to time we predict the signal will appear.
of ε defines the degree to which we rely on the learnedinformation and ε is traditionally set to 0.1 [30].
Thus, 10% of the time, SpecInsight is going to picka random frequency band to sense and 90% of the time,it will pick the band that gives it the maximal reward.But what is the reward function that SpecInsight needs tomaximize? SpecInsight avoids missing a signal by goingto its frequency band just before it expects the signal toappear. As a result, SpecInsight uses an indication of hownear we are to the next expected appearance of a signalin the frequency band as its reward function. Formally,we calculate the reward function for a frequency band fat time t as:
Rf (t) = 1− T +µ�(t−T)/µ�− tµ
(2)
where T is the last time the signal was observed and µ isthe mean value of the pattern interval time as describedin §4.2. The reward function is normalized to 1 in orderto compare bands with different mean pattern interval µ .
To better understand this reward function, consider theexample shown in Fig. 8. Given the last appearance of asignal at time T and the expected cycle µ , we predictthe signal will appear again at times T + µ ,T + 2µ ,T +3µ , · · · . Thus at time t, we predict that the signal willappear next at time T + µ�(t − T)/µ� and we are T +µ�(t−T)/µ�− t away from it. Since the farthest we canbe away from the next appearance is µ , we normalize byµ and subtract it from 1 so that the nearer we are, thelarger the reward function is.
How long to stay in a frequency band f ? Once SpecIn-sight decides which frequency band to sense, it needs todecide how long to stay in that band. We refer to thisas the dwell time td. The dwell time is determined bythe number of measurements (time-frequency blocks) weneed to collect in each band. It is directly related to thedynamics of the pattern, for the following reason: Themore dynamic the usage pattern is, the more uncertainwe are of our predictions, so that the offset between thepredicted occurrence of the signal and the actual occur-rence is bigger. To compensate for that, we need to have
Algorithm 1: Smart Scheduling Algorithm
Procedure SMARTSCHEDULING({f}, {µ}, {σ}, {T})t ← Current Timeif RAND([0,1])< ε then � The ε-greedy strategy
f ∗ ← RAND({f}) � Pick random frequencyelse
for f in {f} doµ ,T ←{µ}f ,{T}fif µ �= 0,∞ then
Rf (t)← 1− T+µ�(t−T)/µ�−tµ
elseRf (t)← RAND([0,1])
f ∗ ← argmaxf Rf (t)td ← min{6{σ}f ∗ , small constant}return {f ∗, td}
longer measurement time in order to capture the signal.As a result, the number of measurements needs to be pro-portional to the uncertainty in our predictions of whenthe signals are going to appear.
The dynamics of the pattern, i.e., the level of uncer-tainty, is captured by the standard deviation σ of the pat-tern interval τ which SpecInsight extracts in the learn-ing phase. The bigger σ is, the more dynamic the us-age pattern is. SpecInsight uses the 3-Sigma Rule [28] todetermine the dwell time td. The rule states that a ±3σinterval centered at the mean of the distribution coversmost of the cases. For example, in a Gaussian distribu-tion, it covers 99.7% of the probabilities. More generally,for any distribution it covers at least 90%. Based on thisrule, SpecInsight sets the dwell time to be td = 6σ .
A few points are worth noting:
• The reward function in Eq. 2 is not well defined forfrequency bands with always-on usage patterns whereµ = 0 and for frequency bands with no signals whereµ = ∞ (always idle). For these frequency bands, wepick the reward function randomly between 0 and 1.
• Frequency bands with fixed-cycle signals, always-onsignals, or no signals have σ ≈ 0. For these bands, weset a minimum dwell time td such that the collecteddata contains at least a few time-frequency blocks.
• Some frequency bands might contain multiple pat-terns, where each pattern has its own µ and σ . SpecIn-sight randomly picks one of the usage patterns’ µ andσ to calculate the reward function and the dwell time.
• In the case of fixed-cycle signals, SpecInsight is ableto track the signals while sequential scanning only de-tects the signal with some probability. Our ability totrack the signals is important in the case of fleeting pe-riodic signals like the one in Fig. 1(c), which are veryeasy to miss using sequential scanning.
• Finally, SpecInsight is a best-effort system and mightmiss sensing deadlines if pattern dynamism in the en-tire spectrum is very high. In the worst case, if all
8
USENIX Association 12th USENIX Symposium on Networked Systems Design and Implementation (NSDI ’15) 167
of the bands in the spectrum were equally highly dy-namic, it would degrade to randomly sampling thebands but would still be no worse than sequential scan-ning. Fortunately, as we will show in section §8, onlyvery few (< 5%) of the patterns are highly dynamic intoday’s spectrum and SpecInsight works well.
Finally, a pseudocode of SpecInsight’s smart schedul-ing algorithm is shown in Alg. 1.
6 IMPLEMENTATION
We implement SpecInsight on USRP software ra-dios [8]. Since each USRP daughterboard works in a par-ticular frequency range, we use two USRPs that simul-taneously run SpecInsight: the first USRP is equippedwith an SBX daughterboard, and works in the frequencyrange from 400 MHz to 4.4 GHz, and the second USRPis equipped with a WBX daughter-board and works in thefrequency from 50 MHz to 2.2 GHz. We connect the twoUSRPs to the same antenna using a power splitter. Weuse an ultra-wideband omni-directional outdoor antennathat works from 25 MHz to 6 GHz [22].
In order to maximize the USRP capabilities, we tunethe bandwidth and sampling rate to their maximum(40 MHz and 50 Ms/s). We set the two USRPs tosense non-overlapping frequency ranges, i.e, 50 MHz to2.2 GHz and 2.2 GHz to 4.4 GHz. Each of them runs anindependent version of SpecInsight’s sensing algorithm,and their spectrum pattern databases are combined to-gether. Thus, SpecInsight senses a total spectrum band-width of 4.35 GHz, from 50 MHz to 4.4 GHz. SpecIn-sight divides this spectrum into 171 bands based on theFCC spectrum allocation table [2]. For each band, itlearns its spectrum patterns and schedules when to sensethe band according to the algorithms in §4 and §5.
Implementing SpecInsight in realtime is challenging.SpecInsight needs to process a data stream over a Gbit/s.In order to support such high data rates, we implement allmajor computations using Intel’s streaming SIMD exten-sion (SSE2) instruction set, which provides instruction-level parallelization. We also use the FFTW library [3]for fast FFT implementation. Consequently, we are ableto run SpecInsight in realtime on a machine with an 8-core Intel-i7 processor and 8 GB of RAM.
7 USRP CALIBRATION
SpecInsight is not hardware specific, and can be usedwith various radios. The radio hardware, however, mayhave its own spurs, i.e., fake signals generated by hard-ware noise, which might be recognized by SpecInsightas patterns. Thus, when running SpecInsight on a partic-ular hardware platform, the radio should be calibrated toidentify hardware-specific spurs and eliminate them.
We calibrate the USRPs used in our prototype. All ofour calibration experiments are conducted in a Faradayshield room which blocks all signals from the outside.
Calibration in the absence of signals: We put our sens-ing setup in the shield room, and collect measurements inthe absence of any transmission. Since all active signalsfrom the outside are blocked by the room, every receivedsignal that is above the noise floor is a spur from the hard-ware. We noted two types of USRP spurs: 1) the USRPalways shows power at the baseband DC frequency, 2)the time samples received during the first 10ms afterpower-on are corrupted. We add filters to SpecInsight toremove these spurs before running the algorithms. Afteradding these filters, SpecInsight does not detect any pat-tern in the samples collected by the USRPs in the shieldroom. This complies with the fact that there are no ac-tive signals in the environment, and random noise is dis-carded by the pattern clustering algorithm.
Calibration in the presence of transmission: USRPsdo not adapt the receiver’s gain with the signal power.As a result, signals whose power is higher than theADC’s maximum quantization level are clipped at the re-ceiver. Clipping distorts the received signal and changesits frequency representation (creating harmonics). To en-sure that the received signal’s frequency representationmatches that of the signal over the air, the receiver shouldbe operating in its linear range without clipping.
The common approach to avoid clipping is to add au-tomatic gain control (AGC) to the receive chain [7]. US-RPs however do not implement AGC. To address this is-sue, SpecInsight detects the occurrences of clipping bycounting the number of time samples that are equal to themaximum quantization value. Once clipping is detected,SpecInsight drops the samples and sends out alerts. Dur-ing our experiments, which encompass 7 locations and atotal of 49 days, we noted only 7 occurrences of clipping,which were removed from the data. Please note that theclipping problem is specific to our sensing hardware butnot fundamental to the algorithm; to avoid it, one coulduse a more expensive hardware that implements AGC.
We run experiments in the shield room with a trans-mitter to check SpecInsight’s ability to detect a patterncorrectly and eliminate clipping events. We let the trans-mitter transmit continuously, but vary its transmissionpower. We confirm that SpecInsight detects the signal inthe correct frequency band as long as there is no clipping,and generates an alert whenever the signal clips.
8 EMPIRICAL RESULTS
8.1 SpecInsight’s Accuracy
We compare SpecInsight with a setup that uses ex-actly the same USRP hardware but sequentially scans the
9

168 12th USENIX Symposium on Networked Systems Design and Implementation (NSDI ’15) USENIX Association
0
1.5
3.0
4.5
Always-On Fixed-Cycle Dynamic Overall
Pe
rce
nta
ge
of
Occu
pa
ncy E
rro
r (%
)SpecInsight
Sequential Scanning
0.001 0.007
0.999
0.0720.0010.342
4.081
0.775
(a) Percentage of Occupancy Error
0
50
100
Always-On Fixed-Cycle Dynamic
Pe
rce
nta
ge
of
Tim
e (
%)
SpecInsightSequential Scanning
0.642 3.261
96.097
33.333 33.333 33.333
(b) Percentage of Time Spent in Each Class
Figure 9: Comparison of SpecInsight with Sequential Scanning: (a)shows that overall SpecInsight reduces errors by 10× in comparison tosequential scanning; (b) shows that SpecInsight uses its time wiselyspending less time on always-on and fixed-cycle bands and more timeon dynamic bands.
spectrum, as typical in today’s systems [21]. For sequen-tial scanning, the dwell time of each band is set to 50ms,which matches the average dwell time of SpecInsight.
To compare the accuracy of the two systems, we needthe ground truth. However, existing sensing hardwaredoes not have 4 GHz of instantaneous bandwidth thuscannot provide the ground truth for such a wideband.To address this issue, we use 10 USRPs to continuouslymonitor a subset of the bands within the 4 GHz spectrum,and obtain their ground truth. This provides us with theground truth needed to calculate the accuracy of SpecIn-sight and sequential scanning for this particular sub-setof bands. We then repeat the experiment for differentsubsets of bands.
We categorize the bands based on their usage patternsto: always-on (on for > 95% of the time), fixed-cycle(σ < 5ms), and dynamic (σ > 100ms). In our experi-ments, we consider equal number of bands (20) of eachtype; for each band we run the experiment for 1 hour.For both SpecInsight and sequential scanning, we com-pute the following two metrics for each type of bands:
• Percentage Occupancy Error: This is the percent-age difference between the ground truth occupancy ofa band and the occupancy reported by SpecInsight andsequential scanning. We define occupancy as the per-centage of time the band is occupied.
• Percentage of Sensing Time: This is the percentageof the total amount of time that the sensing algorithmspends in each type of band.
Results: The results using the above two metrics areshown in Fig. 9. For always-on bands, SpecInsightspends 50× less time in these bands and still achieves thesame accuracy as sequential scanning. For fixed-cyclebands, SpecInsight spends 10× less time in these bands
Boston,MA
NewYorkCity,NY
Amherst,MA
UpperArlington,OH
Redmond,WA
SanFrancisco,CA
Maui,HI
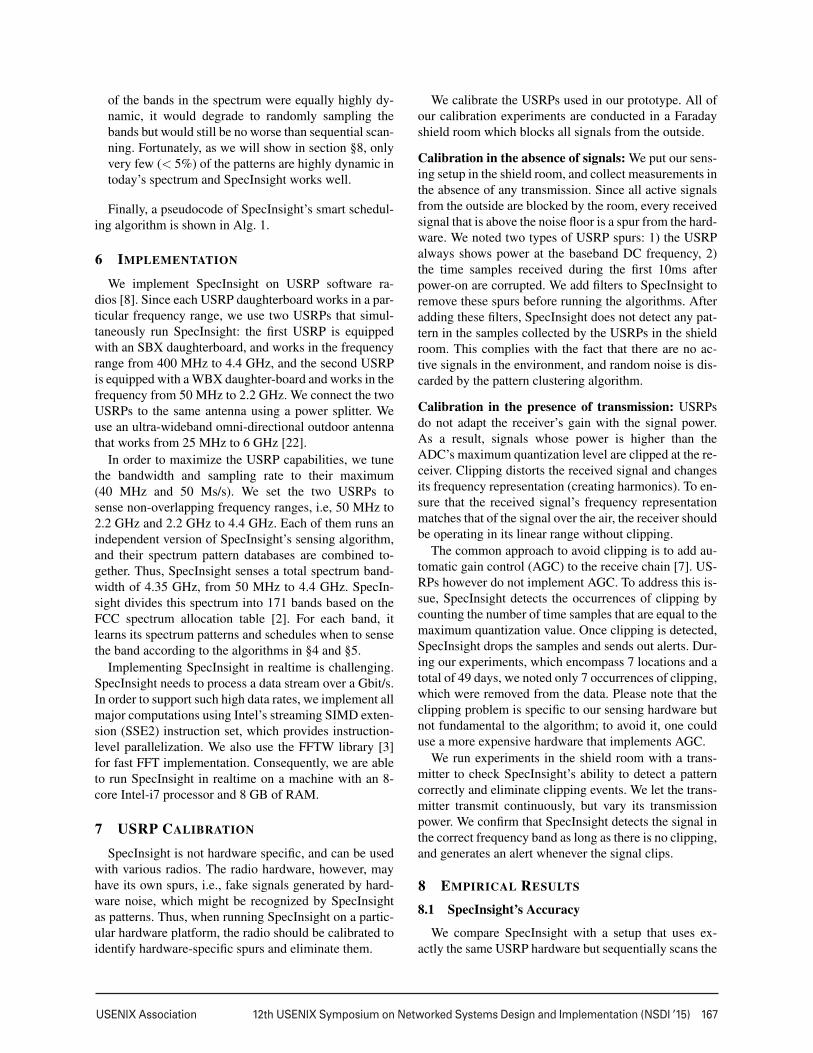
Figure 10: SpecInsight’s Measurement Locations.
and yet has 50× higher accuracy. For bands with moredynamics, SpecInsight can afford to spend 2.5× moretime in these bands which translates into 4× higher ac-curacy. Finally, overall, SpecInsight has 10× higher ac-curacy than sequential scanning for the same time bud-get. This is due to its smart scheduling algorithm, whichspends as little time as needed on always-on and fixed-cycle signals, and saves its time for dynamic signals.
8.2 Real-World Spectrum Analytics
We deployed SpecInsight in seven locations in theUS, including three major cities and four suburban areas,which cover the East Cost, West Cost and Pacific islands(Fig. 10). In each location, we analyzed one week of datacollected by SpecInsight. We report the results below.
8.2.1 The Spectrum Pattern Chart
In this section, we want to analyze how the spectrumusage patterns are distributed across frequencies. Overone week and seven locations, SpecInsight detected atotal of 312 different patterns corresponding to differ-ent technologies. To be able to visualize these patterns,we group them into classes according to their time andfrequency properties. In the time dimension, we dividethe patterns into always-on, fixed-cycle and dynamic. Inthe frequency dimension, we divided the patterns intofrequency-hopping, fixed frequency, and wideband 6.This gives us a total of 3×3=9 classes 7, where Fig. 11 (b)shows one usage pattern example for each class. Basedon these usage patterns, we constructed the first-of-its-kind spectrum pattern chart shown in Fig. 11 (a). In asimilar fashion to the FCC’s spectrum allocation chart,the spectrum pattern chart shows the types of spec-trum usage patterns seen in different frequency bands.Please note that we group the patterns into these roughclasses just for the purpose of visualization; SpecIn-sight’s database contains the exact and detailed patternsin each FCC band, in the form of time-frequency blocks.
Results: Fig. 11(a) shows the spectrum pattern chart(top) and the average spectrum occupancy chart (bottom)
6We label signals with bandwidth larger than 50MHz as wideband.7Note in all of the experiments we did not see wideband signals that
are always on, or frequency hopping signals that repeat in a fixed cycle.Hence, we ended up with a total of 7 classes.
10

USENIX Association 12th USENIX Symposium on Networked Systems Design and Implementation (NSDI ’15) 169
Sig
nal P
attern
sC
hart
0
20
40
60
80
100
50 500 1000 1500 2000 2500 3000 3500 4000 4400
Occupancy (
%)
Frequency (MHz)
(a) The spectrum pattern chart and average occupancy side by side: Top: Spectrum pattern chart drawn in the same fashion as the FCC allocationchart. Each of the small rectangle represents an active signal pattern type, out of the seven active types in Fig. 11(b). Frequency bands are arrangedhorizontally according to their frequency; and for bands with multiple types of patterns, the rectangles are piled up vertically. Different fillings forthe rectangles represent different types of patterns (listed in Fig. 11(b)). Bottom: The average occupancy over 1 week and 7 locations.
Time \ Freq Frequency Hopping Fixed Frequency WideBand
Always-On
Legend
1760-1761 MHz × 0.5s
Legend
681-687 MHz × 1 Day
Not detected
Fixed-Cycle Not detected
Legend
72.45-72.55 MHz × 1 Day
Legend
3300-3500 MHz × 1 Day
Dynamic
Legend
1235.3-1235.4 MHz × 0.5s
Legend
940-940.5 MHz × 1 Day
Legend
3300-3500 MHz × 1 Day
(b) Legend for rectangle fillings: We divide the patterns according to their time and frequency properties, which are the rows and columns of thischart and each intersection defines a class of patterns. So there are a total of 3×3 = 9 types. We give examples for 7 types of signals, while the othertwo (wideband always-on and frequency-hopping fixed-cycle signals) were not detected in any of the 7 locations.
Figure 11: The Spectrum Pattern Chart
over one week and seven locations. The bottom graph iscomputed by averaging occupancy across locations andthe top graph is a superposition of the patterns across alllocations. The figure shows that although there are manybands in the occupancy chart that are empty or nearlyempty, the pattern chart reveals that these bands are ac-tually being used. For example, the occupancy in the fre-quency ranges 1.2 GHz–1.85 GHz and 2.9 GHz–4.4 GHzis less than 0.0001 (almost zero). However, SpecInsightdetected in these bands some frequency hopping signalsand some wide-band fleeting periodic signals. In fact, thefigure shows that although large swaths of the spectrum
may appear completely empty, they actually have activesignals. In particular, about 39% of the bandwidth below4.4 GHz is used by signals whose occupancy is less than0.0001. Moreover, the usage patterns in these band aremostly of two types: 62.6% are frequency hopping sig-nals and 33.5% are wideband fleeting signals.
To better understand how much bandwidth each typeof pattern spans and how much it contributes to thespectrum occupancy, consider Fig. 12. The figure showsthe distribution of bandwidths and occupancies of thepatterns in government-owned bands, non-governmentbands and shared bands (where both government and
11

170 12th USENIX Symposium on Networked Systems Design and Implementation (NSDI ’15) USENIX Association
0
10
20
30
40
50
60
70
Bandwidth
Occupancy
Bandwidth
Occupancy
Bandwidth
Occupancy
Perc
enta
ge %
SharedNon-GovernmentGovernment
Figure 12: Spanned bandwidth vs. contributed occupancy: Wecheck the spanned bandwidth vs. contributed occupancy for differenttypes of patterns in government-owned, non-government and sharedbands. For the legend of this figure, see Fig. 11(b).
31.09%Always-On Signals
(On time > 95%)
18.59%Fast-Periodic Signals
(µ < 1s, σ < 5ms)
15.38%Slow-Periodic Signals
(Period > 1 hour)
34.94%Dynamic Signals
(σ > 5ms)
Figure 13: Statistics of Patterns According to the Timing Charac-teristics: The figure shows that more than half of the patterns (65%)have some timing regularities, either always-on or periodic.
non-government usage coexist). The results reveal thatusage patterns like frequency hopping and wideband sig-nals occupy 53.3% of the bandwidth but only contribute6.8% to the total spectrum occupancy. This is more ap-parent in government-owned bands since these technolo-gies are typically used in security applications. Particu-larly, the government owns 56% of the spectrum but onlycontributes 27.8% to the total occupancy.
8.2.2 Timing Analytics
In our timing analysis, we aim to answer the follow-ing questions: How many of the spectrum patterns aredynamic? How many are highly predictable (periodic oralways-on) signals? We use the standard deviation σ ofthe pattern intervals (described in §4.2) to distinguish dy-namic patterns from periodic and always-on signals. Of-ten higher σ reveals a more dynamic usage pattern. How-ever, this is not always true. Some periodic patterns havea very large period (hours-days), and hence can have alarge standard deviation σ . Fig. 14 shows a usage pat-tern in the government-owned 152 MHz band that re-peats every day. In particular, it has a signal that is alwayspresent, but at night, it is turned off in every other chan-nel. To accommodate such periodic patterns with large σ ,we distinguish between fast periodic and slow periodic.
Results: Fig. 13 shows the percentage of patterns that arealways-on, fast-periodic, slow-periodic and dynamic, out
0 1 2 3 4 5 6 7
Time (Day)
152.9
153.2
Fre
qu
en
cy (
MH
z)
Figure 14: Example of a Slow Periodic Signal: Every other channelof the signal is turned off at night for a fixed duration.
30
40
50
60
70
80
90
100
0 100 200 300 400 500 600
Pro
ba
bili
ty (
%)
Standard Deviation of the Pattern Interval (σ)(ms)
Figure 15: The CDF of the standard deviation of the pattern inter-val (σ ). Only less than 5% of the signals have very large σ .
of the 312 detected patterns. It reveals that only 35% ofthe detected usage patterns are actually dynamic.
To gain more insight into how dynamic the frequencybands are, we compute the CDF of the standard deviationσ of signal intervals. Fig. 15 shows this CDF and revealsthat less than 5% of the patterns are highly dynamic, i.e.,having a very large σ (σ > 200ms). These results showthat knowing the spectrum patterns is highly useful forsmart scheduling of sensing activities, and hence the ben-efits of SpecInsight.
9 CONCLUSION
This paper presents SpecInsight, a system that can ac-quire the detailed utilization patterns over 4 GHz of spec-trum in real time. We implement SpecInsight using off-the-shelf USRP radios and perform a large-scale studyof spectrum analytics in 7 US locations including ur-ban and suburban areas. Consequently, we build the first-of-its-kind spectrum pattern database characterizing howthe spectrum is utilized. We believe that SpecInsight en-ables multiple applications such as dynamic spectrum ac-cess, finding breaches of spectrum regulations, and un-derstanding undocumented spectrum utilizations.
Acknowledgments: We thank the anonymous review-ers and shepherd Jacobus Van der Merwe for their con-structive comments. We are grateful to Haitham Has-sanieh, Anoop Gupta, Aakanksha Chowdhery, OmidAbari, Swarun Kumar, Deepak Vasisht, John MacDon-ald, Fadel Adib, Hariharan Rahul, Zach Kabelac, EzzHamed, and Ranveer Chandra for their constructive feed-backs. We also thank the NETMIT group for their sup-port. This research is funded by NSF. We thank membersof the MIT Wireless Center: Amazon, Cisco, Google, In-tel, Mediatek, Microsoft and Telefonica for their interestand general support.
12

USENIX Association 12th USENIX Symposium on Networked Systems Design and Implementation (NSDI ’15) 171
REFERENCES
[1] Army use of the electromagnetic spectrum. http://www.apd.army.mil/pdffiles/r5 12.pdf.
[2] United states frequency allocations. http://www.ntia.doc.gov/files/ntia/publications/2003-allochrt.pdf.
[3] FFTW. http://www.fftw.org/.
[4] ABARI, O., LIM, F., CHEN, F., AND STO-JANOVIC, V. Why analog-to-information convert-ers suffer in high-bandwidth sparse signal appli-cations. Circuits and Systems I: Regular Papers,IEEE Transactions on (2013).
[5] ANKERST, M., BREUNIG, M. M., PETERKRIEGEL, H., AND SANDER, J. OPTICS: Order-ing points to identify the clustering structure. InSIGMOD (1999), pp. 49–60.
[6] CHEN, D., YIN, S., ZHANG, Q., LIU, M., ANDLI, S. Mining spectrum usage data: a large-scalespectrum measurement study. In Mobicom (2009).
[7] DRENTEA, C. Modern Communications ReceiverDesign and Technology. Artech House, 2010.
[8] ETTUS. Inc. USRP. http://ettus.com.
[9] FCC. Second memorandum opinion & order 10-174.
[10] GHAZI, B., HASSANIEH, H., INDYK, P., KATABI,D., PRICE, E., AND SHI, L. Sample-optimalaverage-case sparse fourier transform in two di-mensions. In Allerton (2013).
[11] GITTINS, J. Bandit processes and dynamic alloca-tion indices. Journal of the Royal Statistical Society(1979).
[12] HASSANIEH, H., INDYK, P., KATABI, D., ANDPRICE, E. Nearly optimal sparse fourier transform.In STOC (2012).
[13] HASSANIEH, H., SHI, L., ABARI, O., HAMED,E., AND KATABI, D. Ghz-wide sensing and de-coding using the sparse fourier transform. In IN-FOCOM (2014).
[14] HONG, S. S., AND KATTI, S. R. DOF: A localwireless information plane. In ACM SIGCOMM(2011).
[15] ISLAM ET AL., M. Spectrum survey in singapore:Occupancy measurements and analyses. In Crown-Com (2008).
[16] IYER, A. P., CHINTALAPUDI, K., NAVDA, V.,RAMJEE, R., PADMANABHAN, V. N., ANDMURTHY, C. R. SpecNet: spectrum sensing sansfrontieres. In NSDI (2011).
[17] KIM, H., AND SHIN, K. Efficient discovery ofspectrum opportunities with mac-layer sensing incognitive radio networks. Mobile Computing, IEEETransactions on (2008).
[18] KONE, V., YANG, L., YANG, X., ZHAO, B. Y.,AND ZHENG, H. On the feasibility of effectiveopportunistic spectrum access. In Proceedings ofthe 10th ACM SIGCOMM Conference on InternetMeasurement 2010, Melbourne, Australia - Novem-ber 1-3, 2010 (2010).
[19] LAKSHMINARAYANAN, K., SAPRA, S., SESHAN,S., AND STEENKISTE, P. RFDump: An architec-ture for monitoring the wireless ether. In CoNEXT(2009).
[20] MCHENRY, M. A. NSF spectrum occupancy mea-surement project summary, 2005.
[21] MICROSOFT SPECTRUM OBSERVATORY. http://spectrum-observatory.cloudapp.net.
[22] MP. Ultra base station antenna. http://www.mpantenna.com/products/product/08-ant-0861-vhf-uhf-basestation-antenna/.
[23] RAHUL, H., KUSHMAN, N., KATABI, D., SO-DINI, C., AND EDALAT, F. Learning to share:Narrowband-friendly wideband networks. In ACMSIGCOMM (2008).
[24] RASHIDI, M., HAGHIGHI, K., PANAHI, A., ANDVIBERG, M. A NLLS based sub-nyquist rate spec-trum sensing for wideband cognitive radio. In IEEEDySpan (2011).
[25] RAYANCHU, S., PATRO, A., AND BANERJEE, S.Airshark: Detecting non-wifi rf devices using com-modity wifi hardware. In ACM IMC (2011).
[26] TAHER, T., BACCHUS, R., ZDUNEK, K., ANDROBERSON, D. Long-term spectral occupancyfindings in chicago. In IEEE DySPAN (2011),pp. 100 – 107.
[27] TIAN, Z., AND GIANNAKIS, G. A wavelet ap-proach to wideband spectrum sensing for cogni-tive radios. In Cognitive Radio Oriented WirelessNetworks and Communications, 2006. 1st Interna-tional Conference on (2006).
[28] TRIOLA, M. F. Essentials of Statistics. 2009.
13

172 12th USENIX Symposium on Networked Systems Design and Implementation (NSDI ’15) USENIX Association
[29] PCAST: REALIZING THE FULL POTENTIAL OFGOVERNMENT HELD SPECTRUM TO SPUR ECO-NOMIC GROWTH, 2012.
[30] VERMOREL, J., AND MOHRI, M. Multi-armedbandit algorithms and empirical evaluation. InECML (2005).
[31] YANG, L., HOU, W., CAO, L., ZHAO, B. Y., ANDZHENG, H. Supporting demanding wireless ap-plications with frequency-agile radios. In NSDI(2010).
[32] YING, X., ZHANG, J., YAN, L., ZHANG, G.,CHEN, M., AND CHANDRA, R. Exploring indoorwhite spaces in metropolises. In ACM MobiCom(2013).
[33] YOON, S., LI, L. E., LIEW, S., CHOUDHURY,R. R., TAN, K., AND RHEE, I. Quicksense: Fastand energy-efficient channel sensing for dynamicspectrum access wireless networks. In IEEE IN-FOCOM (2013).
[34] YUCEK, T., AND ARSLAN, H. A survey of spec-trum sensing algorithms for cognitive radio appli-cations. Communications Surveys Tutorials, IEEE11, 1 (2009).
[35] ZHANG, T., LENG, N., AND BANERJEE, S. Avehicle-based measurement framework for enhanc-ing whitespace spectrum databases. In Mobicom(2014).
[36] ZHAO, Q., TONG, L., SWAMI, A., AND CHEN, Y.Decentralized cognitive mac for opportunistic spec-trum access in ad hoc networks: A POMDP frame-work. Selected Areas in Communications, IEEEJournal on 25, 3 (2007).
14