bi movie magic: maps, graphs, and bi dashboards at amc...
TRANSCRIPT

Session ID:
Prepared by:
BI Movie Magic: Maps,
Graphs, and BI Dashboards
at AMC Theatres
10553
@TimVlamis
Tim Vlamis
VP & Analytics Strategist
Vlamis Software Solutions
[email protected] www.vlamis.com

Agenda:
• About AMC
• Challenges
• Strategy
• Journey
• Solution Set
– Maps
– Graphs
– BI Dashboards
• Next Steps
• Questions

Vlamis Software Solutions
• Vlamis Software founded in 1992 in Kansas City, Missouri
• Developed more than 200 Oracle BI and Analytics systems
• Specializes in ORACLE-based:
• Business Intelligence & Analytics
• Data Mining and Predictive Analytics
• Data Visualization
• Data Warehousing
• Expert presenter at major Oracle conferences
• www.vlamis.com (blog, papers, newsletters, services)
• Co-authors of book “Data Visualization for OBI 11g”
• Co-author of book “Oracle Essbase & Oracle OLAP”
• Oracle University Partner
• Oracle Gold Partner
Copyright © 2016, Vlamis Software Solutions, Inc.

Tim Vlamis
Vice President & Analytics Strategist
– 30+ years experience in business modeling and valuation, forecasting, and scenario analyses
– Oracle ACE
– Instructor for Oracle University’s Data Mining Techniques and Oracle R Enterprise Essentials Courses
– Professional Certified Marketer (PCM) from AMA
– Adjunct Professor of Business Benedictine College
– MBA Kellogg School of Management (Northwestern University)
– BA Economics Yale University
Copyright © 2016, Vlamis Software Solutions,

AMC History
• 1920 Maurice, Edward and Barney Dubinsky purchase the Regent Theatre in Kansas City, Mo.
• 1961 Stanley Durwood becomes CEO of the company and renames it American Multi-cinema.
• 1962 AMC opens the world’s first multiplex, the Parkway Twin in Kansas City.
• 1981 AMC becomes the first theatre chain to add cupholderarmrests.
• 1991 Introduces Clip®, a “film strip” character to serve as an ambassador of the brand and its Silence is Golden® program
• 1995 AMC opens the world’s first megaplex. This innovative destination also inspires AMC to install stadium seating and LoveSeat®-style seating.
• 2000 AMC co-founds online ticket services to add convenience to even the busiest AMC theatres like Empire 25 in New York City, which is recognized as the busiest theatre in the world.
• 2002 AMC becomes the first theatre chain to introduce the circuit-wide gift card
5

AMC History Continued…
• 2005 AMC co-founds National CineMedia, which runs all of AMC’s preshow entertainment and in-theatre advertising.
• 2006 AMC expands presence throughout the country with the acquisition of Loews Theatres
• 2007 AMC partners with IMAX to bring approximately 125 IMAXlarge-screen digital projection systems to AMC locations around the country.
• 2008 AMC launches Dine-In Theatres.
• 2009 AMC partners with Sony and RealD to implement digitaland 3D technology.
• 2010 AMC acquires Kerasotes theatres and expands its presence in the Midwest.
• 2011 AMC launches its AMC Stubs rewards program
• 2012 Wanda Group acquires AMC
• 2013 AMC IPO
• 2015 AMC acquires Starplex Cinemas.
• 2015 AMC introduces Online Concessions and delivery to seat.
6

AMC Facts, by the NUMBERS
• Interests in 370+ theatres with 5,000 screens across the U.S.
• 18 Dine-In Theatres offer dinner and a movie
• AMC employs approximately 20,000 full- and part-time associates
• We serve approximately 200 million guests each year with industry-leading guest satisfaction ratings
• AMC MacGuffins bars serve beer, wine and cocktails to adult guests in 109locations
• AMC’s food & beverage operations, including our dine-in theatres, represent
a Top 60 U.S. restaurant chain
• AMCTheatres.com generates nearly 300 million visits per year
• AMC mobile apps have 5.2 million downloads
• AMC Stubs Loyalty Program with 2.4 million paid members
• Twitter feed with more than 289,000 followers
• Facebook page with more than 4.4 million likes
8
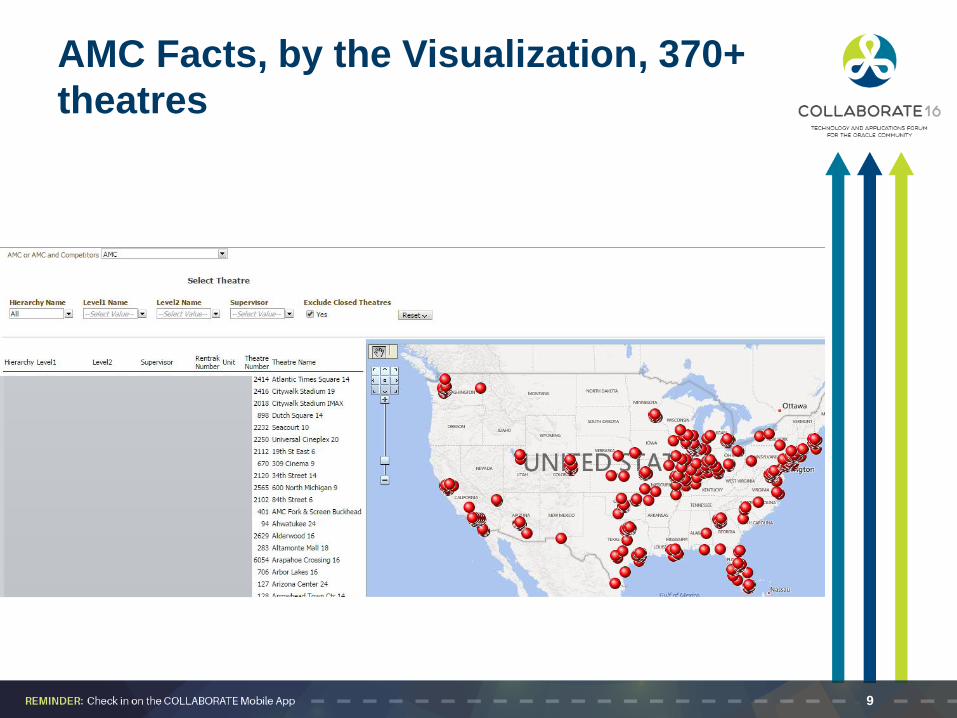
AMC Facts, by the Visualization, 370+
theatres
9

AMC Facts, by the Visualization, 18
DIT theatres
11

Challenges - Strategy…People,
Processes, and Technology
13

Challenges
People
• Culture
• Excel Entrenched
• Numbers, numbers, numbers only
• How does it print?
• Embrace new tools
• Graphs, Charts, Colors.
• Limited Staffing
Process
• Governance – Data and Report ownership, Business Glossary
• Expanded Self Service – to a wider audience w/OBI Analysis
• Pre-Built Excel Reports vs. Real Time Dashboards
Technology
• Legacy Hardware/Software – DPA, Hyperion Enterprise
• OBIEE – New tool
• Rolling out to 1,500+ @Theatre Users – Unproven Platform
• Transition to New EDW from ground up – Patience
• Replacing “working” legacy Applications
14

Data Driven Culture – data driven
decisions, not opinions
15

Data Strategy
Data Management
• Data Delivery - EAI and ETL framework
– Data Models, Canonicals, Schema’s
– Data Mappings
• MDM – Master Data Management Engineered with a Purpose
– Store, Title/Film, F&B Products, Customer– Hierarchy Management (DRM) – Slicing and Dicing,
Regions, Reseats, Core, etc.
• EDW - Enterprise Data Warehouse – Information Harmonized– Star Schema - Shared Common Dimensions driven
by MDM– Data at the right time and lowest grain
– One source of the “truths”
16

Data Strategy – One source for Reporting
and Analysis, but…
17

Data Strategy
Presentation Management – Driven by Key Data Points
• Dashboards and Reports
• Sales Data - POS, Online ticketing, Mobile.
• Competitor – Rentrak
• Loyalty - Member engagement, Demographics
• Theatre Report Dashboards – Driven by 1m queries!
• Performance metrics by theatre by day
• Oracle EBS BI Apps for Finance and HR
• Ad-hoc Self Service Query and Analysis
• All data in the EDW is available for Ad-hoc query
• Customer and Sales Subject Areas – Depth and breadth of attributes
• Education
• Internal Custom OBI and Smartview training
18

Journey Time Line
• 2009 Microsoft Reporting Services
• 2009 Master Data Management (Store, Film,)
• 2009 EDW Core Dimensions (Date, Store, Film)
• 2009 OBIEE Self Service Ad-hoc (Rentrak Data)
• 2011 OBIEE 10G over Oracle BI Apps over EBS 11.5
• 2011 OBIEE 10G Oracle BI Apps DW w/ Oracle EBS r12
• 2011 OBIEE Over Custom EDW (Non EBS)
• 2011 OBIEE 11G Upgrade
• 2012 Theatre Reports / Dashboards*
19

Theatre Reporting Fast & Furious…from
Disruption comes Opportunity
Wanda – Fiscal Year & Weekly to Monthly Changes –
Replace Theatre Reporting in 3 months!!
20

Journey Time Line
• 2013 Corporate Reports/Dashboards
• 2013 OBI Mobile HD
• 2014 Hyperion Planning and Data Relationship Management (DRM)
• 2014 OBI Visualizations Workshop*
• 2014 PureData for Analytics – Powered by Netezza
• 2014 Geospatial Maps
• 2015 Hyperion Financial Management
• 2015 Retire Hyperion Enterprise!
21

AMC Business Intelligence Journey
22
http://blog.percepsys.com/2012/03/business-intelligence-maturity-model.html

Solution Sets
• Maps
• Graphs
• BI Dashboards
23

Video Wall
24

25

Maps at AMC – Part of the Solution
26

Operations Summary - Legacy
27

Operations Summary – New
28

colorbrewer2.org
30

Food & Beverage Analytics
31

Food and Beverage Analytics
32

Food and Beverage Analytics
33

Food and Beverage Analytics
34

Text with Maps
35

National Map
36

National Map with Top 3 Markets
37

Markets
38

Markets
39

Next Steps: To Infinity and Beyond!
• Expand Maps – Geography and Seating
• Scheduled Internal Data User Group (BICC)
• Expand Visualization – Discovery/Exploration/Visual Analyzer
• Big Data (Volume, Velocity, Variety)
• Social, Beacons, Mobile App data, Website click data, Projector logs, Sensor data, Freestyle data, etc.
• Data Streaming – Real Time Data
• Technology advancing from daily micro batches to data streams
• Advanced Analytics
• Predictive, Market Basket Analysis, Text Analysis, Machine Learning
• Embedded Analytics
• Adding historical insight to transactional business Applications (i.e. Scoring/Trends without switching applications)
• Mobile @ Theatre
• First line managers alerts and reports at arms length.
• Balanced Score-Carding
40

Key Takeaways
Spend less time on finding the answers and more time on
enjoying life.
42

BI Movie Magic: Maps, Graphs,
and BI Dashboards at AMC
Theatres
Session #10553
Presented by Tim Vlamis
Vlamis Software Solutions