bio-inspired sensing and imaging of polarization information in … · bio-inspired sensing and...
TRANSCRIPT
Final Report for the Grant Entitled
Bio-Inspired Sensing and Imaging of Polarization Information in Nature
Grant Number FA9550-05-1-0052
Duration: January 1, 2005 till December 31, 2007
PI: Nader Engheta
Co-Pis: Edward N. Pugh Jr., and Jan Van der Spiegel Department of Electrical and Systems Engineering
University of Pennsylvania Philadelphia, Pennsylvania 19104
Abstract
Our unaided eyes can detect two of the characteristics of image-forming visible light from a
scene, namely, the intensity and the wavelength, which can then be encoded into perceptual qualities of brightness and color. Our eyes, however, are effectively blind to the third characteristic of light, its polarization. It is well known, however, that several species of animals have visual systems capable of detecting light’s polarization and using the information so extracted. Understanding the biophysical mechanism behind the polarization vision and reverse engineering its functionality and utility leads to exciting novel methods and techniques in sensing and imaging with various applications. Motivated and inspired by the features of polarization-sensitive visual systems in nature, in our group we have been developing various man-made, non-invasive imaging methodologies, sensing schemes, camera systems, and visualization and display schemes that have shown exciting and promising outcomes with useful applications in system designs. These techniques provide better target detection, enhanced visibility in otherwise low-contrast conditions, longer detection range in optically scattering media, polarization-sensitive adaptation based on changing environments, surface deformation-variation detection (e.g., detection of finger prints on a smooth surface using polarization-based vision), “seeing” objects in shadows, and other novel outcomes and applications. During our efforts supported by this grant, we have investiagted various exciting possibilities of bio-inspired polarization imaging with numerous potential applications. Our findings are described in the attached published papers.
Distribution A: Public Release, Unlimited

REPORT DOCUMENTATION PAGE Form ApprovedOMB No. 0704-0188
1. REPORT DATE (DD-MM-YYYY) 2. REPORT TYPE
4. TITLE AND SUBTITLE 5a. CONTRACT NUMBER
6. AUTHOR(S)
7. PERFORMING ORGANIZATION NAME(S) AND ADDRESS(ES)
9. SPONSORING/MONITORING AGENCY NAME(S) AND ADDRESS(ES)
8. PERFORMING ORGANIZATION REPORT NUMBER
10. SPONSOR/MONITOR'S ACRONYM(S)
13. SUPPLEMENTARY NOTES
12. DISTRIBUTION/AVAILABILITY STATEMENT
14. ABSTRACT
15. SUBJECT TERMS
18. NUMBER OF PAGES
19a. NAME OF RESPONSIBLE PERSON a. REPORT b. ABSTRACT c. THIS PAGE
17. LIMITATION OF ABSTRACT
Standard Form 298 (Rev. 8/98)Prescribed by ANSI Std. Z39.18
Adobe Professional 7.0
PLEASE DO NOT RETURN YOUR FORM TO THE ABOVE ORGANIZATION. 3. DATES COVERED (From - To)
5b. GRANT NUMBER
5c. PROGRAM ELEMENT NUMBER
5d. PROJECT NUMBER
5e. TASK NUMBER
5f. WORK UNIT NUMBER
11. SPONSOR/MONITOR'S REPORT NUMBER(S)
16. SECURITY CLASSIFICATION OF:
19b. TELEPHONE NUMBER (Include area code)
The public reporting burden for this collection of information is estimated to average 1 hour per response, including the time for reviewing instructions, searching existing data sources, gathering andmaintaining the data needed, and completing and reviewing the collection of information. Send comments regarding this burden estimate or any other aspect of this collection of information, includingsuggestions for reducing the burden, to the Department of Defense, Executive Service Directorate (0704-0188). Respondents should be aware that notwithstanding any other provision of law, noperson shall be subject to any penalty for failing to comply with a collection of information if it does not display a currently valid OMB control number.

INSTRUCTIONS FOR COMPLETING SF 298
Standard Form 298 Back (Rev. 8/98)
1. REPORT DATE. Full publication date, includingday, month, if available. Must cite at least the year andbe Year 2000 compliant, e.g. 30-06-1998; xx-06-1998;xx-xx-1998.
2. REPORT TYPE. State the type of report, such asfinal, technical, interim, memorandum, master's thesis,progress, quarterly, research, special, group study, etc.
3. DATES COVERED. Indicate the time during whichthe work was performed and the report was written,e.g., Jun 1997 - Jun 1998; 1-10 Jun 1996; May - Nov1998; Nov 1998.
4. TITLE. Enter title and subtitle with volume numberand part number, if applicable. On classifieddocuments, enter the title classification in parentheses.
5a. CONTRACT NUMBER. Enter all contract numbersas they appear in the report, e.g. F33615-86-C-5169.
5b. GRANT NUMBER. Enter all grant numbers asthey appear in the report, e.g. AFOSR-82-1234.
5c. PROGRAM ELEMENT NUMBER. Enter allprogram element numbers as they appear in the report,e.g. 61101A.
5d. PROJECT NUMBER. Enter all project numbers asthey appear in the report, e.g. 1F665702D1257; ILIR.
5e. TASK NUMBER. Enter all task numbers as theyappear in the report, e.g. 05; RF0330201; T4112.
5f. WORK UNIT NUMBER. Enter all work unitnumbers as they appear in the report, e.g. 001;AFAPL30480105.
6. AUTHOR(S). Enter name(s) of person(s)responsible for writing the report, performing theresearch, or credited with the content of the report. Theform of entry is the last name, first name, middle initial,and additional qualifiers separated by commas, e.g.Smith, Richard, J, Jr.
7. PERFORMING ORGANIZATION NAME(S) ANDADDRESS(ES). Self-explanatory.
8. PERFORMING ORGANIZATION REPORT NUMBER. Enter all unique alphanumeric report numbers assigned bythe performing organization, e.g. BRL-1234;AFWL-TR-85-4017-Vol-21-PT-2.
9. SPONSORING/MONITORING AGENCY NAME(S)AND ADDRESS(ES). Enter the name and address of theorganization(s) financially responsible for and monitoringthe work.
10. SPONSOR/MONITOR'S ACRONYM(S). Enter, ifavailable, e.g. BRL, ARDEC, NADC.
11. SPONSOR/MONITOR'S REPORT NUMBER(S). Enter report number as assigned by the sponsoring/monitoring agency, if available, e.g. BRL-TR-829; -215.
12. DISTRIBUTION/AVAILABILITY STATEMENT. Useagency-mandated availability statements to indicate thepublic availability or distribution limitations of the report. Ifadditional limitations/ restrictions or special markings areindicated, follow agency authorization procedures, e.g.RD/FRD, PROPIN, ITAR, etc. Include copyrightinformation.
13. SUPPLEMENTARY NOTES. Enter information notincluded elsewhere such as: prepared in cooperationwith; translation of; report supersedes; old edition number,etc.
14. ABSTRACT. A brief (approximately 200 words)factual summary of the most significant information.
15. SUBJECT TERMS. Key words or phrases identifyingmajor concepts in the report.
16. SECURITY CLASSIFICATION. Enter securityclassification in accordance with security classificationregulations, e.g. U, C, S, etc. If this form containsclassified information, stamp classification level on the topand bottom of this page.
17. LIMITATION OF ABSTRACT. This block must becompleted to assign a distribution limitation to the abstract. Enter UU (Unclassified Unlimited) or SAR (Same asReport). An entry in this block is necessary if the abstractis to be limited.
Adaptive algorithms for two-channel polarizationsensing under various polarization statistics withnonuniform distributions
Konstantin M. Yemelyanov, Shih-Schön Lin, Edward N. Pugh, Jr., and Nader Engheta
The polarization of light carries much useful information about the environment. Biological studies haveshown that some animal species use polarization information for navigation and other purposes. It hasbeen previously shown that a bioinspired polarization-difference imaging (PDI) technique can facilitatedetection and feature extraction of targets in scattering media. It has also been established [J. Opt. Soc.Am. A 15, 359 (1998)] that polarization sum and polarization difference are the optimum pair of linearcombinations of images taken through two orthogonally oriented linear polarizers of a scene having auniform distribution of polarization directions. However, in many real environments the scene has anonuniform distribution of polarization directions. Using principal component analysis of the polarizationstatistics of the scene, we develop a method to determine the two optimum information channels withunequal weighting coefficients that can be formed as linear combinations of the images of a scene takenthrough a pair of linear polarizers not constrained to the horizontal and vertical directions of the scene.We determine the optimal orientations of linear polarization filters that enhance separation of a targetfrom the background, where the target is defined as an area with distinct polarization characteristics ascompared to the background. Experimental results confirm that in most situations adaptive PDI out-performs conventional PDI with fixed channels. © 2006 Optical Society of America
OCIS codes: 260.5430, 110.2970, 330.1880, 100.2960, 330.7320.
1. Introduction
Polarization is an intrinsic feature of light that pro-vides valuable information about a scene beyond thatprovided by the scene’s spectral (color) and intensitydistributions. Polarized light has been studied exten-sively since Fresnel’s investigations of the wavetheory, and is important in many areas of moderntechnology (see, e.g., Refs. 1–4). Polarization informa-tion has proven useful in several fields, includingcomputer vision,5,6 target detection, particularly in im-aging targets in scattering media, such as water, fog,
etc., in feature extraction,7–22 and in material classi-fication.23,24 Polarization parameters, e.g., Stokes pa-rameters, are in general more sensitive to the nature ofa scattering surface than the total intensity is. In sucha case, polarization imaging techniques offer the pos-sibility of producing images with higher inherent vi-sual contrast than conventional image processing ofthe intensity distribution.3
The polarization of light is not discernible to the un-aided human eyes,25 but polarization has been shownto provide valuable information to other species. In1949, Nobel laureate Karl von Frisch established thathoneybees through their perception of polarized lightuse the Sun as a compass through their perception ofthe polarization pattern of light scattered from thesky.26,27 After von Frisch’s discovery, other research-ers began to investigate polarization vision and foundit in many different species, including amphibians,arthropods, desert ants, octopuses, and probably fish(see, e.g., Refs. 28–41). These animals use polariza-tion information in many different ways, e.g., navi-gation, detecting water surfaces, enhancing visibility(similar to colors), and perhaps even for mutual com-munication.
From its utilization by animals, it is clear that the
K. M. Yemelyanov ([email protected]), S.-S. Lin, andN. Engheta are with the Department of Electrical and SystemsEngineering, University of Pennsylvania, 200 South 33rd Street,Philadelphia, Pennsylvania 19104. N. Engheta is also with theInstitute of Neurological Sciences, University of Pennsylvania, 200South 33rd Street, Philadelphia, Pennsylvania 19104. E. N. Pugh,Jr. is with the F. M. Kirby Center for Molecular Opthalmology andthe Institute of Neurological Sciences, University of Pennsylvania,422 Curie Boulevard, Philadelphia, Pennsylvania 19104.
Received 4 November 2005; revised 11 March 2006; accepted 13March 2006; posted 14 April 2006 (Doc. ID 65745).
0003-6935/06/225504-17$15.00/0© 2006 Optical Society of America
5504 APPLIED OPTICS � Vol. 45, No. 22 � 1 August 2006
pattern of polarization in an image of a scene is apotentially rich source of information. While the hu-man eye is “polarization blind,” man-made imagingsystems have been developed to collect polarizationinformation from scenes.5,6 An important issue forsuch systems is how to process and display the po-larization information after it is collected by the im-aging system to enhance our vision of the scene.Inspired by polarization vision of certain animal spe-cies, in earlier studies, our group introduced,12,42,43
polarization-difference imaging (PDI) processing.44
We demonstrated that optical imaging systems uti-lizing PDI techniques may help the detection of tar-gets in scattering media even when the fraction of thelight is polarized by only a few percent, and that suchenhancement can increase by up to threefold the dis-tance over which targets can be reliably detected nearthreshold visibility.12,42,43 We have also investigatedthe issue of optimal representation of polarizationinformation for the polar-blind human eye.43–45
The idea that polarization vision may involve adap-tation to the environmental polarization is bioinspiredas well. Insects employ a retinal filter consisting of anarray of ommatidia (polarization-sensitive photorecep-tors) that is approximately matched to the polarizationpattern of the sky.32 This filter works as follows: Thesummed output from all the polarization analyzers ofthe polarization-sensitive area reaches a maximumwhen a match between the receptor array and thecelestial pattern has been approximately achieved.This provides the insect with the information of how toalign its longitudinal body axis with the symmetryplane of the sky. To find a proper direction, the insecthas to change its orientation and perform a check ofthe polarization pattern for each angle of orienta-tion.46,47
Inspired by the concept of matched filters31,32 wedevelop a polarization imaging technique based onPDI, but that is adaptable to the environmental con-ditions, i.e., to the polarization background of a scene.The proposed polarization-based system adjusts itselfto enhance the segregation of targets from the back-ground in a manner dependent on the polarizationstatistics of the scene.
The paper is organized as follows: in Section 2, wegive a brief overview of the polarization concept anddefine the polarization parameters used in the paper.In Section 3, we describe the adaptive polarization-difference imaging (APDI) algorithm. Section 4 is de-voted to the validation of the proposed technique,employing both experiments and simulations. In Sec-tion 4, we illustrate the performance of the algorithmin target-against-background detection using the ex-perimental data obtained in a natural environment.In Section 5, we apply the APDI algorithm to a scenetaken under natural illumination conditions. In Sec-tion 6, we propose an APDI-based method that maybe used in surveillance systems, compare APDI withseveral other methods in polarization-based imaging,and discuss the performance of the algorithm. Finallyin Section 7, we present our conclusions.
2. Physics of Polarization Imaging
The polarization of the local field of a monochromaticcoherent light source can be represented as a super-position of two mutually orthogonal wave compo-nents. A phase difference between these componentsproduces a linearly, elliptically, or circularly polar-ized wave with its polarization direction determinedby the relative strengths of the components. Sincehuman eyes and most conventional camera sensorscan only detect the total light intensity collectedat each pixel during an exposure time many timeslonger than the oscillation frequency, when the lightenergy is uniformly distributed over all polarizationdirections, the detected signal will be the same forany polarization direction. Such light is called unpo-larized and emitted by most common light sources,including the Sun or man-made incandescent lightsources. The local polarization signal at the surface ofa sensor (which cannot detect phase information) canbe described as a combination of unpolarized andcompletely linearly polarized components.
Assuming that a perfect linear polarizer is placedin front of a normal polarization-insensitive device,such as a CCD or film camera, the observed intensityI�x, y, �� at the pixel located at �x, y� is in general afunction of the angle � that polarization analyzermakes with a reference direction, and can be de-scribed as
I�x, y, �� � IU�x, y�(1 � p�x, y�cos�2���x, y� � ���),
(1)
where IU is half of the total pixel intensity, andp is the degree of linear polarization defined as�Imax�x, y� � Imin�x, y����Imax�x, y� � Imin�x, y��, whereImax�x, y� and Imin�x, y� denote at each pixel �x, y�, re-spectively, the maximum and minimum observed in-tensity within a full rotation of the analyzer. (We notethat this definition of degree of linear polarization,which is more suitable for wideband signals usedhere, is different from what is used as the degree ofpolarization in the context of the Stokes parame-ters.49 Throughout this paper, we use the horizon asthe reference direction, and angles increase counter-clockwise relative to the direction of the horizon.
As is evident from Eq. (1), at each pixel of the imageof a scene, the polarization (and intensity) of the im-pinging light is characterized by three independentparameters: thus to obtain complete informationabout the polarization features of the object, at leastthree measurements of light intensity at differentangles � are required. These measurements can bemade either simultaneously by three CCD cameras,such that each camera has a fixed polarizer set at adifferent angle, or, assuming the scene is stable overtime, by one camera, taking images sequentiallythrough a polarizer oriented at three different angles.Our computational algorithm can be used with eithermeasurement method after proper calibration.
Consider three images of a scene, I0, I45, I90, corre-sponding to three angles of orientation of the linear
1 August 2006 � Vol. 45, No. 22 � APPLIED OPTICS 5505
polarizer, namely, � � 0°, 45°, and 90° with respect tothe reference direction. From these three images, wecan calculate IU, p, and � at each image point asfollows:
IU�x, y� �I0�x, y� � I90�x, y�
2 ,
p�x, y� ��1 �I45�x, y�IU�x, y�
2
� 1 �I90�x, y�IU�x, y�
2�1�2
,
��x, y� �12 tan�1 IU�x, y� � I0�x, y�
IU�x, y� � I45�x, y�. (2)
Once the parameters IU, p, and � are computed foreach pixel of the scene image, one can reconstruct theimage intensity that would be observed for any angle� using Eq. (1), even though no actual pictures aretaken with a polarizer oriented at �.
3. Concept of Adaptive Polarization-Difference Imaging
A. Polarization-Difference Imaging
The concept of PDI was introduced in earlier inves-tigations of our research group.12,42–45 This idea hassince been utilized by other research groups (see,e.g., Refs. 13, 18, 20, and 49–51). The original PDIsystem captures images of a scene at two orthogonallinear polarizations. Thus one obtains a pair of im-ages, i.e., I0�x, y� and I90�x, y� taken at 0° and 90°orientation of the polarizer, respectively. Thepolarization-sum (PS) and polarization-difference (PD)images are linear combinations of the intensity imagesfor the two orthogonal polarizations; thus given I0�x, y�and I90�x, y� one computes:
PS�x, y�PD�x, y�� 1 1
1 �1Ç
T
I90�x, y�I0�x, y� , (3)
where T identifies the transformation matrix. For anideal linear polarizer, the PS image is equivalent to aconventional intensity image.
Tyo52 has shown that the two image channels PSand PD given by Eq. (3) are the principal components(PCs) of a scene in which the polarization angle has auniform distribution; thus in such cases, PS and PDare optimal channels in the information-theoreticsense of carrying maximally uncorrelated informa-tion about the scene. Tyo’s ideas were developed inanalogy with a principal component analysis (PCA)of trichromatic (three-cone pigment) color vision byBuchsbaum and Gottschalk.53 In Tyo’s analysis, as inthat by Buchsbaum and Gottschalk,53 the transfor-mation matrix T in Eq. (3) is derived by applying PCAto the covariance matrix of the input channels [e.g., I0and I90 in Eq. (3)] for a broadband distribution ofthe relevant property (polarization, spectral distribu-tions) over the ensemble of scenes. In these analyses,the principal component with the largest eigenvalue
is a same-signed sum of the input channels, while theremaining components are the “opponent,” involvingopposite-signed weighting coefficients in the trans-mission matrix.52,53 An interesting corollary to theoptimality of PCA channels in information encodingis that the opponent channels can also be understoodto be optimized for the detection of change relative tothe average scene to which the first principal compo-nent is tuned; thus the opponent channel(s) in effectperform a common-mode rejection of the statisticallyaverage scene or background signal, and in doing soenhance the signal-to-noise ratio (SNR), and thus thedetectability by the opponent channels of targets in ascene that differs in polarization statistics from thebackground. This duality in the sense of optimality ofPCA-derived channels led us to seek the optimumchannels for an arbitrary background scene.
B. Generalization of Polarized-Difference Imaging toNonuniform Polarization Statistics
In real scenes, both the polarization orientation andthe degree of linear polarization of the scene have non-uniform distributions. In such situations, the PD sig-nal of Eq. (6) may not be the most useful signal fordetecting targets against the average background.What would then be the appropriate image (i.e., a com-bination of signals) to reveal hidden polarization fea-tures of the scene and improve the target detection?Answering this question is the goal of this study.
Our approach to this goal has been to enable ourimaging system to adapt to the polarization statisticsof the background, so that if any changes occur in thescene they will pop out on one of the channels. Theadaptation of the system to the polarization statisticsof the background in effect performs a common-moderejection of the background. In such an approach, it isassumed here that the system measures the polar-ization statistics of the scene in the two differentstages: once when only the background is present,and again when a target is present with the back-ground. Furthermore, in describing the ideal behav-ior of such a system, the target is considered as aperturbation of the background scene, i.e., a minorchange that does not alter the overall polarizationstatistics (Subsection 4.C).
Consider the general case such that the probabilitydensity function of the polarization angle over thepixels is arbitrary. Assume that images of the scenewith M � N pixels have been taken with two differentorientations (not necessarily orthogonal) of the polar-izer, i.e., I1 � I��1� and I1 � I��2�. Here, we examinethese two signals using the PCA technique.55 Accord-ing to PCA, the covariance matrix for such an arbi-trary pair of images is defined as
C��1, �2�� E�I1I1� � E2�I1� E�I1I2� � E�I1�E�I2�E�I1I2� � E�I1�E�I2� E�I2I2� � E2�I2� ,
(4)
where E�W� � 1�MN�m�1M �n�1
N W�xm, yn� is the meanvalue taken over the ensemble of pixels in the images,
5506 APPLIED OPTICS � Vol. 45, No. 22 � 1 August 2006
and W is equal to I1, I2, or a product thereof. Once theeigenvalues ��1, �2� and the eigenvectors of the co-variance matrix C are determined, the transforma-tion matrix, which has the eigenvectors as its rows, isformed as follows:
T��1, �2� � ����1, �2� ��1, �2���1, �2� ���1, �2�. (5)
The signs of the scalars � and � may be either positiveor negative. The transformation matrix is formed insuch a way that the first eigenvector corresponds tothe largest eigenvalue. The principal component im-ages are then computed as follows:
PC1��1, �2�PC2��1, �2�� T��1, �2�I��1�
I��2�. (6)
By analogy with the transformation matrix of Tyo’sconventional55 PDI system, we consider PC1 theadaptive analog of the PS signal, and the PC2 theanalog of the PD or opponent signal. We surmise thatby analyzing the PC2 image of a scene, certain im-portant features, e.g., the detection of a target in thepresence of a standard background will be enhanced.
All the parameters in Eqs. (5) and (6) are functionsof the two polarizer angles, which in general, need notbe orthogonal. For the case of a uniform distributionof polarization ellipse orientations over the scene, Eq.(6) reduces to Eq. (3). Our goal is to identify a pair ofanalyzer angles and a pair of weighting coefficientsin Eq. (6) [i.e., the components of the eigenvectorsshown in Eq. (5)], which yield a PC2 image that op-timally enhances the visualization of novel targets ina specific background scene. The term “optimum”here is used by analogy with the approach previouslyused in the analyses of color vision and polarizationvision, as described in Section 3.A. In those analysesa formal assumption was made about the propertiesof the ensemble distribution of signals. In the presentanalysis, the role of the ensemble distribution isplayed by the polarization distribution of a specificbackground scene, and so we will put the adjective“optimum” in quotations, with the understandingthat it is our task to demonstrate empirically that themethod indeed yields a practical optimum separationof targets from the specific background.
C. Finding a Transformation Matrix to Adapt thePolarization-Difference Imaging System to aSpecific Background
To adapt the PDI system to a specific backgroundscene, we first obtain complete polarization informa-tion on the background. Specifically, we capture threeimages of the background scene for three orientationsof the polarizer and then compute the polarizationparameters that completely characterize the scenewith Eq. (2). From these results, we can synthesizeimages of the scene corresponding to any angle oforientation � of the polarizer with Eq. (1). It bearsemphasis that the derivation of images correspond-
ing to various polarizer orientations � from the initialset of three images is not linear.
The next step is to perform the principal componentsanalysis as described in Subsection 3.B for a wide se-lection of pairs of angles �1, �2, deriving the transfor-mation matrix TBG��1, �2� of Eq. (6) for the backgroundfor all pairs of angles. This yields a table or map ofthe derived polarization parameters over the 2D spaceof angles: i.e., ��1, �2�, ���1, �2�, �1��1, �2�, and�2��1, �2� for 0 �1, �2 180°. It is reasonable toexpect that the “optimum” pair of angles will be thatwith corresponding extreme eigenvalues. When the“optimum” pair of angles is chosen, then Eq. (9) isapplied to the target scene. Here we consider, in par-ticular, the following possible choices for the “opti-mum” pair ��1, �2� of polarizer orientations:
Case 1. The pair that maximizes the eigenvectorcomponent � (and it minimizes the magnitude of �).
Case 2. The pair that maximizes–minimizes theeigenvalues.
Case 3. The pair of orthogonal angles that has thepreferential angle of the background polarization asits bisector.
Consideration of case 3 will allow a comparison be-tween the conventional PD algorithm and the newadaptive algorithm here. In this case, as the prefer-ential angle of polarization, we understand the anglecorresponding to the modal value of the empiricaldistribution of polarization angles over the pixels cor-responding to the background scene. We initiallyfocus our investigation on cases 1 and 2, and thencompare the results with those obtained for case 3.Practically, the APDI system images the scene at twoconsecutive stages. The information obtained at thefirst stage is assigned to the background scene (whereno target is present), and the information obtainedat the second stage is assigned to the target scene(where the target and the background are present).
4. Validations of the Adaptive Polarization-DifferenceImaging Algorithm and the Selection of the OptimalSet of Parameters
To develop the APDI approach and examine its util-ity, we conducted several sets of experiments andsimulations. The first set of images was taken in ourlaboratory—a controlled environment with stable il-lumination conditions. The target was a specially de-signed object with known polarization properties, andthe background, as we will describe, was kept simple,while still exhibiting nonuniform polarization statis-tics. This enabled an accurate evaluation of the per-formance of APDI for the target detection. The secondset of images was taken with real-life targets undernatural illumination (sunlight).
A. Experimental Setup in the Laboratory
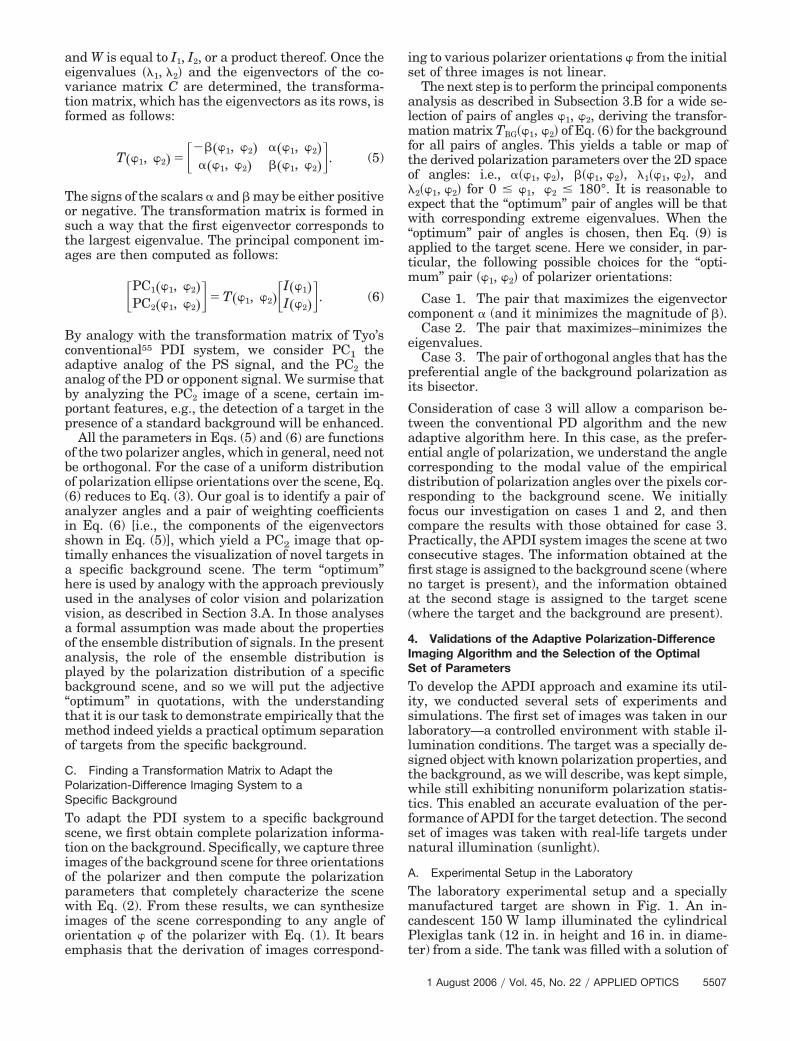
The laboratory experimental setup and a speciallymanufactured target are shown in Fig. 1. An in-candescent 150 W lamp illuminated the cylindricalPlexiglas tank (12 in. in height and 16 in. in diame-ter) from a side. The tank was filled with a solution of
1 August 2006 � Vol. 45, No. 22 � APPLIED OPTICS 5507
10 ml of whole milk diluted in approximately 27 l ofwater. The height of the water level in the tank was21 cm. This created a model of dispersive media (sucha method of simulation of scattering media was orig-inally used by Tyo et al.12). To produce Lambertian-type illumination, an opal glass diffuser was placedbetween the tank and the light source. The target wasan aluminum disk 5.1 cm in diameter. The targetsurface was sandblasted, and there were seven 1 cm2
square patches on it [see Fig. 1(b)]. The six outerpatches were abraded with emory paper in such away that they formed three orthogonally orientedpairs, i.e., 0° and 90°, 30°, and 120°, and 60° and 150°(with respect to the vertical axis). Patches with or-thogonal directions in the scratches are located dia-metrically opposite each other. The surface of thecenter patch was sandblasted in the same way as thebase plate surface. The patches were raised a fewmils from the base plate surface. The target was at-tached to the Plexiglas plate and faced up. The dis-tance between the surface of the water and the planeof the aluminum disk was 55 mm. The target wasobserved with an Olympus E-10 SLR digital camerawith a Sunpack 62 mm diameter glass polarizer at-tached in front of it. The images were taken sequen-tially for three different orientations of the polarizer,i.e., 0°, 45°, and 90° by manually rotating the polar-izer between shots. All the images in the laboratoryexperiment were taken with an exposure time of 1 sand the f number of the camera equal to 4.0. Duringsuch exposure time, any fluctuations due to 120 Hzoscillations in the light source are therefore averagedout. The total time required to capture all three im-ages was less than 10 s and was limited mainly by thetime required to save the raw image of the scene tothe camera’s flash memory. The same digital cameraand polarizer were used in our experiments in thenatural (uncontrolled) environment.
All computer analyses in this study have been doneusing MATLAB software package with its Image Pro-cessing Toolbox. The captured images were stored in
an Olympus raw format (ORF), which gave us rawimages of the scene, without the enhancements andmodifications that most commercial digital camerasperform internally to make pictures look better. TheOlympus E-10 has a single-chip color CCD with aRGGB Bayer primary color filter. For our computa-tions, we extracted the R, G, and B components ofthe RGB (red–green–blue) output directly from theRGGB Bayer filter pattern response, so that the im-age had only ¼ of the total number of active pixels ofthe CCD chip (the G image is an average value of thetwo G filter responses). PCA may be applied to anypair of polarization channels capturing images rep-resenting one of the components (either R, G, B, or V).The V (luminance) component of the hue–saturation–luminance (HSV) was computed by the MATLABImage Processing Toolbox and was, in fact, the max-imum value of the R, G, or B channel at every pixel.In this paper, we present results that were obtainedbased on the V component of the images.
The camera zoom was adjusted in such a way thatthe area occupied by the aluminum disk was only aportion of the target scene. To obtain the backgroundscene, we simply removed the aluminum disk fromthe scene while keeping all other experimental con-ditions, including the focusing distance of the camera,intact. The original image was cropped to 800 �600 pixels for efficiency in analysis. The polarizationstatistics of the background scene are shown in Fig. 2.The histograms of the polarization parameters reveala nonuniform distribution of the polarization statis-tics of the scene with the average degree of linearpolarization of about 25%.
Throughout this paper, we present grayscale im-ages with double precision, i.e., ranging from 0 to 1,where 0 corresponds to 0 and 1 corresponds to 255 of8-bit gray scale. To assess the intrinsic noise of thecamera, we made measurements with the cameralens covered by an opaque cap. The histograms ofthe standard background’s half-intensity distribution,i.e., IU are compared with the histogram of the dark
Fig. 1. (Color online) Layout ofthe experimental setup: (a) pho-tograph of the setup, (b) 7-patchtarget together with a U.S. dime(10-cent coin).
5508 APPLIED OPTICS � Vol. 45, No. 22 � 1 August 2006

noise image in Fig. 3. The mean value of the camera-noise image is 0.5 � 10�2 and standard deviation is7 � 10�4, while for the background intensity imagethose parameters were 0.95 � 10�1 and 0.22 � 10�1,respectively. Thus intrinsic camera noise is negligiblein the standard conditions of the experiments.
B. Application of the Adaptive Polarization-DifferenceImaging Algorithm to Images Obtained in aControlled Environment
Equation (1) was applied to images of the backgroundtaken at three orientations �� � 0°, 45°, and 90°� ofthe linear polarizer, and then images were generatedfor each angular orientation of the polarizer with-in the range from 0° to 180° with 5° steps (� and� � 180° are indistinguishable cases, since phase
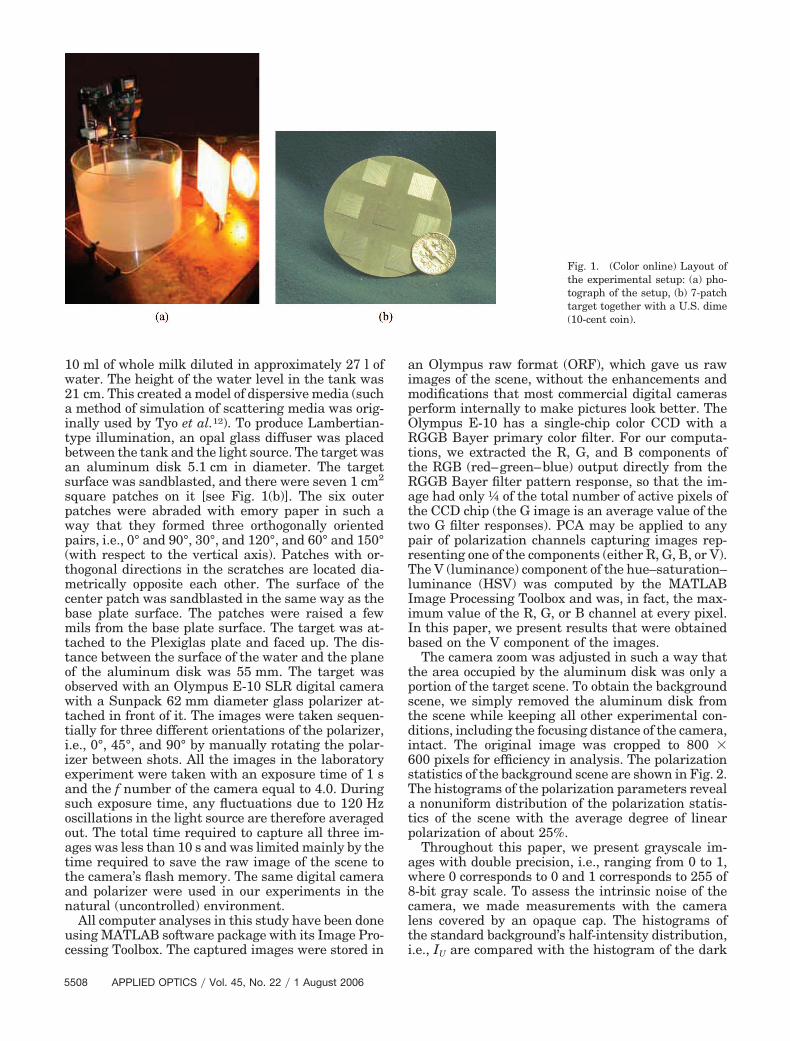
information is not encoded by the camera). For eachpair of images of the background corresponding to thepair of analyzer orientations ��1, �2�, we then ex-tracted a full set of polarization parameters usingPCA, i.e., � ��1, �2�, � � ���1, �2�, �1 � �1��1, �2�,and �2 � �2��1, �2� (Fig. 4).
The distributions of ��1, �2� and ���1, �2� havesimilar forms and in particular have their maximaand minima at the similar locations in the space��1, �2�. The eigenvalues �1 and �2 are symmetricfunctions of ��1, �2�, i.e., �i��1, �2� � �i��2, �1� fori � 1, 2. The maximum and the minimum values of �1
are located on the line of symmetry ��2 � �1�, whichrepresents the situation when the angle of the linearpolarizer for both source images is the same and isobviously not useful. Therefore case 2 reduces to the
Fig. 2. (Color online) Normalized histograms of polarization parameters of the background: (a) half of total pixel intensity IU; (b) degreeof linear polarization p; (c) angle of polarization �. Total number of pixels in the image was 800 � 600. Images of IU and p in the top roware stretched to cover an 8-bit gray-scale range. The reason we have systematic variations in the images of IU and p is that the light comesfrom the one side (top left corner).
Fig. 3. Normalized histogram of the (a) dark noise of the camera compared to the normalized histogram (b) of the background image.
1 August 2006 � Vol. 45, No. 22 � APPLIED OPTICS 5509
analysis of behavior of the smaller eigenvalue, i.e., �2.The value of �2 represents the variance in the PC2image, suggesting that more interesting informationcan be obtained from the PC2 image.
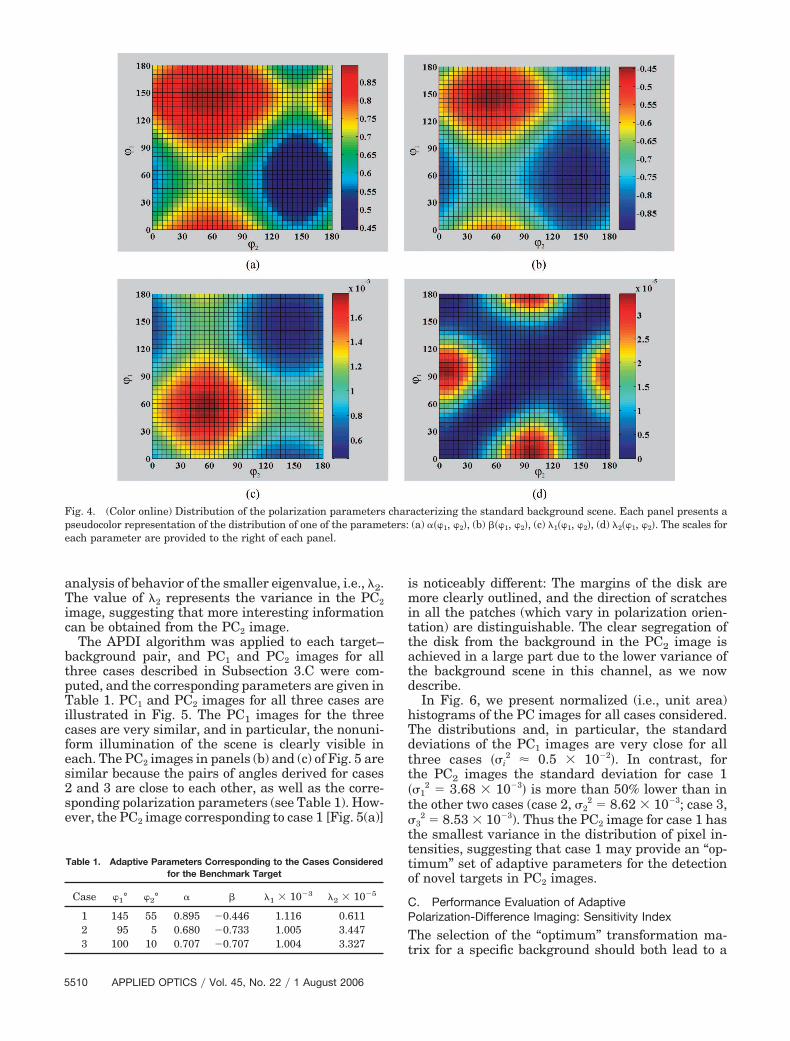
The APDI algorithm was applied to each target–background pair, and PC1 and PC2 images for allthree cases described in Subsection 3.C were com-puted, and the corresponding parameters are given inTable 1. PC1 and PC2 images for all three cases areillustrated in Fig. 5. The PC1 images for the threecases are very similar, and in particular, the nonuni-form illumination of the scene is clearly visible ineach. The PC2 images in panels (b) and (c) of Fig. 5 aresimilar because the pairs of angles derived for cases2 and 3 are close to each other, as well as the corre-sponding polarization parameters (see Table 1). How-ever, the PC2 image corresponding to case 1 [Fig. 5(a)]
is noticeably different: The margins of the disk aremore clearly outlined, and the direction of scratchesin all the patches (which vary in polarization orien-tation) are distinguishable. The clear segregation ofthe disk from the background in the PC2 image isachieved in a large part due to the lower variance ofthe background scene in this channel, as we nowdescribe.
In Fig. 6, we present normalized (i.e., unit area)histograms of the PC images for all cases considered.The distributions and, in particular, the standarddeviations of the PC1 images are very close for allthree cases ��i
2 0.5 � 10�2�. In contrast, forthe PC2 images the standard deviation for case 1��1
2 � 3.68 � 10�3� is more than 50% lower than inthe other two cases (case 2, �2
2 � 8.62 � 10�3; case 3,�3
2 � 8.53 � 10�3). Thus the PC2 image for case 1 hasthe smallest variance in the distribution of pixel in-tensities, suggesting that case 1 may provide an “op-timum” set of adaptive parameters for the detectionof novel targets in PC2 images.
C. Performance Evaluation of AdaptivePolarization-Difference Imaging: Sensitivity Index
The selection of the “optimum” transformation ma-trix for a specific background should both lead to a
Fig. 4. (Color online) Distribution of the polarization parameters characterizing the standard background scene. Each panel presents apseudocolor representation of the distribution of one of the parameters: (a) ��1, �2�, (b) ���1, �2�, (c) �1��1, �2�, (d) �2��1, �2�. The scales foreach parameter are provided to the right of each panel.
Table 1. Adaptive Parameters Corresponding to the Cases Consideredfor the Benchmark Target
Case �1° �2° � � �1 � 10�3 �2 � 10�5
1 145 55 0.895 �0.446 1.116 0.6112 95 5 0.680 �0.733 1.005 3.4473 100 10 0.707 �0.707 1.004 3.327
5510 APPLIED OPTICS � Vol. 45, No. 22 � 1 August 2006
minimum variance in the PC2 image of the back-ground, and enable targets with novel polarizationproperties to pop out in the PC2 channel. To avoidrelying only on the evaluation of the images of thetargets by human viewing, we employed an objectivenumerical evaluation: the sensitivity index calcula-tion. The sensitivity index is based on the signal-detection theory (SDT), which quantifies an observer’sability to discriminate a target from a background.56 In
SDT, an observation taken at some moment may arisefrom a noise-alone distribution, or from the signal-plus-noise distribution, with the means of these distri-butions separated by a certain amount da specified inunits of the standard deviations; da is called the sen-sitivity index. With an increase of da, the probabilityof successful target detection (a hit) will increase,since the overlap between the distributions de-creases, and the probability of a false alarm will also
Fig. 5. Principal components of the scene corresponding to three cases of interest. Left column shows PC1, and right column PC2 images,respectively. Panels (a)–(c) correspond to cases 1–3, respectively. All the images are linearly rescaled to exploit the 8-bit displayable range.The size of the images was 800 � 600 pixels.
1 August 2006 � Vol. 45, No. 22 � APPLIED OPTICS 5511

decrease. In our study as the signal-plus-noise distri-bution, we consider the scene distribution includingboth the target and the background, while the noise-alone distribution is taken as the scene distributionwithout the target present.
To estimate da empirically, we performed a seriesof measurements with 3 min separation betweeneach set. The experimental setup was as described inSubsection 4.A. We first captured 20 sets of images ofthe background alone, and then 20 sets of images of thebackground-plus-target scenes; each set of imagesis composed of three images collected at � � 0°,45°, and 90°, allowing the derivation of an equivalentimage for any polarizer orientation � and PCA, yield-ing PC1 and PC2 images for cases 1–3. An observationfor the SDT analysis was computed over two squareregions of 5 � 5 pixels, determined by the imagedlocation of special portions of the target (Fig. 7). Foreach of the 20 sets of images of the background andthe background-plus-target scenes, the average in-tensities of these regions in the PC1 and PC2 imageswere calculated. In summary, we ended up with 20
pairs of observations of the PC1 and PC2 valuesfor these two specific regions of the scene for each ofthe three cases. We then estimated the sensitivityindex as
da � � �T � �B
���T2 � �B
2��2�, (7)
where �B and �B2 are the mean and the variance of
the background scene in the specific region, and �T
and �T2 are the mean and the variance of the same
region when the target object is present.56 The valuesof the sensitivity index for PC2 images correspondingto the three cases (and the two target regions, res-pectively) were as follows: case 1, da � 1.703 andda � 1.687; case 2, da � 0.772 and da � 1.371; case 3,da � 1.419 and da � 0.908, respectively. Here, thefirst value of da in each case corresponds to the left-hand side target region, and the second value corre-sponds to the right-hand side region, (Fig. 7). Theparameters determined by case 1 clearly yield a su-perior detectability of the polarization targets thanthose determined by cases 2 and 3. Remarkably, thecase 1 PC2 channel outperforms the PC2 channel ofthe other two cases on both the left and the righttargets, even though each of these other channelsperforms much better on one of the two targets. Theseobservations suggest that the PC2 channel generatedwith the maximum components of eigenvectors �, ��correspond to the “optimum” pair of angles for thedetection of the polarization targets against a polar-ized background.
5. Target Detection Against a Nonuniformly PolarizedBackground Under Natural Illumination Conditions
In addition to the experiments in the laboratory, weperformed several experiments under natural illumi-nation conditions. As in the laboratory, every exper-iment session includes capturing three images of both
Fig. 6. Normalized histograms of (a) PC1 and (b) PC2 for all the cases shown as images in Fig. 5. The standard deviations of PCs for allthree cases considered are shown in the figures.
Fig. 7. Scheme of the specially created target where regions usedfor the sensitivity index calculation are marked in black. Dashedlines identify the direction of scratches in the specific patch. Theleft region is referred to as region one and the right region isreferred to as region two, respectively.
5512 APPLIED OPTICS � Vol. 45, No. 22 � 1 August 2006
the background scene and the target scene. Unlikethe laboratory experiments, where the backgroundwas a largely a uniform scene, in this situation thebackground is a relatively complex one, and containsseveral different objects.
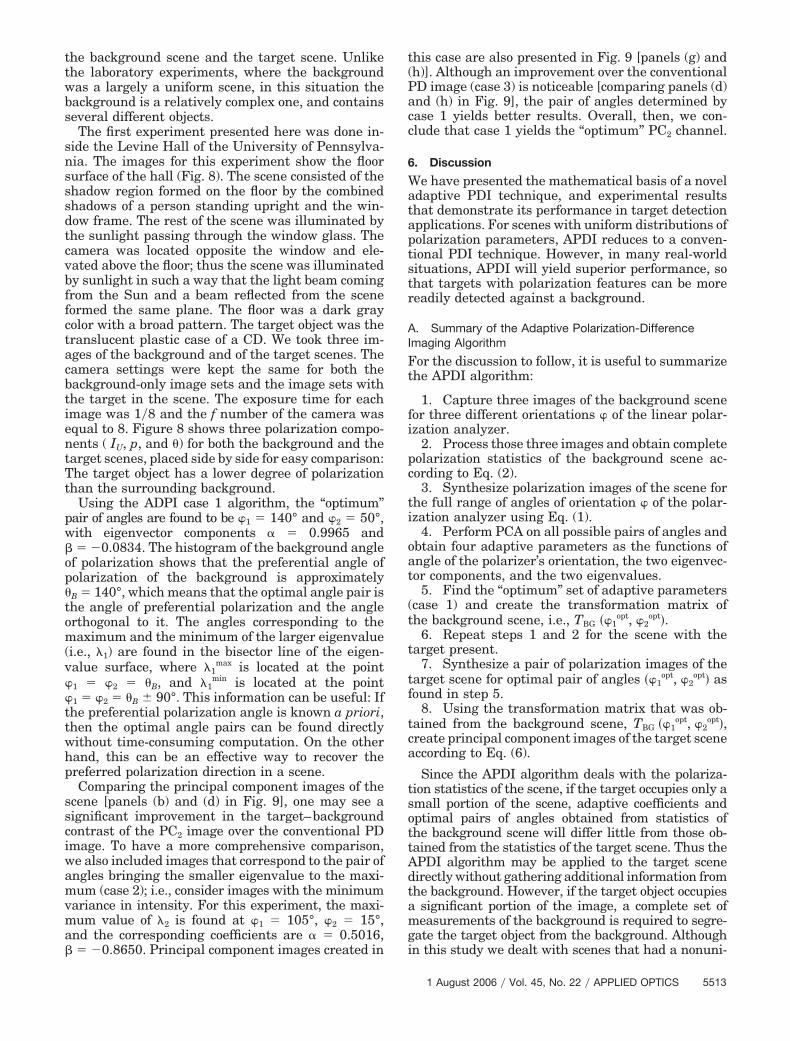
The first experiment presented here was done in-side the Levine Hall of the University of Pennsylva-nia. The images for this experiment show the floorsurface of the hall (Fig. 8). The scene consisted of theshadow region formed on the floor by the combinedshadows of a person standing upright and the win-dow frame. The rest of the scene was illuminated bythe sunlight passing through the window glass. Thecamera was located opposite the window and ele-vated above the floor; thus the scene was illuminatedby sunlight in such a way that the light beam comingfrom the Sun and a beam reflected from the sceneformed the same plane. The floor was a dark graycolor with a broad pattern. The target object was thetranslucent plastic case of a CD. We took three im-ages of the background and of the target scenes. Thecamera settings were kept the same for both thebackground-only image sets and the image sets withthe target in the scene. The exposure time for eachimage was 1�8 and the f number of the camera wasequal to 8. Figure 8 shows three polarization compo-nents ( IU, p, and �) for both the background and thetarget scenes, placed side by side for easy comparison:The target object has a lower degree of polarizationthan the surrounding background.
Using the ADPI case 1 algorithm, the “optimum”pair of angles are found to be �1 � 140° and �2 � 50°,with eigenvector components � 0.9965 and� � �0.0834. The histogram of the background angleof polarization shows that the preferential angle ofpolarization of the background is approximately�B � 140°, which means that the optimal angle pair isthe angle of preferential polarization and the angleorthogonal to it. The angles corresponding to themaximum and the minimum of the larger eigenvalue(i.e., �1) are found in the bisector line of the eigen-value surface, where �1
max is located at the point�1 � �2 � �B, and �1
min is located at the point�1 � �2 � �B 90°. This information can be useful: Ifthe preferential polarization angle is known a priori,then the optimal angle pairs can be found directlywithout time-consuming computation. On the otherhand, this can be an effective way to recover thepreferred polarization direction in a scene.
Comparing the principal component images of thescene [panels (b) and (d) in Fig. 9], one may see asignificant improvement in the target–backgroundcontrast of the PC2 image over the conventional PDimage. To have a more comprehensive comparison,we also included images that correspond to the pair ofangles bringing the smaller eigenvalue to the maxi-mum (case 2); i.e., consider images with the minimumvariance in intensity. For this experiment, the maxi-mum value of �2 is found at �1 � 105°, �2 � 15°,and the corresponding coefficients are � 0.5016,� � �0.8650. Principal component images created in
this case are also presented in Fig. 9 [panels (g) and(h)]. Although an improvement over the conventionalPD image (case 3) is noticeable [comparing panels (d)and (h) in Fig. 9], the pair of angles determined bycase 1 yields better results. Overall, then, we con-clude that case 1 yields the “optimum” PC2 channel.
6. Discussion
We have presented the mathematical basis of a noveladaptive PDI technique, and experimental resultsthat demonstrate its performance in target detectionapplications. For scenes with uniform distributions ofpolarization parameters, APDI reduces to a conven-tional PDI technique. However, in many real-worldsituations, APDI will yield superior performance, sothat targets with polarization features can be morereadily detected against a background.
A. Summary of the Adaptive Polarization-DifferenceImaging Algorithm
For the discussion to follow, it is useful to summarizethe APDI algorithm:
1. Capture three images of the background scenefor three different orientations � of the linear polar-ization analyzer.
2. Process those three images and obtain completepolarization statistics of the background scene ac-cording to Eq. (2).
3. Synthesize polarization images of the scene forthe full range of angles of orientation � of the polar-ization analyzer using Eq. (1).
4. Perform PCA on all possible pairs of angles andobtain four adaptive parameters as the functions ofangle of the polarizer’s orientation, the two eigenvec-tor components, and the two eigenvalues.
5. Find the “optimum” set of adaptive parameters(case 1) and create the transformation matrix ofthe background scene, i.e., TBG ��1
opt, �2opt�.
6. Repeat steps 1 and 2 for the scene with thetarget present.
7. Synthesize a pair of polarization images of thetarget scene for optimal pair of angles ��1
opt, �2opt� as
found in step 5.8. Using the transformation matrix that was ob-
tained from the background scene, TBG ��1opt, �2
opt�,create principal component images of the target sceneaccording to Eq. (6).
Since the APDI algorithm deals with the polariza-tion statistics of the scene, if the target occupies only asmall portion of the scene, adaptive coefficients andoptimal pairs of angles obtained from statistics ofthe background scene will differ little from those ob-tained from the statistics of the target scene. Thus theAPDI algorithm may be applied to the target scenedirectly without gathering additional information fromthe background. However, if the target object occupiesa significant portion of the image, a complete set ofmeasurements of the background is required to segre-gate the target object from the background. Althoughin this study we dealt with scenes that had a nonuni-
1 August 2006 � Vol. 45, No. 22 � APPLIED OPTICS 5513
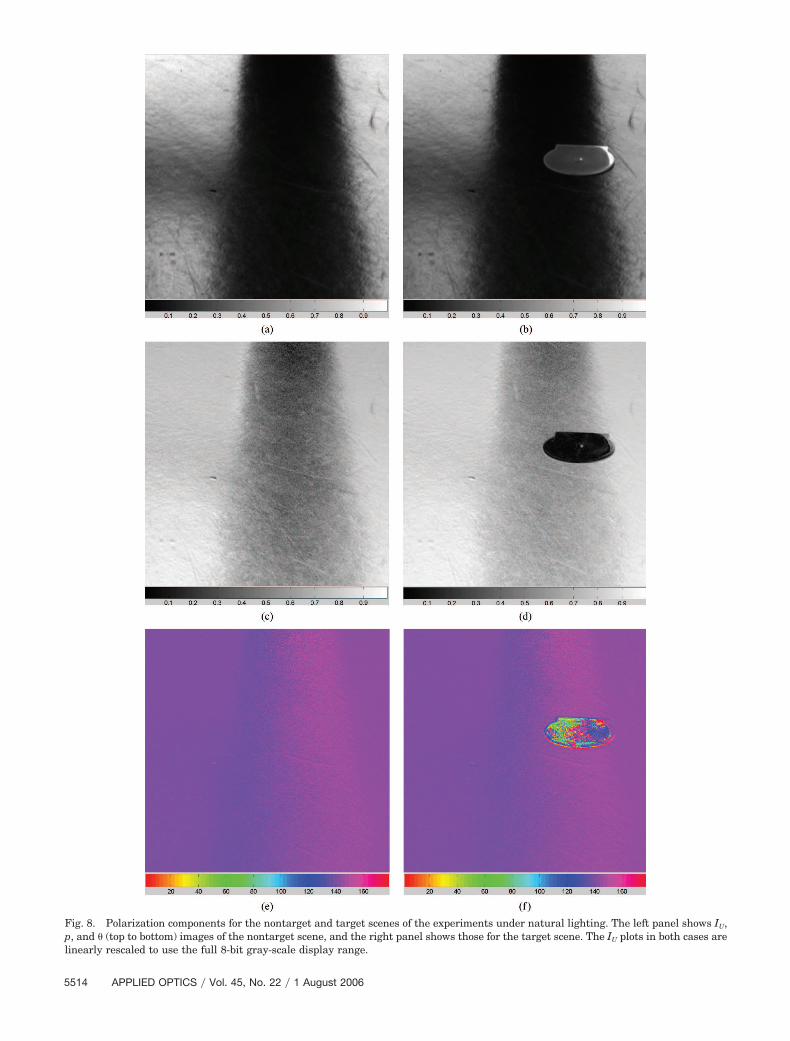
Fig. 8. Polarization components for the nontarget and target scenes of the experiments under natural lighting. The left panel shows IU,p, and � (top to bottom) images of the nontarget scene, and the right panel shows those for the target scene. The IU plots in both cases arelinearly rescaled to use the full 8-bit gray-scale display range.
5514 APPLIED OPTICS � Vol. 45, No. 22 � 1 August 2006
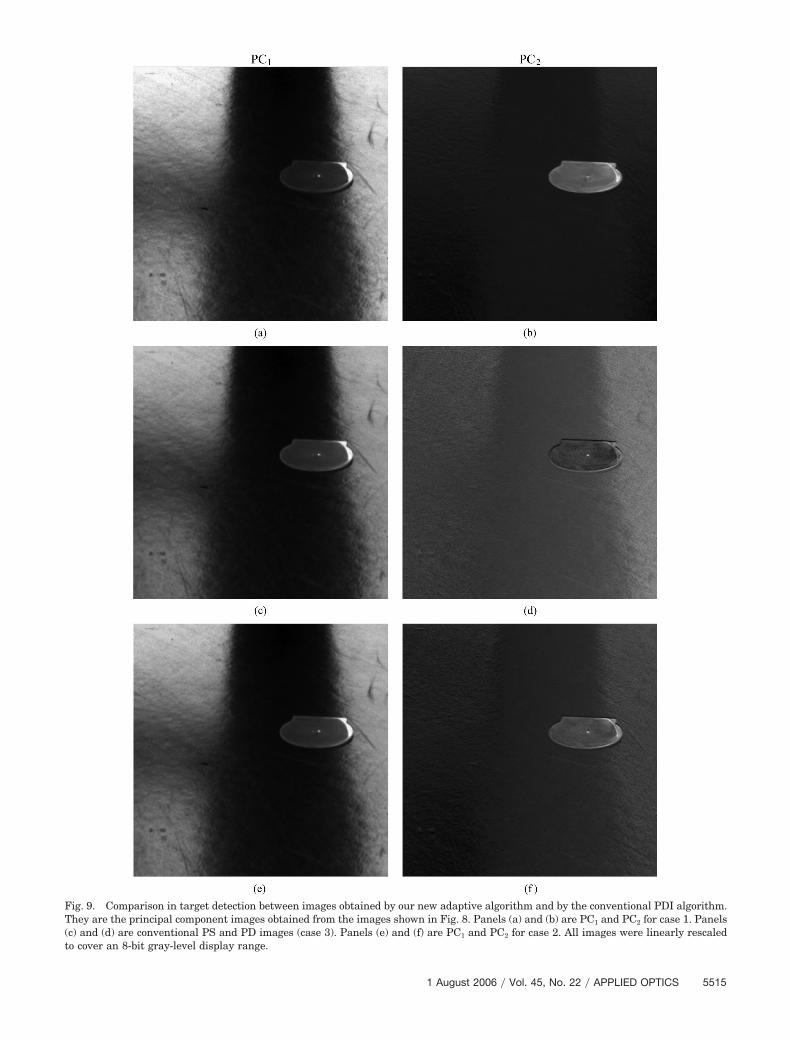
Fig. 9. Comparison in target detection between images obtained by our new adaptive algorithm and by the conventional PDI algorithm.They are the principal component images obtained from the images shown in Fig. 8. Panels (a) and (b) are PC1 and PC2 for case 1. Panels(c) and (d) are conventional PS and PD images (case 3). Panels (e) and (f) are PC1 and PC2 for case 2. All images were linearly rescaledto cover an 8-bit gray-level display range.
1 August 2006 � Vol. 45, No. 22 � APPLIED OPTICS 5515
form distribution in polarization parameters, the po-larization of the background had only one preferentialdirection of polarization. If the scene has two or moreregions of significant areas that have different anglesof preferential polarization, further improvementsmay be required, such as segmentation of the scenebased on its polarization statistics. Such results will bereported in a subsequent paper.
The APDI algorithm is relatively fast and does notrequire significant computer resources. For the com-puter workstation with a Pentium 4 550 processorand 2 GB of RAM, the total computational time wasabout 30 s using the code written in MATLAB. Re-writing the code using a less resource aggressive pro-gramming language, such as C�� will significantlyreduce the processing time. The time required forcapturing the images may also be reduced. Currently,in the laboratory, we employ a setup where the rota-tion of the polarizer is performed by a stepping motorand the entire process can be controlled from thecomputer. Use of this setup will automate the proce-dure of capturing images and their transition to thecomputer.
B. Potential Applications
Based on the computer simulations and experimentspresented above, we propose the APDI algorithm foruse in the detection of targets with polarization fea-tures. To speed the process, the initial pair of anglesmay be selected such that one of the angles is equal tothe preferential polarization angle of the backgroundand the other angle is chosen to be orthogonal to thepreferential angle. To ensure that the selected pair is“optimum,” the calculations of adaptive coefficientsfor a few pairs of polarizer orientations around theselected point should be performed. The pair with themaximum component value of the eigenvectors isthen used as the optimal pair. This approach may
significantly decrease the computational time, as isvery important for real-time applications.
C. Sensitivity of the Adaptive Polarization-DifferenceImaging Algorithm to the Rotation of the Pair of Angles
Since the APDI algorithm may be used as an effectivetool in a visual surveillance system,57 an importantissue in this application is: “How sensitive are theadaptive pairs to the rotation of the polarizationchannels?”
Assume that by applying the APDI algorithm, an“optimum” set of (case 1) parameters has been found.Consider, then, rotating this pair by a certain angleclockwise or counterclockwise. Would it be possible toobtain a PC2 image of the same quality? A simulationof the sensitivity of the APDI algorithm to such rota-tions was undertaken with the same set of experi-mental data reported above. The adaptive coefficientswere applied to the pair of images corresponding toangles rotated by 5° and 10° from the “optimum”(case 1) pair. The goal was to check in which case thealuminum disk is better able to be detected againstthe surrounding water solution. For each case, wecalculated the SNR, considering the output from thealuminum disk as the signal and the output from thesurrounding water solution as the noise or back-ground. Thus we derived
SNR � ��D � �W
�W�, (8)
where �D is the mean value of pixels belonging to thealuminum disk, �W, �W are the mean value and thestandard deviation of all the images except the alumi-num disk, respectively. Figure 10(a) shows SNR forPC1 and PC2 corresponding to optimal pair angles andfor pairs of angles rotated by 5° and 10° with respect tothe optimal pair. We note that the SNR for the optimal
Fig. 10. (a) SNR for PC1 and PC2. Here, the signal is the area of the aluminum disk, and the noise is the rest area of the correspondingPC. (b) Normalized histograms of the PC2 images with a shift from the optimal (case 1) pair of angles. Increasing variance in the PC2 imagewith rotation of the optimal pair of angles is shown.
5516 APPLIED OPTICS � Vol. 45, No. 22 � 1 August 2006
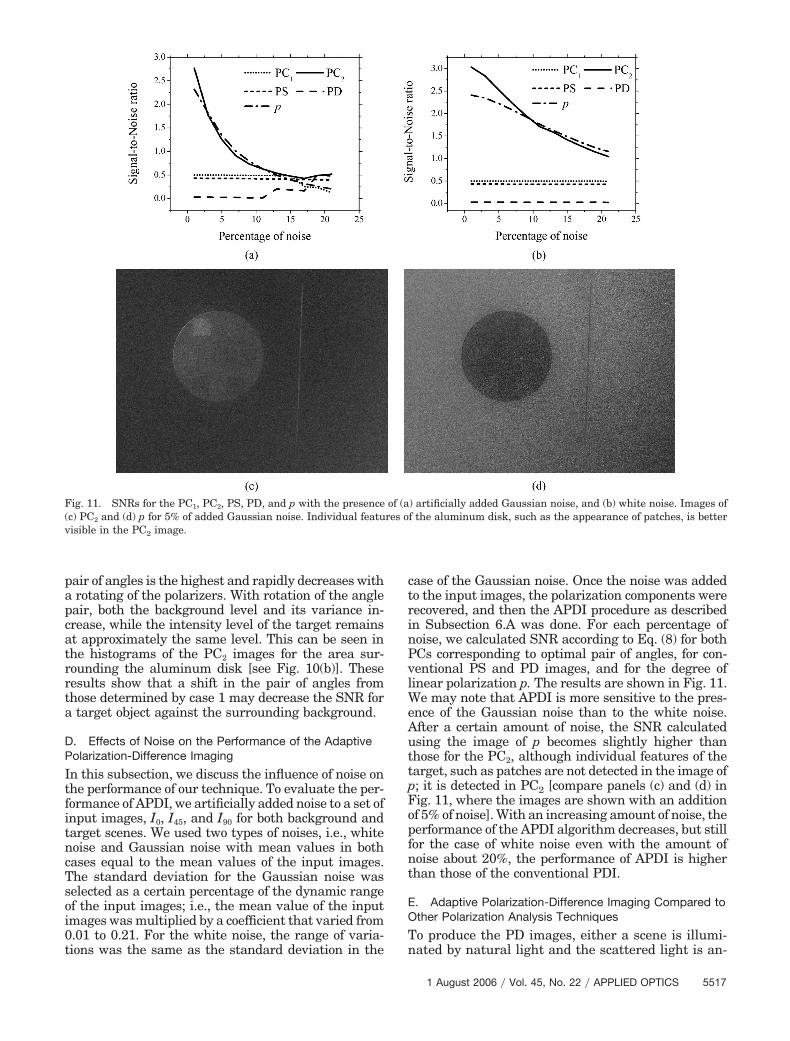
pair of angles is the highest and rapidly decreases witha rotating of the polarizers. With rotation of the anglepair, both the background level and its variance in-crease, while the intensity level of the target remainsat approximately the same level. This can be seen inthe histograms of the PC2 images for the area sur-rounding the aluminum disk [see Fig. 10(b)]. Theseresults show that a shift in the pair of angles fromthose determined by case 1 may decrease the SNR fora target object against the surrounding background.
D. Effects of Noise on the Performance of the AdaptivePolarization-Difference Imaging
In this subsection, we discuss the influence of noise onthe performance of our technique. To evaluate the per-formance of APDI, we artificially added noise to a set ofinput images, I0, I45, and I90 for both background andtarget scenes. We used two types of noises, i.e., whitenoise and Gaussian noise with mean values in bothcases equal to the mean values of the input images.The standard deviation for the Gaussian noise wasselected as a certain percentage of the dynamic rangeof the input images; i.e., the mean value of the inputimages was multiplied by a coefficient that varied from0.01 to 0.21. For the white noise, the range of varia-tions was the same as the standard deviation in the
case of the Gaussian noise. Once the noise was addedto the input images, the polarization components wererecovered, and then the APDI procedure as describedin Subsection 6.A was done. For each percentage ofnoise, we calculated SNR according to Eq. (8) for bothPCs corresponding to optimal pair of angles, for con-ventional PS and PD images, and for the degree oflinear polarization p. The results are shown in Fig. 11.We may note that APDI is more sensitive to the pres-ence of the Gaussian noise than to the white noise.After a certain amount of noise, the SNR calculatedusing the image of p becomes slightly higher thanthose for the PC2, although individual features of thetarget, such as patches are not detected in the image ofp; it is detected in PC2 [compare panels (c) and (d) inFig. 11, where the images are shown with an additionof 5% of noise]. With an increasing amount of noise, theperformance of the APDI algorithm decreases, but stillfor the case of white noise even with the amount ofnoise about 20%, the performance of APDI is higherthan those of the conventional PDI.
E. Adaptive Polarization-Difference Imaging Compared toOther Polarization Analysis Techniques
To produce the PD images, either a scene is illumi-nated by natural light and the scattered light is an-
Fig. 11. SNRs for the PC1, PC2, PS, PD, and p with the presence of (a) artificially added Gaussian noise, and (b) white noise. Images of(c) PC2 and (d) p for 5% of added Gaussian noise. Individual features of the aluminum disk, such as the appearance of patches, is bettervisible in the PC2 image.
1 August 2006 � Vol. 45, No. 22 � APPLIED OPTICS 5517
alyzed with the two orthogonal polarizers, or a sceneis illuminated with the two light sources of orthogo-nal polarizations. The idea of weighted subtraction ofthe two orthogonal components of the scene was firstintroduced by Walker et al.18 Their method involvessubtraction of a scaled image obtained at one polar-ization from the oppositely polarized image, andshows improvement over methods in which subtrac-tion is done without scaling. In this study, the imagecontrast was evaluated as a function of the scaling ofthe subtracted image, and the orthogonal polariza-tion axes were fixed. In contrast, the APDI algorithmpresented here adaptively selects two orientations ofthe polarizer, and also finds the “optimum” weightingof the resultant images by employing PCA to derivethe transformation matrix [Eqs. (5) and (6)], andthereby the resultant PC1 and PC2 images.
Several publications have discussed the nonlinearaspects of polarization imaging techniques (see, e.g.,Refs. 10, 11, and 13). The APDI algorithm proposedhere is essentially linear once PCA analysis has beenapplied to the background [derivation of the images ofthe background corresponding to a full set of orien-tations of the polarizer involves the nonlinear equa-tions, Eq. (1) and (2)]. An advantage of the APDImethod is that it is readily applicable to many differ-ent kinds of scenes in which polarization affects im-age intensities, including scenes that includespecular reflection (e.g., Fig. 9), underwater scenes(Fig. 5), and low-light scenes in which either naturalor artificial illumination is used. Moreover, APDI canbe implemented without using specialized equip-ment: only a digital camera and a polarizer are re-quired for capturing images.
It has been proposed that images of the degree of
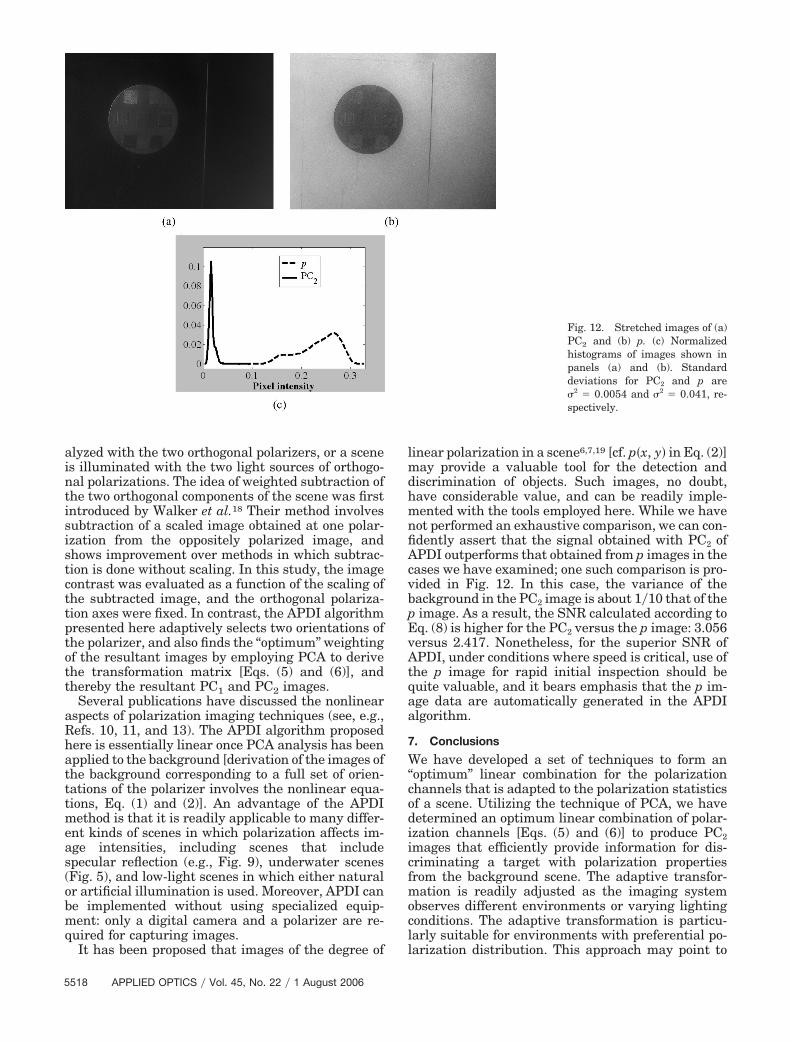
linear polarization in a scene6,7,19 [cf. p�x, y� in Eq. (2)]may provide a valuable tool for the detection anddiscrimination of objects. Such images, no doubt,have considerable value, and can be readily imple-mented with the tools employed here. While we havenot performed an exhaustive comparison, we can con-fidently assert that the signal obtained with PC2 ofAPDI outperforms that obtained from p images in thecases we have examined; one such comparison is pro-vided in Fig. 12. In this case, the variance of thebackground in the PC2 image is about 1�10 that of thep image. As a result, the SNR calculated according toEq. (8) is higher for the PC2 versus the p image: 3.056versus 2.417. Nonetheless, for the superior SNR ofAPDI, under conditions where speed is critical, use ofthe p image for rapid initial inspection should bequite valuable, and it bears emphasis that the p im-age data are automatically generated in the APDIalgorithm.
7. Conclusions
We have developed a set of techniques to form an“optimum” linear combination for the polarizationchannels that is adapted to the polarization statisticsof a scene. Utilizing the technique of PCA, we havedetermined an optimum linear combination of polar-ization channels [Eqs. (5) and (6)] to produce PC2images that efficiently provide information for dis-criminating a target with polarization propertiesfrom the background scene. The adaptive transfor-mation is readily adjusted as the imaging systemobserves different environments or varying lightingconditions. The adaptive transformation is particu-larly suitable for environments with preferential po-larization distribution. This approach may point to
Fig. 12. Stretched images of (a)PC2 and (b) p. (c) Normalizedhistograms of images shown inpanels (a) and (b). Standarddeviations for PC2 and p are�2 � 0.0054 and �2 � 0.041, re-spectively.
5518 APPLIED OPTICS � Vol. 45, No. 22 � 1 August 2006

an interesting research direction in the polarizationvision in certain aquatic species, which may havedetector arrays that act like an adaptive PC2 channel.A further utility of the APDI system is that once thepolarization information [see Eq. (2)] fully character-izing the background scene has been collected (e.g.,by a surveillance system that routinely takes imagesat three orientations of a linear polarizer), the imagedata may be processed off-line to yield an optimumpresentation of the polarization features of the scenethat may otherwise escape attention.
This work was supported by the U.S. Air ForceOffice of Scientific Research (AFOSR), through grantsF49620-01-1-0470, F49620-02-1-0140, FA9550-05-1-0052, and the Defense University Research Instru-mentation Program (DURIP) grant F49620-02-1-0241.We thank the anonymous reviewers for their usefulcomments.
References and Notes1. W. A. Shurcliff, Polarized Light, Production and Use (Harvard
U. Press, 1962).2. D. Goldstein, Polarized Light (Dekker, 2003).3. J. E. Solomon, “Polarization imaging,” Appl. Opt. 20, 1537–
1544 (1981).4. S. Demos and R. Alfano, “Optical polarization imaging,” Appl.
Opt. 36, 150–155 (1997).5. L. B. Wolff, “Polarization camera for computer vision with a
beam splitter,” J. Opt. Soc. Am. A 11, 2935–2945 (1994).6. L. B. Wolff, T. A. Mancini, P. Pouliquen, and A. G. Andreou,
“Liquid crystal polarization camera,” IEEE Trans. Rob.Autom. 13, 195–203 (1997).
7. L. B. Wolff and A. G. Andreou, “Polarization camera sensors,”Image Vis. Comput. 13, 497–510 (1995).
8. W. G. Egan, W. R. Johnson, and V. S. Whitehead, “Terrestrialpolarization imagery obtained from the Space Shuttle: charac-terization and interpretation,” Appl. Opt. 30, 435–442 (1991).
9. F. Goudail, P. Terrier, Y. Takakura, L. Bigue, F. Galland, andV. DeVlaminck, “Target detection with a liquid-crystal-basedpassive Stokes polarimeter,” Appl. Opt. 43, 274–282 (2004).
10. F. Goudail and P. Réfrégier, “Statistical algorithms for targetdetection in coherent active polarimetric images,” J. Opt. Soc.Am. A 18, 3049–3060 (2001).
11. F. Goudail and P. Réfrégier, “Statistical techniques for targetdetection in polarization diversity images,” Opt. Lett. 26,644–646 (2001).
12. J. S. Tyo, M. P. Rowe, E. N. Pugh, Jr., and N. Engheta, “Targetdetection in optically scattered media by polarization-difference imaging,” Appl. Opt. 35, 1855–1870 (1996).
13. Y. Y. Schechner, S. G. Narasimhan, and S. K. Nayar,“Polarization-based vision through haze,” Appl. Opt. 42,511–525 (2003).
14. Y. Y. Schechner and N. Karpel, “Clear underwater vision,”in Proceedings of IEEE Computer Society Conference onComputer Vision and Pattern Recognition (IEEE, 2004),pp. 536–543.
15. Y. Y. Schechner and N. Karpel, “Recovery of underwater vis-ibility and structure by polarization analysis,” IEEE J. Ocean.Eng. 30, 570–587 (2005).
16. Y. Y. Schechner, J. Shamir, and N. Kiryati, “Vision throughsemireflecting media: polarization analysis,” Opt. Lett. 24,1088–1090 (1999).
17. P. C. Y. Chang, J. C. Flitton, K. I. Hopcraft, E. Jakeman, D. L.Jordan, and J. G. Walker, “Improving visibility depth in pas-
sive underwater imaging by use of polarization,” Appl. Opt. 42,2794–2803 (2003).
18. J. G. Walker, P. C. Y. Chang, and K. I. Hopcraft, “Visibilitydepth improvement in active polarization imaging in scatter-ing media,” Appl. Opt. 39, 4933–4941 (2000).
19. H. Wang, C. Sun, Y. Wang, Y. Kiang, and C. Yang, “Determi-nation of the depth of a scattering target in a turbid mediumwith polarization discrimination of transmitted signals,” Opt.Lett. 28, 25–27 (2003).
20. S. G. Demos, W. B. Wang, and R. R. Alfano, “Imaging objectshidden in scattering media with fluorescence polarizationpreservation of contrast agents,” Appl. Opt. 37, 792–797(1998).
21. A. M. Wallace, B. Liang, E. Trucco, and J. Clark, “Improvingdepth acquisition using polarized light,” Int. J. Comput. Vis.32, 87–109 (2001).
22. R. Nothdurft and G. Yao, “Expression of target optical prop-erties in subsurface polarization-gated imaging,” Opt. Express13, 4185–4195 (2005).
23. H. Chen and L. B. Wolff, “Polarization phase-based method formaterial classification and object recognition in computer vi-sion,” in Proceedings of IEEE Computer Society Conferenceon Computer Vision and Pattern Recognition (IEEE, 1996),pp. 128–135.
24. L. B. Wolff, “Polarization-based material classification fromspecular reflection,” IEEE Trans. Pattern Anal. Mach. Intell.12, 1059–1071 (1990).
25. Although a human visual system does not have an ability tosense polarized light, the polarization still might be percepti-ble in the form of Haidinger’s brush.
26. K. von Frisch, “Die polarisation des himmelslichtes als orien-tierender faktor bei den tanzen der biener,” Experimentia 5,142–148 (1949).
27. K. von Frisch, Tanzsprache und Orientierung der Bienen(Springer-Verlag, 1965).
28. K. von Frisch, “Nobel lecture,” The Nobel Foundation, http://www.nobel.se/medicine/laureates/1973/frisch-lecture.pdf.
29. R. Wehner and G. D. Bernard, “Photoreceptor twist: a solutionto the false colour problem,” in Proceedings of the NationalAcademy of Sciences of the United States of America, 90,4132–4135 (1993).
30. R. Wehner, “Polarized-light navigation by insects,” Sci. Am.235, 106–114 (1976).
31. R. Wehner, “Neurobiology of polarization vision,” Trends Neu-rosci. 12, 353–359 (1989).
32. R. Wehner, “‘Matched filters’: neural models of the externalworld,” J. Comp. Physiol. A 161, 511–531 (1987).
33. I. Pomozi, G. Horváth, and R. Wehner, “How the clear-skyangle of polarization pattern continues underneath clouds:full-sky measurements and implications for animal orienta-tion,” J. Exp. Biol. 204, 2933–2942 (2001).
34. G. Horváth, J. Gál, T. Labhart, and R. Wehner, “Does reflec-tion polarization by plants influence colour perception in in-sects? Polarimetric measurements applied to a polarization-sensitive model retina of Papilio butterflies,” J. Exp. Biol. 205,3281–3298 (2002).
35. T. Labhart, “Polarization opponent interneurones in the insectvisual system,” Nature 331, 435–437 (1988).
36. C. W. Hawryshyn, “Polarization vision in fish,” Am. Sci. 80,164–175, 1992.
37. C. W. Hawryshyn, “Ultraviolet polarization vision in fishes:possible mechanisms for coding e-vector,” Philos. Trans. R.Soc. London, Ser. B 355, 1187–1190 (2000).
38. N. Shashar and T. W. Cronin, “Polarization contrast vision inoctopus,” J. Exp. Biol. 199, 999–1004 (1996).
39. T. W. Cronin and N. Shashar, “The linearly polarized lightfield in clear, tropical marine waters: spatial and temporal
1 August 2006 � Vol. 45, No. 22 � APPLIED OPTICS 5519

variation of light intensity, degree of polarization and e-vectorangle,” J. Exp. Biol. 204, 2461–2467 (2001).
40. N. Shashar, P. S. Rutledge, and T. W. Cronin, “Polarizationvision in cuttlefish: a concealed communication channel?” J.Exp. Biol. 199, 2077–2084 (1996).
41. T. W. Cronin, N. Shashar, R. L. Caldwell, J. Marshall, A. G.Cheroske, and T.-H. Chiou, “Polarization vision and its role inbiological signaling,” Integr. Comp. Biol. 43, 549–558 (2003).
42. M. P. Rowe, E. N. Pugh, Jr., J. S. Tyo, and N. Engheta,“Polarization-difference imaging: a biologically inspired tech-nique for observation through scattering media,” Opt. Lett. 20,608–610 (1995).
43. J. S. Tyo, E. N. Pugh, Jr., and N. Engheta, “Colorimetric rep-resentation for use with polarization-difference imaging of ob-jects in scattering media,” J. Opt. Soc. Am. A 15, 367–374(1998).
44. K. M. Yemelyanov, M. A. Lo, E. N. Pugh, Jr., and N. Engheta,“Display of polarization information by coherently movingdots,” Opt. Express 11, 1577–1584 (2003).
45. K. M. Yemelyanov, S.-S. Lin, W. Q. Luis, E. N. Pugh, Jr., andN. Engheta, “Bio-inspired display of polarization informationusing selected visual cues,” in Polarization Science and RemoteSensing, J. A. Shaw and J. S. Tyo, eds., Proc. SPIE 5158,71–84 (2003).
46. T. Labhart, “How polarization-sensitive interneurons performat low degrees of polarization,” J. Exp. Biol. 199, 1467–1475(1996).
47. T. Labhart and E. P. Meyer, Neural mechanisms in insectnavigation: polarization compass and odometer, Curr. Opin.Neurobiol. 12, 707–714 (2002).
48. M. Born and E. Wolf, Principles of Optics, 7th ed. (CambridgeU. Press, 2002).
49. W. B. Wang, S. G. Demos, J. Ali, and R. R. Alfano, “Imagingfluorescent objects embedded inside animal tissues usingpolarization-difference technique,” Optics Commun. 142,161–166 (1997).
50. C. K. Hamett and H. G. Craighead, “Liquid-crystal micropo-larizer array for polarization-difference imaging,” Appl. Opt.41, 1291–1296 (2002).
51. S. P. Schilders, X. S. Gan, and M. Gu, “Resolution improve-ment in microscopic imaging through turbid media based ondifferential polarization gating,” Appl. Opt. 37, 4300–4303(1998).
52. J. S. Tyo, “Optimum linear combination strategy for anN-channel polarization-sensitive imaging or vision system,” J.Opt. Soc. Am. A 15, 359–366 (1998).
53. G. Buchsbaum and A. Gottschalk, “Trichromacy, opponent col-ors coding and optimum color information transmission in theretina,” Proc. R. Soc. London, Ser. B 220, 89–113 (1983).
54. I. T. Jolliffe, Principal Component Analysis (Springer-Verlag,1986).
55. As regular or conventional PDI in this paper, we always referto the technique introduced in Ref. 42.
56. N. A. Macmillan and C. D. Creelman, Detection Theory: AUser’s Guide (Cambridge U. Press, 1991).
57. S.-S. Lin, K. M. Yemelyanov, E. N. Pugh, Jr., and N. Engheta,“Polarization enhanced visual surveillance techniques,” inProceedings of IEEE International Conference on Networking,Sensing, and Control (IEEE, 2004), pp. 216–221.
5520 APPLIED OPTICS � Vol. 45, No. 22 � 1 August 2006

Separation and contrast enhancement of overlapping cast shadow components using
polarization Shih-Schön Lin, Konstantin M. Yemelyanov
Electrical and Systems Engineering Department, University of Pennsylvania, 220 South 33rd Street Moore 203 Philadelphia, PA 19104-6390, USA
[email protected], [email protected].
Edward N. Pugh, Jr. F. M. Kirby Center for Molecular Ophthalmology and Institute of Neurological Sciences, University of Pennsylvania
422 Curie Boulevard, Philadelphia, PA 19104-6390, USA [email protected]
Nader Engheta Electrical and Systems Engineering Department and Institute of Neurological Sciences, University of Pennsylvania,
Philadelphia, PA 19104, USA [email protected]
Abstract: Shadow is an inseparable aspect of all natural scenes. When there are multiple light sources or multiple reflections several different shadows may overlap at the same location and create complicated patterns. Shadows are a potentially good source of information about a scene if the shadow regions can be properly identified and segmented. However, shadow region identification and segmentation is a difficult task and improperly identified shadows often interfere with machine vision tasks like object recognition and tracking. We propose here a new shadow separation and contrast enhancement method based on the polarization of light. Polarization information of the scene captured by our polarization-sensitive camera is shown to separate shadows from different light sources effectively. Such shadow separation is almost impossible to realize with conventional, polarization-insensitive imaging.
©2006 Optical Society of America
OCIS Codes: (150.0150) Machine vision; (110.0100) Image processing; (260.5430) Polarization; (230.5440) Polarization-sensitive devices
References and Links
1. M. Nagao, T. Matsutyama, and Y. Ikeda, "Region extraction and shape analysis in aerial photographs," Comput. Vis. Graph. Image Process. 10, 195-223 (1979).
2. R. Gershon, A. D. Jepson, and J. K. Tsotsos, "Ambient illumination and the determination of material changes," J. Opt. Soc. Am. A 3, 1700-1707 (1986).
3. R. Irvin and D. Mckeown, "Methods for exploiting the relationship between buildings and their shadows in aerial imagery," IEEE Trans. on Syst. Man..Cybern. 19, 1564-1575 (1989).
4. J. M. Scanlan, D. M. Chabries, and R. W. Christiansen, "A Shadow Detection and Removal Algorithm for 2D Images," in Proc. of Int. Conf. on Acoustics, Speech, and Signal Processing (1990) pp. 2057-2060.
5. Y. Liow and T. Pavlidis, "Use of shadows for extracting buildings in aerial images," Comput. Vis. Graph. Image Process. 49, 242-277 (1991).
6. C. Wang, L. Huang, and A. Rosenfeld, "Detecting clouds and cloud shadows on aerial photographs," Pattern. Recogn. Lett. 12, 55-64 (1991).
7. D. Koller, K. Danilidis, and H.-H. Nagel, "Model-based object tracking in monocular image sequences of road traffic scenes," Int. J. Comput. Vis. 10, 257-281 (1993).
8. C. Jiang and M. O. Ward, "Shadow segmentation and classification in a constrained environment," CVGIP: Image Understanding 59, 213-225 (1994).
#69990 - $15.00 USD Received 14 April 2006; revised 29 May 2006; accepted 30 May 2006
(C) 2006 OSA 7 August 2006 / Vol. 14, No. 16 / OPTICS EXPRESS 7099

9. G. Funka-Lea and R. Bajcsy, "Combining color and geometry for the active visual recognition of shadows," in Proc. Int. Conf. on Computer Vision (1995) pp. 203-209.
10. J. Stauder, R. Melch, and J. Ostermann, "Detection of moving cast shadows for object segmentation," IEEE Trans. Multimedia 1, 65-77 (1999).
11. J. A. Marchant and C. M. Onyango, "Shadow-invariant classification for scenes illuminated by daylight," J. Opt. Soc. Am. A 17, 1952-1961 (2000).
12. G. Finlayson, S. Hordley, and M. S. Drew, "Removing shadows from images," in ECCV (2002) pp. 823-836. 13. R. Cucchiara, C. Grana, M. Piccardi, and A. Prati, "Detecting moving objects, Ghosts, and shadows in video
streams," IEEE Trans. Pattern Anal. Mach. Intell. 25, 1337-1342 (2003). 14. T. Gevers and H. Stokman, "Classifying color edges in video into shadow-geometry, highlight, or material
transitions," IEEE Trans. Multimedia 5, 237-243 (2003). 15. A. Prati, I. Mikic, M. M. Trivedi, and R. Cucchiara, "Detecting Moving Shadows: Algorithms and Evaluation,"
IEEE Trans. Pattern Anal. Mach. Intell. 25, 918-923 (2003). 16. I. Sato, Y. Sato, and K. Ikeuchi, "Illumination from shadows," IEEE Trans. Pattern Anal. Mach. Intell. 25, 290-
300 (2003). 17. S. Nadimi and B. Bhanu, "Physical models for moving shadow and object detection in video," IEEE Trans.
Pattern Anal. Mach. Intell. 26, 1079-1087 (2004). 18. E. Salvador, A. Cavallaro, and T. Ebrahimi, "Cast shadow segmentation using invariant color features,"
Comput. Vis. Image Understand. 95, 238-259 (2004). 19. J. M. Wang, Y. C. Chung, C. L. Chang, and S. W. Chen, "Shadow Detection and Removal for Traffic Images,"
in Proc. 2004 IEEE Int. Conf. on Networking, Sensing and Control (IEEE Syst. Man Cybern. Society, Taipei, Taiwan, 2004) pp. 649-654.
20. K. Frisch, "Die polarisation des himmelslichtes als orientierender faktor bei den tanzen der bienen," Experientia 5, 142-148 (1949).
21. R. Wehner, "Polarized-light navigation by insects," Scientific American 235, 106-114 (1976). 22. R. Schwind, "Zonation of the optical environment and zonation in the rhabdom structure within the eye of the
backswimmer, Notenecta glauca," Cell and Tissue Research 232, 53-63 (1983). 23. G. Horváth, "Reflection polarization patterns at flat water surfaces and their relevance for insect polarization
vision," J. Theor. Biol. 175, 27-37 (1995). 24. M. P. Rowe, E. N. Jr. Pugh, and N. Engheta, "Polarization-difference imaging: a biologically inspired technique
for observation through scattering media," Opt. Lett. 20, 608-610 (1995). 25. J. S. Tyo, M. P. Rowe, E. N. Jr. Pugh, and N. Engheta, "Target detection in optically scatter media by
polarization-difference imaging," Appl. Opt. 35, 1855-1870 (1996). 26. S.-S. Lin, K. M. Yemelyanov, E. N. Jr. Pugh, and N. Engheta, "Polarization Enhanced Visual Surveillance
Techniques," in Proc. IEEE Int. Conf. on Networking, Sensing and Control (IEEE Syst. Man. .Cybern. Society, Taipei, Taiwan, 2004), 1, pp. 216-221.
27. S.-S. Lin, K. M. Yemelyanov, E. N. Jr. Pugh, and N. Engheta, "Polarization- and specular-reflection-based, non-contact latent fingerprint imaging and lifting," J. Opt. Soc. Am. A (to be published).
28. K. M. Yemelyanov, S.-S. Lin, E. N. Jr. Pugh, and N. Engheta, "Adaptive Algorithms for 2-channel polarization sensing under various polarization statistics with non-uniform distributions," Appl. Opt. (to be published).
29. J. S. Tyo, E. N. Jr. Pugh, and N. Engheta, "Colorimetric representation for use with polarization-difference imaging of objects in scattering media," J. Opt. Soc. Am. A 15, 367-374 (1998).
30. K. M. Yemelyanov, M. A. Lo, E. N. Jr. Pugh, and N. Engheta, "Display of polarization information by coherently moving dots," Opt. Express 11, 1577-1584 (2003).
31. W. G. Egan, "Dark-target retroreflection increase," in Polarization: Measurement, Analysis, and Remote Sensing II, D. H. Goldstein and D. B. Chenault, eds., Proc. SPIE, 3754, 218-225 (1999).
32. M. J. Duggin, "Imaging polarimetry in scene element discrimination," in Polarization: Measurement, Analysis, and Remote Sensing II, D. H. Goldstein and D. B. Chenault, eds., Proc SPIE 3754, 108-117 (1999).
33. D. H. Goldstein, D. B. Chenault, and J. L. Pezzaniti, "Polarimetric characterization of Spectralon," in Polarization: Measurement, Analysis, and Remote Sensing II, D. H. Goldstein and D. B. Chenault, eds., Proc. SPIE 3754, 126-136 (1999).
34. E. Hecht, Optics (Addison Wesley Longman, Inc., Reading, MA, USA 1998). 35. K. M. Yemelyanov, S.-S. Lin, W. Q. Luis, E. N. Jr. Pugh, and N. Engheta, "Bio-inspired display of polarization
information using selected visual cues," in Polarization Science and Remote Sensing, J. A. Shaw and J. S. Tyo eds. Proc. SPIE, 5158, 71-84 (2003).
36. A. P. Pentland, "Finding the illuminant direction," J. Opt. Soc. Am. 72, 448-455 (1982). 37. Y. Zhang and Y. Yang, "Illuminant direction determination for multiple light sources," in Proc. CVPR (IEEE,
2000) pp. 269-276. 38. J. Pinel and H. Nicolas, "Estimation 2d illuminant direction and shadow segmentation in natural video
sequences," in Proc. VLBV (2001) pp. 197-202. 39. M. W. Powell, S. Sarkar, and D. Goldgof, "A simple strategy for calibrating the geometry of light sources,"
IEEE Trans. Pattern Anal. Mach. Intell. 23, 1022-1027 (2001). ___________________________________________________________________________
#69990 - $15.00 USD Received 14 April 2006; revised 29 May 2006; accepted 30 May 2006
(C) 2006 OSA 7 August 2006 / Vol. 14, No. 16 / OPTICS EXPRESS 7100
1. Introduction
Shadows are formed whenever an occlusion partially blocks the illumination of a surface or object by a light source. With the exception of the ambient light, which is assumed to be omnidirectional, light sources illuminate surfaces from only one specific direction. In addition to classification by the source direction, shadows are further classified into “self” and “cast”. A “self” shadow refers to the regions of an object not directly illuminated by a light source due to its surface orientation, whereas “cast” shadow refers to a region not illuminated by a source due to occlusion by other objects. Shadowed regions usually appear darker than the lit regions and their color properties (e.g., hue and saturation) can also appear different than the directly illuminated regions. Such differences in intensity and color create patterns and boundaries/edges that often confuse human observers or machine vision algorithms which attempt to segment scenes and identify objects using these cues. For this reason many techniques have been developed to identify, segment, and remove shadows from an image or a video sequence[1-19]. However, all previously published methods use only two aspects of light, its intensity and/or spectral (“color”) distribution as information in shadow segmentation, though; in some cases these are combined with temporal and geometric information available. It appears that a third fundamental property of light, its polarization, has not heretofore been used for the purpose of shadow segmentation. Furthermore, most existing shadow segmentation algorithms assume a relatively simple shadow model: an area of a scene is classified either as shadow or non-shadow. In fact it is possible for a specific region of a scene to be both shadow for one source and illuminated simultaneously by another source or sources, as explained below, and polarization information can assist in “parsing” such complications in scene segmentation.
Polarization is an intrinsic property of light. Light from the dominant natural source, the sun, is not polarized but light scattered from small particles in the sky and most light reflected or scattered from object surfaces is partially polarized. The unaided human eye and most machine vision cameras are “blind” to polarization, but some animal species can detect and utilize polarization information and use it for a variety of purposes, including navigation and object recognition [20-23]. Inspired by biological polarization vision, our group has developed polarization sensitive cameras and processing methods for the detection of targets in scattering media, detecting latent fingerprints and enhancing surveillance [24-28]. We have also developed methods for displaying polarization information effectively to human observers [29,30]. It has been reported that polarization increase in dark surface area [31], and that polarization can be used to enhance details in shadow [32]. It has also been reported that polarization increases with increasing incident light angle [33]. In this investigation we show that complex overlapping cast shadows that are almost impossible to distinguish in images generated with only intensity and color information can be readily segmented from each other in images generated from the polarization parameters of a scene.
#69990 - $15.00 USD Received 14 April 2006; revised 29 May 2006; accepted 30 May 2006
(C) 2006 OSA 7 August 2006 / Vol. 14, No. 16 / OPTICS EXPRESS 7101

2. Polarization and Shadow
Specular reflectionDiffuse reflection
Unpolarized incident light
Φin
Φra
Φre
(a) (b)
Fig. 1. (a) General macroscopic reflection model (b) Polarization of light resulting from specular reflection from a dielectric surface.
According to the generally accepted macroscopic description of the interaction of light with a surface, reflected light can be subdivided into specular and diffuse components [Fig. 1(a)]. The ratio of energy carried by the diffuse and specular components depends on the angle of incidence and the material properties of the surface. The diffusely reflected components often undergo multiple random reflections microscopically, so statistically they tend to be unpolarized. In contrast, the specularly reflected component is usually at least partially polarized, with the polarization direction (dominant axis of E-field oscillation) parallel to the local tangent plane of the surface [Fig. 1(b)]. These physical phenomena can be formalized through appropriate application of Fresnel’s analysis and Eq. [34].
In addition to the scattering by surfaces, another important natural source of polarization is the scattering of light by the atmosphere of the earth. The polarization of sun light by the air particles can be explained by the theory of Rayleigh scattering [34], which describes the particles as electric dipoles: because oscillating dipoles do not radiate in the direction of oscillation, a polarization-sensitive observer will see the dome of the sky to exhibits polarization pattern that depends on the location of the sun. Since pioneering investigations of von Frisch it has been well established that many insects can avail themselves of this polarization for navigation [20-23]. Such polarization has consequences for the segmentation of shadows: thus, as we will show below, an area that is inside a shadow cast by direct sunlight, but which is lit by the polarized ambient sky light will show a distinctive polarization, whereas an area that is inside both the shadow cast by sunlight and the shadow cast by skylight will show no polarization at all.
Because most imaging devices integrate light energy over a time epoch that is long relative to the oscillation period (fs), phase information is not recorded. With the phase information lost, when a linear polarization analyzer is placed in front of the camera, the measured intensity I at a specific image location or pixel, as a function of the angle of orientation φ of the polarization analyzer is given by
#69990 - $15.00 USD Received 14 April 2006; revised 29 May 2006; accepted 30 May 2006
(C) 2006 OSA 7 August 2006 / Vol. 14, No. 16 / OPTICS EXPRESS 7102
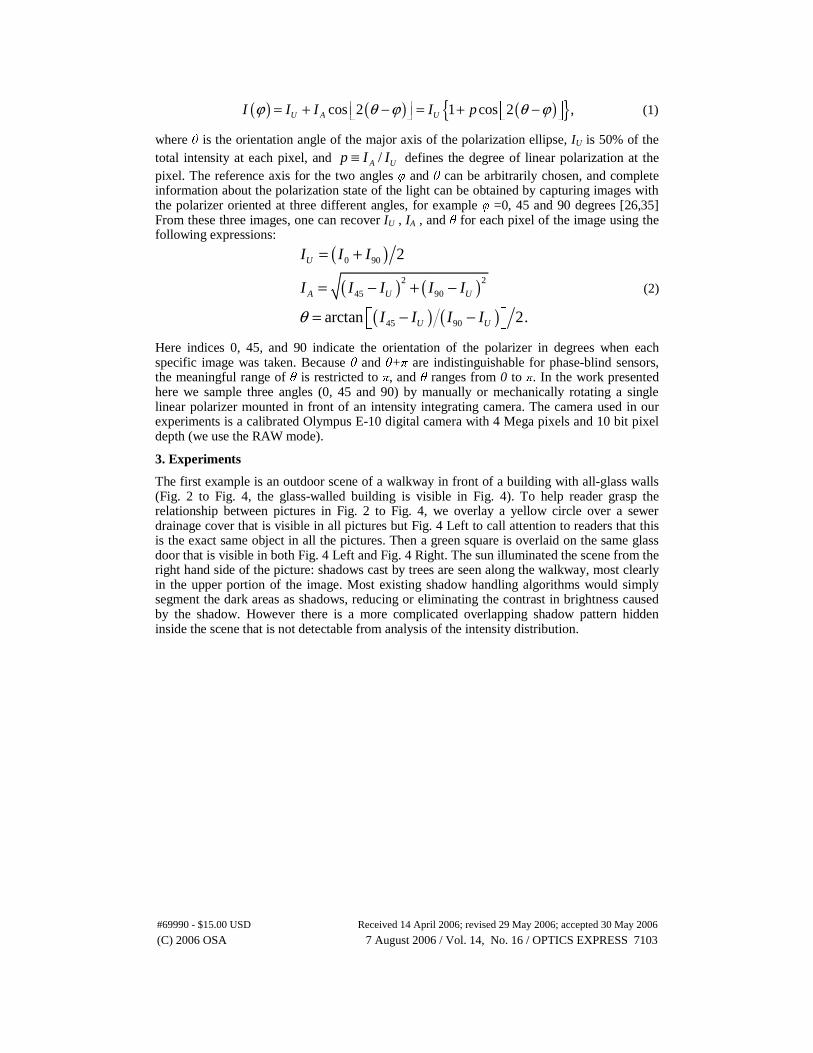
( ) ( ) ( ){ }cos 2 1 cos 2 ,U A UI I I I pϕ θ ϕ θ ϕ= + ⎡ − ⎤ = + ⎡ − ⎤⎣ ⎦ ⎣ ⎦ (1)
where θ is the orientation angle of the major axis of the polarization ellipse, IU is 50% of the total intensity at each pixel, and /A Up I I≡ defines the degree of linear polarization at the pixel. The reference axis for the two angles φ and θ can be arbitrarily chosen, and complete information about the polarization state of the light can be obtained by capturing images with the polarizer oriented at three different angles, for example φ =0, 45 and 90 degrees [26,35] From these three images, one can recover IU , IA , and θ for each pixel of the image using the following expressions:
( )( ) ( )
( ) ( )
0 90
2 2
45 90
45 90
2
arctan 2.
U
A U U
U U
I I I
I I I I I
I I I Iθ
= +
= − + −
= − −⎡ ⎤⎣ ⎦
(2)
Here indices 0, 45, and 90 indicate the orientation of the polarizer in degrees when each specific image was taken. Because θ and θ+π are indistinguishable for phase-blind sensors, the meaningful range of θ is restricted to π, and θ ranges from 0 to π. In the work presented here we sample three angles (0, 45 and 90) by manually or mechanically rotating a single linear polarizer mounted in front of an intensity integrating camera. The camera used in our experiments is a calibrated Olympus E-10 digital camera with 4 Mega pixels and 10 bit pixel depth (we use the RAW mode).
3. Experiments
The first example is an outdoor scene of a walkway in front of a building with all-glass walls (Fig. 2 to Fig. 4, the glass-walled building is visible in Fig. 4). To help reader grasp the relationship between pictures in Fig. 2 to Fig. 4, we overlay a yellow circle over a sewer drainage cover that is visible in all pictures but Fig. 4 Left to call attention to readers that this is the exact same object in all the pictures. Then a green square is overlaid on the same glass door that is visible in both Fig. 4 Left and Fig. 4 Right. The sun illuminated the scene from the right hand side of the picture: shadows cast by trees are seen along the walkway, most clearly in the upper portion of the image. Most existing shadow handling algorithms would simply segment the dark areas as shadows, reducing or eliminating the contrast in brightness caused by the shadow. However there is a more complicated overlapping shadow pattern hidden inside the scene that is not detectable from analysis of the intensity distribution.
#69990 - $15.00 USD Received 14 April 2006; revised 29 May 2006; accepted 30 May 2006
(C) 2006 OSA 7 August 2006 / Vol. 14, No. 16 / OPTICS EXPRESS 7103

Fig. 2. Left: “Intensity-only” image of an outdoor scene with light and shadow. Right: “Degree-of-polarization” image of the same scene; this image plots the quantity p = IA/IU [see Eq. (2)], extracted for each image pixel. Hidden patterns of shadows within shadows are clearly visible in high contrast. The glass-walled building is shown in Fig. 4. The yellow circle points out the same sewage drain cover that is visible in all related pictures up to Fig. 4 except Fig. 4 Left to help orientation.
In this scene the glass-wall building to the left rear side of the scene reflected sunlight from its glass panels, but not from the thinner frames around each piece of glass. The reflected light was partially polarized, and the reflection pattern cast on the scene overlapped with the shadow pattern cast by the direct sunlight. The light reflected by the glass was weaker than the direct sunlight, and the pattern it creates is essentially invisible in the “intensity-only” image at left. However, when our polarization-sensitive camera was used to extract the “degree of polarization” image, the hidden pattern of overlapping shadow was revealed (Fig. 2, right panel). The area that was lit neither by direct sunlight, nor by the reflected light from the glass, is both dark and unpolarized, and thus appears dark in both images. These are the cast pattern of the glass frames of the glass-wall building to the left of the picture. The areas that were not lit by direct sunlight – and thus appear as shadows in the intensity-only image – but which were illuminated by the partially polarized reflected light from the glass-wall building, exhibit strong polarization. The degree-of-polarization image normalizes the polarization signal with respect to the total intensity [Eq. (2)], so these areas show up as a bright pattern in the degree-of polarization-image (Fig. 2, right). To establish that this pattern is unique to the polarization analysis, and not hidden in the intensity-only image due to low contrast in the shadow area, we performed linear contrast enhancement, followed by gamma correction of 0.5 to both images of Fig. 2: from the results (Fig. 3) it is clear that the shadow patterns are only revealed in the degree-of-polarization image. To further document the nature of the sunlight and glass wall sources to the shadows revealed by polarization analysis we provide images of the glass-wall and frames of the building (Fig. 4, left), and of the walkway when the bright direct sunlight is blocked (Fig. 4, right). Note that pictures in Fig. 4 are taken with the camera at about the same position and general view direction as when the pictures in Fig. 2 and Fig. 3 were taken. The only difference is that in Fig. 4 the camera zooms out and points more upward in order to put the tall glass-walled building into view. In sum, the patterns revealed in the degree-of-polarization image are indeed caused by shadows created by polarized light reflected from the glass source.
#69990 - $15.00 USD Received 14 April 2006; revised 29 May 2006; accepted 30 May 2006
(C) 2006 OSA 7 August 2006 / Vol. 14, No. 16 / OPTICS EXPRESS 7104

Fig. 3. Images in Fig. 2 are contrast-enhanced by linear intensity range stretch followed by gamma correction of 0.5 to show the details in the dark area. Left: intensity image. Right: degree of polarization image. It is clear that the pattern revealed in the polarization image is not present in the intensity image even after contrast enhancement. The yellow circle points out the same sewage drain cover that is visible in all related pictures up to Fig. 4 except Fig. 4 Left to help orientation.
Fig. 4. (Pictures shown in this figure are all regular intensity images with no polarization information) Left: the glass-wall building showing big glass rectangles and frames. Right: A picture of the same walk way as in Fig. 2 and Fig. 3 taken another day when the direct sun light is blocked due to nearby construction scaffolding. The shadow pattern cast on the walk way by the glass-wall and frames is visible. The yellow circle in the Right picture points out the same sewer drain cover as seen in Fig. 2 and Fig. 3. The left and right pictures in this figure can be related by the same glass door bracketed by the overlaid green rectangle. Note that pictures in Fig. 4 are taken with the camera at about the same position and general view direction as when taking pictures in Fig. 2 and Fig. 3. The only difference is that in Fig. 4 the camera zooms out and points more upward in order to put the tall glass-walled building into view.
We performed a controlled laboratory experiment to further confirm the results obtained outdoors. The setup comprises a 150W incandescent light source illuminating a scene from the direction opposite the camera, and a 15W fluorescent light illuminating the same scene from the direction corresponding to right hand side of the picture (Fig. 5).
#69990 - $15.00 USD Received 14 April 2006; revised 29 May 2006; accepted 30 May 2006
(C) 2006 OSA 7 August 2006 / Vol. 14, No. 16 / OPTICS EXPRESS 7105
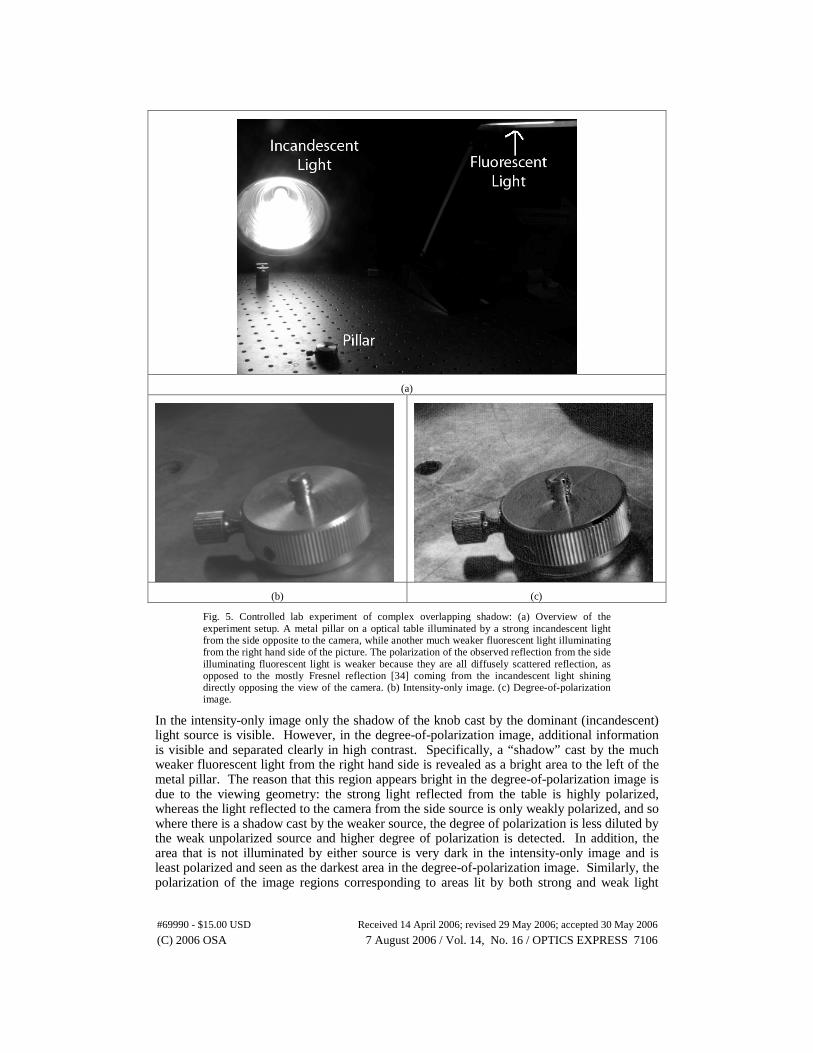
(a)
(b) (c)
Fig. 5. Controlled lab experiment of complex overlapping shadow: (a) Overview of the experiment setup. A metal pillar on a optical table illuminated by a strong incandescent light from the side opposite to the camera, while another much weaker fluorescent light illuminating from the right hand side of the picture. The polarization of the observed reflection from the side illuminating fluorescent light is weaker because they are all diffusely scattered reflection, as opposed to the mostly Fresnel reflection [34] coming from the incandescent light shining directly opposing the view of the camera. (b) Intensity-only image. (c) Degree-of-polarization image.
In the intensity-only image only the shadow of the knob cast by the dominant (incandescent) light source is visible. However, in the degree-of-polarization image, additional information is visible and separated clearly in high contrast. Specifically, a “shadow” cast by the much weaker fluorescent light from the right hand side is revealed as a bright area to the left of the metal pillar. The reason that this region appears bright in the degree-of-polarization image is due to the viewing geometry: the strong light reflected from the table is highly polarized, whereas the light reflected to the camera from the side source is only weakly polarized, and so where there is a shadow cast by the weaker source, the degree of polarization is less diluted by the weak unpolarized source and higher degree of polarization is detected. In addition, the area that is not illuminated by either source is very dark in the intensity-only image and is least polarized and seen as the darkest area in the degree-of-polarization image. Similarly, the polarization of the image regions corresponding to areas lit by both strong and weak light
#69990 - $15.00 USD Received 14 April 2006; revised 29 May 2006; accepted 30 May 2006
(C) 2006 OSA 7 August 2006 / Vol. 14, No. 16 / OPTICS EXPRESS 7106
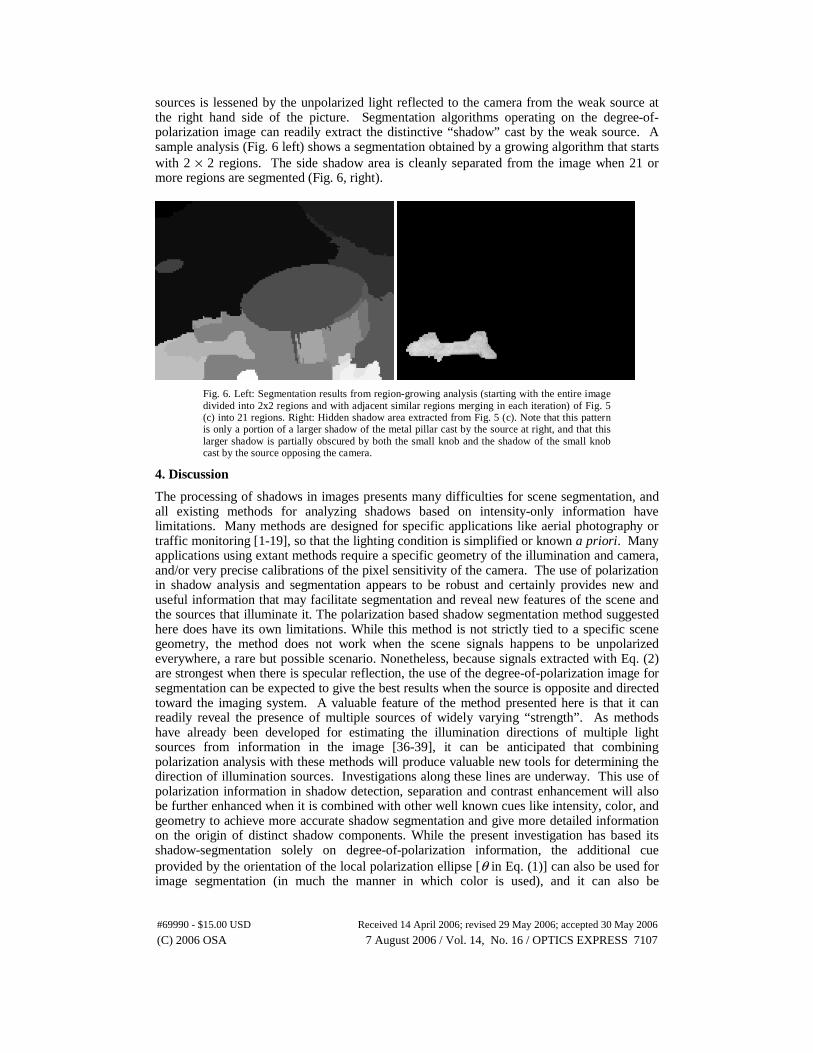
sources is lessened by the unpolarized light reflected to the camera from the weak source at the right hand side of the picture. Segmentation algorithms operating on the degree-of-polarization image can readily extract the distinctive “shadow” cast by the weak source. A sample analysis (Fig. 6 left) shows a segmentation obtained by a growing algorithm that starts with 2 × 2 regions. The side shadow area is cleanly separated from the image when 21 or more regions are segmented (Fig. 6, right).
Fig. 6. Left: Segmentation results from region-growing analysis (starting with the entire image divided into 2x2 regions and with adjacent similar regions merging in each iteration) of Fig. 5 (c) into 21 regions. Right: Hidden shadow area extracted from Fig. 5 (c). Note that this pattern is only a portion of a larger shadow of the metal pillar cast by the source at right, and that this larger shadow is partially obscured by both the small knob and the shadow of the small knob cast by the source opposing the camera.
4. Discussion
The processing of shadows in images presents many difficulties for scene segmentation, and all existing methods for analyzing shadows based on intensity-only information have limitations. Many methods are designed for specific applications like aerial photography or traffic monitoring [1-19], so that the lighting condition is simplified or known a priori. Many applications using extant methods require a specific geometry of the illumination and camera, and/or very precise calibrations of the pixel sensitivity of the camera. The use of polarization in shadow analysis and segmentation appears to be robust and certainly provides new and useful information that may facilitate segmentation and reveal new features of the scene and the sources that illuminate it. The polarization based shadow segmentation method suggested here does have its own limitations. While this method is not strictly tied to a specific scene geometry, the method does not work when the scene signals happens to be unpolarized everywhere, a rare but possible scenario. Nonetheless, because signals extracted with Eq. (2)are strongest when there is specular reflection, the use of the degree-of-polarization image for segmentation can be expected to give the best results when the source is opposite and directed toward the imaging system. A valuable feature of the method presented here is that it can readily reveal the presence of multiple sources of widely varying “strength”. As methods have already been developed for estimating the illumination directions of multiple light sources from information in the image [36-39], it can be anticipated that combining polarization analysis with these methods will produce valuable new tools for determining the direction of illumination sources. Investigations along these lines are underway. This use of polarization information in shadow detection, separation and contrast enhancement will also be further enhanced when it is combined with other well known cues like intensity, color, and geometry to achieve more accurate shadow segmentation and give more detailed information on the origin of distinct shadow components. While the present investigation has based its shadow-segmentation solely on degree-of-polarization information, the additional cue provided by the orientation of the local polarization ellipse [θ in Eq. (1)] can also be used for image segmentation (in much the manner in which color is used), and it can also be
#69990 - $15.00 USD Received 14 April 2006; revised 29 May 2006; accepted 30 May 2006
(C) 2006 OSA 7 August 2006 / Vol. 14, No. 16 / OPTICS EXPRESS 7107

anticipated that this will further contribute to the method. Moreover, as expected from the independence of polarization from the other physical attributes of light and demonstrated by our experiments, information extracted by polarization about shadows is unique and in general cannot be extracted from other cues alone.
5. Conclusion
We have presented a novel method of shadow segmentation based on the local degree of polarization in images captured by a polarization-sensitive imaging system. This analysis reveals that the polarization of light conveys distinct and valuable information about a scene that can be extracted at modest cost. Polarization have been used in many other vision tasks such as removing glare and target detection, but to the best of our knowledge has not previously been used to aid the segmentation of complex shadows in a scene. Polarization information enables our system to extract information about the complexities of multiple light sources and the overlapping shadows they create. Such shadows are very difficult even to detect in intensity-only images, and their extraction with polarization analysis provides a new means of identifying the direction and nature of light sources illuminating a scene.
Acknowledgments
This work is supported in part by the U.S. Air Force Office of Scientific Research (AFOSR), through grants F49620-02-1-0140, FA9550-05-1-0052, and the DURIP grant F49620-02-1-0241. Correspondence should be addressed to Shih-Schön Lin, TEL: +1-215-898-2102; e-mail: [email protected] or Nader Engheta, TEL: +1-215-898-9777; fax; 215-573-2068; e-mail; [email protected].
#69990 - $15.00 USD Received 14 April 2006; revised 29 May 2006; accepted 30 May 2006
(C) 2006 OSA 7 August 2006 / Vol. 14, No. 16 / OPTICS EXPRESS 7108
1FmpttgIcpsepacofifafeptlce
Lin et al. Vol. 23, No. 9 /September 2006 /J. Opt. Soc. Am. A 2137
Polarization-based and specular-reflection-basednoncontact latent fingerprint imaging and
lifting
Shih-Schön Lin and Konstantin M. Yemelyanov
Electrical and Systems Engineering Department, University of Pennsylvania, 220 South 33rd Street, Moore 203,Philadelphia, Pennsylvania 19104-6390
Edward N. Pugh, Jr.
F. M. Kirby Center for Molecular Ophthalmology and Institute of Neurological Sciences, University of Pennsylvania,422 Curie Boulevard, Philadelphia, Pennsylvania 19104-6390
Nader Engheta
Electrical and Systems Engineering Department and Institute of Neurological Sciences, University of Pennsylvania,Philadelphia, Pennsylvania 19104
Received December 22, 2005; accepted February 25, 2006; posted April 6, 2006 (Doc. ID 66822)
In forensic science the finger marks left unintentionally by people at a crime scene are referred to as latentfingerprints. Most existing techniques to detect and lift latent fingerprints require application of a certain ma-terial directly onto the exhibit. The chemical and physical processing applied to the fingerprint potentially de-grades or prevents further forensic testing on the same evidence sample. Many existing methods also havedeleterious side effects. We introduce a method to detect and extract latent fingerprint images without apply-ing any powder or chemicals on the object. Our method is based on the optical phenomena of polarization andspecular reflection together with the physiology of fingerprint formation. The recovered image quality is com-parable to existing methods. In some cases, such as the sticky side of tape, our method shows uniqueadvantages. © 2006 Optical Society of America
OCIS codes: 150.0150, 110.0110, 100.0100, 260.5430.
dpsRtpaaed
tvtemcaIurcMcmfi
. INTRODUCTIONingerprinting is one of the most widely used biometricethods for identifying and authenticating individual
ersons. The modern science of fingerprinting started inhe second half of the 19th century. For an interesting his-orical review, see Refs. 1–3. There are two types of fin-erprint data, distinguished by their formation processes.n forensic science, finger marks left unintentionally at arime scene are referred to as latent fingerprints. Finger-rints acquired directly from human fingers using ink orcanners in controlled environments are referred to as ex-mplar fingerprints.1–4 Although both types of finger-rints are related to some extent, the recovery of latentnd exemplar fingerprints poses very different technicalhallenges. There have been considerably more successfulptical methods for exemplar fingerprints than for latentngerprints, and sometimes the classification can be con-using. For example, there exist methods that use lasernd polarization for extracting fingerprint images directlyrom live human fingers5; such methods are for acquiringxemplar fingerprints. The purpose and the detailedhysical background of that system are different fromhose involved in the application of laser or polarization toatent fingerprints. Another example is a device thatlaims that it “optically reads a latent fingerprint.”6 How-ver, the main function of the particular device is to read
1084-7529/06/092137-17/$15.00 © 2
irectly from a human finger (and simultaneously com-are with a known fingerprint pattern), and such a devicehould be classified as an exemplar fingerprint reader.ecovery of latent fingerprints is much more difficult
han the recovery of exemplar fingerprints because thehysical and chemical composition of latent fingerprintsnd the surfaces on which they are found vary greatlynd can often undergo unknown degradation before beingxamined. In this paper we present a new method for theetection and recovery of latent fingerprints.Latent fingerprints differ from exemplar fingerprints in
hat they are very difficult to detect with unaided humanision under most ordinary viewing conditions (henceheir name); they are usually also of lower quality thanxemplar fingerprints, although high-quality fingerprintarks can at times be found at a crime scene. To be pre-
ise, nonexemplar fingerprints that can be easily seen byhuman observer should be called patent fingerprints.1–4
n practice, however, the term latent fingerprints is oftensed to refer to all fingerprints that are not exemplar. It iseally latent fingerprints that are more common at arime scene and require greater efforts to render visible.ost techniques employed for this purpose utilize a
hemical or physical process that applies some kind ofaterial directly to the surface suspected to bearngerprints.1–4,7–9 Once the contrast of the fingerprint
006 Optical Society of America
mmaopdab
wpsrdTcfdsaiateltmafirtr
fiocwpetdmasfrdLwuqctstpHtpmst
ha
tattitelsgdmlsrt
2FLEWsmiitiooatscficwitagspmraopg
gsavtpad
2138 J. Opt. Soc. Am. A/Vol. 23, No. 9 /September 2006 Lin et al.
ark is sufficiently enhanced by such treatments, theark is either photographed or lifted to be permanently
rchived as evidence. The term lifting the fingerprintriginates from the oldest, but still widely used, finger-rint detection method—powdering—in which the pow-ers applied adhere to the fingerprint material, and thenre physically lifted out of the original crime scene objecty sticky tape.Since applying chemicals or powders onto a surface on
hich fingerprints reside changes the chemical and/orhysical composition of the surface, the use of such inva-ive methods can potentially interfere with subsequent fo-ensic testing of different types, and can sometimes inflicteleterious side effects on the surface or the operator.herefore, in the past 30 years several techniques thatan recover latent fingerprints without the need to applyoreign material directly onto the fingerprints have beeneveloped. Many of these methods use specialized lightources (e.g., laser, UV), filters, and detectors.1–4,7–12 Theyre successful in some cases. However, like all other ex-sting techniques, they do not work in all possible casesnd are known to fail completely with certain types of la-ent fingerprints or object surfaces. As a result, chemicalnhancers are often reintroduced to aid in the detection ofatent fingerprints.1–3,9,12–19 Further studies show thatechniques using special light sources and filters workuch better and in more cases when combined with the
pplication of certain chemicals on the fingerprint samplerst.1,9,12–19 However, the application of chemicals di-ectly onto the fingerprints effectively negates the advan-ages of noncontact methods, and the composite methodsevert back into invasive.
It has been known by experienced law enforcement of-cers that by varying the angle of a flashlight shiningnto a surface suspected to bear latent fingerprints, onean potentially locate latent fingerprints that are other-ise difficult to see.7 However, to lift the latent finger-rints in a form that can be documented and presented asvidence in a court trial, some invasive enhancementreatments are usually considered necessary. Pfister9,20
evised an optical method that uses a semitransparentirror that can project light onto a surface at a right
ngle, while at the same time allowing a camera or ob-erver to view the surface at a right angle. A smooth sur-ace is expected to appear bright due to strong speculareflection, while a fingerprint mark would appear darkerue to much less specular reflection. Margot andennard9,21 reported that such a method works betterhen the sample is pretreated with cyanoacrylate. These of only a right angle in Pfister’s method sacrificeduite a bit of flexibility, and polarization-based techniquesannot be applied to further improve the contrast becausehe specular reflection observed at a right angle from theurface is not preferentially polarized. It is widely knownhat specularly reflected light from dielectrics would beartially polarized at a certain range of viewing angles.owever, to the best of our knowledge, no known applica-
ion of polarization has been reported for latent finger-rints, with the exception of using a polarizing filter to re-ove glare when taking pictures, which is considered a
tandard photographic technique. Menzel22 briefly men-ioned the possibility of using optical polarization to en-
ance visibility of latent fingerprints left on glass, but itppears that no further development took place.We propose here a new method that allows the detec-
ion and lifting of latent fingerprints into clearly identifi-ble digital images without the application of chemicalreatments or, indeed, without any physical contact withhe surface and fingerprint material. Rather than employ-ng extraneous material, our method takes advantage ofhe optical properties. In particular we exploit those prop-rties related to specular reflection and polarization of theatent fingerprint, which usually consists of tiny ridges ofkin residue material including sweat (salty water),rease, and lipid,2,3,23 all of which are rather transparentielectric materials, making them difficult to detect underost viewing conditions. Our method is also applicable to
atent fingerprints left on a smooth but pliable dielectricurface. The recovered fingerprint images have compa-able or better quality than those obtained by conven-ional methods.
. NONCONTACT OPTICAL LATENTINGERPRINT ENHANCEMENT ANDIFTING: CORE TECHNIQUE OUTLINE ANDXPERIMENTAL SETUPe start with the principal physical and physiological ba-
is of our noncontact optical latent fingerprint enhance-ent and lifting in this section. The actual formulas used
n our computation will follow later. The physics underly-ng the method is illustrated in Fig. 1. When a fingerouches the object surface, a dielectric residue mark bear-ng the fingerprint pattern is imprinted on it. The residuen the surface induces differences in optical polarizationr reflection or both between the clean part of the surfacend that bearing the print. The optical information is cap-ured and enhanced by our unique optical setup andtored as digital images. Further digital processing of theaptured images enables us to develop or lift the latentngerprint pattern without applying any powder or otherhemicals to the object. Our optical setup is based on theell-known Fresnel reflection theory for orthogonal polar-
zations and the theories for macroscopic surface reflec-ance developed for computer vision and graphics. As anside, it is interesting to note that biologists and zoolo-ists have found that certain animal species have visualystems that sense and utilize (in or near) visible light’solarization in the natural environment, e.g., backswim-er Notonecta glauca can detect the polarization of light
eflected from smooth water surfaces and use it to landnd plunge safely on the water surface.24,25 Indeed, ourriginal step to design our optical setup for latent finger-rint detection was inspired from this ability of Notonectalauca in detecting the surface of the water.
In Fig. 1(c), we illustrate a cross-section view of the fin-erprint on a surface. The ridge area corresponds to amall amount of residue on the surface, while the furrowrea does not. All existing enhancement methods take ad-antage of this situation by applying materials that selec-ively attach to or interact with only the residue area androduce a colored or fluorescent pattern of the residuerea. Our noncontact method exploits this situation in aifferent way [Fig. 1(d)], with a common household light
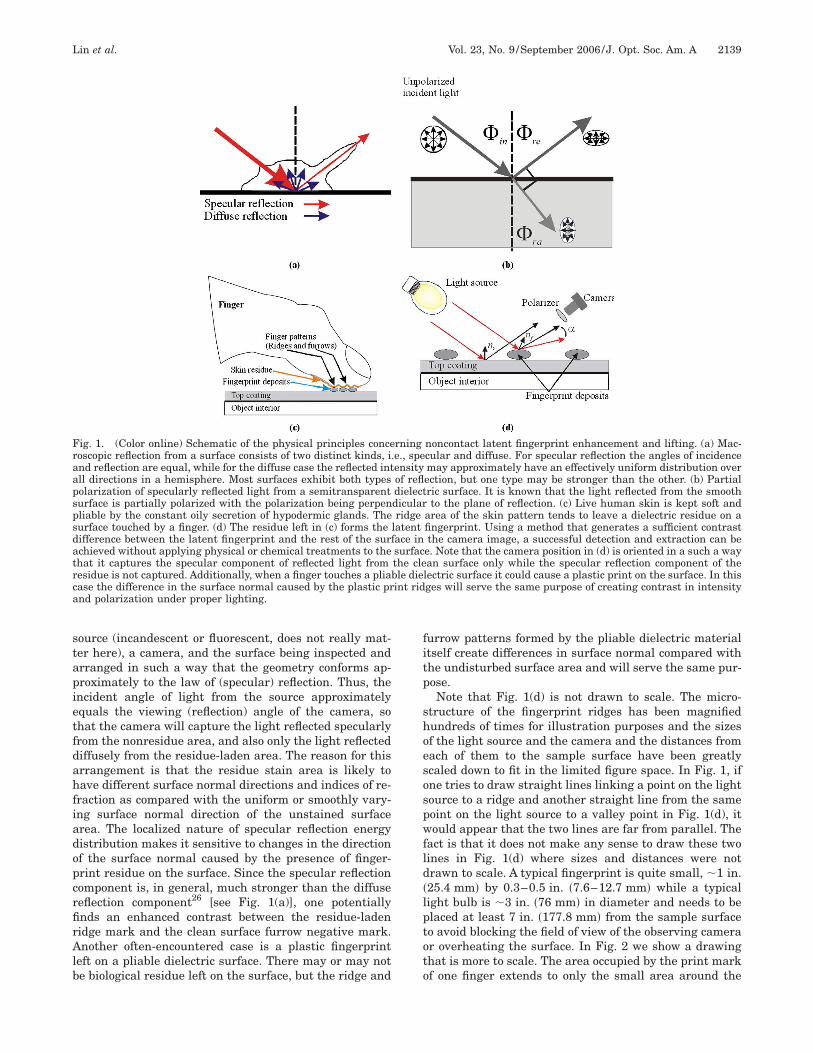
stapietfdahfiadopcrfirAlb
fitp
shoesospwfld�lptoto
Fraapspsdatrca
Lin et al. Vol. 23, No. 9 /September 2006 /J. Opt. Soc. Am. A 2139
ource (incandescent or fluorescent, does not really mat-er here), a camera, and the surface being inspected andrranged in such a way that the geometry conforms ap-roximately to the law of (specular) reflection. Thus, thencident angle of light from the source approximatelyquals the viewing (reflection) angle of the camera, sohat the camera will capture the light reflected specularlyrom the nonresidue area, and also only the light reflectediffusely from the residue-laden area. The reason for thisrrangement is that the residue stain area is likely toave different surface normal directions and indices of re-
raction as compared with the uniform or smoothly vary-ng surface normal direction of the unstained surfacerea. The localized nature of specular reflection energyistribution makes it sensitive to changes in the directionf the surface normal caused by the presence of finger-rint residue on the surface. Since the specular reflectionomponent is, in general, much stronger than the diffuseeflection component26 [see Fig. 1(a)], one potentiallynds an enhanced contrast between the residue-ladenidge mark and the clean surface furrow negative mark.nother often-encountered case is a plastic fingerprint
eft on a pliable dielectric surface. There may or may note biological residue left on the surface, but the ridge and
ig. 1. (Color online) Schematic of the physical principles conceoscopic reflection from a surface consists of two distinct kinds, ind reflection are equal, while for the diffuse case the reflected intll directions in a hemisphere. Most surfaces exhibit both typesolarization of specularly reflected light from a semitransparenturface is partially polarized with the polarization being perpenliable by the constant oily secretion of hypodermic glands. Theurface touched by a finger. (d) The residue left in (c) forms theifference between the latent fingerprint and the rest of the surchieved without applying physical or chemical treatments to thehat it captures the specular component of reflected light fromesidue is not captured. Additionally, when a finger touches a pliaase the difference in the surface normal caused by the plastic prnd polarization under proper lighting.
urrow patterns formed by the pliable dielectric materialtself create differences in surface normal compared withhe undisturbed surface area and will serve the same pur-ose.Note that Fig. 1(d) is not drawn to scale. The micro-
tructure of the fingerprint ridges has been magnifiedundreds of times for illustration purposes and the sizesf the light source and the camera and the distances fromach of them to the sample surface have been greatlycaled down to fit in the limited figure space. In Fig. 1, ifne tries to draw straight lines linking a point on the lightource to a ridge and another straight line from the sameoint on the light source to a valley point in Fig. 1(d), itould appear that the two lines are far from parallel. The
act is that it does not make any sense to draw these twoines in Fig. 1(d) where sizes and distances were notrawn to scale. A typical fingerprint is quite small, �1 in.25.4 mm� by 0.3–0.5 in. �7.6–12.7 mm� while a typicalight bulb is �3 in. �76 mm� in diameter and needs to belaced at least 7 in. �177.8 mm� from the sample surfaceo avoid blocking the field of view of the observing camerar overheating the surface. In Fig. 2 we show a drawinghat is more to scale. The area occupied by the print markf one finger extends to only the small area around the
noncontact latent fingerprint enhancement and lifting. (a) Mac-cular and diffuse. For specular reflection the angles of incidencemay approximately have an effectively uniform distribution overection, but one type may be stronger than the other. (b) Partialric surface. It is known that the light reflected from the smoothto the plane of reflection. (c) Live human skin is kept soft and
area of the skin pattern tends to leave a dielectric residue on afingerprint. Using a method that generates a sufficient contrastthe camera image, a successful detection and extraction can be
e. Note that the camera position in (d) is oriented in a such a wayan surface only while the specular reflection component of the
lectric surface it could cause a plastic print on the surface. In thisges will serve the same purpose of creating contrast in intensity
rning.e., speensityof refldielectdicularridge
latentface insurfacthe cleble dieint rid
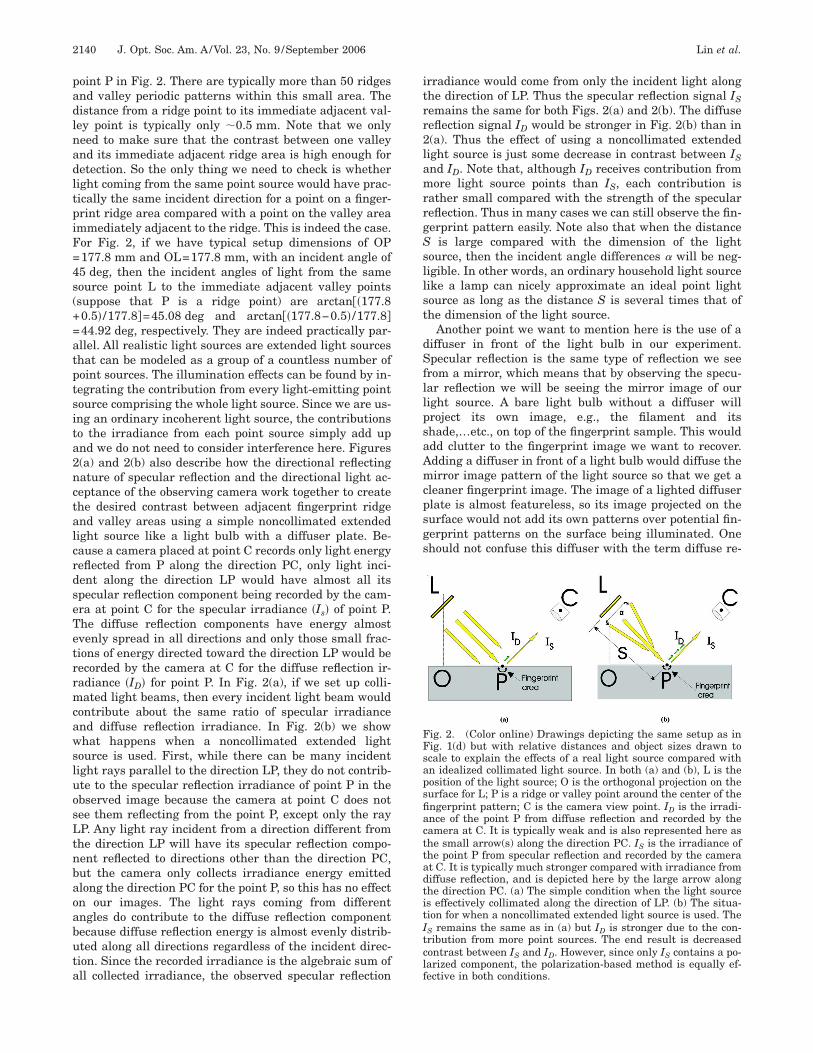
padlnadltpiF=4s(+=atptsita2nctalcrdseTetrrmcawsluosLtnbaoabuta
itrr2lamrrgSsllst
dSfllpsaAmcpsgs
FFsapsfiacttadtitItclf
2140 J. Opt. Soc. Am. A/Vol. 23, No. 9 /September 2006 Lin et al.
oint P in Fig. 2. There are typically more than 50 ridgesnd valley periodic patterns within this small area. Theistance from a ridge point to its immediate adjacent val-ey point is typically only �0.5 mm. Note that we onlyeed to make sure that the contrast between one valleynd its immediate adjacent ridge area is high enough foretection. So the only thing we need to check is whetheright coming from the same point source would have prac-ically the same incident direction for a point on a finger-rint ridge area compared with a point on the valley areammediately adjacent to the ridge. This is indeed the case.or Fig. 2, if we have typical setup dimensions of OP177.8 mm and OL=177.8 mm, with an incident angle of5 deg, then the incident angles of light from the sameource point L to the immediate adjacent valley pointssuppose that P is a ridge point) are arctan��177.80.5� /177.8�=45.08 deg and arctan��177.8−0.5� /177.8�44.92 deg, respectively. They are indeed practically par-llel. All realistic light sources are extended light sourceshat can be modeled as a group of a countless number ofoint sources. The illumination effects can be found by in-egrating the contribution from every light-emitting pointource comprising the whole light source. Since we are us-ng an ordinary incoherent light source, the contributionso the irradiance from each point source simply add upnd we do not need to consider interference here. Figures(a) and 2(b) also describe how the directional reflectingature of specular reflection and the directional light ac-eptance of the observing camera work together to createhe desired contrast between adjacent fingerprint ridgend valley areas using a simple noncollimated extendedight source like a light bulb with a diffuser plate. Be-ause a camera placed at point C records only light energyeflected from P along the direction PC, only light inci-ent along the direction LP would have almost all itspecular reflection component being recorded by the cam-ra at point C for the specular irradiance �Is� of point P.he diffuse reflection components have energy almostvenly spread in all directions and only those small frac-ions of energy directed toward the direction LP would beecorded by the camera at C for the diffuse reflection ir-adiance �ID� for point P. In Fig. 2(a), if we set up colli-ated light beams, then every incident light beam would
ontribute about the same ratio of specular irradiancend diffuse reflection irradiance. In Fig. 2(b) we showhat happens when a noncollimated extended light
ource is used. First, while there can be many incidentight rays parallel to the direction LP, they do not contrib-te to the specular reflection irradiance of point P in thebserved image because the camera at point C does notee them reflecting from the point P, except only the rayP. Any light ray incident from a direction different fromhe direction LP will have its specular reflection compo-ent reflected to directions other than the direction PC,ut the camera only collects irradiance energy emittedlong the direction PC for the point P, so this has no effectn our images. The light rays coming from differentngles do contribute to the diffuse reflection componentecause diffuse reflection energy is almost evenly distrib-ted along all directions regardless of the incident direc-ion. Since the recorded irradiance is the algebraic sum ofll collected irradiance, the observed specular reflection
rradiance would come from only the incident light alonghe direction of LP. Thus the specular reflection signal ISemains the same for both Figs. 2(a) and 2(b). The diffuseeflection signal ID would be stronger in Fig. 2(b) than in(a). Thus the effect of using a noncollimated extendedight source is just some decrease in contrast between ISnd ID. Note that, although ID receives contribution fromore light source points than IS, each contribution is
ather small compared with the strength of the speculareflection. Thus in many cases we can still observe the fin-erprint pattern easily. Note also that when the distance
is large compared with the dimension of the lightource, then the incident angle differences � will be neg-igible. In other words, an ordinary household light sourceike a lamp can nicely approximate an ideal point lightource as long as the distance S is several times that ofhe dimension of the light source.
Another point we want to mention here is the use of aiffuser in front of the light bulb in our experiment.pecular reflection is the same type of reflection we see
rom a mirror, which means that by observing the specu-ar reflection we will be seeing the mirror image of ouright source. A bare light bulb without a diffuser willroject its own image, e.g., the filament and itshade,…etc., on top of the fingerprint sample. This woulddd clutter to the fingerprint image we want to recover.dding a diffuser in front of a light bulb would diffuse theirror image pattern of the light source so that we get a
leaner fingerprint image. The image of a lighted diffuserlate is almost featureless, so its image projected on theurface would not add its own patterns over potential fin-erprint patterns on the surface being illuminated. Onehould not confuse this diffuser with the term diffuse re-
ig. 2. (Color online) Drawings depicting the same setup as inig. 1(d) but with relative distances and object sizes drawn tocale to explain the effects of a real light source compared withn idealized collimated light source. In both (a) and (b), L is theosition of the light source; O is the orthogonal projection on theurface for L; P is a ridge or valley point around the center of thengerprint pattern; C is the camera view point. ID is the irradi-nce of the point P from diffuse reflection and recorded by theamera at C. It is typically weak and is also represented here ashe small arrow(s) along the direction PC. IS is the irradiance ofhe point P from specular reflection and recorded by the camerat C. It is typically much stronger compared with irradiance fromiffuse reflection, and is depicted here by the large arrow alonghe direction PC. (a) The simple condition when the light sources effectively collimated along the direction of LP. (b) The situa-ion for when a noncollimated extended light source is used. TheS remains the same as in (a) but ID is stronger due to the con-ribution from more point sources. The end result is decreasedontrast between IS and ID. However, since only IS contains a po-arized component, the polarization-based method is equally ef-ective in both conditions.
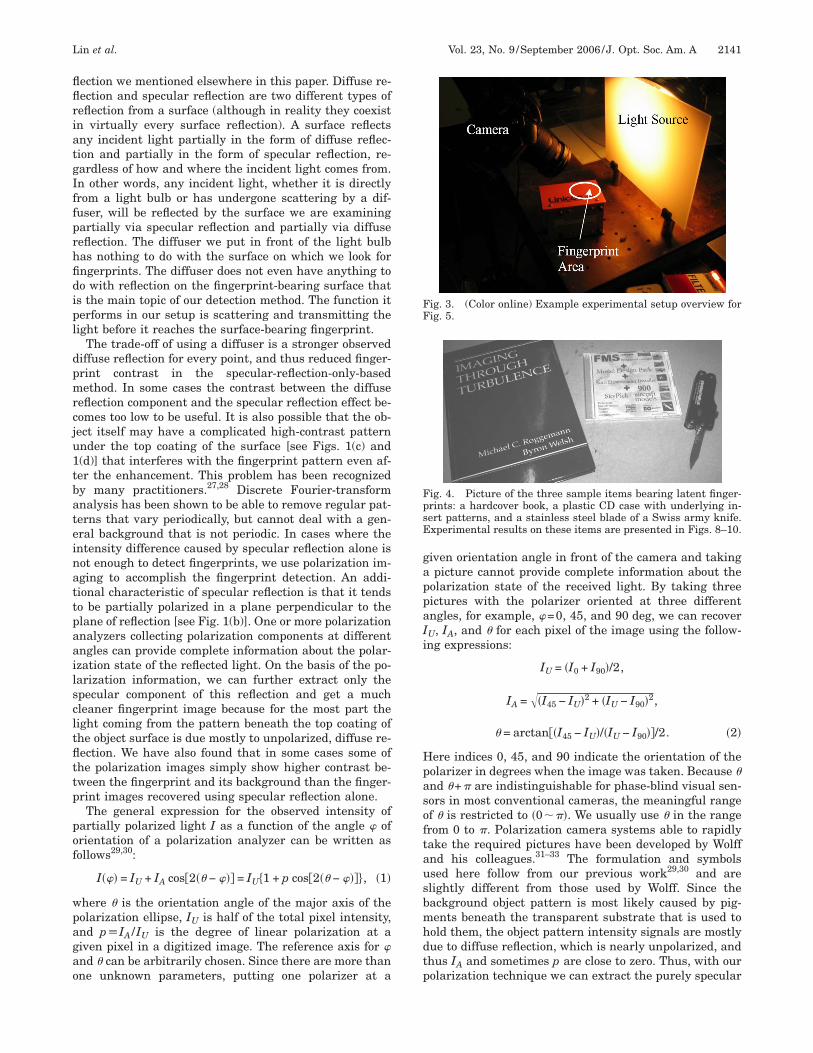
flflriatgIffprhfidipl
dpmrcju1tbateinattpaailscltflttp
pof
wpagao
gappaIi
Hpasoftausbmhdtp
FF
FpsE
Lin et al. Vol. 23, No. 9 /September 2006 /J. Opt. Soc. Am. A 2141
ection we mentioned elsewhere in this paper. Diffuse re-ection and specular reflection are two different types ofeflection from a surface (although in reality they coexistn virtually every surface reflection). A surface reflectsny incident light partially in the form of diffuse reflec-ion and partially in the form of specular reflection, re-ardless of how and where the incident light comes from.n other words, any incident light, whether it is directlyrom a light bulb or has undergone scattering by a dif-user, will be reflected by the surface we are examiningartially via specular reflection and partially via diffuseeflection. The diffuser we put in front of the light bulbas nothing to do with the surface on which we look forngerprints. The diffuser does not even have anything too with reflection on the fingerprint-bearing surface thats the main topic of our detection method. The function iterforms in our setup is scattering and transmitting theight before it reaches the surface-bearing fingerprint.
The trade-off of using a diffuser is a stronger observediffuse reflection for every point, and thus reduced finger-rint contrast in the specular-reflection-only-basedethod. In some cases the contrast between the diffuse
eflection component and the specular reflection effect be-omes too low to be useful. It is also possible that the ob-ect itself may have a complicated high-contrast patternnder the top coating of the surface [see Figs. 1(c) and(d)] that interferes with the fingerprint pattern even af-er the enhancement. This problem has been recognizedy many practitioners.27,28 Discrete Fourier-transformnalysis has been shown to be able to remove regular pat-erns that vary periodically, but cannot deal with a gen-ral background that is not periodic. In cases where thentensity difference caused by specular reflection alone isot enough to detect fingerprints, we use polarization im-ging to accomplish the fingerprint detection. An addi-ional characteristic of specular reflection is that it tendso be partially polarized in a plane perpendicular to thelane of reflection [see Fig. 1(b)]. One or more polarizationnalyzers collecting polarization components at differentngles can provide complete information about the polar-zation state of the reflected light. On the basis of the po-arization information, we can further extract only thepecular component of this reflection and get a muchleaner fingerprint image because for the most part theight coming from the pattern beneath the top coating ofhe object surface is due mostly to unpolarized, diffuse re-ection. We have also found that in some cases some ofhe polarization images simply show higher contrast be-ween the fingerprint and its background than the finger-rint images recovered using specular reflection alone.The general expression for the observed intensity of
artially polarized light I as a function of the angle � ofrientation of a polarization analyzer can be written asollows29,30:
I��� = IU + IA cos�2�� − ��� = IU�1 + p cos�2�� − ����, �1�
here � is the orientation angle of the major axis of theolarization ellipse, IU is half of the total pixel intensity,nd p�IA /IU is the degree of linear polarization at aiven pixel in a digitized image. The reference axis for �nd � can be arbitrarily chosen. Since there are more thanne unknown parameters, putting one polarizer at a
iven orientation angle in front of the camera and takingpicture cannot provide complete information about the
olarization state of the received light. By taking threeictures with the polarizer oriented at three differentngles, for example, �=0, 45, and 90 deg, we can recoverU, IA, and � for each pixel of the image using the follow-ng expressions:
IU = �I0 + I90�/2,
IA = �I45 − IU�2 + �IU − I90�2,
� = arctan��I45 − IU�/�IU − I90��/2. �2�
ere indices 0, 45, and 90 indicate the orientation of theolarizer in degrees when the image was taken. Because �nd �+� are indistinguishable for phase-blind visual sen-ors in most conventional cameras, the meaningful rangef � is restricted to �0���. We usually use � in the rangerom 0 to �. Polarization camera systems able to rapidlyake the required pictures have been developed by Wolffnd his colleagues.31–33 The formulation and symbolssed here follow from our previous work29,30 and arelightly different from those used by Wolff. Since theackground object pattern is most likely caused by pig-ents beneath the transparent substrate that is used toold them, the object pattern intensity signals are mostlyue to diffuse reflection, which is nearly unpolarized, andhus IA and sometimes p are close to zero. Thus, with ourolarization technique we can extract the purely specular
ig. 3. (Color online) Example experimental setup overview forig. 5.
ig. 4. Picture of the three sample items bearing latent finger-rints: a hardcover book, a plastic CD case with underlying in-ert patterns, and a stainless steel blade of a Swiss army knife.xperimental results on these items are presented in Figs. 8–10.
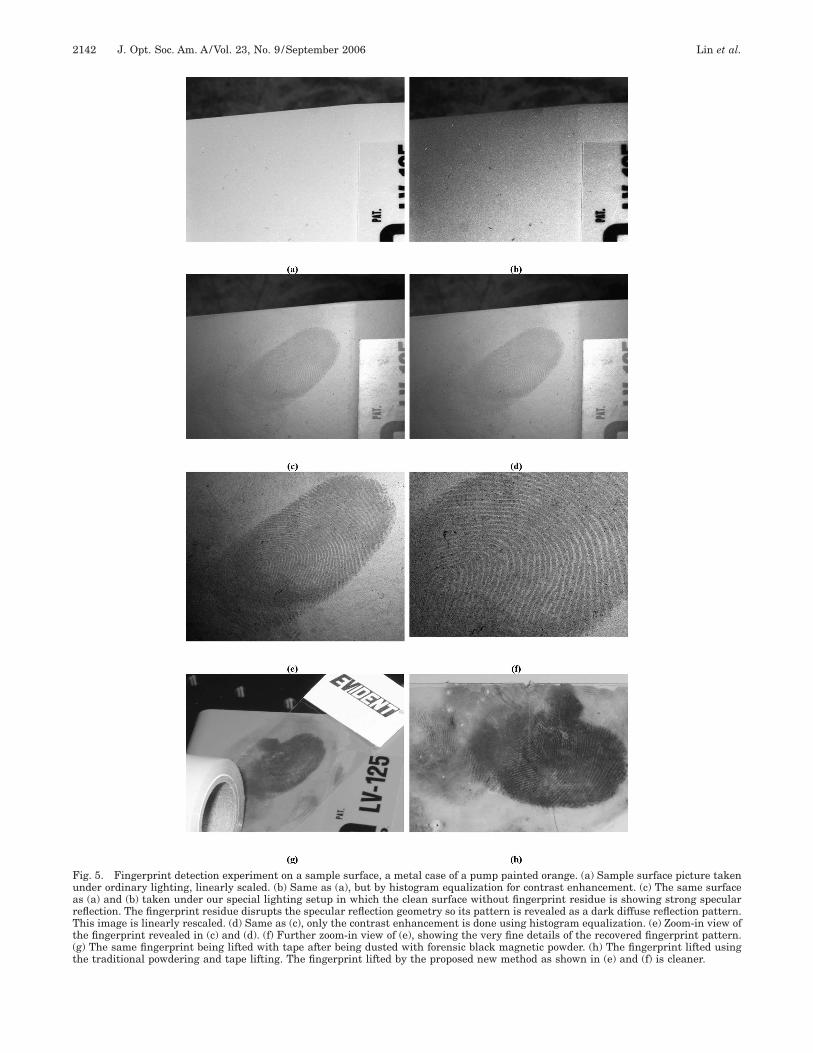
FuarTt(t
2142 J. Opt. Soc. Am. A/Vol. 23, No. 9 /September 2006 Lin et al.
ig. 5. Fingerprint detection experiment on a sample surface, a metal case of a pump painted orange. (a) Sample surface picture takennder ordinary lighting, linearly scaled. (b) Same as (a), but by histogram equalization for contrast enhancement. (c) The same surfaces (a) and (b) taken under our special lighting setup in which the clean surface without fingerprint residue is showing strong speculareflection. The fingerprint residue disrupts the specular reflection geometry so its pattern is revealed as a dark diffuse reflection pattern.his image is linearly rescaled. (d) Same as (c), only the contrast enhancement is done using histogram equalization. (e) Zoom-in view of
he fingerprint revealed in (c) and (d). (f) Further zoom-in view of (e), showing the very fine details of the recovered fingerprint pattern.g) The same fingerprint being lifted with tape after being dusted with forensic black magnetic powder. (h) The fingerprint lifted usinghe traditional powdering and tape lifting. The fingerprint lifted by the proposed new method as shown in (e) and (f) is cleaner.
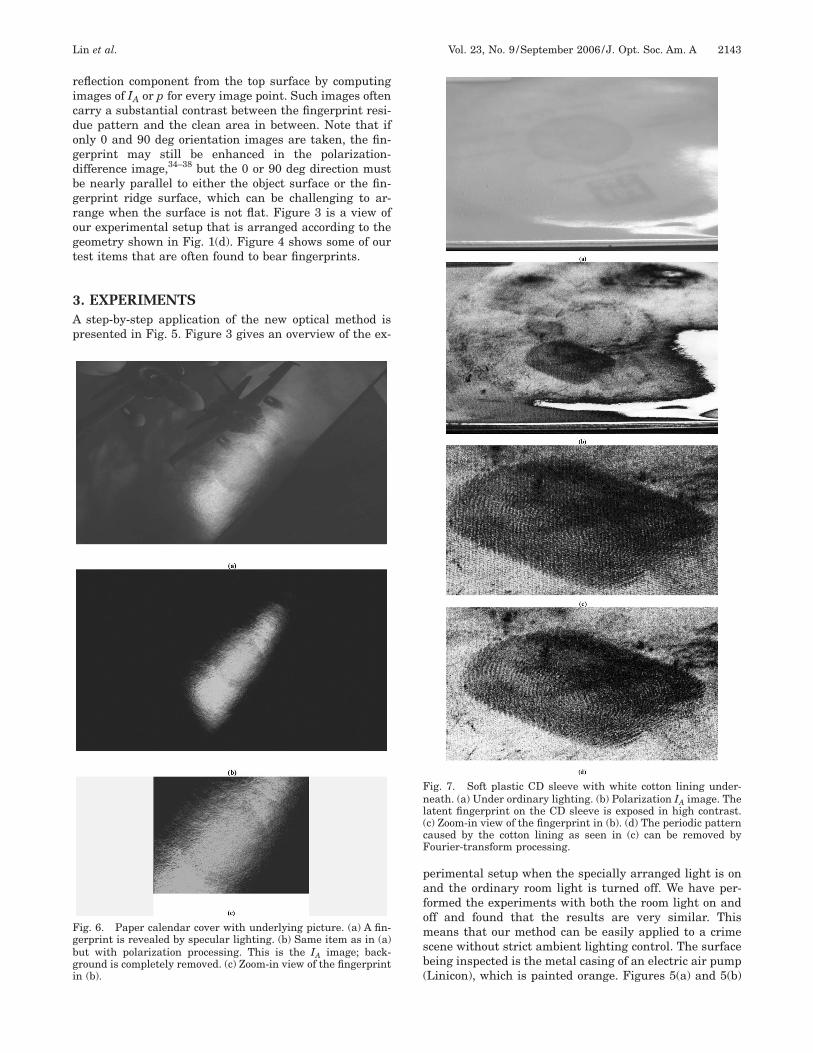
ricdogdbgrogt
3Ap
pafomsb(
Fgbgi
Fnl(cF
Lin et al. Vol. 23, No. 9 /September 2006 /J. Opt. Soc. Am. A 2143
eflection component from the top surface by computingmages of IA or p for every image point. Such images oftenarry a substantial contrast between the fingerprint resi-ue pattern and the clean area in between. Note that ifnly 0 and 90 deg orientation images are taken, the fin-erprint may still be enhanced in the polarization-ifference image,34–38 but the 0 or 90 deg direction muste nearly parallel to either the object surface or the fin-erprint ridge surface, which can be challenging to ar-ange when the surface is not flat. Figure 3 is a view ofur experimental setup that is arranged according to theeometry shown in Fig. 1(d). Figure 4 shows some of ourest items that are often found to bear fingerprints.
. EXPERIMENTSstep-by-step application of the new optical method is
resented in Fig. 5. Figure 3 gives an overview of the ex-
ig. 6. Paper calendar cover with underlying picture. (a) A fin-erprint is revealed by specular lighting. (b) Same item as in (a)ut with polarization processing. This is the IA image; back-round is completely removed. (c) Zoom-in view of the fingerprintn (b).
erimental setup when the specially arranged light is onnd the ordinary room light is turned off. We have per-ormed the experiments with both the room light on andff and found that the results are very similar. Thiseans that our method can be easily applied to a crime
cene without strict ambient lighting control. The surfaceeing inspected is the metal casing of an electric air pumpLinicon), which is painted orange. Figures 5(a) and 5(b)
ig. 7. Soft plastic CD sleeve with white cotton lining under-eath. (a) Under ordinary lighting. (b) Polarization IA image. The
atent fingerprint on the CD sleeve is exposed in high contrast.c) Zoom-in view of the fingerprint in (b). (d) The periodic patternaused by the cotton lining as seen in (c) can be removed byourier-transform processing.
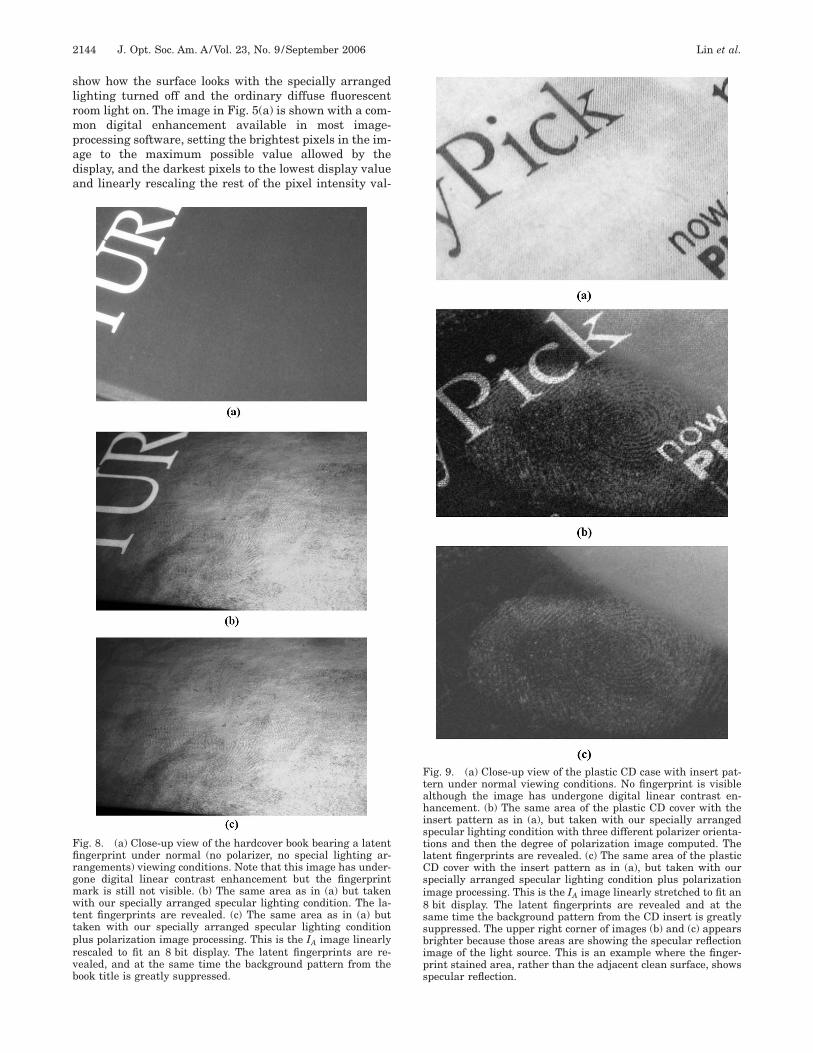
slrmpada
Ffirgmwttprvb
FtahistlCsi8ssbip
2144 J. Opt. Soc. Am. A/Vol. 23, No. 9 /September 2006 Lin et al.
how how the surface looks with the specially arrangedighting turned off and the ordinary diffuse fluorescentoom light on. The image in Fig. 5(a) is shown with a com-on digital enhancement available in most image-
rocessing software, setting the brightest pixels in the im-ge to the maximum possible value allowed by theisplay, and the darkest pixels to the lowest display valuend linearly rescaling the rest of the pixel intensity val-
ig. 8. (a) Close-up view of the hardcover book bearing a latentngerprint under normal (no polarizer, no special lighting ar-angements) viewing conditions. Note that this image has under-one digital linear contrast enhancement but the fingerprintark is still not visible. (b) The same area as in (a) but takenith our specially arranged specular lighting condition. The la-
ent fingerprints are revealed. (c) The same area as in (a) butaken with our specially arranged specular lighting conditionlus polarization image processing. This is the IA image linearlyescaled to fit an 8 bit display. The latent fingerprints are re-ealed, and at the same time the background pattern from theook title is greatly suppressed.
sig. 9. (a) Close-up view of the plastic CD case with insert pat-ern under normal viewing conditions. No fingerprint is visiblelthough the image has undergone digital linear contrast en-ancement. (b) The same area of the plastic CD cover with the
nsert pattern as in (a), but taken with our specially arrangedpecular lighting condition with three different polarizer orienta-ions and then the degree of polarization image computed. Theatent fingerprints are revealed. (c) The same area of the plasticD cover with the insert pattern as in (a), but taken with ourpecially arranged specular lighting condition plus polarizationmage processing. This is the IA image linearly stretched to fit an
bit display. The latent fingerprints are revealed and at theame time the background pattern from the CD insert is greatlyuppressed. The upper right corner of images (b) and (c) appearsrighter because those areas are showing the specular reflectionmage of the light source. This is an example where the finger-rint stained area, rather than the adjacent clean surface, shows
pecular reflection.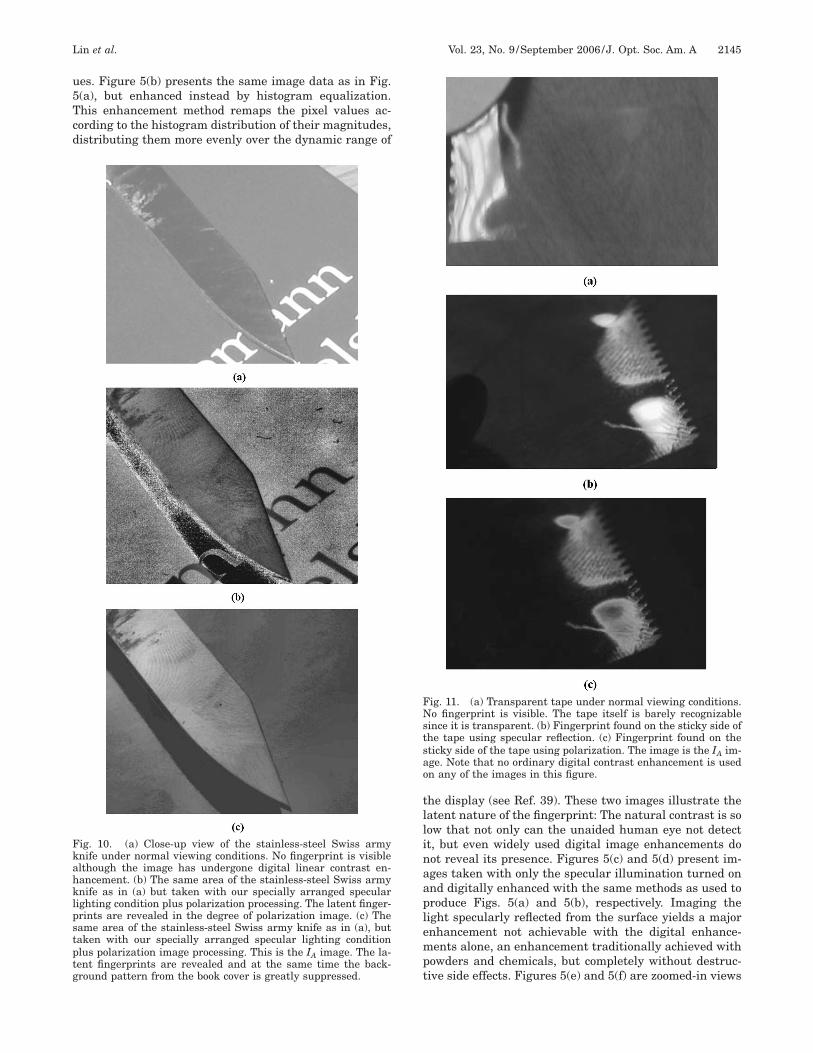
u5Tcd
tllinaaplempt
Fkahklpstptg
FNstsao
Lin et al. Vol. 23, No. 9 /September 2006 /J. Opt. Soc. Am. A 2145
es. Figure 5(b) presents the same image data as in Fig.(a), but enhanced instead by histogram equalization.his enhancement method remaps the pixel values ac-ording to the histogram distribution of their magnitudes,istributing them more evenly over the dynamic range of
ig. 10. (a) Close-up view of the stainless-steel Swiss armynife under normal viewing conditions. No fingerprint is visiblelthough the image has undergone digital linear contrast en-ancement. (b) The same area of the stainless-steel Swiss armynife as in (a) but taken with our specially arranged specularighting condition plus polarization processing. The latent finger-rints are revealed in the degree of polarization image. (c) Theame area of the stainless-steel Swiss army knife as in (a), butaken with our specially arranged specular lighting conditionlus polarization image processing. This is the IA image. The la-ent fingerprints are revealed and at the same time the back-round pattern from the book cover is greatly suppressed.
he display (see Ref. 39). These two images illustrate theatent nature of the fingerprint: The natural contrast is soow that not only can the unaided human eye not detectt, but even widely used digital image enhancements doot reveal its presence. Figures 5(c) and 5(d) present im-ges taken with only the specular illumination turned onnd digitally enhanced with the same methods as used toroduce Figs. 5(a) and 5(b), respectively. Imaging theight specularly reflected from the surface yields a majornhancement not achievable with the digital enhance-ents alone, an enhancement traditionally achieved with
owders and chemicals, but completely without destruc-ive side effects. Figures 5(e) and 5(f) are zoomed-in views
ig. 11. (a) Transparent tape under normal viewing conditions.o fingerprint is visible. The tape itself is barely recognizable
ince it is transparent. (b) Fingerprint found on the sticky side ofhe tape using specular reflection. (c) Fingerprint found on theticky side of the tape using polarization. The image is the IA im-ge. Note that no ordinary digital contrast enhancement is usedn any of the images in this figure.

siqtffiTnrpwqc
iccsswtaFledq6brprgplostat
oosnsosfipe7
lcruu
tac
ttifigmdcovm
smpH(tTnaaOhesh
Fievdh
2146 J. Opt. Soc. Am. A/Vol. 23, No. 9 /September 2006 Lin et al.
howing the detailed quality of the recovered fingerprintmages. As an example comparison with the fingerprintuality lifted by a conventional method, Fig. 5(g) showshe same fingerprint being lifted after being dusted withorensic black magnetic powder. Figure 5(h) shows thengerprint lifted by a forensic sticky tape after dusting.he fingerprint image quality recovered by the proposedoncontact method is more consistent compared with theesults obtained by powdering. It is difficult to spread theowder evenly across the whole fingerprint, and an areaith too much or too little powder will be lifted with loweruality. Furthermore, the process of lifting by sticky tapean itself introduce missing parts in the fingerprint.
The results of another experiment employing our non-nvasive optical method are illustrated in Fig. 6. In thisase, the surface with the latent fingerprint was the paperover of an ordinary desk calendar [Fig. 6(a)], which pre-ented a greater challenge than the solid colored metallicurface. The paper surface contained a printed patternhose light absorption interferes with the optical detec-
ion of the fingerprint. We used both specular reflectionnd polarization analysis to extract the latent fingerprint.or the polarization analysis, images were taken with a
inear polarization analyzer mounted in front of the cam-ra and oriented at three different angles. The pictureisplayed in Fig. 6(b) is the value image of the deriveduantity IA [see Eqs. (2)]. We emphasize here that Fig.(b) is not an image of the ordinary intensity distribution,ut rather a mapping of a certain physical quantity de-ived from the polarization distribution of the light com-rising the image. The specular component of the surfaceeflection is now evident, and the background pattern isone. Figure 6(c) shows a cropped close-up of the finger-rint area of the image seen in Fig. 6(b). These resultsead to two additional conclusions: First, the noninvasiveptical method can extract latent prints from some paperurfaces as well as from smoother surfaces; and second,he processing of the polarization information in the im-ge can further enhance the quality of the recovered la-ent fingerprint under certain conditions.
Sometimes the specular reflection component can bebscured by more intense diffuse reflection. We appliedur methods to such a case, deliberately picking one of thetrongest diffuse reflectors, a white cotton lining under-eath a soft clear plastic CD sleeve (Fig. 7). Figure 7(a)hows an image taken without a polarizing filter in frontf the camera. The diffuse white light is so strong that thepecular reflection output can barely enhance the latentngerprint on the plastic surface. However, theolarization-based analysis followed by the histogramqualization readily enhances the latent fingerprint [Figs.(b) and 7(c)].Figures 8–10 illustrate the fingerprint detection and
ifting capabilities of our new methods applied to severalommon items and surfaces. Note that our method is notestricted to viewing the surface at a right angle, and ourse of polarization is not restricted to glass and is notsed for removing glare.The sticky side of a tape has traditionally caused
rouble with invasive methods, especially methods thatpply powder to the surface. Most powders and reagentsan stick easily anywhere on the sticky surface, not just
he fingerprint area. In contrast, the sticky side of theape is ideally suited to our method. The sticky materials a thin coat of pliable semitransparent dielectric thatts our surface model perfectly. Whether the latent fin-erprint mark is formed by skin residue or by a plasticark formed on the sticky surface, our surface model pre-
icts that high-contrast intensity or polarization imagesan be formed with proper lighting. We tested our methodn a piece of transparent packing tape and the results areery good (Fig. 11). An example of plastic fingerprintark detection using our method is shown in Fig. 12.Figure 13 shows a series of experiments using both the
pecular-reflection-only-based and the polarization-basedethod detecting a fingerprint on the metal case of a
ump (the same pump surface as appeared in Fig. 5).ere the observing view angle of the camera is varied
with a corresponding change in the incident light direc-ion to maintain the specular reflection relationship).hree angles, 30, 45, and 75 deg, are chosen to representear-frontal, near-Brewster’s, and near-grazing viewngles. It is clear that the near-grazing angle is unsuit-ble because it is difficult to see the fingerprint pattern.n the other hand, the light from the light source usedere is definitely unpolarized. As predicted by the Fresnelquation, near the Brewster incidence angle of the sampleurface, the reflected light from the clean sample surfaceas a large degree of polarization while the light reflected
ig. 12. (a) Piece of hardened epoxy resin under ordinary light-ng conditions and view. No fingerprint is visible even after a lin-ar rescale to fit an 8 bit display. (b) Plastic fingerprint mark re-ealed on the same piece of hardened epoxy resin as in (a) in theegree of polarization image. No ordinary digital contrast en-ancement is used on this image.
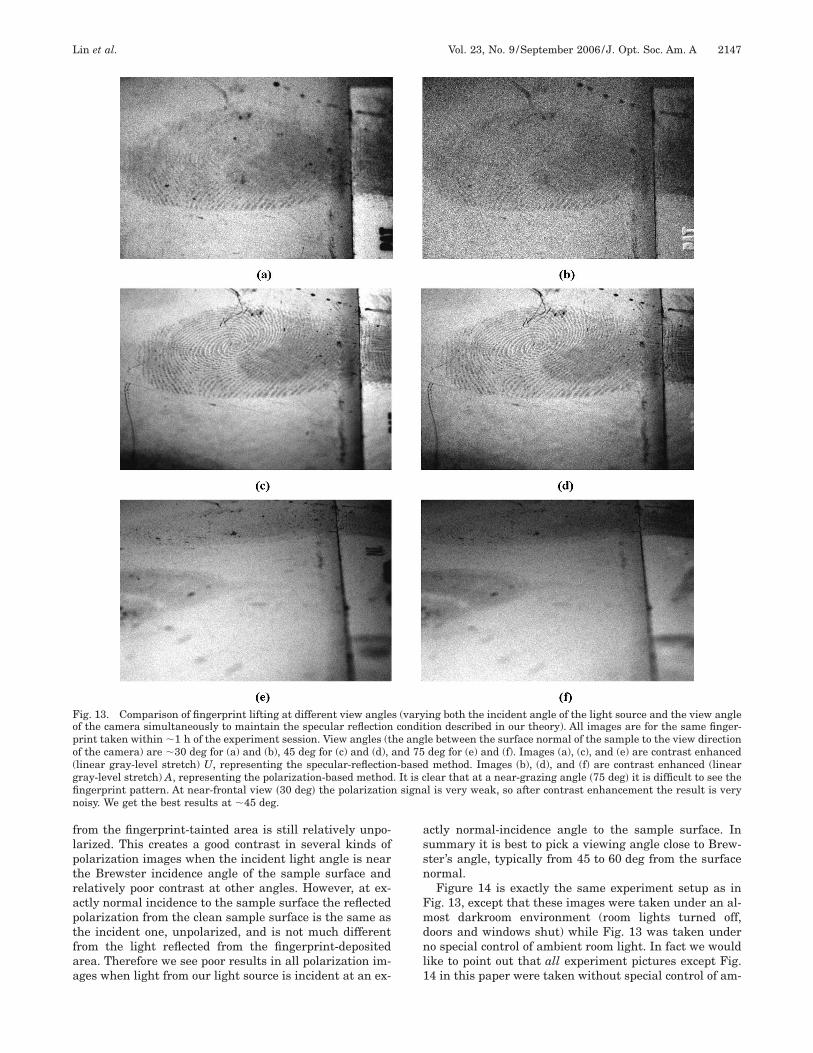
flptraptfaa
assn
Fmdnl1
Fopo(gfin
Lin et al. Vol. 23, No. 9 /September 2006 /J. Opt. Soc. Am. A 2147
rom the fingerprint-tainted area is still relatively unpo-arized. This creates a good contrast in several kinds ofolarization images when the incident light angle is nearhe Brewster incidence angle of the sample surface andelatively poor contrast at other angles. However, at ex-ctly normal incidence to the sample surface the reflectedolarization from the clean sample surface is the same ashe incident one, unpolarized, and is not much differentrom the light reflected from the fingerprint-depositedrea. Therefore we see poor results in all polarization im-ges when light from our light source is incident at an ex-
ig. 13. Comparison of fingerprint lifting at different view anglef the camera simultaneously to maintain the specular reflectionrint taken within �1 h of the experiment session. View angles (tf the camera) are �30 deg for (a) and (b), 45 deg for (c) and (d),linear gray-level stretch) U, representing the specular-reflectionray-level stretch) A, representing the polarization-based methodngerprint pattern. At near-frontal view �30 deg� the polarizationoisy. We get the best results at �45 deg.
ctly normal-incidence angle to the sample surface. Inummary it is best to pick a viewing angle close to Brew-ter’s angle, typically from 45 to 60 deg from the surfaceormal.Figure 14 is exactly the same experiment setup as in
ig. 13, except that these images were taken under an al-ost darkroom environment (room lights turned off,
oors and windows shut) while Fig. 13 was taken undero special control of ambient room light. In fact we would
ike to point out that all experiment pictures except Fig.4 in this paper were taken without special control of am-
ing both the incident angle of the light source and the view angleion described in our theory). All images are for the same finger-le between the surface normal of the sample to the view directiondeg for (e) and (f). Images (a), (c), and (e) are contrast enhancedmethod. Images (b), (d), and (f) are contrast enhanced (linear
lear that at a near-grazing angle �75 deg� it is difficult to see thel is very weak, so after contrast enhancement the result is very
s (varycondit
he angand 75-based
. It is csigna
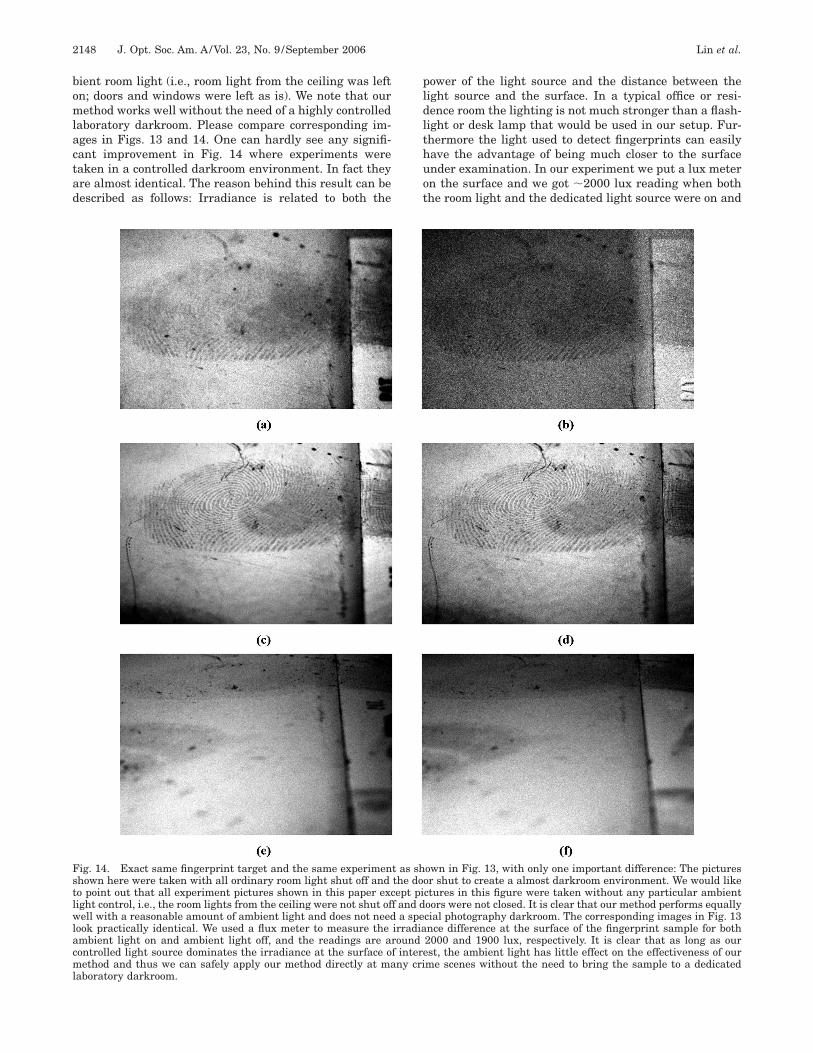
bomlactad
pldlthuot
Fstlwlacml
2148 J. Opt. Soc. Am. A/Vol. 23, No. 9 /September 2006 Lin et al.
ient room light (i.e., room light from the ceiling was leftn; doors and windows were left as is). We note that ourethod works well without the need of a highly controlled
aboratory darkroom. Please compare corresponding im-ges in Figs. 13 and 14. One can hardly see any signifi-ant improvement in Fig. 14 where experiments wereaken in a controlled darkroom environment. In fact theyre almost identical. The reason behind this result can beescribed as follows: Irradiance is related to both the
ig. 14. Exact same fingerprint target and the same experimenhown here were taken with all ordinary room light shut off ando point out that all experiment pictures shown in this paper excight control, i.e., the room lights from the ceiling were not shut ofell with a reasonable amount of ambient light and does not need
ook practically identical. We used a flux meter to measure thembient light on and ambient light off, and the readings are aontrolled light source dominates the irradiance at the surface oethod and thus we can safely apply our method directly at ma
aboratory darkroom.
ower of the light source and the distance between theight source and the surface. In a typical office or resi-ence room the lighting is not much stronger than a flash-ight or desk lamp that would be used in our setup. Fur-hermore the light used to detect fingerprints can easilyave the advantage of being much closer to the surfacender examination. In our experiment we put a lux metern the surface and we got �2000 lux reading when bothhe room light and the dedicated light source were on and
own in Fig. 13, with only one important difference: The picturesor shut to create a almost darkroom environment. We would likectures in this figure were taken without any particular ambientoors were not closed. It is clear that our method performs equallycial photography darkroom. The corresponding images in Fig. 13nce difference at the surface of the fingerprint sample for both2000 and 1900 lux, respectively. It is clear that as long as ourst, the ambient light has little effect on the effectiveness of our
me scenes without the need to bring the sample to a dedicated
t as shthe doept pi
f and da spe
irradiaroundf intereny cri
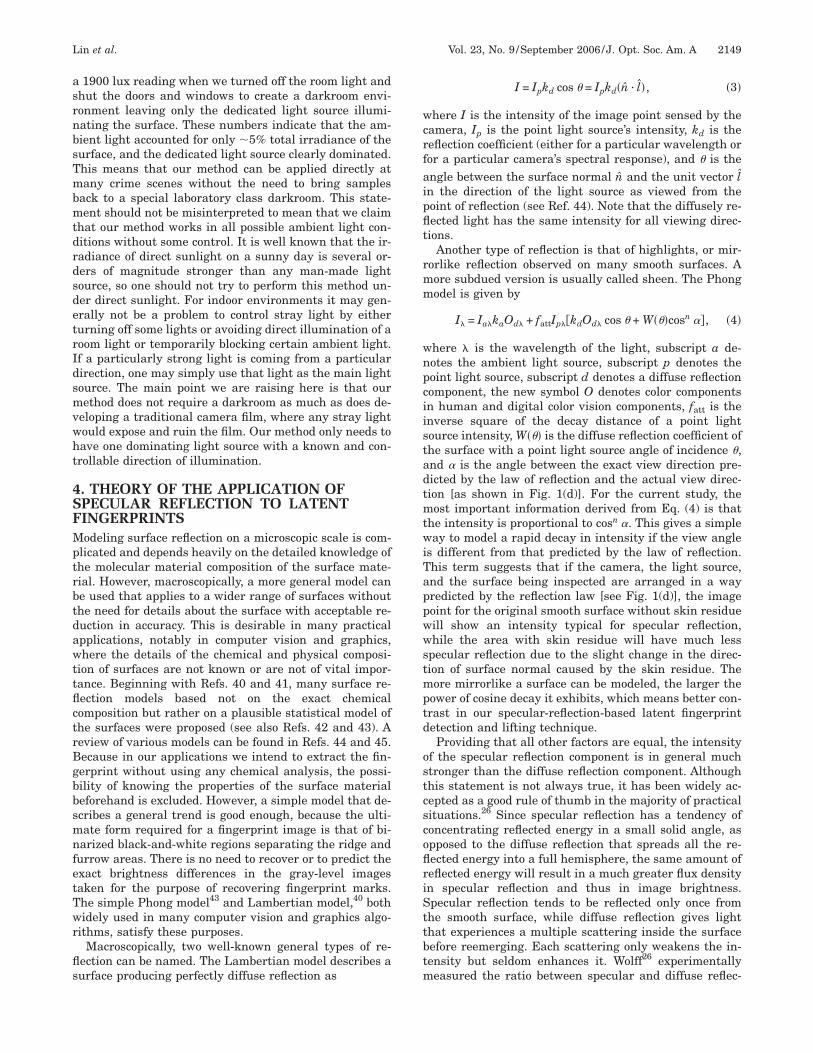
asrnbsTmbmtdrdsdetrIdsmvwht
4SFMptrbtdawttflctrBgbbsmnfetTwr
fls
wcrfaipflt
rmm
wnpciistadtmtwiTappwwstmptd
ostcscoflriSttbtm
Lin et al. Vol. 23, No. 9 /September 2006 /J. Opt. Soc. Am. A 2149
1900 lux reading when we turned off the room light andhut the doors and windows to create a darkroom envi-onment leaving only the dedicated light source illumi-ating the surface. These numbers indicate that the am-ient light accounted for only �5% total irradiance of theurface, and the dedicated light source clearly dominated.his means that our method can be applied directly atany crime scenes without the need to bring samples
ack to a special laboratory class darkroom. This state-ent should not be misinterpreted to mean that we claim
hat our method works in all possible ambient light con-itions without some control. It is well known that the ir-adiance of direct sunlight on a sunny day is several or-ers of magnitude stronger than any man-made lightource, so one should not try to perform this method un-er direct sunlight. For indoor environments it may gen-rally not be a problem to control stray light by eitherurning off some lights or avoiding direct illumination of aoom light or temporarily blocking certain ambient light.f a particularly strong light is coming from a particularirection, one may simply use that light as the main lightource. The main point we are raising here is that ourethod does not require a darkroom as much as does de-
eloping a traditional camera film, where any stray lightould expose and ruin the film. Our method only needs toave one dominating light source with a known and con-rollable direction of illumination.
. THEORY OF THE APPLICATION OFPECULAR REFLECTION TO LATENTINGERPRINTSodeling surface reflection on a microscopic scale is com-
licated and depends heavily on the detailed knowledge ofhe molecular material composition of the surface mate-ial. However, macroscopically, a more general model cane used that applies to a wider range of surfaces withouthe need for details about the surface with acceptable re-uction in accuracy. This is desirable in many practicalpplications, notably in computer vision and graphics,here the details of the chemical and physical composi-
ion of surfaces are not known or are not of vital impor-ance. Beginning with Refs. 40 and 41, many surface re-ection models based not on the exact chemicalomposition but rather on a plausible statistical model ofhe surfaces were proposed (see also Refs. 42 and 43). Aeview of various models can be found in Refs. 44 and 45.ecause in our applications we intend to extract the fin-erprint without using any chemical analysis, the possi-ility of knowing the properties of the surface materialeforehand is excluded. However, a simple model that de-cribes a general trend is good enough, because the ulti-ate form required for a fingerprint image is that of bi-arized black-and-white regions separating the ridge and
urrow areas. There is no need to recover or to predict thexact brightness differences in the gray-level imagesaken for the purpose of recovering fingerprint marks.he simple Phong model43 and Lambertian model,40 bothidely used in many computer vision and graphics algo-
ithms, satisfy these purposes.Macroscopically, two well-known general types of re-
ection can be named. The Lambertian model describes aurface producing perfectly diffuse reflection as
I = Ipkd cos � = Ipkd�n̂ · l̂�, �3�
here I is the intensity of the image point sensed by theamera, Ip is the point light source’s intensity, kd is theeflection coefficient (either for a particular wavelength oror a particular camera’s spectral response), and � is thengle between the surface normal n̂ and the unit vector l̂n the direction of the light source as viewed from theoint of reflection (see Ref. 44). Note that the diffusely re-ected light has the same intensity for all viewing direc-ions.
Another type of reflection is that of highlights, or mir-orlike reflection observed on many smooth surfaces. Aore subdued version is usually called sheen. The Phongodel is given by
I� = Ia�kaOd� + fattIp��kdOd� cos � + W���cosn ��, �4�
here � is the wavelength of the light, subscript a de-otes the ambient light source, subscript p denotes theoint light source, subscript d denotes a diffuse reflectionomponent, the new symbol O denotes color componentsn human and digital color vision components, fatt is thenverse square of the decay distance of a point lightource intensity, W��� is the diffuse reflection coefficient ofhe surface with a point light source angle of incidence �,nd � is the angle between the exact view direction pre-icted by the law of reflection and the actual view direc-ion [as shown in Fig. 1(d)]. For the current study, theost important information derived from Eq. (4) is that
he intensity is proportional to cosn �. This gives a simpleay to model a rapid decay in intensity if the view angle
s different from that predicted by the law of reflection.his term suggests that if the camera, the light source,nd the surface being inspected are arranged in a wayredicted by the reflection law [see Fig. 1(d)], the imageoint for the original smooth surface without skin residueill show an intensity typical for specular reflection,hile the area with skin residue will have much less
pecular reflection due to the slight change in the direc-ion of surface normal caused by the skin residue. Theore mirrorlike a surface can be modeled, the larger the
ower of cosine decay it exhibits, which means better con-rast in our specular-reflection-based latent fingerprintetection and lifting technique.Providing that all other factors are equal, the intensity
f the specular reflection component is in general muchtronger than the diffuse reflection component. Althoughhis statement is not always true, it has been widely ac-epted as a good rule of thumb in the majority of practicalituations.26 Since specular reflection has a tendency ofoncentrating reflected energy in a small solid angle, aspposed to the diffuse reflection that spreads all the re-ected energy into a full hemisphere, the same amount ofeflected energy will result in a much greater flux densityn specular reflection and thus in image brightness.pecular reflection tends to be reflected only once fromhe smooth surface, while diffuse reflection gives lighthat experiences a multiple scattering inside the surfaceefore reemerging. Each scattering only weakens the in-ensity but seldom enhances it. Wolff26 experimentallyeasured the ratio between specular and diffuse reflec-
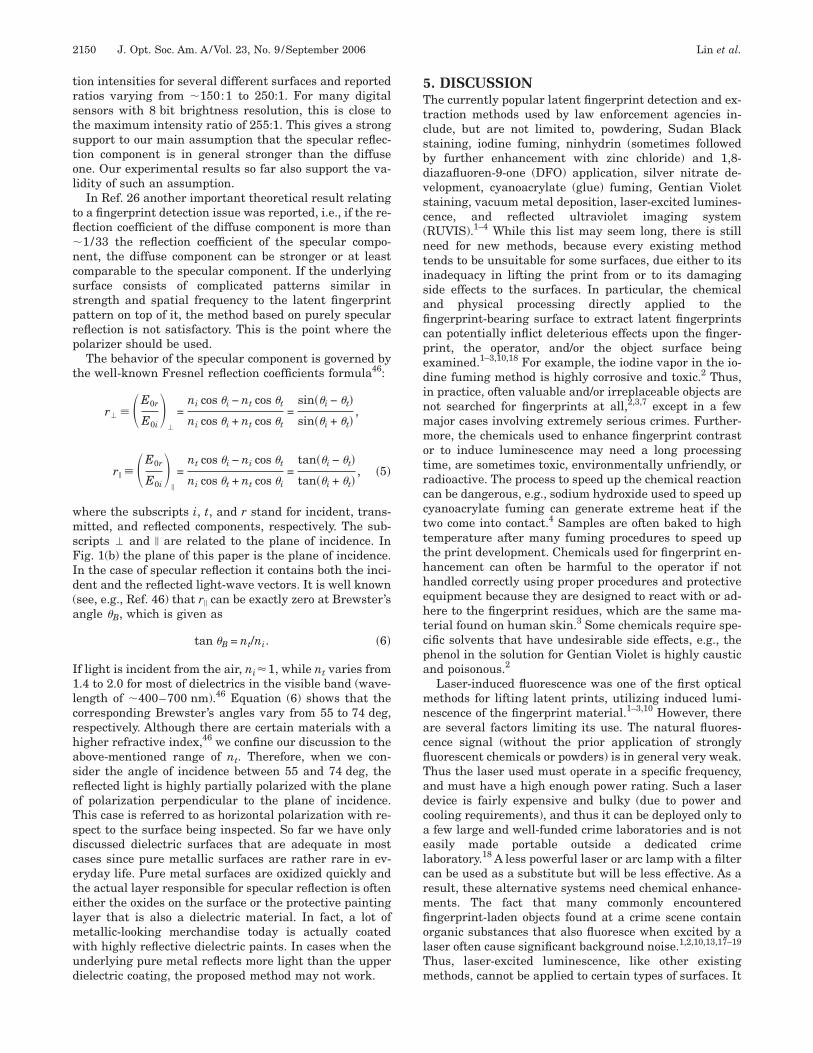
trststol
tfl�ncssprp
t
wmsFId(a
I1lcrhasroTsdcetelmwud
5Ttcsbdvsc(ntisaficpedinmmotrccttthhehtcpa
mnacflTadcaelcrmfiolTm
2150 J. Opt. Soc. Am. A/Vol. 23, No. 9 /September 2006 Lin et al.
ion intensities for several different surfaces and reportedatios varying from �150:1 to 250:1. For many digitalensors with 8 bit brightness resolution, this is close tohe maximum intensity ratio of 255:1. This gives a strongupport to our main assumption that the specular reflec-ion component is in general stronger than the diffusene. Our experimental results so far also support the va-idity of such an assumption.
In Ref. 26 another important theoretical result relatingo a fingerprint detection issue was reported, i.e., if the re-ection coefficient of the diffuse component is more than1/33 the reflection coefficient of the specular compo-ent, the diffuse component can be stronger or at leastomparable to the specular component. If the underlyingurface consists of complicated patterns similar intrength and spatial frequency to the latent fingerprintattern on top of it, the method based on purely speculareflection is not satisfactory. This is the point where theolarizer should be used.The behavior of the specular component is governed by
he well-known Fresnel reflection coefficients formula46:
r� � E0r
E0i�
�
=ni cos �i − nt cos �t
ni cos �i + nt cos �t=
sin��i − �t�
sin��i + �t�,
r� � E0r
E0i�
�
=nt cos �i − ni cos �t
ni cos �t + nt cos �i=
tan��i − �t�
tan��i + �t�, �5�
here the subscripts i, t, and r stand for incident, trans-itted, and reflected components, respectively. The sub-
cripts � and � are related to the plane of incidence. Inig. 1(b) the plane of this paper is the plane of incidence.n the case of specular reflection it contains both the inci-ent and the reflected light-wave vectors. It is well knownsee, e.g., Ref. 46) that r� can be exactly zero at Brewster’sngle �B, which is given as
tan �B = nt/ni. �6�
f light is incident from the air, ni 1, while nt varies from.4 to 2.0 for most of dielectrics in the visible band (wave-ength of �400–700 nm).46 Equation (6) shows that theorresponding Brewster’s angles vary from 55 to 74 deg,espectively. Although there are certain materials with aigher refractive index,46 we confine our discussion to thebove-mentioned range of nt. Therefore, when we con-ider the angle of incidence between 55 and 74 deg, theeflected light is highly partially polarized with the planef polarization perpendicular to the plane of incidence.his case is referred to as horizontal polarization with re-pect to the surface being inspected. So far we have onlyiscussed dielectric surfaces that are adequate in mostases since pure metallic surfaces are rather rare in ev-ryday life. Pure metal surfaces are oxidized quickly andhe actual layer responsible for specular reflection is oftenither the oxides on the surface or the protective paintingayer that is also a dielectric material. In fact, a lot of
etallic-looking merchandise today is actually coatedith highly reflective dielectric paints. In cases when thenderlying pure metal reflects more light than the upperielectric coating, the proposed method may not work.
. DISCUSSIONhe currently popular latent fingerprint detection and ex-
raction methods used by law enforcement agencies in-lude, but are not limited to, powdering, Sudan Blacktaining, iodine fuming, ninhydrin (sometimes followedy further enhancement with zinc chloride) and 1,8-iazafluoren-9-one (DFO) application, silver nitrate de-elopment, cyanoacrylate (glue) fuming, Gentian Violettaining, vacuum metal deposition, laser-excited lumines-ence, and reflected ultraviolet imaging systemRUVIS).1–4 While this list may seem long, there is stilleed for new methods, because every existing methodends to be unsuitable for some surfaces, due either to itsnadequacy in lifting the print from or to its damagingide effects to the surfaces. In particular, the chemicalnd physical processing directly applied to thengerprint-bearing surface to extract latent fingerprintsan potentially inflict deleterious effects upon the finger-rint, the operator, and/or the object surface beingxamined.1–3,10,18 For example, the iodine vapor in the io-ine fuming method is highly corrosive and toxic.2 Thus,n practice, often valuable and/or irreplaceable objects areot searched for fingerprints at all,2,3,7 except in a fewajor cases involving extremely serious crimes. Further-ore, the chemicals used to enhance fingerprint contrast
r to induce luminescence may need a long processingime, are sometimes toxic, environmentally unfriendly, oradioactive. The process to speed up the chemical reactionan be dangerous, e.g., sodium hydroxide used to speed upyanoacrylate fuming can generate extreme heat if thewo come into contact.4 Samples are often baked to highemperature after many fuming procedures to speed uphe print development. Chemicals used for fingerprint en-ancement can often be harmful to the operator if notandled correctly using proper procedures and protectivequipment because they are designed to react with or ad-ere to the fingerprint residues, which are the same ma-erial found on human skin.3 Some chemicals require spe-ific solvents that have undesirable side effects, e.g., thehenol in the solution for Gentian Violet is highly causticnd poisonous.2
Laser-induced fluorescence was one of the first opticalethods for lifting latent prints, utilizing induced lumi-escence of the fingerprint material.1–3,10 However, therere several factors limiting its use. The natural fluores-ence signal (without the prior application of stronglyuorescent chemicals or powders) is in general very weak.hus the laser used must operate in a specific frequency,nd must have a high enough power rating. Such a laserevice is fairly expensive and bulky (due to power andooling requirements), and thus it can be deployed only tofew large and well-funded crime laboratories and is not
asily made portable outside a dedicated crimeaboratory.18 A less powerful laser or arc lamp with a filteran be used as a substitute but will be less effective. As aesult, these alternative systems need chemical enhance-ents. The fact that many commonly encounteredngerprint-laden objects found at a crime scene containrganic substances that also fluoresce when excited by aaser often cause significant background noise.1,2,10,13,17–19
hus, laser-excited luminescence, like other existingethods, cannot be applied to certain types of surfaces. It
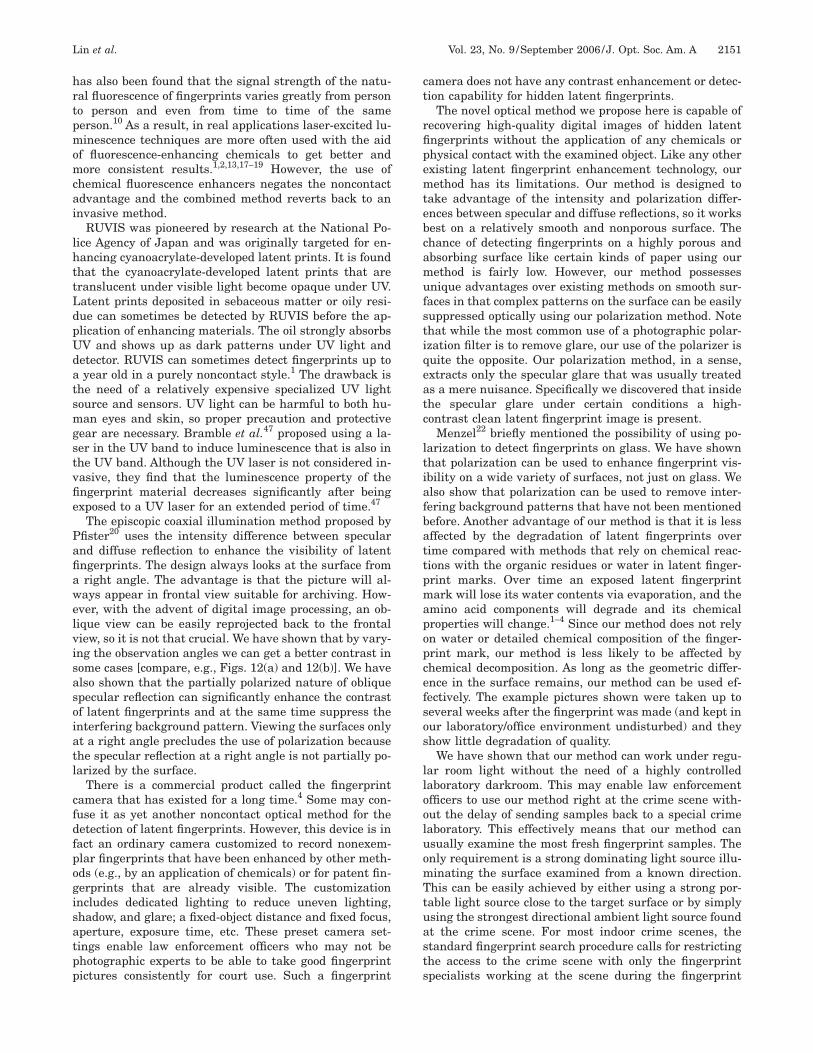
hrtpmomcai
lhttLdpUdatsmgstvfie
Pafiawelvisasoiatl
cfdfpogisatpp
ct
rfipemtebcamufstiqeatc
ltiafbattpmapopcefsos
llooluomTtuasts
Lin et al. Vol. 23, No. 9 /September 2006 /J. Opt. Soc. Am. A 2151
as also been found that the signal strength of the natu-al fluorescence of fingerprints varies greatly from persono person and even from time to time of the sameerson.10 As a result, in real applications laser-excited lu-inescence techniques are more often used with the aid
f fluorescence-enhancing chemicals to get better andore consistent results.1,2,13,17–19 However, the use of
hemical fluorescence enhancers negates the noncontactdvantage and the combined method reverts back to annvasive method.
RUVIS was pioneered by research at the National Po-ice Agency of Japan and was originally targeted for en-ancing cyanoacrylate-developed latent prints. It is foundhat the cyanoacrylate-developed latent prints that areranslucent under visible light become opaque under UV.atent prints deposited in sebaceous matter or oily resi-ue can sometimes be detected by RUVIS before the ap-lication of enhancing materials. The oil strongly absorbsV and shows up as dark patterns under UV light andetector. RUVIS can sometimes detect fingerprints up toyear old in a purely noncontact style.1 The drawback is
he need of a relatively expensive specialized UV lightource and sensors. UV light can be harmful to both hu-an eyes and skin, so proper precaution and protective
ear are necessary. Bramble et al.47 proposed using a la-er in the UV band to induce luminescence that is also inhe UV band. Although the UV laser is not considered in-asive, they find that the luminescence property of thengerprint material decreases significantly after beingxposed to a UV laser for an extended period of time.47
The episcopic coaxial illumination method proposed byfister20 uses the intensity difference between specularnd diffuse reflection to enhance the visibility of latentngerprints. The design always looks at the surface fromright angle. The advantage is that the picture will al-ays appear in frontal view suitable for archiving. How-ver, with the advent of digital image processing, an ob-ique view can be easily reprojected back to the frontaliew, so it is not that crucial. We have shown that by vary-ng the observation angles we can get a better contrast inome cases [compare, e.g., Figs. 12(a) and 12(b)]. We havelso shown that the partially polarized nature of obliquepecular reflection can significantly enhance the contrastf latent fingerprints and at the same time suppress thenterfering background pattern. Viewing the surfaces onlyt a right angle precludes the use of polarization becausehe specular reflection at a right angle is not partially po-arized by the surface.
There is a commercial product called the fingerprintamera that has existed for a long time.4 Some may con-use it as yet another noncontact optical method for theetection of latent fingerprints. However, this device is inact an ordinary camera customized to record nonexem-lar fingerprints that have been enhanced by other meth-ds (e.g., by an application of chemicals) or for patent fin-erprints that are already visible. The customizationncludes dedicated lighting to reduce uneven lighting,hadow, and glare; a fixed-object distance and fixed focus,perture, exposure time, etc. These preset camera set-ings enable law enforcement officers who may not behotographic experts to be able to take good fingerprintictures consistently for court use. Such a fingerprint
amera does not have any contrast enhancement or detec-ion capability for hidden latent fingerprints.
The novel optical method we propose here is capable ofecovering high-quality digital images of hidden latentngerprints without the application of any chemicals orhysical contact with the examined object. Like any otherxisting latent fingerprint enhancement technology, ourethod has its limitations. Our method is designed to
ake advantage of the intensity and polarization differ-nces between specular and diffuse reflections, so it worksest on a relatively smooth and nonporous surface. Thehance of detecting fingerprints on a highly porous andbsorbing surface like certain kinds of paper using ourethod is fairly low. However, our method possessesnique advantages over existing methods on smooth sur-aces in that complex patterns on the surface can be easilyuppressed optically using our polarization method. Notehat while the most common use of a photographic polar-zation filter is to remove glare, our use of the polarizer isuite the opposite. Our polarization method, in a sense,xtracts only the specular glare that was usually treateds a mere nuisance. Specifically we discovered that insidehe specular glare under certain conditions a high-ontrast clean latent fingerprint image is present.
Menzel22 briefly mentioned the possibility of using po-arization to detect fingerprints on glass. We have shownhat polarization can be used to enhance fingerprint vis-bility on a wide variety of surfaces, not just on glass. Welso show that polarization can be used to remove inter-ering background patterns that have not been mentionedefore. Another advantage of our method is that it is lessffected by the degradation of latent fingerprints overime compared with methods that rely on chemical reac-ions with the organic residues or water in latent finger-rint marks. Over time an exposed latent fingerprintark will lose its water contents via evaporation, and the
mino acid components will degrade and its chemicalroperties will change.1–4 Since our method does not relyn water or detailed chemical composition of the finger-rint mark, our method is less likely to be affected byhemical decomposition. As long as the geometric differ-nce in the surface remains, our method can be used ef-ectively. The example pictures shown were taken up toeveral weeks after the fingerprint was made (and kept inur laboratory/office environment undisturbed) and theyhow little degradation of quality.
We have shown that our method can work under regu-ar room light without the need of a highly controlledaboratory darkroom. This may enable law enforcementfficers to use our method right at the crime scene with-ut the delay of sending samples back to a special crimeaboratory. This effectively means that our method cansually examine the most fresh fingerprint samples. Thenly requirement is a strong dominating light source illu-inating the surface examined from a known direction.his can be easily achieved by either using a strong por-
able light source close to the target surface or by simplysing the strongest directional ambient light source foundt the crime scene. For most indoor crime scenes, thetandard fingerprint search procedure calls for restrictinghe access to the crime scene with only the fingerprintpecialists working at the scene during the fingerprint
sdosebvdssd
csapgmpneos
6Whfitimnnbalnslgito
AToFI
R
1
1
1
1
1
1
1
1
1
1
2
2
2
2
2
2
2
2
2
2152 J. Opt. Soc. Am. A/Vol. 23, No. 9 /September 2006 Lin et al.
earch. The specialists have total control over the sceneuring the search so it is generally not a problem to turnn and off any room light. It is also quite easy to useomething like a shade to temporarily block some ambi-nt light, e.g., a piece of cloth, an umbrella, or even theody of the specialist because the size of a fingerprint isery small. In other words, our method can be performedirectly in most crime scenes and even more cases withimple common sense regarding light control. There is es-entially no need for a special darkroom similar to a filmeveloping darkroom.Because of the great variety of latent fingerprints that
an potentially be found in very different crime scenes, noingle latent fingerprint enhancement method can handlell possible cases. Since every method targets differenthysical and chemical properties of different kinds of fin-erprints, it is often found that applying more than oneethod on the same surface will unveil different finger-
rints for different methods.18 Thus the introduction of aew latent fingerprint detection method that uses differ-nt physical principles than those used by existing meth-ds and one that will not interfere with other methodshould be beneficial to law enforcement efforts.
. CONCLUSIONe have introduced a novel optical method to detect, en-
ance, and lift latent fingerprints that are otherwise dif-cult to see. The method is noninvasive and so will not in-erfere with other forensic examinations and will notnflict deleterious side effects on the surface. The equip-
ent required is much less expensive than most otheroncontact methods proposed so far. The new method isot applicable to highly porous and absorbing surfacesut works well on most other surfaces. The new methodlso works on the sticky side of tape, which is a particu-arly problematic surface for many invasive methods. Theew method can be easily performed right at the crimecene without the need to bring samples to a specializedaboratory. The recovered latent fingerprint image hasood quality compared with other existing methods. Sincet does not interfere with other methods, it is advisable tory this method before other invasive or destructive meth-ds.
CKNOWLEDGMENTShis work has been supported by the U.S. Air Force Officef Scientific Research through grants F49620-02-1-0140,A9550-05-1-0052, and the Defense University Researchnstrumentation Program grant F49620-02-1-0241.
EFERENCES1. H. C. Lee and R. E. Gaensslen, eds., Advances in
Fingerprint Technology (CRC Press, 1994).2. H. C. Lee and R. E. Gaensslen, eds., Advances in
Fingerprint Technology, 2nd ed. (CRC Press, 2001).3. C. A. Coppock, Contrast: An Investigator’s Basic Reference
Guide to Fingerprint Identification Concepts (Thomas,2001).
4. Federal Bureau of Investigation, The Science of
Fingerprints: Classification and Uses (U.S. GovernmentPrinting Office, 1984).
5. S. G. Demos and R. R. Alfano, “Optical fingerprinting usingpolarisation contrast improvement,” Electron. Lett. 33,582–584 (1997).
6. K. H. Fielding, J. L. Horner, and C. K. Makekau, “Opticalfingerprint identification by binary joint transformcorrelation,” Opt. Eng. 30, 1958–1961 (1991).
7. W. R. Scott, Fingerprint Mechanics, A Handbook:Fingerprints from Crime Scene to Courtroom (Thomas,1951).
8. R. D. Olsen, Sr., Scott’s Fingerprint Mechanics (Thomas,1978).
9. P. Margot and C. Lennard, Fingerprint DetectionTechniques (Institut de police scientifique et decriminologie, Université de Lausanne, Lausanne,Switzerland, 1994).
0. B. E. Dalrymple, J. M. Duff, and E. R. Menzel, “Inherentfingerprint luminescence—detection by laser,” J. ForensicSci. 22, 106–115 (1977).
1. E. R. German, “Computer image enhancement of latentprints and hard copy output devices,” in Proceedings of theInternational Forensic Symposium on Latent Prints(Laboratory and Identification Divisions, Federal Bureau ofInvestigation, 1987), pp. 151–152.
2. M. C. Cubuk and S. Saygi, “A rising value in evidencedetection: ultraviolet light,” Forensic Sci. Int. 136, 128(2003).
3. E. R. Menzel and J. M. Duff, “Laser detection of latentfingerprints—treatment with fluorescers,” J. Forensic Sci.24, 96–100 (1979).
4. E. R. Menzel, “Laser detection of latent fingerprints—treatment with phosphorescers,” J. Forensic Sci. 24,582–585 (1979).
5. E. R. Menzel and K. E. Fox, “Laser detection of latentfingerprints: preparation of fluorescent dusting powdersand the feasibility of a portable system,” J. Forensic Sci. 25,150–153 (1980).
6. D. W. Herod and E. R. Menzel, “Laser detection of latentfingerprints: ninhydrin,” J. Forensic Sci. 27, 200–204(1982).
7. D. W. Herod and E. R. Menzel, “Laser detection of latentfingerprints: ninhydrin followed by zinc chloride,” J.Forensic Sci. 27, 513–518 (1982).
8. K. E. Creer, “Operational experience in the detection andphotography of latent fingerprints by argon-ion laser,”Forensic Sci. Int. 23, 149–160 (1983).
9. E. R. Menzel, J. A. Burt, and T. W. Sinor, “Laser detectionof latent fingerprints: treatment with glue containingcyanoacrylate ester,” J. Forensic Sci. 28, 307–317 (1983).
0. R. Pfister, “The optical revelation of latent fingerprints,”Fingerprint World 10, 64–70 (1985).
1. C. J. Lennard and P. A. Margot, “Sequencing of reagents forthe improved visualisation of latent fingerprints,” J.Forensic Ident. 38, 197–210 (1988).
2. E. R. Menzel, Fingerprint Detection with Lasers (MarcelDekker, 1999).
3. D. Maltoni, D. Maio, A. K. Jain, and S. Prabhakar,Handbook of Fingerprint Recognition (Springer-Verlag,2003).
4. R. Schwind, “Zonation of the optical environment andzonation in the rhabdom structure within the eye of thebackswimmer, Notenecta glauca,” Cell Tissue Res. 232,53–63 (1983).
5. G. Horváth, “Reflection polarization patterns at flat watersurfaces and their relevance for insect polarization vision,”J. Theor. Biol. 175, 27–37 (1995).
6. L. B. Wolff, “Relative brightness of specular and diffusereflection,” Opt. Eng. 33, 285–293 (1994).
7. B. E. Dalrymple and T. Menzies, “Computer enhancementof evidence through background noise suppression,” J.Forensic Sci. 39, 537–546 (1994).
8. T. Ko, “Fingerprint enhancement by spectral analysistechniques,” in Proceedings of the 31st Applied ImageryPattern Recognition Workshop (IEEE Press, 2002), pp.133–139.
2
3
3
3
3
3
3
3
3
3
3
4
4
4
4
4
4
44
Lin et al. Vol. 23, No. 9 /September 2006 /J. Opt. Soc. Am. A 2153
9. S.-S. Lin, K. M. Yemelyanov, E. N. Pugh, Jr., and N.Engheta, “Polarization enhanced visual surveillancetechniques,” invited paper, in Proceedings of IEEEInternational Conference on Networking, Sensing andControl (IEEE Systems, Man and Cybernetics Society,2004).
0. K. M. Yemelyanov, S.-S. Lin, W. Q. Luis, E. N. Pugh, Jr.,and N. Engheta, “Bio-inspired display of polarizationinformation using selected visual cues,” in PolarizationScience and Remote Sensing, J. A. Shaw and J. S. Tyo, eds.,Proc. SPIE 5158, 71–84 (2003), Vol. 1, pp. 216–221.
1. L. B. Wolff, “Polarization camera for computer vision with abeam splitter,” J. Opt. Soc. Am. A 11, 2935–2945 (1994).
2. L. B. Wolff and A. G. Andreou, “Polarization camerasensors,” Image Vis. Comput. 13, 497–510 (1995).
3. L. B. Wolff, T. A. Mancini, P. Pouliquen, and A. G. Andreou,“Liquid crystal polarization camera,” IEEE Trans. Rob.Autom. 13, 195–203 (1997).
4. M. P. Rowe, E. N. Pugh Jr., and N. Engheta, “Polarization-difference imaging: a biologically inspired technique forobservation through scattering media,” Opt. Lett. 20,608–610 (1995).
5. J. S. Tyo, M. P. Rowe, E. N. Pugh Jr., and N. Engheta,“Target detection in optically scattering media bypolarization-difference imaging,” Appl. Opt. 35, 1855–1870(1996).
6. J. S. Tyo, E. N. Pugh Jr., and N. Engheta, “Colorimetricrepresentation for use with polarization-difference imagingof objects in scattering media,” J. Opt. Soc. Am. A 15,367–374 (1998).
7. J. S. Tyo, “Optimum linear combination strategy for anN-channel polarization-sensitive imaging or vision system,”J. Opt. Soc. Am. A 15, 359–366 (1998).
8. K. M. Yemelyanov, M. A. Lo, E. N. Pugh Jr., and N.Engheta, “Display of polarization information bycoherently moving dots,” Opt. Express 11, 1577–1584(2003).
9. R. C. Gonzalez and R. E. Woods, Digital Image Processing(Prentice Hall, 2001).
0. J. H. Lambert, Photometria sive de mensura et gradibusluminus, colorum et umbrae (Eberhard Klett, 1760).
1. K. E. Torrance and E. M. Sparrow, “Theory for off-specularreflection from roughened surfaces,” J. Opt. Soc. Am. 57,1105–1114 (1967).
2. R. L. Cook and K. E. Torrance, “A reflectance model forcomputer graphics,” Comput. Graph. 15, 307–316(1981).
3. B.-T. Phong, “Illumination for computer generatedpictures,” Commun. ACM 18, 311–317 (1975).
4. J. D. Foley, A. vanDam, S. K. Feiner, and J. F. Hughes,Computer Graphics: Principles and Practice (Addison-Wesley, 1990).
5. S. K. Nayar, K. Ikeuchi, and T. Kanade, “Surface reflection:physical and geometrical perspectives,” IEEE Trans.Pattern Anal. Mach. Intell. 13, 611–634 (1991).
6. E. Hecht, Optics (Addison-Wesley Longman, 1998).7. S. K. Bramble, K. E. Creer, W. G. Qiang, and B. Sheard,
“Ultraviolet luminescence from latent fingerprints,”Forensic Sci. Int. 59, 3–14 (1993).
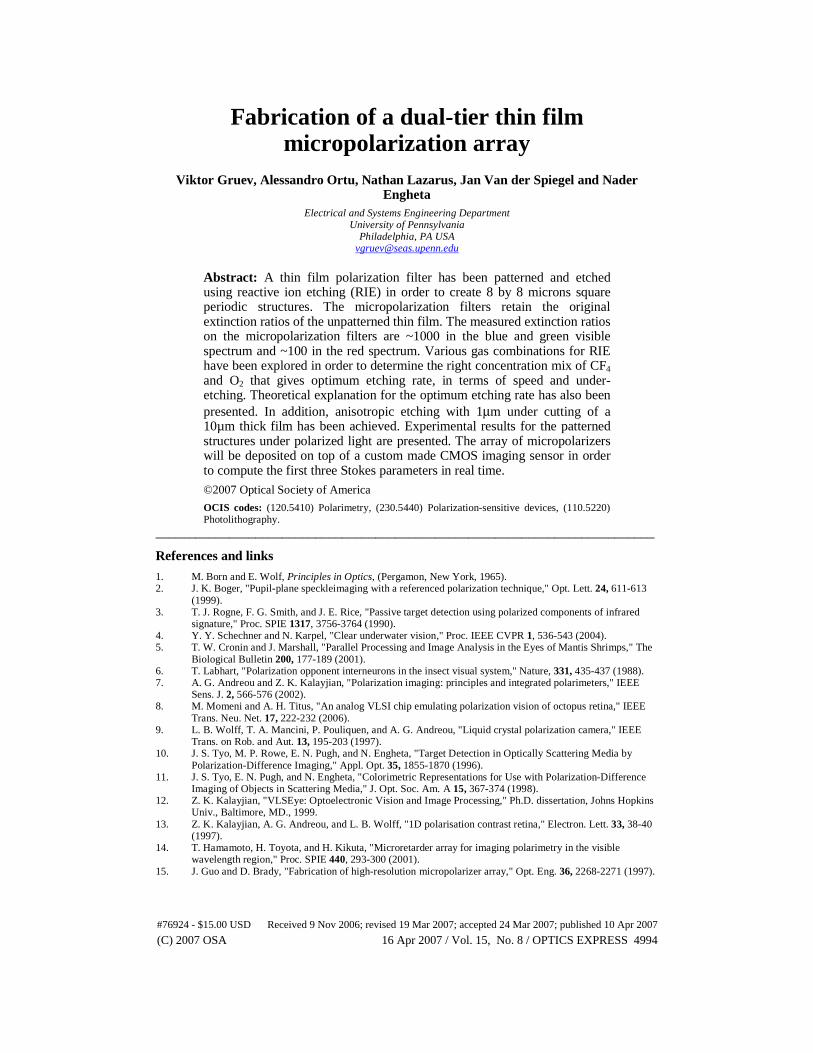
Fabrication of a dual-tier thin film micropolarization array
Viktor Gruev, Alessandro Ortu, Nathan Lazarus, Jan Van der Spiegel and Nader Engheta
Electrical and Systems Engineering Department University of Pennsylvania
Philadelphia, PA USA [email protected]
Abstract: A thin film polarization filter has been patterned and etched using reactive ion etching (RIE) in order to create 8 by 8 microns square periodic structures. The micropolarization filters retain the original extinction ratios of the unpatterned thin film. The measured extinction ratios on the micropolarization filters are ~1000 in the blue and green visible spectrum and ~100 in the red spectrum. Various gas combinations for RIE have been explored in order to determine the right concentration mix of CF4 and O2 that gives optimum etching rate, in terms of speed and under-etching. Theoretical explanation for the optimum etching rate has also been presented. In addition, anisotropic etching with 1μm under cutting of a 10µm thick film has been achieved. Experimental results for the patterned structures under polarized light are presented. The array of micropolarizers will be deposited on top of a custom made CMOS imaging sensor in order to compute the first three Stokes parameters in real time.
©2007 Optical Society of America
OCIS codes: (120.5410) Polarimetry, (230.5440) Polarization-sensitive devices, (110.5220) Photolithography.
___________________________________________________________________________
References and links
1. M. Born and E. Wolf, Principles in Optics, (Pergamon, New York, 1965). 2. J. K. Boger, "Pupil-plane speckleimaging with a referenced polarization technique," Opt. Lett. 24, 611-613
(1999). 3. T. J. Rogne, F. G. Smith, and J. E. Rice, "Passive target detection using polarized components of infrared
signature," Proc. SPIE 1317, 3756-3764 (1990). 4. Y. Y. Schechner and N. Karpel, "Clear underwater vision," Proc. IEEE CVPR 1, 536-543 (2004). 5. T. W. Cronin and J. Marshall, "Parallel Processing and Image Analysis in the Eyes of Mantis Shrimps," The
Biological Bulletin 200, 177-189 (2001). 6. T. Labhart, "Polarization opponent interneurons in the insect visual system," Nature, 331, 435-437 (1988). 7. A. G. Andreou and Z. K. Kalayjian, "Polarization imaging: principles and integrated polarimeters," IEEE
Sens. J. 2, 566-576 (2002). 8. M. Momeni and A. H. Titus, "An analog VLSI chip emulating polarization vision of octopus retina," IEEE
Trans. Neu. Net. 17, 222-232 (2006). 9. L. B. Wolff, T. A. Mancini, P. Pouliquen, and A. G. Andreou, "Liquid crystal polarization camera," IEEE
Trans. on Rob. and Aut. 13, 195-203 (1997). 10. J. S. Tyo, M. P. Rowe, E. N. Pugh, and N. Engheta, "Target Detection in Optically Scattering Media by
Polarization-Difference Imaging," Appl. Opt. 35, 1855-1870 (1996). 11. J. S. Tyo, E. N. Pugh, and N. Engheta, "Colorimetric Representations for Use with Polarization-Difference
Imaging of Objects in Scattering Media," J. Opt. Soc. Am. A 15, 367-374 (1998). 12. Z. K. Kalayjian, "VLSEye: Optoelectronic Vision and Image Processing," Ph.D. dissertation, Johns Hopkins
Univ., Baltimore, MD., 1999. 13. Z. K. Kalayjian, A. G. Andreou, and L. B. Wolff, "1D polarisation contrast retina," Electron. Lett. 33, 38-40
(1997). 14. T. Hamamoto, H. Toyota, and H. Kikuta, "Microretarder array for imaging polarimetry in the visible
wavelength region," Proc. SPIE 440, 293-300 (2001). 15. J. Guo and D. Brady, "Fabrication of high-resolution micropolarizer array," Opt. Eng. 36, 2268-2271 (1997).
#76924 - $15.00 USD Received 9 Nov 2006; revised 19 Mar 2007; accepted 24 Mar 2007; published 10 Apr 2007
(C) 2007 OSA 16 Apr 2007 / Vol. 15, No. 8 / OPTICS EXPRESS 4994
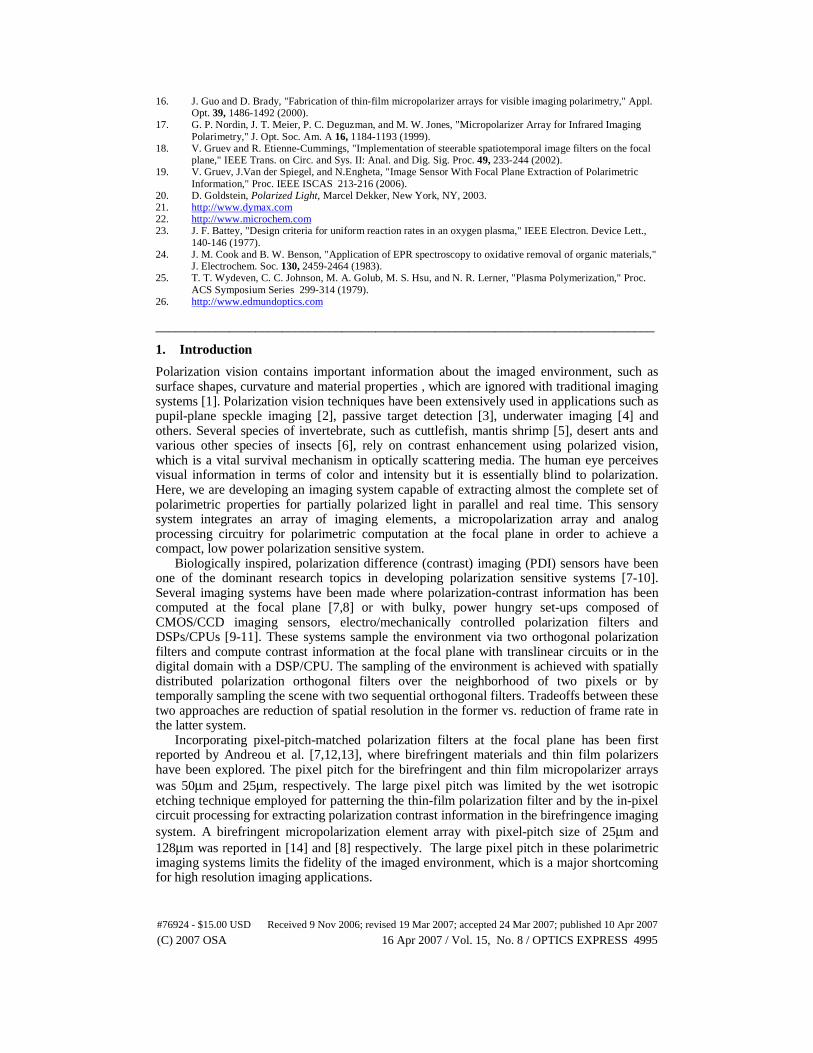
16. J. Guo and D. Brady, "Fabrication of thin-film micropolarizer arrays for visible imaging polarimetry," Appl. Opt. 39, 1486-1492 (2000).
17. G. P. Nordin, J. T. Meier, P. C. Deguzman, and M. W. Jones, "Micropolarizer Array for Infrared Imaging Polarimetry," J. Opt. Soc. Am. A 16, 1184-1193 (1999).
18. V. Gruev and R. Etienne-Cummings, "Implementation of steerable spatiotemporal image filters on the focal plane," IEEE Trans. on Circ. and Sys. II: Anal. and Dig. Sig. Proc. 49, 233-244 (2002).
19. V. Gruev, J.Van der Spiegel, and N.Engheta, "Image Sensor With Focal Plane Extraction of Polarimetric Information," Proc. IEEE ISCAS 213-216 (2006).
20. D. Goldstein, Polarized Light, Marcel Dekker, New York, NY, 2003. 21. http://www.dymax.com 22. http://www.microchem.com 23. J. F. Battey, "Design criteria for uniform reaction rates in an oxygen plasma," IEEE Electron. Device Lett.,
140-146 (1977). 24. J. M. Cook and B. W. Benson, "Application of EPR spectroscopy to oxidative removal of organic materials,"
J. Electrochem. Soc. 130, 2459-2464 (1983). 25. T. T. Wydeven, C. C. Johnson, M. A. Golub, M. S. Hsu, and N. R. Lerner, "Plasma Polymerization," Proc.
ACS Symposium Series 299-314 (1979). 26. http://www.edmundoptics.com ___________________________________________________________________________
1. Introduction
Polarization vision contains important information about the imaged environment, such as surface shapes, curvature and material properties , which are ignored with traditional imaging systems [1]. Polarization vision techniques have been extensively used in applications such as pupil-plane speckle imaging [2], passive target detection [3], underwater imaging [4] and others. Several species of invertebrate, such as cuttlefish, mantis shrimp [5], desert ants and various other species of insects [6], rely on contrast enhancement using polarized vision, which is a vital survival mechanism in optically scattering media. The human eye perceives visual information in terms of color and intensity but it is essentially blind to polarization. Here, we are developing an imaging system capable of extracting almost the complete set of polarimetric properties for partially polarized light in parallel and real time. This sensory system integrates an array of imaging elements, a micropolarization array and analog processing circuitry for polarimetric computation at the focal plane in order to achieve a compact, low power polarization sensitive system.
Biologically inspired, polarization difference (contrast) imaging (PDI) sensors have been one of the dominant research topics in developing polarization sensitive systems [7-10]. Several imaging systems have been made where polarization-contrast information has been computed at the focal plane [7,8] or with bulky, power hungry set-ups composed of CMOS/CCD imaging sensors, electro/mechanically controlled polarization filters and DSPs/CPUs [9-11]. These systems sample the environment via two orthogonal polarization filters and compute contrast information at the focal plane with translinear circuits or in the digital domain with a DSP/CPU. The sampling of the environment is achieved with spatially distributed polarization orthogonal filters over the neighborhood of two pixels or by temporally sampling the scene with two sequential orthogonal filters. Tradeoffs between these two approaches are reduction of spatial resolution in the former vs. reduction of frame rate in the latter system.
Incorporating pixel-pitch-matched polarization filters at the focal plane has been first reported by Andreou et al. [7,12,13], where birefringent materials and thin film polarizers have been explored. The pixel pitch for the birefringent and thin film micropolarizer arrays was 50μm and 25μm, respectively. The large pixel pitch was limited by the wet isotropic etching technique employed for patterning the thin-film polarization filter and by the in-pixel circuit processing for extracting polarization contrast information in the birefringence imaging system. A birefringent micropolarization element array with pixel-pitch size of 25μm and 128μm was reported in [14] and [8] respectively. The large pixel pitch in these polarimetric imaging systems limits the fidelity of the imaged environment, which is a major shortcoming for high resolution imaging applications.
#76924 - $15.00 USD Received 9 Nov 2006; revised 19 Mar 2007; accepted 24 Mar 2007; published 10 Apr 2007
(C) 2007 OSA 16 Apr 2007 / Vol. 15, No. 8 / OPTICS EXPRESS 4995
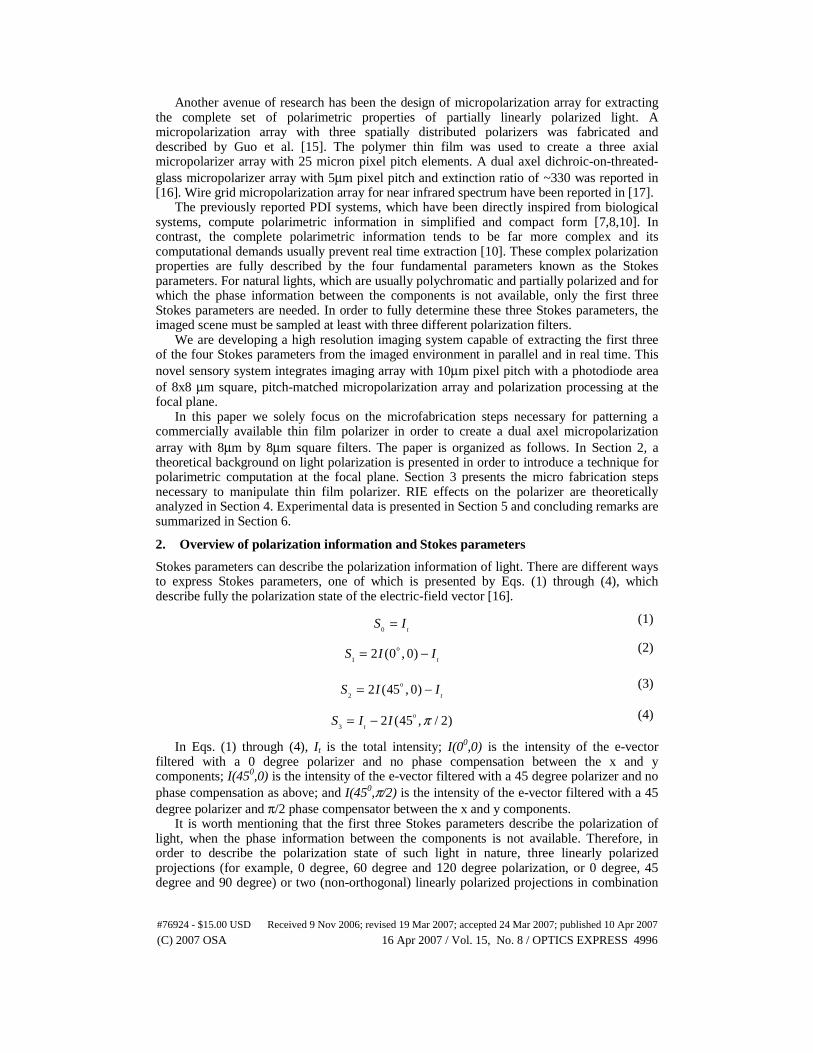
Another avenue of research has been the design of micropolarization array for extracting the complete set of polarimetric properties of partially linearly polarized light. A micropolarization array with three spatially distributed polarizers was fabricated and described by Guo et al. [15]. The polymer thin film was used to create a three axial micropolarizer array with 25 micron pixel pitch elements. A dual axel dichroic-on-threated-glass micropolarizer array with 5μm pixel pitch and extinction ratio of ~330 was reported in [16]. Wire grid micropolarization array for near infrared spectrum have been reported in [17].
The previously reported PDI systems, which have been directly inspired from biological systems, compute polarimetric information in simplified and compact form [7,8,10]. In contrast, the complete polarimetric information tends to be far more complex and its computational demands usually prevent real time extraction [10]. These complex polarization properties are fully described by the four fundamental parameters known as the Stokes parameters. For natural lights, which are usually polychromatic and partially polarized and for which the phase information between the components is not available, only the first three Stokes parameters are needed. In order to fully determine these three Stokes parameters, the imaged scene must be sampled at least with three different polarization filters.
We are developing a high resolution imaging system capable of extracting the first three of the four Stokes parameters from the imaged environment in parallel and in real time. This novel sensory system integrates imaging array with 10μm pixel pitch with a photodiode area of 8x8 μm square, pitch-matched micropolarization array and polarization processing at the focal plane.
In this paper we solely focus on the microfabrication steps necessary for patterning a commercially available thin film polarizer in order to create a dual axel micropolarization array with 8μm by 8μm square filters. The paper is organized as follows. In Section 2, a theoretical background on light polarization is presented in order to introduce a technique for polarimetric computation at the focal plane. Section 3 presents the micro fabrication steps necessary to manipulate thin film polarizer. RIE effects on the polarizer are theoretically analyzed in Section 4. Experimental data is presented in Section 5 and concluding remarks are summarized in Section 6.
2. Overview of polarization information and Stokes parameters
Stokes parameters can describe the polarization information of light. There are different ways to express Stokes parameters, one of which is presented by Eqs. (1) through (4), which describe fully the polarization state of the electric-field vector [16].
0 tS I= (1)
o
12 (0 , 0)
tS I I= − (2)
o
22 (45 , 0)
tS I I= − (3)
o
32 (45 , / 2)
tS I I π= − (4)
In Eqs. (1) through (4), It is the total intensity; I(00,0) is the intensity of the e-vector filtered with a 0 degree polarizer and no phase compensation between the x and y components; I(450,0) is the intensity of the e-vector filtered with a 45 degree polarizer and no phase compensation as above; and I(450,π/2) is the intensity of the e-vector filtered with a 45 degree polarizer and π/2 phase compensator between the x and y components.
It is worth mentioning that the first three Stokes parameters describe the polarization of light, when the phase information between the components is not available. Therefore, in order to describe the polarization state of such light in nature, three linearly polarized projections (for example, 0 degree, 60 degree and 120 degree polarization, or 0 degree, 45 degree and 90 degree) or two (non-orthogonal) linearly polarized projections in combination
#76924 - $15.00 USD Received 9 Nov 2006; revised 19 Mar 2007; accepted 24 Mar 2007; published 10 Apr 2007
(C) 2007 OSA 16 Apr 2007 / Vol. 15, No. 8 / OPTICS EXPRESS 4996

with the total intensity are needed. The latter method is preferred for focal plane implementation since it only requires two thin film polarizers offset by 45 degrees, patterned and placed on neighboring pixels. The overall thickness of the complete filter will be thinner for a two-tier vs. a three tier filter, which has two main advantages. The first advantage is in minimizing light attenuation through multiple layers and increasing the angle of incidence. The second advantage is in reduction of fabrication steps and minimization of alignment errors
The patterning of the thin film polarizer is similar to the Bayer pattern used in color imaging and it is shown in Fig. 1 together with the image sensor. The image sensor is composed of an array of 256 by 256 photo pixels, and the noise suppression and analog computation circuitry is included at the focal plane. The micropolarizer array is separately attached on the image sensor with the pattern shown in Fig. 1.
In the image sensor presented in Fig. 1, a neighborhood of 2 by 2 pixels is addressed and accessed simultaneously. In the pixels neighborhood of interest, one pixel records the 0 degree projected polarized image (I(00,0)), another records the 45 degree projected polarized image (I(450,0)) and two pixels record the unfiltered intensity image (It). The polarimetric parameters are estimated by reading out all four pixels in parallel [18] and scaling them individually at the periphery, i.e. away from the imaging array, with programmable analog scaling circuitry in accordance to the first three Stokes parameter equations (Eqs. (1) through (3)). The details of the addressing scheme of block of 2 by 2 pixels and analog processing circuitry are described in [18,19].
3. Micro fabrication steps for thin film polarizer manipulation
A commercially available thin film polarizer is used to create an array of micropolarizers. The thin film polarizer consists of an iodine-doped Polyvinyl Alcohol (PVA) layer, which acts as a dense array of thin microscopic wires. These microscopic wires are formed by mechanically stretching the polymer film, allowing the molecules of the PVA to align in the direction of stretching. In order to have an effective polarizer, the size and spacing between the thin
Fig. 1. Block diagram of the complete imaging system: imaging array, processing circuitry and micropolarization array
#76924 - $15.00 USD Received 9 Nov 2006; revised 19 Mar 2007; accepted 24 Mar 2007; published 10 Apr 2007
(C) 2007 OSA 16 Apr 2007 / Vol. 15, No. 8 / OPTICS EXPRESS 4997

microscopic wires should be ~1/100th and ~1/10th of the light’s wavelength, respectively [20]. For example, for blue light wavelengths or 450nm wavelength, the distance between the microscopic wires should be on the order of 45nm, while the thickness of the wires should be around 5nm. The mechanical stretching of the polymer creates a very good ~10μm thick polarization filter for the visible spectrum, with extinction ratios of about 1000 in the blue and green spectrum and 100 in the red spectrum. The PVA thin film is placed between two 300μm thick transparent Cellulose Acetate Butyrate (CAB) or polyethylene layers (Fig. 2-a). The CAB layers provide structural stability to the fragile and thin PVA layer.
In order to be able to manipulate the PVA layer, at least one of the protective CAB layers must be removed. Since CAB is a form of acetate, it is therefore acetone soluble. Hence, the sample is submerged in an acetone bath for 30 minutes. One side of the sample is taped with an acetone resistant tape, i.e. rubber tape, to a glass substrate in order to protect the bottom layer of CAB which provides structural stability for the PVA layer. The sample is rinsed with de-ionized water (DI) in order to remove the soften CAB layer. The DI water also solidifies the CAB layer, upon which the sample is submerged in the acetone bath again. These two steps are repeated several times, until no residual CAB layer remains on top of the PVA layer (Fig. 2-b).
The next step is to glue the PVA to a substrate. In the final imaging system, the PVA will be glued directly to the die of the imaging system. For testing purposes, however, the PVA is glued to a microscopic glass in order to be able to back illuminate the filter and to fully characterize the optical properties of the micropolarizer elements. A UV sensitive adhesive promoter, Dymax AD420 [21], is used between the PVA and the IC/Glass substrate (Fig. 2-c). The UV adhesion promoter has 95% transparency, which allows for minimal absorption of the impingent light wave. The adhesive promoter exhibits minimum expansion when heated and it has an important property for preserving the extinction properties of the PVA layer.
The next step is to remove the bottom CAB layer in order to allow patterning the PVA film. This step is similar to the initial step, where a repeated acetone bath and DI water rinsing are used. The final structure after this process is shown in Fig. 2-d.
The remaining steps describe the patterning and etching process of the PVA. These steps are as follow:
Fig. 2. Microfabrication steps for creating a dual layer polarization structures
#76924 - $15.00 USD Received 9 Nov 2006; revised 19 Mar 2007; accepted 24 Mar 2007; published 10 Apr 2007
(C) 2007 OSA 16 Apr 2007 / Vol. 15, No. 8 / OPTICS EXPRESS 4998

(1) Heat the sample to a temperature of 95OC for 5 minutes. This ensures that the surface of the PVA is completely dry. An adhesion promoter, Omnicoat [22], is applied directly and spin coated at 3000 rpm for 60 seconds. The sample is then baked for 1 minute at 95OC. The Omnicoat layer promotes adhesion between the PVA and the SU-8 photoresist (Fig. 2-e).
(2) Immediately apply an SU-8 2015 negative photoresist [22] on top of the PVA. The negative photoresist is hydrophobic and requires the surface of the PVA to be absolutely free of any water molecules. If the sample is cooled down to room temperature, water molecules due to humidity will coat the surface of the PVA. The adhesion of the SU-8 will be virtually non existent when patterning 10μm or smaller structures. Larger structures tend not to have problems with adhesion when the PVA is cooled down to room temperature.
(3) Spin coat the photoresist at 500rpm for 10 seconds and then at 3000 rpm for 50 seconds with 500 rpm per second acceleration. The resulting photoresist thickness is 3μm.
(4) Bake the sample at 65O C for 1min and then at 95O C for 2min. It is recommended that the sample cools down at 65O C for 1 min in order to gradually decrease the temperature of the sample. Gradual increase and decrease of the temperature during the baking process avoids rapid temperature differences and prevents the photoresist from cracking (Fig. 2-f).
(5) Expose the photoresist at 375nm wavelength for 20 seconds at 8mW/cm2 intensity. The mask used to pattern features for the imaging sensor contains 10 μm by 10 μm square patterns (Fig. 2-g). This mask allowed us to closely evaluate isotropic etching properties using an electron scanning microscope.
(6) Post-bake the sample at 65O C for 1 min and then at 95O C for 2 min. The sample is cooled down at 65O C for 1 min in order to gradually decrease the temperature and minimize stress and cracking on the photoresist.
(7) Develop the photoresist for 4 min in an SU-8 developer and gently rinse it with isopropyl alcohol. If white colored liquid appears on the surface, the photoresist is not completely developed and it is submerged in the developer again (Fig. 2-h).
(8) Selective reactive ion etching is performed on the sample. A mixture of gasses composed of 28 sccm Ar, 30 sccm O2 and 10 sccm CF4 is used. The RF power is 150W, at 17OC temperature and 20mbar pressure. The selected ratio of the appropriate gasses is optimized to maximize the etching of the PVA while minimizing the destructive etching of the SU-8 photo resist. The etching rate of the PVA is 0.5μm/min, while the etching rate of the SU-8 is 0.75μm/min. Since the thickness of the PVA is ~10μm, the sample is etched for ~20 minutes. The thickness of the SU-8 is optimized to be 15μm and it will be etched completely by the time the PVA layer is etched. This optimization simplifies the microfabrication procedure at the cost of slightly damaging the PVA structures which might occur due to variations in the PVA and SU-8 thickness.
A more conservative approach can be employed, where the SU-8 thickness can be increased above 15μm. Once the etching of the PVA layer is completed, the remaining photoresist can be removed with an SU-8 photoresist striper. The Omnicoat layer helps lift the SU-8 photoresist and remove it from the PVA structures. The RIE provided anisotropic etching with ~1μm under cutting, compared to 4μm and 10μm under cutting with oxygen plasma and wet etching, respectively (Fig. 2-i).
The next step is to add a second layer of PVA on top of the first layer offset by 45 degrees via a UV adhesive promoter and etch it with the desired mask pattern. First, the adhesive promoter is spin coated at 1500rpm for 60 seconds ensuring ~1μm epoxy layer on top of the first PVA layer. The second PVA layer is placed under an angle starting from one end of the sample and it is gradually lowered toward the other side of the sample. This step helps in eliminating air bubble being trapped in the epoxy layer as well as planarization is achieved due to the liquid state of the epoxy layer.
As an alternative method of merging the two PVA layers, we placed the adhesive promoter on top of the first PVA layer without being spin coated. The second PVA layer is gradually lowered toward the first layer while maintaining parallel alignment of the two layers. Once an initial contact is established between the adhesive promoter and the second
#76924 - $15.00 USD Received 9 Nov 2006; revised 19 Mar 2007; accepted 24 Mar 2007; published 10 Apr 2007
(C) 2007 OSA 16 Apr 2007 / Vol. 15, No. 8 / OPTICS EXPRESS 4999
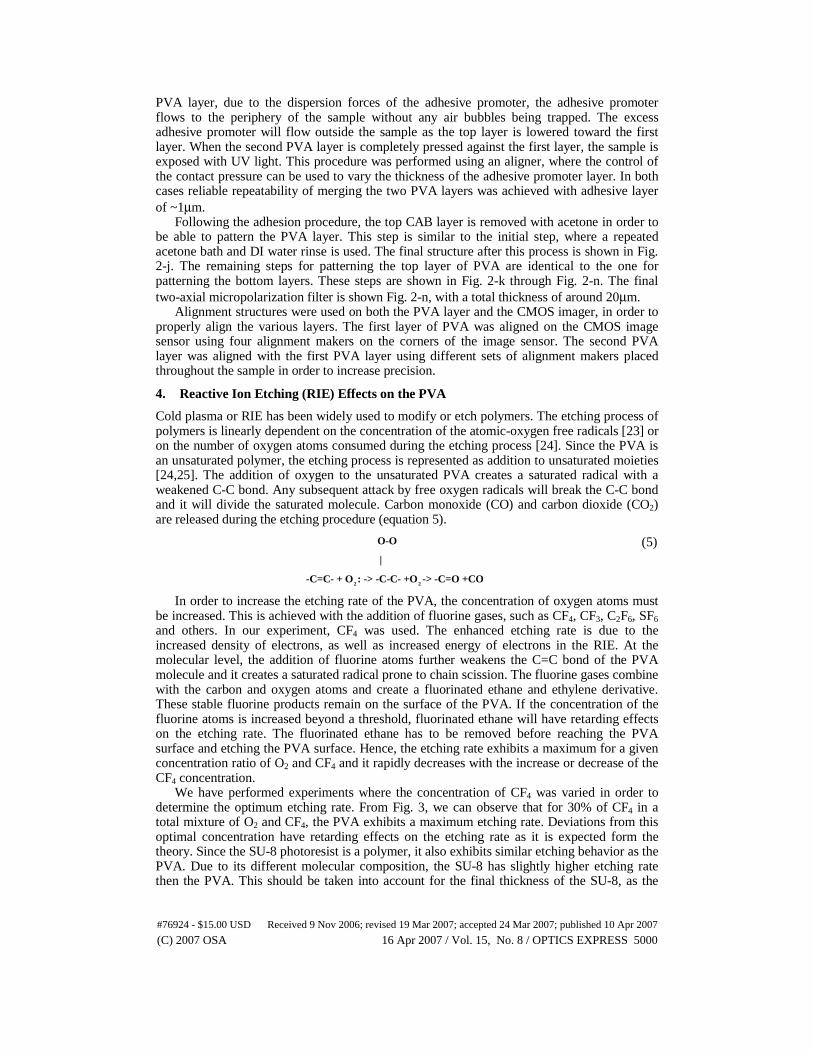
PVA layer, due to the dispersion forces of the adhesive promoter, the adhesive promoter flows to the periphery of the sample without any air bubbles being trapped. The excess adhesive promoter will flow outside the sample as the top layer is lowered toward the first layer. When the second PVA layer is completely pressed against the first layer, the sample is exposed with UV light. This procedure was performed using an aligner, where the control of the contact pressure can be used to vary the thickness of the adhesive promoter layer. In both cases reliable repeatability of merging the two PVA layers was achieved with adhesive layer of ~1μm.
Following the adhesion procedure, the top CAB layer is removed with acetone in order to be able to pattern the PVA layer. This step is similar to the initial step, where a repeated acetone bath and DI water rinse is used. The final structure after this process is shown in Fig. 2-j. The remaining steps for patterning the top layer of PVA are identical to the one for patterning the bottom layers. These steps are shown in Fig. 2-k through Fig. 2-n. The final two-axial micropolarization filter is shown Fig. 2-n, with a total thickness of around 20μm.
Alignment structures were used on both the PVA layer and the CMOS imager, in order to properly align the various layers. The first layer of PVA was aligned on the CMOS image sensor using four alignment makers on the corners of the image sensor. The second PVA layer was aligned with the first PVA layer using different sets of alignment makers placed throughout the sample in order to increase precision.
4. Reactive Ion Etching (RIE) Effects on the PVA
Cold plasma or RIE has been widely used to modify or etch polymers. The etching process of polymers is linearly dependent on the concentration of the atomic-oxygen free radicals [23] or on the number of oxygen atoms consumed during the etching process [24]. Since the PVA is an unsaturated polymer, the etching process is represented as addition to unsaturated moieties [24,25]. The addition of oxygen to the unsaturated PVA creates a saturated radical with a weakened C-C bond. Any subsequent attack by free oxygen radicals will break the C-C bond and it will divide the saturated molecule. Carbon monoxide (CO) and carbon dioxide (CO2) are released during the etching procedure (equation 5).
2 2
O-O
|
-C=C- + O : -> -C-C- +O -> -C=O +CO
(5)
In order to increase the etching rate of the PVA, the concentration of oxygen atoms must be increased. This is achieved with the addition of fluorine gases, such as CF4, CF3, C2F6, SF6 and others. In our experiment, CF4 was used. The enhanced etching rate is due to the increased density of electrons, as well as increased energy of electrons in the RIE. At the molecular level, the addition of fluorine atoms further weakens the C=C bond of the PVA molecule and it creates a saturated radical prone to chain scission. The fluorine gases combine with the carbon and oxygen atoms and create a fluorinated ethane and ethylene derivative. These stable fluorine products remain on the surface of the PVA. If the concentration of the fluorine atoms is increased beyond a threshold, fluorinated ethane will have retarding effects on the etching rate. The fluorinated ethane has to be removed before reaching the PVA surface and etching the PVA surface. Hence, the etching rate exhibits a maximum for a given concentration ratio of O2 and CF4 and it rapidly decreases with the increase or decrease of the CF4 concentration.
We have performed experiments where the concentration of CF4 was varied in order to determine the optimum etching rate. From Fig. 3, we can observe that for 30% of CF4 in a total mixture of O2 and CF4, the PVA exhibits a maximum etching rate. Deviations from this optimal concentration have retarding effects on the etching rate as it is expected form the theory. Since the SU-8 photoresist is a polymer, it also exhibits similar etching behavior as the PVA. Due to its different molecular composition, the SU-8 has slightly higher etching rate then the PVA. This should be taken into account for the final thickness of the SU-8, as the
#76924 - $15.00 USD Received 9 Nov 2006; revised 19 Mar 2007; accepted 24 Mar 2007; published 10 Apr 2007
(C) 2007 OSA 16 Apr 2007 / Vol. 15, No. 8 / OPTICS EXPRESS 5000

SU-8 acts as protective layer for the PVA and it should remain until the unprotected PVA is etched completely. From the experimental data, an Oxygen-to-Freon (CF4) ratio of 3:1 yields an optimum etching results. For this gases concentration, the etching rate of the SU-8 is 0.75μm/min, while the etching rate for the PVA is 0.5μm/min. High etching rate and low selectivity was chosen in order to minimize the etching time of the PVA layer and hence minimize the under etching.
5. Dual-tier micropolarization array: Experimental results
The final two-tier micropolarization array was tested for its structural and optical properties. A scanning electron microscope (SEM) was used to evaluate the photoresist and the etched PVA structures. A comparison of the size of both structures indicated the amount of under-etching due to the selective RIE procedure.
In Fig. 4-a and Fig. 4-b, the SU-8 square structures obtained after the photolithography procedure (see Fig. 2-h) are presented. Fig. 4-a presents the photoresist structures viewed from the top, while Fig. 4-b present an array of photoresist pillars recorded under 52 degree angle tilt. The photoresist squares are 10μm by 10μm wide and 15μm tall, with 10μm spacing between neighboring structures. The corners of the square structures are slightly rounded due to edge diffraction effects from the mask. The rounding effects are minimized by optimizing pre-baking, post-baking and exposure time of the photoresist. The uniform periodic structures are observed in Fig. 4-b.
Fig. 3. Etching rate of PVA and SU-8 as a function of a CF4 concentration in an O2 and CF4 gas mix.
#76924 - $15.00 USD Received 9 Nov 2006; revised 19 Mar 2007; accepted 24 Mar 2007; published 10 Apr 2007
(C) 2007 OSA 16 Apr 2007 / Vol. 15, No. 8 / OPTICS EXPRESS 5001
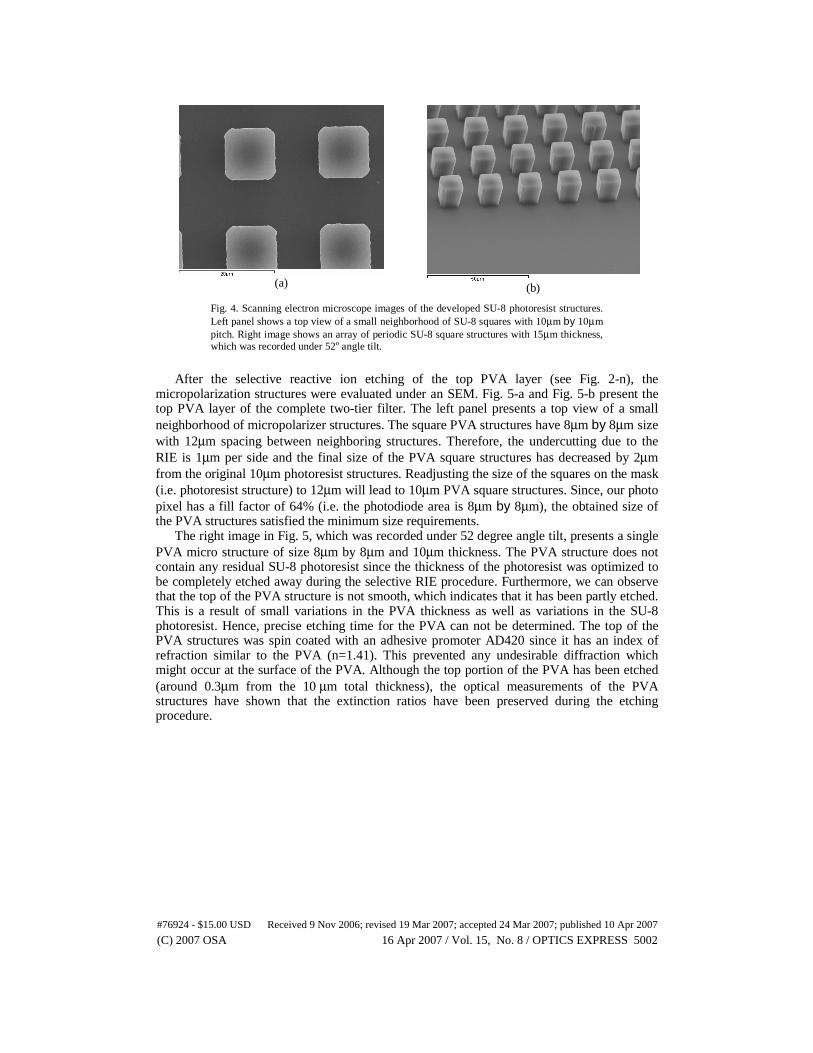
Fig. 4. Scanning electron microscope images of the developed SU-8 photoresist structures. Left panel shows a top view of a small neighborhood of SU-8 squares with 10μm by 10μm pitch. Right image shows an array of periodic SU-8 square structures with 15μm thickness, which was recorded under 52o angle tilt.
After the selective reactive ion etching of the top PVA layer (see Fig. 2-n), the
micropolarization structures were evaluated under an SEM. Fig. 5-a and Fig. 5-b present the top PVA layer of the complete two-tier filter. The left panel presents a top view of a small neighborhood of micropolarizer structures. The square PVA structures have 8μm by 8μm size with 12μm spacing between neighboring structures. Therefore, the undercutting due to the RIE is 1μm per side and the final size of the PVA square structures has decreased by 2μm from the original 10μm photoresist structures. Readjusting the size of the squares on the mask (i.e. photoresist structure) to 12μm will lead to 10μm PVA square structures. Since, our photo pixel has a fill factor of 64% (i.e. the photodiode area is 8μm by 8μm), the obtained size of the PVA structures satisfied the minimum size requirements.
The right image in Fig. 5, which was recorded under 52 degree angle tilt, presents a single PVA micro structure of size 8μm by 8μm and 10μm thickness. The PVA structure does not contain any residual SU-8 photoresist since the thickness of the photoresist was optimized to be completely etched away during the selective RIE procedure. Furthermore, we can observe that the top of the PVA structure is not smooth, which indicates that it has been partly etched. This is a result of small variations in the PVA thickness as well as variations in the SU-8 photoresist. Hence, precise etching time for the PVA can not be determined. The top of the PVA structures was spin coated with an adhesive promoter AD420 since it has an index of refraction similar to the PVA (n=1.41). This prevented any undesirable diffraction which might occur at the surface of the PVA. Although the top portion of the PVA has been etched (around 0.3μm from the 10 μm total thickness), the optical measurements of the PVA structures have shown that the extinction ratios have been preserved during the etching procedure.
(a)
(b)
#76924 - $15.00 USD Received 9 Nov 2006; revised 19 Mar 2007; accepted 24 Mar 2007; published 10 Apr 2007
(C) 2007 OSA 16 Apr 2007 / Vol. 15, No. 8 / OPTICS EXPRESS 5002

The optical properties of the dual-tier micropolarization filter were evaluated under an optical microscope via back polarized illumination of the sample with three different wavelengths: 720nm wavelength (red light), 580nm wavelength (green light) and 480nm wavelength (blue light). We have created two samples of a dual-tier micropolarization filter. In the first sample the two layers of micropolarizers are offset by 90 degrees, while in the second sample they are offset by 45 degrees. The second sample contains the desired pattern which will be integrated with a CMOS image sensor in order to extract the first three Stokes parameters. The first sample was used for measurement purposes and for visual clarity, although it can be used for a polarization difference (contrast) computation [4,9,10].
The optical characteristics of the dual axial micropolarizers offset by 90 degrees are presented in Fig. 6. In Fig. 6-a, the sample was illuminated with polarized light having polarization perpendicular (parallel) to the transmission axis (axis of polarization) of the PVA structures in the first tier. The square structures in the first tier appear bright in intensity and little darker compared to the background since the PVA attenuates part of the parallel polarized light (PVA transmission of about 40% has been measured and reported in the literature [26]). The square structures in the second tier appear opaque. They attenuate the intensity of the incoming light waves since their axis of polarization is oriented perpendicular to the polarization of the incident polarized light. In Fig. 6-b the sample was illuminated with polarized light perpendicular (parallel) to the transmission axis (axis of polarization) of the
(a)
(b)
Fig. 5. Scanning electron microscope images of the top PVA tier. Left image shows an array of 8μm by 8μm PVA structures. Right panel shows a single PVA structure with 8μm pitch and 10μm thickness, which was recorded under 52 degree angle tilt.
(a) (b)
Fig. 6. Experimental results for the dual-tier micropolarization filters offset by 90 degrees. The first layer in the left sample attenuates perpendicular polarized light while the second layer is transparent. The reverse is observed in the right sample.
#76924 - $15.00 USD Received 9 Nov 2006; revised 19 Mar 2007; accepted 24 Mar 2007; published 10 Apr 2007
(C) 2007 OSA 16 Apr 2007 / Vol. 15, No. 8 / OPTICS EXPRESS 5003

PVA structures in the second tier. The reverse effects are observed in this image, where the top layer is opaque and the bottom layer is transparent due to the 90 degree polarization offset of the illuminating light source.
Since the square structures in the dual axial filter reside in different tiers separated by 10μm and the images were taken under a microscope with 5 μm depth of focus, the contours of the square structures in the bottom tier appear slightly blurred. Refocusing the microscope to image the bottom tier structures verified the sharpness of the squarely-etched structures. Since the final thickness of the dual axial filter is ~20μm, the angle of incidence of the incoming light will be limited. For example, for large angles of incidence, the incoming light will be filtered with one micro filter and registered by a neighboring pixel on the CMOS image sensor. Using thinner layers will reduce this effect. In addition, introducing micro lenses on top of the micropolarization array in the future will circumvent this problem.
The optical characteristics of the dual-axial micropolarizers offset by 45 degrees are presented in Fig. 7. The images in Fig. 7-a, 7-b, 7-c and 7-d are recorded with 0, 45, 90 and 135 degrees of polarized light, respectively. In Fig. 7-a (Fig. 7-c), the sample was illuminated with polarized light with polarization parallel (perpendicular) to the transmission axis of the PVA structures in the first tier i.e. with 0 (90) degree polarized light. Hence, the square structures in the first tier appear opaque in intensity in Fig. 7-a and transparent in Fig. 7-c. Since the second tier is offset by 45 degrees, it is difficult to visualize its relative offset. The polarization properties of the second tier are clearly evident in Fig. 7-b and Fig. 7-d. In Fig. 7-b (Fig. 7-d), the sample was illuminated with polarized light parallel (perpendicular) to the transmission axis of the PVA structures in the second tier i.e. with 45 (135) degree polarized light. Hence, the square structures in the second tier appear opaque in intensity in Fig. 7-b and transparent in Fig. 7-d.
Figure 8 and Fig. 9 present movies, demonstrating the polarization filtering capabilities of the dual-tier and single-tier micro-structured PVA, respectively. The offset of the two-tier samples is 45 degrees. The movie files are composed of 36 frames, where the angle of polarization of the light source is varied between 0 degrees and 180 degrees in increments of 5 degrees between frames. The filter was illuminated with red-light wavelength in both examples; hence the transparent background of the sample appears red. The samples were illuminated with all three wavelengths separately in order to evaluate the dependence of the extinction ratios on the wavelength, but for the sake of brevity only one wavelength is
(a) (b) (c) (d)
Fig. 7. Experimental results for the two axial micropolarization filters offset by 45 degrees. The images are illuminated with 0, 45, 90 and 135 degree polarization for the incident polarized light, respectively.
#76924 - $15.00 USD Received 9 Nov 2006; revised 19 Mar 2007; accepted 24 Mar 2007; published 10 Apr 2007
(C) 2007 OSA 16 Apr 2007 / Vol. 15, No. 8 / OPTICS EXPRESS 5004
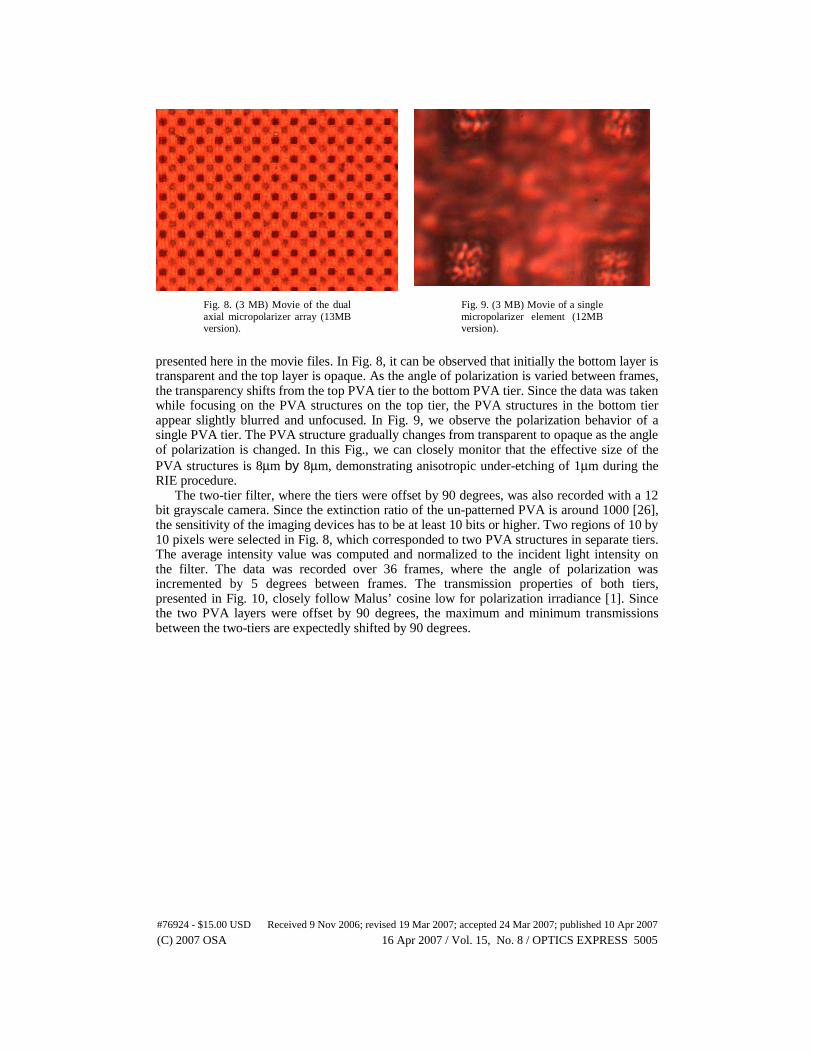
presented here in the movie files. In Fig. 8, it can be observed that initially the bottom layer is transparent and the top layer is opaque. As the angle of polarization is varied between frames, the transparency shifts from the top PVA tier to the bottom PVA tier. Since the data was taken while focusing on the PVA structures on the top tier, the PVA structures in the bottom tier appear slightly blurred and unfocused. In Fig. 9, we observe the polarization behavior of a single PVA tier. The PVA structure gradually changes from transparent to opaque as the angle of polarization is changed. In this Fig., we can closely monitor that the effective size of the PVA structures is 8μm by 8μm, demonstrating anisotropic under-etching of 1μm during the RIE procedure.
The two-tier filter, where the tiers were offset by 90 degrees, was also recorded with a 12 bit grayscale camera. Since the extinction ratio of the un-patterned PVA is around 1000 [26], the sensitivity of the imaging devices has to be at least 10 bits or higher. Two regions of 10 by 10 pixels were selected in Fig. 8, which corresponded to two PVA structures in separate tiers. The average intensity value was computed and normalized to the incident light intensity on the filter. The data was recorded over 36 frames, where the angle of polarization was incremented by 5 degrees between frames. The transmission properties of both tiers, presented in Fig. 10, closely follow Malus’ cosine low for polarization irradiance [1]. Since the two PVA layers were offset by 90 degrees, the maximum and minimum transmissions between the two-tiers are expectedly shifted by 90 degrees.
Fig. 8. (3 MB) Movie of the dual axial micropolarizer array (13MB version).
Fig. 9. (3 MB) Movie of a single micropolarizer element (12MB version).
#76924 - $15.00 USD Received 9 Nov 2006; revised 19 Mar 2007; accepted 24 Mar 2007; published 10 Apr 2007
(C) 2007 OSA 16 Apr 2007 / Vol. 15, No. 8 / OPTICS EXPRESS 5005
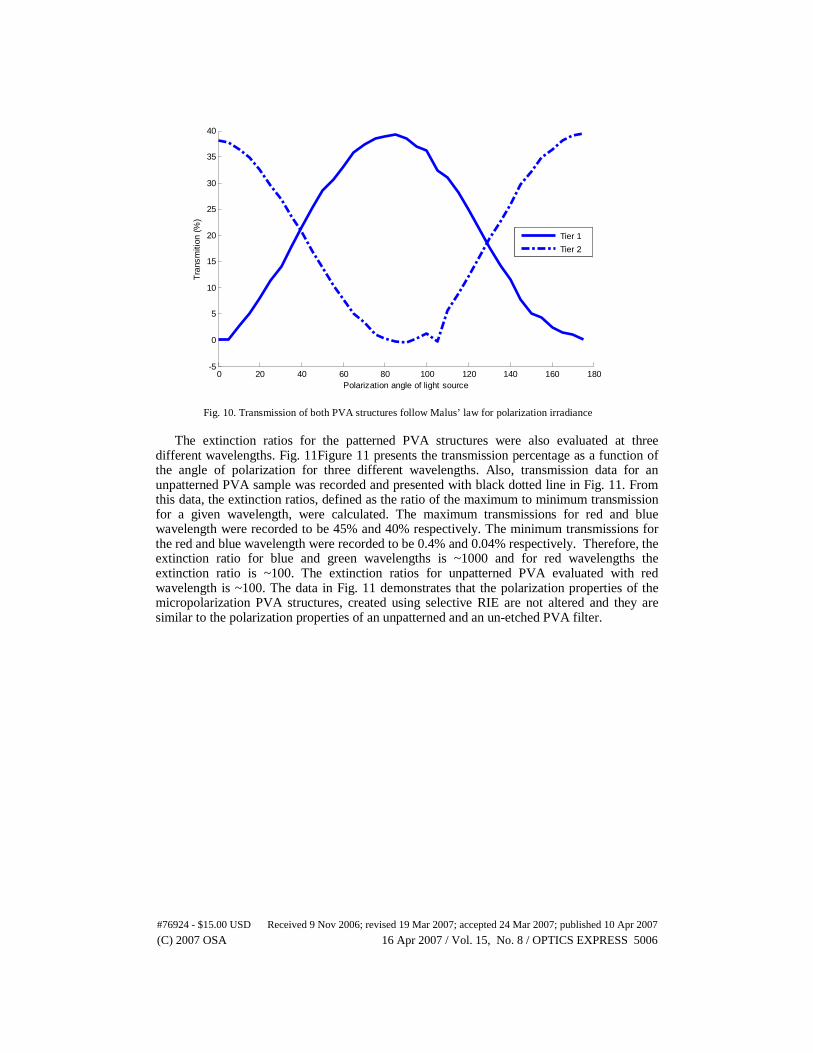
The extinction ratios for the patterned PVA structures were also evaluated at three different wavelengths. Fig. 11Figure 11 presents the transmission percentage as a function of the angle of polarization for three different wavelengths. Also, transmission data for an unpatterned PVA sample was recorded and presented with black dotted line in Fig. 11. From this data, the extinction ratios, defined as the ratio of the maximum to minimum transmission for a given wavelength, were calculated. The maximum transmissions for red and blue wavelength were recorded to be 45% and 40% respectively. The minimum transmissions for the red and blue wavelength were recorded to be 0.4% and 0.04% respectively. Therefore, the extinction ratio for blue and green wavelengths is ~1000 and for red wavelengths the extinction ratio is ~100. The extinction ratios for unpatterned PVA evaluated with red wavelength is ~100. The data in Fig. 11 demonstrates that the polarization properties of the micropolarization PVA structures, created using selective RIE are not altered and they are similar to the polarization properties of an unpatterned and an un-etched PVA filter.
0 20 40 60 80 100 120 140 160 180-5
0
5
10
15
20
25
30
35
40
Polarization angle of light source
Tra
nsm
ition
(%
)
Tier 1
Tier 2
Fig. 10. Transmission of both PVA structures follow Malus’ law for polarization irradiance
#76924 - $15.00 USD Received 9 Nov 2006; revised 19 Mar 2007; accepted 24 Mar 2007; published 10 Apr 2007
(C) 2007 OSA 16 Apr 2007 / Vol. 15, No. 8 / OPTICS EXPRESS 5006
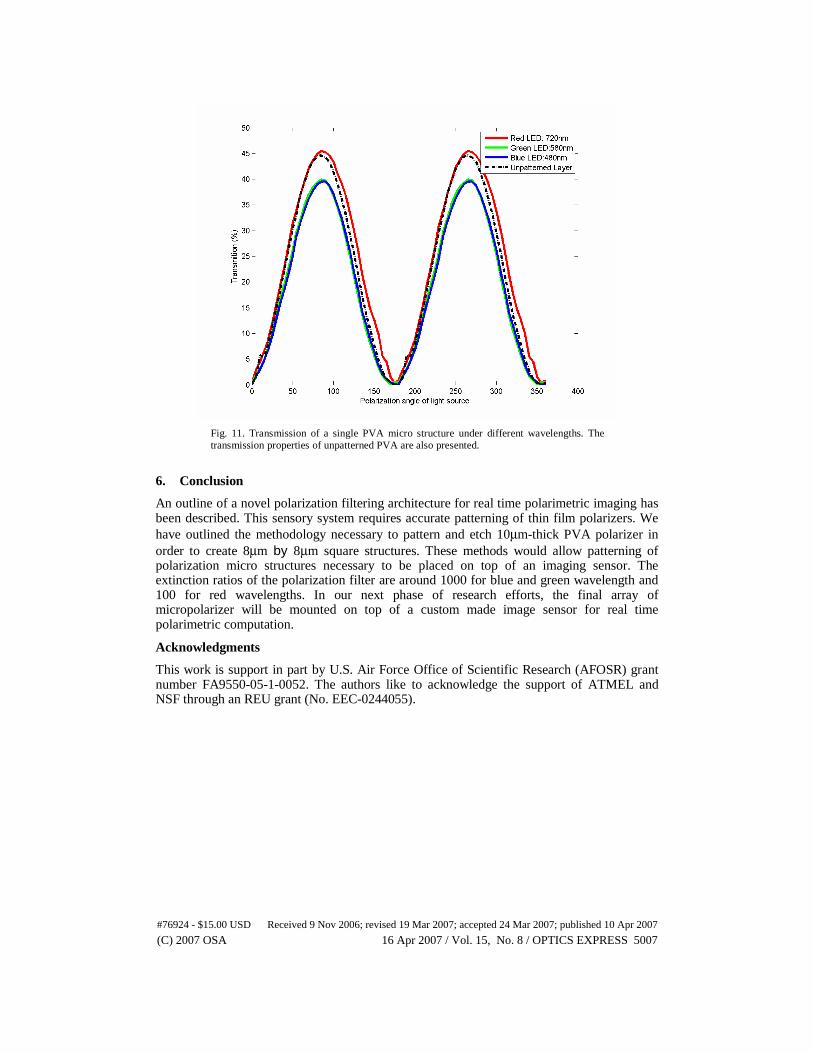
6. Conclusion
An outline of a novel polarization filtering architecture for real time polarimetric imaging has been described. This sensory system requires accurate patterning of thin film polarizers. We have outlined the methodology necessary to pattern and etch 10μm-thick PVA polarizer in order to create 8μm by 8μm square structures. These methods would allow patterning of polarization micro structures necessary to be placed on top of an imaging sensor. The extinction ratios of the polarization filter are around 1000 for blue and green wavelength and 100 for red wavelengths. In our next phase of research efforts, the final array of micropolarizer will be mounted on top of a custom made image sensor for real time polarimetric computation.
Acknowledgments
This work is support in part by U.S. Air Force Office of Scientific Research (AFOSR) grant number FA9550-05-1-0052. The authors like to acknowledge the support of ATMEL and NSF through an REU grant (No. EEC-0244055).
Fig. 11. Transmission of a single PVA micro structure under different wavelengths. The transmission properties of unpatterned PVA are also presented.
#76924 - $15.00 USD Received 9 Nov 2006; revised 19 Mar 2007; accepted 24 Mar 2007; published 10 Apr 2007
(C) 2007 OSA 16 Apr 2007 / Vol. 15, No. 8 / OPTICS EXPRESS 5007