biobuilding using banana-scented bacteria to teach synthetic biology
TRANSCRIPT

Provided for non-commercial research and educational use only. Not for reproduction, distribution or commercial use.
This chapter was originally published in the book Methods in Enzymology, Vol. 497 published by Elsevier, and the attached copy is provided by Elsevier for the author's benefit and for the benefit of the author's institution, for non-commercial research and educational use including without limitation use in instruction at your institution, sending it to specific colleagues who know you, and providing a copy to your institution’s administrator.
All other uses, reproduction and distribution, including without limitation commercial reprints, selling or licensing copies or access, or posting on open internet sites, your personal or institution’s website or repository, are prohibited. For exceptions, permission may be sought for such use through Elsevier's permissions site at:
http://www.elsevier.com/locate/permissionusematerial
From: James Dixon and Natalie Kuldell, BioBuilding: Using Banana-Scented Bacteria to Teach Synthetic Biology. In Christopher Voigt, editor: Methods in
Enzymology, Vol. 497, Burlington: Academic Press, 2011, pp. 255-271. ISBN: 978-0-12-385075-1
© Copyright 2011 Elsevier Inc. Academic Press

Author's personal copy
C H A P T E R T W E L V E
M
IS
*{
ethods
SN 0
SharoMIT,
BioBuilding: Using Banana-Scented
Bacteria to Teach Synthetic Biology
James Dixon* and Natalie Kuldell†
Contents
1. In
in
076
n HDe
troduction
Enzymology, Volume 497 # 2011
-6879, DOI: 10.1016/B978-0-12-385075-1.00012-3 All rig
igh School, Sharon, Massachusetts, USApartment of Biological Engineering, Cambridge, Massachusetts, USA
Else
hts
256
2. E
au d’coli 2573. “
Eau That Smell” Teaching Lab Using the MIT iGEM Team’sEau d’coli Cells
2593
.1. G rowing starter cultures for the students 2623
.2. B acterial growth and scent curves 2633
.3. A ssessment 2664. T
eaching Labs Modified for Resource-Stretched Settings 2674
.1. P reparation of MacFarland Turbidity standards 2684
.2. C omparison of growing cultures to Turbidity Standards 2685. S
ummary 269Ackn
owledgments 270Refe
rences 270Abstract
Student interest in synthetic biology is detectable and growing. Each year
teenagers from around the world participate in iGEM, a summer long synthetic
biology competition. As part of their iGEM experience, undergraduates design
and construct novel living systems using standardized biological parts. One
engineering feat was accomplished by the 2006 MIT iGEM team, who modified
the normally putrid smell of bacteria so that the cells generated pleasant
scents, such as wintergreen and banana. We have taken advantage of their
project as well as other iGEM successes to develop a teaching curriculum for
high schools and colleges. The curriculum includes four hands-on activities and
two classroom assignments. We envision these activities either complementing
existing instruction, for example in an advanced placement biology lab, or
replacing some outdated, cookbook lab classes that are often used as gateways
to undergraduate research opportunities. The activities we have developed also
introduce engineering and technology concepts that are often overlooked in the
vier Inc.
reserved.
255

256 James Dixon and Natalie Kuldell
Author's personal copy
already over-stuffed high school and college curricula. To ease their adoption,
the activities include teacher materials, such as annotated instructions, grading
rubrics, and animated resources. Here, we detail the student and teacher
materials for performing the banana-scented bacteria lab, called “Eau that
Smell.” Other free teaching materials similar to the content here can be
accessed through BioBuilder.org.
1. Introduction
Having observed the profoundly successful learning experiences thathigh school and college students have had through the international Geneti-callyMachines Competition (iGEM;Mitchell et al., 2010), we have turned tosynthetic biology to reinvigorate and reengage students in classes at the highschool and college level. In particular, we have recast or extended studentiGEM projects so as to align them with existing teaching frameworks, or tomeet educational needs in biological engineering laboratory classes (Kuldell,2007). The content we offer includes a lab activity inspired by the iGEMproject from the 2006 MIT team, namely Eau d’coli. These bacteria havebeen genetically engineered to smell like mint during the exponential (“log”)phase of bacterial growth and like bananas during the stationary phase (MIT2006 iGEM team: http://openwetware.org/wiki/IGEM:MIT/2006).
In transforming the Eau d’coli project and other iGEM successes intohands-on activities at BioBuilder.org that could be widely adopted, weconsidered generally accepted hallmarks of good curricula as well as morepedestrian logistical questions. The activities had to explicitly addressengineering- and technology-teaching standards (National AcademiesStandards: http://www.nap.edu/catalog.php?record_id=4962, NationalEducation Standards: http://www7.nationalacademies.org/bose/Standards_Framework_Homepage.html) using investigative frameworks (NationalResearch Council, 2000, Wiggins and McTighe, 1998), and had to beprovided through an open digital platform (e.g., Khan Academy: http://www.khanacademy.org/). Additionally, since we are both teachers, we aresensitive to implementation issues for these activities. Instructions had toprovide real, “rubber meets the road” guidance. For example, the resourcesprovided to teachers had to include guidelines for fitting the activities intoshort or long lab periods, rubrics for grading the work, and digital forums forposing practical questions and sharing clever solutions.
One illustrative example of the “BioBuilder” curriculum grew from aproject called “eChromi” which was the 2009 iGEM Grand Prize winnercarried out by students at the University of Cambridge (University ofCambridge 2009 iGEM team: http://www.echromi.com/). As part oftheir work, students generated a bacterial palette, genetically reprogrammed

“Eau that Smell” Teaching Lab 257
Author's personal copy
strains to appear shades of red, green, and purple. Unexpectedly, theperformance of these color-generating genetic programs depended on thegenetic background of the bacterial chassis. Though the iGEM team did notsee this variable behavior as much more than odd, we took advantage of theobservation as the point of departure for an investigative teaching lab that couldreplace the standard transformation lab commonly taught in high schooladvanced placement (AP) biology classes (Pearson AP Biology Labs: http://www.phschool.com/science/biology_place/labbench/lab6/concepts1.html).In our “BioBuilder” lab 4, students transform a B-type and a K-type bacterialhost with the purple and the green color-generating plasmids. As with thetraditional lab series, students are able to observe that DNA can be transferredto confer phenotypes and that selectable markers can be used to identifycells with plasmids. In the context of the BioBuilder lab, however, there ismotivation for performing this DNA transformation. Students can directlyexamine the presumed equivalence of host strains and can askwhyDNAmightbe expressed differently. They can identify future experiments and applicationsto exploit their observations. In other words, they become practitioners ofscience and engineering, as opposed to technicians.
In this chapter, we detail a teaching laboratory that extends the 2006MITiGEM team’s “Eau d’coli” project (Fig. 12.1). Students grow four strains ofgenetically engineered cells. One of the strains serves as the zero-smellstandard. Another strain is designed to generate a banana-flavored smellwhen the cells are growing in stationary phase. Students are asked toinvestigate the performance of the remaining two strains. These strains usedistinct genetic programs to generate the banana smell during the exponential(“log”) phase of growth. Observing that equivalent designs can performdifferently in real life is an important lesson for budding engineers. The labactivity further offers a chance for students to learn important microbiolo-gical techniques and behaviors, in a charismatic and interesting context.
2. Eau d’coli
The banana-flavored smell from the genetically engineered Eau d’colicells arises from the conversion of isoamyl alcohol to isoamyl acetate.Isoamyl acetate has a banana smell (Fig. 12.2).
Isoamyl alcohol (also called 3-methyl-1-butanol, isopentyl alcohol, orisobutylcarbinol) can be added to the bacterial growth media, where it isefficiently imported into the cells. There, it is converted to isoamyl acetateby the product of ATFI, a gene from Saccharomyces cerevisiae that was clonedbetween a bacterial ribosome binding site and a transcriptional terminator tomake a three part “banana-odor generator.”
To regulate the production of the banana smell, promoters that are activeduring distinct stages of the bacterial growth cyclewere used. These promoters

Figure 12.1 MIT 2006 iGEM team. Members of the summer 2006 team are shown inDrew Endy’s research lab at MIT wearing their iGEM team T-shirts. From the left areshown: Stephen Payne, Boyuan Zhu, Tom Knight, Reshma Shetty, Andre Green,Samantha Sutton, Veena Venkatachalam, Jason Kelly, Austin Che, Barry Canton,Kate Broadbent. Source: Heather A. Thomson.
Isoamylalcohol
Stationary phasebanana odor generator
ATF1
ATF1generator
BBa_J45250
Isoamylacetate
Figure 12.2 Eau d’coli. Diagram illustrating workings of the Eau d’coli system. Cellsexpressing the ATF1 gene from S. cerevisiae can convert isoamyl alcohol in the growthmedia to isoamyl acetate, a compound that smells like bananas. A bacterial promoterthat is primarily active during stationary phase controls the expression ofATF1. Source:2006 MIT iGEM team.
258 James Dixon and Natalie Kuldell
Author's personal copy
differ in their affinity for sigma-factors that can associate with the RNApolymerase core. For cells designed to smell like bananas during stationaryphase, a sigma-38 regulated promoter, pOsmY (Hengge-Aronis et al., 1993),

Table 12.1 Registry of standard biological parts for “Eau That Smell” experiment
BBa_J45999 BBa_J45199 BBa_J45250 BBa_J45200 BBa_J45990
Indole-free
chassis
Banana-odor
generator
Sigma-38
controlling
banana smell
Sigma-70
controlling
banana smell
Sigma-38
promoter
plus 4 part
genetic
inverter
generating
banana
smell
“Eau that Smell” Teaching Lab 259
Author's personal copy
was cloned upstream of the device. For cells designed to smell like bananasduring log phase growth, either a sigma-70 regulated promoter, pTetR (Lutzand Bujard, 1997), was cloned upstream of banana-odor generator, or a fourpart genetic inverter was added to the sigma-38 based construct (BBa_J45990:http://partsregistry.org/Part:BBa_J45990). To best detect the banana smell,the cellular chassis bore amutation in the tnaA gene, inhibiting indole produc-tion and effectively eliminating the putrid smell that characterizes most Escher-ichia coli (YYC912 strain reference: http://cgsc.biology.yale.edu/Strain.php?ID¼64826). The genetic devices associated with this synthetic systemwere allentered into the Registry of Standard Biological Parts (Registry Homepage:http://partsregistry.org/Main_Page) and are tabulated here (Table 12.1).
A combination of techniques was employed by the MIT iGEM team tocharacterize the growth and behavior of their system. To assess the effect ofthe synthetic devices on cellular growth rate, the team measured changes inturbidity of the cultures over time. Growth curves were then correlatedwith expression from the devices by fusing the promoters to GFP instead ofthe banana-odor generator. In this way, the fluorescence of the cells overtime could be measured and used as a predictor of timed scent production inthat system (Fig. 12.3). Finally, gas chromatography and a “sniff” test wereused on the complete systems to look for isoamyl acetate generated by thecells as they grew (Fig. 12.4).
3. “Eau That Smell” Teaching Lab Using the MIT
iGEM Team’s Eau d’coli Cells
The cells that were engineered by the MIT 2006 iGEM team smelldistinctively of bananas, almost like a banana smoothie, by the time theyreach fully saturated growth. However, the completed system leaves only afew teachable questions and experimental manipulations open to teachers.We extended the existing behavior of the Eau d’coli project so students

Bba_J45995 (pOsmY-GFP)
Bba_J45996 (pOsmY-Inverter-GFP)
Bba_J45017 (Negative control)
BBa_I7100 (Constitutive promoter-GFP)
Bba_J45995 (pOsmY-GFP)
Bba_J45996 (pOsmY-Inverter-GFP)
Bba_J45017 (Negative control)
BBa_I7100 (Constitutive promoter-GFP)
9E+5A
B
8E+5
7E+5
6E+5
5E+5
4E+5
3E+5
2E+5
1E+5
0E+00.2 0.3 0.4
Absorbance 600 nm (relative units)
Time (min)
0.00
0.10
0.20
0.30
0.40
0.50
0.60
0.70
0.80
0 200 400 600 800 1000
Abs
orba
nce
600nm
(re
lative
uni
ts)
1200
GFP
Sig
nal (r
elat
ive
units)
0.5 0.6 0.7
Figure 12.3 Characterization of Eau d’coli growth and cell population control. Por-tions of the Eau d’coli system were characterized by examining the growth rate(panel A) and timing of gene expression (panel B). In both cases, the relevant promoterswere fused to GFP and changes in turbidity and fluorescence were measured over time.The data suggest Eau d’coli’s output can be controlled by natural changes in cellpopulation. Source: http://openwetware.org/wiki/IGEM:MIT/2006/osmY_Results.
260 James Dixon and Natalie Kuldell
Author's personal copy
could actively engage with it. Drawing from the National Science Standards(National Academy Standards website http://www.nap.edu/openbook.php?record_id¼4962), we first identified a design opportunity, namely

Abundance
Abundance
Abundance
Time→
Time→
Time→
A
B
C
BBa_J45200
TOP10
No isoamyl acetate
Isoamyl acetate
Standard
Octyl acetateinternal standard
Octyl acetateInternal standard
Isoamyl acetate
1e+07
1.6e+07
1.4e+07
1.2e+07
1e+07
8,000,000
6,000,000
4,000,000
2,000,000
8,000,000
6,000,000
4,000,000
2,000,000
1e+07
8,000,000
6,000,000
4,000,000
2,000,000
5.00 10.00
5.00 10.00
5.00 10.00
Octyl acetateinternal standard Indole
Indole
Figure 12.4 Isoamyl acetate output from Eau d’coli. Isoamyl acetate appears as adistinct and detectable peak on a gas chromatography when Eau d’coli cells aregrown in the presence of isoamyl acetate (panel A), but only when cells bear thebanana-odor generator, BBa_J45200 (panel B). Purified isoamyl acetate was used toconfirm the retention rate of the compound (panel C). The pronounced peak for indolereflects the fact that the strains expressing these devices were wild-type for tnaA.Source: http://partsregistry.org/Part:BBa_J45200:Experience.
“Eau that Smell” Teaching Lab 261
Author's personal copy
262 James Dixon and Natalie Kuldell
Author's personal copy
alternative genetic circuits that both met the stated goal of making log-phasebanana smell. Next, we allowed the students to experimentally evaluateand then choose the better performing solution. The teacher’s materials thatwe provide include some guidance for helpful assessment of the student’swork, rubrics to guide the student’s communication of experimentallimitations and questions to motivate future directions.
In our hands, the banana-smell is less intense when directed by a sigma-70 promoter than when controlled by a sigma-38 promoter and a four partgenetic inverter. However, the former design does a better job of expressingthe device during log-phase only. This experimental result presents aninteresting “choice” for the students to weigh (Fig. 12.5).
3.1. Growing starter cultures for the students
To begin this experiment, a high school or college teacher would request akit from us. We could also send kits to summer iGEM teams who needpreliminary training. These kits include four bacterial strains, three thatshould smell like bananas when grown in the presence of isoamyl alcoholand one negative control strain. The kits will also include, as needed,growth media, banana-scent standards, and turbidity standards. The strainswill be sent in the form of a “stab” or “slant,” a test tube with a small amountof bacteria on a slanted media. To continue the experiment, teachers andtheir students will have to further culture the bacteria by streaking out thestabs onto LB (Luria Broth) þ ampicillin plates, as instructed below, andthen further growing liquid starter cultures the following day. Note thatsince the host strain is chloramphenicol resistant, the selection can equallywell be carried out in LB þ ampicillin þ chloramphenicol. If used, chlor-amphenicol stock solutions are made as 34 mg/ml ethanol and are used at a1:1000 dilution in plates and in liquid culture.
Day 1
1. Using a sterile toothpick or inoculating loop, gather a small amount ofbacteria from the stab and transfer it to a petri dish containing LB agar(1% tryptone, 0.5% yeast extract, 1% NaCl, 2% agar) þ ampicillin(200 mg/ml final concentration).
2. Repeat with the remaining stab samples, streaking out each onto adifferent petri dish.
3. Place these cultures in a 37 �C incubator overnight.
Day 2
1. Using a sterile inoculating loop, transfer a bacterial colony from one ofthe petri dishes to a large sterile culture tube containing 5 ml of LB(recipe is identical to that for petri dishes but the agar is omitted) and 5 mlof ampicillin (stock solution ¼ 100 mg/ml sterile water).

00
1
2
3
4
5
6Strain 1-1 (sigma-38 Strain 1-2 (sigma38+ inverter
ATF1)
500 1000 1500 2000 00
0.51
1.52
2.53
3.54
4.5
500 1000 1500 2000
00
0.20.40.60.8
11.21.41.61.8
500 1000
Strain 1-4 (no ATF1)
1500 200000
0.5
1
1.5
2
2.5
3.5
3
500 1000 1500 2000
spec OD600 Banana Smell
ATF1)
Strain 1-3 (sigma-70 ATF1)
Figure 12.5 Behavior of “Eau that Smell” experimental and control strains. Growthand banana-smell generated by each experimental strain was assessed. Growth curves,shown with the blue lines, are measured as changes in turbidity over time. Bananasmell, shown with red lines, was calibrated to the smell standards and is plotted for eachtime point on the growth curve. Growth time, in minutes, is shown on the x-axis.Unexpectedly, the log-phase promoter (strain 1-3) generates a less pronounced banana-flavored smell but is more tightly controlled to express only during the log-phase ofgrowth. Source: data collected by J. Dixon.
“Eau that Smell” Teaching Lab 263
Author's personal copy
2. Repeat for each strain you will inoculate.3. Place the culture tubes in the roller wheel in the incubator at 37 �C
overnight. Be sure to balance the tubes across from each other tominimize stress on the roller wheel.
3.2. Bacterial growth and scent curves
Once the liquid starter cultures for each strain have been grown, studentscan inoculate larger volumes of cells to be examined for growth and banana-smell over time. Cells are grown in flasks in sufficiently large volumes so the

264 James Dixon and Natalie Kuldell
Author's personal copy
smell associated with each strain is pronounced, and the volume can supportthe removal of multiple aliquots for turbidity measurements. We havedescribed the lab with 50 ml of each culture growing in 100 ml Erlenmeyerflasks on stir plates at room temperature. Instructors will have to scale thematerials according to the number of students and the availability ofequipment.
Depending on the time available for teaching, the experiment can be runin different ways. A longer time period such as a 3 or 4 h college lab wouldallow the students to follow much of the growth curve, ideally from the endof lag phase through exponential growth and into stationary phase, all in oneday. In cases when students are in the lab for an hour or less, the experimentcan be carried out over several days, with an instructor placing the growingcells into a refrigerator between days to slow down their growth. In thiscase, the instructor overseeing the lab should warm the cells back to roomtemperature in advance of the students’ time in lab and should note the timethe cultures spend at room temperature so students can accurately determinechanges in turbidity over time. It is important that the growing culturesremain covered with foil or plugs while they cool and warm so the smellassociated with each strain can be determined. Additionally, students shouldbe discouraged from smelling the cultures too often since the smell willdissipate and, if smelled too often, it can give some students a headache.
Data collected should be plotted with time as the common x-axis, andwith both turbidity and smell sharing the y-axis. Turbidity can be measuredwith optical density at 600 nm using a spectrophotometer or by comparisonto the MacFarland Turbidity Scale, described below. The intensity of thebanana smell can be described with the following standards, prepared asindicated.
3.2.1. Banana-scent standardAn arbitrary scale has been established to associate numerical values to theintensity of the banana smell. This scale is based on the smell of a series ofbanana extract dilutions. The banana extract is an oil and will not dissolve inwater. However, the concentrations are low and as long as the standard isgiven a shake before smelling, a suspension is sufficient. We have usedbanana extract made by “Frontier Natural Flavors” but suspect other brandswould work equally well. The dilutions are prepared as indicated inTable 12.2, storing the solutions in plastic 50 ml conical tubes at roomtemperature until needed.
3.2.2. Measuring banana-smell and cell growth
1. Prepare a stock growth solution with 300 ml LB (1% tryptone, 0.5%yeast extract, 1% NaCl), 300 ml ampicillin (stock solution ¼ 100 mg/ml sterile water), 250 ml isoamyl alcohol. Note that isoamyl alcohol
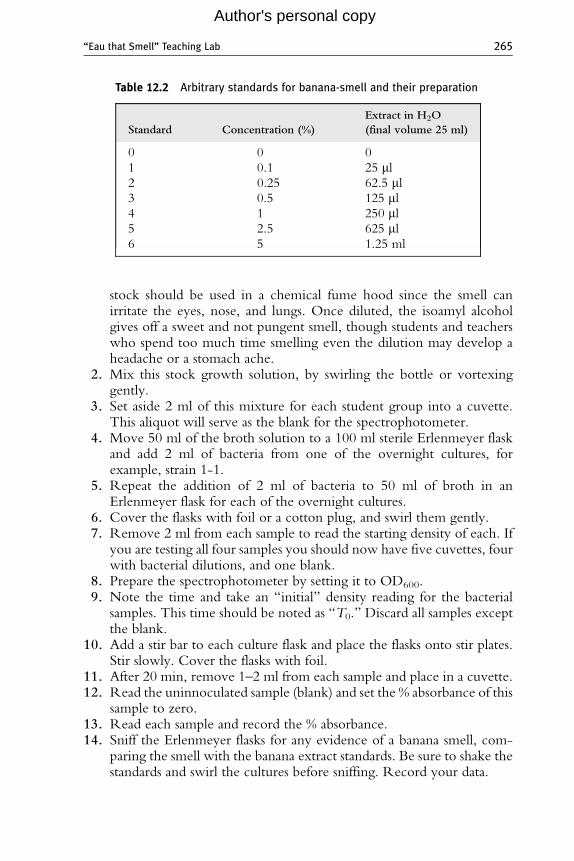
Table 12.2 Arbitrary standards for banana-smell and their preparation
Standard Concentration (%)
Extract in H2O
(final volume 25 ml)
0 0 0
1 0.1 25 ml2 0.25 62.5 ml3 0.5 125 ml4 1 250 ml5 2.5 625 ml6 5 1.25 ml
“Eau that Smell” Teaching Lab 265
Author's personal copy
stock should be used in a chemical fume hood since the smell canirritate the eyes, nose, and lungs. Once diluted, the isoamyl alcoholgives off a sweet and not pungent smell, though students and teacherswho spend too much time smelling even the dilution may develop aheadache or a stomach ache.
2. Mix this stock growth solution, by swirling the bottle or vortexinggently.
3. Set aside 2 ml of this mixture for each student group into a cuvette.This aliquot will serve as the blank for the spectrophotometer.
4. Move 50 ml of the broth solution to a 100 ml sterile Erlenmeyer flaskand add 2 ml of bacteria from one of the overnight cultures, forexample, strain 1-1.
5. Repeat the addition of 2 ml of bacteria to 50 ml of broth in anErlenmeyer flask for each of the overnight cultures.
6. Cover the flasks with foil or a cotton plug, and swirl them gently.7. Remove 2 ml from each sample to read the starting density of each. If
you are testing all four samples you should now have five cuvettes, fourwith bacterial dilutions, and one blank.
8. Prepare the spectrophotometer by setting it to OD600.9. Note the time and take an “initial” density reading for the bacterial
samples. This time should be noted as “T0.” Discard all samples exceptthe blank.
10. Add a stir bar to each culture flask and place the flasks onto stir plates.Stir slowly. Cover the flasks with foil.
11. After 20 min, remove 1–2 ml from each sample and place in a cuvette.12. Read the uninnoculated sample (blank) and set the % absorbance of this
sample to zero.13. Read each sample and record the % absorbance.14. Sniff the Erlenmeyer flasks for any evidence of a banana smell, com-
paring the smell with the banana extract standards. Be sure to shake thestandards and swirl the cultures before sniffing. Record your data.
266 James Dixon and Natalie Kuldell
Author's personal copy
15. At 20-min intervals repeat steps 11–14.16. Between time points, you can calculate the bacterial population using
the approximation of 1 OD600 unit ¼ 1 � 109 bacteria.
3.2.3. Notes to teachersA teacher presenting this lab has an opportunity to teach microbiologytechniques, population growth dynamics, molecular genetics, and basicsynthetic biology concepts in a meaningful, real world way. Given thatengineering practice in general and synthetic biology in particular are notcommonly taught, we provide lesson materials to introduce the lab activitiesfound on the “BioBuilding” wiki. For example, the “Eau that Smell” labcan be framed with a one page “bioprimer” in which two characters discussthe relevant merits of the designs that will be compared. Terms that areunfamiliar to the teacher or students can be learned through the glossary linkon the BioBuilding site, or through short animations that further extend thenarrative between the characters. The animations and activities are collectedon BioBuilder.org (Fig. 12.6).
3.3. Assessment
To show their understanding of the system, students can be asked to discuss:
� How well were they able to measure the population growth?� How well were they able to smell bananas?� Did each strain and their associated devices produce the same results?� Did the genetic systems affect the growth curve of the bacteria?
Students performing this lab also have a chance to do meaningful erroranalysis and examine the difference between quantitative and qualitativeresults. When the students analyze their data, they might consider:
� How does each part of the experiment add to the conclusion?� What errors or experimental parameters might lead to data variability?� How confidently can they state their results?� Are they equally confident in both the growth data and the smell data?� Is using smell to measure the isoamyl acetate valid?� What methods did they use to try to increase their confidence in theresults?
� How might they change this system to better quantify the banana smell?� Is there another kind input or output they would suggest including?� If they could construct a different genetic system,whatmight they construct?
This final question could easily be used as the bridge to other “BioBuild-ing” activities or to a summer iGEM project, depending on the teachingcontext.

Figure 12.6 BioPrimer #1. To introduce students to the scientific and engineeringunderpinnings of the “Eau that Smell” lab activity, a one page “BioPrimer” can becirculated and discussed. When accessed from the internet, the BioPrimer has activelinks to terms that are unfamiliar, allowing the concepts to be learned through anima-tions or additional readings. Multiple BioPrimers could serve as the framework for asemester long biological engineering class or a biotechnology course. Source: AnimatedStoryboards and BioBuilder.org.
“Eau that Smell” Teaching Lab 267
Author's personal copy
4. Teaching Labs Modified for
Resource-Stretched Settings
For teaching settings that do not have a reliable spectrophotometer ora sufficient number of instruments to use in a class setting, we offer amodification to the standard protocol. To assess turbidity, the bacterialsolutions can be compared to the MacFarland Turbidity standards. Theturbidity standards are prepared as suspensions of BaCl2 in H2SO4 and arevisually similar to suspensions of growing E. coli.

268 James Dixon and Natalie Kuldell
Author's personal copy
Other activities available through BioBuilder.org offer similar instructionsfor modifications when equipment is unreliable or limiting. For example, the“iTune Device” lab generates a yellow colored product that the students cancompare to a Benjamin Moore Paint Chip to approximate intensity readings.
4.1. Preparation of MacFarland Turbidity standards
Dilutions of 1% BaCl2 in 1% H2SO4 are prepared according to Table 12.3.The standards are stable at room temperature for at least a month, morelikely longer, and can be aliquoted by the students themselves or in advanceby the instructors.
4.2. Comparison of growing cultures to Turbidity Standards
1. Turbidity standards should be aliquoted into small clear test tubes. Thetubes should contain enough of each standard to fill the tube to a heightof about 1 in. (2.5 cm). Tubes must be properly labeled with its turbiditystandard number.
2. The aliquots of the turbidity standards should be placed in a test tuberack that allows the liquid to be viewed from the side.
3. On a blank index card or piece of folded printer paper, two thick blacklines should be drawn with a marker. These lines should be placed on thecard or paper to fall within the height of the standards.
4. Place the card with the lines into the test tube rack behind the standards(see Fig. 12.7).
5. To compare the bacterial cultures to the turbidity standards, an aliquot ofthe growing cultures should be moved into a test tube of the same size asthe standards. A volume approximately equal to that of the standardsshould be used and the identity of the samples should be included on thetube’s label.
Table 12.3 Standards for turbidity and their preparation
Turbidity scale OD600 1% BaCl2/1% H2SO4 (ml)
0 0 0.0/10
1 0.1 0.05/9.95
2 0.2 0.1/9.9
3 0.4 0.2/9.8
4 0.5 0.3/9.7
5 0.65 0.4/9.6
6 0.85 0.5/9.5
7 1.0 0.6/9.4

Figure 12.7 Example of turbidity comparison. Samples of bacteria (leftmost memberof each pair) are compared to MacFarland Turbidity Standards. Samples are deemedequivalent when the black lines behind the tubes are obscured to the same extent.Source: J. Dixon.
“Eau that Smell” Teaching Lab 269
Author's personal copy
6. The sample tubes can be placed next to the turbidity standards to becompared side-by-side. The standard that best represents the turbidity ofthe samples will be the one that obscures to the same extent the blacklines drawn on the card.
7. Table 12.3 can be used to determine the OD600 value using eachturbidity standard.
8. If the number of cells is to be calculated, then 1 OD600 unit can beapproximated as equal to 1 � 109 cells/ml.
5. Summary
Most students at the high school and college level today could hardlyimagine a world that did not include digital resources. Indeed, whenstudents in Michael Wesch’s “Digital Enthography” class at Kansas StateUniversity tackled the question: “what is it like being a student today,”they documented their findings as a video (“Vision of Students Today”:http://www.youtube.com/watch?v¼dGCJ46vyR9o) and posted it toYouTube. In their video, the students present the results of their classsurveys by holding 8½ � 11 in. signs or by showing their computer screensto the camera. Some of their messages, like “my average class size is 115”and “I buy hundred dollar textbooks that I never open” are not new issuesfor students at the university level. However, some aspects they present doseem different, for example, “I facebook through most of my classes” and“My neighbor paid for class but never comes.”

270 James Dixon and Natalie Kuldell
Author's personal copy
How is a teacher to respond to the digital distractions that are a hallmarkof this era? One (not unappealing) reply is to say something like, “stopgoofing off and study.” Indeed, experience says that students who put moreinto any class are the ones who get more out of it. So when students offeronly a portion of their energy and attention in class, they are only short-changing themselves. Nonetheless, most teachers are hopeful that the sub-ject they teach will excite others, and so most teachers look for ways toengage the students.
Perhaps, a more constructive reply to the issue of digital distractions is tomeet the students on their technology playing field. If students really do“spend 3.5 h a day online” then perhaps a winning strategy is to teachthrough technology and online tools. Digital quiz-lets, discussion forums,and internet games can encourage students to interact more often and morethoughtfully with the class content. But when poorly implemented, cyber-oriented teaching can fall short, seeming more like “chocolate-coveredbroccoli” than any novel and engaging tool for interaction (Gorsky andBlau, 2009). Additionally, the recent failure of Google’s “Wave” learningmanagement system is a sobering reminder that technological advancesmust not be too complicated for average users, and must integrate wellwith the way people actually teach (Young, 2010).
Synthetic biology offers a mechanism for training students in an engagingand novel way. iGEM continues to attract summer students worldwide(iGEM: http://2010.igem.org/Main_Page), and the Adventures in SyntheticBiology comic is “given out like candy” (DIY-bio: http://diybio4beginners.blogspot.com/2009/02/adventures-in-synthetic-biology-comic.html). Thesetwo educational successes are leveraged at the BioBuilder website (http://www. biobuilder.org/) which expands iGEM projects like the banana-smell-ing bacteria, into digitally accessible materials for teaching and learning.
ACKNOWLEDGMENTS
We thank the 2006 MIT iGEM team for their hard and thoughtful work to establish the Eaud’coli system. We further thank Ginkgo Bioworks for DNA construction. These teachingmaterials were developed over two summers with the support of SynBERC, an NSF-fundedEngineering Research Center, and the support of MIT’s Department of BiologicalEngineering.
REFERENCES
Gorsky, P., and Blau, I. (2009). Online teaching effectiveness: A tale of two instructors. Int.Rev. Res. Open Dist. Learn. 10(3), 1–27.
Hengge-Aronis, R., Lange, R., Henneberg, N., and Fischer, D. (1993). Osmotic regulationof rpoS-dependent genes in Escherichia coli. J. Bacteriol. 175(1), 259–265, PMID:8416901.

“Eau that Smell” Teaching Lab 271
Author's personal copy
Kuldell, N. (2007). Authentic teaching and learning through synthetic biology. J. Biol. Eng.1, 8.
Lutz, R., and Bujard, H. (1997). Independent and tight regulation of transcriptional units inEscherichia coli via the LacR/O, the TetR/O and AraC/I1-I2 regulatory elements.NucleicAcids Res. 25(6), 1203–1210.
Mitchell, R., Dori, Y. J., and Kuldell, N. (2010). Experiential engineering through iGEM—An undergraduate summer competition in synthetic biology. J. Sci. Educ. Technol.10.1007/210956-010-9242-7.
National Research Council (2000). How People Learn National Academies Press, Washing-ton, DC0-309-07036-8.
Wiggins, G., and McTighe, J. (1998). Understanding by Design. Merrill Prentice Hall,Columbus, OH0-13-093058-X.
Young, J. (2010). Google Wave, Embraced by many on Campuses, to get Wiped Out.Chronicle of Higher Education. http://chronicle.com/blogPost/blogPost-content/26039/August 5.