biodiversity assessment of the kannaland and oudtshoorn
TRANSCRIPT
Compiled By:
Andrew Skowno, Dr Stephen Holness & Dr Philip Desmet
Date: 31st August 2010
DEADP REPORT Number: LB07/2008a
Biodiversity Assessment of the Kannaland
and Oudtshoorn Local Municipalities, and
Eden District Management Area (Uniondale)
Final Report

Kannaland, Oudtshoorn and DMA04 Biodiversity Assessment – Final Report August 2010 i
Report Title: Biodiversity Assessment of the Kannaland and Oudtshoorn Local Municipalities, and Eden
District Management Area (Uniondale)
Date: 31st August 2010
Authors & contact details: Andrew Skowno (corresponding author)
ECOSOL GIS – 21 Neapolis, Pier Street, South End, Port Elizabeth 6001
Cell: 082 774 4613; Email: [email protected]
Dr Stephen Holness
Private Consultant , Port Elizabeth; Cell: 082 887 3735; Email: [email protected]
Dr Phillip Desmet
Private Consultant, Pretoria; Cell: 082 352 2955; Email: [email protected]
Client: Western Cape Department of Environmental Affairs and Development Planning, Contact
Mellisa Naiker (021) 483 2885
Principle funding agent: Western Cape Provincial Government
Citation: Skowno, A.L., Holness, S.D. and P.G. Desmet (2010) Biodiversity Assessment of the Kannaland
and Oudtshoorn Local Municipalities, and Eden District Management Area
(Uniondale). DEADP Report LB07/2008a, 65 pages.
Acknowledgements: Thanks to Mellisa Naiker and the rest of the project steering committee. In particular
Donovan Kirkwood, Jeff Manual and Kerry Maree for providing technical and input and
advice. Thanks to Jan Vlok, Anna Lise Vlok, and John Gallo for expert biodiversity, and
planning input and helpful comments on draft manuscript.
Kannaland, Oudtshoorn and DMA04 Biodiversity Assessment – Final Report August 2010 ii
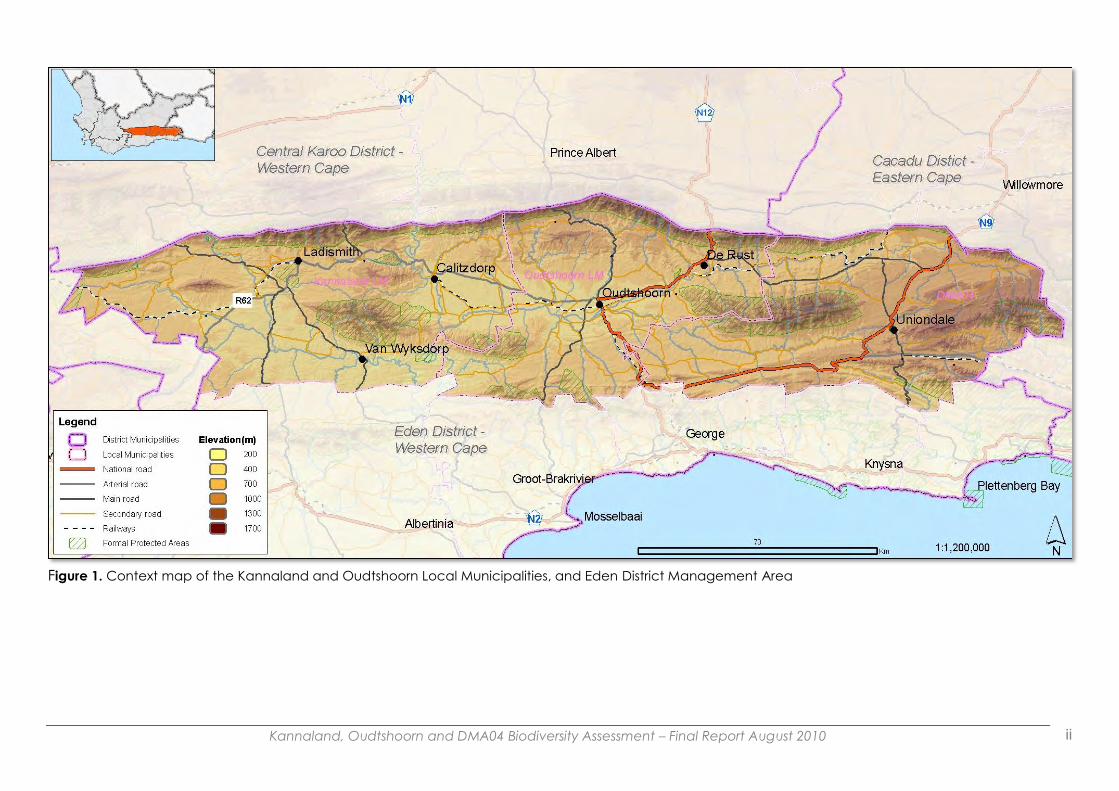
Figure 1. Context map of the Kannaland and Oudtshoorn Local Municipalities, and Eden District Management Area
Kannaland, Oudtshoorn and DMA04 Biodiversity Assessment – Final Report August 2010 iii
Table of Contents
List of Figures ......................................................................................................................................................... iv List of Tables ........................................................................................................................................................... v Objectives and Deliverables from the TOR .................................................................................................. vi
1 INTRODUCTION AND SUMMARY ....................................................................................................................... 1
2 BIODIVERSITY INFORMATION ............................................................................................................................. 3
2.1 BACKGROUND .................................................................................................................................................. 3 2.2 BIODIVERSITY FEATURES ..................................................................................................................................... 3
2.2.1 Habitat Types .......................................................................................................................................... 3 2.2.2 Nationally Listed Threatened Ecosystems ....................................................................................... 5 2.2.3 Priorities identified in other conservation assessments within, or overlapping into, the planning domain.................................................................................................................................................. 5 2.2.4 Existing data on species and biodiversity features ...................................................................... 6 2.2.5 Aquatic Features ................................................................................................................................... 6
2.3 ECOLOGICAL PROCESS .................................................................................................................................... 7 2.3.1 Connectivity ............................................................................................................................................ 8 2.3.2 Areas of potential importance in climate change adaptation ............................................... 8 2.3.3 Existing corridors from Gouritz Initiative ............................................................................................ 8
2.4 ALIGNMENT WITH ADJACENT CONSERVATION PLANS ......................................................................................... 9 2.5 LAND COVER ................................................................................................................................................. 10 2.6 TERRESTRIAL ECOSYSTEM STATUS ...................................................................................................................... 12
3 PROTECTED AREA NETWORK GAP ANALYSIS ................................................................................................ 15
3.1 PROTECTION LEVEL AND URGENCY ................................................................................................................. 18
4 RETENTION AND RESTORATION OF BIODIVERSITY ....................................................................................... 20
5 CRITICAL BIODIVERSITY AREAS ........................................................................................................................ 23
5.1 WHAT ARE CBAS? ......................................................................................................................................... 23 5.2 CRITICAL BIODIVERSITY AREAS CATEGORIES ................................................................................................... 24 5.3 PLANNING APPROACH.................................................................................................................................... 24 5.4 DESCRIPTION OF CBA‟S FOR THE KANNALAND MUNICIPALITY, OUDTSHOORN MUNICIPALITY AND EDEN
DISTRICT MANAGEMENT AREA ...................................................................................................................................... 27
6 LAND-USE GUIDELINES ....................................................................................................................................... 30
6.1 DESIRED MANAGEMENT OBJECTIVE ................................................................................................................ 30 6.2 RECOMMENDED BIODIVERSITY-COMPATIBLE LAND-USE GUIDELINES ................................................................ 30 6.3 GUIDELINES FOR THE SOUND MANAGEMENT OF LAND AND WATER RESOURCES................................................ 32 6.4 LAND-USE ACTIVITY DEFINITIONS ..................................................................................................................... 35
7 REFERENCES .......................................................................................................................................................... 39
8 APPENDIX 1: GIS METHODS AND TECHNICAL NOTES ................................................................................. 41
8.1 PLANNING DOMAIN ....................................................................................................................................... 41 8.2 GENERAL ........................................................................................................................................................ 41 8.3 TABLE SHOWING COLOURS USED IN THE CRITICAL BIODIVERSITY AREA MAP .................................................... 42 8.4 PROTECTED AREAS LAYER ................................................................................................................................ 42 8.5 LAND COVER MODEL ...................................................................................................................................... 42 8.6 BIODIVERSITY FEATURES ................................................................................................................................... 43
8.6.1 Habitat model ...................................................................................................................................... 43 8.6.2 Nationally listed threatened ecosystems ...................................................................................... 44 8.6.3 Special plant species .......................................................................................................................... 44 8.6.4 Forest patches ...................................................................................................................................... 44 8.6.5 Quartz patches .................................................................................................................................... 44 8.6.6 Leslie Hill Succulent Karoo Expert areas ........................................................................................ 45 8.6.7 John Gallo Expert areas ( including inputs from Jan Vlok) ...................................................... 45

Kannaland, Oudtshoorn and DMA04 Biodiversity Assessment – Final Report August 2010 iv
8.6.8 Priority areas from the STEP and SKEP Conservation Assessments.......................................... 45 8.6.9 Succulent Karoo Priorities .................................................................................................................. 45 8.6.10 Garden Route Initiative Critical Biodiversity Areas and Ecological Support Areas ...... 46 8.6.11 East Cape Priorities ......................................................................................................................... 46
8.7 AQUATIC FEATURES ............................................................................................................................................ 46 8.7.1 Priority Rivers and Catchments ........................................................................................................ 46 8.7.2 Additional rivers .................................................................................................................................... 46 8.7.3 Wetlands and pans ............................................................................................................................. 47
8.8 ECOSYSTEM STATUS ............................................................................................................................................ 47 8.9 PROTECTION LEVEL AND URGENCY .................................................................................................................... 47 8.10 CLIMATE CHANGE AND CORRIDORS ................................................................................................................ 47
8.10.1 High priority unfragmented landscapes................................................................................... 47 8.10.2 Riparian corridors ............................................................................................................................ 47 8.10.3 Topographic variability.................................................................................................................. 48 8.10.4 South-facing slopes ........................................................................................................................ 48 8.10.5 Kloof model ...................................................................................................................................... 49 8.10.6 Existing corridors from the Gouritz Initiative.............................................................................. 49 8.10.7 Alignment with adjacent conservation plans......................................................................... 49
8.11 NON-BIODIVERSITY ALIGNMENT LAYERS ...................................................................................................... 50 8.11.1 Important Natural Viewsheds ...................................................................................................... 50
8.12 COST LAYERS ................................................................................................................................................. 50 8.12.1 Landcover model ........................................................................................................................... 50
8.13 RESTORATION / REHABILITATION MODEL ...................................................................................................... 50 8.14 TECHNICAL METHODS USED IN THE ASSESSMENT ........................................................................................... 50
8.14.1 Planning Units ................................................................................................................................... 50 8.14.2 Biodiversity Features and Targets ............................................................................................... 50 8.14.3 Software methods........................................................................................................................... 50 8.14.4 Planning Unit Cost ........................................................................................................................... 50 8.14.5 Ecological Support Areas ............................................................................................................. 51 8.14.6 CBA Lookup Table .......................................................................................................................... 51
9 APPENDIX 2: ECOSYSTEM STATUS FOR HABITAT UNITS IN THE PLANNING DOMAIN
List of Figures Figure 1. Context map of the Kannaland and Oudtshoorn Local Municipalities, and Eden District
Management Area.
Figure 2. Habitat units mapped by Vlok et al. (2005), showing the Little Karoo Region mapped and
the municipal areas on which this assessment is focussed . 235 distinct habitat units were identified
in the three Municipal areas covered by this report, out of a total of 369 mapped for the region.
Figure 3. Biomes represented in the planning domain following Vlok et al. (2005) classification.
Figure 4. Seven NEMBA listed threatened ecosystems found in the planning domain. Based on the
South African National Vegetation Map (Mucina and Rutherford, 2006).
Figure 5. Priorities areas identified by other conservation assessments.
Figure 6. Biodiversity rich areas and threatened species distributions identified by other projects.
Figure 7. Aquatic features used in the assessment included sensitive wetlands and pans, based on
Cape Nature (Shaw 2007) and NFPA wetlands (Nel et al. in prep); priority sub-quaternary river
catchments and river reaches , based on NFPA data, where FEPA are priority areas and FESA are
support areas (Nel et al. in prep); additional order 2 and above rivers buffered by 100m.
Figure 8. Features representing ecological processes, landscape connectivity and climate change
adaptation.
Figure 9. Biodiversity Corridors Developed for the Gouritz Region by Lombard et al. 2004
Figure 10. Critical Biodiversity Areas identified by other recent projects adjacent to the planning
domain; including the Central Karoo District, Eastern Cape Provincial Plan, CAPE Fine Scale plans
for Hessequa and Mossel Bay, and Garden Route Initiative.
Figure 11. Land cover map of the Kannaland Municipality, Oudtshoorn Municipality, and Eden
District Management Area. No natural (Transformed) class includes, cultivation, mining, rural and
urban development, high density alien, plantations, roads and railways. Degradation class includes
severely degraded areas mapped by Thompson et al. (2005).

Kannaland, Oudtshoorn and DMA04 Biodiversity Assessment – Final Report August 2010 v
Figure 12. Terrestrial ecosystem status (transformation and degradation combined). Due to the high
levels of transformation and degradation 12 habitat types are Critically Endangered, 13 are
Endangered and 19 are Vulnerable. A total of 235 habitat types are described in the planning are
by Vlok et al. 2005.
Figure 13. Protected areas in the Kannaland Municipality, Oudtshoorn Municipality and Eden
District Management Area. A small portion of the Garden Route National Park is represented, ten
Western Cape Provincial Reserves, one Eastern Cape Provincial Reserve and four Mountain
Catchment Areas. Seven Cape Nature biodiversity stewardship sites and numerous private
conservation areas. (provincial reserves, national parks, mountain catchment areas and
contracted biodiversity stewardship sites were considered formal PAs in protection status
calculations, private reserves are classed as informal CAs).
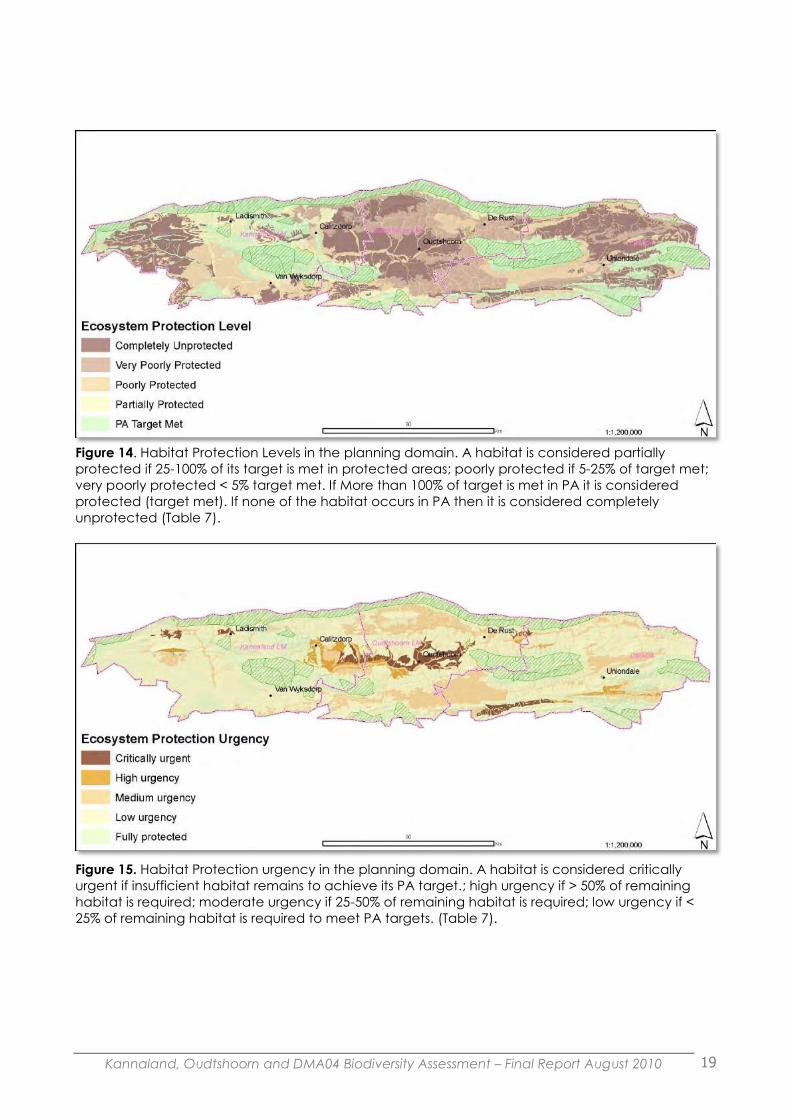
Figure 14. Habitat Protection Levels in the planning domain. A habitat is considered partially
protected if 25-100% of its target is met in protected areas; poorly protected if 5-25% of target met;
very poorly protected < 5% target met. If More than 100% of target is met in PA it is considered
protected (target met). If none of the habitat occurs in PA then it is considered completely
unprotected (Table 4).
Figure 15. Habitat Protection urgency in the planning domain. A habitat is considered critically
urgent if insufficient habitat remains to achieve its PA target.; high urgency if > 50% of remaining
habitat is required; moderate urgency if 25-50% of remaining habitat is required; low urgency if <
25% of remaining habitat is required to meet PA targets. (Table 4).
Figure 16. Map extracted from Forsyth et al. (2008) to illustrate the available tools for responsible
land management in the region; specifically the recommended stocking rates for Ostriches in the
various habitats of the region .
Figure 17. Map extracted from Forsyth et al. (2008) to illustrate the available tools for responsible
land management in the region; specifically the spekboom thicket restoration potential of habitats
in the region.
Figure 18. Important tourism view sheds identified in the region by Reyers et al.( 2009).
Figure 19. The outputs on the initial MARXAN runs were used to identify the highest priority network
of Critical Biodiversity Areas. These include both irreplaceable sites (i.e. areas where there is no
choice) as well as significant “best design” areas which are not the only options but represent an
efficient and ecologically coherent network of optimal sites.
Figure 20. Critical Biodiversity Areas in the Kannaland Municipality, Oudtshoorn Municipality and
Eden District Management Area.
List of Tables
Table 1. Summary of extent of Biomes in the Planning Domain, Note Vlok Et al. 2005 biome
definitions followed not SA vegetation map definitions
Table 2. The area covered by level one and level 2 land classes in the Kannaland and Oudtshoorn
Local Municipalities, and Eden District Management Area.
Table 3. The percentage coverage of level one land classes in the Kannaland and Oudtshoorn
Local Municipalities, and Eden District Management Area.
Table 4. Summary table of number of vegetation types found in each Ecosystem Status Class
Table 5. Criteria used to identify threatened terrestrial ecosystems, with thresholds for critically
endangered (CR), endangered (EN) and vulnerable (VU) ecosystems (SANBI 2008).
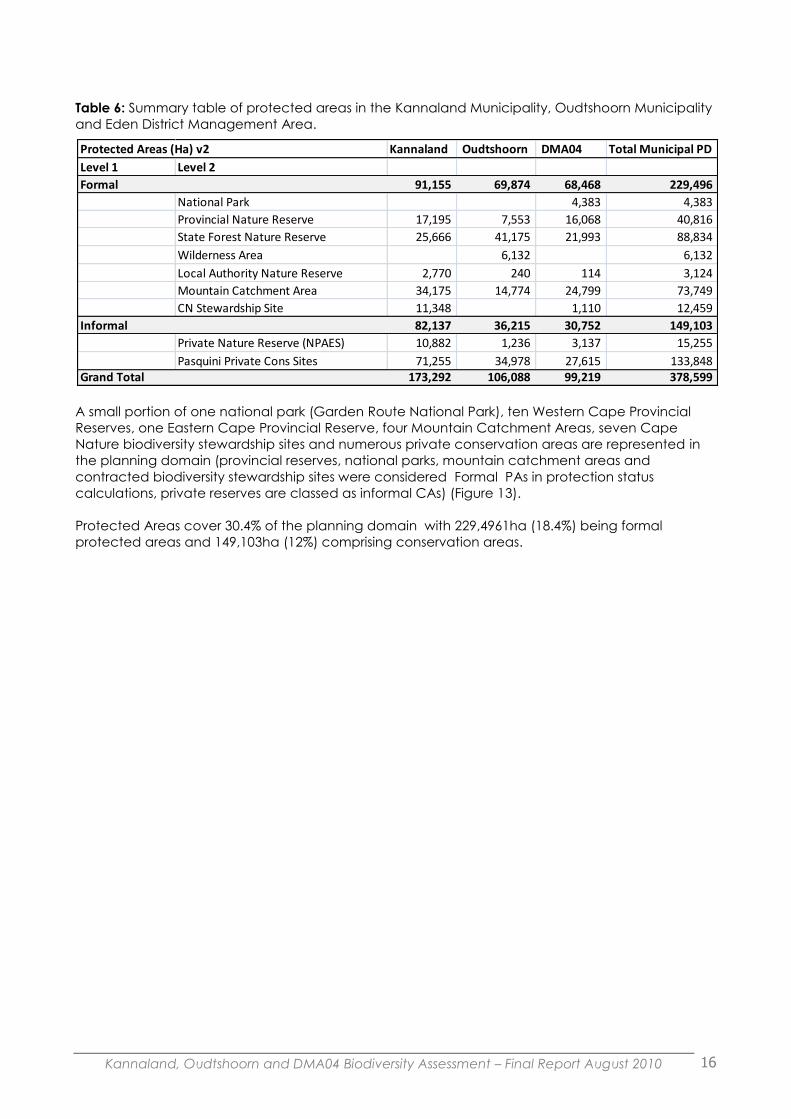
Table 6. Summary table of protected areas in the Kannaland Municipality, Oudtshoorn Municipality
and Eden District Management Area
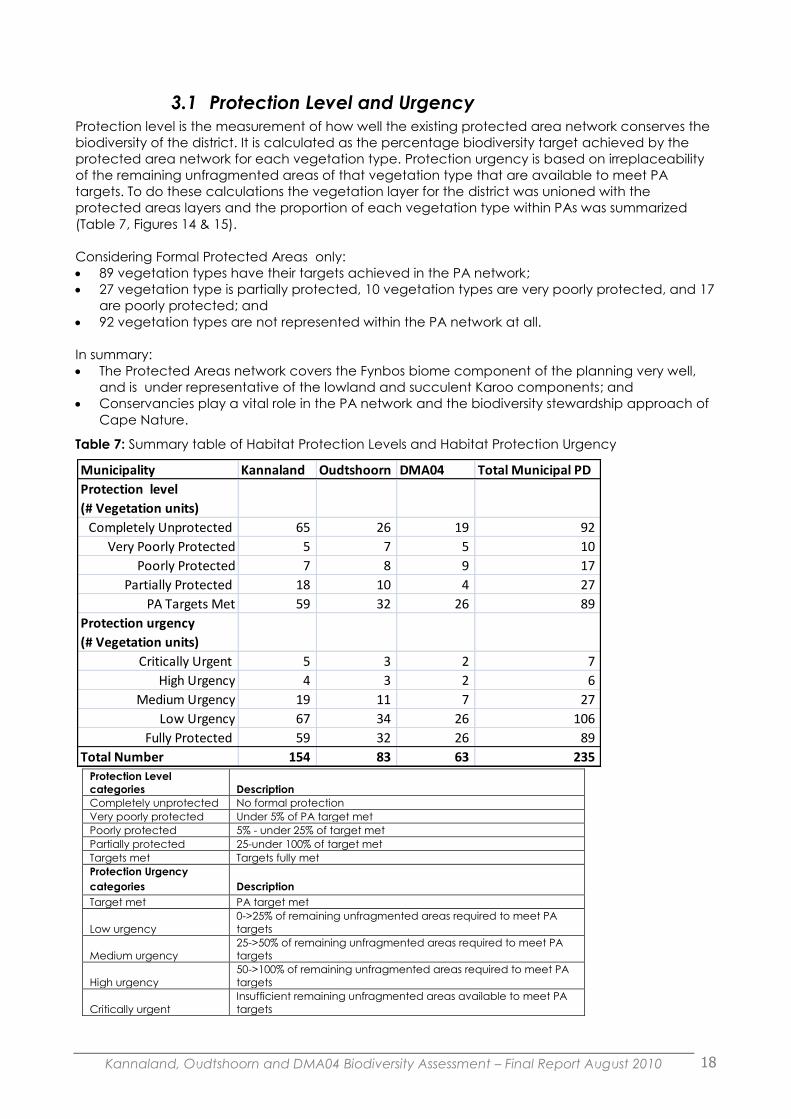
Table 7. Summary table of Habitat Protection Levels and Habitat Protection Urgency
Table 8. Criteria used to define the CBA map categories (Figure 17)
Table 9. Biodiversity criteria used to define Critical Biodiversity Areas (CBAs) in the Kannaland,
Oudtshoorn Municipalities and DMA04.
Table 10. Desired Management Objective per mapped category
Table 11. Recommended biodiversity-compatible land use guidelines matrix
Table 12. Land-use activity definitions adopted from the provincial Rural Land Use Planning and
Management Guidelines (in preparation).

Kannaland, Oudtshoorn and DMA04 Biodiversity Assessment – Final Report August 2010 vi
Objectives and Deliverables from the TOR
Objective
The identification of biodiversity features and areas where conservation compatible
land-use practices are required in order to meet nationally accepted targets for
pattern and process.
To provide a realistic picture of patterns of transformation by assessing degradation.
To produce a conservation plan that is efficiently designed and will meet biodiversity
targets in a spatial configuration that avoids conflict with non-conservation
compatible land-use.
Project Deliverables linked to his Report
Map A: Biodiversity priority map(s) for Kannaland and Oudtshoorn Municipality and
for Eden District Municipal Areas;
Land and resource use guidelines linked to the biodiversity features displayed in
Map A;
Management recommendations for priority ecosystems identified in Map ;
Development of map A must conform closely to the methodology & work-plan
developed in phase I of the project;
A detailed report documenting the methodology and techniques used;
The report is accompanied by an electronic archive of the spatial data used in this
study. Key spatial information layers (protected areas, vegetation types and critical
biodiversity areas) will be available on SANBI‟s BGIS web site (http://bgis.sanbi.org).

Kannaland, Oudtshoorn and DMA04 Biodiversity Assessment – Final Report August 2010 1
1 Introduction and Summary
The Kannaland Municipality, Oudtshoorn Municipality, and Eden District Management Area
together make up the bulk of what is known as the Little Karoo Region. Although the Fynbos
Biome is well represented in the mountainous areas of the region it is the prominence of the
Succulent Karoo Biome that makes the region unique in the Western Cape Province.
Kannaland Municipality, Oudtshoorn Municipality, and Eden District Management Area have
benefited from the ground breaking conservation planning projects that focused on the CFR in
2000 (CAPE 2000), and more recent CEPF and World Bank funded biodiversity planning
focussed on the Gouritz Corridor and Little Karoo Region. However, a fine scale or medium
scale Critical Biodiversity Area (CBA) map has to date not been produced.
In an attempt to fill this gap in biodiversity planning the Department of Environmental Affairs
and Development Planning (DEADP) in conjunction with the Eden District Municipality
commissioned this biodiversity assessment of the Kannaland Municipality, Oudtshoorn
Municipality, and Eden District Management Area to inform Spatial Development Frameworks
(SDFs), Biodiversity Sector plans, Environmental Management Frameworks (EMFs), Strategic
Environmental Assessments (SEAs) and the Environmental Impact Assessment (EIA) process. This
biodiversity assessment, through the development of a critical biodiversity area (CBA) map for
the district, is aimed at assisting biodiversity and land use managers and decision makers in this
demanding task. This report summarizes the results of the biodiversity assessment conducted.
Details of the analyses performed are contained in the appendices.
Biodiversity data: The habitat map developed by Vlok et al. (2005) was used in this assessment. In total 235
habitat types were delineated in the planning domain;
Expert mapping available for the region included the areas of special botanical interest
collected in the Leslie Hill Succulent Karoo Project, and ecological process related corridors
from the Gouritz Initiative;
Areas of special biodiversity interest were obtained from various sources including Cape
Nature, CREW, Little Karoo Study Group and Gouritz Initiative;
Priority conservation areas and critical biodiversity areas identified by other projects were
incorporated into the analysis where possible. All CBA outputs from this study were aligned
with outputs from adjoining studies to aid in implementation;
Existing aquatic biodiversity data from NFEPA and other sources was combined for the
analysis; and
Additional process related features were modeled from the landscape, describing areas
likely to be important in terms of climate change adaptation and connectivity.
Land cover data: This project developed a simplified land cover based on existing land cover maps for the
region developed by Kirkwood et al. (2010) and Thompson et al. (2005); and
According to the model, the majority of the district is still natural vegetation (76%), while 10%
is transformed by cultivation, mining, dams and urbanization, and 14 % can be considered
degraded.
Ecosystem status and threats: Agriculture and urbanization are likely to be the principal drivers of biodiversity loss in the
district, at present about 23% of the district‟s ecosystems are transformed or degraded. No
information on agricultural developments and urban development was obtained; and
Due to the high levels of transformation and degradation in specific areas of the planning
domain 12 habitat types are Critically Endangered, 13 are Endangered and 19 are
Vulnerable.
Protected area network:

Kannaland, Oudtshoorn and DMA04 Biodiversity Assessment – Final Report August 2010 2
At present 19% of the planning domain is in formal Protected Areas. Approximately a third
of the regions 235 vegetation types do not occur within any protected area, and a third are
fully protected. The lowland and succulent Karoo habitat types in particular are poorly
conserved compared to the Fynbos habitats. Cape Nature‟s Biodiversity stewardship
Programme is active in the region with 12,459 Ha of private land under some form of legal
conservation stewardship agreement.
Critical biodiversity areas: The biodiversity assessment for the Kannaland and Oudtshoorn Local Municipalities, and
Eden District Management Area is designed to identify an efficient set of Critical Biodiversity
Areas ( and Ecological Support Areas) that meet the targets for the underlying biodiversity
features in as small an area as possible and in areas with least conflict with other activities.
Of fundamental importance is that these areas are identified in a configuration that
deliberately facilitates the functioning of ecological processes (both currently and in the
face of climate change) which are required to ensure that the biodiversity features persist in
the long term;
A critical biodiversity area (CBA) map has been developed for the planning domain.
This CBA map is intended to act as the biodiversity sector‟s input into multi-sectoral plans
and assessments (e.g. SDF, EMF EIA, IDP, etc.);
The CBA map product is aligned with national standards for bioregional plans in terms of
terminology and methods;
The CBA map should be integrated into the Eden district SDF, and the Kannaland and
Oudtshoorn Local SDFs; and
Land use guidelines have been developed for each CBA category and aligned with land
use categories commonly used in SDFs.
Data availability: All maps, report and data will be made available on SANBI‟s Biodiversity GIS web site
(http://bgis.sanbi.org).

Kannaland, Oudtshoorn and DMA04 Biodiversity Assessment – Final Report August 2010 3
2 Biodiversity Information
2.1 Background A biodiversity dataset must meet several criteria if it is to be used in a spatial analysis such as this
assessment. The data must be:
In an electronic format (e.g. spreadsheet or GIS database);
Spatial (e.g. point, line or polygon coverage);
At an appropriate spatial resolution to be compatible with the scale at which the assessment is
being conducted; and
Accessible to the people conducting the analyses
Region-wide biodiversity assessment and planning projects always face the problem of lack of
suitable biodiversity data that is (a) geo-referenced; (b) is of relevant spatial resolution such as
point locality data; and (c) that covers the majority of the planning domain.
The Kannaland Municipality, Oudtshoorn Municipality, and Eden District Management Area do not
have an operational biodiversity information management system (BIMS). There are, however, quite
few high quality spatial biodiversity datasets that partially or completely cover the region. These
range from Vlok et al.‟s (2005) excellent habitat map, to recent analyses by the Little Karoo study
Group (Gallo et al. 2010), all of which are discussed in detail below.
Some new biodiversity process surrogate datasets were generated during the course of this project
through spatial modelling, basic expert mapping, as well as integration of existing spatial
information on habitat types, wetlands and pans, rivers and catchments.
The land cover for the region and selected sensitive viewsheds are also discussed here. Whilst these
are not biodiversity datasets land cover is a key information layer in the biodiversity assessment
process, and sensitive viewsheds are included to align outcomes with areas important for tourism as
an ecological service.
2.2 Biodiversity Features The Little Karoo region, in which the Kannaland Municipality, Oudtshoorn Municipality, and Eden
District Management Area fall, has some excellent biodiversity planning layers developed over the
last few years. In addition to utilising these layers, incorporating expert knowledge into systematic
conservation assessment is also an essential part of the conservation assessment and planning
process that is widely used in South Africa. It can serve a number of important functions; the
process serves as a cross reference to the predominantly data driven, mathematical/mechanistic
process of irreplaceability analysis; it promotes confidence and credibility in the use of the
information system; it can provide a rapidly gathered source of biodiversity information especially
where no other electronic spatial biodiversity databases exist.
2.2.1 Habitat Types
The conservation planning process made use of the finescale vegetation map produced
by Jan Vlok (Vlok et al. 2005). This high quality vegetation map is based on a combination of
extensive field surveys during 2004, the subdivision of landscape into topo-geomorphic units
hand drawn on 1:50 000 LandSat images and additional remote sensing interpretation. A
hierarchical classification system was used with vegetation units, nested within habitats which
are nested within biomes. In transformed areas, the pre-transformation vegetation was
estimated and mapped based on surrounding vegetation and remaining patches. 235
vegetation types are found within the Kannaland and Oudtshoorn Local Municipalities, and
Eden District Management Area (Uniondale) of the Little Karoo.
Targets were based on those defined for the Little Karoo study region using a systematic
approach (Vlok & Reyers Unpublished). Each target was derived using the slope of the species-
area curve (Desmet & Cowling 2004). This benefited habitats with greater species heterogeneity.
Kannaland, Oudtshoorn and DMA04 Biodiversity Assessment – Final Report August 2010 4
The percentage of species targeted for conservation was set at 75%. The targets were rescaled
so that the target range was 16-34% as per the national standard.
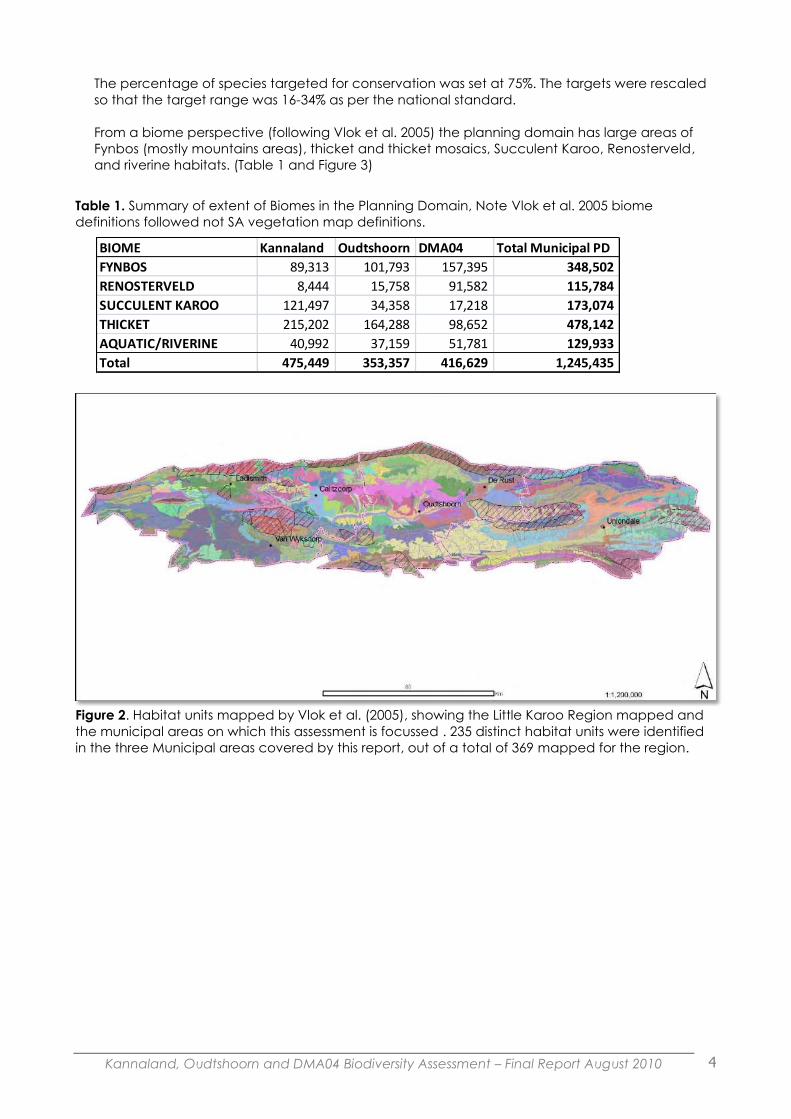
From a biome perspective (following Vlok et al. 2005) the planning domain has large areas of
Fynbos (mostly mountains areas), thicket and thicket mosaics, Succulent Karoo, Renosterveld,
and riverine habitats. (Table 1 and Figure 3)
Table 1. Summary of extent of Biomes in the Planning Domain, Note Vlok et al. 2005 biome
definitions followed not SA vegetation map definitions.
Figure 2. Habitat units mapped by Vlok et al. (2005), showing the Little Karoo Region mapped and
the municipal areas on which this assessment is focussed . 235 distinct habitat units were identified
in the three Municipal areas covered by this report, out of a total of 369 mapped for the region.
BIOME Kannaland Oudtshoorn DMA04 Total Municipal PD
FYNBOS 89,313 101,793 157,395 348,502
RENOSTERVELD 8,444 15,758 91,582 115,784
SUCCULENT KAROO 121,497 34,358 17,218 173,074
THICKET 215,202 164,288 98,652 478,142
AQUATIC/RIVERINE 40,992 37,159 51,781 129,933
Total 475,449 353,357 416,629 1,245,435

Kannaland, Oudtshoorn and DMA04 Biodiversity Assessment – Final Report August 2010 5
Figure 3. Biomes represented in the planning domain following Vlok et al. (2005) classification.
2.2.2 Nationally Listed Threatened Ecosystems
Vegetation types that will be listed as threatened under NEMBA were obtained from SANBI. The
boundaries of these units are based on the National Vegetation Map (Figure 4).
Figure 4. Seven NEMBA listed threatened ecosystems found in the planning domain. Based on the
South African National Vegetation Map (Mucina and Rutherford, 2006).
2.2.3 Priorities identified in other conservation assessments within, or
overlapping into, the planning domain
Priorities and CBA‟s identified in plans that covered all or part of the planning domain were
incorporated where appropriate (Figure 3); these included the following products: Leslie Hill
Succulent Karoo Priorities (Desmet 2006); John Gallo‟s Succulent Karoo priority reserve and
stewardship areas tool (Gallo et al. 2010); Garden Route Initiative (Holness et al. 2010, Vromans
et al. 2010) Eastern Cape Biodiversity Conservation Plan (Berliner and Desmet 2008); STEP
(Cowling et al. 2003) and SKEP (Driver et al. 2003) priorities (Figure 5).

Kannaland, Oudtshoorn and DMA04 Biodiversity Assessment – Final Report August 2010 6
2.2.4 Existing data on species and biodiversity features
Existing spatial information on biodiversity “hot spots” and threatened species was included in
the analysis, including (Figure 5): Expert plant areas based on expert consultations from Leslie Hill
Succulent Karoo Project (Desmet 2006); Quartz patches and Forest Patches mapped by experts
for Cape Nature (Kirkwood pers com); CREW and Cape Nature Database of Critically
endangered, endangered and vulnerable plant species (Kirkwood pers com)(Figure 6).
Figure 5. Priorities areas identified by other conservation assessments
Figure 6. Biodiversity rich areas and threatened species distributions identified by other projects
2.2.5 Aquatic Features
2.2.5.1 Priority Rivers and Catchments
Outputs of the National Freshwater Ecosystem Priority Area assessment (NFEPA) which is currently
being completed (Nel et al. in prep) were incorporated. This project identifies the most important
rivers, river catchment and wetlands for meeting freshwater biodiversity targets and conserving
ecological processes.

Kannaland, Oudtshoorn and DMA04 Biodiversity Assessment – Final Report August 2010 7
The project identified Freshwater Ecosystem Priority Areas (FEPAs) which are the freshwater
equivalent of a Critical Biodiversity Area, and Freshwater Ecosystem Support Areas (FESAs) which
are the freshwater equivalent of Ecological Support Areas. These are identified at a national scale
and require some finescaling before they can be incorporated into a Critical Biodiversity Area
map.
2.2.5.2 Wetlands and Pans
The sensitive wetland layer compiled by Cape Nature (Shaw 2007) was combined with NFEPA
wetland layer (Nel et al. in prep) was used as the basis for analysis. To address ecological status or
health of the wetlands. We applied the technique described by Amis (2009) in which the level of
terrestrial transformation/degradation immediately surrounding a wetland was used as a proxy of
wetland health. Each wetland feature was buffered by 500m and the percentage transformation
and degradation in each of the buffered areas was calculated. Wetlands with low levels of
transformation in their buffer zone are assumed to be in a better ecological state that wetlands
with high levels of transformation. This ecological state analysis was used to categorize wetlands
into critical and important wetlands for the CBA map. Wetlands that are in a better ecological
state are priorities for conservation and land use management (Figure 7).
2.2.5.3 Additional Rivers
From a process perspective, it is not just the nationally selected rivers which are important. A river
buffer layer developed by Don Kirkwood which buffered the larger (above 2nd order) 1:50 000
rivers by 100m and the smaller rivers by 30m was included as a compulsory part of the Ecological
Support Area layer in the second conservation run.
Figure 7. Aquatic features used in the assessment included sensitive wetlands and pans, based on
Cape Nature (Shaw 2007) and NFPA wetlands (Nel et al. in prep); priority sub-quaternary river
catchments and river reaches , based on NFPA data, where FEPA are priority areas and FESA are
support areas (Nel et al. in prep); additional order 2 and above rivers buffered by 100m.
2.3 Ecological Process New ecological process layers were developed for the planning domain based on methodologies
applied in the National Protected Areas Assessment but applied at a finer scale. These include
identification of optimal ecological corridors and the identification of areas likely to provide climate
change resilience (Figure 8). Specific areas that were identified include:

Kannaland, Oudtshoorn and DMA04 Biodiversity Assessment – Final Report August 2010 8
2.3.1 Connectivity
High priority areas in unfragmented landscapes were identified to enhance landscape
connectivity. The National Protected Areas Expansion Conservation Assessment (Holness 2008)
identified high priority unfragmented areas that if protected would contribute most to meeting
national terrestrial and freshwater conservation targets. The areas identified are all over 5000ha in
size. Every attempt should be made to avoid an activity that results in the fragmentation of these
areas. River corridors represent important linkages across the landscape, particularly in arid and
poorly differentiated habitats. In addition to the other river and aquatic features included in the
plan, it was important to ensure that all major riparian corridor areas were included to ensure that
the linkages important for climate change adaptation were protected.
2.3.2 Areas of potential importance in climate change adaptation
Climate change resilience areas: Modelled approaches were used to identify areas of potential
importance for promoting climate change resilience in the landscape (Figure 8). These modelled
layers include:
Kloofs, which provide important connectivity and provide both temperature and moisture
refuges;
South facing slopes, which similar to kloofs provide refuge habitats;
Topographically diverse areas, which contain important altitudinal and climatic gradients
which are important for climate change adaptation as well as ensuring a range of micro-
climates are protected; and
Riverine corridors, which provide important connectivity in extensive arid environments,
were identified.
Details on the modelling of these features can be found in Appendix 1.
Figure 8. Features representing ecological processes, landscape connectivity and climate
change adaptation.
2.3.3 Existing corridors from Gouritz Initiative
The Gouritz Initiative developed a set of priority process areas to support long term ecological
processes in the region. These identified areas included the STEP Megaconservancy Network,
identified mountain corridors and the core Gouritz north-south corridor. These identified areas
included the STEP Megaconservancy Network, identified mountain corridors, quartz patches,
connectivity areas important for nectavores, and the core Gouritz north-south corridor. These
components of the Gouritz plan were trimmed to their remaining natural extent and were included
into the MARXAN run with a 60% target (Lombard et al. 2004)(Figure 9).

Kannaland, Oudtshoorn and DMA04 Biodiversity Assessment – Final Report August 2010 9
Figure 9. Biodiversity Corridors Developed for the Gouritz Region by Lombard et al. 2004.
2.4 Alignment with adjacent conservation plans Corridors are worthless if the don‟t go anywhere. Fortunately, conservation plans have been
undertaken for almost all the areas surrounding the Little Karoo (Figure 10). Priority corridors and
adjacent CBA areas were collated from the adjacent 6 systematic conservation plans:
• Central Karoo District FSBP (Skowno et al. 2009);
• Winelands DMA FSBP (Skowno et al. 2009);
• Hessequa FSBP (Pence et al. 2010);
• Mosselbay FSBP (Pence et al. 2010);
• Garden Route Initiative Critical Biodiversity Areas (Holness et al. 2010); and
• East Cape Province (Berliner and Desmet 2008)
Figure 10. Critical Biodiversity Areas identified by other recent projects adjacent to the planning
domain; including the Central Karoo District, Eastern Cape Provincial Plan, CAPE Fine Scale plans
for Hessequa and Mossel Bay, and Garden Route Initiative.

Kannaland, Oudtshoorn and DMA04 Biodiversity Assessment – Final Report August 2010 10
2.5 Land Cover Land cover is one of the most important information layers used in a conservation assessment. As
transformed areas are generally considered to have very little biodiversity value, a land cover map
tells us how much biodiversity is left and where this is located. There is generally a good inverse
relationship between levels of transformation in a landscape and biodiversity intactness (e.g.
Scholes and Biggs, 2005). In the absence of any actual biodiversity data we can still make
inferences about the state of the natural environment based purely on the land cover. The
ecosystem status index for South African vegetation types is such an index. Therefore an up-to-date
representation of current land-cover is of key importance to the conservation and planning
fraternity in the district, who require a detailed land cover map to help inform decisions on land
use. Ultimately this layer is critical in developing a strategy for the conservation of biodiversity in the
district (Figure 11).
This project developed a simplified land cover based on a land cover map put together by
Kirkwood et al. (2010) as part of the Western Cape Biodiversity Framework (which in turn was based
on Thompson et al. 2005). The land cover used in the analyses includes the Chief Directorate
Surveys and Mapping 1:50 000 series roads, railways and built up areas buffered by 10-200m; the
Western Cape fields layer developed by Geo Terra Image for National Department of Agriculture
(based on the SPOT5 2006 series) (Table 2).
Land cover statistics with respect to the area of the target municipalities occupied by the different
land classes are summarized in Table 1. Just over 10% of the planning area has been transformed
from natural ecosystems to other land uses, and just over 14% has been severely degraded (Table
3).
Table 2: The area covered by level one and level 2 land classes in the Kannaland and Oudtshoorn
Local Municipalities, and Eden District Management Area.
Table 3: The percentage coverage of level one land classes in the Kannaland and Oudtshoorn
Local Municipalities, and Eden District Management Area.
Landcover (Hectares) Kannaland Oudtshoorn DMA04 Total Municipal PD
Level 1 Level 2
Natural 380,884 251,232 320,205 952,320
Natural Natural 118,886 133,629 217,416 469,931
Natural Near Natural - AIP 18,199 17,882 11,028 47,108
Natural Near Natural - Mod Degr 243,798 99,721 91,761 435,280
Natural Unknown - - 0 0
No Natural 21,795 41,092 57,925 120,812
No Natural No Natural Agric 17,279 34,962 53,584 105,826
No Natural No Natural Dam 775 1,261 934 2,970
No Natural No Natural Urban 668 2,010 368 3,045
No Natural No Natural - Other 3,074 2,859 3,039 8,972
Degraded 72,770 61,033 38,499 172,302
Grand Total 475,449 353,357 416,629 1,245,435
Land Cover (%) Kannaland Oudtshoorn DMA04 Total Municipal PD
Natural 80 71 77 76
No Natural 5 12 14 10
Degraded 15 17 9 14
Grand Total 100 100 100 100

Kannaland, Oudtshoorn and DMA04 Biodiversity Assessment – Final Report August 2010 11
Figure 11. Land cover map of the Kannaland Municipality, Oudtshoorn Municipality, and Eden District Management Area. No natural (Transformed)
class includes, cultivation, mining, rural and urban development, high density alien, plantations, roads and railways. Degradation class includes
severely degraded areas mapped by Thompson et al. (2005).

Kannaland, Oudtshoorn and DMA04 Biodiversity Assessment – Final Report August 2010 12
2.6 Terrestrial Ecosystem Status Ecosystem status classification refers to the likelihood of an ecosystem, in this case defined as a
vegetation type, persisting into the future given the current amount of that ecosystem that has
already been transformed to other land uses
SANBI has developed a classification system that uses a suite of biodiversity loss indicators or criteria
to assign national ecosystem status to South African vegetation types. For the district level
classification for the Central Karoo District only criterion A (Table 5) was used to determine
ecosystem status of vegetation types. For criteria B to F the district level analyses have not been
done yet.
The ecosystem status and protection level calculations presented here differ from the national
assessment in three key areas. Firstly, the calculations consider only the extent of a vegetation type
that occurs within the Little Karoo region (defined by Vlok et al. 2005 - refer to Appendix 8.1 for
details) and not the national extent of a vegetation type. From a municipal environmental
management perspective the focus is on the state of biodiversity within the three municipal areas
and not in neighbouring municipalities. Secondly, this assessment calculates ecosystem status using
transformation and severe degradation combined (Figure 12). Finally, smaller vegetation units,
specifically mapped in the region are used in this analysis not the SA vegetation units. This gives a
better picture of where ecosystems are threatened as it includes areas that are in the process of
undergoing transformation. Degradation here includes only severe degradation such as soil erosion
and reduction in cover but does not include components of degradation such as species shifts due
to overgrazing, alien species or bush encroachment (Thompson et al. 2005).
Due to the high levels of transformation and degradation in the planning domain 12 habitat types
are Critically Endangered, 13 are Endangered and 19 are Vulnerable. A total of 235 habitat types
are described in the Municipal planning area by Vlok et al. (2005).
Note: The vegetation map produced by Vlok et al. (2005) covers a larger area than the municipal
planning domain used in this report (see point 8.1 in Appendix 1). The larger Little Karoo Planning
Domain includes 371 vegetation Units compared to the 235 habitat units in the smaller Municipal
Planning Domain on which this report is focussed. However, all ecosystem status calculations and
protection level calculations were based on the larger Little Karoo PD. This is standard practise in
biodiversity assessment s and ensures that the entire extent of each habitat unit is considered in the
calculation of Ecosystem statistics (Table 4) (Appendix 1).
Table 4. Summary table of number of vegetation types found in each Ecosystem Status Class
Municipality Kannaland Oudtshoorn DMA04 Total Municipal PD
Ecosystem status
(# Vegetation units)
Critically Endangered 8 6 4 12
Endangered 10 6 2 13
Vulnerable 11 9 6 19
Least Threatened 125 62 51 191
Total Number 154 83 63 235

Kannaland, Oudtshoorn and DMA04 Biodiversity Assessment – Final Report August 2010 13
Table 5: Criteria used to identify threatened terrestrial ecosystems, with thresholds for critically
endangered (CR), endangered (EN) and vulnerable (VU) ecosystems (SANBI 2008).
Criterion CR EN VU
A1: Irreversible loss of natural
habitat
Remaining natural
habitat ≤
biodiversity target
Remaining natural
habitat ≤
(biodiversity target +
15%)
Remaining natural
habitat ≤ 60% of
original area of
ecosystem
A2: Ecosystem degradation
and loss of integrity*
≥ 60% of ecosystem
significantly
degraded
≥ 40% of ecosystem
significantly
degraded
≥ 20% of ecosystem
significantly
degraded
B: Rate of loss of natural
habitat**
C: Limited extent and
imminent threat*
-- Ecosystem extent ≤ 3
000ha, and imminent
threat
Ecosystem extent ≤ 6
000ha, and
imminent threat
D1: Threatened plant species
associations
≥ 80 threatened
Red Data List plant
species
≥ 60 threatened Red
Data List plant
species
≥ 40 threatened Red
Data List plant
species
D2: Threatened animal species
associations**
E: Priority areas for meeting
explicit biodiversity targets as
defined in a systematic
biodiversity plan
Very high
irreplaceability and
high threat
Very high
irreplaceability and
medium threat
Very high
irreplaceability and
low threat
F: Fragmentation** * Because of data constraints, Criteria A2 and C have been applied to forests but not to other vegetation
types. ** Because of data constraints, Criteria B and D2 are dormant at this stage and thresholds have not
been set for these criteria. Further testing of Criterion F is needed to determine whether it is a workable criterion
for terrestrial ecosystems.

Kannaland, Oudtshoorn and DMA04 Biodiversity Assessment – Final Report August 2010 14
Figure 12: Terrestrial ecosystem status (transformation and degradation combined). Due to the high levels of transformation and degradation 12 habitat types
are Critically Endangered, 13 are Endangered and 19 are Vulnerable. A total of 235 habitat types are described in the planning are by Vlok et al. 2005.

Kannaland, Oudtshoorn and DMA04 Biodiversity Assessment – Final Report August 2010 15
3 Protected Area Network GAP Analysis Protected areas (PAs) are the primary strategy for ensuring that a representative portion of the
regions biodiversity is conserved as a benchmark for the benefit of current and future generations.
Whilst the long term persistence of biodiversity will require the management of biodiversity both in
PAs and in the surrounding matrix of production landscapes, there are clear national guidelines as
to the proportion of the district‟s surface area that should be under some form of formal
conservation management. Comparing the proportion of the regions biodiversity represented and
targets achieved in the existing PA network to what is recommended in the national guidelines
provides a quantitative measure of the conservation effectiveness of the provincial PA network. This
also gives an indication of the amount of work still required to reach the goal of a fully
representative PA network .
The National Environmental Management: Protected Areas Act (57 of 2003) defines a „protected
area‟ (PA) as one of the following types: Special Nature Reserves; National Parks; Nature Reserves;
Protected Environments; World Heritage Sites; Marine Protected Areas; Specially Protected Forest
Areas; and Mountain catchment areas. Collectively, the formal terrestrial and marine protected
areas comprise the National Protected Area System (National PAS).
The protected area (PA) layer for the planning domain was based on that used in the National
Protected Areas Expansion Strategy (NPAES). To this layer we added the official Biodiversity
Stewardship sites for the region (supplied by CAPE NATURE , A. Vlok pers com) as Formal Pas.
Informal private conservation areas identified by Pasquini (2007) were added as Informal CAs in the
Protected areas context map only and were not considered as CAs in the analysis (Figure 13).
Only Formal Protected Areas and contracted Cape Nature Stewardship sites were considered as
Formal Protected Areas in the analysis. These sites are assumed to contribute to meeting
biodiversity targets, and as such are “hard wired” into the CBA Model as PAs. Informal sites are not
assumed to contribute to meeting biodiversity targets as there is no guarantee in the long term that
the biodiversity contained in them will be conserved.
Protected Areas (as recognized in the PA act):
Special Nature Reserves;
National Parks;
Provincial Nature Reserves;
Protected Environments;
Contract Nature Reserves; and
Also includes are: World Heritage Sites, Marine Protected Areas, Marine
Conservation Areas, specially protected forests.
Conservation Areas (CAs) non-statutory protected areas not recognized in the PA act:
Biodiversity agreements; and
Conservancies.
Note that this classification does not take into account PA management effectiveness. This
classification relates solely to the legal status of PAs with regards the PA Act.
Kannaland, Oudtshoorn and DMA04 Biodiversity Assessment – Final Report August 2010 16
Table 6: Summary table of protected areas in the Kannaland Municipality, Oudtshoorn Municipality
and Eden District Management Area.
A small portion of one national park (Garden Route National Park), ten Western Cape Provincial
Reserves, one Eastern Cape Provincial Reserve, four Mountain Catchment Areas, seven Cape
Nature biodiversity stewardship sites and numerous private conservation areas are represented in
the planning domain (provincial reserves, national parks, mountain catchment areas and
contracted biodiversity stewardship sites were considered Formal PAs in protection status
calculations, private reserves are classed as informal CAs) (Figure 13).
Protected Areas cover 30.4% of the planning domain with 229,4961ha (18.4%) being formal
protected areas and 149,103ha (12%) comprising conservation areas.
Protected Areas (Ha) v2 Kannaland Oudtshoorn DMA04 Total Municipal PD
Level 1 Level 2
Formal 91,155 69,874 68,468 229,496
National Park 4,383 4,383
Provincial Nature Reserve 17,195 7,553 16,068 40,816
State Forest Nature Reserve 25,666 41,175 21,993 88,834
Wilderness Area 6,132 6,132
Local Authority Nature Reserve 2,770 240 114 3,124
Mountain Catchment Area 34,175 14,774 24,799 73,749
CN Stewardship Site 11,348 1,110 12,459
Informal 82,137 36,215 30,752 149,103
Private Nature Reserve (NPAES) 10,882 1,236 3,137 15,255
Pasquini Private Cons Sites 71,255 34,978 27,615 133,848 Grand Total 173,292 106,088 99,219 378,599

Kannaland, Oudtshoorn and DMA04 Biodiversity Assessment – Final Report August 2010 17
Figure 13: Protected areas in the Kannaland Municipality, Oudtshoorn Municipality and Eden District Management Area. A small portion of
the Garden Route National Park is represented, ten Western Cape Provincial Reserves, one Eastern Cape Provincial Reserve and four
Mountain Catchment Areas. Seven Cape Nature biodiversity stewardship sites and numerous private conservation areas. (provincial reserves,
national parks, mountain catchment areas and contracted biodiversity stewardship sites were considered formal PAs in protection status
calculations, private reserves are classed as informal CAs).
Kannaland, Oudtshoorn and DMA04 Biodiversity Assessment – Final Report August 2010 18
3.1 Protection Level and Urgency Protection level is the measurement of how well the existing protected area network conserves the
biodiversity of the district. It is calculated as the percentage biodiversity target achieved by the
protected area network for each vegetation type. Protection urgency is based on irreplaceability
of the remaining unfragmented areas of that vegetation type that are available to meet PA
targets. To do these calculations the vegetation layer for the district was unioned with the
protected areas layers and the proportion of each vegetation type within PAs was summarized
(Table 7, Figures 14 & 15).
Considering Formal Protected Areas only:
89 vegetation types have their targets achieved in the PA network;
27 vegetation type is partially protected, 10 vegetation types are very poorly protected, and 17
are poorly protected; and
92 vegetation types are not represented within the PA network at all.
In summary:
The Protected Areas network covers the Fynbos biome component of the planning very well,
and is under representative of the lowland and succulent Karoo components; and
Conservancies play a vital role in the PA network and the biodiversity stewardship approach of
Cape Nature.
Table 7: Summary table of Habitat Protection Levels and Habitat Protection Urgency
Municipality Kannaland Oudtshoorn DMA04 Total Municipal PD
Protection level
(# Vegetation units)
Completely Unprotected 65 26 19 92
Very Poorly Protected 5 7 5 10
Poorly Protected 7 8 9 17
Partially Protected 18 10 4 27
PA Targets Met 59 32 26 89
Protection urgency
(# Vegetation units)
Critically Urgent 5 3 2 7
High Urgency 4 3 2 6
Medium Urgency 19 11 7 27
Low Urgency 67 34 26 106
Fully Protected 59 32 26 89
Total Number 154 83 63 235
Protection Level
categories Description
Completely unprotected No formal protection
Very poorly protected Under 5% of PA target met
Poorly protected 5% - under 25% of target met
Partially protected 25-under 100% of target met
Targets met Targets fully met
Protection Urgency
categories Description
Target met PA target met
Low urgency
0->25% of remaining unfragmented areas required to meet PA
targets
Medium urgency
25->50% of remaining unfragmented areas required to meet PA
targets
High urgency
50->100% of remaining unfragmented areas required to meet PA
targets
Critically urgent
Insufficient remaining unfragmented areas available to meet PA
targets
Kannaland, Oudtshoorn and DMA04 Biodiversity Assessment – Final Report August 2010 19
Figure 14. Habitat Protection Levels in the planning domain. A habitat is considered partially
protected if 25-100% of its target is met in protected areas; poorly protected if 5-25% of target met;
very poorly protected < 5% target met. If More than 100% of target is met in PA it is considered
protected (target met). If none of the habitat occurs in PA then it is considered completely
unprotected (Table 7).
Figure 15. Habitat Protection urgency in the planning domain. A habitat is considered critically
urgent if insufficient habitat remains to achieve its PA target.; high urgency if > 50% of remaining
habitat is required; moderate urgency if 25-50% of remaining habitat is required; low urgency if <
25% of remaining habitat is required to meet PA targets. (Table 7).

Kannaland, Oudtshoorn and DMA04 Biodiversity Assessment – Final Report August 2010 20
4 Retention and Restoration of Biodiversity Drivers of biodiversity loss can also be referred to as “threats to biodiversity” or simply a site‟s “cost”
or “vulnerability” in relation to identified threats.
Threats to biodiversity are defined here as human-induced or mediated activities that result in the
loss (transformation) or reduction (degradation) of biodiversity pattern and/or processes. The
impacts of threats may manifest as changes in biodiversity structure (e.g. landscape
fragmentation, over grazing, composition (e.g. species loss), or as changes in ecosystem
functioning (e.g. altered hydrology, reduced net primary productivity)
Agriculture and urbanisation are viewed as the direct agents of biodiversity loss and degradation.
The direct impacts on biodiversity due to competing land-uses result in (a) loss of habitat and
landscape fragmentation, and (b) degradation of the natural environment, but their impact could
be significantly mitigated if the institutions responsible for environmental and land-use planning and
management operated and applied the law effectively. Threats to biodiversity in the Little Karoo
were only superficially considered in this assessment. A comprehensive report on the perceptions of
biodiversity threat in the Namakwa District, based on a survey of karoo ecological and livestock
management experts was recently completed (Todd et al. 2009). This report (an extract from which
can be found in Box 1.) is potentially very useful to planners in the Little Karoo region as the land-
use and threats are similar.
Specific threats to biodiversity and potential drivers of biodiversity loss for the region are addressed
in a report entitled “Retention and restoration of the biodiversity of the Little Karoo” by Forsyth, Vlok
and Reyers (2008). Recommendations on wildlife stocking, ostrich farming, fire management and
veld restoration potential for the region are provided in the report. The report, maps and spatial
data is available from the Gouritz initiative web site (www.gouritz.com) and SANBI‟s BIS system
(http://bgis.sanbi.org) (Figure 16 & 17).
Figure 16. Map extracted from Forsyth et al. (2008) to illustrate the available tools for responsible
land management in the region; specifically the recommended stocking rates for Ostriches in the
various habitats of the region .

Kannaland, Oudtshoorn and DMA04 Biodiversity Assessment – Final Report August 2010 21
Figure 17. Map extracted from Forsyth et al. (2008) to illustrate the available tools for responsible
land management in the region; specifically the spekboom thicket restoration potential of habitats
in the region.
Ecosystem services The Ecosystem services of forage production and carbon storage are addressed in the Forsyth et al.
(2008) report, and a recent study has expanded this in the Little Karoo. Reyers et al. (2009) highlight
the impact of land use change on the following ecosystem services
forage production;
carbon storage;
water flow regulation;
erosion control ; and
tourism view sheds.
This biodiversity assessment, although not aimed at ecosystem services directly, addresses most of
these issues. The NFEPA catchment prioritisation (Nel et al. iIn prep) specifically aims to include
areas important for flow regulation and catchment recharge. Wetlands and riparian areas
highlighted in this assessment as CBA or ESA also specifically address water flow regulation.
Important tourism viewsheds identified by Reyers et al. (2009) have been included in this
assessment as a connectivity layer (Figure 18).
Figure 18. Important tourism view sheds identified in the region by Reyers et al.( 2009).
Kannaland, Oudtshoorn and DMA04 Biodiversity Assessment – Final Report August 2010 22
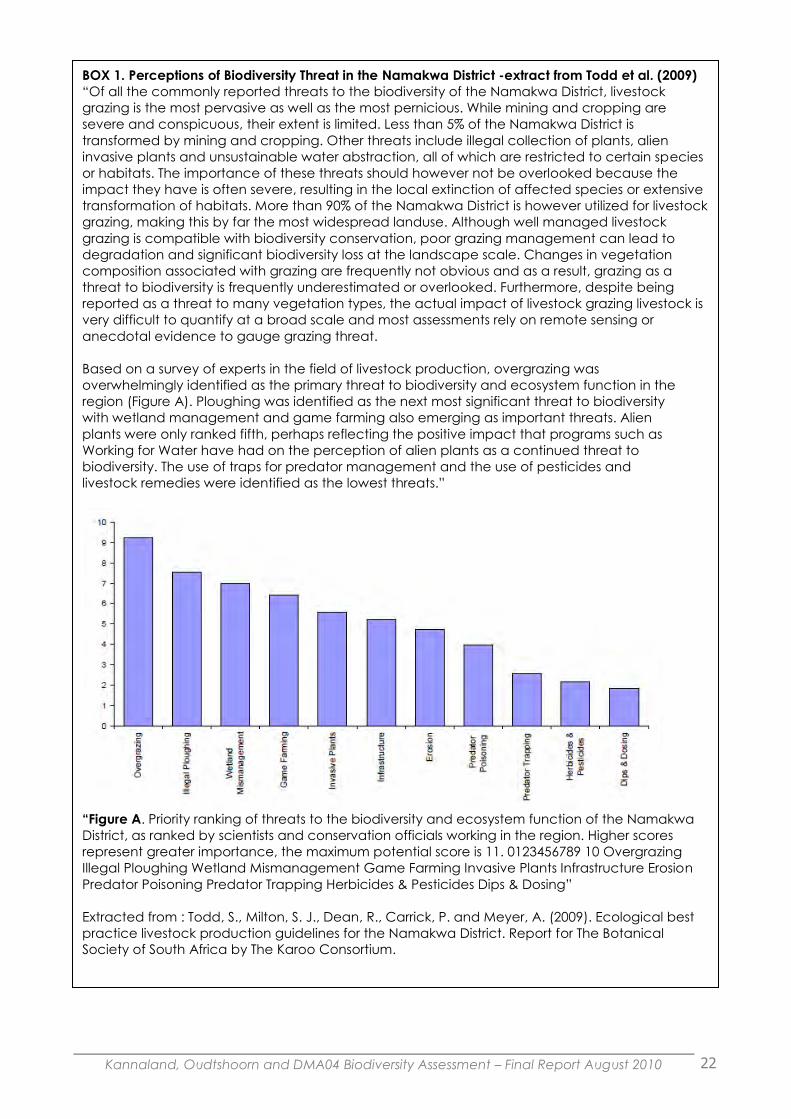
BOX 1. Perceptions of Biodiversity Threat in the Namakwa District -extract from Todd et al. (2009)
“Of all the commonly reported threats to the biodiversity of the Namakwa District, livestock
grazing is the most pervasive as well as the most pernicious. While mining and cropping are
severe and conspicuous, their extent is limited. Less than 5% of the Namakwa District is
transformed by mining and cropping. Other threats include illegal collection of plants, alien
invasive plants and unsustainable water abstraction, all of which are restricted to certain species
or habitats. The importance of these threats should however not be overlooked because the
impact they have is often severe, resulting in the local extinction of affected species or extensive
transformation of habitats. More than 90% of the Namakwa District is however utilized for livestock
grazing, making this by far the most widespread landuse. Although well managed livestock
grazing is compatible with biodiversity conservation, poor grazing management can lead to
degradation and significant biodiversity loss at the landscape scale. Changes in vegetation
composition associated with grazing are frequently not obvious and as a result, grazing as a
threat to biodiversity is frequently underestimated or overlooked. Furthermore, despite being
reported as a threat to many vegetation types, the actual impact of livestock grazing livestock is
very difficult to quantify at a broad scale and most assessments rely on remote sensing or
anecdotal evidence to gauge grazing threat.
Based on a survey of experts in the field of livestock production, overgrazing was
overwhelmingly identified as the primary threat to biodiversity and ecosystem function in the
region (Figure A). Ploughing was identified as the next most significant threat to biodiversity
with wetland management and game farming also emerging as important threats. Alien
plants were only ranked fifth, perhaps reflecting the positive impact that programs such as
Working for Water have had on the perception of alien plants as a continued threat to
biodiversity. The use of traps for predator management and the use of pesticides and
livestock remedies were identified as the lowest threats.”
“Figure A. Priority ranking of threats to the biodiversity and ecosystem function of the Namakwa
District, as ranked by scientists and conservation officials working in the region. Higher scores
represent greater importance, the maximum potential score is 11. 0123456789 10 Overgrazing
Illegal Ploughing Wetland Mismanagement Game Farming Invasive Plants Infrastructure Erosion
Predator Poisoning Predator Trapping Herbicides & Pesticides Dips & Dosing”
Extracted from : Todd, S., Milton, S. J., Dean, R., Carrick, P. and Meyer, A. (2009). Ecological best
practice livestock production guidelines for the Namakwa District. Report for The Botanical
Society of South Africa by The Karoo Consortium.
Kannaland, Oudtshoorn and DMA04 Biodiversity Assessment – Final Report August 2010 23
5 Critical Biodiversity Areas
5.1 What are CBAs? The Critical Biodiversity Areas (CBA) map aims to guide sustainable development by providing a
synthesis of biodiversity information to decision makers. It serves as the common reference for all
multi-sectoral planning procedures, advising which areas can be lost to development, and which
areas of critical biodiversity value and their support zones should be protected against any
impacts.
The CBA map indicates areas of land as well as aquatic features which must be safeguarded in
their natural state if biodiversity is to persist and ecosystems are to continue functioning. Land in this
category is referred to as a Critical Biodiversity Area. CBAs incorporate: (i) areas that need to be
safeguarded in order to meet national biodiversity thresholds (ii) areas required to ensure the
continued existence and functioning of species and ecosystems, including the delivery of
ecosystem services; and/or (iii) important locations for biodiversity features or rare species.
Ecological Support Areas (ESAs) are supporting zones required to prevent the degradation of
Critical Biodiversity Areas and Protected Areas. An ESA may be an ecological process area that
connects and therefore sustains Critical Biodiversity Areas or a terrestrial feature, e.g. the riparian
habitat surrounding and supporting aquatic Critical Biodiversity Areas.
Those areas of natural vegetation identified on the map as Other Natural Areas are sufficiently
extensive at this stage that they may withstand some loss through conversion of their natural state,
and undergo development. It is important to note that in the future, such areas will be increasingly
converted or impacted, and it is possible that they will eventually be reclassified as Critical
Biodiversity Areas. Therefore, in all decision making, the precautionary principle needs to be
applied.
The CBA map identifies areas that have been irreversibly transformed through development (e.g.
urban development, plantation, agriculture). These areas are referred to as No Natural Areas
Remaining. They no longer contribute to the biodiversity of the area. However, there are areas of
land (partially or wholly transformed or degraded land) that have been classified as ESAs or even
CBAs. Although these areas are heavily degraded or transformed, they still play an important role in
supporting ecological processes. This is particularly the case with riparian areas, some key
catchment areas and key pieces of corridors. No further intensification of land-use activities should
be permitted and they should be prioritized for rehabilitation, where possible.

Kannaland, Oudtshoorn and DMA04 Biodiversity Assessment – Final Report August 2010 24
5.2 Critical Biodiversity Areas Categories Criteria defining the CBA map categories are presented in Table 8. These criteria are closely linked
to those used in other plans such as the Garden Route Systematic Biodiversity Plan Report (Holness,
2009).
Table 8: Criteria used to define the CBA map categories (Figure 20) CBA MAP
CATEGORY CRITERIA DEFINING THE CATEGORY
Protected
Areas
Formal Protected Areas
a) Nature Reserves & National Parks (protected by the National Environment Management:
Protected Areas Act 57 of 2003);
b) Forest Nature Reserves (declared in terms of the National Forest Act 84 of 1998).
c) Mountain Catchment Areas (declared in terms of the Mountain Catchment Area Act 63
of 1970); and
d) World Heritage Sites (declared in terms of the World Heritage Convention Act 49 of
1999).
Critical
Biodiversity
Areas
1. Any terrestrial or aquatic area required to meet biodiversity pattern and/or process
thresholds:
a) Any area that is required for meeting pattern thresholds, namely:
Remaining areas of Critically Endangered vegetation types;
Special habitats (areas required to protect special species and habitats);
Listed Ecosystems in terms of the National Biodiversity Act (10 of 2004);
Remaining areas protected by the National Forest Act (84 of 1998); and
High priority river reaches.
b) Any area that is required for meeting process thresholds including:
Ecological corridors;
Areas important for climate change adaptation; and
Riparian corridors.
c) Hydrological process areas (wetlands, priority catchment areas).
d) All 'best design' sites (largest, most intact, least disturbed, connected and/or adjacent) in
terms of meeting pattern and process thresholds. 'Best design' refers to an identified network of
natural sites that meet pattern and process thresholds in all vegetation types in a spatially
efficient and ecologically robust way, and aim to avoid conflict with other activities (e.g.
economic activity) where it is possible to achieve biodiversity thresholds elsewhere.
Ecological
Support Area
Supporting zone required to prevent degradation of Critical Biodiversity Areas and Protected
Areas.
a) Areas required to prevent degradation of Critical Biodiversity Areas and formal Protected
Areas;
b) Remaining catchment and other process areas that are required to prevent degradation
of Critical Biodiversity Areas and formal Protected Areas; and
c) Areas that are already transformed or degraded, but which are currently or potentially still
important for supporting ecological processes e.g. transformed or alien plant infested
areas that have transformed or degraded the natural buffer area of a wetland or river.
These areas are a focus for rehabilitation rather than the intensification of land uses.
Other Natural
Areas
Natural areas not included in the above categories.
No Natural
Areas
Remaining
These areas include cultivated areas (intensive agriculture), afforested areas (plantation
forestry), mined areas, urban areas, infrastructure, dams and areas under coastal
development.
Source Reference: Holness, 2009
5.3 Planning approach The biodiversity assessment for the Kannaland Municipality, Oudtshoorn Municipality and Eden
District Management Area is designed to identify an efficient set of Critical Biodiversity Areas (and
Ecological Support Areas) that meet the targets for the underlying biodiversity features in as small
an area as possible and in areas with least conflict with other activities. Of fundamental
importance is that these areas are identified in a configuration that deliberately facilitates the

Kannaland, Oudtshoorn and DMA04 Biodiversity Assessment – Final Report August 2010 25
functioning of ecological processes (both currently and in the face of climate change) which are
required to ensure that the biodiversity features persist in the long term.
A two step optimization approach to systematic conservation planning was undertaken making
use of MARXAN. This approach has the advantage of allowing an efficient network to be identified
(i.e. one which uses the least possible space to achieve its targets and also minimizes cost to other
sectors) as well as to promote the identification of a network which is sensible from an ecological
point of view (the approach strongly favours connected and adjacent areas, and allows
preferential meeting of targets in priority catchments and areas important for climate change
resilience) (Figure 19). For details on the methods used refer to Appendix 1.
Figure 19. The outputs on the initial MARXAN runs were used to identify the highest priority network
of Critical Biodiversity Areas. These include both irreplaceable sites (i.e. areas where there is no
choice) as well as significant “best design” areas which are not the only options but represent an
efficient and ecologically coherent network of optimal sites.

Kannaland, Oudtshoorn and DMA04 Biodiversity Assessment – Final Report August 2010 26
Figure 20. Critical Biodiversity Areas in the Kannaland Municipality, Oudtshoorn Municipality and Eden District Management Area.

Kannaland, Oudtshoorn and DMA04 Biodiversity Assessment – Final Report August 2010 27
5.4 Description of CBA’s for the Kannaland Municipality,
Oudtshoorn Municipality and Eden District Management
Area
Table 9. Biodiversity criteria used to define Critical Biodiversity Areas (CBAs) in the Kannaland,
Oudtshoorn Municipalities and DMA04 (Figure 20).
Category
Name Description of
biodiversity features
used to define CBA
category
Shp File Name
Terrestrial
Features
Habitat map Base habitat map of
235 terrestrial habitats
mapped by Vlok et al.
(2005).
LK_Region_veg_Ecostat
us.shp
Special species CR EN and VU plant
locations from the
CREW and DK
datasets buffered by
250m
Combined_rares_1.shp
Nationally Listed
threatened
ecosystems
Remaining extent of
EN and VU vegetation
types listed under
NEMBA as threatened.
Threatened_veg_clippe
d_to_natural.shp
Leslie Hill Expert
areas
Identified expert
features from the
Succulent Karoo
assessment
undertaken for the
Leslie Hill Trust
Leslie_Hill_expert_areas_
1.shp
Quartz patches Quartz patches from
DK dataset
Quartz _1.shp
Forest Forest habitat from DK
dataset
Forest_1.shp
Aquatic
features
High priority river
reaches
Identified high priority
river catchments from
the NFEPA assessment
(Nel et al. In prep)
Rivers_1.shp
High priority
catchments
Identified high priority
river reaches from the
NFEPA assessment (Nel
et al. In prep)
Catch_1.shp
Sensitive
wetlands
Sensitive wetlands
from the Cape Nature
assessment and
NFEPA
Wetlands_notclipped_1.
shp
Riparian
corridors
Variable width
buffered corridors
along major rivers in
the Little Karoo.
All_Riparian_corridors_1.
shp
Climate
change and
connectivity
High priority
unfragmented
landscapes
High priority
unfragmented areas
identified within the
NPAES conservation
assessment. The study
identified the largest,
most intact areas for
High_priority_
unfragmented_
landscapes_1.shp

Kannaland, Oudtshoorn and DMA04 Biodiversity Assessment – Final Report August 2010 28
Category
Name Description of
biodiversity features
used to define CBA
category
Shp File Name
meeting national
pattern and process
targets.
High
topographic
variability
Areas of potential
climate change
resilience and climate
refuges based on a
multi-scale modelled
assessment of
landscapes of high
topographic diversity.
These areas also
include important
altitude gradients.
High_topo_variability_1.s
hp
Kloofs Modelled layer of
kloofs which are
important refuge
habitats
Kloofs_1.shp
Gouritz Corridors Climate Change
connectivity corridors
developed by
Lombard et al. 2004
for Gouritz Initiative
Gouritz_all_1.shp
South Facing
Slopes
Modelled layer of
south facing slopes
which represent areas
of climate change
resilience due to
probable lower
temperatures and
higher moisture levels.
Large_southernslopes_1.
shp
Related climate
change layers
and inputs
o Riparian
corridors (see
above)
o River reaches
(see above)
o Marxan
analysis which
favours areas
with high
variety of
habitats
Priorities
from other
conservatio
n plans
Priority areas
from SKEP
Identified high
irreplaceability priority
areas from the SKEP
assessment
StepSkep_1.shp
Priority areas
from STEP
Identified pattern and
process priority areas
from the STEP
assessment
StepSkep_1.shp
Succulent Karoo
priorities
(Desmet 2006)
Priority areas from the
Leslie Hill Succulent
Karoo assessment
Leslie_hill_1.shp
Succulent Karoo
Priorities (Gallo
Priority areas from the
Leslie Hill Succulent
Gallo _1.shp

Kannaland, Oudtshoorn and DMA04 Biodiversity Assessment – Final Report August 2010 29
Category
Name Description of
biodiversity features
used to define CBA
category
Shp File Name
et al. 2010) Karoo assessment by
Gallo et al. (2010)
East Cape
Priorities
Priority subcatchments
from the Eastern Cape
Biodiversity assessment
where these extend
into the Little Karoo
Ec_priorities_1.shp
Alignment
with
adjacent
conservatio
n plans
Corridor linkages
to adjacent
plans
Identified CBA areas in
the adjacent 6
conservation plans:
o Central Karoo
o Cape
Winelands
DMA
o Hessequa FSBP
o Mossel Bay
FSBP
o Garden Route
Initiative
o East Cape
Province BCP
LK_Region_ProtectedAr
eas.shp
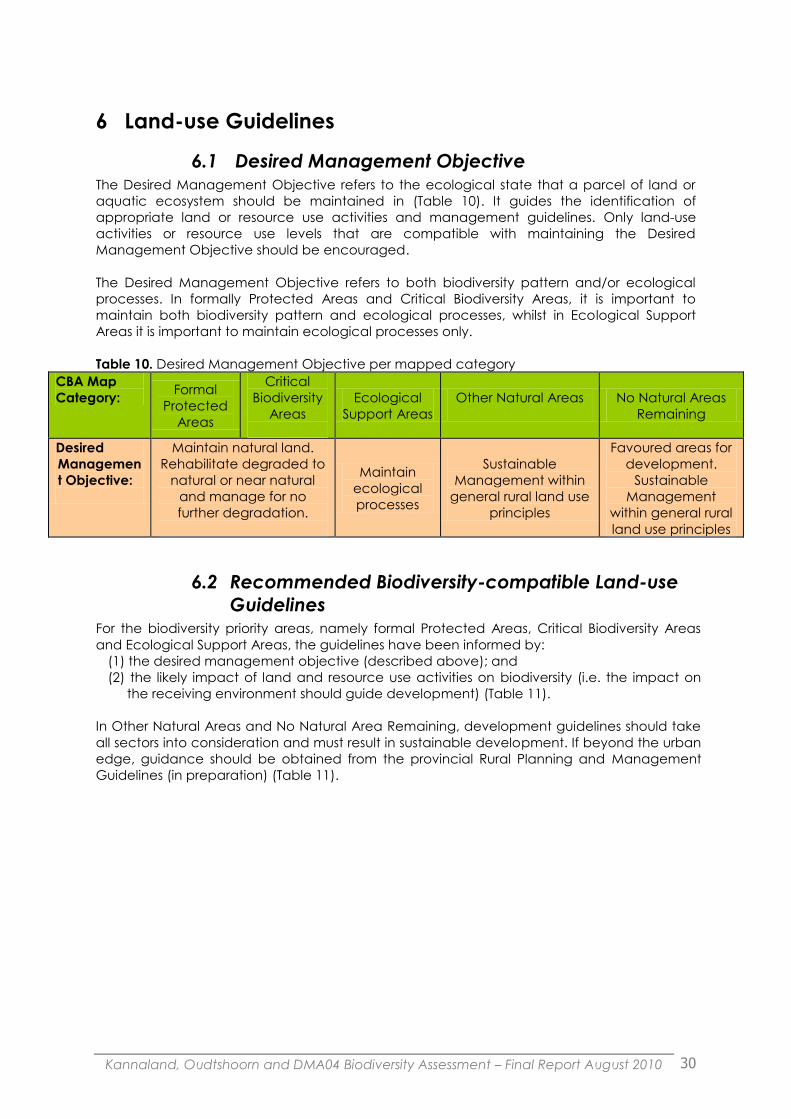
Kannaland, Oudtshoorn and DMA04 Biodiversity Assessment – Final Report August 2010 30
6 Land-use Guidelines
6.1 Desired Management Objective The Desired Management Objective refers to the ecological state that a parcel of land or
aquatic ecosystem should be maintained in (Table 10). It guides the identification of
appropriate land or resource use activities and management guidelines. Only land-use
activities or resource use levels that are compatible with maintaining the Desired
Management Objective should be encouraged.
The Desired Management Objective refers to both biodiversity pattern and/or ecological
processes. In formally Protected Areas and Critical Biodiversity Areas, it is important to
maintain both biodiversity pattern and ecological processes, whilst in Ecological Support
Areas it is important to maintain ecological processes only.
Table 10. Desired Management Objective per mapped category
CBA Map
Category: Formal
Protected
Areas
Critical
Biodiversity
Areas
Ecological
Support Areas
Other Natural Areas
No Natural Areas
Remaining
Desired
Managemen
t Objective:
Maintain natural land.
Rehabilitate degraded to
natural or near natural
and manage for no
further degradation.
Maintain
ecological
processes
Sustainable
Management within
general rural land use
principles
Favoured areas for
development.
Sustainable
Management
within general rural
land use principles
6.2 Recommended Biodiversity-compatible Land-use
Guidelines For the biodiversity priority areas, namely formal Protected Areas, Critical Biodiversity Areas
and Ecological Support Areas, the guidelines have been informed by:
(1) the desired management objective (described above); and
(2) the likely impact of land and resource use activities on biodiversity (i.e. the impact on
the receiving environment should guide development) (Table 11).
In Other Natural Areas and No Natural Area Remaining, development guidelines should take
all sectors into consideration and must result in sustainable development. If beyond the urban
edge, guidance should be obtained from the provincial Rural Planning and Management
Guidelines (in preparation) (Table 11).

Kannaland, Oudtshoorn and DMA04 Biodiversity Assessment – Final Report August 2010 31
Table 11. Recommended biodiversity-compatible land use guidelines matrix
KEY: Biodiversity sector land-use recommendations
Yes = Encouraged so long as conditions listed in the rural guidelines are adhered to.
No = Discouraged;
Restricted = Land-use possible so long as the overall desired management objective is maintained,
impacts on biodiversity are mitigated where possible, and conditions listed in the rural guidelines are
adhered to. CBA MAP CATEGORY: →
Formal Protected
Areas
Critical Biodiversity
Areas
Ecological
Support Areas
Other Natural
Areas
No Natural Areas
Remaining
DESIRED MANAGEMENT OBJECTIVE: →
Maintain natural
land. Rehabilitate
degraded to natural
or near natural and
manage for no
further degradation.
Maintain natural
land. Rehabilitate
degraded to
natural or near
natural and
manage for no
further
degradation.
Maintain
ecological
processes
Sustainable
Management
within general
rural land-use
principles
Sustainable
Management
within general
rural land-use
principles.
Favoured areas
for development.
RECOMMENDED PSDF SPATIAL PLANNING
CATEGORY: →
LAND-USE ACTIVITY
Core 1 Core 1 Core 2
Buffer 1 or 2
at the discretion of
Town and
Regional Planners
Intensive
Agriculture and
Settlement
1) CONSERVATION
LAND-USE
GOVERNED BY THE
NATIONAL
ENVIRONMENTAL
MANAGEMENT:
PROTECTED AREAS
ACT AND A
PROTECTED AREA
MANAGEMENT PLAN
Yes Yes
REFER TO THE PROVINCIAL RURAL
LAND-USE PLANNING AND
MANAGEMENT GUIDELINES FOR
GUIDANCE IN IDENTIFYING
APPROPRIATE LAND-USE ACTIVITIES
ALWAYS MANAGE FOR SUSTAINABLE
DEVELOPMENT WHEN CONSIDERING
LAND and WATER RESOURCE USE
APPLICATIONS IN NATURAL AREAS
2a) AGRICULTURE -HIGH IMPACT : Intensive
Agriculture
(includes forestry plantation and space
extensive agricultural enterprises)
No No
2b) AGRICULTURE - LOW IMPACT: Extensive
Agriculture Restricted Yes
3) HOLIDAY ACCOMMODATION Restricted Restricted
4a) RURAL HOUSING:
Low Density Rural Housing (Consolidation
of rural erven for conservation)
Restricted Restricted
4b) RURAL HOUSING:
On-Farm Workers Settlement No Restricted
5a)TOURIST and RECREATIONAL FACILITIES
- LOW IMPACT: Lecture rooms, restrooms,
restaurants, gift shops and outdoor
recreation
Restricted Restricted
5b) TOURIST and RECREATIONAL FACILITIES
- HIGH IMPACT: Golf , polo, and housing
eco-estates
No No
6a) RURAL BUSINESS:
Place Bound Restricted Restricted
6b) RURAL BUSINESS:
Non Place Bound No No
7) RURAL INDUSTRY No No
8) SMALL HOLDINGS
No No
9) COMMUNITY FACILITIES and
INSTITUTIONS No No
10) INFRASTRUCTURE INSTALLATIONS
Restricted Restricted
11a) SETTLEMENT:
Existing Settlements (Urban Expansion) No No
11b) SETTLEMENT:
New Settlements No No
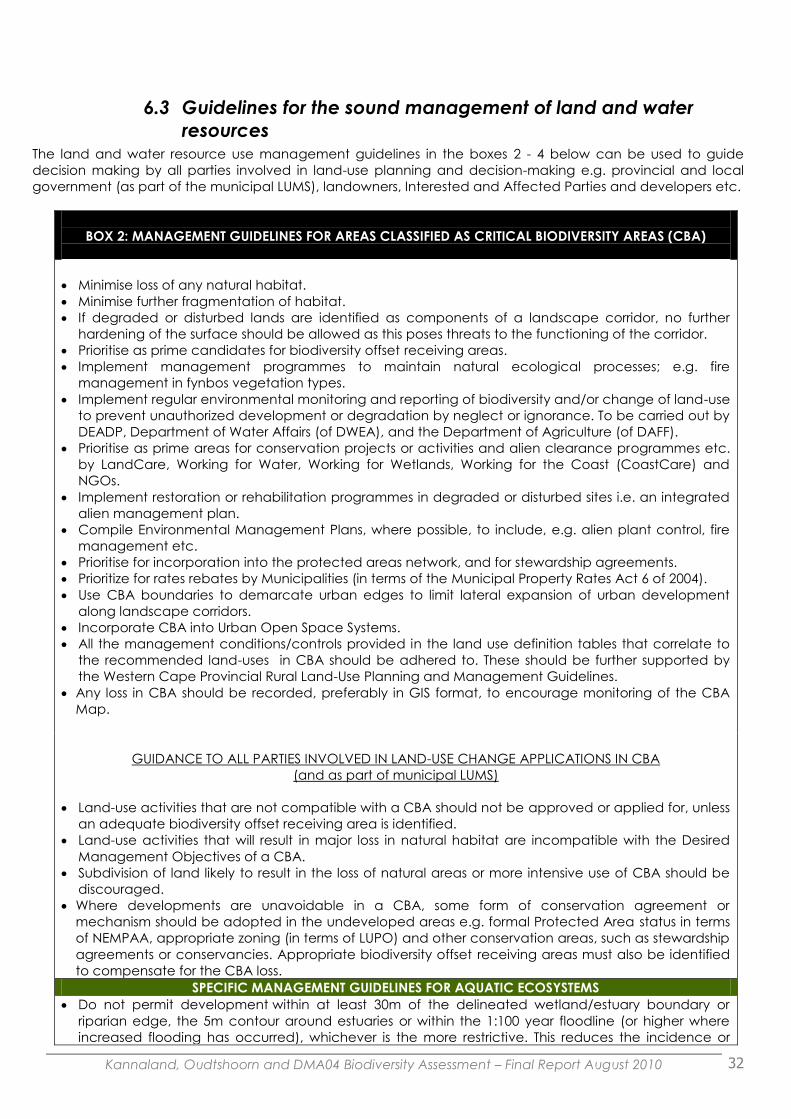
Kannaland, Oudtshoorn and DMA04 Biodiversity Assessment – Final Report August 2010 32
6.3 Guidelines for the sound management of land and water
resources The land and water resource use management guidelines in the boxes 2 - 4 below can be used to guide
decision making by all parties involved in land-use planning and decision-making e.g. provincial and local
government (as part of the municipal LUMS), landowners, Interested and Affected Parties and developers etc.
BOX 2: MANAGEMENT GUIDELINES FOR AREAS CLASSIFIED AS CRITICAL BIODIVERSITY AREAS (CBA)
Minimise loss of any natural habitat.
Minimise further fragmentation of habitat.
If degraded or disturbed lands are identified as components of a landscape corridor, no further
hardening of the surface should be allowed as this poses threats to the functioning of the corridor.
Prioritise as prime candidates for biodiversity offset receiving areas.
Implement management programmes to maintain natural ecological processes; e.g. fire
management in fynbos vegetation types.
Implement regular environmental monitoring and reporting of biodiversity and/or change of land-use
to prevent unauthorized development or degradation by neglect or ignorance. To be carried out by
DEADP, Department of Water Affairs (of DWEA), and the Department of Agriculture (of DAFF).
Prioritise as prime areas for conservation projects or activities and alien clearance programmes etc.
by LandCare, Working for Water, Working for Wetlands, Working for the Coast (CoastCare) and
NGOs.
Implement restoration or rehabilitation programmes in degraded or disturbed sites i.e. an integrated
alien management plan.
Compile Environmental Management Plans, where possible, to include, e.g. alien plant control, fire
management etc.
Prioritise for incorporation into the protected areas network, and for stewardship agreements.
Prioritize for rates rebates by Municipalities (in terms of the Municipal Property Rates Act 6 of 2004).
Use CBA boundaries to demarcate urban edges to limit lateral expansion of urban development
along landscape corridors.
Incorporate CBA into Urban Open Space Systems.
All the management conditions/controls provided in the land use definition tables that correlate to
the recommended land-uses in CBA should be adhered to. These should be further supported by
the Western Cape Provincial Rural Land-Use Planning and Management Guidelines.
Any loss in CBA should be recorded, preferably in GIS format, to encourage monitoring of the CBA
Map.
GUIDANCE TO ALL PARTIES INVOLVED IN LAND-USE CHANGE APPLICATIONS IN CBA
(and as part of municipal LUMS)
Land-use activities that are not compatible with a CBA should not be approved or applied for, unless
an adequate biodiversity offset receiving area is identified.
Land-use activities that will result in major loss in natural habitat are incompatible with the Desired
Management Objectives of a CBA.
Subdivision of land likely to result in the loss of natural areas or more intensive use of CBA should be
discouraged.
Where developments are unavoidable in a CBA, some form of conservation agreement or
mechanism should be adopted in the undeveloped areas e.g. formal Protected Area status in terms
of NEMPAA, appropriate zoning (in terms of LUPO) and other conservation areas, such as stewardship
agreements or conservancies. Appropriate biodiversity offset receiving areas must also be identified
to compensate for the CBA loss.
SPECIFIC MANAGEMENT GUIDELINES FOR AQUATIC ECOSYSTEMS
Do not permit development within at least 30m of the delineated wetland/estuary boundary or
riparian edge, the 5m contour around estuaries or within the 1:100 year floodline (or higher where
increased flooding has occurred), whichever is the more restrictive. This reduces the incidence or

Kannaland, Oudtshoorn and DMA04 Biodiversity Assessment – Final Report August 2010 33
severity of natural hazards.
The “buffer” may need to be wider than 30m. This should be determined on a case-by-case basis by
a specialist ecologist or hydrologist in consultation with appropriate authorities to reflect site-specific
factors. The approach for determining buffer width should consider the current condition of the
aquatic ecosystem and existing and proposed buffer, as well as the functioning of the system in the
broader landscape, plus an assessment of the impacts to the ecosystem of the existing and
proposed adjacent land-use.
Maintain water quantity, quality and flow regimes as close to natural as possible (desired Eco-status
or Ecological Management Class of A: Natural or B: Largely Natural).
Large-scale groundwater abstraction should be avoided.
Areas that are degraded or disturbed should be rehabilitated through programmes such as Working
for Water, Working for Wetlands, Working for the Coast (Coastcare); and a systematic alien
vegetation (and where possible fish) eradication programme implemented to improve biodiversity
and water supply, especially upstream areas of estuaries and wetlands.
Ensure implementation of the CBA Map and guidelines through Catchment Management Agencies.
BOX 3: MANAGEMENT GUIDELINES FOR AREAS CLASSIFIED AS ECOLOGICAL SUPPORT AREAS (ESA)
Extensive loss of habitat within ecological process areas should be minimized.
Fragmentation of habitat should be avoided within ecological process areas.
Natural linkages should be maintained and encouraged between ecosystems, e.g. rivers to associated
wetlands.
Maintain ESA to ensure that ecological processes remain intact e.g. hydrological [river] processes and
riparian areas, fire processes, vegetation boundaries which reflect soil interfaces or upland-lowland
interfaces etc.), especially within landscape corridors.
After CBA areas, ESAs should be a secondary focus for rehabilitation, where possible e.g. alien clearing
through an integrated alien management plan.
If degraded, disturbed or agricultural lands are identified as components of a landscape corridor, no
further hardening of the surface should be allowed as this poses threats to the functioning of the corridor.
Avoid intensification of land-use where possible.
In fynbos and fire-prone thicket systems appropriate fire regimes should be maintained.
All the management conditions/controls provided in the land use definition table relating to the
recommended land uses in ESA should be adhered to.
Any loss in ESA should be recorded, preferably in GIS format, to encourage monitoring of the CBA Map.
SPECIFIC MANAGEMENT GUIDELINES FOR AQUATIC ECOSYSTEMS
To protect river integrity a minimum buffer of 32m, including all riparian habitat, around rivers in ESA
should be maintained. Where possible, the 1:100 year flood line should be used (or higher in areas that
have experienced increased flooding). This reduces the incidence or severity of natural hazards.
Do not permit infilling, excavation, drainage, hardened surfaces (including buildings and asphalt),
intensive agriculture or any new developments within a wetland and its associated buffer of natural
vegetation (i.e. wetland marginal habitat).
Maintain water quantity, quality and flow regimes as close to natural as possible (desired Eco-status or
Ecological Management Class of A: Natural or B: Largely Natural)
Large-scale groundwater abstraction should be avoided.
Areas that are degraded or disturbed should be rehabilitated through programmes such as Working for
Water, Working for Wetlands; and a systematic alien vegetation (and where possible fish) eradication
programme implemented to improve biodiversity and water supply, especially upstream areas of
estuaries and wetlands.
Ensure implementation of the CBA Map and guidelines through Catchment Management Agencies.

Kannaland, Oudtshoorn and DMA04 Biodiversity Assessment – Final Report August 2010 34
BOX 4: MANAGEMENT GUIDELINES FOR AREAS CLASSIFIED AS OTHER NATURAL AREAS (ONA)
These are areas that have not been flagged as having critical biodiversity importance. However, it is
possible that they contain important biodiversity features which are worthy of safeguarding, but which
were not identified in the CBA Map, e.g. a previously unidentified rare species on the site.
Developments should attempt to avoid fragmentation of natural habitat.
Developments must still meet the NEMA principles and EIA requirements, including all other planning
procedures (e.g. town and regional planning, water use licensing, agricultural subdivisions and
cultivation).
Proposals should follow all relevant guidelines to minimize the impact of the proposed development.
Any loss in ONA should be recorded, preferably in GIS format, to encourage monitoring of the CBA
Map.

Kannaland, Oudtshoorn and DMA04 Biodiversity Assessment – Final Report August 2010 35
6.4 Land-use Activity Definitions Table 12. Land-use activity definitions adopted from the provincial Rural Land Use Planning and
Management Guidelines (in preparation). Where land and resource use applications are processed (e.g.
through EIAs), the land and resource use management guidelines, Section 4.4 on page 34, are
encouraged.
LAND-USE ACTIVITY DEFINITIONS
1. CONSERVATION
This is a land-use activity where conservation is the major objective. Subject to stringent controls the following
biodiversity-compatible land-use activities (i.e. those of very low impact) may be accommodated in Critical
Biodiversity Areas:
1a) Conservation management activities such as alien clearing, research and environmental education.
1b) Low intensity eco-tourism activities such as recreation and tourism (e.g. hiking trails, bird and game watching,
and visitor overnight accommodation) with limited access points.
1c) Sustainable consumptive activities: Harvesting of natural resources (e.g. wild flowers for medicinal, culinary or
commercial use), subject to an Environmental Management Plang (EMP) demonstrating the sustainability of
harvesting.
Assumes the following conditions/controls: These land uses are limited to very low transformation levels for
infrastructure development. Existing infrastructure and transformed areas should be utilized. Environmental
Management Plans are required to ensure appropriate protection of the receiving environment e.g. harvesting
volumes, periods etc. The entire property or a part thereof (depending on the land-use activity above) is under
some form of conservation agreement or mechanism. These mechanisms would include formal Protected Areas
in terms of NEM:PAA, appropriate zoning (in terms of the Land Use Planning Ordinance) and other conservation
areas, such as stewardship agreements or conservancies (see Section 2.8 on page 23).
2. AGRICULTURE
2a) Intensive agriculture, including:
- All areas of High Potential and Unique Agricultural Land (HPUAL), together with areas of lower agricultural
potential where particular agricultural practices may themselves contribute to the character of the
environment, the agricultural working landscape or the local economy
Forestry (Timber Production) -
Includes: all timber plantations, mainly Pinus, Eucalyptus & Acacia plant species;
Assumes the following conditions/controls: monoculture of alien timber species with heavy impact on
hydrology and soil erosion and introduction and spread of a variety of the most aggressive alien invasive plants.
Irrigated Crop Cultivation -
Includes: all irrigated crops (vegetables) and irrigated tree crops (orchards);
Assumes the following conditions/controls: intensive production activity with high nutrient and agro-chemical
inputs and often two crops per year [but even just ploughing, with no chemicals etc, results in irreversible loss of
natural habitat].
Dryland Crop Cultivation -
Includes: all tillage cultivation of non-irrigated crops, mostly single-season annuals, but including perennial and
orchard-type tree crops if cultivated with an indigenous grass layer;
Assumes the following conditions/controls: crop production methods that conserve water and protect against
soil erosion; more-or-less limited and responsible use of fertilisers, pesticides and other agrochemicals and
genetically modified organisms (GMOs).
“Nuisance” and space extensive agricultural enterprises (e.g. intensive feed-lots, poultry battery houses) -
Includes: all intensive animal production systems, of domestic or „wild‟ species, that are dependent primarily
on imported foodstuffs and confinement; includes dairy farming and all areas in production support for dairy,
including pastures, fodder and grain crops, much of which is usually irrigated;
Assumes the following conditions/controls: To be located in close proximity to regional routes (including rail) to
facilitate product and requisite (e.g. feed) movement and supply
2b) Extensive agriculture, including extensive livestock or game farming
Includes: livestock or game production and related tourism activities on extensive land portions of natural land
cover. Could include private game reserves, sustainable commercial hunting along with other consumptive and
non-consumptive use of wild natural resources. Private game reserves to be officially protected through various
mechanisms (e.g. NEM:PAA or other conservation agreements – see Section 2.8 on page 23), with strict limits on
the level of development considered acceptable for lodge and other accommodation infrastructure.
Assumes the following conditions/controls: application of minimum size criteria for economic sustainability as
are applied to rangeland livestock farming; strictly limited development for revenue generating purposes such as
intensified tourism or sectional ownership. Stringent management conditions applied, such as –

Kannaland, Oudtshoorn and DMA04 Biodiversity Assessment – Final Report August 2010 36
Faunal specialist to undertake carrying capacity study for game reserves/production.
For game reserves, indigenous species only to be stocked
Environmental Management Plan, including fire management measures, if necessary.
These land uses are limited to very low transformation levels for infrastructure development.
Location of infrastructure either within disturbed/transformed areas and existing buildings, where possible.
3) HOLIDAY ACCOMMODATION
Provides tourist/holiday accommodation in rural areas.
(i) B&B Establishment; Backpackers Accommodation; Guesthouse; Boutique Hotel / Lodge;
(ii) Resort
(iii) Camping Sites
Assumes the following conditions/controls: All forms of holiday accommodation are encouraged within
existing structures or on existing disturbed or transformed areas and within close proximity to existing infrastructure
(e.g. roads and electricity). Although encouraged for resort developments too, this is not always possible given
the unique nature of the setting required, which will most likely be place-bound. Most holiday accommodation
should be provided in or adjacent to existing towns and rural settlements, although it can be accommodated in
the rural landscape. However, the form and scale of facilities should be aligned with the character, quality and
environmental sensitivity of the rural landscape. Certain norms (e.g. number of guesthouses or B&B per farm) must
be applied, as per the RLUP&M guidelines.
These land uses are restricted to small footprints and will be subject to the Western Cape Rural Land Use Planning
and Management Guidelines, which restricts the number of new structures etc within the larger landscape and
encourages densification to reduce cumulative impacts. Resort developments are subject to a density norm or
formulae and the resort units are restricted to 120m² footprints in terms of these guidelines.
4) RURAL RESIDENTIAL
4a) Low density rural residential (consolidation of rural erven for conservation)
This land use facilitates residential development rights outside the urban edge, is of a low density and occurs on
extensive pieces of land thereby increasing the size of the conservation area or land under conservation, i.e.
consolidation of the conservation area (area in hectares that is conserved through various mechanisms – see
Section 2.8 on page 20), within the province. The following density norms, in addition to other land use factors,
environmental constraints and strategic context, including the desirability to consolidate erven, shall be used to
establish the maximum number of units permitted on land units outside the urban edge, namely:
- Divide the total extent in hectares of the to-be-consolidated cadastral units by 1000 and multiply the answer by
the number of cadastral units to be consolidated. Refer to the Rural Planning & Development Guidelines (in
prep) if this calculation yields a number of dwelling units that is less than or equal to, or less than one-third more
than, the total number of individual cadastral units to be consolidated.
development for „lifestyle‟ or investment-type recreational ownership such as share-block schemes,
multi-ownership reserves, but only for extensive land portions with limited development (NB: excludes golf
estates or residential eco-estates).
Assumes the following conditions/controls:
Maintenance of a large measure of natural land cover and biodiversity friendly management must be
maintained; the development footprint should be extremely limited in relation to the property size.
Individual footprints to be limited to 250m² with maximum permissible floor space of 120m².
Clustered layout, sensitively placed to limit the transformation impact, development within already transformed
or disturbed areas or use of existing buildings or built on timber piers (this will also ensure corridor linkages
throughout the cadastral);
Sustainable water supply (within the allocated Reserve of the water resource).
Use off grid services (solar power, rainwater harvesting, grey water recycling, urine diversion/enviro- loos) & built
from local recyclable materials.
No formal gardening.
Areas not developed are under some form of agreement or mechanism. These mechanisms would include
formal Protected Areas in terms of NEM:PAA, appropriate zoning (in terms of the Land Use Planning Ordinance)
and other conservation areas, such as stewardship agreements or conservancies (see Section 2.8 on page 23).
4b) “On-Farm” Settlement of Farm Workers
This land use includes residences for farm workers and retirees “on-farm” i.e. where housing is
available to farm workers who currently live on the farm and will be living there in future, either due to
personal preference (e.g their tenure rights, rural surroundings, place for retirement, etc.) or because
circumstances require it (e.g. working hours, etc.).
Assumes the following conditions/controls:
(a) Fragmentationg of agricultural landscape and land for agricultural purposes not being threatened by the
“urbanization” or the rural areas.
(b) Where possible, clustering of units in distinct housing precincts located in visually unobtrusive locations and
existing footprints, but enjoying convenient access to rural access network
5) TOURIST AND RECREATIONAL FACILITIES
Includes a broad range of rural tourist and recreational facilities in support of sustainable rural tourism, rural

Kannaland, Oudtshoorn and DMA04 Biodiversity Assessment – Final Report August 2010 37
businesses and communities, as well as to provide for the rural recreational and leisure needs of urban dwellers,
namely:
5a) Low impact facilities
(i) lecture rooms, restrooms, restaurants, gift shops
(ii) outdoor recreation (e.g. 4x4 trails and hiking trails)
(iii) Non-place bound tourist and recreational activities and facilities (e.g. water parks, paint ball); and
5b) High impact facilities
(iv) Golf Courses, Golf Estates, Polo Fields and Polo Estates (with or without residential component).
Assumes the following conditions/controls:
Non-place bound tourist and recreational activities and facilities located in or peripheral to existing rural
settlements
Rural tourist and recreational activities and facilities to be linked to a natural setting or feature.
Location of infrastructure either within disturbed/transformed areas and existing buildings, where possible.
Restricting large-scale recreational developments including a residential component to a location in the
“urban periphery”, allowing for inclusion in the medium-term urban edge
Development outside of ecologically sensitive areas, for example river-beds, wetlands, flood-lines and priority
ecological corridors.
6. RURAL BUSINESS
This land use broadens tourist and visitor demand and strengthens rural and settlement economies. It includes
Rural businesses ranging from a curio-shop in a National Park to a conference venue on a game farm, namely:
6a) Place-bound business -
(i) Farm stall and farm shop
(ii) Restaurant/tavern
(iii) Venue facility (e.g. conference/ wedding)
AND
6b) Non place-bound business e.g. agricultural co-operative, filling station/ petro-port, tourist retail outlet, plant
nursery, hotel/motel, tourism office, commercial kennel.
Assumes the following conditions/controls:
Farm stall restricted to selling products produced and processed on the farm to the general public, located
either in the farmstead precinct or abutting a tourist route, if present.
Restaurant, tavern and venue facility located within the farmstead precinct.
Non place-bound business located in and peripheral to rural settlements, outside of environmentally sensitive
areas e.g. Critical Biodiversity Areas.
Location of infrastructure either within disturbed/transformed areas and existing buildings, where possible.
7. RURAL INDUSTRY
This land use accommodates a range of industry types serving rural areas, and include:
7(a) Non place-bound rural industry, for example -
- Manufacturing agricultural requisites such as pallet making, bottle labeling
- Processing of regionally sourced product such as fruit cannery, meat processing plant, abattoir,
- Transport contractors, dairy depots, builder‟s yards; and
- Processing rural sourced products (e.g. pottery manufacturing from kaolin mines)
7(b) Extractive industry which is place-bound given mineral resource i.e. quarrying and mining; including
secondary beneficiation (e.g. cement block manufacturing plants, concrete batch plants, pre-mix asphalt
plants). Includes all strip and opencast mining excavations or quarrying (sand mining); plus the visual, physical
and chemical impacts of these activities, particularly on ground water reserves; all mine waste and refuse dumps,
urban waste sites and landfill sites for whatever purposes.
Assumes the following conditions/controls:
All non place-bound industry (i.e. rural industry and service trades) to be located in and peripheral to rural
settlements outside of environmentally sensitive areas e.g. Critical Biodiversity Areas.
Extractive industry to be located at the mineral source within the rural area, and informed by environmental
considerations and post mining rehabilitation.
8. SMALLHOLDINGS
This land use accommodates smaller agricultural properties which may be used for agriculture, but may also be
occupied as places of residence by people who seek a rural lifestyle, and usually includes agriculture, dwelling
house, home occupation.
Assumes the following conditions/controls:
New smallholding development to be restricted to inside the urban edge.
Minimum smallholding unit size : 8 000m²
Compilation of a Management Plan for new and existing smallholding areas.
9. COMMUNITY FACILITIES AND INSTITUTIONS
This land use provides facilities in support of rural community socio-economic development and well-being;
including:
(i) schools, places of assembly, churches
(ii) primary and secondary health care
(iii) institutions requiring a buffer or isolated location (e.g. infectious disease recovery facility)
(iv) institutions requiring an agricultural production location (e.g. agricultural research stations and agricultural

Kannaland, Oudtshoorn and DMA04 Biodiversity Assessment – Final Report August 2010 38
schools).
Assumes the following conditions/controls:
Facilities located within existing towns and rural settlements; in close proximity to a settlement or located on a
regional route, outside of environmentally sensitive areas e.g. Critical Biodiversity Areas.
In the absence of public land, establish facilities “on-farm”, utilizing existing farm structures or existing footprints.
Location of facilities to target disturbed areas and areas of low agricultural potential in order to avoid
fragmentation of super-blocks.
10. INFRASTRUCTURE INSTALLATIONS
This land use accommodates infrastructure installations serving both the urban and rural areas where such
installations include:
(i) Wastewater treatment works, airport, water extraction purification plants, safety and security (e.g. Police
stations); irrigation infrastructure; roads, power lines, railways, pipelines; and
(ii) All substantial impoundments, reservoirs or dams and weirs, with associated pipelines, canals, access roads
and bulk water transfer schemes),
Assumes the following conditions/controls:
Installations be located on disturbed or low-value agricultural land.
A shared location and/or facility (e.g. police and clinic in a community service centre)
Infrastructure installations requiring a location outside the urban edge be restricted to extensive agricultural
areas peripheral to settlements in close proximity to regional routes to facilitate access and to restrict
fragmentation of the agricultural landscape
Installations in intensive agricultural areas be restricted to essential services (e.g. irrigation infrastructure, safety
and security).
All water-use developments to be subject to the Ecological Reserve.
11. SETTLEMENT
This category includes all human settlements, consisting of the following 2 sub-categories:
(1) Existing settlements (& urban expansion), which include:
Metropolitan areas, cities, larger towns, small towns, villages and hamlets.
It comprises all physical, residential, educational, recreational (e.g. sports facilities, fields, parks), cemeteries,
industrial and business development, including associated infrastructure etc, which are commonly known as
urban land use activities (or the built environment). Existing settlements are frequently under significant pressure to
expand due to in-migration & population increases, which require the provision of housing and services etc
therefore causing urban expansion.
Assumes the following conditions/controls:
The control of urban expansion through the delineation of an urban edge to prevent urban sprawl.
The delineation process is guided by the provincial urban edge guideline document and informed by a
biodiversity plan, for example: a Critical Biodiversity Area is used to delineate a boundary of the urban edge.
The promotion of compact urban settlements, whilst maintaining an open space system (where possible) that
is informed by a biodiversity plan.
(2) New settlements include areas that will -
(i) Service geographically isolated farming areas (i.e. agri-village)
(ii) Service rural resource exploitation (e.g. mines)
(iii) Proclaim the urban component of existing rural settlements
Assumes the following conditions/controls:
New Settlements located in the rural area when necessitated by unique circumstances (e.g. servicing of
isolated large infrastructural projects outside the servicing sphere of existing settlements) or in order to proclaim
the urban component of existing rural (i.e. Transformation of Certain Rural Areas) church, forestry or
conservation settlements.

Kannaland, Oudtshoorn and DMA04 Biodiversity Assessment – Final Report August 2010 39
7 References Amis, M.A., Rouget, M., Balmford, A., Thuiller, W., Kleynhans, C.J., Day, J. and Nel, J., in press.
Predicting Freshwater Habitat Integrity Using Land Use/Cover Surrogates. WATER SA.
Anon (2001). C-Plan. Conservation Planning Software User Manual forC-PlanVersion 3.06. Armidale,
New South Wales National Parks and Wildlife Service, Report.
Anon (2008). Guideline regarding the Determination of Bioregions and the Preparation and
Publication of Bioregional Plans. Department of Environmental Affairs and Tourism.
Ardron, J.A., Possingham, H.P., and Klein, C.J., eds. (2008). Marxan Good Practices Handbook.
External review version, pp 155. Pacific Marine Analysis and Research Association,
www.pacmara.org, Vancouver, BC, Canada.
Ball, I.R. and Possingham, H.P. (2000). MARXAN (V1.8.2): Marine Reserve Design Using Spatially
Explicit Annealing, a Manual. The Ecology Centre, University of Queensland, Brisbane,
Australia.
Berliner D. & Desmet P. (2007) Eastern Cape Biodiversity Conservation Plan: Technical Report.
Department of Water Affairs and Forestry Project No 2005-012, Pretoria. 1 August 2007
Cowling, R.M., A.T. Lombard, M. Rouget, G.I.H. Kerley, T. Wolf, R. Sims-Castley, A. Knight, J.H.J. Vlok,
S.M. Pierce, A.F. Boshoff and S.L. Wilson. (2003). A conservation assessment for the
Subtropical Thicket Biome. Terrestrial Ecology Research Unit, University of Port Elizabeth.
Cowling, R.M. (1999). Planning for persistence –systematic reserve design in southern Africa‟s
succulent Karoo desert. Parks, 9(1), February 1999
Desmet, P.G. (2006) A Strategic Land Acquisition Policy for the Leslie Hill Succulent Karoo Trust
(ZA1415). Report for the Leslie Hill Succulent Karoo Trust (WWF), Stellenbosch, South Africa
Driver, A, P. Desmet, M. Rouget, R. Cowling and K. Maze. 2003. Succulent Karoo Ecosystem Plan,
Biodiversity Component, Technical Report. Cape Conservation Unit, Report No. CCU 1/03,
Botanical Society of South Africa.
Driver, A., Cowling, R.M. & Maze, K.E. (2003). Planning for living landscapes: Perspectives and
lessons from South Africa. Cape Town: Botanical Society of South Africa, Center for Applied
Diversity Science and Conservation International.
Driver, A., Maze, K., Rouget, M., Lombard, A.T., Nel, J., Turpie, J.K., Cowling, R.M., Desmet, P.,
Goodman, P., Harris, J., Jonas, Z., Reyers, B. Sink, K. & Strauss, T. 2004. The National Spatial
Biodiversity Assessment. Priorities for biodiversity conservation in South Africa. Strelitzia 17.
SANBI.
Forsyth, G., Vlok, J. And B. Reyers (2008) Retention and restoration of the biodiversity of the Little
Karoo. CSIR Report No CSIR/NRE/ECO/ER/2008/0118/C Prepared for: Critical Ecosystem
Partnership Fund.
Gallo, J.A., Lombard, A.T. and Cowling, R.M. (2010) Increasing the impact of systematic
conservation planning: some suggestions, a decision support system framework, and a
precursory model. Submitted to Conservation Biology.
Holness, S.D, Bradshaw, P., & Brown, A. (2010). Critical Biodiversity Areas of the Garden Route.
Garden Route Initiative, SANParks.
Jackelman, J; Holness, S and Lechmere-Oertel, R (2008). The National Protected Area Expansion
Strategy (NPAES): A Framework for Implementation. Report compiled for South African
National Biodiversity Institute and National Department of Environment Affairs and Tourism,
Pretoria
Lombard, A.T., T. Wolf and N. Cole. 2003. GIS coverages and spatial analyses for the Subtropical
Thicket Ecosystem Planning (STEP) Project. Terrestrial Ecology Research Unit, University of Port
Elizabeth. TERU Report 42.
Lombard, A.T., Wolf, T. and T. Strauss (2004) GIS Specialist Services, Gouritz Initiative (GI). Prepared
for: Cape Nature
Margules, C.R. & Pressey, R.L. (2000). Systematic conservation planning. Nature, 405.
Marsh, A, Desmet, P & Oosthuysen, E (2009). Namakwa District Managementity Biodiversity Sector
Plan, Version 2, February 2009. Northern Cape Province Department of Tourism, Environment
& Conservation (DTEC), Directorate: Policy Coordination and Environmental Planning,
Springbok
Mucina L. & Rutherford, M.C. (eds) (2006). The Vegetation of South Africa, Lesotho and Swaziland.
Strelitzia 19. South African National Biodiversity Institute, Pretoria.

Kannaland, Oudtshoorn and DMA04 Biodiversity Assessment – Final Report August 2010 40
Nel, J.L., Reyers, B., Van Deventer, H., Smith-Adao, L. 2007. Protected Area
Expansion Strategy: Spatial assessment of river priorities. Final Report. CSIR Report
number CSIR/NRE/ECO/2007/0134/C.
Noss, R.F. (1990). "Indicators for monitoring biodiversity - a hierarchical approach." Conservation
Biology 4(4): 355-364.
Pasquini, L. 2007. Privately –owned lands and biodiversity conservation: analysing the role of Private
Conservation Areas in the Little Karoo, south Africa. University of Sheffield.
Pence, Genevieve Q.K. 2008 (in prep). C.A.P.E. Fine-Scale Systematic Conservation Planning
Assessment: Technical Report. Produced for Cape Nature.
Reyers, B., P. J. O‟Farrell, R. M. Cowling, B. N. Egoh, D. C. Le Maitre and J. H. J. Vlok 2009. Ecosystem
services, land-cover change, and stakeholders: finding a sustainable foothold for a semiarid
biodiversity hotspot. Ecology and Society 14(1): 38. [online]
Rouget, M., Reyers, B., Jonas, Z., Desmet, P., Driver, A., Maze, K., Egoh, B. & Cowling, R.M. (2004).
South African National Spatial Biodiversity Assessment 2004: Technical Report. Volume1:
terrestrial component. Pretoria: South African National Biodiversity Institute.
Rutherford, M.C., Midgley, G.F., Bond, W.J., Powrie, L.W., Roberts, R. and Allsopp N. (1999). South
African Country Study on Climate Change. Plant Biodiversity:vulnerability and Adaptation
Assessment. NBI.
SANBI (2007). Draft Guideline regarding the Determination of Bioregions and the Preparation and
Publication of Bioregional Plans. March 2007. Prepared by the South African National
Biodiversity Institute at the request of the Minister and Department of Environmental Affairs
and Tourism
SANBI (2008). Threatened Ecosystems in South Africa: General Information. South African Biodiversity
Institute, Pretoria.
Scholes, R.J. & Biggs, R (2005) A biodiversity intactness index. Nature 434, 45-49
Skowno, A.L., Holness, S.D. and P.G. Desmet (2009) Biodiversity Assessment of the Central Karoo
District Managementity. DEADP Report EADP05/2008, 52 pages.
Thompson, M., J. Vlok, R. Cowling, S. Cundill and N. Mundau (2005). A land transformation map for
the Little Karoo. Pretoria, GeoterraImage (Pty) Ltd.
Vlok, J. H. J., R. M. Cowling and T. Wolf. 2005. A vegetation map for the Little Karoo. Unpublished
maps and report for a SKEP project supported by Grant No 1064410304. (Cape Town,
Critical Ecosystem Partnership Fund)
Vlok, J. And Reyers, B. Unpublished. Methods, Data, and Results for Determining the Representation
Targets of the Little Karoo
Vromans, D.C., Maree, K.S., Holness, S.D., Job, N. and Brown, A.E. 2010. The Garden Route
Biodiversity Sector Plan for the George, Knysna and Bitou Municipalities. Supporting land-use
planning and decision-making in Critical Biodiversity Areas and Ecological Support Areas for
sustainable development. Garden Route Initiative. South African National Parks. Knysna.
Vromans, D.C., Maree, K.S., Holness, S. D., Job, N. and Brown, A.E. 2010. The Garden Route
Biodiversity Sector Plan for the southern regions of the Kouga and Koukamma Municipalities.
Supporting land-use planning and decision-making in Critical Biodiversity Areas and
Ecological Support Areas for sustainable development. Garden Route Initiative. South
African National Parks. Knysna.

Kannaland, Oudtshoorn and DMA04 Biodiversity Assessment – Final Report August 2010 41
8 Appendix 1: GIS methods and technical notes
8.1 Planning Domain The planning domain for this study includes the whole of the Kannaland Local Municipality,
Oudtshoorn Local Municipality and the Eden District Management Area (DMA04) in which
the town of Uniondale is situated. The latest municipal boundaries (Municipal Demarcation
board 2008) were utilised. Many of the existing plans and data layers for the region follow
the Little Karoo Planning domain defined by Vlok et al. (2005) and refined by Reyers et al.
(2008). The Little Karoo Planning domain extends further west than this assessment and
covers an area of 1,9 million hectares as opposed to the 1,25 million covered by this
assessment (Figure A). Ecosystem Status and Protection level calculations were based on
the larger Little Karoo Planning area and its 371 vegetation units.
Figure A. showing the Little Karoo Planning Domain defined by Vlok et al. (2005) in relation
the planning domain of this study.
8.2 General All GIS analyses and processes were conducted by the authors in ESRI ARCGIS (9.3.1) ,
ARCVIEW (3.2) and IDRISI environments. The projection for all grids and shapefiles was set to
UTM 34 South described below:
Projected Coordinate System: WGS_1984_UTM_Zone_34S
Projection: Transverse_Mercator
False_Easting: 500000.00000000
False_Northing: 10000000.00000000
Central_Meridian: 21.00000000
Scale_Factor: 0.99960000
Latitude_Of_Origin: 0.00000000
Linear Unit: Meter
Geographic Coordinate System: GCS_WGS_1984
Datum: D_WGS_1984
Prime Meridian: Greenwich
Angular Unit: Degree

Kannaland, Oudtshoorn and DMA04 Biodiversity Assessment – Final Report August 2010 42
8.3 Table showing colours used in the Critical Biodiversity
Area Map
CODE NAME SOURCE DESCRIPTION NOTES FOR AV3.x
CBA Critical
biodiversity
area
CAPE Fine-
scale
Green
(67:128:0
RGB)
(hue:saturation:va
lue)
63:255:128
ESA Ecological
support area
Central
Karoo
Olive
(168:168:0
RGB)
PA Protected
area (formal)
CAPE Fine-
scale
Green (1:99:0
RGB) + black
45° , 0.5 lines
85:255:100
CA
Conservation
area
(informal)
Central
Karoo
Olive
(115:115:0
RGB) + black
45°, 0.5 lines
OTHER NAT Other natural
areas
CAPE Fine-
scale
White
TRANS Transformed
or converted
areas
CAPE Fine-
scale
Grey
(178:178:178
RGB)
8.4 Protected areas layer A protected area layer was developed for the planning domain based on existing Cape
Nature Protected Areas data set, Cape Nature Stewardship Sites data set, Informal
Conservation Ares in the NPAES (2008), and Private conservation areas Identified by
Pasquini (2007). Only Formal Protected Areas and contracted Cape Nature Stewardship
sites were considered as Protected Areas in the analysis. These sites are assumed to
contribute to meeting biodiversity targets, and as such are “hard wired” into the CBA Model
as PAs. Informal sites are not assumed to contribute to meeting biodiversity targets as there
is no guarantee in the long term that the biodiversity contained in them will be conserved.
8.5 Land cover model This project developed a simplified land cover based on a land cover map put together by
Kirkwood et al. (2009) (specifically the land cover designed for ecosystem status
calculations) as part of the Western Cape Biodiversity Framework (which in turn was based
on Thompson et al. 2005). The modifications made in this project include the addition of:
Chief Directorate Surveys and Mapping 1:50 000 series data (roads and railways buffered by
15m; dams and quarries un-buffered; built up areas buffered by 100m); and agricultural
fields layer developed by GTI for Department agriculture. Some reclassification was
necessary: The DA fields layer is more accurate than the fields class of the Thompson data
set in delineating actual cultivated areas and old lands. The cultivated Class in this Land
Cover was based solely on the DA field layers. The areas classified as cultivated by
Thompson et al. (2005) that fall outside of the DA fields layer were reclassified as Severely
Degraded. This decision was based on desktop SPOT image investigation. Two levels of land
classification were developed based on Kirkwood et al. (2009)
The Land cover is available as shapefile or 10m resolution TIFF.

Kannaland, Oudtshoorn and DMA04 Biodiversity Assessment – Final Report August 2010 43
8.6 Biodiversity Features
8.6.1 Habitat model
The conservation planning process made use of the finescale vegetation map produced
by Jan Vlok (Vlok et al. 2005). This high quality vegetation map is based on a combination
of extensive field surveys during 2004, the subdivision of landscape into topogeomorphic
units hand drawn on 1:50 000 Landsat images and additional remote sensing interpretation.
A hierarchical classification system was used with vegetation units, nested within habitats
which are nested within biomes. In transformed areas, the pretransformation vegetation
was estimated and mapped based on surrounding vegetation and remaining patches. 235
vegetation types are found within the Kannaland and Oudtshoorn Local Municipalities, and
Eden District Management Area (Uniondale) of the Little Karoo.
Targets were based on those defined for the Little Karoo study region using a systematic
approach (Vlok & Reyers Unpublished). Each target was derived using the slope of the
species-area curve (Desmet & Cowling 2004). This benefited habitats with greater species
heterogeneity. The percentage of species targeted for conservation was set at 75%.. The
targets were rescaled so that the target range was 16-34% as per the national standard.
These are given in the Excel Spreadsheet targets.xls.
A two stage approach to the identification of the priority areas for habitats was used :
1.) Area targets were set based on the original extent of each habitat within the planning
area combined with the percentage target. The available natural areas of each
habitat type were made available for selection. Targets could be not be met for 14
types:
a. Calitzdorp Gravel Apronveld
b. Doornkloof Gannaveld
c. Eensaamheid Renosterveld
d. Elandsvlei Gwarrieveld
e. Gourits Asbos-Gwarrieveld
f. Greylands Apronveld
g. Grootkop Apronveld
h. Kruisrivier Gannaveld
i. Langkloof Renosterveld
j. Oudtshoorn Gannaveld
k. Rooirivier Apronveld
l. Vanwyksdorp Gravel Apronveld
m. Volmoed Gannaveld
n. Witvlakte Arid Spekboomveld
2.) For these vegetation types a second “shadow” feature was added in which included
both natural and degraded areas of that vegetation type. The same target was used
for this feature. Both the original feature (with natural areas only) and the “shadow
feature” (with natural and degraded areas) were included within the analysis. The
consequence of this is that natural areas are always selected first (as they are required
to meet the targets for both the original feature and the “shadow feature”, and that the
additional area required to meet the remaining target would then be met in degraded
areas.
Landcover
Level 1 Level 2
Natural Natural
Near Natural - Alien invasive plants
Near Natural - Moderately Degraded
Unknown
No Natural No Natural Agric
No Natural Dam
No Natural Urban
No Natural - Other
Degraded Severely Degraded

Kannaland, Oudtshoorn and DMA04 Biodiversity Assessment – Final Report August 2010 44
8.6.2 Nationally listed threatened ecosystems
Vegetation types that will be listed at threatened under NEMBA were obtained from SANBI.
The boundaries of these units are based on the National Vegetation Map. These were
trimmed to their remaining untransformed extent and these areas were included as features
in the conservation assessment. For Critically Endangered vegetation types 100% of both
natural and degraded areas were targeted for selection, while for other types only natural
areas were made available and targets were based on the original extent of each
vegetation type within the planning domain:
Name Status Target
%
Eastern Coastal
Shale Band
Vegetation
Vulnerable 27
Eastern Little
Karoo
Vulnerable 16
Kango
Limestone
Renosterveld
Vulnerable 29
Langkloof Shale
Renosterveld
Critically Endangered 100
Montagu Shale
Renosterveld
Vulnerable 29
Muscadel Riviere Critically Endangered 100
8.6.3 Special plant species
Critically endangered, endangered and vulnerable plant species records from Cape
Nature and CREW Databases. The locations of threatened plant species (Critically
Endangered, Endangered and Vulnerable) were buffered by 250m. Existing datasets
provided by Don Kirkwood and John Gallo were combined with data provided by CREW.
Only Critically Endangered, Endangered and Vulnerable species were included from the
CREW records, with Data Deficient, Least Concern and “No Status” records being removed.
From the John Gallo datasets (largely derived from CapeNature records), records with “low
level of concern” statuses similar to those listed above were removed from the dataset, as
were records with poor location accuracy (e.g. records tied to “nearest minute”, centroids
of farms etc). The above three datasets were combined, and trimmed to the remaining
natural and degraded area.
Specific species data are not provided in this dataset, as certain elements of the CREW
dataset are potentially sensitive. Should a site be identified as having potential special
species, the CREW dataset should be directly queried to find specific details of the species
concerned.
A 100% target was set for remaining natural areas and degraded areas with potential
special plant species to ensure that these areas all fall within CBAs .
8.6.4 Forest patches
Forest patches from Cape Nature (Kirkwood pers com). An 30% target was used for these
areas to ensure that they were largely included in CBAs without forcing in all small
fragments. This analysis was redundant as all areas were already within existing protected
areas.
8.6.5 Quartz patches
Quartz areas were derived from two datasets. Quartz patches from Cape Nature (Kirkwood
pers com) were combined with the quartz vegetation types from the Little Karoo vegetation

Kannaland, Oudtshoorn and DMA04 Biodiversity Assessment – Final Report August 2010 45
map. These areas were trimmed to their remaining natural extent. Quartz patches are also
included within the areas prioritized by the Gouritz assessment (Lombard et al, 2004).
A 30% target was used for these areas to ensure that they were included in CBAs without
forcing in all fragments.
8.6.6 Leslie Hill Succulent Karoo Expert areas
The Leslie Hill Succulent Karoo Trust plant expert survey (Desmet, 2006) contains the results of
a survey of 16 Succulent Karoo plant experts (38 respondents were originally identified and
approached) who were asked to map the most important areas for conservation in the
Succulent Karoo. The survey was conducted in 2005 as part of a study commission by the
WWF to assess conservation priorities in the Succulent Karoo. Criteria for mapping areas
included: Areas rich with endemic plant species or unique habitats; Good representative
area of the general habitats and vegetation of the surrounding area; Area is under threat
from some activity and if not conserved will be lost.
The expert group identified 134 areas within the Succulent Karoo as being important for
conservation covering an area of 1.17 Million hectares or 9.7% of the core Succulent Karoo
biome. The distribution of expert mapped areas is overwhelmingly skewed towards areas in
Namaqualand with only a handful identified in Central Karoo planning domain.
Targets were set based on the original extent of each expert area:
0-1000ha 80% target
1000-5000ha 50% target
5000-10000ha 40% target
10000ha+ 20% target
8.6.7 John Gallo Expert areas ( including inputs from Jan Vlok)
John Gallo recently completed a conservation planning tool and assessment of priority
areas for reserves and stewardship within the Little Karoo (Gallo et al, in press). Expert
identified areas included habitats with high endemism and richness of succulents and
identified priority sites identified by Jan Vlok. Areas above a threshold value of 0.5 were
extracted from the above datasets. These areas were clipped to their remaining natural
extent. A 30% target was used for these areas to ensure that they were included in CBAs
without forcing in all fragments.
8.6.8 Priority areas from the STEP and SKEP Conservation Assessments
Features were extracted from the STEP and SKEP conservation assessments
High irreplaceability areas from the Succulent Karoo assessment (SKEP) were included. A
20% target was used for the CBA run.
Process areas were included from the thicket assessment (STEP). These were the river
and biome process areas. A 20% targets were used fro these features in the CBA run.
The remaining natural extent of these features were included within the conservation
assessment. Low targets were used in the Little Karoo assessment as more modern analyses
were available and the intention was to slightly skew the selection into these areas rather
than forcing selection. Note that components of the STEP assessment such a the Mega
Conservancy Corridors are included via the “Gouritz Priorities” detailed below.
8.6.9 Succulent Karoo Priorities
Priority areas identified within the Leslie Hill Succulent Karoo Trust assessment (Desmet, 2006)
were included as features. Any site with a Marxan score of greater than 25 was included. A
30% target was used.
Kannaland, Oudtshoorn and DMA04 Biodiversity Assessment – Final Report August 2010 46
8.6.10 Garden Route Initiative Critical Biodiversity Areas and Ecological Support
Areas
Priority areas identified within the Route Initiative Critical Biodiversity Areas and Ecological
Support Areas assessment process that overlapped into the planning domain were included
(Holness et al, 2010; Vromans et al, 2010a, Vromans et al, 2010b). A target of 30% of these
areas was used.
8.6.11 East Cape Priorities
Priority sub-catchments identified as CBAs within the Eastern Cape Biodiversity Assessment
(Berliner & Desmet, 2007) were included as features where these extended into the CKDM.
A target of 30% of the remaining intact area was used.
8.7 Aquatic features
8.7.1 Priority Rivers and Catchments
Outputs of the National Freshwater Ecosystem Priority Area assessment (NFEPA) which is
currently being completed (Nel et al, in prep) were incorporated. This project identifies the
most important rivers, river catchment and wetlands for meeting freshwater biodiversity
targets and conserving ecological processes.
The project identified Freshwater Ecosystem Priority Areas (FEPAs) which are the freshwater
equivalent of a Critical Biodiversity Area, and Freshwater Ecosystem Support Areas (FESAs)
which are the freshwater equivalent of Ecological Support Areas. These are identified at a
national scale and require some finescaling before they can be incorporated into a Critical
Biodiversity Area map:
• FEPA priority catchments were trimmed to their remaining natural extent and
this was included as a feature in the conservation assessment with a target of
70%. Any intact FEPA area that was not selected as a CBA in the assessment
was included in the second run as a compulsory Ecological Support Area to
ensure that the catchment was sufficiently protected.
• FESA support area catchments were trimmed to their remaining natural extent
and this was included as a feature in the conservation assessment with a
target of 30% of original area.
• FEPA priority river reaches and a buffer of 500m on either side were trimmed
to their remaining natural extent and this was included as a feature in the
conservation assessment with a target of 70%. Any intact FEPA river reach
area that was not selected as a CBA in the assessment was included in the
second run as a compulsory Ecological Support Area to ensure that the
catchment was sufficiently protected.
• FESA support area river reaches and a buffer of 500m on either side were
trimmed to their remaining natural extent and this was included as a feature
in the conservation assessment with a target of 30% of original area. Any
intact FESPA river reach area that was not selected as a CBA in the
assessment was included in the second run as a compulsory Ecological
Support Area to ensure that the catchment was sufficiently protected.
8.7.2 Additional rivers
From a process perspective, it is not just the nationally selected rivers which are important. A
river buffer layer developed by Don Kirkwood which buffered the larger (above 2nd order)
1:50 000 rivers by 100m and the smaller rivers by 30m was included as a compulsory part of
the Ecological Support Area layer in the second conservation run.

Kannaland, Oudtshoorn and DMA04 Biodiversity Assessment – Final Report August 2010 47
8.7.3 Wetlands and pans
Cape Nature sensitive wetlands layer (Shaw 2007) combined with the NFEPA wetland layer
(see above) were clipped to Planning Domain, and a unique ID was assigned to each
wetland. The Wetlands were then buffered by 500m and the percentage transformation
and degradation around each wetland was calculated using zonal statistics (ARCGIS9.2),
this attribute was then joined to the original wetland layer. Wetlands with more than 30% of
their buffer area transformed or degraded were considered to be in a poor ecological
state.
The wetlands were clipped to remaining natural and degraded areas and included as a
feature in the MARXAN run with a target of 30%. Any natural wetland not selected as a CBA
was included in the second run as a compulsory Ecological Support Area to ensure that
wetlands are sufficiently protected.
8.8 Ecosystem status Ecosystem status calculations are based on a union between the vegetation,
transformation and protected areas layers. A pivot table was used in Excel to calculate per
vegetation type summary statistics of transformation, degradation and protection.
Separate ecosystem status calculations were performed using transformation only and
transformation and degradation together. The Status of the habitat types is summarized in
Appendix 2.
8.9 Protection Level and Urgency Protection level is calculated as the percentage biodiversity target achievement by the
protected area network for each vegetation type. Protection urgency is based on
irreplaceability of the remaining unfragmented areas of that vegetation type that are
available to meet PA targets. The union between vegetation types, transformation and
protected areas described in the ecosystem status methods above was used to calculate
protection summary statistics. (full details for each vegetation type in Appendix 2)
8.10 Climate change and corridors
8.10.1 High priority unfragmented landscapes
Unfragmented areas play an important role in climate change adaptation as they allow
relatively unrestricted movement of species across the landscape, which ensures that they
can adapt naturally to climate change. Further, these large areas represent landscapes
where a range of ecological processes that require extensive areas (e.g. habitat for wide
ranging scavengers such as Brown Hyaena) can either currently operate or where there is
reasonable potential for these processes to be reinstated.
The National Protected Areas Expansion Conservation Assessment (Holness 2008) identified
high priority unfragmented areas that if protected would contribute most to meeting
national terrestrial and freshwater conservation targets. The areas identified are all over
5000ha in size. Every attempt should be made to avoid an activity that results in the
fragmentation of these areas.
A 30% target was used for these areas to ensure preferential selection of other biodiversity
features in these areas without forcing the whole area into the plan.
8.10.2 Riparian corridors
River corridors represent important linkages across the landscape, particularly in arid and
poorly differentiated habitats. In addition to the other river and aquatic features included in
the plan, it was important to ensure that all major riparian corridor areas were included to
ensure that the linkages important for climate change adaptation were protected.

Kannaland, Oudtshoorn and DMA04 Biodiversity Assessment – Final Report August 2010 48
The DWAF 1:500 000 rivers layer was used as the basis for the assessment. Rivers were
buffered as follows:
3rd order and larger rivers 1000m
2nd order rivers 500m
All remaining rivers 250m
All intact natural areas within these riparian corridors were targeted as Critical Biodiversity
Areas with 100% target set. A 100% target for both natural and transformed areas for these
rivers was set for the second run, ie. they were fully included in the Ecological Support Areas
category.
8.10.3 Topographic variability
Areas of potential climate change resilience and climate refuges based on a multi-scale
modeled assessment of landscapes of high topographic diversity. These topographically
diverse areas are important for a number of reasons:
The representation of rare or unique features that are not encountered more
widely in the landscape;
Associated with keystone ecological process features such as inselbergs, cliff
faces, springs and caves;
Are an important refuge habitat in the face of climate change; and
These areas also include important altitude, temperature and moisture
gradients which need to be protected to allow climate change adaptation.
The 90m resolution SRTM Digital Elevation Model was used as the basis for the assessment.
This layer was processed in IDRISI according to the following method:
The data were filtered at a variety of scales: 7x7, 15x15, 25x25, 45x45 pixels;
A standard deviation was calculated at each scale;
Areas with a top quartile SD at any of these scales were classified as having high
topographic variability; and
A combined multi-scale layer of areas of high topographic variability was produced
by combining these layers. Small areas were removed (>100ha).
A 30% target for these areas was set for the first CBA run, while the remaining unselected
areas were included as Ecological Support Areas if they were not transformed.
8.10.4 South-facing slopes
South facing slopes represent important climate change refuges. These areas are likely to
serve as refuge habitats during period of temperature increase and moisture decrease as
they naturally have lower temperatures and higher moisture levels that the general
landscape.
The 90m resolution SRTM Digital Elevation Model was used as the basis for the assessment.
This layer was processed in IDRISI according to the following method:
Areas with a south facing aspect were identified using IDRISI modelling tools (aspect
of between 110° and 250°);
Areas of a slope of 10° or greater were identified using IDRISI modelling tools;
These two layers were intersected to identify areas with steep south facing slopes;
The layer was clipped to the remaining natural extent; and
Small areas were removed (>100ha).
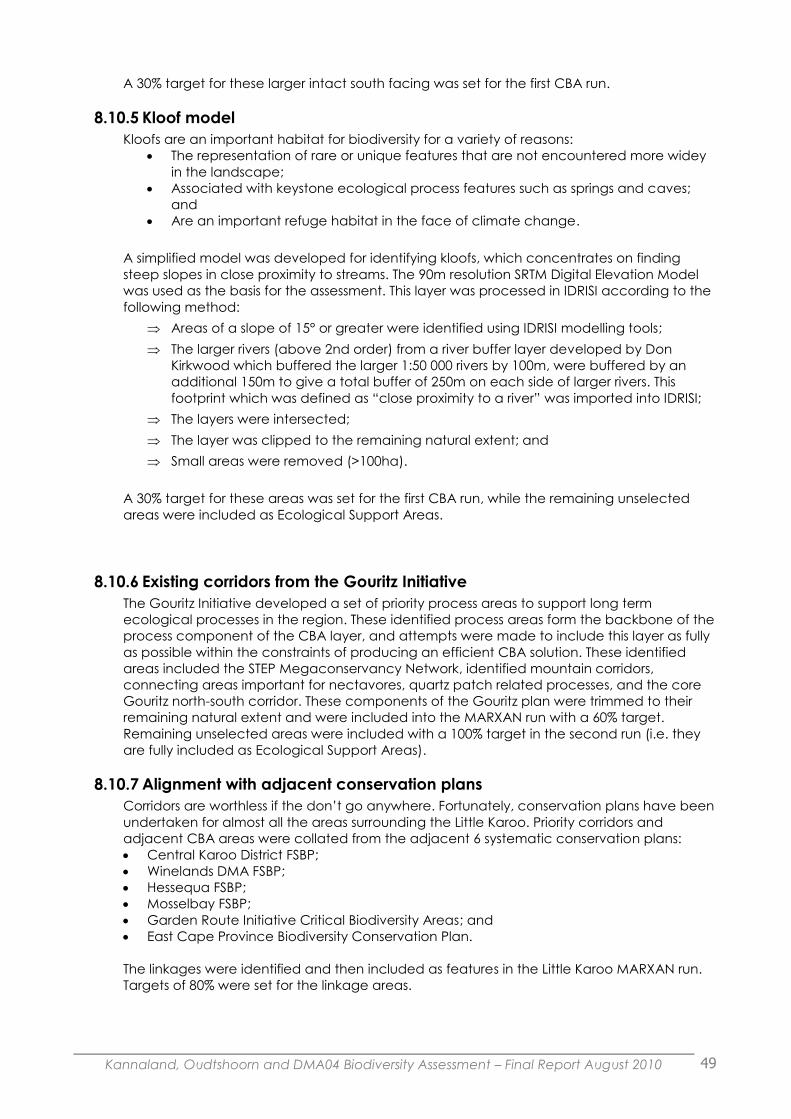
Kannaland, Oudtshoorn and DMA04 Biodiversity Assessment – Final Report August 2010 49
A 30% target for these larger intact south facing was set for the first CBA run.
8.10.5 Kloof model
Kloofs are an important habitat for biodiversity for a variety of reasons:
The representation of rare or unique features that are not encountered more widey
in the landscape;
Associated with keystone ecological process features such as springs and caves;
and
Are an important refuge habitat in the face of climate change.
A simplified model was developed for identifying kloofs, which concentrates on finding
steep slopes in close proximity to streams. The 90m resolution SRTM Digital Elevation Model
was used as the basis for the assessment. This layer was processed in IDRISI according to the
following method:
Areas of a slope of 15° or greater were identified using IDRISI modelling tools;
The larger rivers (above 2nd order) from a river buffer layer developed by Don
Kirkwood which buffered the larger 1:50 000 rivers by 100m, were buffered by an
additional 150m to give a total buffer of 250m on each side of larger rivers. This
footprint which was defined as “close proximity to a river” was imported into IDRISI;
The layers were intersected;
The layer was clipped to the remaining natural extent; and
Small areas were removed (>100ha).
A 30% target for these areas was set for the first CBA run, while the remaining unselected
areas were included as Ecological Support Areas.
8.10.6 Existing corridors from the Gouritz Initiative
The Gouritz Initiative developed a set of priority process areas to support long term
ecological processes in the region. These identified process areas form the backbone of the
process component of the CBA layer, and attempts were made to include this layer as fully
as possible within the constraints of producing an efficient CBA solution. These identified
areas included the STEP Megaconservancy Network, identified mountain corridors,
connecting areas important for nectavores, quartz patch related processes, and the core
Gouritz north-south corridor. These components of the Gouritz plan were trimmed to their
remaining natural extent and were included into the MARXAN run with a 60% target.
Remaining unselected areas were included with a 100% target in the second run (i.e. they
are fully included as Ecological Support Areas).
8.10.7 Alignment with adjacent conservation plans
Corridors are worthless if the don‟t go anywhere. Fortunately, conservation plans have been
undertaken for almost all the areas surrounding the Little Karoo. Priority corridors and
adjacent CBA areas were collated from the adjacent 6 systematic conservation plans:
Central Karoo District FSBP;
Winelands DMA FSBP;
Hessequa FSBP;
Mosselbay FSBP;
Garden Route Initiative Critical Biodiversity Areas; and
East Cape Province Biodiversity Conservation Plan.
The linkages were identified and then included as features in the Little Karoo MARXAN run.
Targets of 80% were set for the linkage areas.
Kannaland, Oudtshoorn and DMA04 Biodiversity Assessment – Final Report August 2010 50
8.11 Non-Biodiversity Alignment layers
8.11.1 Important Natural Viewsheds
The CSIR ecosystem services project developed a viewshed layer of areas within the Little Karoo
that are highly visible from known tourism access routes. High value areas (above a score of 5)
were selected from this layer. These areas were clipped to remaining natural areas to define a
“High visibility natural areas” layer. This was included as a feature in the conservation planning run
with a 30% target to prioritize areas where intact biodiversity may be contributing to tourism in the
area (Reyers et al. 2008).
8.12 Cost Layers
8.12.1 Landcover model
The landcover model was used as part of the cost surface. See 8.14.4
8.13 Restoration / Rehabilitation model Potential thicket restoration areas were generated using STEP (2001) vegetation,
Thompson‟s 2005 landcover and distance to settlements data (CDSM) by CSIR team in CEPF
funded project in 2008 (Forsyth et.al 2008).
8.14 Technical methods used in the assessment
8.14.1 Planning Units
Hexagon planning units of 25ha size were used as the base planning units.
8.14.2 Biodiversity Features and Targets
Targets for habitat types followed Vlok et al. 2005, Reyers et al. 2008 and Gallo et al (in
press) . Targets for other features were set based on those used in other similar plans, as well
as the underlying nature of the feature. For example, remaining natural and degraded
areas of Critically Endangered habitat listed under NEM:BA were given a 100% target to
ensure that they were reflected in the final CBA map, while more notional features such as
high priority quarter degree squares from the SKEP assessment or modelled areas important
for climate change adaptation were given far lower targets to encourage preferential
selection of these areas without forcing them into the plan. High targets were set for
selected priority river catchments and river reaches from the aquatic assessment as these
were required to form the backbone of the conservation design. The targets are detailed in
the individual descriptions of features in the preceding chapter.
8.14.3 Software methods
A similar planning process was used to that of that used in the Central Karoo and Garden
Route to ensure optimal alignment between these adjacent plans and to facilitate user
understanding of these plans. A two step optimization approach to systematic conservation
planning was undertaken making use of MARXAN. This approach has the advantage of
allowing an efficient network to be identified (i.e. one which uses the least possible space to
achieve its targets and also minimizes cost to other sectors) as well as to promote the
identification of a network which is sensible from an ecological point of view (the approach
strongly favours connected and adjacent areas, and allows preferential meeting of targets
in priority catchments and areas important for climate change resilience). MARXAN was
also used to integrate the corridors and selected areas with those CBA and corridor areas
from the adjacent conservation plans.
8.14.4 Planning Unit Cost
A cost surface was prepared based on the integrated transformation and degradation
layer. Highest costs were associated with transformed areas, and lowest costs with natural
areas. Natural areas received a base cost of 1 unit, near natural areas were 3 units,

Kannaland, Oudtshoorn and DMA04 Biodiversity Assessment – Final Report August 2010 51
degraded areas had a cost of 10 units, rural transformed areas (agricultural fields, dams
etc) had a cost of 100 and urban areas a cost of 500 units. These were summarised for the
planning units based on an area weighted mean. In addition, identified stewardship sites
within the Pasquini 2007 protected area layer were discounted by 50% to allow for
preferential selection of these areas.
High costs for not meeting targets (“spf” values) were assigned to features that needed to
be fixed into the plan design while lower costs were associated with features where there
was less risk associated with not fully meeting the targets or where features existed which
needed to guide but not force the conservation planning algorithm.
Remaining extent of biodiversity features (i.e. the area available for selection) were
identified using the transformed classes in the compiled landcover. Degraded areas were
still available for selection for some features such as endangered and critically endangered
habitats but were strongly avoided where possible.
8.14.5 Ecological Support Areas
Ecological Support Areas were then identified by increasing the targets for selected process
features (such as the remaining areas of high priority catchments, riverine corridors and climate
change adaptation areas) to an effective 100%, which forces these areas into the conservation
plan. For this second iteration (in addition to the MARXAN based integration), the exact selected
features were used in the selection.
8.14.6 CBA Lookup Table
It is important that the users of the CBA and ESA layer can quickly and easily identify why a
specific area was selected within the conservation plan. The use of MARXAN as an optimizing
tool invariably means that selected planning units were prioritized on the basis of a range of
underlying features found within the unit. One negative consequence of the methodology is
that it is sometimes difficult to pin-point the specific feature that resulted in the selection of the
planning unit, as all features present will be contributing to meeting targets. Nevertheless, it is
important when dealing with development applications that as good an idea of possible of the
specific features found at a site are known to the person scrutinizing the application. Therefore a
simplified look-up table or layer was created to show at a glance what the major features
present at a site are and hence contributed most to its selection. It should be emphasized that
this table is designed to allow quick and easy understanding of the over-all plan and give a
reasonably robust feature list for a site, and not a comprehensive listing of the specific features.
The shapefile is designed to allow the user to select or query any polygon. The table has the
following fields:
CBA category: This gives the CBA category for the polygon. It indicates whether the
polygon is a Formal Protected Area, a Conservation Area, a Critical Biodiversity Area or an
Ecological Support Area.
Objective: This field outlines the management objective for the land parcel. This relates to
either maintaining ecological patterns or processes.
Habitat: This field indicates areas where the remaining intact habitat within that planning
unit is contributing significantly to targets. Habitats are indicated as contributing to best
design if this was likely to be a major reason why the polygon was selected.
Aquatic features: These are areas where developments should be carefully screened to
ensure no major impact on the rivers, their riparian corridors and wetlands are likely.
Specials: This field indicates if threatened species are likely to occur at the site. Polygons are
indicated as “Potential threatened species” .
Expert: These are areas identified within the various expert layers included in the
conservation plan. Polygons are flagged as having “Potential occurrence of expert
identified special feature” and this will relate to a feature such as a quartz patch, area of
high value for succulents, or a forest.
PlanPriori: These areas are the sites that were identified in other conservation plans as
important. They are likely to include possible important habitats, for example those
identified in the Leslie Hill Succulent Karoo Assessment. Note that the Gouritz corridors are
indicated in the "Process" category rather than here.

Kannaland, Oudtshoorn and DMA04 Biodiversity Assessment – Final Report August 2010 52
Catch: This indicates priority catchments and are areas where special attention needs to
be given to avoiding major impacts on hydrological processes and aquatic features.
Process: These are all the climate change process, corridor and linkage areas, important
both for links within the district and to adjacent areas. These areas include potential climate
refugia, and are flagged as “Maintain ecological processes and linkages especially for
climate change”.
Threatened: These are threatened habitats listed under NEMBA.
Unfrag: These are important unfragmented areas which potentially contribute significantly
to the climate change resilience of the area. Developments which result in these areas
being fragmented should be avoided.

9 Appendix 2 – Ecosystem status for habitat types identified by Vlok et al. (2005)
Kannaland, Oudtshoorn and DMA04 Biodiversity Assessment – Final Report August 2010 53
Vegetation Unit
Total
Extent
Natural
Extent
No Natural
Extent
Degraded
Extent
TARGET
(%)
Eco-
Status
Protection
Level
Protection
Urgency
Aardvark Quartz Gannaveld 16 11 0 5 32 LT PA Target Met Fully protected
Adamskraal Gwarrieveld 6,348 5,683 40 625 27 LT PA Target Met Fully protected
Algerynskraal Gannaveld 666 340 106 220 23 VU Completely Unprotected Low urgency
Algerynskraal Gravel Apronveld 644 503 18 123 34 LT Completely Unprotected Low urgency
Allemorgens Kalkveld 21 21
28 LT PA Target Met Fully protected
Anysberg Arid Asteraceous Fynbos 755 744 11
28 LT PA Target Met Fully protected
Anysberg Arid Proteoid Fynbos 4,311 4,311
33 LT PA Target Met Fully protected
Anysberg Mesic Proteid Fynbos 586 586
32 LT PA Target Met Fully protected
Anysberg Perennial Stream 144 140 0 3 28 LT PA Target Met Fully protected
Anysberg Renosterveld 2,046 1,953 88 5 26 LT PA Target Met Fully protected
Assegaaibosch Arid Spekboomveld 1,548 1,532 14 2 26 LT Completely Unprotected Low urgency
Attaquas Mesic Proteoid Fynbos 1,563 1,558 5
32 LT PA Target Met Fully protected
Barandas Arid Spekboomveld 13,880 12,249 125 1,506 26 LT Completely Unprotected Low urgency
Bellair Quartz Apronveld 1,830 1,799 1 30 33 LT Completely Unprotected Low urgency
Bellair Quartz Gannaveld 1,220 1,149 8 63 32 LT Completely Unprotected Low urgency
Bergplaas Sandolien-Renosterveld 800 706 19 75 26 LT PA Target Met Fully protected
Bergplaas Waboom-Thicket 3,910 2,552 75 1,283 25 LT Partially Protected Low urgency
Biljetsfontein Apronveld 2,178 1,512 281 385 34 LT Partially Protected Low urgency
Blossoms Asbos-Gwarrieveld 45,207 15,343 11,972 17,893 25 EN Very Poorly Protected Medium urgency
Boerbonefontein Pruimveld 3,393 2,212 31 1,151 24 LT PA Target Met Fully protected
Boerboonleegte Gannaveld 433 358 10 66 23 LT Completely Unprotected Low urgency
Bosluiskloof Grassy Fynbos 230 220
9 28 LT PA Target Met Fully protected
Brakrivier Gannaveld 2,456 2,007 102 347 23 LT Completely Unprotected Low urgency
Brandrivier Renoster-Gwarrieveld 5 5
27 LT Completely Unprotected Low urgency
Buffels Arid Spekboomveld 7,514 6,059 40 1,415 26 LT Partially Protected Low urgency
Buffels River & floodplain 7,452 2,456 2,749 2,247 27 EN Partially Protected Medium urgency
Calitzdorp Arid Spekboomveld 6,166 5,960 121 85 22 LT Very Poorly Protected Low urgency
Calitzdorp Gannaveld 4,269 1,157 68 3,045 23 EN Completely Unprotected Medium urgency
Calitzdorp Gravel Apronveld 9,078 2,994 1,616 4,468 34 CR Poorly Protected High urgency
Calitzdorp Valley Spekboomveld 14,142 10,838 125 3,179 27 LT Partially Protected Low urgency
Cango Renoster-Thicket 32,440 12,901 2,271 17,268 27 EN Very Poorly Protected Medium urgency
Central Swartberg Perennial stream 12,468 9,946 1,446 1,075 28 LT PA Target Met Fully protected
De Rust Sandolien-Spekboomveld 17,157 13,619 2,483 1,055 27 LT Very Poorly Protected Low urgency
De Vlugt Forest-Waboomveld 862 851 6 5 24 LT PA Target Met Fully protected
De Vlugt Sandolien-Renosterveld 1,198 637 379 182 26 VU Partially Protected Low urgency
Doornboom Fynbos-Gwarrieveld 2,101 2,062
39 27 LT Completely Unprotected Low urgency
Doornkloof Gannaveld 34 4 3 27 23 EN PA Target Met Fully protected
Doornkloof Gwarrieveld 2,482 2,165 22 296 27 LT PA Target Met Fully protected
Doornrivier Mesic Proteoid Fynbos 7,059 6,154 596 309 32 LT PA Target Met Fully protected
Doringrivier Arid Proteoid Fynbos 824 824
33 LT PA Target Met Fully protected
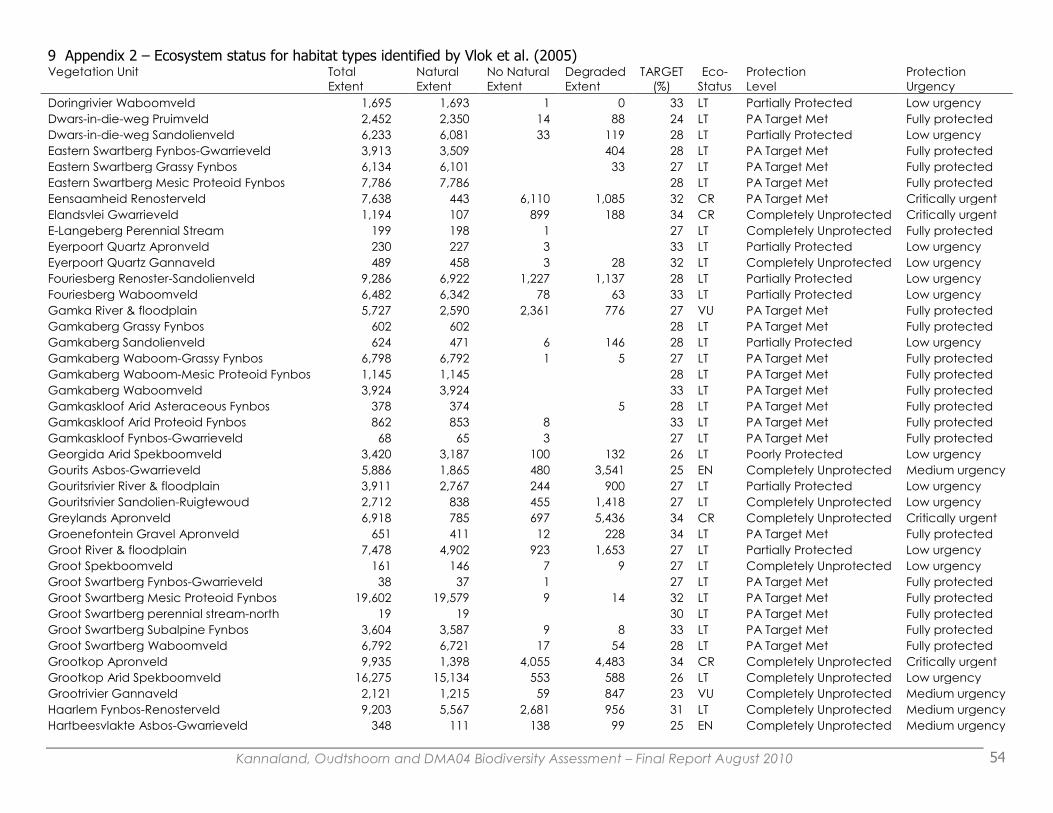
9 Appendix 2 – Ecosystem status for habitat types identified by Vlok et al. (2005)
Kannaland, Oudtshoorn and DMA04 Biodiversity Assessment – Final Report August 2010 54
Vegetation Unit
Total
Extent
Natural
Extent
No Natural
Extent
Degraded
Extent
TARGET
(%)
Eco-
Status
Protection
Level
Protection
Urgency
Doringrivier Waboomveld 1,695 1,693 1 0 33 LT Partially Protected Low urgency
Dwars-in-die-weg Pruimveld 2,452 2,350 14 88 24 LT PA Target Met Fully protected
Dwars-in-die-weg Sandolienveld 6,233 6,081 33 119 28 LT Partially Protected Low urgency
Eastern Swartberg Fynbos-Gwarrieveld 3,913 3,509
404 28 LT PA Target Met Fully protected
Eastern Swartberg Grassy Fynbos 6,134 6,101
33 27 LT PA Target Met Fully protected
Eastern Swartberg Mesic Proteoid Fynbos 7,786 7,786
28 LT PA Target Met Fully protected
Eensaamheid Renosterveld 7,638 443 6,110 1,085 32 CR PA Target Met Critically urgent
Elandsvlei Gwarrieveld 1,194 107 899 188 34 CR Completely Unprotected Critically urgent
E-Langeberg Perennial Stream 199 198 1
27 LT Completely Unprotected Fully protected
Eyerpoort Quartz Apronveld 230 227 3
33 LT Partially Protected Low urgency
Eyerpoort Quartz Gannaveld 489 458 3 28 32 LT Completely Unprotected Low urgency
Fouriesberg Renoster-Sandolienveld 9,286 6,922 1,227 1,137 28 LT Partially Protected Low urgency
Fouriesberg Waboomveld 6,482 6,342 78 63 33 LT Partially Protected Low urgency
Gamka River & floodplain 5,727 2,590 2,361 776 27 VU PA Target Met Fully protected
Gamkaberg Grassy Fynbos 602 602
28 LT PA Target Met Fully protected
Gamkaberg Sandolienveld 624 471 6 146 28 LT Partially Protected Low urgency
Gamkaberg Waboom-Grassy Fynbos 6,798 6,792 1 5 27 LT PA Target Met Fully protected
Gamkaberg Waboom-Mesic Proteoid Fynbos 1,145 1,145
28 LT PA Target Met Fully protected
Gamkaberg Waboomveld 3,924 3,924
33 LT PA Target Met Fully protected
Gamkaskloof Arid Asteraceous Fynbos 378 374
5 28 LT PA Target Met Fully protected
Gamkaskloof Arid Proteoid Fynbos 862 853 8
33 LT PA Target Met Fully protected
Gamkaskloof Fynbos-Gwarrieveld 68 65 3
27 LT PA Target Met Fully protected
Georgida Arid Spekboomveld 3,420 3,187 100 132 26 LT Poorly Protected Low urgency
Gourits Asbos-Gwarrieveld 5,886 1,865 480 3,541 25 EN Completely Unprotected Medium urgency
Gouritsrivier River & floodplain 3,911 2,767 244 900 27 LT Partially Protected Low urgency
Gouritsrivier Sandolien-Ruigtewoud 2,712 838 455 1,418 27 LT Completely Unprotected Low urgency
Greylands Apronveld 6,918 785 697 5,436 34 CR Completely Unprotected Critically urgent
Groenefontein Gravel Apronveld 651 411 12 228 34 LT PA Target Met Fully protected
Groot River & floodplain 7,478 4,902 923 1,653 27 LT Partially Protected Low urgency
Groot Spekboomveld 161 146 7 9 27 LT Completely Unprotected Low urgency
Groot Swartberg Fynbos-Gwarrieveld 38 37 1
27 LT PA Target Met Fully protected
Groot Swartberg Mesic Proteoid Fynbos 19,602 19,579 9 14 32 LT PA Target Met Fully protected
Groot Swartberg perennial stream-north 19 19
30 LT PA Target Met Fully protected
Groot Swartberg Subalpine Fynbos 3,604 3,587 9 8 33 LT PA Target Met Fully protected
Groot Swartberg Waboomveld 6,792 6,721 17 54 28 LT PA Target Met Fully protected
Grootkop Apronveld 9,935 1,398 4,055 4,483 34 CR Completely Unprotected Critically urgent
Grootkop Arid Spekboomveld 16,275 15,134 553 588 26 LT Completely Unprotected Low urgency
Grootrivier Gannaveld 2,121 1,215 59 847 23 VU Completely Unprotected Medium urgency
Haarlem Fynbos-Renosterveld 9,203 5,567 2,681 956 31 LT Completely Unprotected Medium urgency
Hartbeesvlakte Asbos-Gwarrieveld 348 111 138 99 25 EN Completely Unprotected Medium urgency

9 Appendix 2 – Ecosystem status for habitat types identified by Vlok et al. (2005)
Kannaland, Oudtshoorn and DMA04 Biodiversity Assessment – Final Report August 2010 55
Vegetation Unit
Total
Extent
Natural
Extent
No Natural
Extent
Degraded
Extent
TARGET
(%)
Eco-
Status
Protection
Level
Protection
Urgency
Hartbeesvlakte Fynbos-Spekboomveld 4,820 4,812 1 6 28 LT PA Target Met Fully protected
Hartbeesvlakte Gannaveld 2,514 1,407 48 1,060 23 VU Completely Unprotected Low urgency
Hartbeesvlakte Sandolien-Renosterveld 14,668 13,947 437 284 26 LT Completely Unprotected Low urgency
Hartbeesvlakte Spekboomveld 5,718 5,262 81 375 27 LT Partially Protected Low urgency
Hermanuskraal Quartz Gannaveld 114 71 8 35 32 VU Completely Unprotected Medium urgency
Herold Renoster-Sandolienveld 3,072 1,094 1,710 268 28 EN Poorly Protected Medium urgency
Hondewater Randteveld 569 461 0 108 24 LT Completely Unprotected Low urgency
Kamanassie Arid Proteoid Fynbos 4,762 4,751 9 1 33 LT PA Target Met Fully protected
Kamanassie Arid Restioid Fynbos 3,748 3,724 4 19 23 LT PA Target Met Fully protected
Kamanassie Grassy Fynbos 6,009 5,897 53 59 28 LT PA Target Met Fully protected
Kamanassie Mesic Proteoid Fynbos 9,024 8,976 47 1 32 LT PA Target Met Fully protected
Kamanassie northern Perennial Stream 2,497 2,463 28 7 28 LT PA Target Met Fully protected
Kamanassie Perennial Stream 3,874 3,642 108 124 30 LT PA Target Met Fully protected
Kamanassie Subalpine Fynbos 818 818
33 LT PA Target Met Fully protected
Kamanassie Waboomveld 30,003 27,405 1,721 877 28 LT PA Target Met Fully protected
Kandelaars Arid Spekboomveld 16,922 16,145 415 363 26 LT Completely Unprotected Low urgency
Kandelaars Gannaveld 1,622 1,096 243 283 23 LT Completely Unprotected Low urgency
Kareebosch Apronveld 1,145 1,066 44 35 34 LT Completely Unprotected Low urgency
Kareebosch Randteveld 2,081 2,035 35 11 24 LT Completely Unprotected Low urgency
Kareevlakte Quartz Gannaveld 556 389 29 138 32 LT Completely Unprotected Low urgency
Keurbooms River & Perennial Streams 6,974 6,353 367 254 28 LT PA Target Met Fully protected
Keurbosch Arid Spekboomveld 5,259 5,120 22 117 26 LT Poorly Protected Low urgency
Keurbosch Fynbos-Gwarrieveld 1,172 1,164 1 7 27 LT PA Target Met Fully protected
Klein Swartberg Arid Proteoid Fynbos 2,791 2,785
6 33 LT PA Target Met Fully protected
Klein Swartberg Fynbos-Gwarrieveld 419 419
27 LT PA Target Met Fully protected
Klein Swartberg Grassy Fynbos 6,129 6,121 0 8 28 LT PA Target Met Fully protected
Klein Swartberg Mesic Proteoid Fynbos 15,372 15,370
1 32 LT PA Target Met Fully protected
Klein Swartberg Perennial Stream 1,335 1,088 198 49 28 LT PA Target Met Fully protected
Klein Swartberg Subalpine Fynbos 849 849
30 LT PA Target Met Fully protected
Klein Swartberg Waboomveld 1,530 1,481 23 25 33 LT PA Target Met Fully protected
Klipgat Apronveld 9,738 9,470 125 142 34 LT Poorly Protected Low urgency
Koeniekuils Apronveld 7 7
34 LT Completely Unprotected Low urgency
Koeniekuils Gannaveld 17,489 11,942 518 5,029 23 LT Poorly Protected Low urgency
Koenieleegte Randteveld 4,095 3,269 13 813 24 LT Completely Unprotected Low urgency
Koenieleegte Scholtzbosveld 2,432 799 23 1,610 16 EN Completely Unprotected Medium urgency
Kouga Arid Proteoid Fynbos 9,844 9,584 151 109 33 LT Poorly Protected Low urgency
Kouga Asbos-Renosterveld 1,435 1,284 124 27 27 LT Completely Unprotected Low urgency
Kouga Grassy Fynbos 19,425 19,028 234 163 28 LT PA Target Met Fully protected
Kouga Mesic Proteoid Fynbos 25,492 25,197 189 106 32 LT PA Target Met Fully protected
Kouga Perennial Stream 8,699 7,209 1,105 385 28 LT PA Target Met Fully protected

9 Appendix 2 – Ecosystem status for habitat types identified by Vlok et al. (2005)
Kannaland, Oudtshoorn and DMA04 Biodiversity Assessment – Final Report August 2010 56
Vegetation Unit
Total
Extent
Natural
Extent
No Natural
Extent
Degraded
Extent
TARGET
(%)
Eco-
Status
Protection
Level
Protection
Urgency
Kouga Sandolien-Renosterveld 4,793 4,273 397 124 26 LT Completely Unprotected Low urgency
Kouga Subalpine Fynbos 1,355 1,354
1 30 LT PA Target Met Fully protected
Kruisrivier Arid Spekboomveld 3,657 3,279 174 204 27 LT Completely Unprotected Low urgency
Kruisrivier Gannaveld 2,440 457 19 1,964 23 CR Completely Unprotected High urgency
Kruisrivier Renoster-Sandolienveld 3,155 2,206 698 251 28 LT Completely Unprotected Low urgency
Kruisrivier Sandolien-Spekboomveld 3,246 3,059 90 97 28 LT Completely Unprotected Low urgency
Kruisrivier Spekboom-Pruimveld 29,424 27,089 1,103 1,232 24 LT Very Poorly Protected Low urgency
Kruisrivier Waboom-Renosterveld 2,505 2,040 247 218 31 LT Very Poorly Protected Low urgency
Kruisrivier Waboom-Thicket 5,612 2,728 57 2,827 25 VU Completely Unprotected Medium urgency
Kwessie Arid Spekboomveld 1,174 859 10 306 26 LT Partially Protected Low urgency
Ladismith Arid Spekboomveld 11,024 9,353 283 1,388 26 LT Partially Protected Low urgency
Ladismith Fynbos-Sandolienveld 1,255 1,039 3 213 28 LT Partially Protected Low urgency
Ladismith Gannaveld 7,270 3,944 142 3,184 23 VU PA Target Met Fully protected
Ladismith Sandolien-Renosterveld 4,353 3,782 386 186 26 LT Partially Protected Low urgency
Langkloof Renosterveld 5,930 1,480 3,810 640 34 CR Completely Unprotected High urgency
Leeublad Sandolien-Renosterveld 21,703 11,818 7,167 2,719 26 VU Poorly Protected Low urgency
Lemoenshoek Gannaveld 350 102 5 243 23 VU Completely Unprotected Medium urgency
Matjiesrivier Arid Proteoid Fynbos 1,061 1,051
9 33 LT Completely Unprotected Low urgency
Matjiesrivier Asbos-Renosterveld 2,291 823 1,145 324 27 EN Completely Unprotected Medium urgency
Matjiesrivier Sandolienveld 3,132 2,180 765 188 28 LT Completely Unprotected Low urgency
Matjiesrivier Waboom-Renosterveld 5,039 4,836
202 31 LT Completely Unprotected Low urgency
Matjiesvlei Sandolien-Thicket 2,620 2,199 74 348 27 LT Very Poorly Protected Low urgency
Meiringspoort Spekboom Thicket 362 356 5 2 28 LT PA Target Met Fully protected
Meiringspoort Waboomveld 1,629 1,596 1 32 33 LT PA Target Met Fully protected
Mistkraal Fynbos-Gwarrieveld 3,110 3,086 3 20 27 LT Completely Unprotected Low urgency
Mistkraal Gwarrieveld 2,119 2,035 21 63 27 LT Completely Unprotected Low urgency
Mons Ruber Waboom-Thicket 10,477 8,718 285 1,474 26 LT Poorly Protected Low urgency
Nooitgedacht Gwarrieveld 4,399 1,798 47 2,555 27 EN Completely Unprotected Medium urgency
Noukloof Arid Spekboomveld 10,532 9,293 751 488 26 LT PA Target Met Fully protected
Ockertskraal Arid Spekboomveld 32,411 20,221 138 12,052 26 LT Poorly Protected Low urgency
Ockertskraal Quartz Apronveld 1,629 1,544 55 30 33 LT Completely Unprotected Low urgency
Ockertskraal Randteveld 6,493 6,042 36 415 24 LT Completely Unprotected Low urgency
Olifants River & floodplain 48,227 22,666 14,842 10,719 27 VU Poorly Protected Medium urgency
Opsoek Asbos-Thicket 370 188 49 133 24 VU Completely Unprotected Medium urgency
Ortmansgat Randteveld 2,110 1,786 37 287 24 LT Completely Unprotected Low urgency
Oudtshoorn Gannaveld 9,980 733 6,525 2,722 23 CR Completely Unprotected Critically urgent
Oudtshoorn Scholtzbosveld 1,623 638 11 974 16 VU Completely Unprotected Low urgency
Outeniqua Perennial Stream 6,012 3,170 1,953 889 28 VU PA Target Met Fully protected
Outeniqua Waboomveld 7,572 5,564 1,253 756 33 LT Poorly Protected Low urgency
Paardeberg Fynbos-Sandolienveld 2,832 1,759 658 415 28 LT Completely Unprotected Low urgency

9 Appendix 2 – Ecosystem status for habitat types identified by Vlok et al. (2005)
Kannaland, Oudtshoorn and DMA04 Biodiversity Assessment – Final Report August 2010 57
Vegetation Unit
Total
Extent
Natural
Extent
No Natural
Extent
Degraded
Extent
TARGET
(%)
Eco-
Status
Protection
Level
Protection
Urgency
Paardeberg Mesic Proteoid Fynbos 486 486
32 LT Completely Unprotected Low urgency
Paardebont Fynbos-Sandolienveld 1,036 598 183 255 28 VU Completely Unprotected Medium urgency
Perdefontein Fynbos-Gwarrieveld 906 890 4 13 27 LT PA Target Met Fully protected
Pietslaagte Apronveld 10,724 8,125 473 2,126 34 LT Completely Unprotected Low urgency
Pietslaagte Arid Spekboomveld 16,650 15,807 199 643 26 LT Completely Unprotected Low urgency
Pietslaagte Asbos-Gwarrieveld 17,380 15,536 775 1,068 25 LT Very Poorly Protected Low urgency
Plathuis Randteveld 9,905 9,605 33 267 24 LT Completely Unprotected Low urgency
Poortfontein Randteveld 3,554 2,731 13 810 24 LT Completely Unprotected Low urgency
Potjiesrivier Waboomveld 14,152 12,315 1,430 407 33 LT Very Poorly Protected Low urgency
Prinspoort Arid Gwarrieveld 1,577 1,476 57 44 27 LT Completely Unprotected Low urgency
Prinspoort Pruimveld 3,203 2,954 78 171 25 LT Completely Unprotected Low urgency
Ratelfontein Gannaveld 732 637 1 94 23 LT PA Target Met Fully protected
Request Quartz Apronveld 49 13 0 36 33 LT Completely Unprotected Low urgency
Request Quartz Gannaveld 583 469 38 76 32 LT Completely Unprotected Low urgency
Request Randteveld 1,295 957 7 330 24 LT Completely Unprotected Low urgency
Rooiberg Arid Asteraceous Fynbos 3,062 3,062
28 LT PA Target Met Fully protected
Rooiberg Arid Proteoid Fynbos 3,789 3,789
33 LT PA Target Met Fully protected
Rooiberg Arid Restioid Fynbos 6,357 6,345 7 6 23 LT PA Target Met Fully protected
Rooiberg Fynbos-Spekboomveld 6,788 6,670 4 114 28 LT PA Target Met Fully protected
Rooiberg Grassy Fynbos 2,219 2,219
28 LT PA Target Met Fully protected
Rooiberg Mesic Proteoid Fynbos 10,033 10,033
32 LT PA Target Met Fully protected
Rooiberg Perennial Stream 2,068 2,006 22 40 28 LT PA Target Met Fully protected
Rooiberg Subalpine Fynbos 51 51
30 LT PA Target Met Fully protected
Rooiberg Waboomveld 4,946 4,938 8
33 LT PA Target Met Fully protected
Rooirivier Apronveld 1,582 452 246 884 34 CR Completely Unprotected High urgency
Rouxpos Gwarrieveld 209 196 1 12 27 LT Completely Unprotected Low urgency
Rouxpos Randteveld 834 749 5 81 24 LT Completely Unprotected Low urgency
Saffraanrivier Waboom-Renosterveld 3,409 2,028 497 884 31 VU Poorly Protected Low urgency
Sandberg Arid Restioid Fynbos 6,625 6,564 7 55 23 LT PA Target Met Fully protected
Sandberg Fynbos-Spekboomveld 3,822 3,816 0 5 28 LT Completely Unprotected Low urgency
Sandkraal Gwarrieveld 2,066 1,944 7 114 27 LT Partially Protected Low urgency
Seweweekspoort Perennial Stream 3,501 2,269 738 494 28 LT PA Target Met Fully protected
Seweweekspoort Waboomveld 1,010 1,001 1 7 33 LT PA Target Met Fully protected
Snyberg Gravel Apronveld 1,866 1,217 180 469 34 LT Completely Unprotected Medium urgency
Snyberg Gwarrieveld 1,087 707 118 262 27 LT Poorly Protected Low urgency
Stompdrift Arid Spekboomveld 9,030 8,312 528 190 26 LT Very Poorly Protected Low urgency
Stormberg Randteveld 524 428 1 96 24 LT Completely Unprotected Low urgency
Swartberg Renosterveld 2,916 2,332 370 215 34 LT Partially Protected Low urgency
Tafelberg Renoster-Sandolienveld 6,231 5,625 277 329 28 LT Partially Protected Low urgency
Touws River & floodplain 6,060 3,692 1,014 1,354 27 LT PA Target Met Fully protected

9 Appendix 2 – Ecosystem status for habitat types identified by Vlok et al. (2005)
Kannaland, Oudtshoorn and DMA04 Biodiversity Assessment – Final Report August 2010 58
Vegetation Unit
Total
Extent
Natural
Extent
No Natural
Extent
Degraded
Extent
TARGET
(%)
Eco-
Status
Protection
Level
Protection
Urgency
Touws River Pruimveld 1,299 1,296 0 2 25 LT PA Target Met Fully protected
Touwsberg Fynbos-Gwarrieveld 2,371 2,357 2 11 27 LT Partially Protected Low urgency
Touwsberg Mesic Proteoid Fynbos 1,700 1,700
32 LT Completely Unprotected High urgency
Touwsberg perennial stream 106 96 10
28 LT Completely Unprotected Critically urgent
Touwsfontein Randteveld 2,135 2,066 15 54 24 LT PA Target Met Fully protected
Touwsfontein Scholtzbosveld 1,034 1,008 13 13 16 LT PA Target Met Fully protected
Toverwater Sandolien-Spekboomveld 9,793 9,195 88 510 27 LT Poorly Protected Low urgency
Tsitsikamma Mesic Proteoid Fynbos 18,098 17,896 85 117 32 LT PA Target Met Fully protected
Tsitsikamma Perennial Stream 3,182 2,662 342 178 28 LT Partially Protected Low urgency
Uniondale Asbos-Renosterveld 17,324 8,389 6,607 2,328 27 VU Completely Unprotected Medium urgency
Uniondale Waboom-Renosterveld 8,530 5,299 2,264 967 31 LT Poorly Protected Low urgency
Vaalhoek Arid Spekboomveld 12,399 11,848 121 430 26 LT Poorly Protected Low urgency
Van Zylsdamme Gannaveld 730 207 306 217 23 EN Completely Unprotected Medium urgency
Vanwyksdorp Arid Spekboomveld 4,804 4,313 236 256 26 LT Partially Protected Low urgency
Vanwyksdorp Gravel Apronveld 266 82 28 157 34 CR Partially Protected Medium urgency
Visgat Apronveld 101 95 6
34 LT Completely Unprotected Low urgency
Vlakteplaas Gannaveld 4,102 1,763 1,136 1,203 23 VU Completely Unprotected Medium urgency
Volmoed Arid Spekboomveld 5,535 5,405 9 121 26 LT Completely Unprotected Low urgency
Volmoed Gannaveld 6,712 1,103 3,853 1,756 23 CR Completely Unprotected High urgency
Voorsorg Fynbos-Spekboomveld 7,689 7,499 76 114 28 LT PA Target Met Fully protected
Vrede Arid Gwarrieveld 1,194 1,194 0
27 LT PA Target Met Fully protected
Vrede Randteveld 2,400 2,331 8 61 24 LT PA Target Met Fully protected
Waterval Randteveld 454 190
265 24 VU Completely Unprotected Medium urgency
Witberg Arid Proteoid Fynbos 2,524 2,524 0
33 LT PA Target Met Fully protected
Witberg Waboomveld 7,181 6,876 153 152 33 LT PA Target Met Fully protected
Witvlakte Apronveld 4,267 3,616 61 589 34 LT Very Poorly Protected Low urgency
Witvlakte Arid Spekboomveld 2,233 238 15 1,980 26 CR Completely Unprotected Critically urgent
Witvlakte Quartz Gannaveld 979 626 22 332 32 LT Completely Unprotected Medium urgency
Woeska Waboomveld 5 4 1
33 LT Partially Protected Low urgency
Zewefontein Arid Gwarrieveld 5,318 5,176 76 66 27 LT Completely Unprotected Low urgency
Zoar Fynbos-Spekboomveld 7,558 6,170 133 1,256 27 LT PA Target Met Fully protected
Zoar Gwarrieveld 972 291 289 392 27 EN Completely Unprotected Medium urgency
Zorgvliet Apronveld 801 741 49 11 34 LT Completely Unprotected Low urgency
Zorgvliet Fynbos-Gwarrieveld 951 943 2 5 27 LT Completely Unprotected Low urgency
Zorgvliet Pruimveld 5,700 5,517 100 82 25 LT Completely Unprotected Medium urgency
Totals 1,245,435 952,320 120,812 172,302