biosensors and bioelectronics - sogang · biosensors and bioelectronics journal homepage: selective...
TRANSCRIPT
Contents lists available at ScienceDirect
Biosensors and Bioelectronics
journal homepage: www.elsevier.com/locate/bios
Selective isolation and noninvasive analysis of circulating cancer stem cellsthrough Raman imaging
Hyeon-Yeol Choa,b,1, Md. Khaled Hossainc,1, Jin-Ho Leea,b, Jiyou Hand, Hun Joo Leec,e,Kyeong-Jun Kima, Jong-Hoon Kimf, Ki-Bum Leeb,⁎,2, Jeong-Woo Choia,c,⁎⁎,3
a Department of Chemical and Biomolecular Engineering, Sogang University, Seoul 04107, South KoreabDepartment of Chemistry and Chemical Biology, Rutgers, The State University of New Jersey, Piscataway, NJ 08854, USAc Interdisciplinary Program of Integrated Biotechnology, Sogang University, Seoul 04107, South Koread Department of Biological Sciences, Laboratory of Stem Cell Research and Biotechnology, Hyupsung University, Hwasung-si 18330, South Koreae DP Team, Samsung Bioepis, Incheon 21987, South KoreafDepartment of Biotechnology, Laboratory of Stem Cells and Tissue Regeneration, College of Life Sciences and Biotechnology, Korea University, Seoul 02841, South Korea
A R T I C L E I N F O
Keywords:Circulating cancer stem cellsMetastasisCirculating tumor cellsRaman-active nanoprobesRaman imaging
A B S T R A C T
Circulating cancer stem cells (CCSCs), a rare circulating tumor cell (CTC) type, recently arose as a useful resourcefor monitoring and characterizing both cancers and their metastatic derivatives. However, due to the scarcity ofCCSCs among hematologic cells in the blood and the complexity of the phenotype confirmation process, CCSCresearch can be extremely challenging. Hence, we report a nanoparticle-mediated Raman imaging method forCCSC characterization which profiles CCSCs based on their surface marker expression phenotypes. We havedeveloped an integrated combinatorial Raman-Active Nanoprobe (RAN) system combined with a microfluidicchip to successfully process complete blood samples. CCSCs and CTCs were detected (90% efficiency) andclassified in accordance with their respective surface marker expression via completely distinct Raman signals ofRANs. Selectively isolated CCSCs (93% accuracy) were employed for both in vitro and in vivo tumor phenotypingto identify the tumorigenicity of the CCSCs. We utilized our new method to predict metastasis by screening bloodsamples from xenograft models, showing that upon CCSC detection, all subjects exhibited liver metastasis.Having highly efficient detection and noninvasive isolation capabilities, we have demonstrated that our RAN-based Raman imaging method will be valuable for predicting cancer metastasis and relapse via CCSC detection.Moreover, the exclusion of peak overlapping in CCSC analysis with our Raman imaging method will allow toexpand the RAN families for various cancer types, therefore, increasing therapeutic efficacy by providing de-tailed molecular features of tumor subtypes.
1. Introduction
Cancer stem cells (CSCs) refer to a small subset of tumor cells thathave the unique ability to self-renew and differentiate. Their self-re-newal process typically drives tumorigenesis and their differentiationprocess causes tumor heterogeneity (Jordan et al., 2006; Malanchiet al., 2012). CSCs can be identified by biomarkers showing stem-likecharacteristics, such as CD133 and CD44, which are responsible forstemness and pleiotropic roles in cell adhesion, migration, and homing(Mizrak et al., 2008; Zöller, 2011). Even though CSCs account for asmall fraction of tumor cell population (~1%), they are known to have
a critical role in cancer metastasis and relapse owing to their distinctiveabilities including self-renewal, differentiation, and chemoresistance(Medema, 2013; Melo et al., 2017; Moncharmont et al., 2012; Pathaniaet al., 2016; Visvader and Lindeman, 2008). For example, in the me-tastasis process, metastatic cancer cells, including CSCs, migrate alongvasculature in the lymph nodes to initiate tumor growth at secondaryorgan sites by extravasation (Maheswaran and Haber, 2010; Riethdorfet al., 2008). While it is known that most circulating tumor cells (CTCs)obtain a migratory cell fate and lose epithelial properties through theprocess of epithelial to mesenchymal transition (EMT), the metastaticprocess is enormously complex and highly dynamic (Maheswaran and
https://doi.org/10.1016/j.bios.2017.11.049Received 28 August 2017; Received in revised form 13 November 2017; Accepted 15 November 2017
⁎ Corresponding author at: Department of Chemistry and Chemical Biology, Rutgers, The State University of New Jersey, Piscataway, NJ 08854, USA.⁎⁎ Corresponding author. Department of Chemical and Biomolecular Engineering, Sogang University, Seoul, 04107, South Korea.
1 Equal contribution.2 http://kblee.rutgers.edu3 http://home.sogang.ac.kr/sites/nbel
E-mail addresses: [email protected] (K.-B. Lee), [email protected] (J.-W. Choi).
Biosensors and Bioelectronics 102 (2018) 372–382
Available online 16 November 20170956-5663/ © 2017 Elsevier B.V. All rights reserved.
T
Haber, 2010), thereby the detailed mechanisms underlying CTC mi-gration have not been well studied. Scientists have reported that only asmall subset of CTCs, categorized and termed circulating cancer stemcells (CCSCs), are involved in successful cancer metastasis, exhibitinghigh invasiveness (Cristofanilli et al., 2004; Kennecke et al., 2010;Malanchi et al., 2012). Given these extraordinary characteristics,combined with the important functions of CCSCs have in cancer me-tastasis, a highly selective detection and analysis method for the iso-lation of CCSCs from a heterogeneous CTC population is essential foradvancing cancer therapeutics and will providing new insights intocancer metastasis and relapse at the single cell levels (Nadal et al.,2013).
Due to the scarcity of CCSCs and CTCs among heterogeneous bloodcells, as few as one cell per 109 hematologic cells in the blood of pa-tients, simultaneous detection, isolation, and analysis of CCSCs andCTCs in a highly selective, sensitive, and non-invasive manner is ex-tremely challenging (Cristofanilli et al., 2004; Lawson et al., 2015;Nagrath et al., 2007). The fluorescence-activated cell sorting (FACS)method has been utilized for CCSC isolation and detection by com-paring a CSC marker (CD133 or CD44) with white blood cell (WBC)marker (CD45) expression (Al-Hajj et al., 2003; Ginestier et al., 2007;Kantara et al., 2015; Lawson et al., 2015; Liu et al., 2014). However, itis limited in validating primary cancer phenotypic characters con-sidering that CSC markers are expressed not only on CSCs but also onnormal stem cells (Pattabiraman and Weinberg, 2014). Therefore, it isnecessary to combine the CCSC and CTC detection for improving ac-curacy in CCSC research. For example, detecting and analyzing breastCCSCs and CTCs, which have four subtypes including luminal, humanepidermal growth factor receptor 2 (HER2) positive, and two triple-negative types (Basal-A and Basal-B), requires the use of a combinationof at least five antibodies (four antibodies for subtyping, epithelial celladhesion molecule (EpCAM), HER2, human epidermal growth factorreceptor 1 (EGFR), and mucin 1 (MUC1), and one antibody for stemnessconfirmation (CD133)) (Carey et al., 2007; Eirew et al., 2008; Kao et al.,2009; Kennecke et al., 2010; Neve et al., 2006; Perou et al., 2000)(Table 1). Therefore, simultaneous detection and analysis of varioussubtypes of CCSCs and CTCs, showing primary cancer's heterogeneityvia a multi-probe-based platform, requires an innovative method forefficient multiplex detection of subpopulations of heterogeneous cancercells and the analysis of a wide range of complex analytes.
To this end, several CTC detection chips using immune-affinity-based separation methods with multiple fluorescent probes have de-monstrated limited success for CCSC detection. (Lee et al., 2013a,2013b; Yoon et al., 2013). However, given the limitations of thefluorescent probe systems, it is difficult to analyze CTC subtypes withhigh isolation efficiency from blood, particularly for CCSCs with sig-nificantly different quantities which require an increase in the numberof probes. This is an especially critical challenge in multicolor analysis,where it is impossible to discriminate between fluorophores that spec-trally overlap (Lichtman and Conchello, 2005; Zhang et al., 2016).Therefore, there remains significant room for improvement in achievinghighly sensitive and specific cell detection methods that can displaybroad multiplexing capabilities with high reproducibility.
Raman imaging with surface-enhanced Raman spectroscopy (SERS)
has significant advantages when compared to fluorescence imaging,including spectral information that shows a larger number of char-acteristic peaks, and crucially, distinct non-overlapping peaks.(Papadopoulou and Bell, 2011; Sabatte et al., 2008; Ye et al., 2017; Zhaiet al., 2012; Zheng et al., 2012). Particularly, SERS has shown signalswith low background noise in biological samples including those drawnfrom blood by avoiding autofluorescent signals (Premasiri et al., 2012;Wang et al., 2011). These comprehensive advantages render SERS ashighly competitive in meeting the needs of multiplex quantification ofmolecules in living cells. However, to the best of our knowledge, aRaman imaging-based detection and analysis method of CCSC has notyet been reported. To detect and analyze CCSCs, three requirementsmust be satisfied for CTC research: a high detection yield of target cellsin the blood, non-invasive isolation of captured cells, and the simulta-neous detection of surface markers with different expression levels.
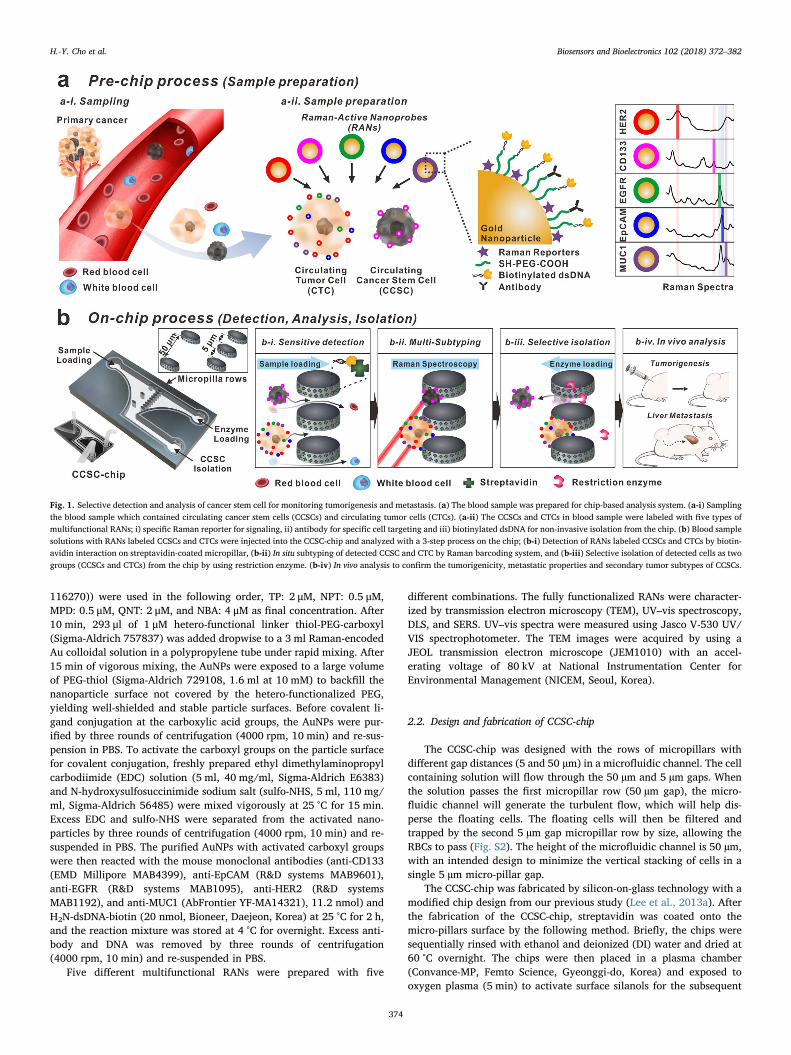
To address the aforementioned challenges for the detection anddownstream analysis of CCSCs and CTCs, we report a novel combina-torial Raman-Active Nanoprobe (RAN)-based chip platform with thecapability of simultaneous detection, isolation, and further analysis ofCCSCs and various CTC subtypes though Raman imaging (Fig. 1). TheRAN is a multifunctional probe designed with four tunable componentsincluding i) a Raman reporter as a barcoding component, ii) an anti-body as a cancer cell detecting component, iii) a biotinylated double-stranded DNA (dsDNA) as a non-invasive isolating component, and iv) agold nanoparticle as a Raman signal-enhancing component. In thisdemonstration, individually conjugated RANs are employed to detectboth CCSCs and several major breast cancer CTC subtypes using fivedifferent surface markers: CD133, EpCAM, EGFR, HER2, and MUC1(Fig. 1a). The CCSCs and CTCs are detected and isolated in an effective,selective, and noninvasive manner on the microfluidic chip via avidin-biotin reactions followed by restriction enzyme digestion of the dsDNAlinker from the RANs (Fig. 1b). We have shown that selectively isolatedCCSCs and CTCs successfully exhibit tumorigenicity and secondarytumor subtypes in both in vitro and in vivo model systems.
2. Materials and methods
2.1. Raman-active nanoprobe synthesis and characterization
In this work, we prepared five different combinations of RANs. Eachtype of RAN was conjugated with modification of a previously reportedmethod by Qian et al. (2008). Fig. S1a shows the illustrations of thestep-by-step conjugation process of the AuNP/Raman reporter/PEG/antibody/DNA conjugate. Briefly, RANs were prepared by adding afreshly prepared 1–5 μM Raman reporter solution dropwise to a rapidlymixing gold colloid at a 1:6 reporter solution and 60 nm AuNP colloid(BBI solutions EM.GC60, Cardiff, UK) volume ratio. Considering thateach Raman reporter shows different signal enhancement effects withAuNPs, the concentration of reporters was determined from the signalto noise (S/N) ratio of the representative peak for each RAN. Con-centrations of different Raman reporters (Thiophenol (TP, Sigma-Al-drich 240249), Nile Blue A (NBA, Sigma-Aldrich N0766), 1-naphtha-lenethiol (NPT, Sigma-Aldrich 724742), 4-mercaptopyridine (MPD,Sigma-Aldrich 148202), 2-quinolinethiol (QNT, Sigma-Aldrich
Table 1Classification of breast cancer based on pathological features. Depends on the surface marker expression profiles, the subtype of breast cancer was categorized.
Subtype Surface marker expression profile Reference
CD133 HER2 EGFR EpCAM MUC1
Cancer Stem Cells + (Jordan et al., 2006; Medema, 2013; Visvader and Lindeman, 2008)Luminal type – + (Carey et al., 2007; Kao et al., 2009; Neve et al., 2006)HER2 positive type + – (Carey et al., 2007; Kao et al., 2009; Neve et al., 2006)Basal-A type – + – + (Carey et al., 2007; Kao et al., 2009; Neve et al., 2006)Basal-B type – – + – – (Carey et al., 2007; Kao et al., 2009; Neve et al., 2006)
H.-Y. Cho et al. Biosensors and Bioelectronics 102 (2018) 372–382
373
116270)) were used in the following order, TP: 2 μM, NPT: 0.5 μM,MPD: 0.5 μM, QNT: 2 μM, and NBA: 4 μM as final concentration. After10 min, 293 μl of 1 μM hetero-functional linker thiol-PEG-carboxyl(Sigma-Aldrich 757837) was added dropwise to a 3 ml Raman-encodedAu colloidal solution in a polypropylene tube under rapid mixing. After15 min of vigorous mixing, the AuNPs were exposed to a large volumeof PEG-thiol (Sigma-Aldrich 729108, 1.6 ml at 10 mM) to backfill thenanoparticle surface not covered by the hetero-functionalized PEG,yielding well-shielded and stable particle surfaces. Before covalent li-gand conjugation at the carboxylic acid groups, the AuNPs were pur-ified by three rounds of centrifugation (4000 rpm, 10 min) and re-sus-pension in PBS. To activate the carboxyl groups on the particle surfacefor covalent conjugation, freshly prepared ethyl dimethylaminopropylcarbodiimide (EDC) solution (5 ml, 40 mg/ml, Sigma-Aldrich E6383)and N-hydroxysulfosuccinimide sodium salt (sulfo-NHS, 5 ml, 110 mg/ml, Sigma-Aldrich 56485) were mixed vigorously at 25 °C for 15 min.Excess EDC and sulfo-NHS were separated from the activated nano-particles by three rounds of centrifugation (4000 rpm, 10 min) and re-suspended in PBS. The purified AuNPs with activated carboxyl groupswere then reacted with the mouse monoclonal antibodies (anti-CD133(EMD Millipore MAB4399), anti-EpCAM (R&D systems MAB9601),anti-EGFR (R&D systems MAB1095), anti-HER2 (R&D systemsMAB1192), and anti-MUC1 (AbFrontier YF-MA14321), 11.2 nmol) andH2N-dsDNA-biotin (20 nmol, Bioneer, Daejeon, Korea) at 25 °C for 2 h,and the reaction mixture was stored at 4 °C for overnight. Excess anti-body and DNA was removed by three rounds of centrifugation(4000 rpm, 10 min) and re-suspended in PBS.
Five different multifunctional RANs were prepared with five
different combinations. The fully functionalized RANs were character-ized by transmission electron microscopy (TEM), UV–vis spectroscopy,DLS, and SERS. UV–vis spectra were measured using Jasco V-530 UV/VIS spectrophotometer. The TEM images were acquired by using aJEOL transmission electron microscope (JEM1010) with an accel-erating voltage of 80 kV at National Instrumentation Center forEnvironmental Management (NICEM, Seoul, Korea).
2.2. Design and fabrication of CCSC-chip
The CCSC-chip was designed with the rows of micropillars withdifferent gap distances (5 and 50 µm) in a microfluidic channel. The cellcontaining solution will flow through the 50 µm and 5 µm gaps. Whenthe solution passes the first micropillar row (50 µm gap), the micro-fluidic channel will generate the turbulent flow, which will help dis-perse the floating cells. The floating cells will then be filtered andtrapped by the second 5 µm gap micropillar row by size, allowing theRBCs to pass (Fig. S2). The height of the microfluidic channel is 50 µm,with an intended design to minimize the vertical stacking of cells in asingle 5 µm micro-pillar gap.
The CCSC-chip was fabricated by silicon-on-glass technology with amodified chip design from our previous study (Lee et al., 2013a). Afterthe fabrication of the CCSC-chip, streptavidin was coated onto themicro-pillars surface by the following method. Briefly, the chips weresequentially rinsed with ethanol and deionized (DI) water and dried at60 °C overnight. The chips were then placed in a plasma chamber(Convance-MP, Femto Science, Gyeonggi-do, Korea) and exposed tooxygen plasma (5 min) to activate surface silanols for the subsequent
Fig. 1. Selective detection and analysis of cancer stem cell for monitoring tumorigenesis and metastasis. (a) The blood sample was prepared for chip-based analysis system. (a-i) Samplingthe blood sample which contained circulating cancer stem cells (CCSCs) and circulating tumor cells (CTCs). (a-ii) The CCSCs and CTCs in blood sample were labeled with five types ofmultifunctional RANs; i) specific Raman reporter for signaling, ii) antibody for specific cell targeting and iii) biotinylated dsDNA for non-invasive isolation from the chip. (b) Blood samplesolutions with RANs labeled CCSCs and CTCs were injected into the CCSC-chip and analyzed with a 3-step process on the chip; (b-i) Detection of RANs labeled CCSCs and CTCs by biotin-avidin interaction on streptavidin-coated micropillar, (b-ii) In situ subtyping of detected CCSC and CTC by Raman barcoding system, and (b-iii) Selective isolation of detected cells as twogroups (CCSCs and CTCs) from the chip by using restriction enzyme. (b-iv) In vivo analysis to confirm the tumorigenicity, metastatic properties and secondary tumor subtypes of CCSCs.
H.-Y. Cho et al. Biosensors and Bioelectronics 102 (2018) 372–382
374
reaction. The chips were sequentially immersed in a 10% 3-amino-propyltriethoxysilane (APTES) solution (Sigma-Aldrich A3648), thor-oughly washed with DI water, and baked at 110 °C for 1 h. The silanizedchips were exposed to 2% glutaraldehyde solution (Sigma-AldrichG5882) in 100 mM phosphate buffer (pH 8.0) for 1 h, washed with PBS,and dried with nitrogen gas. 10 μM of streptavidin (Sigma-AldrichS0677) was allowed to react with immobilized glutaraldehyde at roomtemperature (1 h). After washing with PBS, the chips were covered with1% bovine serum albumin (Sigma-Aldrich A2153) in PBS (1 h) to blockany sites that proteins did not bind to on the glutaraldehyde modifiedsurface. Finally, the chips were washed with PBS solution and driedwith nitrogen gas.
2.3. Cell culture and preparation of cell suspension solution
Three human breast cancer cell lines (Korea Cell Line Bank (KCLB)30022), MDA-MB-231 (KCLB 30026) and SK-BR-3 (KCLB 30030)) wereobtained from KCLB (Seoul, Korea). MCF-7, MDA-MB-231, and SK-BR-3cell lines were grown in Roswell Park Memorial Institute (RPMI) 1640(ThermoFisher Scientific 11875-093). All media were supplementedwith 10% fetal bovine serum (FBS, Biowest S1520- 500) and 1%Penicillin-Streptomycin (ThermoFisher Scientific 15140163). Humanbreast CSC line and culture media were purchased from Celprogen(36102-29, Torrance, CA, USA). CSCs were cultured with maintenancemedia (Celprogen M36102-29S) to stabilize as an undifferentiatedcondition. Every cell line was grown in tissue culture plates (BDBiosciences, San Jose, CA, USA) in a 37 °C humidified incubator with5% CO2. At 80% confluence, the breast cancer cells were subcultured ata density of 1 × 10⁵ cells/ml and the breast CSCs at 1 × 10⁶ cells/mlon tissue culture plates, and the media were replaced every 3 days forthe three breast cancer cell lines and every 2 days for CSCs.
48 h after sub-culturing, the cells were detached from the tissueculture plates using trypsin (ThermoFisher Scientific 25300054), afterwhich it was washed twice with respective media to remove the de-taching agent, trypsin. The cell pellets were re-suspended in the re-spective media and the number of cells were counted with a hemo-cytometer. The concentration of each suspended cell solution wasmatched as 1 × 10⁴ cells/ml for next use.
2.4. Handling of healthy human blood
All healthy human blood samples were kindly donated from healthydonors through the Korea University (Seoul, Korea) with informedconsent under an Institutional Review Board (IRB)-approved researchprotocol. The blood samples were collected using BD Vacutainer® CPT™cell preparation tubes (BD 362753, Franklin Lakes, NJ, USA) containingsodium heparin and polyester gel. After gentle mixing, 4 ml of freshblood was gently diluted twice with PBS. According to the literature,CCSCs and CTCs were present in the buffy coat layer with WBCs,therefore, we used a density gradient reagent (Ficoll-Paque plus, GEHealthcare 17–1440-02, Pittsburgh, PA, USA) to get the WBCs con-tained buffy coat. In a centrifuge tube, 6 ml of Ficoll-Paque plus wasadded followed by carefully adding but not mixing 8 ml of dilutedblood and centrifugation at room temperature for 30 min at 400g. Aftercentrifugation, the plasma layer was removed carefully from the top,and the low-density buffy coat cell layer containing lymphocytes andmonocytes was collected while leaving the Ficoll and RBC sediment inthe centrifuge tube. After collection, the cells were transferred to a newtube, resuspended in 4 ml PBS, and stored at 4 °C for next use.
2.5. CCSCs and CTCs labeled with RNP and injected into CCSC-chip
100 suspended cells of each subtype (CCSC, MCF-7, SK-BR-3, andMDA-MB-231) were mixed with the WBC suspension solution and thenincubated with 10 pM. RANs with constant and gentle mixing for30 min at room temperature. Then, the RAN labeled-cells were washed
three times and resuspended in 400 μl of fresh culture medium. TheRAN labeled-cell suspensions (containing 100 labeled cells) were in-fused through the microfluidic channel at a flow rate 10 μl/min andincubated at room temperature for 20 min to immobilize on the chipsurface. Then the chip was washed with fresh culture medium to re-move the debris or unbound cells (Fig. S2).
2.6. Acquisition of SERS mapping image and data analysis
NTEGRA Spectra (AFM-Raman Spectrometer, NT-MDT, Russia)equipped with a liquid nitrogen-cooled CCD detector and an invertedoptical microscope (Olympus IX71) was used for SERS mapping thecells. SERS mapping images were acquired by scanning 1024 points (32× 32) using a 785 nm NIR laser with 3 mW and 3 s exposure time onthe sample plane. The SERS data was analyzed using Nova software(NT-MDT). After extracting 8 points of Raman spectra from the detectedCCSC or CTC, a S/N ratio was calculated for each spectrum and aver-aged. The noise signal was extracted from 8 points in the background(outside of cell area) of the detected cell's Raman map image.
2.7. DNA cleavage and release of CCSCs/CTCs
To evaluate the cleavage efficiency of DNA linkers, two restrictionenzymes, HindIII (New England BioLabs R0104S) and BamHI (NewEngland BioLabs R0136S), were subsequently treated on the CCSCs/CTCs detected in CCSC-chip. Enzyme solutions (500 unit/ml in NEBuffer2, New England BioLabs B7002S) flowed into the chip at a flowrate of 30 μl/min for 20 min at 37 °C. Released CTCs and CCSCs wereisolated in a conical tube and transferred to a tissue culture plate forenrichment and culturing.
2.8. CCSC differentiation
Approximately 10,000 CCSCs were seeded in the 12-well plates.After 2 days of cultivation to promote CCSC attachment, maintenancemedia was changed to human breast cancer stem cell differentiationmedia (Celprogen M36102-29DS, Torrance, CA, USA) to start differ-entiation of CCSC. Media was changed every 3 days during the differ-entiation.
2.9. In vivo tumorigenesis assay
To examine the tumorigenic and metastatic property of CCSC invivo, 6-week-old BALB/c nude mice were purchased from RaonBio(Yongin-si, Korea) (control, n = 4; xenograft with CCSCs, n = 9; xe-nograft). All animals were acclimatized to the animal facility for at least72 h prior to experimentation and maintained according to the Guidefor the Care and Use of Laboratory Animals published by the NIH. Everyanimal experiment was conducted under an Institutional Animal Careand Use Committee (IACUC)-approved research protocol. The animalswere housed in a barrier under high-efficiency particulate air (HEPA)filtration and provided with sterilized food and water ad libitum. Theanimal facility maintained 12 h light/dark cycles at room temperature21± 2 °C with 30–40% humidity. Approximately 5.0 × 10⁶ cells ofCD133 positive cells and CD133 negative cells were mixed with354234-matrigel (BD, San Jose, California, USA) and subcutaneouslyinjected into the left and right side of flanks nearby each leg. Nineweeks after inoculation, the grafted tumor tissues and livers were dis-sected and embedded in Tissue-Tek 100% optimal cutting temperaturecompound (O.C.T., Sakura Finetek, USA). Then the fresh tissue wasrapidly snap frozen by putting it into liquid nitrogen and stored in a−80 °C freezer until further analysis. Freshly cryopreserved tissueswere sliced (6 µm thick) using a −25 °C ultra-microtome (Leica CM3050S, Wetzlar, Germany). Each section was picked up on an adhesionmicroscope glass slide (Paul Mariendeld GmbH & Co. KG, Lauda-Königshofen, Germany) followed by the careful washing out of the
H.-Y. Cho et al. Biosensors and Bioelectronics 102 (2018) 372–382
375
O.C.T compound, with PBS. The sections were incubated with 2 mMprobe 1 for 2 h and covered with fluorescent slide cover glass. Thefluorescence microscopy images were taken using a confocal laserscanning microscope (LSM 5 Exciter, and LSM 710, Carl-Zeiss, Oberko,Germany). The mice that died before the 9-week mark were notcounted.
2.10. Statistical analysis
Statistical analyses were carried out using GraphPad Prism.Normality of distribution and homogeneity of variance were validatedand the statistical significance between the means was calculated usingunpaired Student's t-test or Mann-Whitney test when normality testsfailed. All numerical data presented with mean± s.e.m. P<0.05 wasconsidered statistically significant.
3. Results and discussion
3.1. Selective detection and analysis of CCSCs/CTCs using a combinatorialRAN-based CCSC-chip
To distinguish five different types of circulating breast cancer cellsincluding the CCSCs and four subtypes of CTCs, five RAN families weresynthesized (Fig. S1a). To construct our RAN, we first conjugated theRaman reporter onto the gold nanoparticles’ (AuNPs) surface by pairingthem with each antibody to enable the RANs to have unique spectral-molecular signatures (Table S1). After a short incubation, the AuNPsurface was coated with a thiol-terminated polyethylene glycol (thiol-PEG-carboxyl) to improve the stability of the RANs and prevent theiraggregation in complex biological solutions. Antibodies and double-stranded DNAs (NH2-dsDNA-Biotin) were conjugated to the PEG-con-jugated AuNPs through EDC-NHS reaction to target and detect CCSCs/CTCs. Two different sequences of dsDNAs (DNA-A for CTCs and DNA-Bfor CCSCs) were specifically designed to select and isolate CCSCs andCTCs, which would be cleaved with the presence of specific restrictionenzymes (Fig. S3). Through dynamic light scattering (DLS) analysis, thehydrodynamic size of RANs was determined to be 91.3± 2.3 nm (n =10) in diameter (Fig. S1b). This hydrodynamic size was corroborated bythe calculated value (94.2 nm), with a consideration of the length of thelinkers and antibodies. Surface functionalization of AuNP with Ramanreporters did not show any effect on the size distribution and mono-dispersity of the nanoparticle constructs as supported by TEM imaging(Fig. S1c).
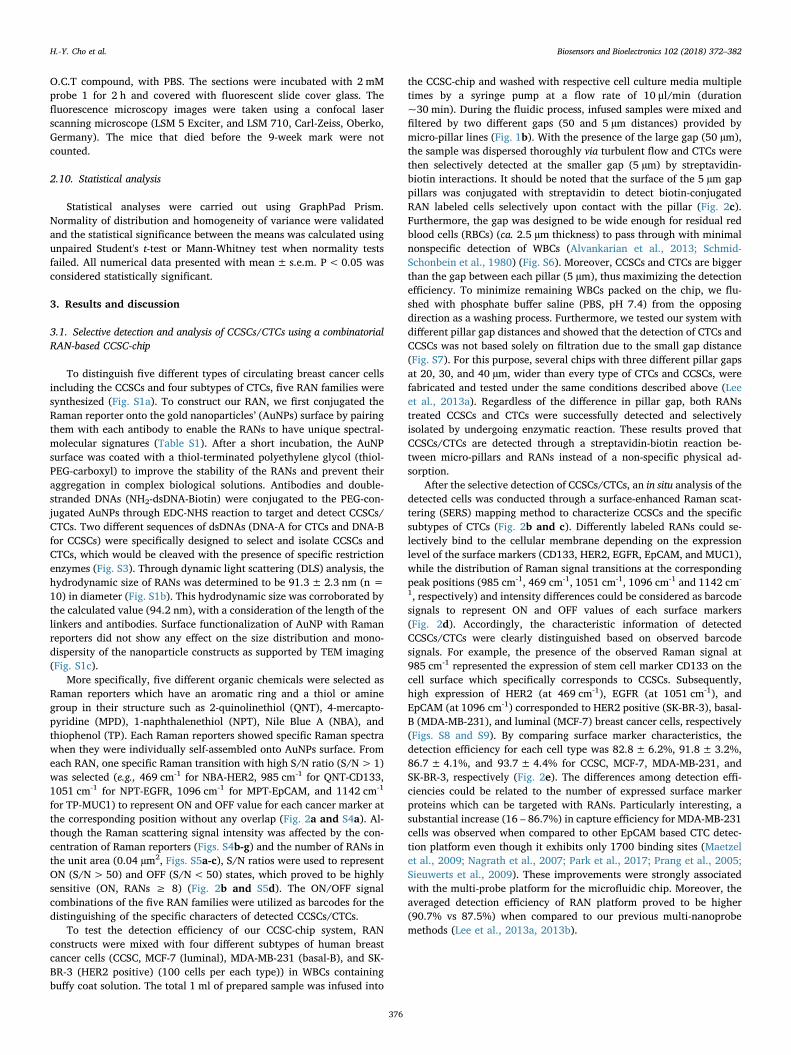
More specifically, five different organic chemicals were selected asRaman reporters which have an aromatic ring and a thiol or aminegroup in their structure such as 2-quinolinethiol (QNT), 4-mercapto-pyridine (MPD), 1-naphthalenethiol (NPT), Nile Blue A (NBA), andthiophenol (TP). Each Raman reporters showed specific Raman spectrawhen they were individually self-assembled onto AuNPs surface. Fromeach RAN, one specific Raman transition with high S/N ratio (S/N>1)was selected (e.g., 469 cm-1 for NBA-HER2, 985 cm-1 for QNT-CD133,1051 cm-1 for NPT-EGFR, 1096 cm-1 for MPT-EpCAM, and 1142 cm-1
for TP-MUC1) to represent ON and OFF value for each cancer marker atthe corresponding position without any overlap (Fig. 2a and S4a). Al-though the Raman scattering signal intensity was affected by the con-centration of Raman reporters (Figs. S4b-g) and the number of RANs inthe unit area (0.04 µm2, Figs. S5a-c), S/N ratios were used to representON (S/N>50) and OFF (S/N<50) states, which proved to be highlysensitive (ON, RANs ≥ 8) (Fig. 2b and S5d). The ON/OFF signalcombinations of the five RAN families were utilized as barcodes for thedistinguishing of the specific characters of detected CCSCs/CTCs.
To test the detection efficiency of our CCSC-chip system, RANconstructs were mixed with four different subtypes of human breastcancer cells (CCSC, MCF-7 (luminal), MDA-MB-231 (basal-B), and SK-BR-3 (HER2 positive) (100 cells per each type)) in WBCs containingbuffy coat solution. The total 1 ml of prepared sample was infused into
the CCSC-chip and washed with respective cell culture media multipletimes by a syringe pump at a flow rate of 10 μl/min (duration~30 min). During the fluidic process, infused samples were mixed andfiltered by two different gaps (50 and 5 µm distances) provided bymicro-pillar lines (Fig. 1b). With the presence of the large gap (50 µm),the sample was dispersed thoroughly via turbulent flow and CTCs werethen selectively detected at the smaller gap (5 µm) by streptavidin-biotin interactions. It should be noted that the surface of the 5 µm gappillars was conjugated with streptavidin to detect biotin-conjugatedRAN labeled cells selectively upon contact with the pillar (Fig. 2c).Furthermore, the gap was designed to be wide enough for residual redblood cells (RBCs) (ca. 2.5 µm thickness) to pass through with minimalnonspecific detection of WBCs (Alvankarian et al., 2013; Schmid-Schonbein et al., 1980) (Fig. S6). Moreover, CCSCs and CTCs are biggerthan the gap between each pillar (5 µm), thus maximizing the detectionefficiency. To minimize remaining WBCs packed on the chip, we flu-shed with phosphate buffer saline (PBS, pH 7.4) from the opposingdirection as a washing process. Furthermore, we tested our system withdifferent pillar gap distances and showed that the detection of CTCs andCCSCs was not based solely on filtration due to the small gap distance(Fig. S7). For this purpose, several chips with three different pillar gapsat 20, 30, and 40 µm, wider than every type of CTCs and CCSCs, werefabricated and tested under the same conditions described above (Leeet al., 2013a). Regardless of the difference in pillar gap, both RANstreated CCSCs and CTCs were successfully detected and selectivelyisolated by undergoing enzymatic reaction. These results proved thatCCSCs/CTCs are detected through a streptavidin-biotin reaction be-tween micro-pillars and RANs instead of a non-specific physical ad-sorption.
After the selective detection of CCSCs/CTCs, an in situ analysis of thedetected cells was conducted through a surface-enhanced Raman scat-tering (SERS) mapping method to characterize CCSCs and the specificsubtypes of CTCs (Fig. 2b and c). Differently labeled RANs could se-lectively bind to the cellular membrane depending on the expressionlevel of the surface markers (CD133, HER2, EGFR, EpCAM, and MUC1),while the distribution of Raman signal transitions at the correspondingpeak positions (985 cm-1, 469 cm-1, 1051 cm-1, 1096 cm-1 and 1142 cm-
1, respectively) and intensity differences could be considered as barcodesignals to represent ON and OFF values of each surface markers(Fig. 2d). Accordingly, the characteristic information of detectedCCSCs/CTCs were clearly distinguished based on observed barcodesignals. For example, the presence of the observed Raman signal at985 cm-1 represented the expression of stem cell marker CD133 on thecell surface which specifically corresponds to CCSCs. Subsequently,high expression of HER2 (at 469 cm-1), EGFR (at 1051 cm-1), andEpCAM (at 1096 cm-1) corresponded to HER2 positive (SK-BR-3), basal-B (MDA-MB-231), and luminal (MCF-7) breast cancer cells, respectively(Figs. S8 and S9). By comparing surface marker characteristics, thedetection efficiency for each cell type was 82.8± 6.2%, 91.8± 3.2%,86.7±4.1%, and 93.7± 4.4% for CCSC, MCF-7, MDA-MB-231, andSK-BR-3, respectively (Fig. 2e). The differences among detection effi-ciencies could be related to the number of expressed surface markerproteins which can be targeted with RANs. Particularly interesting, asubstantial increase (16 – 86.7%) in capture efficiency for MDA-MB-231cells was observed when compared to other EpCAM based CTC detec-tion platform even though it exhibits only 1700 binding sites (Maetzelet al., 2009; Nagrath et al., 2007; Park et al., 2017; Prang et al., 2005;Sieuwerts et al., 2009). These improvements were strongly associatedwith the multi-probe platform for the microfluidic chip. Moreover, theaveraged detection efficiency of RAN platform proved to be higher(90.7% vs 87.5%) when compared to our previous multi-nanoprobemethods (Lee et al., 2013a, 2013b).
H.-Y. Cho et al. Biosensors and Bioelectronics 102 (2018) 372–382
376
3.2. Selective and noninvasive isolation of CCSCs/CTCs for prediction ofsecondary tumor subtype
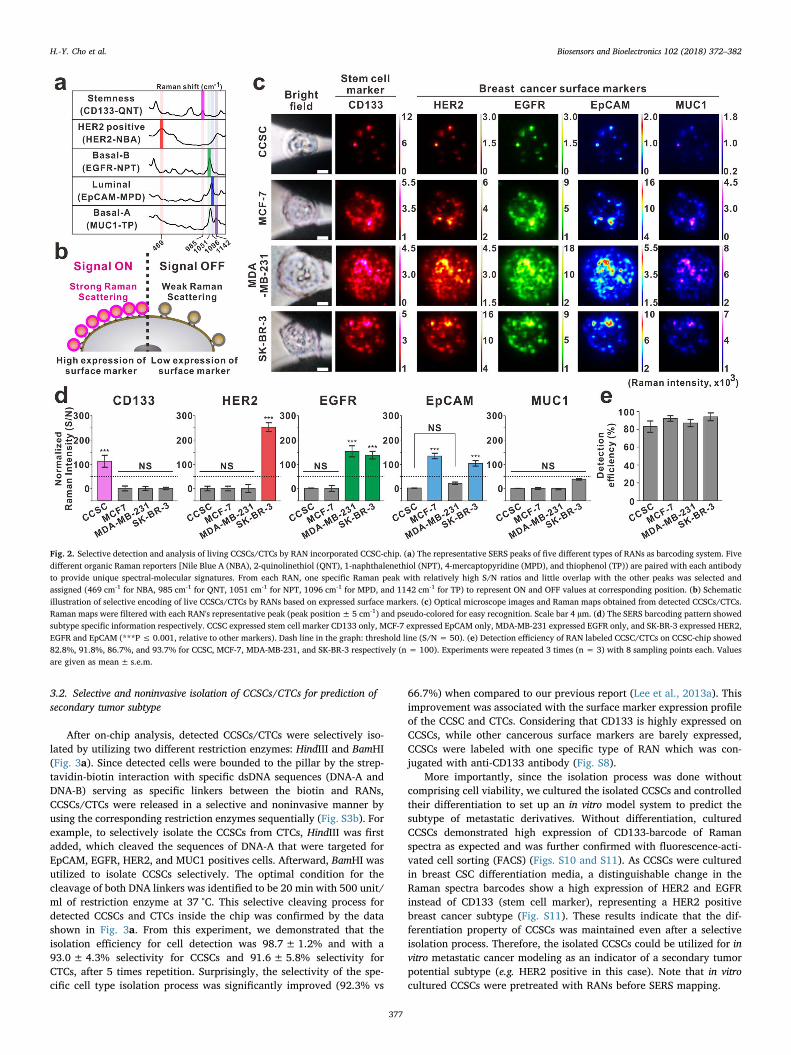
After on-chip analysis, detected CCSCs/CTCs were selectively iso-lated by utilizing two different restriction enzymes: HindIII and BamHI(Fig. 3a). Since detected cells were bounded to the pillar by the strep-tavidin-biotin interaction with specific dsDNA sequences (DNA-A andDNA-B) serving as specific linkers between the biotin and RANs,CCSCs/CTCs were released in a selective and noninvasive manner byusing the corresponding restriction enzymes sequentially (Fig. S3b). Forexample, to selectively isolate the CCSCs from CTCs, HindIII was firstadded, which cleaved the sequences of DNA-A that were targeted forEpCAM, EGFR, HER2, and MUC1 positives cells. Afterward, BamHI wasutilized to isolate CCSCs selectively. The optimal condition for thecleavage of both DNA linkers was identified to be 20 min with 500 unit/ml of restriction enzyme at 37 °C. This selective cleaving process fordetected CCSCs and CTCs inside the chip was confirmed by the datashown in Fig. 3a. From this experiment, we demonstrated that theisolation efficiency for cell detection was 98.7± 1.2% and with a93.0±4.3% selectivity for CCSCs and 91.6±5.8% selectivity forCTCs, after 5 times repetition. Surprisingly, the selectivity of the spe-cific cell type isolation process was significantly improved (92.3% vs
66.7%) when compared to our previous report (Lee et al., 2013a). Thisimprovement was associated with the surface marker expression profileof the CCSC and CTCs. Considering that CD133 is highly expressed onCCSCs, while other cancerous surface markers are barely expressed,CCSCs were labeled with one specific type of RAN which was con-jugated with anti-CD133 antibody (Fig. S8).
More importantly, since the isolation process was done withoutcomprising cell viability, we cultured the isolated CCSCs and controlledtheir differentiation to set up an in vitro model system to predict thesubtype of metastatic derivatives. Without differentiation, culturedCCSCs demonstrated high expression of CD133-barcode of Ramanspectra as expected and was further confirmed with fluorescence-acti-vated cell sorting (FACS) (Figs. S10 and S11). As CCSCs were culturedin breast CSC differentiation media, a distinguishable change in theRaman spectra barcodes show a high expression of HER2 and EGFRinstead of CD133 (stem cell marker), representing a HER2 positivebreast cancer subtype (Fig. S11). These results indicate that the dif-ferentiation property of CCSCs was maintained even after a selectiveisolation process. Therefore, the isolated CCSCs could be utilized for invitro metastatic cancer modeling as an indicator of a secondary tumorpotential subtype (e.g. HER2 positive in this case). Note that in vitrocultured CCSCs were pretreated with RANs before SERS mapping.
Fig. 2. Selective detection and analysis of living CCSCs/CTCs by RAN incorporated CCSC-chip. (a) The representative SERS peaks of five different types of RANs as barcoding system. Fivedifferent organic Raman reporters [Nile Blue A (NBA), 2-quinolinethiol (QNT), 1-naphthalenethiol (NPT), 4-mercaptopyridine (MPD), and thiophenol (TP)) are paired with each antibodyto provide unique spectral-molecular signatures. From each RAN, one specific Raman peak with relatively high S/N ratios and little overlap with the other peaks was selected andassigned (469 cm-1 for NBA, 985 cm-1 for QNT, 1051 cm-1 for NPT, 1096 cm-1 for MPD, and 1142 cm-1 for TP) to represent ON and OFF values at corresponding position. (b) Schematicillustration of selective encoding of live CCSCs/CTCs by RANs based on expressed surface markers. (c) Optical microscope images and Raman maps obtained from detected CCSCs/CTCs.Raman maps were filtered with each RAN's representative peak (peak position± 5 cm-1) and pseudo-colored for easy recognition. Scale bar 4 µm. (d) The SERS barcoding pattern showedsubtype specific information respectively. CCSC expressed stem cell marker CD133 only, MCF-7 expressed EpCAM only, MDA-MB-231 expressed EGFR only, and SK-BR-3 expressed HER2,EGFR and EpCAM (***P ≤ 0.001, relative to other markers). Dash line in the graph: threshold line (S/N = 50). (e) Detection efficiency of RAN labeled CCSC/CTCs on CCSC-chip showed82.8%, 91.8%, 86.7%, and 93.7% for CCSC, MCF-7, MDA-MB-231, and SK-BR-3 respectively (n = 100). Experiments were repeated 3 times (n = 3) with 8 sampling points each. Valuesare given as mean± s.e.m.
H.-Y. Cho et al. Biosensors and Bioelectronics 102 (2018) 372–382
377

Once in vitro confirmation was completed, the tumorigenic proper-ties of the isolated CCSCs and stemless CTCs were further investigatedusing an in vivo animal model. Selectively isolated and expanded CCSCsand CTCs (5 × 10⁵ cells each) were transplanted into male nude mice(n = 9) using subcutaneous injections at the left and right flank regions,respectively (Fig. 3b). We carefully selected a male nude mouse as amouse model to prevent unexpected tumorigenesis caused by femalemouse sex hormones (Caceres et al., 2016; Mohibi et al., 2011). Afternine weeks, the tumor xenograft from the CCSCs injection site grew sixtimes bigger in volume than the injection site of CTCs (Fig. 3b and c).The average size of the CCSC tumors was 10 mm in diameter with anaverage mass of 0.2 g, while tumors with stemless CTCs grew up to3 mm with an average mass of 0.01 g (Fig. 3d). To conduct a morecomprehensive study, the composition of the tumor developed byCCSCs was characterized by immunofluorescence staining of thin tumor
slices (Fig. 3e). The immunostaining results of CCSC induced-tumorshowed that the tumor cells were heterogeneous with a CSC population(CD133+ and CD44+/CD24-/low) as well as different subtype specificbreast cancers, including HER2 positive (HER2+) and basal-B (EGFR+,and MUC1-), which were derived from CCSCs. This result further sup-ported that transplanted CCSCs could proliferate as well as differentiateinto subtype-specific cancer cells in vivo. Furthermore, since the in vitrobiomarker expression patterns of differentiated CCSCs was quite similarwith the in vivo results, we believe that an in vitro CCSC differentiationassay with our SERS-based barcode screening method can be utilized asan innovative tool for predicting secondary tumor compositions (Figs.S11 and 3e). Taken all together, noninvasively isolated CCSCs havegreat potential for advancing personalized medicine via identifying theheterogeneity of metastatic derivatives using both in vitro and in vivocancer models.
Fig. 3. In vivo tumorigenesis property of CCSCs and CTCs. (a) Schematic illustration and optical microscopy images of restriction enzyme-mediated selective cell retrieval process. (a-i)CCSC (white arrow) and CTCs (red arrows) were detected on pillar surfaces. (a-ii) HindIII was treated to cleave the dsDNA which conjugated with RAN-EpCAM, RAN-EGFR, RAN-MUC1,and RAN-HER2. After the washing step, every CTCs were successfully isolated except the CCSC. (a-iii) To isolate the remaining CCSC on a chip, BamHI was treated. Each restrictionenzymes treated for 30 min at 37 °C. Scale bar = 20 µm. (b) Selectively isolated CCSCs and CTCs were subcutaneously injected mice right after the injection (0 week) and 9th week (leftside (L): CCSCs (CD133+), right flank (R); CTCs (CD133-)). The White circle indicates cell injected site. The inserted image showed extracted tumors from mice at 9th week (ruler:millimeter scale). (c) CCSCs showed significant tumorigenic property compare to CTCs. The size of the tumor was quantified at various time points. (d) Wet tissue weight of extractedtumor from each flank side of mouse 9 weeks after the cell injection. Data are means± s.e.m. n = 9 (**0.001<P ≤ 0.005, *** P ≤ 0.001, student's t-test), (e) Immunofluorescenceimage of surface markers expression in the tumor from CCSC injected site. Stem cell markers (CD133+ and CD44+/CD24-/low) were still strongly expressed with HER2 expression. Scalebar = 100 µm.
H.-Y. Cho et al. Biosensors and Bioelectronics 102 (2018) 372–382
378

In parallel, since we observed that CTCs could also generate tumorsin an in vivo environment, the tumorigenic property of CTCs was in-vestigated in detail. Three subtypes of breast cancer cells (MCF-7, MDA-MB-231, and SK-BR-3) and a normal breast epithelial cell line (humanmammary epithelial cell, HMEC) (5 × 10⁵ cells each) were implantedin male nude mice (n = 8) at both shoulders (left and right) and flankregions (left and right) (Fig. S12a). Nine weeks later, the injected MDA-MB-231 and MCF-7 cells generated a tumor at the injection site. In-terestingly, SK-BR-3 and HMEC cells vanished two weeks post-injectionand did not generate any tumors (Fig. S12b). However, MDA-MB-231cells generated tumors larger (13 mm and 0.6 g) than the tumors gen-erated by CCSCs. We speculated that this result might be due to thebasal type cell line MDA-MB-231 showing a subpopulation of more than90% CD44+/CD24-/low, which is indicative of prospective CSCs whichhave high tumorigenicity (Cheang et al., 2008; Fillmore andKuperwasser, 2008; Karnoub et al., 2007). We also studied the meta-bolic abilities of injected CCSCs and CTCs. For this purpose, each sub-type of cells was pre-cultured on an ultra-hydrophobic chamber (1 ×10⁵ cells in 6 well-plate) to monitor the formation of spheroid shapedclusters. The spheroid formation was clearly observed from the CCSCsand MCF-7 cells, while MDA-MB-231 and SK-BR-3 cells could notgenerate spheroids (Fig. S13a). Indeed, “spheroids” or “sphere-formingcells” are commonly found in various solid tumor samples (ascites) andpostulated as a key participant for in vivo tumorigenesis and metastasis(Leis et al., 2012; Wang et al., 2013). Moreover, we monitored thespreading speeds of CCSC and MCF-7 spheroids to confirm malignancyof the cancer cells for 21 h. The spreading speed of CCSC spheroid wasdramatically faster than that of MCF-7 due to possible metabolic dif-ferences, which are known to affect the ability of cancer cells to survive,proliferate, and invade (Wiercinska et al., 2011) (Fig. S13b). Interest-ingly, the invasiveness of CCSC spheroid was improved in the three-dimensional environment conditions generated by a Matrigel block(Fig. S13c). Our results not only proved that CCSCs exhibit metabolicattributes that promote their ability to survive and generate a tumor invivo, but also supports that the stem-like properties of CTCs are morecritically related to secondary tumor formation. Lastly, the xenograftmodel of tumorigenesis was obtained from a fixed cell concentration (5× 10⁵ cells), hence tumorigenesis results could also vary for differentcell concentration conditions.
3.3. Analysis of tumor metastasis risk by identifying CCSCs/CTCs
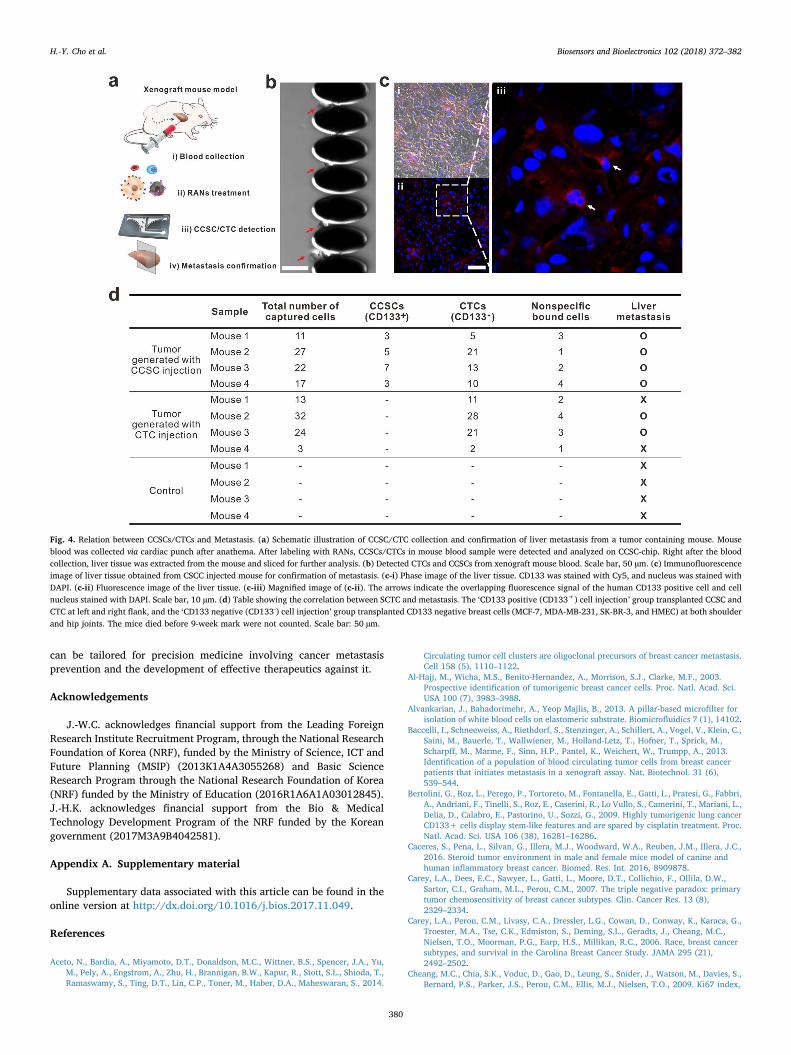
As a genuine metastatic cancer model system, blood samples(1.8 ml) were collected by cardiac puncture from xenograft modelssubjected to CCSCs and CTCs injections after clear tumor observation(Fig. 4). After incubating with RANs, 1.0 ml of RAN-labeled bloodplasma was injected into our CCSC-chip with an optimized flow rate of10 μl/min (Fig. 4a). Approximately 35 circulating epithelial cells weredetected from both samples with a different distribution of Ramanbarcode signals observed (Fig. 4b). Both CCSCs and CTCs (HER2 posi-tive) were detected from the CCSC injected xenograft model. On theother hand, in the various subtypes of mixed CTC injected xenograftmodels, only basal-B subtype CTCs were detected. Since the CCSCs andCTCs were observed from blood samples from animal disease models,we postulated that tumor metastasis was possible (Aceto et al., 2014;Baccelli et al., 2013). To verify the relationship between CCSC/CTC andtumor metastasis, liver tissues were extracted from the mouse modelafter euthanasia and tissue slices were generated as a standard model.Fluorescence images of thin liver sections (5 µm) showed remarkableexpression of the anti-human CD133 marker (Cy3 labeled) in the liver,which was considered as direct evidence for the liver metastasis of thetransplanted CCSCs (Fig. 4c). In particular, even though the totalnumber of detected CCSCs and CTCs from each group were similar(negative = 18, positive = 19.25), the observed metastatic propertywas significantly different. Notably, when CCSCs were observedthrough the chip, a 100% rate of liver metastasis was observed while
only 50% of liver metastasis was observed in the absence of CCSCs(Fig. 4d).
4. Conclusion
The advancement of precision medicine for the effective treatmentof individual cancer patients essentially requires the development of aninnovative method to detect CCSCs, as well as multiple CTC subtypes,with high sensitivity, to isolate their subpopulations selectively, andanalyze their molecular features as well as their metastatic abilities inan accurate and non-invasive manner. To address the above challenges,here, we have demonstrated the selective detection and accurate ana-lysis of the heterogeneous tumorigenic properties of CCSCs and CTCs byusing a novel combinatorial RANs-based chip platform. Regarding theclassification of breast cancer subtypes, basal type is considered as atriple-negative breast cancer due to a negative estrogen receptor (ER),progesterone receptor (PR), and HER2. The basal type expressing EGFRwas further categorized into two subgroups; basal-A and basal-B. Theexpression of MUC1 was distinguished between basal-A (positive) and B(negative) (Kao et al., 2009). Accordingly, we chose MUC1 as a specificmarker for basal-A and EGFR for basal-B (Kao et al., 2009). In this work,to cover the whole range of breast cancer subtypes and to confirm thestemness of CCSCs, we carefully designed five different RANs that canidentify each CTC subtype and CCSC's stemness.
Furthermore, blood samples from either xenograft animal models orhuman patients can be mixed with our designed RANs to simulta-neously detect, characterize, and isolate CCSCs and CTCs withoutcompromising cell viability. Combinatorial RANs, each labeled withfive Raman reporters, have unique Raman spectra which allow fordistinguishing the five-different biomarker signals with minimumoverlapping. Whole subtypes of breast CCSCs and CTCs were detectedwith ca. 90% efficiency and each cell subtype could be further char-acterized by Raman spectroscopy including luminal, HER2 positive,basal-A, and basal-B. The subtypes of breast cancers were known tohave different functions and molecular characteristics in metastasis(Kennecke et al., 2010), population (Carey et al., 2006; Millikan et al.,2008), survival (Cheang et al., 2009; Cristofanilli et al., 2004; Hu et al.,2006; Perou et al., 2000; Sorlie et al., 2001), and response to treatment(Carey et al., 2007; Hugh et al., 2009; Nielsen et al., 2010; Prat et al.,2010). Furthermore, confirmation of CCSCs population in CTCs canprovide a new insight into understanding a patient's metastatic status indetail. Although many clinical researchers have been investigating theprognostic relevance of CTCs in breast cancer and have suggested thatCTCs can serve as valuable prognostic markers in all stages of breastcancer, the confirmation of CTC stemness, most relevant to the meta-static tumor type, has not been studied yet (Cristofanilli et al., 2004;Eroglu et al., 2013; Hayes et al., 2006; Janni et al., 2016; Pierga et al.,2008; Riethdorf et al., 2007). Therefore, our developed method willenable scientists to investigate the heterogeneous tumorigenicity ofCTCs, which can then facilitate the study of chemotherapeutic effectson cancer metastasis, therefore improving the survival rate of cancerpatients. Moreover, the differentiation profile of isolated CCSCs showssimilar tumor subtypes in subcutaneously CCSC transplanted sites of themouse model. This result illustrates that the analysis of differentiatedCCSC can provide the subtype of the secondary tumor without con-ducting a biopsy.
In conclusion, our combinatorial RAN-based CCSC-chip will be va-luable for a multi-detection system that can provide accurate cancerdiagnosis and prognosis. Since CCSC marker in our method, CD133(prominin-1), is widely believed to be a CSC marker in various solidtumor types such as breast (Nadal et al., 2013), colorectal (Lugli et al.,2010), brain (Singh et al., 2003), prostate (Collins et al., 2005), andlung cancer (Bertolini et al., 2009), the RAN-based CCSC-chip is able toapply for CCSC detection for other cancer types. We believe that ourdeveloped method is especially powerful for predicting tumor's meta-static capabilities through efficient CCSC/CTC detection, therefore, it
H.-Y. Cho et al. Biosensors and Bioelectronics 102 (2018) 372–382
379
can be tailored for precision medicine involving cancer metastasisprevention and the development of effective therapeutics against it.
Acknowledgements
J.-W.C. acknowledges financial support from the Leading ForeignResearch Institute Recruitment Program, through the National ResearchFoundation of Korea (NRF), funded by the Ministry of Science, ICT andFuture Planning (MSIP) (2013K1A4A3055268) and Basic ScienceResearch Program through the National Research Foundation of Korea(NRF) funded by the Ministry of Education (2016R1A6A1A03012845).J.-H.K. acknowledges financial support from the Bio & MedicalTechnology Development Program of the NRF funded by the Koreangovernment (2017M3A9B4042581).
Appendix A. Supplementary material
Supplementary data associated with this article can be found in theonline version at http://dx.doi.org/10.1016/j.bios.2017.11.049.
References
Aceto, N., Bardia, A., Miyamoto, D.T., Donaldson, M.C., Wittner, B.S., Spencer, J.A., Yu,M., Pely, A., Engstrom, A., Zhu, H., Brannigan, B.W., Kapur, R., Stott, S.L., Shioda, T.,Ramaswamy, S., Ting, D.T., Lin, C.P., Toner, M., Haber, D.A., Maheswaran, S., 2014.
Circulating tumor cell clusters are oligoclonal precursors of breast cancer metastasis.Cell 158 (5), 1110–1122.
Al-Hajj, M., Wicha, M.S., Benito-Hernandez, A., Morrison, S.J., Clarke, M.F., 2003.Prospective identification of tumorigenic breast cancer cells. Proc. Natl. Acad. Sci.USA 100 (7), 3983–3988.
Alvankarian, J., Bahadorimehr, A., Yeop Majlis, B., 2013. A pillar-based microfilter forisolation of white blood cells on elastomeric substrate. Biomicrofluidics 7 (1), 14102.
Baccelli, I., Schneeweiss, A., Riethdorf, S., Stenzinger, A., Schillert, A., Vogel, V., Klein, C.,Saini, M., Bauerle, T., Wallwiener, M., Holland-Letz, T., Hofner, T., Sprick, M.,Scharpff, M., Marme, F., Sinn, H.P., Pantel, K., Weichert, W., Trumpp, A., 2013.Identification of a population of blood circulating tumor cells from breast cancerpatients that initiates metastasis in a xenograft assay. Nat. Biotechnol. 31 (6),539–544.
Bertolini, G., Roz, L., Perego, P., Tortoreto, M., Fontanella, E., Gatti, L., Pratesi, G., Fabbri,A., Andriani, F., Tinelli, S., Roz, E., Caserini, R., Lo Vullo, S., Camerini, T., Mariani, L.,Delia, D., Calabro, E., Pastorino, U., Sozzi, G., 2009. Highly tumorigenic lung cancerCD133+ cells display stem-like features and are spared by cisplatin treatment. Proc.Natl. Acad. Sci. USA 106 (38), 16281–16286.
Caceres, S., Pena, L., Silvan, G., Illera, M.J., Woodward, W.A., Reuben, J.M., Illera, J.C.,2016. Steroid tumor environment in male and female mice model of canine andhuman inflammatory breast cancer. Biomed. Res. Int. 2016, 8909878.
Carey, L.A., Dees, E.C., Sawyer, L., Gatti, L., Moore, D.T., Collichio, F., Ollila, D.W.,Sartor, C.I., Graham, M.L., Perou, C.M., 2007. The triple negative paradox: primarytumor chemosensitivity of breast cancer subtypes. Clin. Cancer Res. 13 (8),2329–2334.
Carey, L.A., Perou, C.M., Livasy, C.A., Dressler, L.G., Cowan, D., Conway, K., Karaca, G.,Troester, M.A., Tse, C.K., Edmiston, S., Deming, S.L., Geradts, J., Cheang, M.C.,Nielsen, T.O., Moorman, P.G., Earp, H.S., Millikan, R.C., 2006. Race, breast cancersubtypes, and survival in the Carolina Breast Cancer Study. JAMA 295 (21),2492–2502.
Cheang, M.C., Chia, S.K., Voduc, D., Gao, D., Leung, S., Snider, J., Watson, M., Davies, S.,Bernard, P.S., Parker, J.S., Perou, C.M., Ellis, M.J., Nielsen, T.O., 2009. Ki67 index,
Fig. 4. Relation between CCSCs/CTCs and Metastasis. (a) Schematic illustration of CCSC/CTC collection and confirmation of liver metastasis from a tumor containing mouse. Mouseblood was collected via cardiac punch after anathema. After labeling with RANs, CCSCs/CTCs in mouse blood sample were detected and analyzed on CCSC-chip. Right after the bloodcollection, liver tissue was extracted from the mouse and sliced for further analysis. (b) Detected CTCs and CCSCs from xenograft mouse blood. Scale bar, 50 µm. (c) Immunofluorescenceimage of liver tissue obtained from CSCC injected mouse for confirmation of metastasis. (c-i) Phase image of the liver tissue. CD133 was stained with Cy5, and nucleus was stained withDAPI. (c-ii) Fluorescence image of the liver tissue. (c-iii) Magnified image of (c-ii). The arrows indicate the overlapping fluorescence signal of the human CD133 positive cell and cellnucleus stained with DAPI. Scale bar, 10 µm. (d) Table showing the correlation between SCTC and metastasis. The ‘CD133 positive (CD133+) cell injection’ group transplanted CCSC andCTC at left and right flank, and the ‘CD133 negative (CD133-) cell injection’ group transplanted CD133 negative breast cells (MCF-7, MDA-MB-231, SK-BR-3, and HMEC) at both shoulderand hip joints. The mice died before 9-week mark were not counted. Scale bar: 50 µm.
H.-Y. Cho et al. Biosensors and Bioelectronics 102 (2018) 372–382
380
HER2 status, and prognosis of patients with luminal B breast cancer. J. Natl. CancerInst. 101 (10), 736–750.
Cheang, M.C., Voduc, D., Bajdik, C., Leung, S., McKinney, S., Chia, S.K., Perou, C.M.,Nielsen, T.O., 2008. Basal-like breast cancer defined by five biomarkers has superiorprognostic value than triple-negative phenotype. Clin. Cancer Res. 14 (5),1368–1376.
Collins, A.T., Berry, P.A., Hyde, C., Stower, M.J., Maitland, N.J., 2005. Prospectiveidentification of tumorigenic prostate cancer stem cells. Cancer Res. 65 (23),10946–10951.
Cristofanilli, M., Budd, G.T., Ellis, M.J., Stopeck, A., Matera, J., Miller, M.C., Reuben,J.M., Doyle, G.V., Allard, W.J., Terstappen, L.W., Hayes, D.F., 2004. Circulatingtumor cells, disease progression, and survival in metastatic breast cancer. N. Engl. J.Med. 351 (8), 781–791.
Eirew, P., Stingl, J., Raouf, A., Turashvili, G., Aparicio, S., Emerman, J.T., Eaves, C.J.,2008. A method for quantifying normal human mammary epithelial stem cells with invivo regenerative ability. Nat. Med. 14 (12), 1384–1389.
Eroglu, Z., Fielder, O., Somlo, G., 2013. Analysis of circulating tumor cells in breastcancer. J. Natl. Compr. Cancer Netw. 11 (8), 977–985.
Fillmore, C.M., Kuperwasser, C., 2008. Human breast cancer cell lines contain stem-likecells that self-renew, give rise to phenotypically diverse progeny and survive che-motherapy. Breast Cancer Res. 10 (2), R25.
Ginestier, C., Hur, M.H., Charafe-Jauffret, E., Monville, F., Dutcher, J., Brown, M.,Jacquemier, J., Viens, P., Kleer, C.G., Liu, S., Schott, A., Hayes, D., Birnbaum, D.,Wicha, M.S., Dontu, G., 2007. ALDH1 is a marker of normal and malignant humanmammary stem cells and a predictor of poor clinical outcome. Cell Stem Cell 1 (5),555–567.
Hayes, D.F., Cristofanilli, M., Budd, G.T., Ellis, M.J., Stopeck, A., Miller, M.C., Matera, J.,Allard, W.J., Doyle, G.V., Terstappen, L.W., 2006. Circulating tumor cells at eachfollow-up time point during therapy of metastatic breast cancer patients predictprogression-free and overall survival. Clin. Cancer Res. 12 (14 Pt 1), 4218–4224.
Hu, Z., Fan, C., Oh, D.S., Marron, J.S., He, X., Qaqish, B.F., Livasy, C., Carey, L.A.,Reynolds, E., Dressler, L., Nobel, A., Parker, J., Ewend, M.G., Sawyer, L.R., Wu, J.,Liu, Y., Nanda, R., Tretiakova, M., Ruiz Orrico, A., Dreher, D., Palazzo, J.P., Perreard,L., Nelson, E., Mone, M., Hansen, H., Mullins, M., Quackenbush, J.F., Ellis, M.J.,Olopade, O.I., Bernard, P.S., Perou, C.M., 2006. The molecular portraits of breasttumors are conserved across microarray platforms. BMC Genom. 7 (1), 96.
Hugh, J., Hanson, J., Cheang, M.C., Nielsen, T.O., Perou, C.M., Dumontet, C., Reed, J.,Krajewska, M., Treilleux, I., Rupin, M., Magherini, E., Mackey, J., Martin, M., Vogel,C., 2009. Breast cancer subtypes and response to docetaxel in node-positive breastcancer: use of an immunohistochemical definition in the BCIRG 001 trial. J. Clin.Oncol. 27 (8), 1168–1176.
Janni, W.J., Rack, B., Terstappen, L.W., Pierga, J.Y., Taran, F.A., Fehm, T., Hall, C., deGroot, M.R., Bidard, F.C., Friedl, T.W., Fasching, P.A., Brucker, S.Y., Pantel, K., Lucci,A., 2016. Pooled analysis of the prognostic relevance of circulating tumor cells inprimary breast cancer. Clin. Cancer Res. 22 (10), 2583–2593.
Jordan, C.T., Guzman, M.L., Noble, M., 2006. Cancer stem cells. N. Engl. J. Med. 355 (12),1253–1261.
Kantara, C., O'Connell, M.R., Luthra, G., Gajjar, A., Sarkar, S., Ullrich, R.L., Singh, P.,2015. Methods for detecting circulating cancer stem cells (CCSCs) as a novel ap-proach for diagnosis of colon cancer relapse/metastasis. Lab Invest. 95 (1), 100–112.
Kao, J., Salari, K., Bocanegra, M., Choi, Y.L., Girard, L., Gandhi, J., Kwei, K.A.,Hernandez-Boussard, T., Wang, P., Gazdar, A.F., Minna, J.D., Pollack, J.R., 2009.Molecular profiling of breast cancer cell lines defines relevant tumor models andprovides a resource for cancer gene discovery. PLoS One 4 (7), e6146.
Karnoub, A.E., Dash, A.B., Vo, A.P., Sullivan, A., Brooks, M.W., Bell, G.W., Richardson,A.L., Polyak, K., Tubo, R., Weinberg, R.A., 2007. Mesenchymal stem cells withintumour stroma promote breast cancer metastasis. Nature 449 (7162), 557–563.
Kennecke, H., Yerushalmi, R., Woods, R., Cheang, M.C., Voduc, D., Speers, C.H., Nielsen,T.O., Gelmon, K., 2010. Metastatic behavior of breast cancer subtypes. J. Clin. Oncol.28 (20), 3271–3277.
Lawson, D.A., Bhakta, N.R., Kessenbrock, K., Prummel, K.D., Yu, Y., Takai, K., Zhou, A.,Eyob, H., Balakrishnan, S., Wang, C.Y., Yaswen, P., Goga, A., Werb, Z., 2015. Single-cell analysis reveals a stem-cell program in human metastatic breast cancer cells.Nature 526 (7571), 131–135.
Lee, H.J., Cho, H.Y., Oh, J.H., Namkoong, K., Lee, J.G., Park, J.M., Lee, S.S., Huh, N.,Choi, J.W., 2013a. Simultaneous capture and in situ analysis of circulating tumorcells using multiple hybrid nanoparticles. Biosens. Bioelectron. 47, 508–514.
Lee, H.J., Oh, J.H., Oh, J.M., Park, J.M., Lee, J.G., Kim, M.S., Kim, Y.J., Kang, H.J., Jeong,J., Kim, S.I., Lee, S.S., Choi, J.W., Huh, N., 2013b. Efficient isolation and accurate insitu analysis of circulating tumor cells using detachable beads and a high-pore-den-sity filter. Angew. Chem. Int. Ed. Engl. 52 (32), 8337–8340.
Leis, O., Eguiara, A., Lopez-Arribillaga, E., Alberdi, M.J., Hernandez-Garcia, S., Elorriaga,K., Pandiella, A., Rezola, R., Martin, A.G., 2012. Sox2 expression in breast tumoursand activation in breast cancer stem cells. Oncogene 31 (11), 1354–1365.
Lichtman, J.W., Conchello, J.A., 2005. Fluorescence microscopy. Nat. Methods 2 (12),910–919.
Liu, S., Cong, Y., Wang, D., Sun, Y., Deng, L., Liu, Y., Martin-Trevino, R., Shang, L.,McDermott, S.P., Landis, M.D., Hong, S., Adams, A., D'Angelo, R., Ginestier, C.,Charafe-Jauffret, E., Clouthier, S.G., Birnbaum, D., Wong, S.T., Zhan, M., Chang, J.C.,Wicha, M.S., 2014. Breast cancer stem cells transition between epithelial and me-senchymal states reflective of their normal counterparts. Stem Cell Rep. 2 (1), 78–91.
Lugli, A., Iezzi, G., Hostettler, I., Muraro, M.G., Mele, V., Tornillo, L., Carafa, V., Spagnoli,G., Terracciano, L., Zlobec, I., 2010. Prognostic impact of the expression of putativecancer stem cell markers CD133, CD166, CD44s, EpCAM, and ALDH1 in colorectalcancer. Br. J. Cancer 103 (3), 382–390.
Maetzel, D., Denzel, S., Mack, B., Canis, M., Went, P., Benk, M., Kieu, C., Papior, P.,
Baeuerle, P.A., Munz, M., Gires, O., 2009. Nuclear signalling by tumour-associatedantigen EpCAM. Nat. Cell Biol. 11 (2), 162–171.
Maheswaran, S., Haber, D.A., 2010. Circulating tumor cells: a window into cancer biologyand metastasis. Curr. Opin. Genet. Dev. 20 (1), 96–99.
Malanchi, I., Santamaria-Martinez, A., Susanto, E., Peng, H., Lehr, H.-A., Delaloye, J.-F.,Huelsken, J., 2012. Interactions between cancer stem cells and their niche governmetastatic colonization. Nature 481 (7379), 85–89.
Medema, J.P., 2013. Cancer stem cells: the challenges ahead. Nat. Cell Biol. 15 (4),338–344.
Melo, F.S., Kurtova, A.V., Harnoss, J.M., Kljavin, N., Hoeck, J.D., Hung, J., Anderson, J.E.,Storm, E.E., Modrusan, Z., Koeppen, H., Dijkgraaf, G.J., Piskol, R., de Sauvage, F.J.,2017. A distinct role for Lgr5+ stem cells in primary and metastatic colon cancer.Nature 543 (7647), 676–680.
Millikan, R.C., Newman, B., Tse, C.K., Moorman, P.G., Conway, K., Dressler, L.G., Smith,L.V., Labbok, M.H., Geradts, J., Bensen, J.T., Jackson, S., Nyante, S., Livasy, C.,Carey, L., Earp, H.S., Perou, C.M., 2008. Epidemiology of basal-like breast cancer.Breast Cancer Res. Treat. 109 (1), 123–139.
Mizrak, D., Brittan, M., Alison, M., 2008. CD133: molecule of the moment. J. Pathol. 214(1), 3–9.
Mohibi, S., Mirza, S., Band, H., Band, V., 2011. Mouse models of estrogen receptor-po-sitive breast cancer. J. Carcinog. 10 (1), 35.
Moncharmont, C., Levy, A., Gilormini, M., Bertrand, G., Chargari, C., Alphonse, G.,Ardail, D., Rodriguez-Lafrasse, C., Magne, N., 2012. Targeting a cornerstone of ra-diation resistance: cancer stem cell. Cancer Lett. 322 (2), 139–147.
Nadal, R., Ortega, F.G., Salido, M., Lorente, J.A., Rodriguez-Rivera, M., Delgado-Rodriguez, M., Macia, M., Fernandez, A., Corominas, J.M., Garcia-Puche, J.L.,Sanchez-Rovira, P., Sole, F., Serrano, M.J., 2013. CD133 expression in circulatingtumor cells from breast cancer patients: potential role in resistance to chemotherapy.Int. J. Cancer 133 (10), 2398–2407.
Nagrath, S., Sequist, L.V., Maheswaran, S., Bell, D.W., Irimia, D., Ulkus, L., Smith, M.R.,Kwak, E.L., Digumarthy, S., Muzikansky, A., Ryan, P., Balis, U.J., Tompkins, R.G.,Haber, D.A., Toner, M., 2007. Isolation of rare circulating tumour cells in cancerpatients by microchip technology. Nature 450 (7173), 1235–1239.
Neve, R.M., Chin, K., Fridlyand, J., Yeh, J., Baehner, F.L., Fevr, T., Clark, L., Bayani, N.,Coppe, J.P., Tong, F., Speed, T., Spellman, P.T., DeVries, S., Lapuk, A., Wang, N.J.,Kuo, W.L., Stilwell, J.L., Pinkel, D., Albertson, D.G., Waldman, F.M., McCormick, F.,Dickson, R.B., Johnson, M.D., Lippman, M., Ethier, S., Gazdar, A., Gray, J.W., 2006. Acollection of breast cancer cell lines for the study of functionally distinct cancersubtypes. Cancer Cell 10 (6), 515–527.
Nielsen, T.O., Parker, J.S., Leung, S., Voduc, D., Ebbert, M., Vickery, T., Davies, S.R.,Snider, J., Stijleman, I.J., Reed, J., Cheang, M.C., Mardis, E.R., Perou, C.M., Bernard,P.S., Ellis, M.J., 2010. A comparison of PAM50 intrinsic subtyping with im-munohistochemistry and clinical prognostic factors in tamoxifen-treated estrogenreceptor-positive breast cancer. Clin. Cancer Res. 16 (21), 5222–5232.
Papadopoulou, E., Bell, S.E., 2011. Label-free detection of single-base mismatches in DNAby surface-enhanced Raman spectroscopy. Angew. Chem. Int. Ed. Engl. 50 (39),9058–9061.
Park, M.H., Reategui, E., Li, W., Tessier, S.N., Wong, K.H., Jensen, A.E., Thapar, V., Ting,D., Toner, M., Stott, S.L., Hammond, P.T., 2017. Enhanced isolation and release ofcirculating tumor cells using nanoparticle binding and ligand exchange in a micro-fluidic chip. J. Am. Chem. Soc. 139 (7), 2741–2749.
Pathania, R., Kolhe, R.B., Ramachandran, S., Mariappan, G., Thakur, P., Prasad, P.D.,Ganapathy, V., Thangaraju, M., 2016. Combination of DNMT and HDAC inhibitorsreprogram cancer stem cell signaling to overcome drug resistance. Cancer Res. 76 (14Supplement) (3325-3325).
Pattabiraman, D.R., Weinberg, R.A., 2014. Tackling the cancer stem cells—what chal-lenges do they pose? Nat. Rev. Drug Discov. 13 (7), 497–512.
Perou, C.M., Sorlie, T., Eisen, M.B., van de Rijn, M., Jeffrey, S.S., Rees, C.A., Pollack, J.R.,Ross, D.T., Johnsen, H., Akslen, L.A., Fluge, O., Pergamenschikov, A., Williams, C.,Zhu, S.X., Lonning, P.E., Borresen-Dale, A.L., Brown, P.O., Botstein, D., 2000.Molecular portraits of human breast tumours. Nature 406 (6797), 747–752.
Pierga, J.Y., Bidard, F.C., Mathiot, C., Brain, E., Delaloge, S., Giachetti, S., de Cremoux, P.,Salmon, R., Vincent-Salomon, A., Marty, M., 2008. Circulating tumor cell detectionpredicts early metastatic relapse after neoadjuvant chemotherapy in large operableand locally advanced breast cancer in a phase II randomized trial. Clin. Cancer Res.14 (21), 7004–7010.
Prang, N., Preithner, S., Brischwein, K., Goster, P., Woppel, A., Muller, J., Steiger, C.,Peters, M., Baeuerle, P.A., da Silva, A.J., 2005. Cellular and complement-dependentcytotoxicity of Ep-CAM-specific monoclonal antibody MT201 against breast cancercell lines. Br. J. Cancer 92 (2), 342–349.
Prat, A., Parker, J.S., Karginova, O., Fan, C., Livasy, C., Herschkowitz, J.I., He, X., Perou,C.M., 2010. Phenotypic and molecular characterization of the claudin-low intrinsicsubtype of breast cancer. Breast Cancer Res. 12 (5), R68.
Premasiri, W.R., Lee, J.C., Ziegler, L.D., 2012. Surface-enhanced Raman scattering ofwhole human blood, blood plasma, and red blood cells: cellular processes andbioanalytical sensing. J. Phys. Chem. B 116 (31), 9376–9386.
Qian, X., Peng, X.H., Ansari, D.O., Yin-Goen, Q., Chen, G.Z., Shin, D.M., Yang, L., Young,A.N., Wang, M.D., Nie, S., 2008. In vivo tumor targeting and spectroscopic detectionwith surface-enhanced Raman nanoparticle tags. Nat. Biotechnol. 26 (1), 83–90.
Riethdorf, S., Fritsche, H., Muller, V., Rau, T., Schindlbeck, C., Rack, B., Janni, W., Coith,C., Beck, K., Janicke, F., Jackson, S., Gornet, T., Cristofanilli, M., Pantel, K., 2007.Detection of circulating tumor cells in peripheral blood of patients with metastaticbreast cancer: a validation study of the Cell Search system. Clin. Cancer Res. 13 (3),920–928.
Riethdorf, S., Wikman, H., Pantel, K., 2008. Review: biological relevance of disseminatedtumor cells in cancer patients. Int. J. Cancer 123 (9), 1991–2006.
H.-Y. Cho et al. Biosensors and Bioelectronics 102 (2018) 372–382
381
Sabatte, G., Keir, R., Lawlor, M., Black, M., Graham, D., Smith, W.E., 2008. Comparison ofsurface-enhanced resonance Raman scattering and fluorescence for detection of alabeled antibody. Anal. Chem. 80 (7), 2351–2356.
Schmid-Schonbein, G.W., Shih, Y.Y., Chien, S., 1980. Morphometry of human leukocytes.Blood 56 (5), 866–875.
Sieuwerts, A.M., Kraan, J., Bolt, J., van der Spoel, P., Elstrodt, F., Schutte, M., Martens,J.W., Gratama, J.W., Sleijfer, S., Foekens, J.A., 2009. Anti-epithelial cell adhesionmolecule antibodies and the detection of circulating normal-like breast tumor cells. J.Natl. Cancer Inst. 101 (1), 61–66.
Singh, S.K., Clarke, I.D., Terasaki, M., Bonn, V.E., Hawkins, C., Squire, J., Dirks, P.B.,2003. Identification of a cancer stem cell in human brain tumors. Cancer Res. 63 (18),5821–5828.
Sorlie, T., Perou, C.M., Tibshirani, R., Aas, T., Geisler, S., Johnsen, H., Hastie, T., Eisen,M.B., van de Rijn, M., Jeffrey, S.S., Thorsen, T., Quist, H., Matese, J.C., Brown, P.O.,Botstein, D., Lonning, P.E., Borresen-Dale, A.L., 2001. Gene expression patterns ofbreast carcinomas distinguish tumor subclasses with clinical implications. Proc. Natl.Acad. Sci. USA 98 (19), 10869–10874.
Visvader, J.E., Lindeman, G.J., 2008. Cancer stem cells in solid tumours: accumulatingevidence and unresolved questions. Nat. Rev. Cancer 8 (10), 755–768.
Wang, X., Qian, X., Beitler, J.J., Chen, Z.G., Khuri, F.R., Lewis, M.M., Shin, H.J., Nie, S.,Shin, D.M., 2011. Detection of circulating tumor cells in human peripheral bloodusing surface-enhanced Raman scattering nanoparticles. Cancer Res. 71 (5),1526–1532.
Wang, Y.J., Bailey, J.M., Rovira, M., Leach, S.D., 2013. Sphere-forming assays for
assessment of benign and malignant pancreatic stem cells. In: Su, H.G. (Ed.),Pancreatic Cancer: Methods and Protocols. Humana Press, Totowa, NJ, pp. 281–290.
Wiercinska, E., Naber, H.P., Pardali, E., van der Pluijm, G., van Dam, H., ten Dijke, P.,2011. The TGF-beta/Smad pathway induces breast cancer cell invasion through theup-regulation of matrix metalloproteinase 2 and 9 in a spheroid invasion modelsystem. Breast Cancer Res. Treat. 128 (3), 657–666.
Ye, S., Li, X., Wang, M., Tang, B., 2017. Fluorescence and SERS imaging for the si-multaneous absolute quantification of multiple miRNAs in living cells. Anal. Chem.89 (9), 5124–5130.
Yoon, H.J., Kim, T.H., Zhang, Z., Azizi, E., Pham, T.M., Paoletti, C., Lin, J., Ramnath, N.,Wicha, M.S., Hayes, D.F., Simeone, D.M., Nagrath, S., 2013. Sensitive capture ofcirculating tumour cells by functionalized graphene oxide nanosheets. Nat.Nanotechnol. 8 (10), 735–741.
Zhai, W.L., Li, D.W., Qu, L.L., Fossey, J.S., Long, Y.T., 2012. Multiple depositions of Agnanoparticles on chemically modified agarose films for surface-enhanced Ramanspectroscopy. Nanoscale 4 (1), 137–142.
Zhang, W., Lou, X., Meng, X., Zhu, L., 2016. Representation method for spectrally over-lapping signals in flow cytometry based on fluorescence pulse time-delay estimation.Sensors 16 (11), 1978.
Zheng, J., Jiao, A., Yang, R., Li, H., Li, J., Shi, M., Ma, C., Jiang, Y., Deng, L., Tan, W.,2012. Fabricating a reversible and regenerable Raman-active substrate with a bio-molecule-controlled DNA nanomachine. J. Am. Chem. Soc. 134 (49), 19957–19960.
Zöller, M., 2011. CD44: can a cancer-initiating cell profit from an abundantly expressedmolecule? Nat. Rev. Cancer 11 (4), 254–267.
H.-Y. Cho et al. Biosensors and Bioelectronics 102 (2018) 372–382
382