bishop farmstead offices of pinelands preservation alliance energy assessment … · 2013-10-18 ·...
TRANSCRIPT
BISHOP FARMSTEAD OFFICES OF PINELANDS PRESERVATION ALLIANCE
ENERGY ASSESSMENT
for
NEW JERSEY
BOARD OF PUBLIC UTILITIES
CHA PROJECT NO. 23261
NOVEMBER 2011
Prepared by:
6 Campus Drive
Parsippany, NJ 07054
(973) 538-2120
TABLE OF CONTENTS Page
1.0 INTRODUCTION & BACKGROUND....……………….……...…............1
2.0 EXECUTIVE SUMMARY………………....…………..…………………...2
3.0 EXISTING CONDITIONS……………………….………..……………..…3 3.1 Building General 3.2 Utility Usage 3.3 HVAC Systems 3.4 Control Systems 3.5 Lighting/Electrical Systems 3.6 Plumbing Systems
4.0 ENERGY CONSERVATION MEASURES………………………………..6 4.1 ECM-1 Insulate HHW Piping 4.2 ECM-2 Boiler Replacement 4.3 ECM-3 Replace AC Condensing Units 4.4 ECM-4 Replace Basement Windows 4.5 ECM-5 Install Seals on Storm Windows 4.6 ECM-6 Install Ceiling Insulation 4.7 ECM-7 Replace Domestic Hot Water Heater 4.8 ECM-8 Install Low-Flow Plumbing Fixtures 4.9 ECM-9 Install Energy Star Appliances 4.10 ECM-10 Lighting Replacements 4.11 ECM-11 Install Occupancy Sensors 4.12 ECM-12 Lighting Replacements with Occupancy Sensors
5.0 PROJECT INCENTIVES…………………..………………………………...14
5.1 Incentives Overview 5.2 Building Incentives
6.0 ALTERNATIVE ENERGY EVALUATION…………………………...….17
6.1 Geothermal 6.2 Solar 6.3 Wind 6.4 Combined Heat and Power Generation (CHP) 6.5 Biomass Power Generation 6.6 Demand Response Curtailment
7.0 EPA PORTFOLIO MANAGER……………………………………….……23 8.0 CONCLUSIONS & RECOMMENDATIONS.…………………….…..…..24

APPENDICES A Utility Usage Analysis B Project Summary
C ECM-1 Insulate HHW Piping D ECM-2 Boiler Replacement E ECM-3 Replace AC Condensing Units F ECM-4 Replace Basement Windows G ECM-5 Install Storm Window Seals H ECM-6 Install Ceiling Insulation I ECM-7 Replace Domestic Hot Water Heater J ECM-8 Install Low-Flow Plumbing Fixtures K ECM-9 Install Energy Star Appliances L ECM-10 Lighting Replacements M ECM-11 Install Occupancy Sensors N ECM-12 Lighting Replacements with Occupancy Sensors O New Jersey Pay For Performance Incentive Program P Photovoltaic (PV) Rooftop Solar Power Generation Q Solar Thermal Domestic Hot Water Plant R Wind S EPA Portfolio Manager T Equipment Inventory

_____________________________________________________________________________ New Jersey BPU - Energy Audits
Page 1 of 25
1.0 INTRODUCTION AND BACKGROUND The Bishop Farmstead Offices of Pinelands Preservation Alliance is a 2,900 square foot facility consisting of a basement, two floors of office space, and an attic. The facility is located at 17 Pemberton Road, Southampton, NJ. The building was constructed in 1753 with an addition in the early 1800s. Pinelands purchased the facility in 2004. The Bishop Farmstead Offices operates Monday through Friday from 8:30 AM to 5:30 PM, and some weekends for special events. The facility is occupied by up to 9 people during these hours. There is also a visitor center where resources about the area, energy conservation information, and touring materials can be obtained. Pinelands was interested in considering all potential energy saving measures, regardless if payback was applicable, as a learning tool for visitors. New Jersey’s Clean Energy Program, funded by the New Jersey Board of Public Utilities, supports energy efficiency and sustainability for Municipal and Local Government Energy Audits. Through the support of a utility trust fund, New Jersey is able to assist state and local authorities in reducing energy consumption while increasing comfort.

_____________________________________________________________________________ New Jersey BPU - Energy Audits
Page 2 of 25
2.0 EXECUTIVE SUMMARY This report details the results of the Bishop Farmstead Offices of Pinelands Preservation Alliance, a 2,900 square foot facility consisting of offices and visitor center. The original building was constructed in 1753 with an addition in the early 1800s. Various potential Energy Conservation Measures (ECMs) were identified for the above categories. Potential annual savings of $3,000 for the recommended ECMs may be realized with a payback of 5.4 years. The ECMs identified in this report will allow for the building to reduce its energy usage and if pursued has the opportunity to qualify for the New Jersey SmartStart Buildings Program and/or Direct Install Program. A summary of the costs, savings, and paybacks for the recommended ECMs follows:
Summary of Energy Conservation Measures - Bishop Farmstead Offices
Energy Conservation Measure
Approx. Costs
Approx. Annual Savings
Payback w/o
Incentive
Potential Incentive*
Payback w/
Incentive
Recommended For Implementation
ECM-1 Insulate HHW Piping
$ 200 $ 1,200 0.2 $ - 0.2 X
ECM-2 Boiler Replacement
$ 7,900 $ 600 13.2 $ 4,700 5.3 X
ECM-3 Replace AC Condensing Units
$ 4,700 $ 200 23.5 $ 2,800 9.5 X
ECM-4 Replace Basement Windows
$ 1,100 $ 100 11.0 $ - 11.0
ECM-5 Install Storm Window Seals
$ 300 $ 200 1.5 $ - 1.5 X
ECM-6 Install Ceiling Insulation
$ 1,700 $ 200 8.5 $ - 8.5 X
ECM-7 Replace Domestic Hot Water Heater
$ 3,500 $ 200 17.5 $ 300 16.0
ECM-8 Install Low-Flow Plumbing Fixtures
$ 2,200 $ - - $ - -
ECM-9 Install Energy Star Appliances
$ 1,100 $ 100 11.0 $ - 11.0
ECM-10 Lighting Replacements
$ 1,000 $ 600 1.7 $ 600 0.7
ECM-11 Install Occupancy Sensors
$ 400 $ 100 4.0 $ 200 2.0
ECM-12
Lighting Replacements with Occupancy Sensors
$ 1,400 $ 600 2.3 $ 800 1.0 X
* Incentive shown is the maximum amount potentially available per the NJ SmartStart or Direct Install Programs.

_____________________________________________________________________________ New Jersey BPU - Energy Audits
Page 3 of 25
3.0 EXISTING CONDITIONS 3.1 Building – General The Bishop Farmstead Offices of Pinelands Preservation Alliance is a 2,900 square foot facility consisting of offices and a visitor center. The original building was constructed in 1753, and spaces included a conference room, visitor room, and offices above these rooms. The kitchen, rear offices, and supplemental second floor offices above these spaces were added in the early 1800s. This facility operates Monday through Friday from 8:30 AM to 5:30 PM, and as required on weekends for special events. The facility is occupied by a maximum of nine people during office hours. There is also a visitor center area specific resources can be obtained. The occupancy of this room varies. The building envelopes of the main building and addition were constructed in the same manner. Exterior walls consist of 8” block finished with 1” plaster. The roof is constructed of pine slates, one layer of tar (felt) paper, and finished with cedar shingles. Roof assembly is covered in moss. Removal of moss and further inspection would be recommended to determine the condition of the roof assembly. The ceiling is constructed of 1” wood planks, 6” air space, and plaster. Exterior doors are solid wood. The facility received grant money from a historical preservation fund and cannot alter the exterior appearance of the building. Therefore, the doors, walls, windows, and roof must be replaced with materials pertaining to the time period they were originally installed. 3.2 Utility Usage Utilities include electricity, propane, fuel oil #2, and potable water. Electricity is delivered and supplied by Public Service Electric & Gas Company (PSE&G). Propane and fuel oil #2 is supplied and delivered by Allen’s Oil & Propane. Potable water is provided at no cost by wells from an aquifer under the facility. The facility has one electric meter; from May 2009 through May 2010, the annual electric usage was 5,210 kWh at a cost of about $1,500. Review of electricity bills during this period showed that the facility was charged at the following rates: consumption unit cost of $0.168 per kWh; demand unit cost of $11.40 per kW; and blended unit cost of $0.287 per kWh. Electrical usage was generally higher in the summer months when air conditioning equipment was operational. From April 2010 through May 2011, the facility purchased 1,306 gallons of fuel oil #2 to be consumed by the oil-fired boiler. Based on the annual cost of $5063.54, the price for fuel oil was $3.88 per gallon. Fuel oil #2 consumption was highest in winter months for heating. Utilizing two propane bills from 2011, it was determined that the propane-fired domestic hot water heater consumed about 86 gallons of propane. Based on the annual cost of $280, the price for fuel oil was $3.32 per gallon. See Appendix A for a detailed utility analysis. Electricity commodity is supplied and delivered by PSE&G. The delivery component will always be the responsibility of the utility that connects the facility to the power grid; however, the supply can be purchased from a third party and is often less expensive. The electricity commodity supply entity will require submission of one to three years of past energy bills. Contract terms can vary among suppliers. According to the U.S. Energy Information Administration, the average commercial unit cost of electricity in New Jersey during the same periods as those noted above was $0.144 per kWh. When compared to the average state values, it is recommended that a third party electricity supplier be pursued. A list of approved electrical energy commodity suppliers can be found in Appendix A.

_____________________________________________________________________________ New Jersey BPU - Energy Audits
Page 4 of 25
An energy analysis was performed for propane, fuel oil, and electric to determine which was most cost effective for heating the facility. Natural gas was omitted from the analysis because there is currently no service available at the site.
Fuel Unit Conversion Efficiency Unit Cost $/MBTU
Electric 1 KW 3.41 1.00 0.29$ 0.0842$ Propane 1 Gal 91.60 0.92 3.32$ 0.0393$
#2 Oil 1 Gal 140.00 0.82 3.88$ 0.0338$ Each fuel was converted to cost per million BTU of energy to compare the three fuels. The efficiency column is the ratio of the output to input of the system that uses the fuel. The result was fuel oil #2 was the most cost-effective fuel to heat the facility. 3.3 HVAC Systems Hot water (HW) is the primary heating medium utilized in the facility. One Weil-McLain HW boiler, located in the basement, serves the building. The boiler is oil fired with an efficiency rating of 85%. The input is 40 MBh and output 34 MBh. The existing boiler is in good condition and was replaced in 2004; it is estimated that it has 17 more years of useful life. The efficiency of the heating system is standard; hydronic equipment served by the boiler includes perimeter baseboard heaters on the first and second floors. The hydronic heating system is broken up into four zones, consisting of the second floor, kitchen, backroom, and first floor. Each zone has a shutoff valve at the boiler for maintenance and a dedicated Taco 1/25 HP pump to circulate HW. There are two cooling only split system AHUs; one serving each floor of the facility. AHU-1 is located in the basement and serves the first floor of the facility; AHU-2 is located in the attic and serves the second floor. Both units, manufactured by Williamson Company, are outdated. All occupied spaces are air conditioned. Each of the AHUs are equipped with direct expansion (DX) cooling coils and connected to a dedicated remote condensing unit located outdoors. The two remote condensers serving the facility have a total cooling capacity of about 4.5 tons. Pinelands purchased the facility in 2004 and has not upgraded the HVAC system. It is estimated that these units are at least 20 years’ old with an estimated cooling efficiency of 1.656 KW/ton. Specifics on mechanical equipment can be found within the equipment inventory located in Appendix T. 3.4 Control Systems The facility is broken into two AC control zones. Each AHU serves a dedicated floor with a programmable thermostat. The facility has five programmable thermostats; three heating, one cooling only and one heating and cooling. The boiler has four zones each controlled by separate programmable thermostats. Typical setpoints in the facility are 68°F heating and 74°F cooling during occupied times, and 58°F heating and 76°F cooling during unoccupied times; these values vary slightly between thermostats per space and occupant comfort. Each thermostat has been programmed for overnight setback.

_____________________________________________________________________________ New Jersey BPU - Energy Audits
Page 5 of 25
3.5 Lighting/Electrical Systems Maintenance personnel began upgrading the incandescent fixtures to compact florescent lighting. There are also numerous lamps or fixtures which utilize compact fluorescent lamps in the offices, copy room, vestibule, kitchen, and restrooms. In these areas, a small percentage of lamps still had 60 W incandescent bulbs; the attic utilizes three 60 W incandescent bulbs. The conference room, which is seldom occupied, utilizes track lighting and has (10) incandescent 50 W floodlights controlled by a dimmer switch. The visitor center is also sporadically utilized. The only exception is some of the incandescent bulbs have been changed to LED lights. The totals in this room are six incandescent bulbs and four 7 W LED lights. The exterior lights are controlled by wall mounted switches. Exterior building lighting is provided by a combination of incandescent and compact florescent lighting. Additionally, parking lot and site lighting is provided by 10 light posts with high pressure sodium bulbs. The audit estimated (3) 400 W; and (7) 250 W, two of which are not operational.. These lights are controlled by a timer. The facility is also equipped with emergency backup lighting in the event of a power outage. These modules are located throughout the facility and are battery powered. 3.6 Plumbing Systems The facility utilizes a 40 gallon Bradford White 40,000 Btuh propane-fired water heater to generate domestic hot water (DHW). Located in the basement, this unit was installed prior to 2004. The DHW heater provides hot water for the sinks, dishwasher, and shower. Personnel noted that the shower is not used, and is presently utilized for storage of boxes. Since the shower is not used and the remaining DHW load is minimal, the water heater is oversized for current usage. All plumbing fixtures are standard flow typical for the 1980s, and in fair condition. More water-efficient flush valves and faucets could be installed to reduce water usage. However, since the complex uses well water supplied at no charge, there are no economic benefits from reduced usage; however, Pinelands requested that the benefits of plumbing measures be included in the audit.

_____________________________________________________________________________ New Jersey BPU - Energy Audits
Page 6 of 25
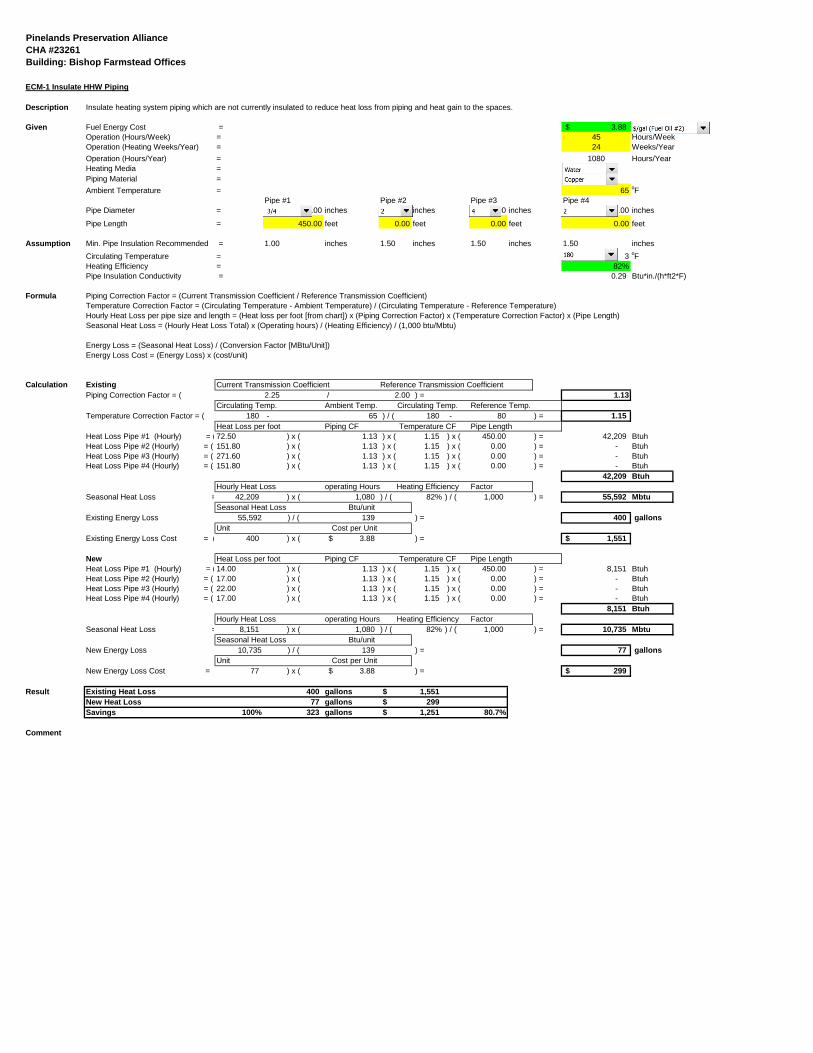
4.0 ENERGY CONSERVATION MEASURES 4.1 ECM-1 Insulate HHW Piping The facility utilizes hot water for heating. The boiler is located in the basement and baseboard heaters are located in spaces throughout the first and second floors. The ¾” piping for this system runs 450 feet of exposed pipe through an unconditioned basement to the vertical penetrations in the floor of the heaters. During heating season, the exposed piping loses heat to the ambient air and the efficiency of the heating system decreases. To minimize the heat transfer between the pipes and ambient air, the exposed piping should be insulated with polyethylene pipe insulation. To compute the amount of heat lost through the uninsulated hot water piping, the exposed surface area of the piping was determined. Transmission coefficients for copper piping were then utilized in conjunction with the ambient air and hot water temperatures to generate correction factors for the heat transfer calculation. By installing 1” polyethylene insulation on the hot water piping, it is expected this ECM will reduce annual fuel oil #2 consumption by approximately 320 gallons. Installation can be performed by in-house personnel. Hot water piping has an expected life of 20 years, according to ASHRAE, and total energy savings over the life of the project are estimated at 6,400 gallons of fuel oil #2 and $24,000. The implementation cost and savings related to this ECM are presented in Appendix C and summarized below:
ECM-1 Insulate HHW Piping
Budgetary Annual Utility Savings Estimated Total Potential Payback Payback
Cost Maintenance Savings ROI Incentive* (without (with
Electricity LPG Fuel
Oil #2 Total Savings Incentive) Incentive)
$ kW kWh Gals Gals $ $ $ $ Years Years
200 0 0 0 320 1,200 0 1,200 119.0 NA 0.2 NA
* There is no incentive available through the New Jersey Smart Start or Direct Install Programs for this ECM. See section 5.0 for other incentive opportunities
This measure is recommended. 4.2 ECM-2 Boiler Replacement The boiler is oil fired with an efficiency of 85%. It was replaced in 2004, is standard within the industry, and is in good condition. Replacing the existing boiler with a newer technology condensing boiler will increase efficiency up to 95% and reduce fuel oil #2 consumption. The boiler load was calculated from the gallons used annually per utility bills, boiler efficiency, and conversion from gallons oil to MBH. The load was then compared to the fuel a new condensing boiler would use at the improved operating efficiency. The difference in fuel usage was the saving. Oil-fired boilers have an expected life of 25 years, according to ASHRAE, and total energy savings over the life of the project are estimated at 3,500 gallons of fuel oil and $15,000.
_____________________________________________________________________________ New Jersey BPU - Energy Audits
Page 7 of 25
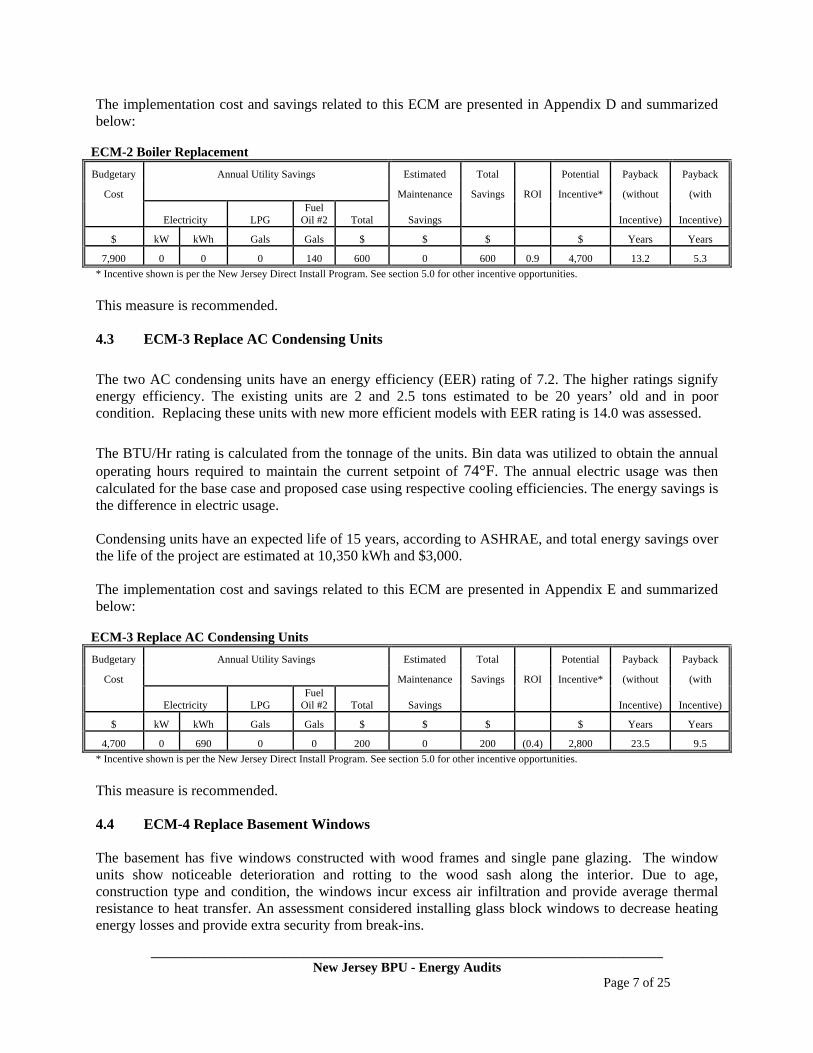
The implementation cost and savings related to this ECM are presented in Appendix D and summarized below:
ECM-2 Boiler Replacement
Budgetary Annual Utility Savings Estimated Total Potential Payback Payback
Cost Maintenance Savings ROI Incentive* (without (with
Electricity LPG Fuel
Oil #2 Total Savings Incentive) Incentive)
$ kW kWh Gals Gals $ $ $ $ Years Years
7,900 0 0 0 140 600 0 600 0.9 4,700 13.2 5.3
* Incentive shown is per the New Jersey Direct Install Program. See section 5.0 for other incentive opportunities. This measure is recommended. 4.3 ECM-3 Replace AC Condensing Units
The two AC condensing units have an energy efficiency (EER) rating of 7.2. The higher ratings signify energy efficiency. The existing units are 2 and 2.5 tons estimated to be 20 years’ old and in poor condition. Replacing these units with new more efficient models with EER rating is 14.0 was assessed.
The BTU/Hr rating is calculated from the tonnage of the units. Bin data was utilized to obtain the annual operating hours required to maintain the current setpoint of 74°F. The annual electric usage was then calculated for the base case and proposed case using respective cooling efficiencies. The energy savings is the difference in electric usage. Condensing units have an expected life of 15 years, according to ASHRAE, and total energy savings over the life of the project are estimated at 10,350 kWh and $3,000. The implementation cost and savings related to this ECM are presented in Appendix E and summarized below:
ECM-3 Replace AC Condensing Units
Budgetary Annual Utility Savings Estimated Total Potential Payback Payback
Cost Maintenance Savings ROI Incentive* (without (with
Electricity LPG Fuel
Oil #2 Total Savings Incentive) Incentive)
$ kW kWh Gals Gals $ $ $ $ Years Years
4,700 0 690 0 0 200 0 200 (0.4) 2,800 23.5 9.5
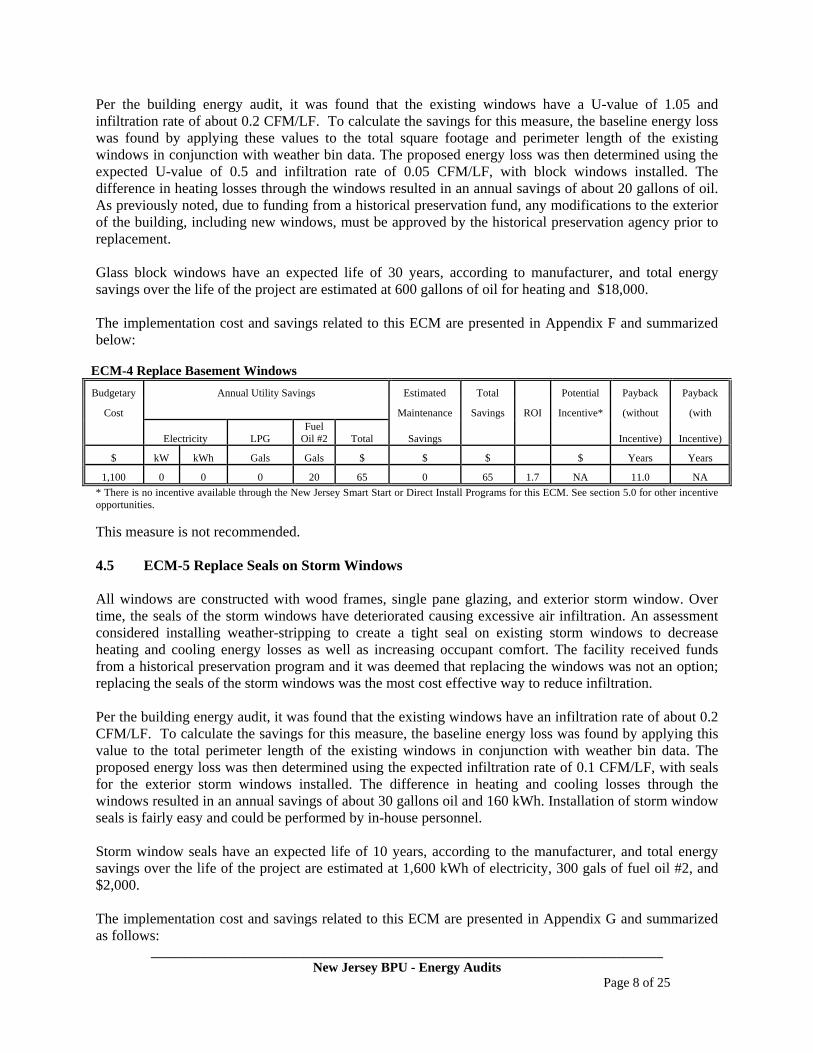
* Incentive shown is per the New Jersey Direct Install Program. See section 5.0 for other incentive opportunities. This measure is recommended. 4.4 ECM-4 Replace Basement Windows The basement has five windows constructed with wood frames and single pane glazing. The window units show noticeable deterioration and rotting to the wood sash along the interior. Due to age, construction type and condition, the windows incur excess air infiltration and provide average thermal resistance to heat transfer. An assessment considered installing glass block windows to decrease heating energy losses and provide extra security from break-ins.
_____________________________________________________________________________ New Jersey BPU - Energy Audits
Page 8 of 25
Per the building energy audit, it was found that the existing windows have a U-value of 1.05 and infiltration rate of about 0.2 CFM/LF. To calculate the savings for this measure, the baseline energy loss was found by applying these values to the total square footage and perimeter length of the existing windows in conjunction with weather bin data. The proposed energy loss was then determined using the expected U-value of 0.5 and infiltration rate of 0.05 CFM/LF, with block windows installed. The difference in heating losses through the windows resulted in an annual savings of about 20 gallons of oil. As previously noted, due to funding from a historical preservation fund, any modifications to the exterior of the building, including new windows, must be approved by the historical preservation agency prior to replacement. Glass block windows have an expected life of 30 years, according to manufacturer, and total energy savings over the life of the project are estimated at 600 gallons of oil for heating and $18,000. The implementation cost and savings related to this ECM are presented in Appendix F and summarized below:
ECM-4 Replace Basement Windows
Budgetary Annual Utility Savings Estimated Total Potential Payback Payback
Cost Maintenance Savings ROI Incentive* (without (with
Electricity LPG Fuel
Oil #2 Total Savings Incentive) Incentive)
$ kW kWh Gals Gals $ $ $ $ Years Years
1,100 0 0 0 20 65 0 65 1.7 NA 11.0 NA
* There is no incentive available through the New Jersey Smart Start or Direct Install Programs for this ECM. See section 5.0 for other incentive opportunities.
This measure is not recommended. 4.5 ECM-5 Replace Seals on Storm Windows All windows are constructed with wood frames, single pane glazing, and exterior storm window. Over time, the seals of the storm windows have deteriorated causing excessive air infiltration. An assessment considered installing weather-stripping to create a tight seal on existing storm windows to decrease heating and cooling energy losses as well as increasing occupant comfort. The facility received funds from a historical preservation program and it was deemed that replacing the windows was not an option; replacing the seals of the storm windows was the most cost effective way to reduce infiltration. Per the building energy audit, it was found that the existing windows have an infiltration rate of about 0.2 CFM/LF. To calculate the savings for this measure, the baseline energy loss was found by applying this value to the total perimeter length of the existing windows in conjunction with weather bin data. The proposed energy loss was then determined using the expected infiltration rate of 0.1 CFM/LF, with seals for the exterior storm windows installed. The difference in heating and cooling losses through the windows resulted in an annual savings of about 30 gallons oil and 160 kWh. Installation of storm window seals is fairly easy and could be performed by in-house personnel. Storm window seals have an expected life of 10 years, according to the manufacturer, and total energy savings over the life of the project are estimated at 1,600 kWh of electricity, 300 gals of fuel oil #2, and $2,000. The implementation cost and savings related to this ECM are presented in Appendix G and summarized as follows:

_____________________________________________________________________________ New Jersey BPU - Energy Audits
Page 9 of 25
ECM-5 Replace Seals on Storm Windows
Budgetary Annual Utility Savings Estimated Total Potential Payback Payback
Cost Maintenance Savings ROI Incentive* (without (with
Electricity LPG Fuel
Oil #2 Total Savings Incentive) Incentive)
$ kW kWh Gals Gals $ $ $ $ Years Years
300 0 160 0 30 200 0 200 5.7 NA 1.5 NA
* There is no incentive available through the New Jersey Smart Start or Direct Install Programs for this ECM. See section 5.0 for other incentive opportunities.
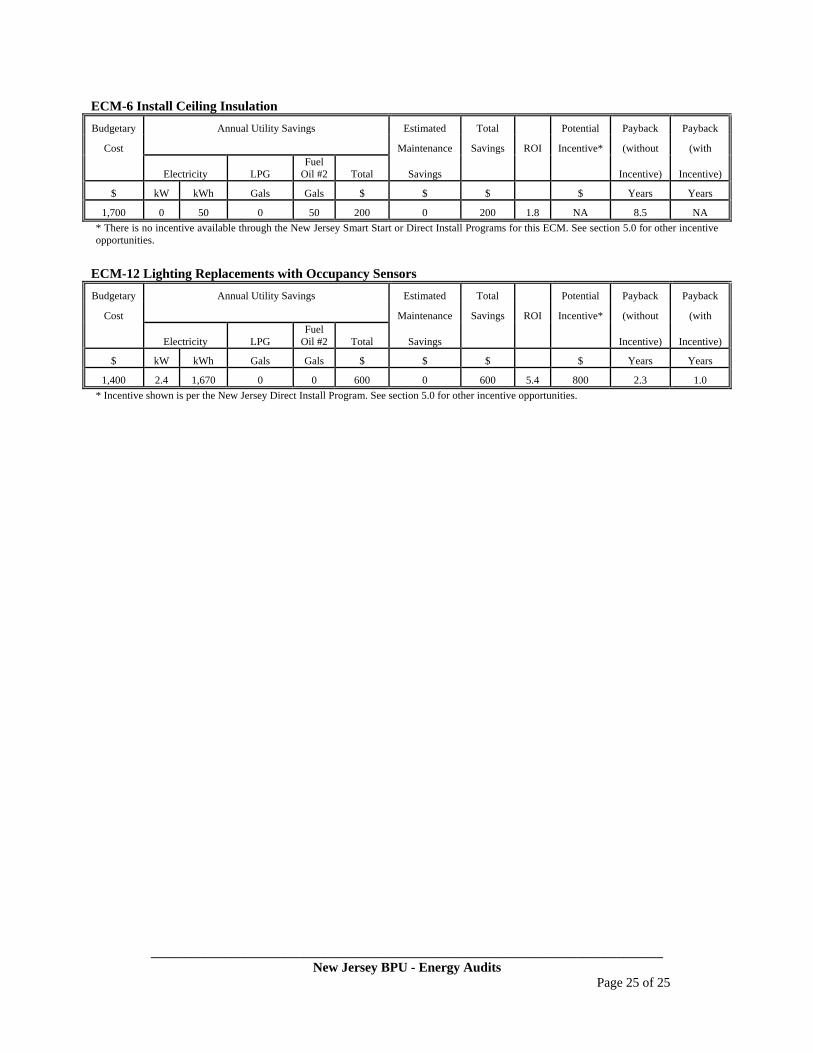
This measure is recommended. 4.6 ECM-6 Install Ceiling Insulation The overhead roof and ceiling construction between the occupied space and outdoors is wood shingles, felt paper, pine slates, attic air space, 1” decking, 6” airspace, and 1” plaster. This ECM addressed blowing in 6” of loose-fill cellulose insulation (R-2.7/inch) between the ceiling joists of the attic to minimize heating and cooling energy losses. To calculate the savings, the heat losses through the roof assembly of the facility was found using the existing roof’s R-value of 9.5 and bin weather data for nearby Philadelphia, PA. The values were totaled to determine the existing annual energy losses. Heating and cooling energy loss values were then determined with a thermal resistance which included the additional R-16.2 loose-fill insulation. The annual energy savings of blowing insulation in between the ceiling joists is expected to be about 50 gallons of fuel oil and 50 kWh. This is an annual savings of $200.
Loose-fill insulation has an expected life of 24 years, according to ASHRAE, and total energy savings over the life of the project are estimated at 1,200 gallons of oil, 1,200 kWh, and $4,800. The implementation cost and savings related to this ECM are presented in Appendix H and summarized below:
ECM-6 Install Ceiling Insulation
Budgetary Annual Utility Savings Estimated Total Potential Payback Payback
Cost Maintenance Savings ROI Incentive* (without (with
Electricity LPG Fuel
Oil #2 Total Savings Incentive) Incentive)
$ kW kWh Gals Gals $ $ $ $ Years Years
1,700 0 50 0 50 200 0 200 1.8 NA 8.5 NA
* There is no incentive available through the New Jersey Smart Start or Direct Install Programs for this ECM. See section 5.0 for other incentive opportunities.
This measure is recommended. 4.7 ECM-7 Replace Domestic Hot Water Heater Domestic hot water for the facility is generated by a 40 gallon Bradford White, 40 Btuh propane-fired hot water heater which is oversized for current HW demand, which includes dish and hand washing. One shower in the facility is not utilized according to personnel. During periods of little or no HW use, the unit must still heat the water within the storage tank. Energy required maintaining the 40 gallons of HW
_____________________________________________________________________________ New Jersey BPU - Energy Audits
Page 10 of 25
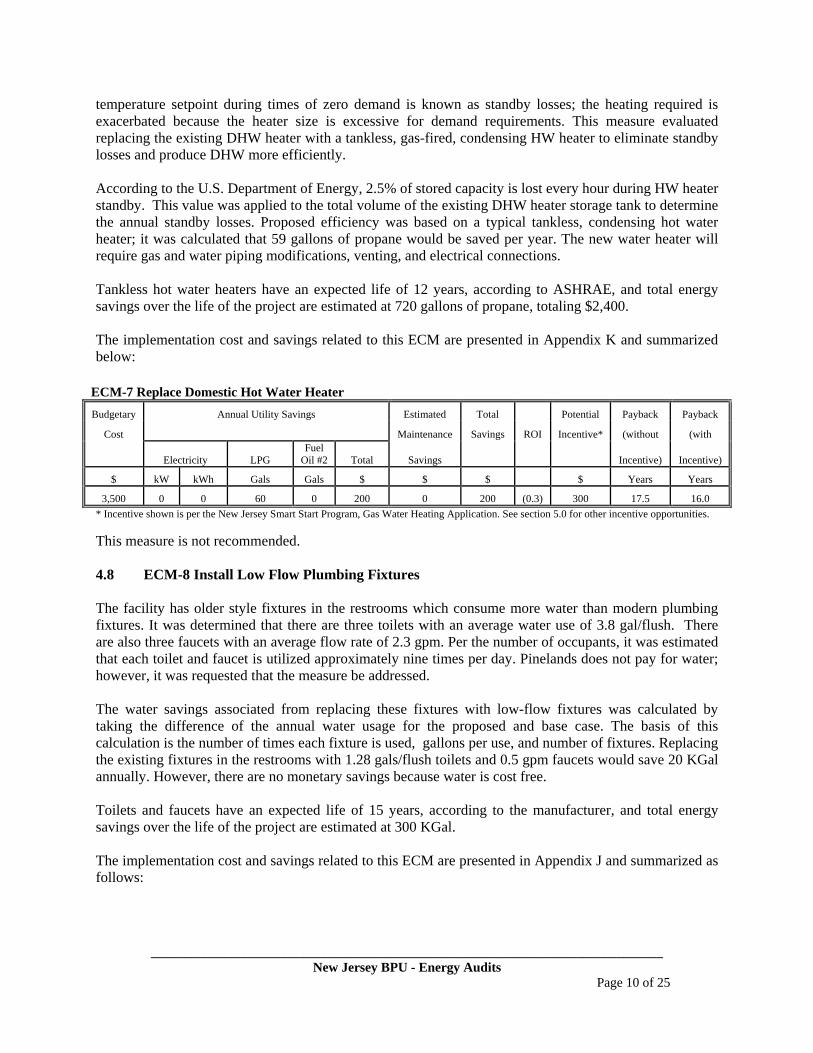
temperature setpoint during times of zero demand is known as standby losses; the heating required is exacerbated because the heater size is excessive for demand requirements. This measure evaluated replacing the existing DHW heater with a tankless, gas-fired, condensing HW heater to eliminate standby losses and produce DHW more efficiently. According to the U.S. Department of Energy, 2.5% of stored capacity is lost every hour during HW heater standby. This value was applied to the total volume of the existing DHW heater storage tank to determine the annual standby losses. Proposed efficiency was based on a typical tankless, condensing hot water heater; it was calculated that 59 gallons of propane would be saved per year. The new water heater will require gas and water piping modifications, venting, and electrical connections. Tankless hot water heaters have an expected life of 12 years, according to ASHRAE, and total energy savings over the life of the project are estimated at 720 gallons of propane, totaling $2,400. The implementation cost and savings related to this ECM are presented in Appendix K and summarized below:
ECM-7 Replace Domestic Hot Water Heater
Budgetary Annual Utility Savings Estimated Total Potential Payback Payback
Cost Maintenance Savings ROI Incentive* (without (with
Electricity LPG Fuel
Oil #2 Total Savings Incentive) Incentive)
$ kW kWh Gals Gals $ $ $ $ Years Years
3,500 0 0 60 0 200 0 200 (0.3) 300 17.5 16.0
* Incentive shown is per the New Jersey Smart Start Program, Gas Water Heating Application. See section 5.0 for other incentive opportunities.
This measure is not recommended. 4.8 ECM-8 Install Low Flow Plumbing Fixtures The facility has older style fixtures in the restrooms which consume more water than modern plumbing fixtures. It was determined that there are three toilets with an average water use of 3.8 gal/flush. There are also three faucets with an average flow rate of 2.3 gpm. Per the number of occupants, it was estimated that each toilet and faucet is utilized approximately nine times per day. Pinelands does not pay for water; however, it was requested that the measure be addressed. The water savings associated from replacing these fixtures with low-flow fixtures was calculated by taking the difference of the annual water usage for the proposed and base case. The basis of this calculation is the number of times each fixture is used, gallons per use, and number of fixtures. Replacing the existing fixtures in the restrooms with 1.28 gals/flush toilets and 0.5 gpm faucets would save 20 KGal annually. However, there are no monetary savings because water is cost free. Toilets and faucets have an expected life of 15 years, according to the manufacturer, and total energy savings over the life of the project are estimated at 300 KGal. The implementation cost and savings related to this ECM are presented in Appendix J and summarized as follows:

_____________________________________________________________________________ New Jersey BPU - Energy Audits
Page 11 of 25
ECM-8 Install Low-Flow Plumbing Fixtures
Budgetary Annual Utility Savings Estimated Total Potential Payback Payback
Cost Maintenance Savings ROI Incentive* (without (with
Electricity LPG Water Total Savings Incentive) Incentive)
$ kW kWh Gals kGals $ $ $ $ Years Years
2,500 0 0 0 20 NA 0 NA (1.0) NA NA NA
* There is no incentive available through the New Jersey Smart Start or Direct Install Programs for this ECM. See section 5.0 for other incentive opportunities. This measure is not recommended. 4.9 ECM-9 Install Energy Star Appliances The facility has older style appliances in the kitchen including an Amana BX2LTE refrigerator and Whirlpool dishwasher. The Energy Star webpage suggests that facilities with a dishwasher made before 1994 pays on average an extra $40 a year on utility bills and wastes more than 10 gallons of water per cycle compared to owning a new Energy Star qualified model. Energy Star qualified refrigerators are required to use 20% less energy than models not labeled with the Energy Star logo. Pinelands was interested in evaluating the replacement of the dishwasher and refrigerator with Energy Star appliances. Utilizing the Energy Star webpage, a calculation was performed; the dishwasher will save 90 kWh, 3 Kgals/year of water assuming one use per day and cycle time of 1 hour. This cost savings is $30/year for the dishwasher. The refrigerator will save 310 kWh annually which is a cost savings of $70/year. Together these appliances would save 310 kWh annually for a cost savings of approximately $100. Energy Star appliances have an expected life of 12 years, according to the website. The total energy savings over the life of the project are estimated at 3,720 Kwh, totaling $1,200. The implementation cost and savings related to this ECM are presented in Appendix K and summarized below:
ECM-9 Install Energy Star Appliances
Budgetary Annual Utility Savings Estimated Total Potential Payback Payback
Cost Maintenance Savings ROI Incentive* (without (with
Electricity LPG Water Total Savings Incentive) Incentive)
$ kW kWh Gals kGals $ $ $ $ Years Years
1,100 0 310 0 3 100 0 100 0.1 NA 11.0 NA
* There is no incentive available through the New Jersey Smart Start or Direct Install Programs for this ECM. See section 5.0 for other incentive opportunities
This measure is not recommended. 4.10 ECM-10 Lighting Replacements A comprehensive fixture survey was conducted of the entire building. Each switch and circuit was identified, and the number of fixtures, locations, and existing wattage established (Appendix T). Inefficient lighting fixtures include those that utilize incandescent screw type bulbs, incandescent flood lighting and T-12 fluorescent lamps. Upgrading these lighting fixtures to more efficient technology provides electrical energy savings.

_____________________________________________________________________________ New Jersey BPU - Energy Audits
Page 12 of 25
Energy savings for this measure were calculated by applying the existing and proposed fixture wattages to estimated times of operation. The difference between energy requirements resulted in a total annual savings of 1,630 kWh with an electrical demand reduction of about 2.4 kW. Supporting calculations, including assumptions for lighting hours and annual energy usage for each fixture, are provided in Appendix L. Fixtures that utilize incandescent bulbs would be replaced with compact fluorescent spiral lightbulbs, incandescent flood lamps can be replaced with LEDs, and T-12 fluorescent lighting would be upgraded to T-8 fluorescents with electronic ballasts. Lighting has an expected life of 15 years, according to the manufacturer, and total energy savings over the life of the project are estimated at 24,450 kWh and $9,000. The implementation cost and savings related to this ECM are presented in Appendix L and summarized below:
ECM-10 Lighting Replacements
Budgetary Annual Utility Savings Estimated Total Potential Payback Payback
Cost Maintenance Savings ROI Incentive* (without (with
Electricity LPG Fuel
Oil #2 Total Savings Incentive) Incentive)
$ kW kWh Gals Gals $ $ $ $ Years Years
1,000 2.4 1,630 0 0 600 0 600 8.0 600 1.7 0.7
* Incentive shown is per the New Jersey Direct Install Program. See section 5.0 for other incentive opportunities. This measure is not recommended in lieu of ECM-12. 4.11 ECM-11 Install Occupancy Sensors Review of the comprehensive lighting survey determined that lighting in two rooms, the conference room and visitor center, is typically operational, regardless of occupancy. Therefore, installing an occupancy sensor in these spaces to turn off lights when the areas are unoccupied was assessed. Using a process similar to that utilized in section 4.10, the energy savings for this measure were calculated by applying the known fixture wattages in the space to the estimated existing and proposed times of operation for each fixture. The difference between the two values resulted in an annual savings of 490 kWh. Two wall-mounted occupancy sensors with dimmer control are required for this measure. Occupancy sensors have an expected life of 15 years, according to the manufacturer, and total energy savings over the life of the project are estimated at 7,350 kWh and $1,500. The implementation cost and savings related to this ECM are presented in Appendix M and summarized as follows:
_____________________________________________________________________________ New Jersey BPU - Energy Audits
Page 13 of 25
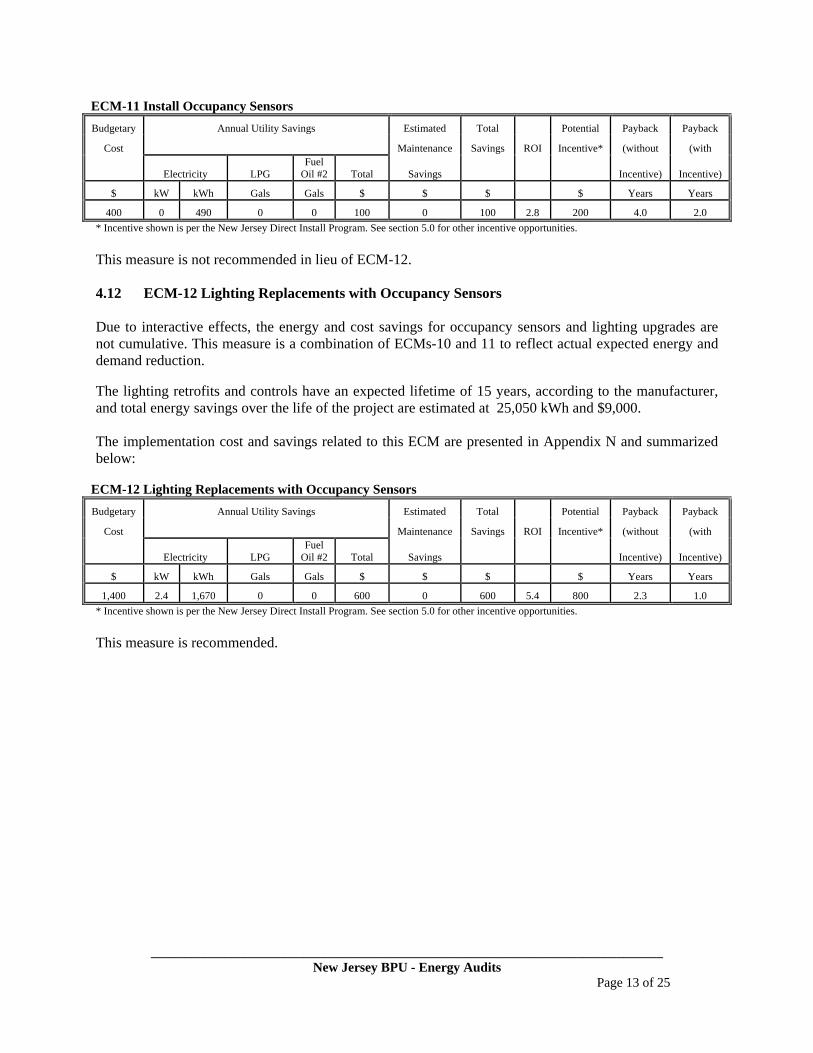
ECM-11 Install Occupancy Sensors
Budgetary Annual Utility Savings Estimated Total Potential Payback Payback
Cost Maintenance Savings ROI Incentive* (without (with
Electricity LPG Fuel
Oil #2 Total Savings Incentive) Incentive)
$ kW kWh Gals Gals $ $ $ $ Years Years
400 0 490 0 0 100 0 100 2.8 200 4.0 2.0
* Incentive shown is per the New Jersey Direct Install Program. See section 5.0 for other incentive opportunities. This measure is not recommended in lieu of ECM-12. 4.12 ECM-12 Lighting Replacements with Occupancy Sensors Due to interactive effects, the energy and cost savings for occupancy sensors and lighting upgrades are not cumulative. This measure is a combination of ECMs-10 and 11 to reflect actual expected energy and demand reduction. The lighting retrofits and controls have an expected lifetime of 15 years, according to the manufacturer, and total energy savings over the life of the project are estimated at 25,050 kWh and $9,000. The implementation cost and savings related to this ECM are presented in Appendix N and summarized below:
ECM-12 Lighting Replacements with Occupancy Sensors
Budgetary Annual Utility Savings Estimated Total Potential Payback Payback
Cost Maintenance Savings ROI Incentive* (without (with
Electricity LPG Fuel
Oil #2 Total Savings Incentive) Incentive)
$ kW kWh Gals Gals $ $ $ $ Years Years
1,400 2.4 1,670 0 0 600 0 600 5.4 800 2.3 1.0
* Incentive shown is per the New Jersey Direct Install Program. See section 5.0 for other incentive opportunities. This measure is recommended.

_____________________________________________________________________________ New Jersey BPU - Energy Audits
Page 14 of 25
5.0 PROJECT INCENTIVES 5.1 Incentives Overview 5.1.1 New Jersey Pay For Performance Program The complex will be eligible for incentives from the New Jersey Office of Clean Energy. The most significant incentives will be from the New Jersey Pay for Performance (P4P) Program. The P4P program is designed for qualified energy conservation projects in facilities whose demand in any of the preceding 12 months exceeds 200 kW. However, the 200 kW/month average minimum has been waived for buildings owned by local governments or municipalities and non-profit organizations. Facilities that meet this criterion must also achieve a minimum performance target of 15% energy reduction by using the EPA Portfolio Manager benchmarking tool before and after implementation of the measure(s). If the participant is a municipal electric company customer, and a customer of a regulated gas New Jersey Utility, only gas measures will be eligible under the Program. American Recovery and Reinvestment Act (ARRA) funding, when available, may allow oil, propane and municipal electric customers to be eligible for the P4P Program. Available incentives are as follows: Incentive #1: Energy Reduction Plan – This incentive is designed to offset the cost of services associated with the development of the Energy Reduction Plan (ERP). The standard incentive pays $0.10 per square foot, up to a maximum of $50,000, not to exceed 50% of facility annual energy cost, paid after approval of application. For building audits funded by the New Jersey Board of Public Utilities, which receive an initial 75% incentive toward performance of the energy audit, facilities are only eligible for an additional $0.05 per square foot, up to a maximum of $25,000, rather than the standard incentive noted above. Incentive #2: Installation of Recommended Measures – This incentive is based on projected energy saving and designed to pay approximately 60% of the total performance-based incentive. Base incentives deliver $0.11/kWh and $1.10/therm not to exceed 30% of total project cost. Incentive #3: Post-Construction Benchmarking Report – This incentive is paid after acceptance of a report proving energy savings over one year utilizing the Environmental Protection Agency (EPA) Portfolio Manager benchmarking tool. Incentive #3 base incentives deliver $0.07/kWh and $0.70/therm not to exceed 20% of total project cost. Combining incentives #2 and #3 will provide a total of $0.18/ kWh and $1.8/therm not to exceed 50% of total project cost. Additional incentives for #2 and #3 are increased by $0.005/kWh and $0.05/therm for each percentage increase above the 15% minimum target to 20%, calculated with the EPA Portfolio Manager benchmarking tool, not to exceed 50% of total project cost. 5.1.2 New Jersey Smart Start Program For this program, specific incentives for energy conservation measures are calculated on an individual basis utilizing the 2011 New Jersey Smart Start incentive program. This program provides incentives dependent upon mechanical and electrical equipment. If applicable, incentives from this program are reflected in the ECM summaries and attached appendices. If the complex qualifies and enters into the New Jersey Pay for Performance Program, all energy savings will be included in the total site energy reduction, and savings will be applied towards the Pay for Performance incentive. A project is not applicable for both New Jersey incentive programs.
_____________________________________________________________________________ New Jersey BPU - Energy Audits
Page 15 of 25
5.1.3 ARRA Initiative “Energy Efficiency Programs through the Clean Energy Program” The American Recovery and Reinvestment Act (ARRA) Initiative is available to New Jersey oil, propane, cooperative and municipal electric customers who do not pay the Societal Benefits Charge. This charge can be seen on any electric bill as the line item “SBC Charge.” Applicants can participate in this program in conjunction with other New Jersey Clean Energy Program initiatives including Pay for Performance, Local Government Energy Audits, and Direct Install programs. Funding for this program is dispersed on a first come, first serve basis until all funds are exhausted. The program does not limit the municipality to a minimum or maximum incentive, and the availability of funding cannot be determined prior to application. If the municipality meets all qualifications, the application must be submitted to TRC Energy Solutions for review. TRC will then determine the amount of the incentive based on projected energy savings of the project. It is important to note that all applications for this incentive must be submitted before implementation of energy conservation measures. Additional information is available on New Jersey’s Clean Energy Program website. 5.1.4 Direct Install Program The Direct Install Program targets small and medium sized facilities where the peak electrical demand does not exceed 200 kW in any of the previous 12 months. Buildings must be located in New Jersey and served by one of the state’s public, regulated electric or natural gas utility companies. On a case-by-case basis, the program manager may accept a project for a customer that is within 10% of the 200 kW peak demand threshold.
The 200 kW peak demand threshold has been waived for local government entities that receive and utilize their Energy Efficiency and Conservation Block Grant as discussed in section 5.1.3 in conjunction with Direct Install.
Direct Install is funded through New Jersey’s Clean Energy Program and is designed to provide capital for building energy upgrade projects to fast track implementation. The program will pay up to 60% of the costs for lighting, HVAC, motors, natural gas, refrigeration, and other equipment upgrades with higher efficiency alternatives. If a building is eligible for this funding, the Direct Install Program can significantly reduce the implementation cost of energy conservation projects. The program pays a maximum amount of $50,000 per building, and up to $250,000 per customer per year. Installations must be completed by a Direct Install participating contractor, a list of which can be found on the New Jersey Clean Energy Website at http://www.njcleanenergy.com. Contractors will coordinate with the applicant to arrange installation of recommended measures identified in a previous energy assessment, such as this document. 5.2 Building Incentives 5.2.1 New Jersey Pay For Performance Program Under incentive #1 of the New Jersey Pay for Performance Program, the 2,900 square foot Bishop Farmstead Offices of Pinelands Preservation Alliance is eligible for about $145 toward development of an Energy Reduction Plan. When calculating the total amount under Incentives #2 and #3, all energy conservation measures are applicable as the amount received is based on site wide energy improvements. Since the overall energy reduction for the complex is estimated to exceed the 15% minimum, the facility

_____________________________________________________________________________ New Jersey BPU - Energy Audits
Page 16 of 25
is eligible to receive monies based on Incentives #2 and #3 as discussed above in section 5.1.1. In total, incentives through the NJ P4P program are expected to total about $600, reducing the total project payback from 4.6 years to 4.4 years. See Appendix O for calculations. 5.2.2 New Jersey Smart Start Program The Bishop Farmstead Offices of Pinelands Preservation Alliance is eligible for several incentives available under New Jersey Smart Start Programs. The total amount of all qualified incentives is about $800 and includes replacing the AC condensing units, a tankless DHW heater and making lighting system upgrades. 5.2.3 ARRA Initiative “Energy Efficiency Programs through the Clean Energy Program Custom measures allows program participants the opportunity to receive an incentive for unique energy-efficiency measures that are not on the prescriptive equipment Incentive list, but are project/facility specific. We cannot calculate incentives for this program but the facility can call 866-NJSMART (866-657-6278) and press option 4 for additional information and eligibility. The measures that apply are ECM-1, ECM-2, ECM-4, ECM-5, and ECM-6 due to the oil and propane reductions.
5.2.4 Direct Install Program The Bishop Farmstead Offices of Pinelands Preservation Alliance is potentially eligible to receive funding from the Direct Install Program. The total implementation cost for all ECMs potentially eligible for Direct Install funding is about $14,000 and includes the boiler, AC condensing units, and upgrades to the lighting system. The program would pay 60%, or about $8,300 of these initial costs, leaving only $5,700 to be paid out of pocket. Direct Install funding has the potential to significantly reduce the payback period of Energy Conservation Measures. For the Bishop Farmstead Offices of Pinelands Preservation Alliance, the Direct Install Program brings the simple payback of the applicable measures from about 10.0 years, to approximately 4.1 years.
_____________________________________________________________________________ New Jersey BPU - Energy Audits
Page 17 of 25
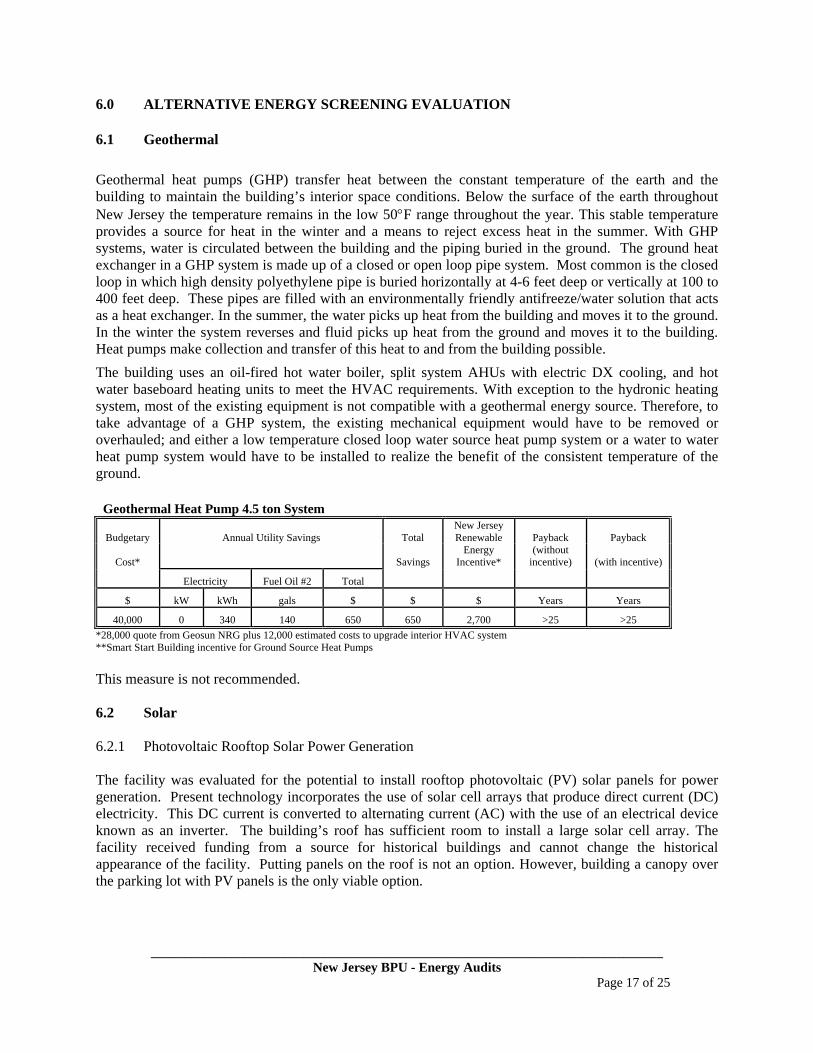
6.0 ALTERNATIVE ENERGY SCREENING EVALUATION 6.1 Geothermal
Geothermal heat pumps (GHP) transfer heat between the constant temperature of the earth and the building to maintain the building’s interior space conditions. Below the surface of the earth throughout New Jersey the temperature remains in the low 50F range throughout the year. This stable temperature provides a source for heat in the winter and a means to reject excess heat in the summer. With GHP systems, water is circulated between the building and the piping buried in the ground. The ground heat exchanger in a GHP system is made up of a closed or open loop pipe system. Most common is the closed loop in which high density polyethylene pipe is buried horizontally at 4-6 feet deep or vertically at 100 to 400 feet deep. These pipes are filled with an environmentally friendly antifreeze/water solution that acts as a heat exchanger. In the summer, the water picks up heat from the building and moves it to the ground. In the winter the system reverses and fluid picks up heat from the ground and moves it to the building. Heat pumps make collection and transfer of this heat to and from the building possible.
The building uses an oil-fired hot water boiler, split system AHUs with electric DX cooling, and hot water baseboard heating units to meet the HVAC requirements. With exception to the hydronic heating system, most of the existing equipment is not compatible with a geothermal energy source. Therefore, to take advantage of a GHP system, the existing mechanical equipment would have to be removed or overhauled; and either a low temperature closed loop water source heat pump system or a water to water heat pump system would have to be installed to realize the benefit of the consistent temperature of the ground.
Geothermal Heat Pump 4.5 ton System
Budgetary Annual Utility Savings Total New Jersey Renewable Payback Payback
Cost*
Savings Energy
Incentive* (without
incentive) (with incentive)
Electricity Fuel Oil #2 Total
$ kW kWh gals $ $ $ Years Years
40,000 0 340 140 650 650 2,700 >25 >25
*28,000 quote from Geosun NRG plus 12,000 estimated costs to upgrade interior HVAC system **Smart Start Building incentive for Ground Source Heat Pumps
This measure is not recommended. 6.2 Solar 6.2.1 Photovoltaic Rooftop Solar Power Generation The facility was evaluated for the potential to install rooftop photovoltaic (PV) solar panels for power generation. Present technology incorporates the use of solar cell arrays that produce direct current (DC) electricity. This DC current is converted to alternating current (AC) with the use of an electrical device known as an inverter. The building’s roof has sufficient room to install a large solar cell array. The facility received funding from a source for historical buildings and cannot change the historical appearance of the facility. Putting panels on the roof is not an option. However, building a canopy over the parking lot with PV panels is the only viable option.

_____________________________________________________________________________ New Jersey BPU - Energy Audits
Page 18 of 25
The PVWATTS solar power generation model was utilized to calculate PV power generation. The closest city available in the model is Philadelphia, Pennsylvania and a fixed tilt array type was utilized to calculate energy production. The PVWATT solar power generation model is provided in Appendix P. Federal tax credits are also available for renewable energy projects up to 30% of installation cost. Since the facility is a non-profit organization, federal taxes are paid and this project is eligible for this incentive. Installation of (PV) arrays in the state New Jersey will allow the owner to participate in the New Jersey solar renewable energy certificates program (SREC). This is a program that has been set up to allow entities with large amounts of environmentally unfriendly emissions to purchase credits from zero emission (PV) solar-producers. An alternative compliance penalty (ACP) is paid for by the high emission producers and is set each year on a declining scale of 3% per year. One SREC credit is equivalent to 1000 kilowatt hours of PV electrical production; these credits can be traded for period of 15 years from the date of installation. The cost of the ACP penalty for 2011 is $600; this is the amount that must be paid per SREC by the high emission producers. The expected dollar amount that will be paid to the PV producer for 2012 is expected to be $700/SREC credit. Payments that will be received from the PV producer will change from year to year dependent upon supply and demand. Renewable Energy Consultants is a third party SREC broker that has been approved by the New Jersey Clean Energy Program. As stated above there is no definitive way to calculate an exact price that will be received by the PV producer per SREC over the next 15 years. Renewable Energy Consultants estimated an average of $487/ SREC per year and this number was utilized in the cash flow for this report. From May 2010 through April 2011 the Bishop Offices at Pinelands Preservation Alliance had a maximum electricity demand of 6.10 kW and a minimum of 2.7 kW. The monthly average over the observed 12 month period was 4.56 kW. The existing load justifies the use of 4.5 kW PV solar array; where incentives can be applied from a federal tax credit and a New Jersey SREC program. The system costs for PV installations were derived from contractor budgetary pricing in the state of New Jersey for estimates of total cost of system installation. It should be noted that the cost of installation is currently about $8.00 per watt or $8,000 per kW of installed system, for a 4.5 kW system. Other cost considerations will also need to be considered. PV panels have an approximate 20 year life span; however, the inverter device that converts DC electricity to AC has a life span of 10 to 12 years and will need to be replaced multiple times during the useful life of the PV system. The implementation cost and savings related to this ECM are presented in Appendix P and summarized as follows:
Photovoltaic (PV) Solar Power Generation - 4.5 kW System
Budgetary Annual Utility Savings Total New Jersey Renewable Payback Payback
Cost*
Savings SREC* (without
incentive) (with incentive)
Electricity Fuel Oil #2 Total
$ kW kWh gals $ $ $ Years Years
36,000 0 5,430 0 1,600 1,600 2,700 22.5 8.6
* Estimated Solar Renewable Energy Certificate Program (SREC) for 15 years at $487/1000 kWh
At 100 square feet per kW of PV panels (rule of thumb), the proposed PV power generation system would require 450 square feet of open space. This measure is recommended because the facility can build a canopy over the parking lot to install these panels and the transmission lines will be short and have a direct route which will minimize installation cost.

_____________________________________________________________________________ New Jersey BPU - Energy Audits
Page 19 of 25
6.2.2 Solar Thermal Hot Water Plant Active solar thermal systems use solar collectors to gather the sun’s energy to heat water, another fluid, or air. An absorber in the collector converts the sun’s energy into heat. The heat is then transferred by circulating water, antifreeze, or sometimes air to another location for immediate use or storage for later utilization. Applications for active solar thermal energy include providing hot water, heating swimming pools, space heating, and preheating air in residential and commercial buildings. A standard solar hot water system is typically composed of solar collectors, heat storage vessel, piping, circulators, and controls. Systems are typically integrated to work alongside a conventional heating system that provides heat when solar resources are not sufficient. The solar collectors are usually placed on the roof of the building, oriented south, and tilted around the site’s latitude, to maximize the amount of radiation collected on a yearly basis. Several options exist for using active solar thermal systems for space heating. The most common method involves using glazed collectors to heat a liquid held in a storage tank (similar to an active solar hot water system). The most practical system would transfer the heat from the panels to thermal storage tanks and transfer solar produced thermal energy to use for domestic hot water production. DHW is presently produced by gas-fired water heaters and, therefore, this measure would offer natural gas utility savings. Currently, an incentive is not available for installation of thermal solar systems. A Federal tax credit of 30% of installation cost for the thermal applications is available; however, The Bishop Farmstead Offices of Pinelands Preservation Alliance does not pay Federal taxes and, therefore, would not benefit from this program. The implementation cost and savings related to this ECM are presented in Appendix Q and summarized as follows:
Solar Thermal Domestic Hot Water Plant
Budgetary Annual Utility Savings Total New Jersey Renewable Payback Payback
Cost*
Savings Energy
Incentive* (without
incentive) (with incentive)
Electricity Fuel Oil #2 Total
$ kW kWh gals $ $ $ Years Years
12,200 0 340 50 200 200 0 >25 >25
* No incentive is available in New Jersey at this time.
This measure is not recommended. 6.3 Wind Small wind turbines use a horizontal axis propeller, or rotor, to capture the kinetic energy of the wind and convert it into rotary motion to drive a generator which usually is designed specifically for the wind turbine. The rotor consists of two or three blades, usually made from wood or fiberglass. These materials give the turbine the needed strength and flexibility, and have the added advantage of not interfering with television signals. The structural backbone of the wind turbine is the mainframe, and includes the slip-rings that connect the wind turbine, which rotates as it points into changing wind directions, and the fixed tower wiring. The tail aligns the rotor into the wind.

_____________________________________________________________________________ New Jersey BPU - Energy Audits
Page 20 of 25
To avoid turbulence and capture greater wind energy, turbines are mounted on towers. Turbines should be mounted at least 30 feet above any structure or natural feature within 300 feet of the installation. Smaller turbines can utilize shorter towers. For example, a 250-watt turbine may be mounted on a 30-50 foot tower, while a 10 kW turbine will usually need a tower of 80-120 feet. Tower designs include tubular or latticed, guyed or self-supporting. Wind turbine manufacturers also provide towers. The New Jersey Clean Energy Program for small wind installations has designated numerous pre-approved wind turbines for installation in the State of New Jersey. Incentives for wind turbine installations are based on kilowatt hours saved in the first year. Systems sized under 16,000 kWh per year of production will receive a $3.20 per kWh incentive. Systems producing over 16,000 kWh will receive $51,200 for the first 16,000 kWh of production with an additional $0.50 per kWh up to a maximum cap of 750,000 kWh per year. Federal tax credits are also available for renewable energy projects at $1,000 per KW or maximum $4,000; however, The Bishop Farmstead Offices of Pinelands Preservation Alliance does not pay Federal taxes and, therefore, would not benefit from this program. The most important part of any small wind generation project is the mean annual wind speed at the height of which the turbine will be installed. Using Retscreen to do an analysis, a mean annual wind speed of about 4.2 miles per hour was utilized. The turbine was sized to handle 100% of the facility load, so the savings would equal the annual electrical usage. From the utility analysis this value is equal to 5,210 kWh. The implementation cost and savings related to this ECM are presented in Appendix R and summarized as follows:
Wind Power Generation – 4.5 kW System
Budgetary Annual Utility Savings Total New Jersey Renewable Payback Payback
Cost*
Savings Energy
Incentive* (without
incentive) (with incentive)
Electricity Fuel Oil #2 Total
$ kW kWh gals $ $ $ Years Years
71,000 0 5,210 0 1,500 1,500 16,700 >25 >25
* Estimated REIP Incentive at $3.20/KWh
This measure is not recommended. 6.4 Combined Heat and Power Generation (CHP)
Combined heat and power, cogeneration, is self-production of electricity on-site with beneficial recovery of the heat byproduct from the electrical generator. Common CHP equipment includes reciprocating engine-driven, micro turbines, steam turbines, and fuel cells. Typical CHP customers include industrial, commercial, institutional, educational institutions, and multifamily residential facilities. CHP systems that are commercially viable at the present time are sized approximately 50 kW and above, with numerous options in blocks grouped around 300 kW, 800 kW, 1,200 kW and larger. Typically, CHP systems are used to produce a portion of the electricity needed by a facility some or all of the time, with the balance of electric needs satisfied by purchase from the grid.
Any proposed CHP project will need to consider many factors, such as existing system load, use of thermal energy produced, system size, natural gas fuel availability, and proposed plant location. The Municipal Complex has sufficient need for electrical generation and the ability to use most of the thermal byproduct during the winter, thermal usage during the summer months is low. Thermal energy produced

_____________________________________________________________________________ New Jersey BPU - Energy Audits
Page 21 of 25
by the CHP plant in the warmer months will be wasted. An absorption chiller could be installed to utilize the heat to produce chilled water; however, there is no chilled water distribution system in the building. The most viable selection for a CHP plant at this location would be a reciprocating engine natural gas-fired unit. Purchasing this system and performing modifications to the existing HVAC and electrical systems would greatly outweigh the savings over the life of the equipment. This measure is not recommended. 6.5 Biomass Power Generation Biomass power generation is a process in which waste organic materials are used to produce electricity or thermal energy. These materials would otherwise be sent to the landfill or expelled to the atmosphere. To participate in NJCEP's Customer On-Site Renewable Energy program, participants must install an on-site sustainable biomass or fuel cell energy generation system. Incentives for bio-power installations are available to support up to 1MW-dc of rated capacity.
*Class I organic residues are eligible for funding through the NJCEP CORE program. Class I wastes include the following renewable supply of organic material:
Wood wastes not adulterated with chemicals, glues or adhesives Agricultural residues (corn stover, rice hulls or nut shells, manures, poultry litter, horse manure,
etc) and/or methane gases from landfills Food wastes Municipal tree trimming and grass clipping wastes Paper and cardboard wastes Non adulterated construction wood wastes, pallets
The NJDEP evaluates biomass resources not identified in the RPS.
Examples of eligible facilities for a CORE incentive include:
Digestion of sewage sludge Landfill gas facilities Combustion of wood wastes to steam turbine Gasification of wood wastes to reciprocating engine Gasification or pyrolysis of bio-solid wastes to generation equipment
* from NJOCE Website This measure is not recommended due to noise issues and because the facility does not have a steady waste stream to utilize as a fuel source. 6.6 Demand Response Curtailment Presently, electricity is delivered by PSE&G, which receives the electricity from regional power grid RFC. PSE&G is the regional transmission organization (RTO) that coordinates the movement of wholesale electricity in all or parts of 13 states and the District of Columbia including the State of New Jersey.

_____________________________________________________________________________ New Jersey BPU - Energy Audits
Page 22 of 25
Utility Curtailment is an agreement with the utility provider’s regional transmission organization and an approved Curtailment Service Provider (CSP) to shed electrical load by either turning major equipment off or energizing all or part of a facility utilizing an emergency generator; therefore, reducing the electrical demand on the utility grid. This program is to benefit the utility company during high demand periods and utility provider offers incentives to the CSP to participate in this program. Enrolling in the program will require program participants to drop electrical load or turn on emergency generators during high electrical demand conditions or during emergencies. Part of the program also will require that program participants reduce their required load or run emergency generators with notice to test the system. A pre-approved CSP will require a minimum of 100 kW of load reduction to participate in any curtailment program. From May 2010 through April 2011 the Bishop Offices at Pinelands Preservation Alliance had a maximum electricity demand of 6.10 kW and a minimum of 2.7 kW. The monthly average over the observed 12 month period was 4.56 kW. This measure is not recommended because the facility does not have adequate load to meet the required minimum load reduction.

_____________________________________________________________________________ New Jersey BPU - Energy Audits
Page 23 of 25
7.0 EPA PORTFOLIO MANAGER The United States Environmental Protection Agency (EPA) is a federal agency in charge of regulating environment waste and policy in the United States. The EPA has released the EPA Portfolio Manager for public use. The program is designed to allow property owners and managers to share, compare and improve upon their facility’s energy consumption. Inputting such parameters as electricity, heating fuel, building characteristics and location into the website based program generates a naturalized energy rating score out of 100. Once an account is registered, monthly utility data can be entered to track the savings progress and retrieve an updated energy rating score on a monthly basis. The Bishop Farmstead Offices of Pinelands Preservation Alliance is considered an average energy consumer per the Portfolio Manager with a Site Energy Usage Index (EUI) of 57 kBTU/ft2/year. This is lower than the national average of 68 KBTU/ft2/year. The EUI can be improved by addressing wasted energy from such sources as inefficient HVAC equipment, poor building envelope components and inefficient lighting systems. By implementing the measures discussed in this report, it is expected that the EUI can be reduced to approximately 47 kBTU/ft2/year. The EPA Portfolio Manager did not generate an energy rating score for this building because it is less than 5000 square feet which is required for the office category, which is not eligible for an energy star rating. A full EPA Energy Star Portfolio Manager Report is located in Appendix S. The user name and password for the building’s EPA Portfolio Manager Account has been provided to Jaclyn Rhoads, Director of Conservation Policy of Bishop Farmstead Offices of Pinelands Preservation Alliance.

_____________________________________________________________________________ New Jersey BPU - Energy Audits
Page 24 of 25
8.0 CONCLUSIONS & RECOMMENDATIONS The energy audit conducted by CHA at Bishop Farmstead Offices of Pinelands Preservation Alliance, identified potential ECMs for insulation upgrades, boiler replacement, AC condensing unit replacement, window and storm window replacement, appliance upgrades, and lighting and occupancy sensor upgrades. Potential annual savings of $3,000 may be realized for the recommended ECMs, with a summary of the costs, savings, and paybacks as follows:
ECM-1 Insulate HHW Piping
Budgetary Annual Utility Savings Estimated Total Potential Payback Payback
Cost Maintenance Savings ROI Incentive* (without (with
Electricity LPG Fuel
Oil #2 Total Savings Incentive) Incentive)
$ kW kWh Gals Gals $ $ $ $ Years Years
200 0 0 0 320 1,200 0 1,200 119.0 NA 0.2 NA
* There is no incentive available through the New Jersey Smart Start or Direct Install Programs for this ECM. See section 5.0 for other incentive opportunities
ECM-2 Boiler Replacement
Budgetary Annual Utility Savings Estimated Total Potential Payback Payback
Cost Maintenance Savings ROI Incentive* (without (with
Electricity LPG Fuel
Oil #2 Total Savings Incentive) Incentive)
$ kW kWh Gals Gals $ $ $ $ Years Years
7,900 0 0 0 140 600 0 600 0.9 4,700 13.2 5.3
* Incentive shown is per the New Jersey Direct Install Program. See section 5.0 for other incentive opportunities.
ECM-3 Replace AC Condensing Units
Budgetary Annual Utility Savings Estimated Total Potential Payback Payback
Cost Maintenance Savings ROI Incentive* (without (with
Electricity LPG Fuel
Oil #2 Total Savings Incentive) Incentive)
$ kW kWh Gals Gals $ $ $ $ Years Years
4,700 0 690 0 0 200 0 200 (0.4) 2,800 23.5 9.5
* Incentive shown is per the New Jersey Direct Install Program. See section 5.0 for other incentive opportunities.
ECM-5 Install Storm Windows
Budgetary Annual Utility Savings Estimated Total Potential Payback Payback
Cost Maintenance Savings ROI Incentive* (without (with
Electricity LPG Fuel
Oil #2 Total Savings Incentive) Incentive)
$ kW kWh Gals Gals $ $ $ $ Years Years
300 0 160 0 30 200 0 200 5.7 NA 1.5 NA
* There is no incentive available through the New Jersey Smart Start or Direct Install Programs for this ECM. See section 5.0 for other incentive opportunities.
_____________________________________________________________________________ New Jersey BPU - Energy Audits
Page 25 of 25
ECM-6 Install Ceiling Insulation
Budgetary Annual Utility Savings Estimated Total Potential Payback Payback
Cost Maintenance Savings ROI Incentive* (without (with
Electricity LPG Fuel
Oil #2 Total Savings Incentive) Incentive)
$ kW kWh Gals Gals $ $ $ $ Years Years
1,700 0 50 0 50 200 0 200 1.8 NA 8.5 NA
* There is no incentive available through the New Jersey Smart Start or Direct Install Programs for this ECM. See section 5.0 for other incentive opportunities.
ECM-12 Lighting Replacements with Occupancy Sensors
Budgetary Annual Utility Savings Estimated Total Potential Payback Payback
Cost Maintenance Savings ROI Incentive* (without (with
Electricity LPG Fuel
Oil #2 Total Savings Incentive) Incentive)
$ kW kWh Gals Gals $ $ $ $ Years Years
1,400 2.4 1,670 0 0 600 0 600 5.4 800 2.3 1.0
* Incentive shown is per the New Jersey Direct Install Program. See section 5.0 for other incentive opportunities.

APPENDIX A
Utility Usage Analysis
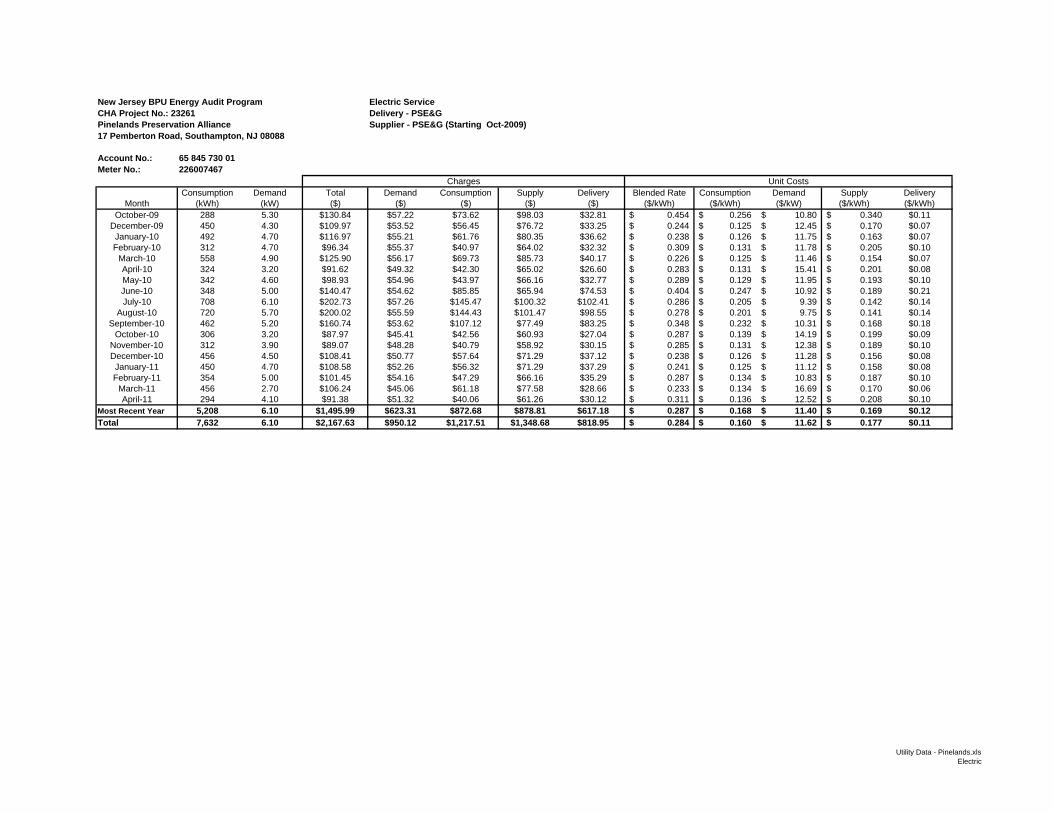
New Jersey BPU Energy Audit Program Electric ServiceCHA Project No.: 23261 Delivery - PSE&GPinelands Preservation Alliance Supplier - PSE&G (Starting Oct-2009)17 Pemberton Road, Southampton, NJ 08088
Account No.: 65 845 730 01Meter No.: 226007467
Consumption Demand Total Demand Consumption Supply Delivery Blended Rate Consumption Demand Supply DeliveryMonth (kWh) (kW) ($) ($) ($) ($) ($) ($/kWh) ($/kWh) ($/kW) ($/kWh) ($/kWh)
October-09 288 5.30 $130.84 $57.22 $73.62 $98.03 $32.81 0.454$ 0.256$ 10.80$ 0.340$ $0.11December-09 450 4.30 $109.97 $53.52 $56.45 $76.72 $33.25 0.244$ 0.125$ 12.45$ 0.170$ $0.07January-10 492 4.70 $116.97 $55.21 $61.76 $80.35 $36.62 0.238$ 0.126$ 11.75$ 0.163$ $0.07February-10 312 4.70 $96.34 $55.37 $40.97 $64.02 $32.32 0.309$ 0.131$ 11.78$ 0.205$ $0.10
March-10 558 4.90 $125.90 $56.17 $69.73 $85.73 $40.17 0.226$ 0.125$ 11.46$ 0.154$ $0.07April-10 324 3.20 $91.62 $49.32 $42.30 $65.02 $26.60 0.283$ 0.131$ 15.41$ 0.201$ $0.08May-10 342 4.60 $98.93 $54.96 $43.97 $66.16 $32.77 0.289$ 0.129$ 11.95$ 0.193$ $0.10June-10 348 5.00 $140.47 $54.62 $85.85 $65.94 $74.53 0.404$ 0.247$ 10.92$ 0.189$ $0.21July-10 708 6.10 $202.73 $57.26 $145.47 $100.32 $102.41 0.286$ 0.205$ 9.39$ 0.142$ $0.14
August-10 720 5.70 $200.02 $55.59 $144.43 $101.47 $98.55 0.278$ 0.201$ 9.75$ 0.141$ $0.14September-10 462 5.20 $160.74 $53.62 $107.12 $77.49 $83.25 0.348$ 0.232$ 10.31$ 0.168$ $0.18
October-10 306 3.20 $87.97 $45.41 $42.56 $60.93 $27.04 0.287$ 0.139$ 14.19$ 0.199$ $0.09November-10 312 3.90 $89.07 $48.28 $40.79 $58.92 $30.15 0.285$ 0.131$ 12.38$ 0.189$ $0.10December-10 456 4.50 $108.41 $50.77 $57.64 $71.29 $37.12 0.238$ 0.126$ 11.28$ 0.156$ $0.08January-11 450 4.70 $108.58 $52.26 $56.32 $71.29 $37.29 0.241$ 0.125$ 11.12$ 0.158$ $0.08February-11 354 5.00 $101.45 $54.16 $47.29 $66.16 $35.29 0.287$ 0.134$ 10.83$ 0.187$ $0.10
March-11 456 2.70 $106.24 $45.06 $61.18 $77.58 $28.66 0.233$ 0.134$ 16.69$ 0.170$ $0.06April-11 294 4.10 $91.38 $51.32 $40.06 $61.26 $30.12 0.311$ 0.136$ 12.52$ 0.208$ $0.10
Most Recent Year 5,208 6.10 $1,495.99 $623.31 $872.68 $878.81 $617.18 0.287$ 0.168$ 11.40$ 0.169$ $0.12Total 7,632 6.10 $2,167.63 $950.12 $1,217.51 $1,348.68 $818.95 0.284$ 0.160$ 11.62$ 0.177$ $0.11
Charges Unit Costs
Utility Data - Pinelands.xlsElectric
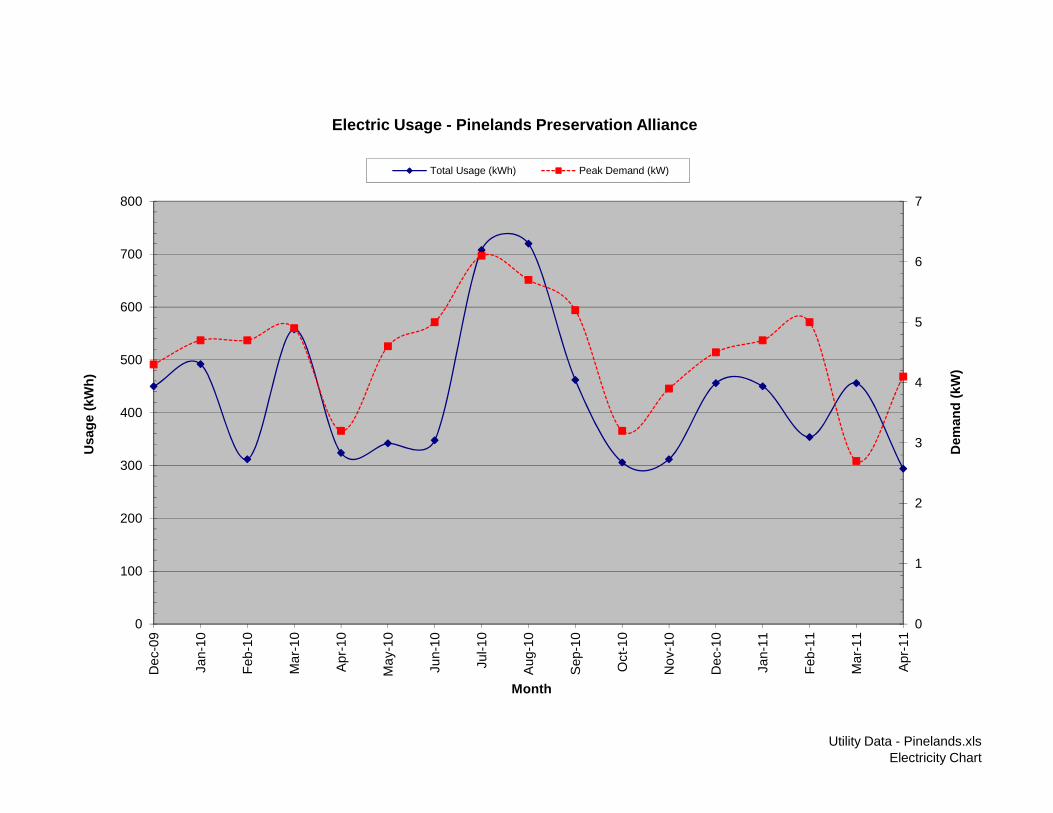
Utility Data - Pinelands.xlsElectricity Chart
0
1
2
3
4
5
6
7
0
100
200
300
400
500
600
700
800
Dec
-09
Jan-
10
Feb-
10
Mar
-10
Apr
-10
May
-10
Jun-
10
Jul-1
0
Aug
-10
Sep
-10
Oct
-10
Nov
-10
Dec
-10
Jan-
11
Feb-
11
Mar
-11
Apr
-11
Dem
and
(kW
)
Usa
ge (k
Wh)
Month
Electric Usage - Pinelands Preservation Alliance
Total Usage (kWh) Peak Demand (kW)
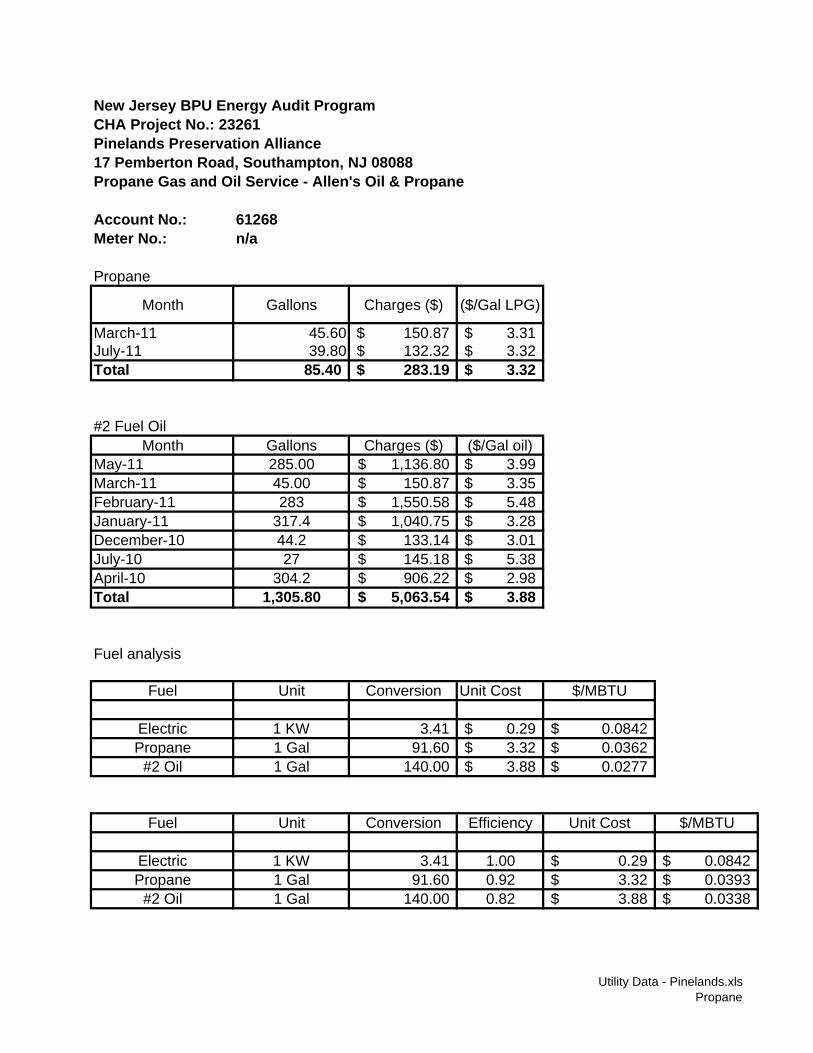
New Jersey BPU Energy Audit ProgramCHA Project No.: 23261Pinelands Preservation Alliance17 Pemberton Road, Southampton, NJ 08088Propane Gas and Oil Service - Allen's Oil & Propane
Account No.: 61268Meter No.: n/a
Propane
Month Gallons Charges ($) ($/Gal LPG)
March-11 45.60 150.87$ 3.31$ July-11 39.80 132.32$ 3.32$ Total 85.40 283.19$ 3.32$
#2 Fuel OilMonth Gallons Charges ($) ($/Gal oil)
May-11 285.00 1,136.80$ 3.99$ March-11 45.00 150.87$ 3.35$ February-11 283 1,550.58$ 5.48$ January-11 317.4 1,040.75$ 3.28$ December-10 44.2 133.14$ 3.01$ July-10 27 145.18$ 5.38$ April-10 304.2 906.22$ 2.98$ Total 1,305.80 5,063.54$ 3.88$
Fuel analysis
Fuel Unit Conversion Unit Cost $/MBTU
Electric 1 KW 3.41 0.29$ 0.0842$ Propane 1 Gal 91.60 3.32$ 0.0362$
#2 Oil 1 Gal 140.00 3.88$ 0.0277$
Fuel Unit Conversion Efficiency Unit Cost $/MBTU
Electric 1 KW 3.41 1.00 0.29$ 0.0842$ Propane 1 Gal 91.60 0.92 3.32$ 0.0393$
#2 Oil 1 Gal 140.00 0.82 3.88$ 0.0338$
Utility Data - Pinelands.xlsPropane

Utility Data - Pinelands.xlsFuel Oil #2 Chart
$-
$1
$2
$3
$4
$5
$6
0
50
100
150
200
250
300
350
400
Apr
-10
May
-10
Jun-
10
Jul-1
0
Aug
-10
Sep
-10
Oct
-10
Nov
-10
Dec
-10
Jan-
11
Feb-
11
Mar
-11
Apr
-11
May
-11
Uni
t cos
t ($/
Gal
lon
Oil)
Usa
ge (G
al O
il #2
)
Month
Propane Gas Usage - Pinelands Preservation Alliance
Total Fuel Oil #2 Purchases (Gals) Fuel Oil #2 Unit Cost ($/Gallon Oil)

APPENDIX B
Project Summary

Pinelands Preservation AllianceCHA #23261Engineer: GRE 0.287$ $/kWh blended
0.168$ $/kWh supplyProject Summary 11.395$ $/kW
3.878$ $/Gal #2 OilReturn on Investemet (ROI) = (Gain from Investment - Cost of Investment) / Cost of Investment 3.316$ $/Gal LPG
Item Cost Simple NJ Smart Start Direct Install Direct Install Max Payback w/ Life ROIkW kWh Gals kWh Gals kGals $ Payback Incentives Eligible (Y/N)* Incentives** Incentives Incentives*** Years kW kWh Gals Oil Gals LPG kgals $
demand supply #2 Oil cooling LPG water Total
ECM-1 Insulate HHW Piping 0.0 0 320 0 0 0 $ 1,200 $ 200 0.2 -$ N -$ -$ 0.2 20 0.0 - 6,400 - - 24,000$ 119.0 ECM-2 Boiler Replacement 0.0 0 140 0 0 0 $ 600 $ 7,900 13.2 -$ Y 4,700$ 4,700$ 5.3 25 0.0 - 3,500 - - 15,000$ 0.9 ECM-3 Replace AC Condensing Units 0.0 0 0 690 0 0 $ 200 $ 4,700 23.5 400$ Y 2,800$ 2,800$ 9.5 15 0.0 10,350 - - - 3,000$ (0.4) ECM-4 Replace Basement Windows 0.0 0 20 0 0 0 $ 100 $ 1,100 11.0 -$ N -$ -$ 11.0 30 0.0 - 600 - - 3,000$ 1.7 ECM-5 Install Storm Window Seals 0.0 0 30 160 0 0 $ 200 $ 300 1.5 -$ N -$ -$ 1.5 10 0.0 1,600 300 - - 2,000$ 5.7 ECM-6 Install Ceiling Insulation 0.0 0 50 50 0 0 $ 200 $ 1,700 8.5 -$ N -$ -$ 8.5 24 0.0 1,200 1,200 - - 4,800$ 1.8 ECM-7 Replace Domestic Hot Water Heater 0.0 0 0 0 60 0 $ 200 $ 3,500 17.5 300$ N -$ 300$ 16.0 12 0.0 - - 720 - 2,400$ (0.3) ECM-8 Install Low-Flow Plumbing Fixtures 0.0 0 0 0 0 20 $ - $ 2,500 - -$ N -$ -$ - 15 0.0 - - - 300 -$ (1.0) ECM-9 Install Energy Star Appliances 0.0 310 0 0 0 3 $ 100 $ 1,100 11.0 -$ N -$ -$ 11.0 12 0.0 3,720 - - 30 1,200$ 0.1 ECM-10 Lighting Replacements 2.4 1,630 0 0 0 0 $ 600 $ 1,000 1.7 15$ Y 600$ 600$ 0.7 15 36.1 24,450 - - - 9,000$ 8.0 ECM-11 Install Occupancy Sensors 0.0 490 0 0 0 0 $ 100 $ 400 4.0 60$ Y 200$ 200$ 2.0 15 0.0 7,350 - - - 1,500$ 2.8 ECM-12 Lighting Replacements with Occupancy Sensors 2.4 1,670 0 0 0 0 $ 600 $ 1,400 2.3 75$ Y 800$ 800$ 1.0 15 36.1 25,050 - - - 9,000$ 5.4
Total Does not include ECM-10 and ECM-11 2.4 1,980 560 900 60 23 $ 3,400 $ 24,400 7.2 775$ 8,300$ 8,600$ 4.6 18 36.1 41,920 12,000 720 330 64,400$ 1.6
Total Measures w/ Positive ROI only 2.4 1,980 560 210 0 3 $ 3,000 $ 13,700 4.6 75$ 5,500$ 5,500$ 2.7 18 36.1 31,570 12,000 0 30 $ 59,000 3.3 * Eligibility for the Direct Install Program was estimated by the project engineer per the program guidelines. Final eligibility is determined by TRC and the qualified Direct Install participating contractor. ** Value reflects the maximum potential incentive through the NJ Direct Install Program. Amount is subject to change per TRC and the qualified Direct Install participating contractor.*** Payback calculated using the greatest incentive available through either the NJ Smart Start Program or the Direct Install Program. Other incentives may be available for this measure that are not reflected here. See Section 5.0 of the report.
Utility Costs
Bishop Farmstead OfficesAnnual Savings Project Life Savings

APPENDIX C
ECM-1 Insulate HHW Piping
Pinelands Preservation AllianceCHA #23261Building: Bishop Farmstead Offices
ECM-1 Insulate HHW Piping
Description Insulate heating system piping which are not currently insulated to reduce heat loss from piping and heat gain to the spaces.
Given Fuel Energy Cost = 3.88$ 6Operation (Hours/Week) = 45 Hours/WeekOperation (Heating Weeks/Year) = 24 Weeks/YearOperation (Hours/Year) = 1080 Hours/YearHeating Media = 1 Piping Material = 3Ambient Temperature = 65 oF
Pipe #1 Pipe #2 Pipe #3 Pipe #4Pipe Diameter = 2.00 inches 5.00 inches 8.00 inches 5.00 inches
Pipe Length = 450.00 feet 0.00 feet 0.00 feet 0.00 feet
Assumption Min. Pipe Insulation Recommended = 1.00 inches 1.50 inches 1.50 inches 1.50 inchesCirculating Temperature = 3 oFHeating Efficiency = 82% Pipe Insulation Conductivity = 0.29 Btu*in./(h*ft2*F)
Formula Piping Correction Factor = (Current Transmission Coefficient / Reference Transmission Coefficient)Temperature Correction Factor = (Circulating Temperature - Ambient Temperature) / (Circulating Temperature - Reference Temperature)Hourly Heat Loss per pipe size and length = (Heat loss per foot [from chart]) x (Piping Correction Factor) x (Temperature Correction Factor) x (Pipe Length)Seasonal Heat Loss = (Hourly Heat Loss Total) x (Operating hours) / (Heating Efficiency) / (1,000 btu/Mbtu)
Energy Loss = (Seasonal Heat Loss) / (Conversion Factor [MBtu/Unit])Energy Loss Cost = (Energy Loss) x (cost/unit)
Calculation Existing Current Transmission Coefficient Reference Transmission Coefficient Piping Correction Factor = ( 2.25 / 2.00 ) = 1.13
Circulating Temp. Ambient Temp. Circulating Temp. Reference Temp.Temperature Correction Factor = ( 180 - 65 ) / ( 180 - 80 ) = 1.15
Heat Loss per foot Piping CF Temperature CF Pipe LengthHeat Loss Pipe #1 (Hourly) = ( 72.50 ) x ( 1.13 ) x ( 1.15 ) x ( 450.00 ) = 42,209 BtuhHeat Loss Pipe #2 (Hourly) = ( 151.80 ) x ( 1.13 ) x ( 1.15 ) x ( 0.00 ) = - BtuhHeat Loss Pipe #3 (Hourly) = ( 271.60 ) x ( 1.13 ) x ( 1.15 ) x ( 0.00 ) = - BtuhHeat Loss Pipe #4 (Hourly) = ( 151.80 ) x ( 1.13 ) x ( 1.15 ) x ( 0.00 ) = - Btuh
42,209 BtuhHourly Heat Loss operating Hours Heating Efficiency Factor
Seasonal Heat Loss = 42,209 ) x ( 1,080 ) / ( 82% ) / ( 1,000 ) = 55,592 MbtuSeasonal Heat Loss Btu/unit
Existing Energy Loss 55,592 ) / ( 139 ) = 400 Unit Cost per Unit
Existing Energy Loss Cost = ( 400 ) x ( 3.88$ ) = 1,551$
New Heat Loss per foot Piping CF Temperature CF Pipe LengthHeat Loss Pipe #1 (Hourly) = ( 14.00 ) x ( 1.13 ) x ( 1.15 ) x ( 450.00 ) = 8,151 BtuhHeat Loss Pipe #2 (Hourly) = ( 17.00 ) x ( 1.13 ) x ( 1.15 ) x ( 0.00 ) = - BtuhHeat Loss Pipe #3 (Hourly) = ( 22.00 ) x ( 1.13 ) x ( 1.15 ) x ( 0.00 ) = - BtuhHeat Loss Pipe #4 (Hourly) = ( 17.00 ) x ( 1.13 ) x ( 1.15 ) x ( 0.00 ) = - Btuh
8,151 BtuhHourly Heat Loss operating Hours Heating Efficiency Factor
Seasonal Heat Loss = 8,151 ) x ( 1,080 ) / ( 82% ) / ( 1,000 ) = 10,735 MbtuSeasonal Heat Loss Btu/unit
New Energy Loss 10,735 ) / ( 139 ) = 77 Unit Cost per Unit
New Energy Loss Cost = 77 ) x ( 3.88$ ) = 299$
Result Existing Heat Loss 400 gallonsNew Heat Loss 77 gallons Savings 100% 323 gallons 80.7%
Comment
1,551$ 299$
1,251$
gallons
gallons
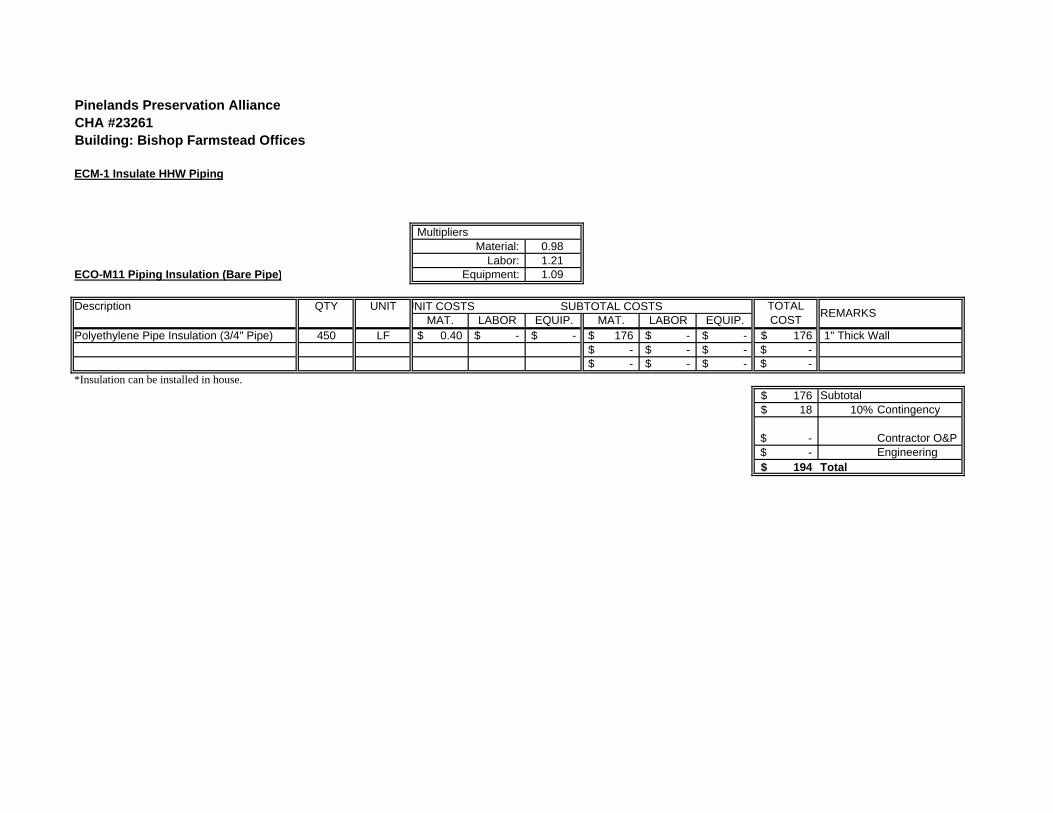
Pinelands Preservation AllianceCHA #23261Building: Bishop Farmstead Offices
ECM-1 Insulate HHW Piping
MultipliersMaterial: 0.98
Labor: 1.21ECO-M11 Piping Insulation (Bare Pipe) Equipment: 1.09
Description QTY UNIT UNIT COSTS SUBTOTAL COSTSMAT. LABOR EQUIP. MAT. LABOR EQUIP.
Polyethylene Pipe Insulation (3/4" Pipe) 450 LF 0.40$ -$ -$ 176$ -$ -$ 176$ 1" Thick Wall-$ -$ -$ -$ -$ -$ -$ -$
*Insulation can be installed in house.
176$ Subtotal18$ 10% Contingency
-$ Contractor O&P-$ Engineering
194$ Total
TOTAL COST REMARKS

APPENDIX D
ECM-2 Boiler Replacement

Pinelands Preservation AllianceCHA #23261Building: Bishop Farmstead Offices
ECM-2 Boiler Replacement
Existing FuelProposed Fuel
Item Value UnitsBaseline Fuel Cost 3.88$ Proposed Fuel Cost 3.88$
Baseline Fuel Use 1,306 Gals #2Existing Boiler Plant Efficiency 82%Baseline Boiler Load 148,537 Mbtu/yrBaseline Fuel Cost 5,064$
Proposed Boiler Plant Efficiency 92%Proposed Fuel Use 1,164 Gals #2 Proposed Fuel Cost 4,514$
Annual Savings 142 Gals #2Annual Savings 550$ /yr
Formula/Comments
Based on historical utility dataEstimated or MeasuredBaseline Fuel Use x Existing Efficiency x 138.7 Mbtu/Gals #2
New Boiler EfficiencyBaseline Boiler Load / Proposed Efficiency / 138.7 Mbtu/Gals #2
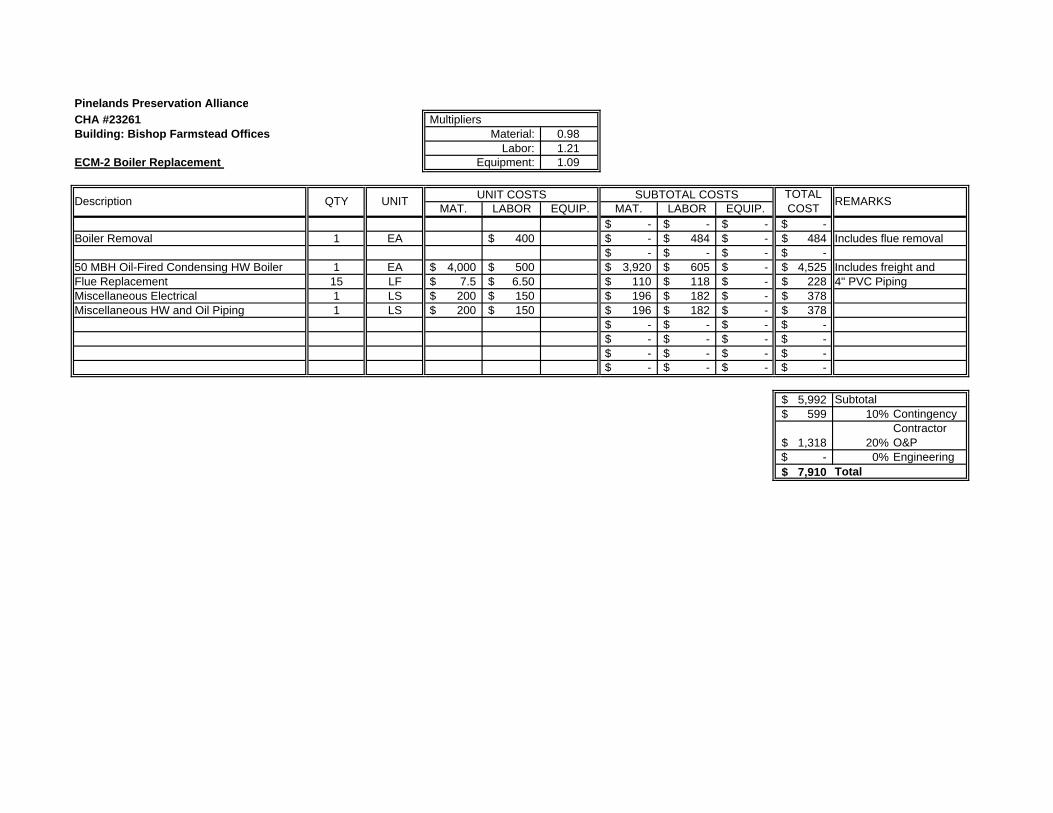
Pinelands Preservation AllianceCHA #23261 MultipliersBuilding: Bishop Farmstead Offices Material: 0.98
Labor: 1.21ECM-2 Boiler Replacement Equipment: 1.09
MAT. LABOR EQUIP. MAT. LABOR EQUIP.-$ -$ -$ -$
Boiler Removal 1 EA 400$ -$ 484$ -$ 484$ -$ -$ -$ -$
50 MBH Oil-Fired Condensing HW Boiler 1 EA 4,000$ 500$ 3,920$ 605$ -$ 4,525$ Flue Replacement 15 LF 7.5$ 6.50$ 110$ 118$ -$ 228$ Miscellaneous Electrical 1 LS 200$ 150$ 196$ 182$ -$ 378$ Miscellaneous HW and Oil Piping 1 LS 200$ 150$ 196$ 182$ -$ 378$
-$ -$ -$ -$ -$ -$ -$ -$ -$ -$ -$ -$ -$ -$ -$ -$
5,992$ Subtotal599$ 10% Contingency
1,318$ 20%Contractor O&P
-$ 0% Engineering7,910$
Includes freight and 4" PVC Piping
Total
SUBTOTAL COSTS
Includes flue removal
Description QTY UNIT UNIT COSTS TOTAL COST REMARKS

APPENDIX E
ECM-3 Replace AC Condensing Units
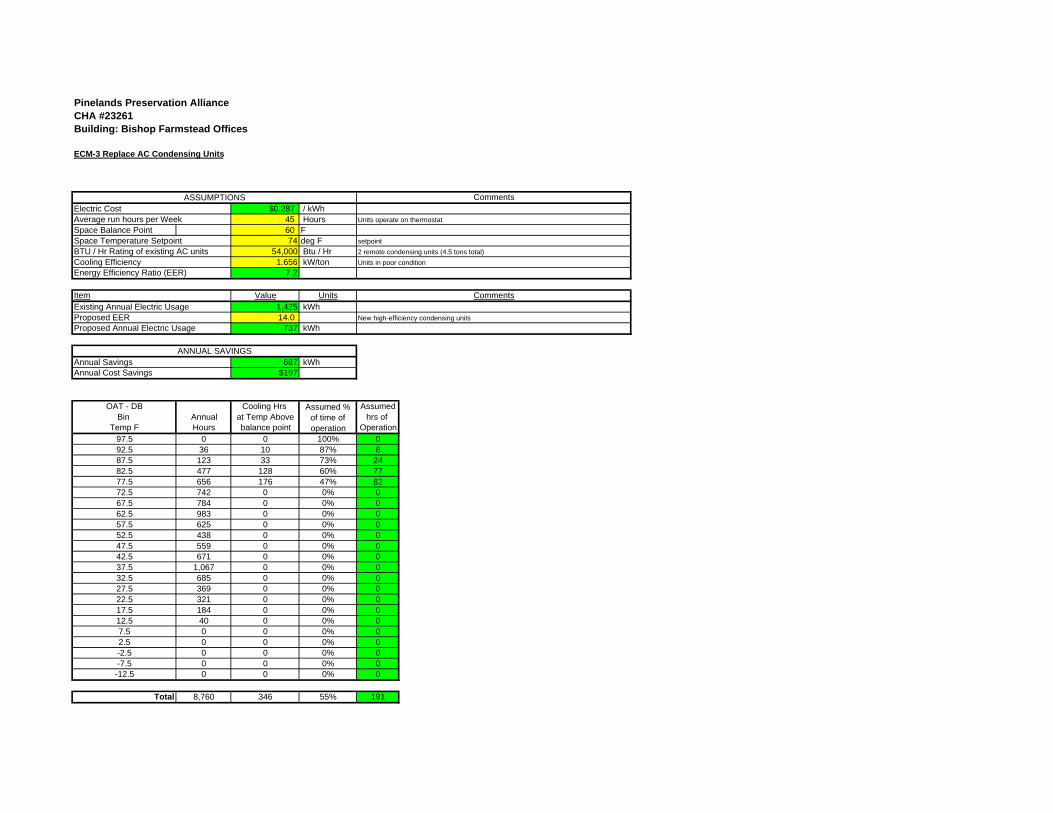
Pinelands Preservation AllianceCHA #23261Building: Bishop Farmstead Offices
ECM-3 Replace AC Condensing Units
Electric Cost $0.287 / kWhAverage run hours per Week 45 HoursSpace Balance Point 60 FSpace Temperature Setpoint 74 deg FBTU / Hr Rating of existing AC units 54,000 Btu / HrCooling Efficiency 1.656 kW/tonEnergy Efficiency Ratio (EER) 7.2
Item Value UnitsExisting Annual Electric Usage 1,425 kWhProposed EER 14.0Proposed Annual Electric Usage 737 kWh
Annual Savings 687 kWhAnnual Cost Savings $197
OAT - DB Cooling Hrs AssumedBin Annual at Temp Above hrs of
Temp F Hours balance point Operation97.5 0 0 100% 092.5 36 10 87% 887.5 123 33 73% 2482.5 477 128 60% 7777.5 656 176 47% 8272.5 742 0 0% 067.5 784 0 0% 062.5 983 0 0% 057.5 625 0 0% 052.5 438 0 0% 047.5 559 0 0% 042.5 671 0 0% 037.5 1,067 0 0% 032.5 685 0 0% 027.5 369 0 0% 022.5 321 0 0% 017.5 184 0 0% 012.5 40 0 0% 07.5 0 0 0% 02.5 0 0 0% 0-2.5 0 0 0% 0-7.5 0 0 0% 0-12.5 0 0 0% 0
Total 8,760 346 55% 191
Assumed % of time of operation
setpoint
New high-efficiency condensing units
2 remote condensing units (4.5 tons total)
Comments
Units in poor condition
ASSUMPTIONS Comments
Units operate on thermostat
ANNUAL SAVINGS
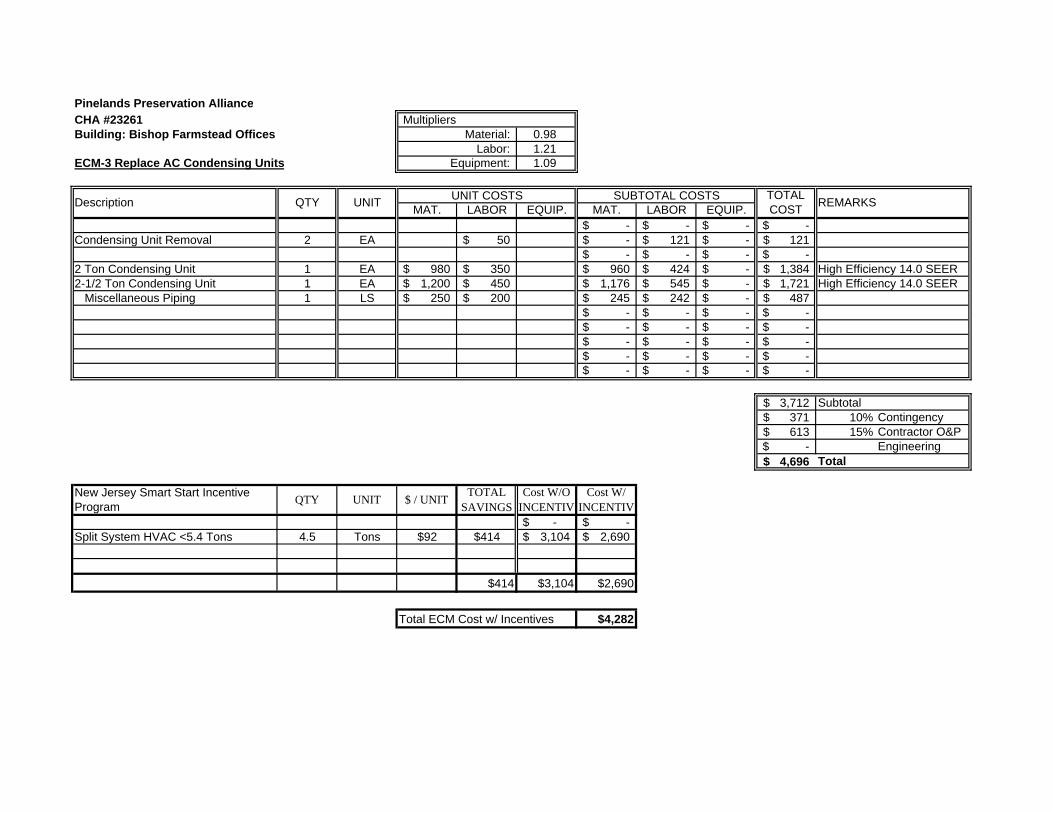
Pinelands Preservation AllianceCHA #23261 MultipliersBuilding: Bishop Farmstead Offices Material: 0.98
Labor: 1.21ECM-3 Replace AC Condensing Units Equipment: 1.09
MAT. LABOR EQUIP. MAT. LABOR EQUIP.-$ -$ -$ -$
Condensing Unit Removal 2 EA 50$ -$ 121$ -$ 121$ -$ -$ -$ -$
2 Ton Condensing Unit 1 EA 980$ 350$ 960$ 424$ -$ 1,384$ 2-1/2 Ton Condensing Unit 1 EA 1,200$ 450$ 1,176$ 545$ -$ 1,721$
Miscellaneous Piping 1 LS 250$ 200$ 245$ 242$ -$ 487$ -$ -$ -$ -$ -$ -$ -$ -$ -$ -$ -$ -$ -$ -$ -$ -$ -$ -$ -$ -$
3,712$ Subtotal371$ 10% Contingency613$ 15% Contractor O&P
-$ Engineering4,696$
-$ -$ 4.5 Tons $92 $414 3,104$ 2,690$
$414 $3,104 $2,690
Total ECM Cost w/ Incentives $4,282
TOTAL SAVINGS
Cost W/O INCENTIV
High Efficiency 14.0 SEERHigh Efficiency 14.0 SEER
Cost W/ INCENTIV
UNIT $ / UNIT
Split System HVAC <5.4 Tons
New Jersey Smart Start Incentive Program QTY
REMARKS
Total
Description QTY UNIT UNIT COSTS SUBTOTAL COSTS TOTAL COST

APPENDIX F
ECM-4 Replace Basement Windows
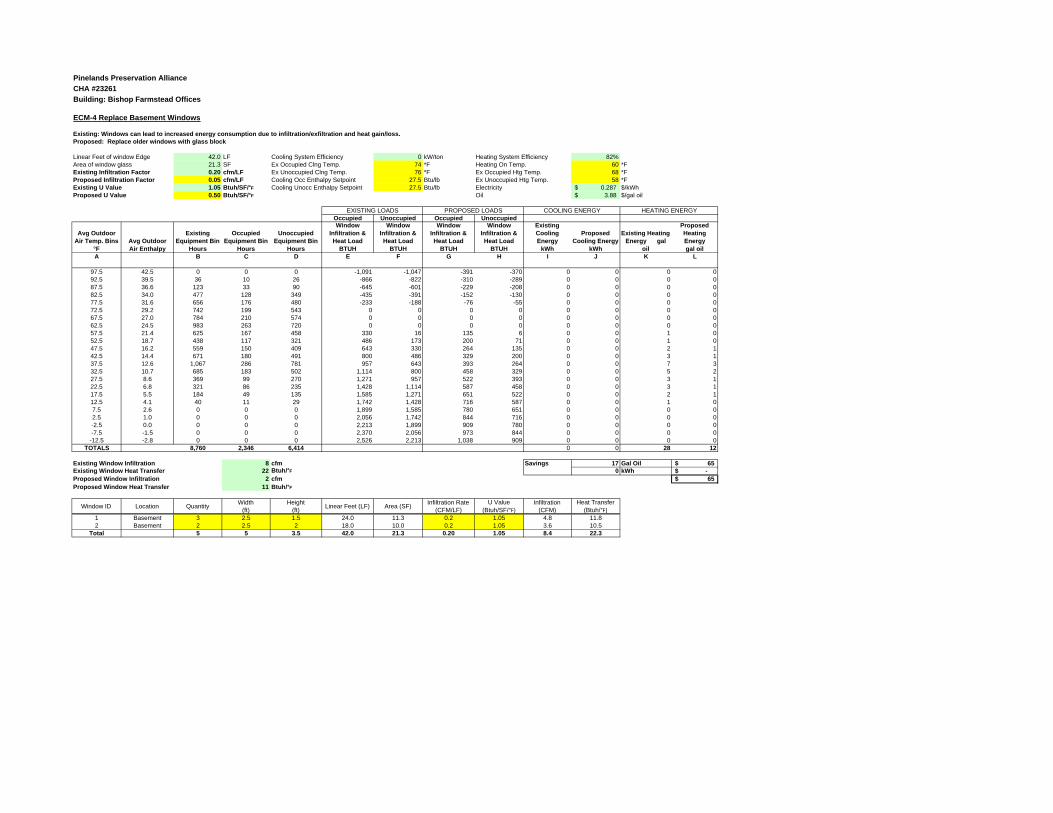
Pinelands Preservation AllianceCHA #23261Building: Bishop Farmstead Offices
ECM-4 Replace Basement Windows
Existing: Windows can lead to increased energy consumption due to infiltration/exfiltration and heat gain/loss. Proposed: Replace older windows with glass block
Linear Feet of window Edge 42.0 LF Cooling System Efficiency 0 kW/ton Heating System Efficiency 82%Area of window glass 21.3 SF Ex Occupied Clng Temp. 74 *F Heating On Temp. 60 *FExisting Infiltration Factor 0.20 cfm/LF Ex Unoccupied Clng Temp. 76 *F Ex Occupied Htg Temp. 68 *FProposed Infiltration Factor 0.05 cfm/LF Cooling Occ Enthalpy Setpoint 27.5 Btu/lb Ex Unoccupied Htg Temp. 58 *FExisting U Value 1.05 Btuh/SF/°F Cooling Unocc Enthalpy Setpoint 27.5 Btu/lb Electricity 0.287$ $/kWh Proposed U Value 0.50 Btuh/SF/°F Oil 3.88$ $/gal oil
Occupied Unoccupied Occupied Unoccupied
Avg Outdoor Air Temp. Bins
°FAvg Outdoor Air Enthalpy
Existing Equipment Bin
Hours
Occupied Equipment Bin
Hours
Unoccupied Equipment Bin
Hours
Window Infiltration & Heat Load
BTUH
Window Infiltration & Heat Load
BTUH
Window Infiltration & Heat Load
BTUH
Window Infiltration & Heat Load
BTUH
Existing Cooling Energy
kWh
Proposed Cooling Energy
kWh
Existing Heating Energy gal
oil
Proposed Heating Energy gal oil
A B C D E F G H I J K L
97.5 42.5 0 0 0 -1,091 -1,047 -391 -370 0 0 0 092.5 39.5 36 10 26 -866 -822 -310 -289 0 0 0 087.5 36.6 123 33 90 -645 -601 -229 -208 0 0 0 082.5 34.0 477 128 349 -435 -391 -152 -130 0 0 0 077.5 31.6 656 176 480 -233 -188 -76 -55 0 0 0 072.5 29.2 742 199 543 0 0 0 0 0 0 0 067.5 27.0 784 210 574 0 0 0 0 0 0 0 062.5 24.5 983 263 720 0 0 0 0 0 0 0 057.5 21.4 625 167 458 330 16 135 6 0 0 1 052.5 18.7 438 117 321 486 173 200 71 0 0 1 047.5 16.2 559 150 409 643 330 264 135 0 0 2 142.5 14.4 671 180 491 800 486 329 200 0 0 3 137.5 12.6 1,067 286 781 957 643 393 264 0 0 7 332.5 10.7 685 183 502 1,114 800 458 329 0 0 5 227.5 8.6 369 99 270 1,271 957 522 393 0 0 3 122.5 6.8 321 86 235 1,428 1,114 587 458 0 0 3 117.5 5.5 184 49 135 1,585 1,271 651 522 0 0 2 112.5 4.1 40 11 29 1,742 1,428 716 587 0 0 1 07.5 2.6 0 0 0 1,899 1,585 780 651 0 0 0 02.5 1.0 0 0 0 2,056 1,742 844 716 0 0 0 0-2.5 0.0 0 0 0 2,213 1,899 909 780 0 0 0 0-7.5 -1.5 0 0 0 2,370 2,056 973 844 0 0 0 0
-12.5 -2.8 0 0 0 2,526 2,213 1,038 909 0 0 0 0TOTALS 8,760 2,346 6,414 0 0 28 12
Existing Window Infiltration 8 cfm Savings 17 Gal Oil 65$ Existing Window Heat Transfer 22 Btuh/°F 0 kWh -$ Proposed Window Infiltration 2 cfm 65$ Proposed Window Heat Transfer 11 Btuh/°F
Window ID Location Quantity Width (ft)
Height (ft) Linear Feet (LF) Area (SF) Infiltration Rate
(CFM/LF)U Value
(Btuh/SF/°F)Infiltration
(CFM)Heat Transfer
(Btuh/°F)1 Basement 3 2.5 1.5 24.0 11.3 0.2 1.05 4.8 11.82 Basement 2 2.5 2 18.0 10.0 0.2 1.05 3.6 10.5
Total 5 5 3.5 42.0 21.3 0.20 1.05 8.4 22.3
EXISTING LOADS PROPOSED LOADS COOLING ENERGY HEATING ENERGY
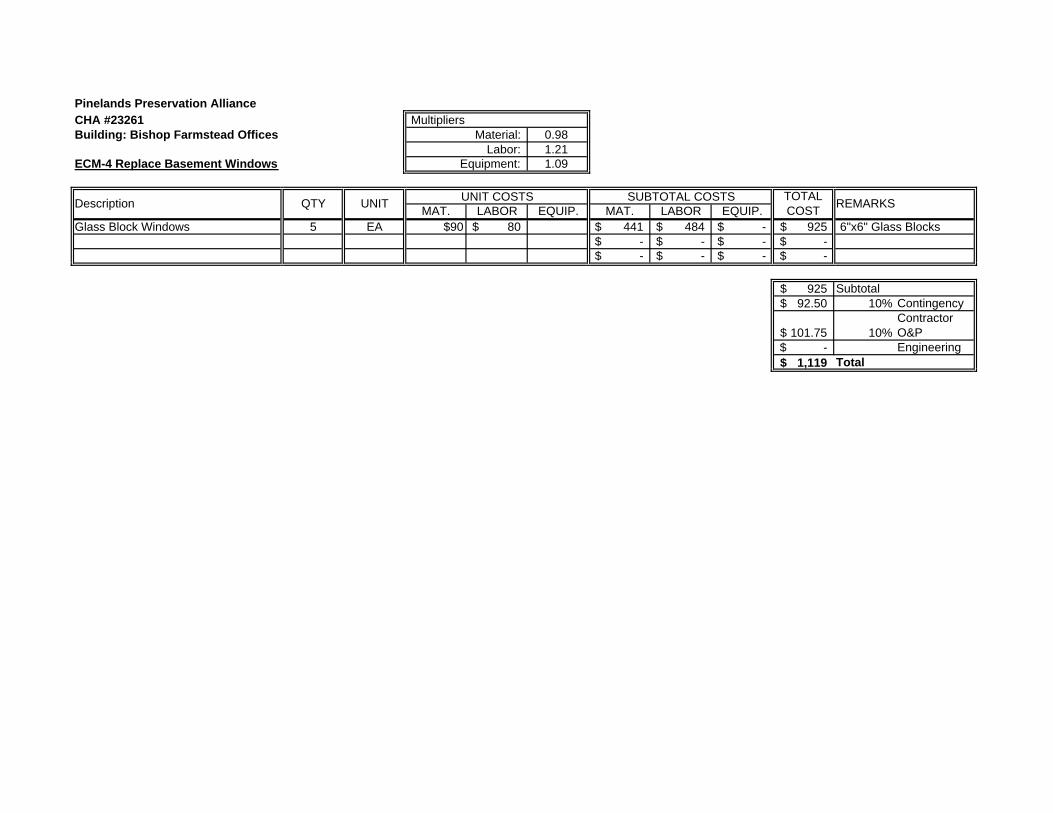
Pinelands Preservation AllianceCHA #23261 MultipliersBuilding: Bishop Farmstead Offices Material: 0.98
Labor: 1.21ECM-4 Replace Basement Windows Equipment: 1.09
MAT. LABOR EQUIP. MAT. LABOR EQUIP.Glass Block Windows 5 EA $90 80$ 441$ 484$ -$ 925$ 6"x6" Glass Blocks
-$ -$ -$ -$ -$ -$ -$ -$
925$ Subtotal92.50$ 10% Contingency
101.75$ 10%Contractor O&P
-$ Engineering1,119$
REMARKS
Total
Description QTY UNIT UNIT COSTS SUBTOTAL COSTS TOTAL COST

APPENDIX G
ECM-5 Install Storm Window Seals
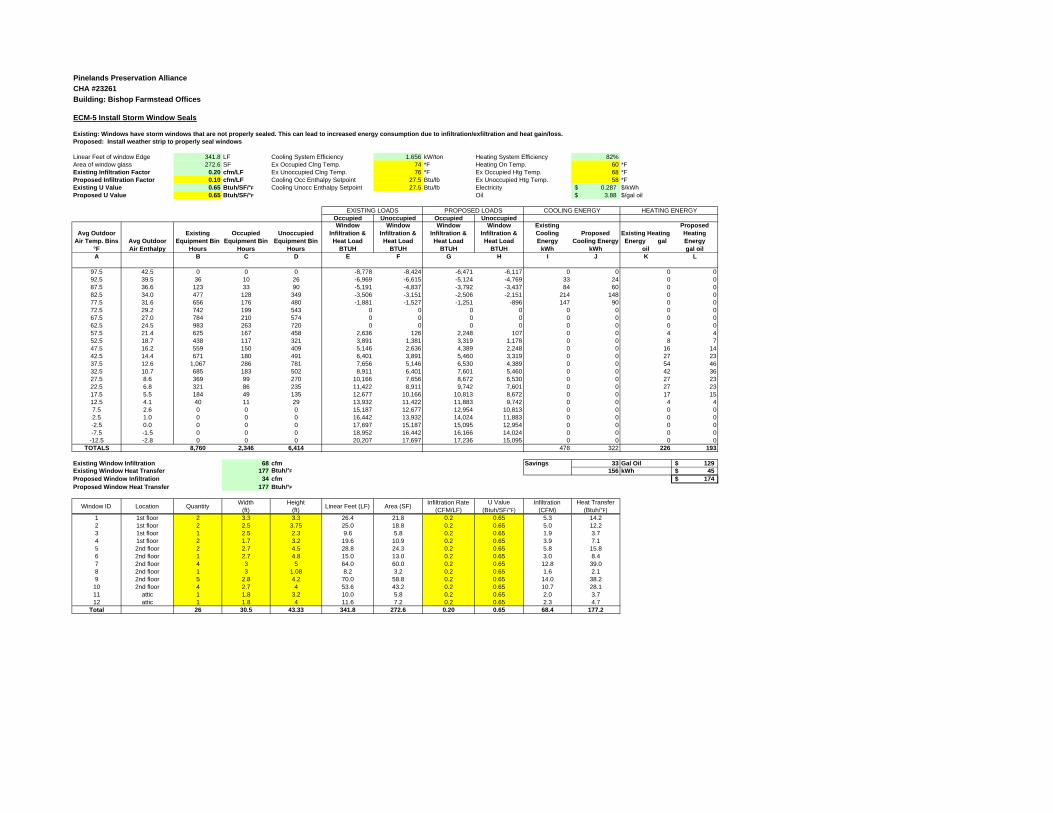
Pinelands Preservation AllianceCHA #23261Building: Bishop Farmstead Offices
ECM-5 Install Storm Window Seals
Existing: Windows have storm windows that are not properly sealed. This can lead to increased energy consumption due to infiltration/exfiltration and heat gain/loss. Proposed: Install weather strip to properly seal windows
Linear Feet of window Edge 341.8 LF Cooling System Efficiency 1.656 kW/ton Heating System Efficiency 82%Area of window glass 272.6 SF Ex Occupied Clng Temp. 74 *F Heating On Temp. 60 *FExisting Infiltration Factor 0.20 cfm/LF Ex Unoccupied Clng Temp. 76 *F Ex Occupied Htg Temp. 68 *FProposed Infiltration Factor 0.10 cfm/LF Cooling Occ Enthalpy Setpoint 27.5 Btu/lb Ex Unoccupied Htg Temp. 58 *FExisting U Value 0.65 Btuh/SF/°F Cooling Unocc Enthalpy Setpoint 27.5 Btu/lb Electricity 0.287$ $/kWh Proposed U Value 0.65 Btuh/SF/°F Oil 3.88$ $/gal oil
Occupied Unoccupied Occupied Unoccupied
Avg Outdoor Air Temp. Bins
°FAvg Outdoor Air Enthalpy
Existing Equipment Bin
Hours
Occupied Equipment Bin
Hours
Unoccupied Equipment Bin
Hours
Window Infiltration & Heat Load
BTUH
Window Infiltration & Heat Load
BTUH
Window Infiltration & Heat Load
BTUH
Window Infiltration & Heat Load
BTUH
Existing Cooling Energy
kWh
Proposed Cooling Energy
kWh
Existing Heating Energy gal
oil
Proposed Heating Energy gal oil
A B C D E F G H I J K L
97.5 42.5 0 0 0 -8,778 -8,424 -6,471 -6,117 0 0 0 092.5 39.5 36 10 26 -6,969 -6,615 -5,124 -4,769 33 24 0 087.5 36.6 123 33 90 -5,191 -4,837 -3,792 -3,437 84 60 0 082.5 34.0 477 128 349 -3,506 -3,151 -2,506 -2,151 214 148 0 077.5 31.6 656 176 480 -1,881 -1,527 -1,251 -896 147 90 0 072.5 29.2 742 199 543 0 0 0 0 0 0 0 067.5 27.0 784 210 574 0 0 0 0 0 0 0 062.5 24.5 983 263 720 0 0 0 0 0 0 0 057.5 21.4 625 167 458 2,636 126 2,248 107 0 0 4 452.5 18.7 438 117 321 3,891 1,381 3,319 1,178 0 0 8 747.5 16.2 559 150 409 5,146 2,636 4,389 2,248 0 0 16 1442.5 14.4 671 180 491 6,401 3,891 5,460 3,319 0 0 27 2337.5 12.6 1,067 286 781 7,656 5,146 6,530 4,389 0 0 54 4632.5 10.7 685 183 502 8,911 6,401 7,601 5,460 0 0 42 3627.5 8.6 369 99 270 10,166 7,656 8,672 6,530 0 0 27 2322.5 6.8 321 86 235 11,422 8,911 9,742 7,601 0 0 27 2317.5 5.5 184 49 135 12,677 10,166 10,813 8,672 0 0 17 1512.5 4.1 40 11 29 13,932 11,422 11,883 9,742 0 0 4 47.5 2.6 0 0 0 15,187 12,677 12,954 10,813 0 0 0 02.5 1.0 0 0 0 16,442 13,932 14,024 11,883 0 0 0 0-2.5 0.0 0 0 0 17,697 15,187 15,095 12,954 0 0 0 0-7.5 -1.5 0 0 0 18,952 16,442 16,166 14,024 0 0 0 0
-12.5 -2.8 0 0 0 20,207 17,697 17,236 15,095 0 0 0 0TOTALS 8,760 2,346 6,414 478 322 226 193
Existing Window Infiltration 68 cfm Savings 33 Gal Oil 129$ Existing Window Heat Transfer 177 Btuh/°F 156 kWh 45$ Proposed Window Infiltration 34 cfm 174$ Proposed Window Heat Transfer 177 Btuh/°F
Window ID Location Quantity Width (ft)
Height (ft) Linear Feet (LF) Area (SF) Infiltration Rate
(CFM/LF)U Value
(Btuh/SF/°F)Infiltration
(CFM)Heat Transfer
(Btuh/°F)1 1st floor 2 3.3 3.3 26.4 21.8 0.2 0.65 5.3 14.22 1st floor 2 2.5 3.75 25.0 18.8 0.2 0.65 5.0 12.23 1st floor 1 2.5 2.3 9.6 5.8 0.2 0.65 1.9 3.74 1st floor 2 1.7 3.2 19.6 10.9 0.2 0.65 3.9 7.15 2nd floor 2 2.7 4.5 28.8 24.3 0.2 0.65 5.8 15.86 2nd floor 1 2.7 4.8 15.0 13.0 0.2 0.65 3.0 8.47 2nd floor 4 3 5 64.0 60.0 0.2 0.65 12.8 39.08 2nd floor 1 3 1.08 8.2 3.2 0.2 0.65 1.6 2.19 2nd floor 5 2.8 4.2 70.0 58.8 0.2 0.65 14.0 38.2
10 2nd floor 4 2.7 4 53.6 43.2 0.2 0.65 10.7 28.111 attic 1 1.8 3.2 10.0 5.8 0.2 0.65 2.0 3.712 attic 1 1.8 4 11.6 7.2 0.2 0.65 2.3 4.7
Total 26 30.5 43.33 341.8 272.6 0.20 0.65 68.4 177.2
EXISTING LOADS PROPOSED LOADS COOLING ENERGY HEATING ENERGY
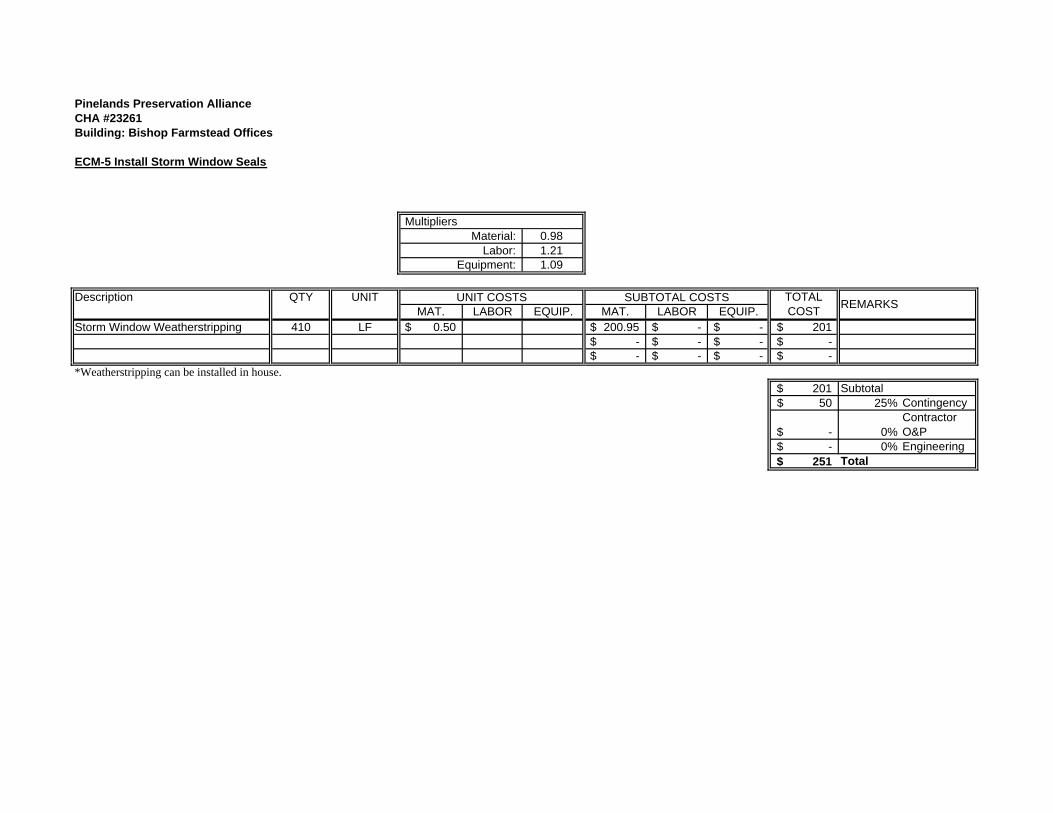
Pinelands Preservation AllianceCHA #23261Building: Bishop Farmstead Offices
ECM-5 Install Storm Window Seals
MultipliersMaterial: 0.98
Labor: 1.21Equipment: 1.09
Description QTY UNITMAT. LABOR EQUIP. MAT. LABOR EQUIP.
Storm Window Weatherstripping 410 LF 0.50$ 200.95$ -$ -$ 201$ -$ -$ -$ -$ -$ -$ -$ -$
*Weatherstripping can be installed in house.
201$ Subtotal50$ 25% Contingency
-$ 0%Contractor O&P
-$ 0% Engineering251$ Total
UNIT COSTS SUBTOTAL COSTS TOTAL COST REMARKS

APPENDIX H
ECM-6 Install Ceiling Insulation
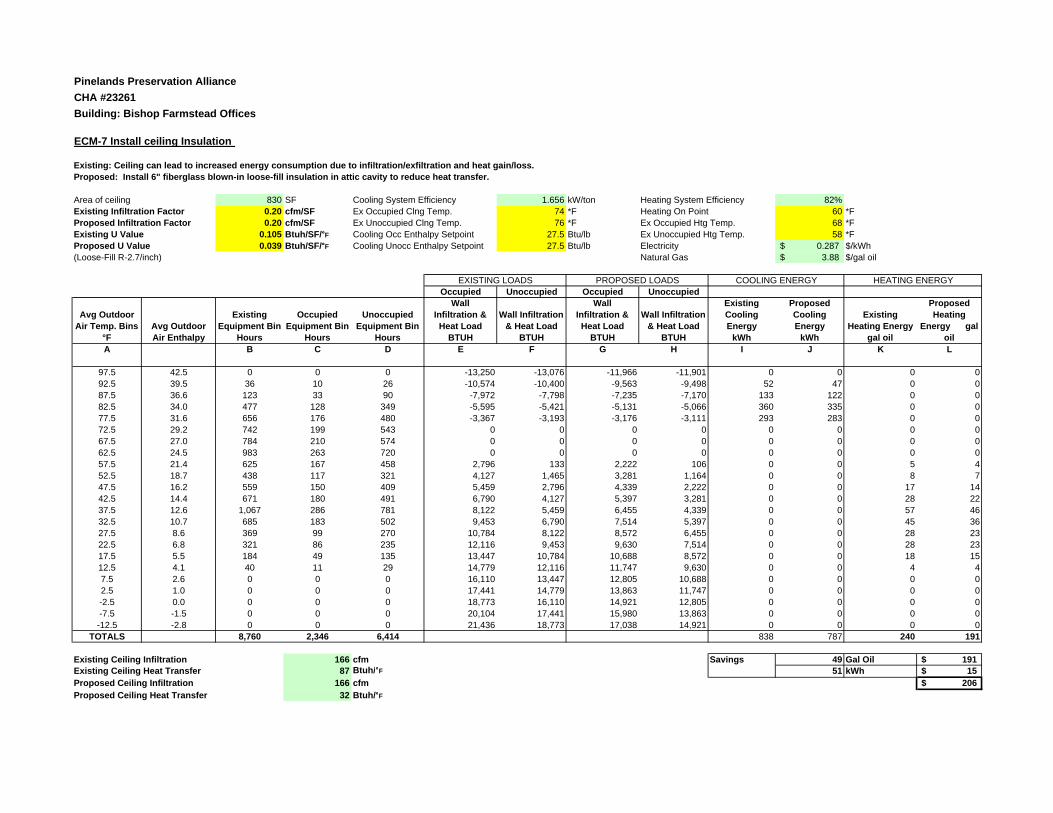
Pinelands Preservation AllianceCHA #23261Building: Bishop Farmstead Offices
ECM-7 Install ceiling Insulation
Existing: Ceiling can lead to increased energy consumption due to infiltration/exfiltration and heat gain/loss. Proposed: Install 6" fiberglass blown-in loose-fill insulation in attic cavity to reduce heat transfer.
Area of ceiling 830 SF Cooling System Efficiency 1.656 kW/ton Heating System Efficiency 82%Existing Infiltration Factor 0.20 cfm/SF Ex Occupied Clng Temp. 74 *F Heating On Point 60 *FProposed Infiltration Factor 0.20 cfm/SF Ex Unoccupied Clng Temp. 76 *F Ex Occupied Htg Temp. 68 *FExisting U Value 0.105 Btuh/SF/°F Cooling Occ Enthalpy Setpoint 27.5 Btu/lb Ex Unoccupied Htg Temp. 58 *FProposed U Value 0.039 Btuh/SF/°F Cooling Unocc Enthalpy Setpoint 27.5 Btu/lb Electricity 0.287$ $/kWh (Loose-Fill R-2.7/inch) Natural Gas 3.88$ $/gal oil
Occupied Unoccupied Occupied Unoccupied
Avg Outdoor Air Temp. Bins
°FAvg Outdoor Air Enthalpy
Existing Equipment Bin
Hours
Occupied Equipment Bin
Hours
Unoccupied Equipment Bin
Hours
Wall Infiltration & Heat Load
BTUH
Wall Infiltration & Heat Load
BTUH
Wall Infiltration & Heat Load
BTUH
Wall Infiltration & Heat Load
BTUH
Existing Cooling Energy
kWh
Proposed Cooling Energy
kWh
Existing Heating Energy
gal oil
Proposed Heating
Energy gal oil
A B C D E F G H I J K L
97.5 42.5 0 0 0 -13,250 -13,076 -11,966 -11,901 0 0 0 092.5 39.5 36 10 26 -10,574 -10,400 -9,563 -9,498 52 47 0 087.5 36.6 123 33 90 -7,972 -7,798 -7,235 -7,170 133 122 0 082.5 34.0 477 128 349 -5,595 -5,421 -5,131 -5,066 360 335 0 077.5 31.6 656 176 480 -3,367 -3,193 -3,176 -3,111 293 283 0 072.5 29.2 742 199 543 0 0 0 0 0 0 0 067.5 27.0 784 210 574 0 0 0 0 0 0 0 062.5 24.5 983 263 720 0 0 0 0 0 0 0 057.5 21.4 625 167 458 2,796 133 2,222 106 0 0 5 452.5 18.7 438 117 321 4,127 1,465 3,281 1,164 0 0 8 747.5 16.2 559 150 409 5,459 2,796 4,339 2,222 0 0 17 1442.5 14.4 671 180 491 6,790 4,127 5,397 3,281 0 0 28 2237.5 12.6 1,067 286 781 8,122 5,459 6,455 4,339 0 0 57 4632.5 10.7 685 183 502 9,453 6,790 7,514 5,397 0 0 45 3627.5 8.6 369 99 270 10,784 8,122 8,572 6,455 0 0 28 2322.5 6.8 321 86 235 12,116 9,453 9,630 7,514 0 0 28 2317.5 5.5 184 49 135 13,447 10,784 10,688 8,572 0 0 18 1512.5 4.1 40 11 29 14,779 12,116 11,747 9,630 0 0 4 47.5 2.6 0 0 0 16,110 13,447 12,805 10,688 0 0 0 02.5 1.0 0 0 0 17,441 14,779 13,863 11,747 0 0 0 0-2.5 0.0 0 0 0 18,773 16,110 14,921 12,805 0 0 0 0-7.5 -1.5 0 0 0 20,104 17,441 15,980 13,863 0 0 0 0-12.5 -2.8 0 0 0 21,436 18,773 17,038 14,921 0 0 0 0
TOTALS 8,760 2,346 6,414 838 787 240 191
Existing Ceiling Infiltration 166 cfm Savings 49 Gal Oil 191$ Existing Ceiling Heat Transfer 87 Btuh/°F 51 kWh 15$ Proposed Ceiling Infiltration 166 cfm 206$ Proposed Ceiling Heat Transfer 32 Btuh/°F
EXISTING LOADS PROPOSED LOADS COOLING ENERGY HEATING ENERGY
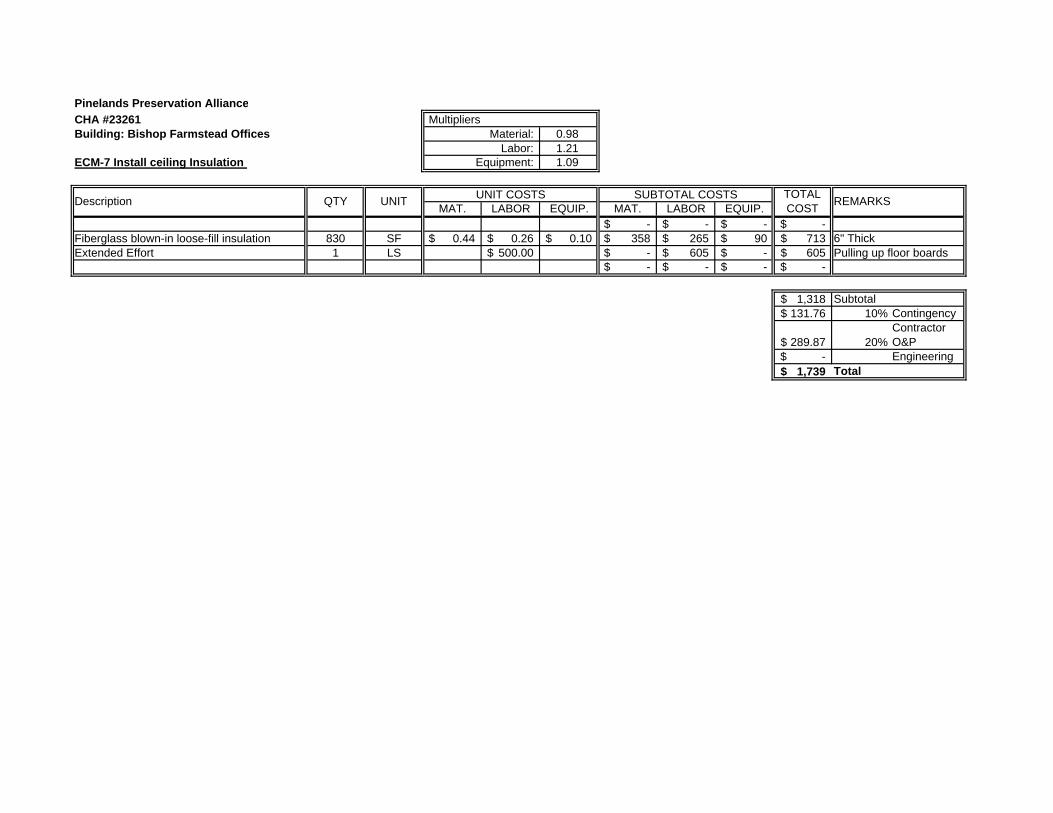
Pinelands Preservation AllianceCHA #23261 MultipliersBuilding: Bishop Farmstead Offices Material: 0.98
Labor: 1.21ECM-7 Install ceiling Insulation Equipment: 1.09
MAT. LABOR EQUIP. MAT. LABOR EQUIP.-$ -$ -$ -$
Fiberglass blown-in loose-fill insulation 830 SF 0.44$ 0.26$ 0.10$ 358$ 265$ 90$ 713$ 6" ThickExtended Effort 1 LS 500.00$ -$ 605$ -$ 605$
-$ -$ -$ -$
1,318$ Subtotal131.76$ 10% Contingency
289.87$ 20%Contractor O&P
-$ Engineering1,739$ Total
SUBTOTAL COSTSDescription QTY UNIT UNIT COSTS TOTAL COST REMARKS
Pulling up floor boards

APPENDIX I
ECM-7 Replace Domestic Hot Water Heater
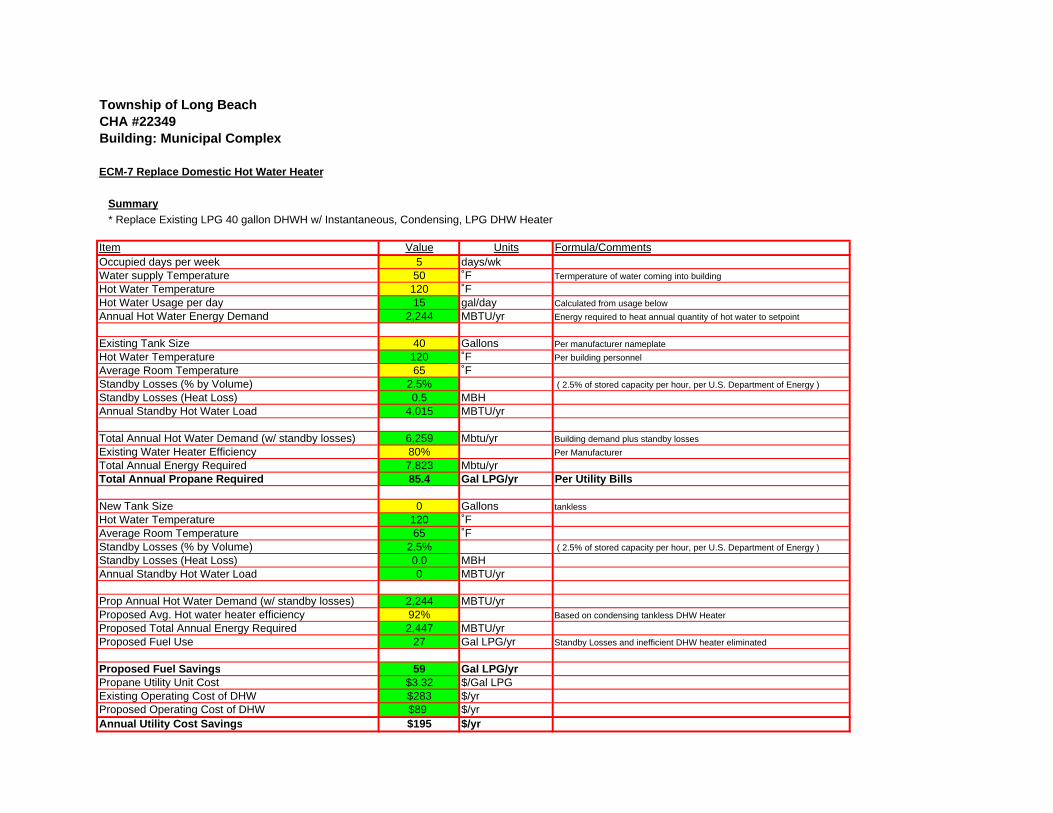
Township of Long BeachCHA #22349Building: Municipal Complex
ECM-7 Replace Domestic Hot Water Heater
Summary * Replace Existing LPG 40 gallon DHWH w/ Instantaneous, Condensing, LPG DHW Heater
Item Value UnitsOccupied days per week 5 days/wkWater supply Temperature 50 ˚FHot Water Temperature 120 ˚FHot Water Usage per day 15 gal/dayAnnual Hot Water Energy Demand 2,244 MBTU/yr
Existing Tank Size 40 GallonsHot Water Temperature 120 ˚FAverage Room Temperature 65 ˚FStandby Losses (% by Volume) 2.5%Standby Losses (Heat Loss) 0.5 MBHAnnual Standby Hot Water Load 4,015 MBTU/yr
Total Annual Hot Water Demand (w/ standby losses) 6,259 Mbtu/yrExisting Water Heater Efficiency 80%Total Annual Energy Required 7,823 Mbtu/yrTotal Annual Propane Required 85.4 Gal LPG/yr
New Tank Size 0 GallonsHot Water Temperature 120 ˚FAverage Room Temperature 65 ˚FStandby Losses (% by Volume) 2.5%Standby Losses (Heat Loss) 0.0 MBHAnnual Standby Hot Water Load 0 MBTU/yr
Prop Annual Hot Water Demand (w/ standby losses) 2,244 MBTU/yrProposed Avg. Hot water heater efficiency 92%Proposed Total Annual Energy Required 2,447 MBTU/yrProposed Fuel Use 27 Gal LPG/yr
Proposed Fuel Savings 59 Gal LPG/yrPropane Utility Unit Cost $3.32 $/Gal LPGExisting Operating Cost of DHW $283 $/yrProposed Operating Cost of DHW $89 $/yrAnnual Utility Cost Savings $195 $/yr
Formula/Comments
Termperature of water coming into building
Calculated from usage belowEnergy required to heat annual quantity of hot water to setpoint
Per manufacturer nameplatePer building personnel
( 2.5% of stored capacity per hour, per U.S. Department of Energy )
tankless
Building demand plus standby lossesPer Manufacturer
Per Utility Bills
Standby Losses and inefficient DHW heater eliminated
( 2.5% of stored capacity per hour, per U.S. Department of Energy )
Based on condensing tankless DHW Heater
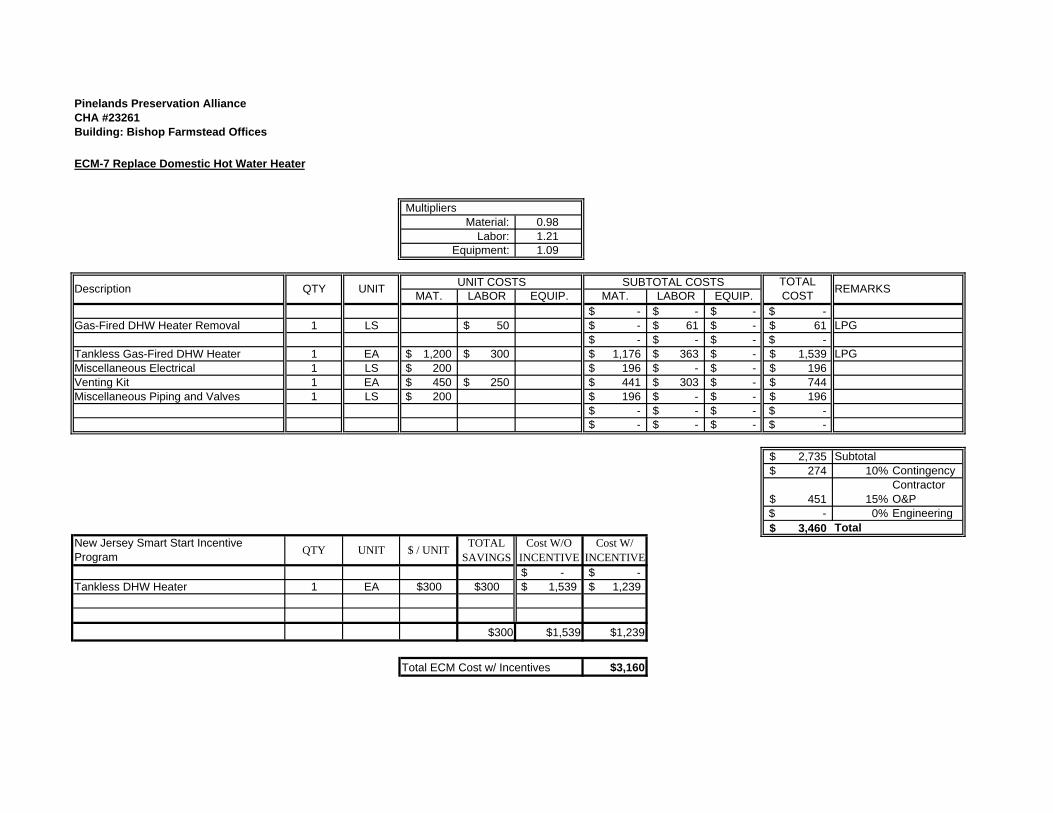
Pinelands Preservation AllianceCHA #23261Building: Bishop Farmstead Offices
ECM-7 Replace Domestic Hot Water Heater
MultipliersMaterial: 0.98
Labor: 1.21Equipment: 1.09
MAT. LABOR EQUIP. MAT. LABOR EQUIP.-$ -$ -$ -$
Gas-Fired DHW Heater Removal 1 LS 50$ -$ 61$ -$ 61$ LPG-$ -$ -$ -$
Tankless Gas-Fired DHW Heater 1 EA 1,200$ 300$ 1,176$ 363$ -$ 1,539$ LPGMiscellaneous Electrical 1 LS 200$ 196$ -$ -$ 196$ Venting Kit 1 EA 450$ 250$ 441$ 303$ -$ 744$ Miscellaneous Piping and Valves 1 LS 200$ 196$ -$ -$ 196$
-$ -$ -$ -$ -$ -$ -$ -$
2,735$ Subtotal274$ 10% Contingency
451$ 15%Contractor O&P
-$ 0% Engineering3,460$
-$ -$ 1 EA $300 $300 1,539$ 1,239$
$300 $1,539 $1,239
Total ECM Cost w/ Incentives $3,160
Cost W/ INCENTIVE
Tankless DHW Heater
New Jersey Smart Start Incentive Program QTY UNIT $ / UNIT
TOTAL SAVINGS
Cost W/O INCENTIVE
Description
Total
TOTAL COST REMARKSQTY UNIT UNIT COSTS SUBTOTAL COSTS

APPENDIX J
ECM-8 Install Low-Flow Plumbing Fixtures

Pinelands Preservation AllianceCHA #23261Building: Bishop Farmstead Offices
ECM-8 Install Low-Flow Plumbing Fixtures Toilets
$0.00 $ / kGal39
3.8 Gal
31.28 Gal $530 Each$150 Each
$2,040
26 kGal / year9 kGal / year
17 kGal / year$0 / year
- years*Pinelands currently does not pay for water and therefore will not experience any financial benefit from water reduction.
S A V I N G S
Proposed Installation cost of Changing out ToiletTotal cost of new toilets & valves
Proposed Gallons / FlushProposed Toilets to be Replaced
Proposed Material Cost of Changing out Toilet
Simple Payback
Current Toilet Water UseProposed Toilet Water UseWater SavingsCost Savings*
E X I S T I N G C O N D I T I O N S
P R O P O S E D C O N D I T I O N S
Cost of Water / 1000 GallonsToilets in BuildingAverage Flushes / Toilet (per Day)Average Gallons / Flush
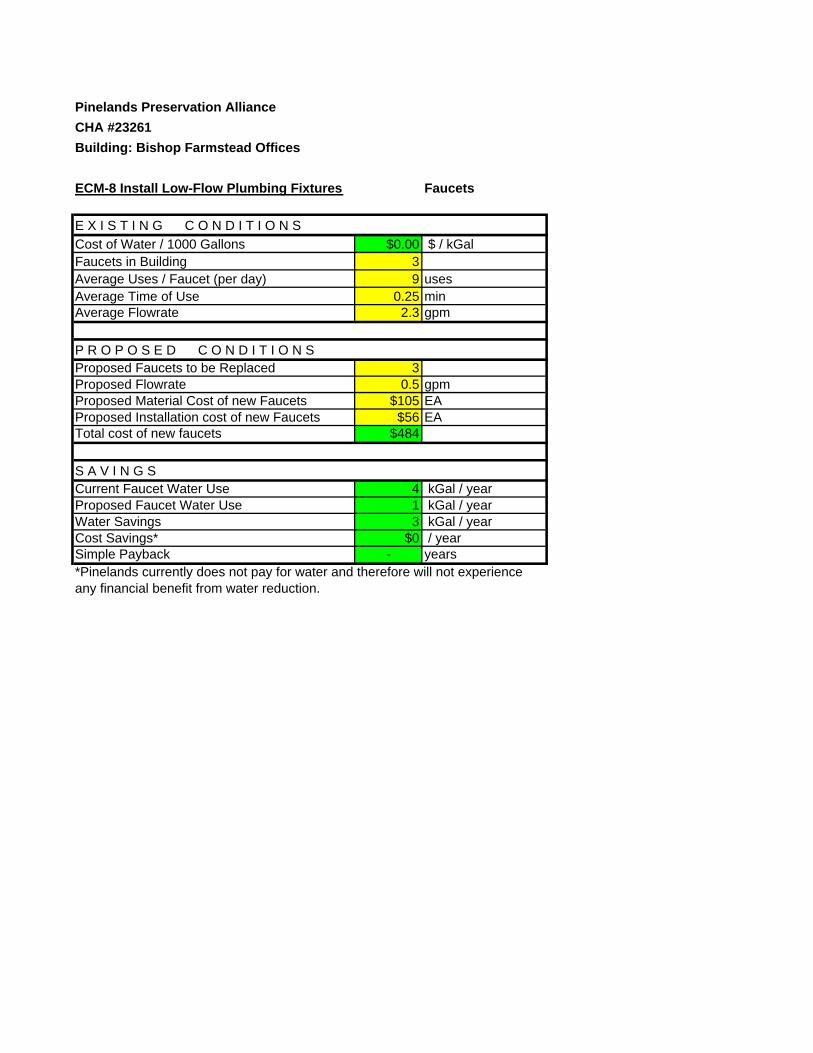
Pinelands Preservation AllianceCHA #23261Building: Bishop Farmstead Offices
ECM-8 Install Low-Flow Plumbing Fixtures Faucets
$0.00 $ / kGal39 uses
0.25 min2.3 gpm
30.5 gpm
$105 EA$56 EA
$484
4 kGal / year1 kGal / year3 kGal / year
$0 / year- years
*Pinelands currently does not pay for water and therefore will not experience any financial benefit from water reduction.
Proposed FlowrateProposed Faucets to be Replaced
E X I S T I N G C O N D I T I O N S
P R O P O S E D C O N D I T I O N S
Cost of Water / 1000 GallonsFaucets in BuildingAverage Uses / Faucet (per day)
Average FlowrateAverage Time of Use
S A V I N G S
Proposed Material Cost of new FaucetsProposed Installation cost of new FaucetsTotal cost of new faucets
Simple Payback
Current Faucet Water UseProposed Faucet Water UseWater SavingsCost Savings*

APPENDIX K
ECM-9 Install Energy Star Appliances
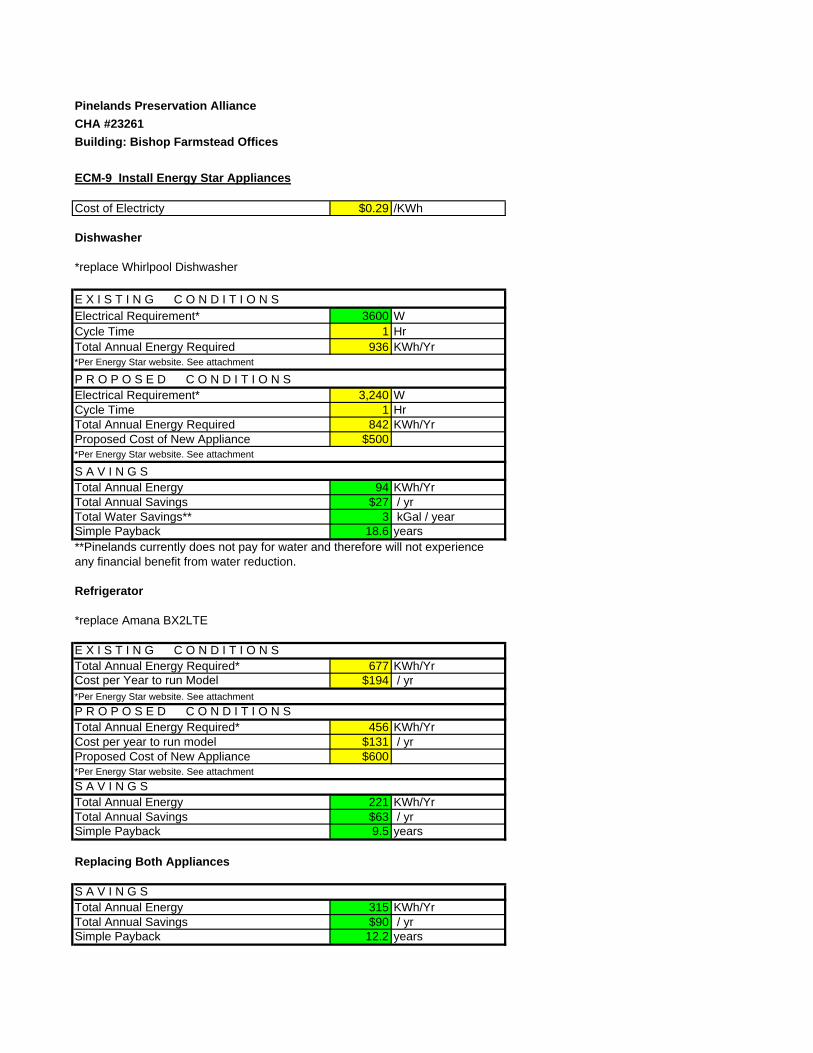
Pinelands Preservation AllianceCHA #23261Building: Bishop Farmstead Offices
ECM-9 Install Energy Star Appliances
$0.29 /KWh
Dishwasher
*replace Whirlpool Dishwasher
3600 W1 Hr
936 KWh/Yr*Per Energy Star website. See attachment
3,240 W1 Hr
842 KWh/Yr$500
*Per Energy Star website. See attachment
94 KWh/Yr$27 / yr
3 kGal / year18.6 years
Refrigerator
*replace Amana BX2LTE
677 KWh/Yr$194 / yr
*Per Energy Star website. See attachment
456 KWh/Yr$131 / yr$600
*Per Energy Star website. See attachment
221 KWh/Yr$63 / yr9.5 years
Replacing Both Appliances
315 KWh/Yr$90 / yr
12.2 yearsTotal Annual Savings
Total Annual Energy Required*
Proposed Cost of New Appliance
S A V I N G S
Total Annual Energy
Proposed Cost of New Appliance
Total Annual Savings
Total Annual Energy Required
S A V I N G S
Simple Payback
**Pinelands currently does not pay for water and therefore will not experience any financial benefit from water reduction.
Total Water Savings**
Simple Payback
Cost per year to run model
Cycle Time
Total Annual Energy
Total Annual Energy Required
Simple Payback
P R O P O S E D C O N D I T I O N SElectrical Requirement*
Cost per Year to run Model
Cycle Time
P R O P O S E D C O N D I T I O N S
Cost of Electricty
E X I S T I N G C O N D I T I O N STotal Annual Energy Required*
S A V I N G STotal Annual EnergyTotal Annual Savings
E X I S T I N G C O N D I T I O N SElectrical Requirement*

Dishwashers ResourcesFind a Model
Qualified Dishwashers Excel | PDF
Find a Store
Special Offers
Savings Calculator
Related ProductsClothes Washers
Dehumidifiers
Freezers
Refrigerators
Room Air Cleaners & Purifiers
Water Coolers
(Are you a partner? For Partners)
See also: Commercial Dishwashers
Did You Know?ENERGY STAR qualified dishwashers are, on average, 10% more energy efficient and 12% more water efficient than standard models.
About ENERGY STAR Dishwashers
EPA Home EPA Search
DOE Home DOE
Search
Products Home Improvement New Homes Buildings & Plants Partner Resources KidsPublications News Room FAQs Contact Us Privacy Site Index Recursos en EspañolPDF Viewer Flash Viewer PowerPoint Viewer Excel Viewer
Dishwashers for Consumers
ENERGY STAR qualified dishwashers use advanced technology to get your dishes clean while using less water and energy.
Trim your utility bills — Do you have a dishwasher made before 1994? If so, you're paying an extra $40 a year on your utility bills compared to owning a new ENERGY STAR qualified model. Replace one of these old dishwashers with ENERGY STAR and save enough money to pay for dishwasher detergent all year.
Save loads of water — A dishwasher built before 1994 wastes more than 10 gallons of water per cycle. A new, ENERGY STAR qualified dishwasher will save, on average, 1,300 gallons of water over its lifetime.
Save the environment — Nearly 70 percent of U.S. electricity is generated by burning coal and natural gas, which releases greenhouse gasses and other air pollutants into the atmosphere, contributing to climate change and air quality problems. ENERGY STAR qualified dishwashers use less energy than conventional models, which helps reduce air pollution and combat global climate change. By reducing water consumption, ENERGY STAR qualified dishwashers also help protect our lakes, streams, and oceans.
Find out more ways to save water and help protect our nation's water supply.
Overview Specifications Buying Guidance FAQs
Page 1 of 1Dishwashers : ENERGY STAR
10/20/2011http://www.energystar.gov/index.cfm?fuseaction=find_a_product.showProductGroup&pg...

Refrigerator Retirement Savings Calculator
If you have trouble using this tool or have questions about the calculations, please contact [email protected]
EPA Home EPA Search
DOE Home DOE Search
Products Home Improvement New Homes Buildings & Plants Partner Resources KidsPublications News Room FAQs Contact Us Privacy Site Index Recursos en EspañolPDF Viewer Flash Viewer PowerPoint Viewer Excel Viewer
BX21T 20.5 cubic feet Bottom Freezer
$0.287
$194.42
677 kWh
You can save more than $315 over five years by replacing your old refrigerator or freezer with a new ENERGY STAR qualified model!
Your model costs...
An ENERGY STAR qualified model costs...
$194 per year to run
$131 per year to run
Note: If your refrigerator or freezer is a newer, ENERGY STAR qualified model your results may not display significant savings.
Page 1 of 1ENERGY STAR
10/3/2011http://www.energystar.gov/index.cfm?fuseaction=refrig.calculator&pd=25176&model=bx...

APPENDIX L
ECM-10 Lighting Replacements

Energy Audit of Pinelands Preservation AllianceCHA Project No. 23261 Cost of Electricity: $0.168 $/kWh
ECM-10 Lighting Replacements $11.395 $/kW
No. of Fixtures Standard Fixture Code NYSERDA Fixture Code
Watts per Fixture kW/Space
Exist Control
Annual Hours Annual kWh
Number of Fixtures Standard Fixture Code Fixture Code
Watts per Fixture kW/Space
Retrofit Control
Annual Hours
Annual kWh
Annual kWh Saved
Annual kW Saved
Annual $ Saved
Retrofit Cost
NJ Smart Start
Lighting Incentive
Simple Payback With Out Incentive
Simple Payback
Field Code
No. of fixtures before the retrofit
"Lighting Fixture Code" Example 2T 40 R F(U) = 2'x2' Troff 40 w Recess. Floor 2 lamps U shape
Code from Table of Standard Fixture Wattages
Value from Table of Standard Fixture Wattages
(Watts/Fixt) * (Fixt No.)
Pre-inst. control device
Estimated daily hours for the usage group
(kW/space) * (Annual Hours)
No. of fixtures after the retrofit
"Lighting Fixture Code" Example 2T 40 R F(U) = 2'x2' Troff 40 w Recess. Floor 2 lamps U shape
Code from Table of Standard Fixture Wattages
Value from Table of Standard Fixture Wattages
(Watts/Fixt) * (Number of Fixtures)
Retrofit control device
Estimated annual hours for the usage group
(kW/space) * (Annual Hours)
(Original Annual kWh) - (Retrofit Annual kWh)
(Original Annual kW) - (Retrofit Annual kW)
(kWh Saved) * ($/kWh)
Cost for renovations to lighting system
Prescriptive Lighting Measures
Length of time for renovations cost to be recovered
Length of time for renovations cost to
be recovered
117 3 CF 23 CFS23/1 23 0.1 SW 125 9 3 CF 23 CFS23/1 23 0.1 SW 125 9 - 0.0 -$ -$ $071 1 I 60 I60/1 60 0.1 SW 125 8 1 CF 26 CFQ26/1-L 27 0.0 SW 125 3 4 0.0 5.20$ 6.75$ $0 1.3 1.3122 1 CF 15 CFS15/1 15 0.0 SW 500 8 1 CF 15 CFS15/1 15 0.0 SW 500 8 - 0.0 -$ -$ $0122 1 CF 15 CFS15/1 15 0.0 SW 2000 30 1 CF 15 CFS15/1 15 0.0 SW 2,000 30 - 0.0 -$ -$ $0108 1 I 65 I65/1 65 0.1 SW 2000 130 1 CF 26 CFQ26/1-L 27 0.0 SW 2,000 54 76 0.0 17.93$ 6.75$ $0 0.4 0.4122 1 CF 15 CFS15/1 15 0.0 SW 250 4 1 CF 15 CFS15/1 15 0.0 SW 250 4 - 0.0 -$ -$ $0117 4 CF 23 CFS23/1 23 0.1 SW 2000 184 4 CF 23 CFS23/1 23 0.1 SW 2,000 184 - 0.0 -$ -$ $0249 1 T 30 W F 2 (MAG) RL/RB F32SS 81 0.1 SW 500 41 1 W 28 W F 2 F42SSILL 48 0.0 SW 500 24 17 0.0 7.28$ 97.75$ $15 13.4 11.4117 1 CF 23 CFS23/1 23 0.0 SW 2000 46 1 CF 23 CFS23/1 23 0.0 SW 2,000 46 - 0.0 -$ -$ $0117 4 CF 23 CFS23/1 23 0.1 SW 2000 184 4 CF 23 CFS23/1 23 0.1 SW 2,000 184 - 0.0 -$ -$ $0117 2 CF 23 CFS23/1 23 0.0 SW 500 23 2 CF 23 CFS23/1 23 0.0 SW 500 23 - 0.0 -$ -$ $0117 3 CF 23 CFS23/1 23 0.1 SW 500 35 3 CF 23 CFS23/1 23 0.1 SW 500 35 - 0.0 -$ -$ $0122 8 CF 15 CFS15/1 15 0.1 SW 2000 240 8 CF 15 CFS15/1 15 0.1 SW 2,000 240 - 0.0 -$ -$ $065 2 I 100 I100/1 100 0.2 SW 2000 400 2 CF 26 CFQ26/1-L 27 0.1 SW 2,000 108 292 0.1 68.89$ 13.50$ $0 0.2 0.273 10 I 120 I120/1 120 1.2 SW 500 600 10 LED Flood light 0 7 0.1 SW 500 35 565 1.1 249.19$ 483.00$ $0 1.9 1.973 6 I 120 I120/1 120 0.7 SW 500 360 6 LED Flood light 0 7 0.0 SW 500 21 339 0.7 149.51$ 289.80$ $0 1.9 1.9250 4 LED Flood light 0 7 0.0 SW 500 14 4 LED Flood light 0 7 0.0 SW 500 14 - 0.0 -$ -$ $0229 1 WP200 I 1 i200/1 200 0.2 SW 2000 400 1 WP 42 2 CF42/1-L 48 0.0 SW 2,000 96 304 0.2 71.72$ 40.50$ $0 0.6 0.6117 1 CF 23 CFS23/1 23 0.0 SW 2000 46 1 CF 23 CFS23/1 23 0.0 SW 2,000 46 - 0.0 -$ -$ $0117 1 CF 23 CFS23/1 23 0.0 SW 500 12 1 CF 23 CFS23/1 23 0.0 SW 500 12 - 0.0 -$ -$ $071 3 I 60 I60/1 60 0.2 SW 125 23 3 CF 26 CFQ26/1-L 27 0.1 SW 125 10 12 0.1 15.61$ 20.25$ $0 1.3 1.371 3 I 60 I60/1 60 0.2 SW 260 47 3 CF 26 CFQ26/1-L 27 0.1 SW 260 21 26 0.1 17.85$ 20.25$ $0 1.1 1.1237 3 WP 400 Po HPS hps400/1 465 1.4 Timer 260 363 3 WP 400 Po HPS hps400/1 465 1.4 Timer 260 363 - 0.0 -$ -$ $0141 3 HPS 250 HPS250/1 295 0.9 Timer 260 230 3 HPS 250 HPS250/1 295 0.9 Timer 260 230 - 0.0 -$ -$ $0
68 5.8 3,433 68 1,256 3.4 1,798 1,635 2.4 $603 $979 $152.4 $329
1,635 $274$603 1.6 1.6
COST & SAVINGS ANALYSIS
1st Floor restroom
2nd floor hallway
2nd floor center office
RETROFIT CONDITIONS
Area Description
BasementBasement
EXISTING CONDITIONS
Unique description of the location - Room number/Room name: Floor number (if applicable)
2nd floor center office
AtticOutside Porch LightsParking Lot Lights
2nd floor large office2nd floor office restroom
Parking Lot Lights
1st floor copy room
kitchen - 1st floor
1st floor single office
Total savingskWh Savings
Demand SavingsTotal
2nd floor restroom
1st floor rear vestibule
kitchen - 1st floor1st floor conference room1st floor visitor room1st floor visitor room2nd floor end 2 person office2nd floor end 2 person office
1st floor 3 person office
11/9/2011 Page 1, ECM-10

APPENDIX M
ECM-11 Install Occupancy Sensors
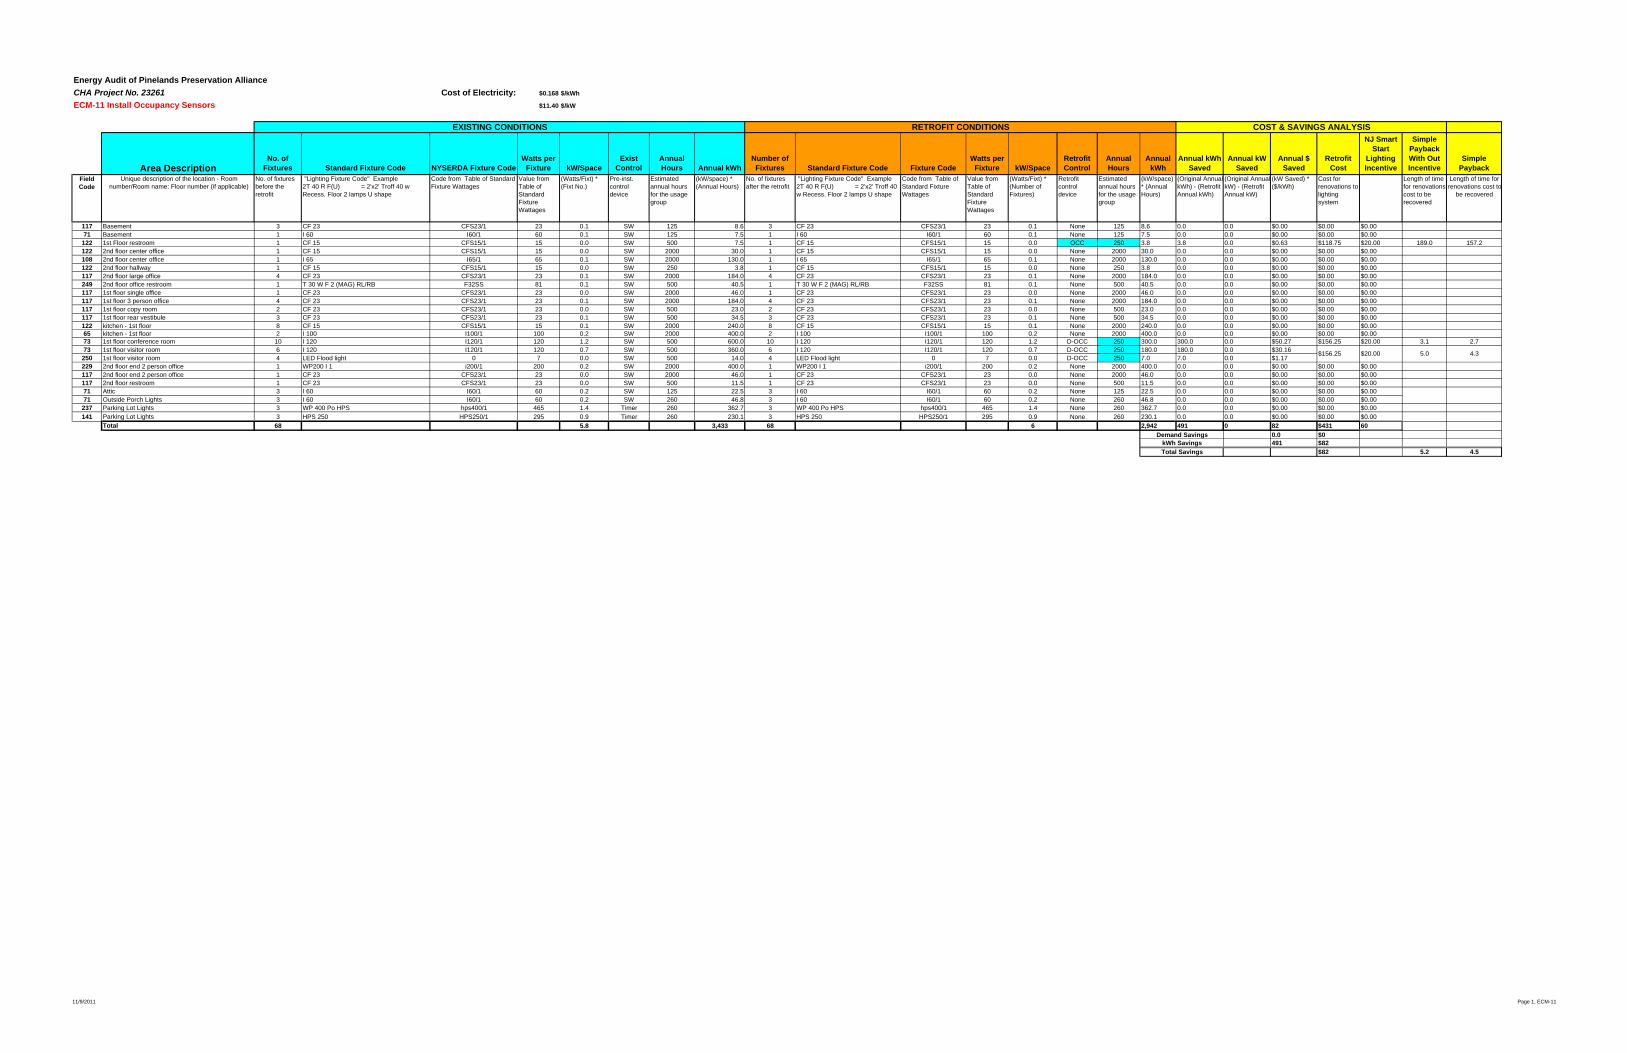
Energy Audit of Pinelands Preservation AllianceCHA Project No. 23261 Cost of Electricity: $0.168 $/kWh
ECM-11 Install Occupancy Sensors $11.40 $/kW
No. of Fixtures Standard Fixture Code NYSERDA Fixture Code
Watts per Fixture kW/Space
Exist Control
Annual Hours Annual kWh
Number of Fixtures Standard Fixture Code Fixture Code
Watts per Fixture kW/Space
Retrofit Control
Annual Hours
Annual kWh
Annual kWh Saved
Annual kW Saved
Annual $ Saved
Retrofit Cost
NJ Smart Start
Lighting Incentive
Simple Payback With Out Incentive
Simple Payback
Field Code
No. of fixtures before the retrofit
"Lighting Fixture Code" Example 2T 40 R F(U) = 2'x2' Troff 40 w Recess. Floor 2 lamps U shape
Code from Table of Standard Fixture Wattages
Value from Table of Standard Fixture Wattages
(Watts/Fixt) * (Fixt No.)
Pre-inst. control device
Estimated annual hours for the usage group
(kW/space) * (Annual Hours)
No. of fixtures after the retrofit
"Lighting Fixture Code" Example 2T 40 R F(U) = 2'x2' Troff 40 w Recess. Floor 2 lamps U shape
Code from Table of Standard Fixture Wattages
Value from Table of Standard Fixture Wattages
(Watts/Fixt) * (Number of Fixtures)
Retrofit control device
Estimated annual hours for the usage group
(kW/space) * (Annual Hours)
(Original Annual kWh) - (Retrofit Annual kWh)
(Original Annual kW) - (Retrofit Annual kW)
(kW Saved) * ($/kWh)
Cost for renovations to lighting system
Length of time for renovations cost to be recovered
Length of time for renovations cost to
be recovered
117 3 CF 23 CFS23/1 23 0.1 SW 125 8.6 3 CF 23 CFS23/1 23 0.1 None 125 8.6 0.0 0.0 $0.00 $0.00 $0.0071 1 I 60 I60/1 60 0.1 SW 125 7.5 1 I 60 I60/1 60 0.1 None 125 7.5 0.0 0.0 $0.00 $0.00 $0.00122 1 CF 15 CFS15/1 15 0.0 SW 500 7.5 1 CF 15 CFS15/1 15 0.0 OCC 250 3.8 3.8 0.0 $0.63 $118.75 $20.00 189.0 157.2122 1 CF 15 CFS15/1 15 0.0 SW 2000 30.0 1 CF 15 CFS15/1 15 0.0 None 2000 30.0 0.0 0.0 $0.00 $0.00 $0.00108 1 I 65 I65/1 65 0.1 SW 2000 130.0 1 I 65 I65/1 65 0.1 None 2000 130.0 0.0 0.0 $0.00 $0.00 $0.00122 1 CF 15 CFS15/1 15 0.0 SW 250 3.8 1 CF 15 CFS15/1 15 0.0 None 250 3.8 0.0 0.0 $0.00 $0.00 $0.00117 4 CF 23 CFS23/1 23 0.1 SW 2000 184.0 4 CF 23 CFS23/1 23 0.1 None 2000 184.0 0.0 0.0 $0.00 $0.00 $0.00249 1 T 30 W F 2 (MAG) RL/RB F32SS 81 0.1 SW 500 40.5 1 T 30 W F 2 (MAG) RL/RB F32SS 81 0.1 None 500 40.5 0.0 0.0 $0.00 $0.00 $0.00117 1 CF 23 CFS23/1 23 0.0 SW 2000 46.0 1 CF 23 CFS23/1 23 0.0 None 2000 46.0 0.0 0.0 $0.00 $0.00 $0.00117 4 CF 23 CFS23/1 23 0.1 SW 2000 184.0 4 CF 23 CFS23/1 23 0.1 None 2000 184.0 0.0 0.0 $0.00 $0.00 $0.00117 2 CF 23 CFS23/1 23 0.0 SW 500 23.0 2 CF 23 CFS23/1 23 0.0 None 500 23.0 0.0 0.0 $0.00 $0.00 $0.00117 3 CF 23 CFS23/1 23 0.1 SW 500 34.5 3 CF 23 CFS23/1 23 0.1 None 500 34.5 0.0 0.0 $0.00 $0.00 $0.00122 8 CF 15 CFS15/1 15 0.1 SW 2000 240.0 8 CF 15 CFS15/1 15 0.1 None 2000 240.0 0.0 0.0 $0.00 $0.00 $0.0065 2 I 100 I100/1 100 0.2 SW 2000 400.0 2 I 100 I100/1 100 0.2 None 2000 400.0 0.0 0.0 $0.00 $0.00 $0.0073 10 I 120 I120/1 120 1.2 SW 500 600.0 10 I 120 I120/1 120 1.2 D-OCC 250 300.0 300.0 0.0 $50.27 $156.25 $20.00 3.1 2.773 6 I 120 I120/1 120 0.7 SW 500 360.0 6 I 120 I120/1 120 0.7 D-OCC 250 180.0 180.0 0.0 $30.16250 4 LED Flood light 0 7 0.0 SW 500 14.0 4 LED Flood light 0 7 0.0 D-OCC 250 7.0 7.0 0.0 $1.17229 1 WP200 I 1 i200/1 200 0.2 SW 2000 400.0 1 WP200 I 1 i200/1 200 0.2 None 2000 400.0 0.0 0.0 $0.00 $0.00 $0.00117 1 CF 23 CFS23/1 23 0.0 SW 2000 46.0 1 CF 23 CFS23/1 23 0.0 None 2000 46.0 0.0 0.0 $0.00 $0.00 $0.00117 1 CF 23 CFS23/1 23 0.0 SW 500 11.5 1 CF 23 CFS23/1 23 0.0 None 500 11.5 0.0 0.0 $0.00 $0.00 $0.0071 3 I 60 I60/1 60 0.2 SW 125 22.5 3 I 60 I60/1 60 0.2 None 125 22.5 0.0 0.0 $0.00 $0.00 $0.0071 3 I 60 I60/1 60 0.2 SW 260 46.8 3 I 60 I60/1 60 0.2 None 260 46.8 0.0 0.0 $0.00 $0.00 $0.00237 3 WP 400 Po HPS hps400/1 465 1.4 Timer 260 362.7 3 WP 400 Po HPS hps400/1 465 1.4 None 260 362.7 0.0 0.0 $0.00 $0.00 $0.00141 3 HPS 250 HPS250/1 295 0.9 Timer 260 230.1 3 HPS 250 HPS250/1 295 0.9 None 260 230.1 0.0 0.0 $0.00 $0.00 $0.00
68 5.8 3,433 68 6 2,942 491 0 82 $431 600.0 $0491 $82
$82 5.2 4.5
2nd floor hallway
2nd floor office restroom
Basement1st Floor restroom2nd floor center office2nd floor center office
2nd floor large office
kitchen - 1st floor
1st floor copy room
1st floor single office1st floor 3 person office
1st floor rear vestibule
Basement
COST & SAVINGS ANALYSIS
Area DescriptionUnique description of the location - Room
number/Room name: Floor number (if applicable)
EXISTING CONDITIONS RETROFIT CONDITIONS
2nd floor restroomAtticOutside Porch LightsParking Lot LightsParking Lot Lights
Total Savings
TotalDemand Savings
kWh Savings
kitchen - 1st floor1st floor conference room1st floor visitor room1st floor visitor room2nd floor end 2 person office2nd floor end 2 person office
4.35.0$20.00$156.25
11/9/2011 Page 1, ECM-11

APPENDIX N
ECM-12 Lighting Replacements with Occupancy Sensors
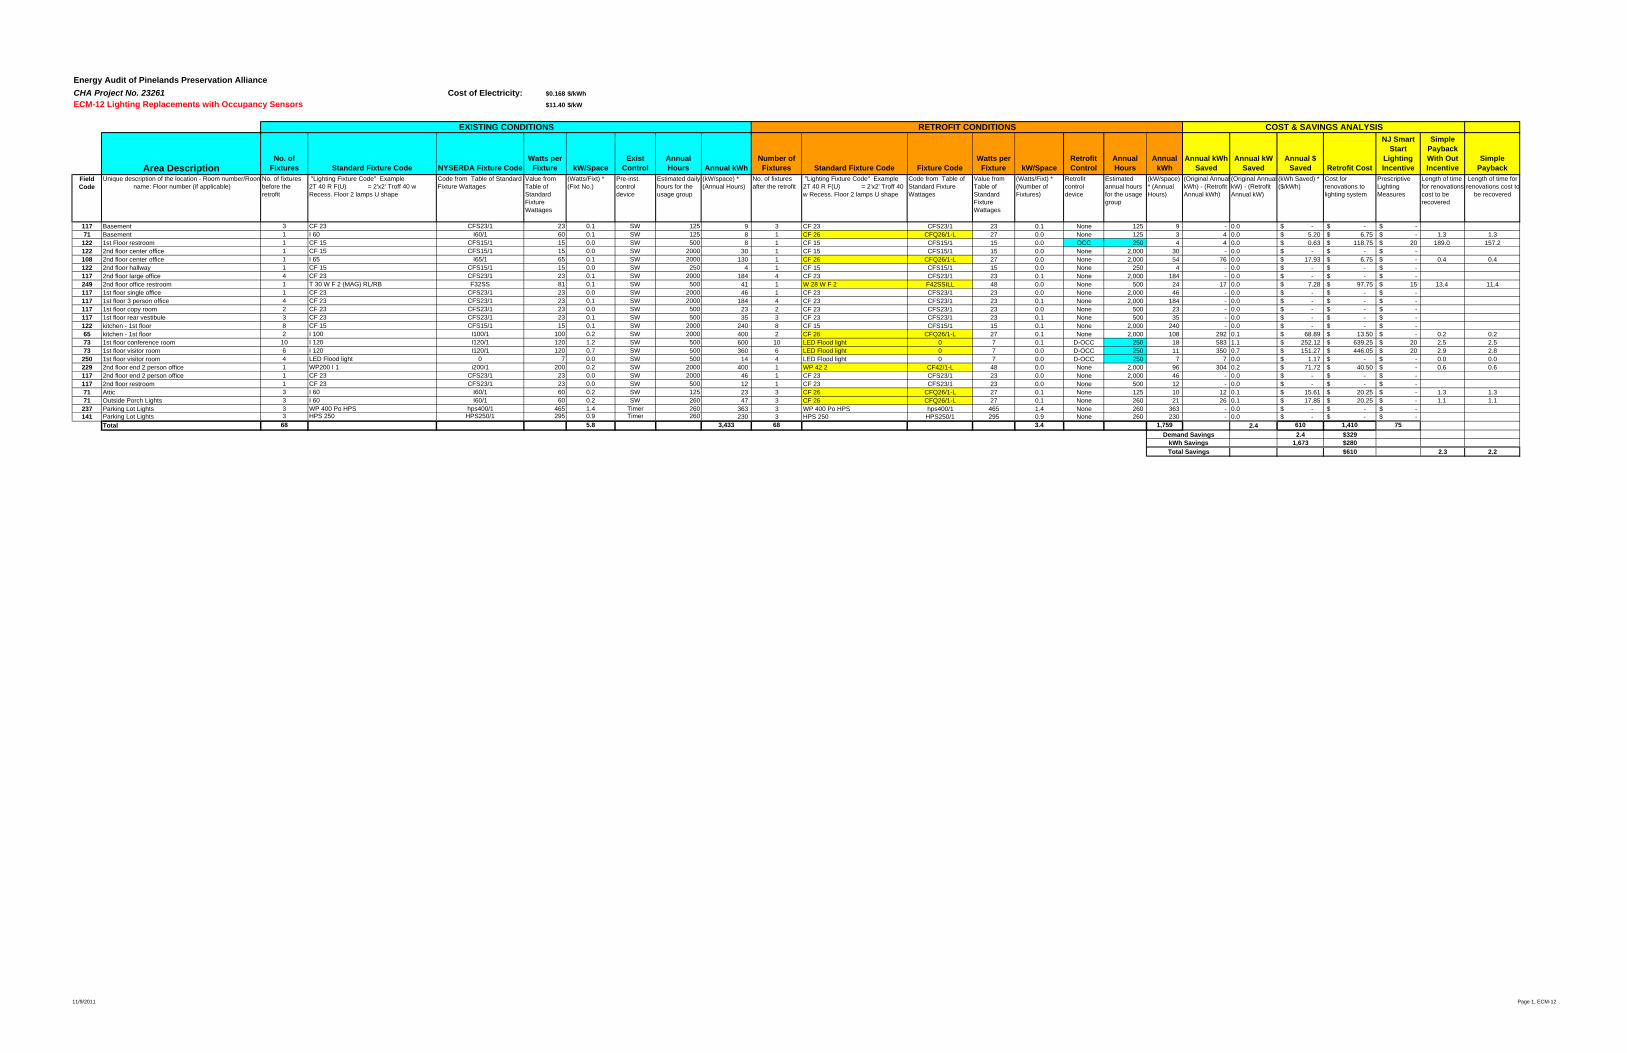
Energy Audit of Pinelands Preservation Alliance CHA Project No. 23261 Cost of Electricity: $0.168 $/kWh
ECM-12 Lighting Replacements with Occupancy Sensors $11.40 $/kW
No. of Fixtures Standard Fixture Code NYSERDA Fixture Code
Watts per Fixture kW/Space
Exist Control
Annual Hours Annual kWh
Number of Fixtures Standard Fixture Code Fixture Code
Watts per Fixture kW/Space
Retrofit Control
Annual Hours
Annual kWh
Annual kWh Saved
Annual kW Saved
Annual $ Saved Retrofit Cost
NJ Smart Start
Lighting Incentive
Simple Payback With Out Incentive
Simple Payback
Field Code
No. of fixtures before the retrofit
"Lighting Fixture Code" Example 2T 40 R F(U) = 2'x2' Troff 40 w Recess. Floor 2 lamps U shape
Code from Table of Standard Fixture Wattages
Value from Table of Standard Fixture Wattages
(Watts/Fixt) * (Fixt No.)
Pre-inst. control device
Estimated daily hours for the usage group
(kW/space) * (Annual Hours)
No. of fixtures after the retrofit
"Lighting Fixture Code" Example 2T 40 R F(U) = 2'x2' Troff 40 w Recess. Floor 2 lamps U shape
Code from Table of Standard Fixture Wattages
Value from Table of Standard Fixture Wattages
(Watts/Fixt) * (Number of Fixtures)
Retrofit control device
Estimated annual hours for the usage group
(kW/space) * (Annual Hours)
(Original Annual kWh) - (Retrofit Annual kWh)
(Original Annual kW) - (Retrofit Annual kW)
(kWh Saved) * ($/kWh)
Cost for renovations to lighting system
Prescriptive Lighting Measures
Length of time for renovations cost to be recovered
Length of time for renovations cost to
be recovered
117 3 CF 23 CFS23/1 23 0.1 SW 125 9 3 CF 23 CFS23/1 23 0.1 None 125 9 - 0.0 -$ -$ -$ 71 1 I 60 I60/1 60 0.1 SW 125 8 1 CF 26 CFQ26/1-L 27 0.0 None 125 3 4 0.0 5.20$ 6.75$ -$ 1.3 1.3122 1 CF 15 CFS15/1 15 0.0 SW 500 8 1 CF 15 CFS15/1 15 0.0 OCC 250 4 4 0.0 0.63$ 118.75$ 20$ 189.0 157.2122 1 CF 15 CFS15/1 15 0.0 SW 2000 30 1 CF 15 CFS15/1 15 0.0 None 2,000 30 - 0.0 -$ -$ -$ 108 1 I 65 I65/1 65 0.1 SW 2000 130 1 CF 26 CFQ26/1-L 27 0.0 None 2,000 54 76 0.0 17.93$ 6.75$ -$ 0.4 0.4122 1 CF 15 CFS15/1 15 0.0 SW 250 4 1 CF 15 CFS15/1 15 0.0 None 250 4 - 0.0 -$ -$ -$ 117 4 CF 23 CFS23/1 23 0.1 SW 2000 184 4 CF 23 CFS23/1 23 0.1 None 2,000 184 - 0.0 -$ -$ -$ 249 1 T 30 W F 2 (MAG) RL/RB F32SS 81 0.1 SW 500 41 1 W 28 W F 2 F42SSILL 48 0.0 None 500 24 17 0.0 7.28$ 97.75$ 15$ 13.4 11.4117 1 CF 23 CFS23/1 23 0.0 SW 2000 46 1 CF 23 CFS23/1 23 0.0 None 2,000 46 - 0.0 -$ -$ -$ 117 4 CF 23 CFS23/1 23 0.1 SW 2000 184 4 CF 23 CFS23/1 23 0.1 None 2,000 184 - 0.0 -$ -$ -$ 117 2 CF 23 CFS23/1 23 0.0 SW 500 23 2 CF 23 CFS23/1 23 0.0 None 500 23 - 0.0 -$ -$ -$ 117 3 CF 23 CFS23/1 23 0.1 SW 500 35 3 CF 23 CFS23/1 23 0.1 None 500 35 - 0.0 -$ -$ -$ 122 8 CF 15 CFS15/1 15 0.1 SW 2000 240 8 CF 15 CFS15/1 15 0.1 None 2,000 240 - 0.0 -$ -$ -$ 65 2 I 100 I100/1 100 0.2 SW 2000 400 2 CF 26 CFQ26/1-L 27 0.1 None 2,000 108 292 0.1 68.89$ 13.50$ -$ 0.2 0.273 10 I 120 I120/1 120 1.2 SW 500 600 10 LED Flood light 0 7 0.1 D-OCC 250 18 583 1.1 252.12$ 639.25$ 20$ 2.5 2.573 6 I 120 I120/1 120 0.7 SW 500 360 6 LED Flood light 0 7 0.0 D-OCC 250 11 350 0.7 151.27$ 446.05$ 20$ 2.9 2.8250 4 LED Flood light 0 7 0.0 SW 500 14 4 LED Flood light 0 7 0.0 D-OCC 250 7 7 0.0 1.17$ -$ -$ 0.0 0.0229 1 WP200 I 1 i200/1 200 0.2 SW 2000 400 1 WP 42 2 CF42/1-L 48 0.0 None 2,000 96 304 0.2 71.72$ 40.50$ -$ 0.6 0.6117 1 CF 23 CFS23/1 23 0.0 SW 2000 46 1 CF 23 CFS23/1 23 0.0 None 2,000 46 - 0.0 -$ -$ -$ 117 1 CF 23 CFS23/1 23 0.0 SW 500 12 1 CF 23 CFS23/1 23 0.0 None 500 12 - 0.0 -$ -$ -$ 71 3 I 60 I60/1 60 0.2 SW 125 23 3 CF 26 CFQ26/1-L 27 0.1 None 125 10 12 0.1 15.61$ 20.25$ -$ 1.3 1.371 3 I 60 I60/1 60 0.2 SW 260 47 3 CF 26 CFQ26/1-L 27 0.1 None 260 21 26 0.1 17.85$ 20.25$ -$ 1.1 1.1237 3 WP 400 Po HPS hps400/1 465 1.4 Timer 260 363 3 WP 400 Po HPS hps400/1 465 1.4 None 260 363 - 0.0 -$ -$ -$ 141 3 HPS 250 HPS250/1 295 0.9 Timer 260 230 3 HPS 250 HPS250/1 295 0.9 None 260 230 - 0.0 -$ -$ -$
68 5.8 3,433 68 3.4 1,759 2.4 610 1,410 752.4 $329
1,673 $280$610 2.3 2.2
Total
2nd floor restroom
1st floor 3 person office
2nd floor hallway
AtticOutside Porch LightsParking Lot Lights
2nd floor end 2 person office
Parking Lot Lights
Total Savings
RETROFIT CONDITIONS
Unique description of the location - Room number/Roomname: Floor number (if applicable)
COST & SAVINGS ANALYSIS
Demand Savings
Area Description
kWh Savings
EXISTING CONDITIONS
BasementBasement
kitchen - 1st floor
2nd floor center office
2nd floor large office2nd floor office restroom
1st floor copy room
1st floor single office
1st floor rear vestibule
1st Floor restroom
2nd floor center office
kitchen - 1st floor1st floor conference room1st floor visitor room1st floor visitor room2nd floor end 2 person office
11/9/2011 Page 1, ECM-12

APPENDIX O
New Jersey Pay For Performance Incentive Program

Pinelands Preservation AllianceCHA #23261Building: Bishop Farmstead Offices
New Jersey Pay For Performance Incentive Program
Note: The following calculation is based on the New Jersey Pay For Performance Incentive Program per 2011Building must have a minimum average electric demand of 200 kW. This minimum is waived for buildings owned by localgovernements or non-profit organizations.
Total Building Area (Square Feet) 2,900 $0.10 $/sqftIs this audit funded by the NJ BPU (Y/N) Yes $0.05 $/sqftBoard of Public Utilites (BPU)
kWh Therms #2 Fuel Oil LPGExisting Cost (from utility) $1,500 $0 $5,100 $300
Existing Usage (from utility) 5,210 0 1,310 90Proposed Savings 2,190 0 560 0
Existing Total MMBtusProposed Savings MMBtus
% Energy ReductionProposed Annual Savings
$/kWh $/therm $/kWh $/therm $/kWh $/therm $/kWh $/thermIncentive #2 $0.09 $0.90 $0.005 $0.05 $0.11 $1.25 $0.11 $1.25Incentive #3 $0.09 $0.90 $0.005 $0.05 $0.11 $1.25 $0.11 $1.25
Elec Gas Total
Incentive #1 $0 $0 $145Incentive #2 $241 $0 $241Incentive #3 $241 $0 $241
Total All Incentives $482 $0 $627
Total Project Cost $13,700
Allowable Incentive
% Incentives #1 of Utility Cost* 9.7% $145% Incentives #2 of Project Cost** 1.8% $241% Incentives #3 of Project Cost** 1.8% $241
Total Eligible Incentives*** w/o Incentives w/ IncentivesProject Cost w/ Incentives 4.6 4.4
* Maximum allowable incentive is 50% of annual utility cost if not funded by NJ BPU, and %25 if it is.** Maximum allowable amount of Incentive #2 is 25% of total project cost.Maximum allowable amount of Incentive #3 is 25% of total project cost.*** Maximum allowable amount of Incentive #1 is $50,000 if not funded by NJ BPU, and $25,000 if it is. Maximum allowable amount of Incentive #2 & #3 is $1 million per gas account and $1 million per electric account
209
$13,073
Min (Savings = 15%) Increase (Savings > 15%) Max Incentive
86
$3,000
Achieved Incentive
Incentives $
Project Payback (years)$627
Incentive #1Audit not funded by NJ BPUAudit is funded by NJ BPU
Annual Utilities
41.0%

APPENDIX P
Photovoltaic (PV) Rooftop Solar Power Generation
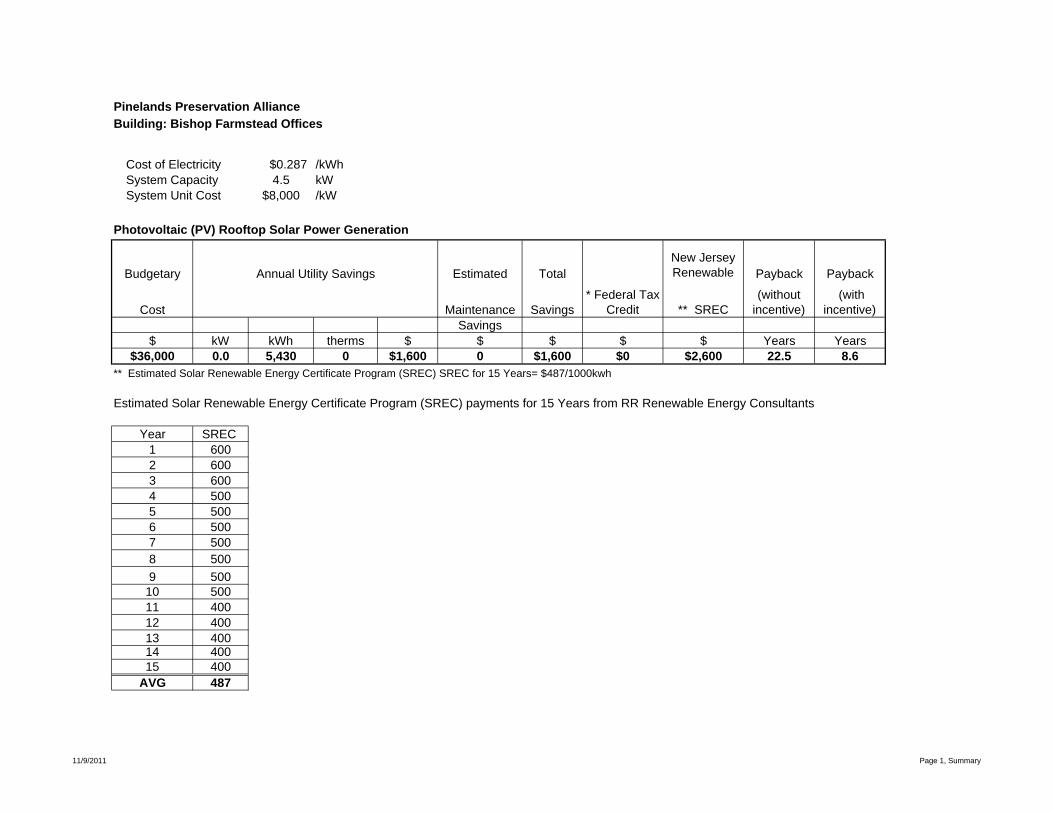
Building: Bishop Farmstead Offices
Cost of Electricity $0.287 /kWhSystem Capacity 4.5 kWSystem Unit Cost $8,000 /kW
Budgetary Estimated TotalNew Jersey Renewable Payback Payback
Cost Maintenance Savings* Federal Tax
Credit ** SREC(without
incentive) (with
incentive) Savings
$ kW kWh therms $ $ $ $ $ Years Years $36,000 0.0 5,430 0 $1,600 0 $1,600 $0 $2,600 22.5 8.6
** Estimated Solar Renewable Energy Certificate Program (SREC) SREC for 15 Years= $487/1000kwh
Estimated Solar Renewable Energy Certificate Program (SREC) payments for 15 Years from RR Renewable Energy Consultants
Year SREC 1 6002 6003 6004 5005 5006 5007 5008 5009 500
10 50011 40012 40013 40014 40015 400
AVG 487
Photovoltaic (PV) Rooftop Solar Power Generation
Annual Utility Savings
Pinelands Preservation Alliance
11/9/2011 Page 1, Summary

PVWATTS: Cautions for Interpreting the Results
http://rredc.nrel.gov/solar/calculators/PVWATTS/version1/interp.html[10/25/2011 10:52:14 AM]
Cautions for Interpreting the Results
The monthly and yearly energy production are modeled using the PV system parameters you selected and weather data that are typical orrepresentative of long-term averages. For reference, or comparison with local information, the solar radiation values modeled for the PVarray are included in the performance results.
Because weather patterns vary from year-to-year, the values in the tables are better indicators of long-term performance than performancefor a particular month or year. PV performance is largely proportional to the amount of solar radiation received, which may vary from thelong-term average by ± 30% for monthly values and ± 10% for yearly values. How the solar radiation might vary for your location may beevaluated by examining the tables in the Solar Radiation Data Manual for Flat-Plate and Concentrating Collectors(http://rredc.nrel.gov/solar/old_data/nsrdb/redbook/).
For these variations and the uncertainties associated with the weather data and the model used to model the PV performance, futuremonths and years may be encountered where the actual PV performance is less than or greater than the values shown in the table. Thevariations may be as much as 40% for individual months and up to 20% for individual years. Compared to long-term performance overmany years, the values in the table are accurate to within 10% to 12%.
If the default overall DC to AC derate factor is used, the energy values in the table will overestimate the actual energy production if nearbybuildings, objects, or other PV modules and array structure shade the PV modules; if tracking mechanisms for one- and two-axis trackingsystems do not keep the PV arrays at the optimum orientation with respect to the sun's position; if soiling or snow cover related lossesexceed 5%; or if the system performance has degraded from new. (PV performance typically degrades 1% per year.) If any of thesesituations exist, an overall DC to AC derate factor should be used with PVWATTS that was calculated using system specific componentderate factors for shading, sun-tracking, soiling, and age.
The PV system size is the nameplate DC power rating. The energy production values in the table are valid only for crystalline silicon PVsystems.
The cost savings are determined as the product of the number of kilowatt hours (kWh) and the cost of electricity per kWh. These costsavings occur if the owner uses all the electricity produced by the PV system, or if the owner has a net-metering agreement with the utility.With net-metering, the utility bills the owner for the net electricity consumed. When electricity flows from the utility to the owner, the meterspins forward. When electricity flows from the PV system to the utility, the meter spins backwards.
If net-metering isn’t available and the PV system sends surplus electricity to the utility grid, the utility generally buys the electricity from theowner at a lower price than the owner pays the utility for electricity. In this case, the cost savings shown in the table should be reduced.
Besides the cost savings shown in the table, other benefits of PV systems include greater energy independence and a reduction in fossilfuel usage and air pollution. For commercial customers, additional cost savings may come from reducing demand charges. Homeownerscan often include the cost of the PV system in their home mortgage as a way of accommodating the PV system’s initial cost.
To accelerate the use of PV systems, many state and local governments offer financial incentives and programs. Go tohttp://www.nrel.gov/stateandlocal for more information.
Please send questions and comments to Webmaster Disclaimer and copyright notice.
Return to RREDC Home Page ( http://rredc.nrel.gov/ )
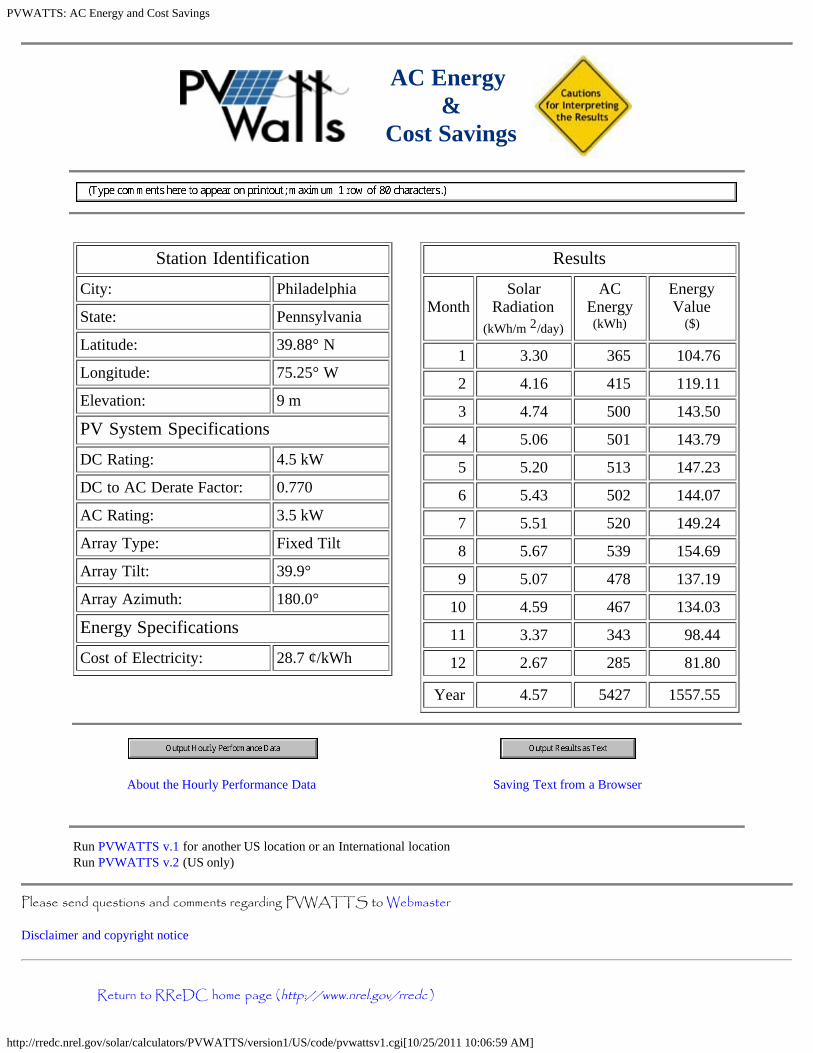
PVWATTS: AC Energy and Cost Savings
http://rredc.nrel.gov/solar/calculators/PVWATTS/version1/US/code/pvwattsv1.cgi[10/25/2011 10:06:59 AM]
* * *AC Energy
&Cost Savings
Station Identification
City: Philadelphia
State: Pennsylvania
Latitude: 39.88° N
Longitude: 75.25° W
Elevation: 9 m
PV System Specifications
DC Rating: 4.5 kW
DC to AC Derate Factor: 0.770
AC Rating: 3.5 kW
Array Type: Fixed Tilt
Array Tilt: 39.9°
Array Azimuth: 180.0°
Energy Specifications
Cost of Electricity: 28.7 ¢/kWh
Results
MonthSolar
Radiation(kWh/m 2/day)
ACEnergy(kWh)
EnergyValue
($)
1 3.30 365 104.76
2 4.16 415 119.11
3 4.74 500 143.50
4 5.06 501 143.79
5 5.20 513 147.23
6 5.43 502 144.07
7 5.51 520 149.24
8 5.67 539 154.69
9 5.07 478 137.19
10 4.59 467 134.03
11 3.37 343 98.44
12 2.67 285 81.80
Year 4.57 5427 1557.55
About the Hourly Performance Data*
Saving Text from a Browser
Run PVWATTS v.1 for another US location or an International locationRun PVWATTS v.2 (US only)
Please send questions and comments regarding PVWATTS to Webmaster
Disclaimer and copyright notice
Return to RReDC home page (http://www.nrel.gov/rredc )

APPENDIX Q
Solar Thermal Domestic Hot Water Plant
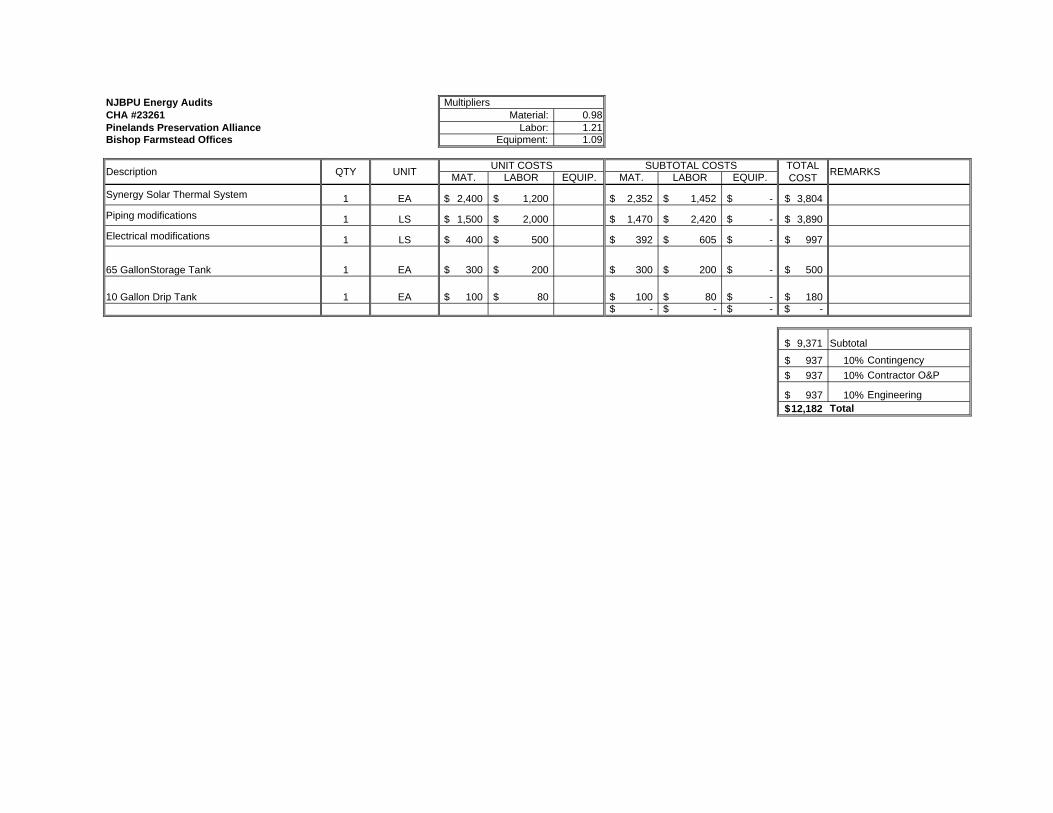
NJBPU Energy Audits MultipliersCHA #23261 Material: 0.98Pinelands Preservation Alliance Labor: 1.21Bishop Farmstead Offices Equipment: 1.09
MAT. LABOR EQUIP. MAT. LABOR EQUIP.
1 EA 2,400$ 1,200$ 2,352$ 1,452$ -$ 3,804$ Piping modifications 1 LS 1,500$ 2,000$ 1,470$ 2,420$ -$ 3,890$ Electrical modifications 1 LS 400$ 500$ 392$ 605$ -$ 997$
1 EA 300$ 200$ 300$ 200$ -$ 500$
1 EA 100$ 80$ 100$ 80$ -$ 180$ -$ -$ -$ -$
9,371$
937$ 10% Contingency937$ 10% Contractor O&P
937$ 10% Engineering12,182$ Total
REMARKS
Synergy Solar Thermal System
65 GallonStorage Tank
10 Gallon Drip Tank
Subtotal
Description QTY UNIT UNIT COSTS SUBTOTAL COSTS TOTAL COST

Interactive Energy Calculators
http://infinitepower.org/calc_water.htm[10/25/2011 10:41:18 AM]
Home
What Can I Do?
Electric Choice
Home Energy
FAQs
LEARNFact SheetsLesson Plans
PLAYCalculators
NETWORKOrganizationsBusinessesEvents Calendar
BROWSEResources Solar Wind Biomass Geothermal Water
Projects
TX Energy -Past and Present
Financial Help
About Us
About SECO
RARE
Interactive Energy Calculators
Our calculators help you understand energy production and consumption in a whole new way. Use themto develop a personal profile of your own energy use.
Carbon Pollution CalculatorElectric Power Pollution Calculator PV System EconomicsSolar Water HeatingWhat's a Watt?
Solar Water Heating CalculatorWater heating is a major energy consumer. Although the energy consumed daily is often less than for airconditioning or heating, it is required year round, making it a good application of solar energy. Use thiscalculator to explore the energy usage of your water heater, and to estimate whether a solar water heatercould save you money.
Water Heater Characteristics
Physical Thermal
Diameter (feet) Water Inlet Temperature (Degrees F)
Capacity (gallons) Ambient Temperature (Degrees F)
Surface Area (calculated - sq ft) Hot Water Temperature (Degrees F)
Effective R-value Hot Water Usage (Gallons per Day)
Energy Use
Heat Delivered in Hot Water (BTU/hr)
Heat loss through insulation (BTU/hr)
Gas vs. Electric Water Heating
Gas Electric
Overall Efficiency
Conversion Efficiency 0.98
BTU/hr Power Into Water Heater BTU/hr

Interactive Energy Calculators
http://infinitepower.org/calc_water.htm[10/25/2011 10:41:18 AM]
Cost
$ /Therm Utility Rates $ /kWh
$ Yearly Water Heating Cost $
How Does Solar Compare?
Solar Water Heater Cost: $ Percentage Solar:
years for gas Payback Time for Solar System years forelectric
More information on solar water heating:
Fact sheet - Solar Water HeatersFact sheet - Solar Water Heaters for Swimming PoolsKids fact sheet - Heat from the Sun
Return to Top of Page
Send comments, questions, and suggestions to website manager.
Window on State Government | Privacy and Security Policy | Accessibility Policy
State Energy Conservation Office (SECO)

APPENDIX R
Wind
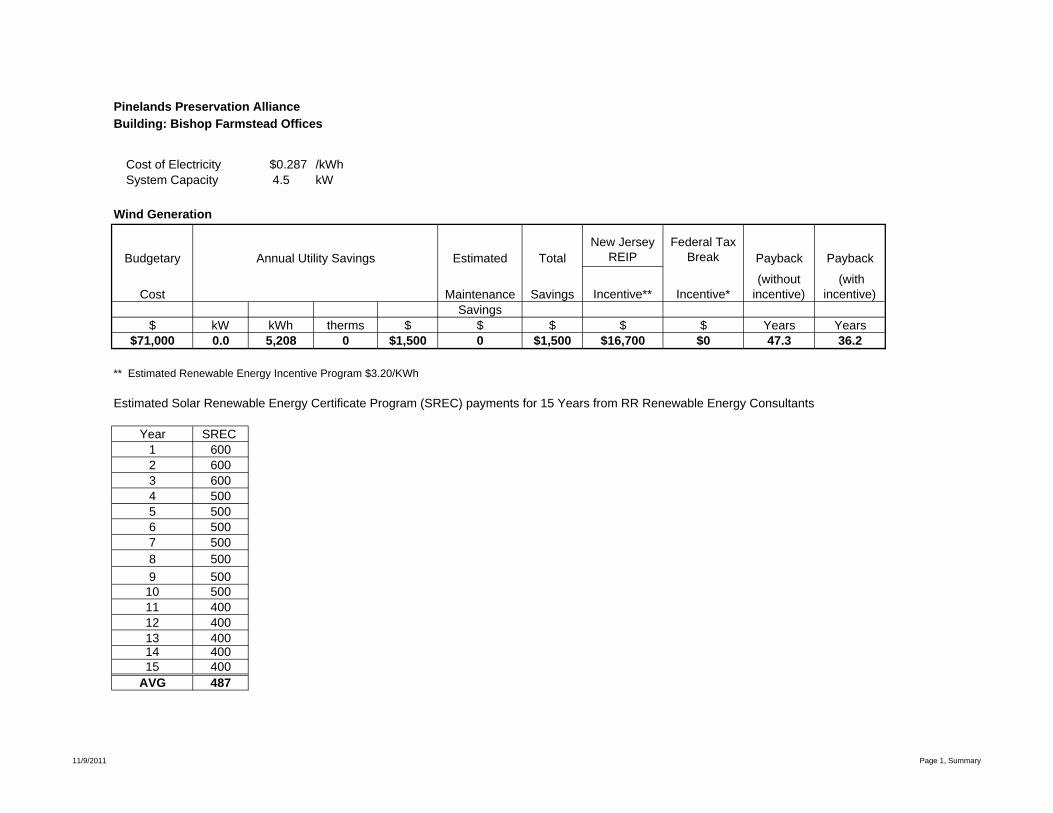
Building: Bishop Farmstead Offices
Cost of Electricity $0.287 /kWhSystem Capacity 4.5 kW
Budgetary Estimated TotalNew Jersey
REIPFederal Tax
Break Payback Payback
Cost Maintenance Savings Incentive** Incentive*(without
incentive) (with
incentive) Savings
$ kW kWh therms $ $ $ $ $ Years Years $71,000 0.0 5,208 0 $1,500 0 $1,500 $16,700 $0 47.3 36.2
** Estimated Renewable Energy Incentive Program $3.20/KWh
Estimated Solar Renewable Energy Certificate Program (SREC) payments for 15 Years from RR Renewable Energy Consultants
Year SREC 1 6002 6003 6004 5005 5006 5007 5008 5009 500
10 50011 40012 40013 40014 40015 400
AVG 487
Wind Generation
Annual Utility Savings
Pinelands Preservation Alliance
11/9/2011 Page 1, Summary

AtlanticOcean
P e n n s y l v a n i aP e n n s y l v a n i a
D e l a w a r eD e l a w a r e
N e w Y o r kN e w Y o r k
M a r y l a n dM a r y l a n d
N e w Y o r kN e w Y o r k
C o n n e c t i c u tC o n n e c t i c u t
OceanBurlington
Morris
Sussex
Atlantic
Salem
Warren
Monmouth
Hunterdon
Cumberland
Bergen
Mercer
Somerset
Middlesex
Gloucester
Camden
Passaic
Cape May
Essex
Union
Hudson
Tabor
Newark
Edison
Vernon
Vienna
Camden
Bayonne
CliftonPassaic
Kresson
Trenton
Fenwick
Paterson
Vineland
Elizabeth
New Egypt
Zarephath
Colts Neck
Union City
Chatsworth
Flemington
Jersey City
Dennisville
Crandon Lakes
Beach Haven West
73°30'0"W
73°30'0"W
74°0'0"W
74°0'0"W
74°30'0"W
74°30'0"W
75°0'0"W
75°0'0"W
75°30'0"W
75°30'0"W
76°0'0"W
76°0'0"W41
°0'0"N
41°0'
0"N
40°30
'0"N
40°30
'0"N
40°0'
0"N
40°0'
0"N
39°30
'0"N
39°30
'0"N
39°0'
0"N
39°0'
0"N
950000
950000
1000000
1000000
1050000
1050000
1100000
1100000
1150000
1150000
4300
000
4300
000
4350
000
4350
000
4400
000
4400
000
4450
000
4450
000
4500
000
4500
000
4550
000
4550
000
4600
000
4600
000
Mean Speed at 30 m mph m/s
< 10.1 < 4.510.1 - 11.2 4.5 - 5.011.2 - 12.3 5.0 - 5.512.3 - 13.4 5.5 - 6.0
13.4 - 14.5 6.0 - 6.514.5 - 15.7 6.5 - 7.015.7 - 16.8 7.0 - 7.516.8 - 17.9 7.5 - 8.017.9 - 19.0 8.0 - 8.5 > 19.0 > 8.5
0 8 16 24 324Miles
0 10 20 30 405Kilometers
FeaturesCity
Interstate Highway
County Boundary
Water Body
Wind Resource of New JerseyWind Resource of New Jersey Mean Annual Wind Speed at 30 Meters
AWS Truewind, LCC
Projection: Tranverse Mercator,UTM Zone 17 WGS84
Spatial Resolution of Wind Resource Data: 200mThis map was created by AWS Truewind using
the MesoMap system and historical weather data.Although it is believed to represent an accurate
overall picture of the wind energy resource, estimates at any location should be confirmed by
measurement.The transmission line information was obtained byAWS Truewind from the Global Energy Decisions
Velocity Suite. AWS does not warrant the accuracy of the transmission line information.
Generalized Transmission Line Category
Under 100 kV
100 kV-161 kV
230 kV-287 kV
345 kV
500 kV
735 kV +
Step-Up
DC Line

APPENDIX S
EPA Portfolio Manager

OMB No. 2060-0347
STATEMENT OF ENERGY PERFORMANCEPinelands Preservation
Building ID: 2902398 For 12-month Period Ending: February 28, 20111
Date SEP becomes ineligible: N/A Date SEP Generated: November 07, 2011
FacilityPinelands Preservation17 Pemberton RoadSouthampton, NJ 08088
Facility OwnerPinelands Preservation17 Pemberton Road Southampton, NJ 08088
Primary Contact for this FacilityJaclyn Rhoads17 Pemberton Road Southampton, NJ 08088
Year Built: 1753Gross Floor Area (ft2): 2,900
Energy Performance Rating2 (1-100) N/A
Site Energy Use Summary3
Electricity - Grid Purchase(kBtu) 17,872 Fuel Oil (No. 2) (kBtu) 147,895 Natural Gas - (kBtu)4 0 Total Energy (kBtu) 165,767
Energy Intensity5 Site (kBtu/ft2/yr) 57 Source (kBtu/ft2/yr) 72 Emissions (based on site energy use) Greenhouse Gas Emissions (MtCO2e/year) 13 Electric Distribution Utility Public Service Electric & Gas Co National Median Comparison National Median Site EUI 68 National Median Source EUI 164 % Difference from National Median Source EUI -56% Building Type Office
Stamp of Certifying Professional
Based on the conditions observed at thetime of my visit to this building, I certify that
the information contained within thisstatement is accurate.
Meets Industry Standards6 for Indoor EnvironmentalConditions:Ventilation for Acceptable Indoor Air Quality N/A Acceptable Thermal Environmental Conditions N/A Adequate Illumination N/A
Certifying ProfessionalJaclyn Rhoads17 Pemberton Road Southampton, NJ 08088
Notes: 1. Application for the ENERGY STAR must be submitted to EPA within 4 months of the Period Ending date. Award of the ENERGY STAR is not final until approval is received from EPA.2. The EPA Energy Performance Rating is based on total source energy. A rating of 75 is the minimum to be eligible for the ENERGY STAR.3. Values represent energy consumption, annualized to a 12-month period.4. Values represent energy intensity, annualized to a 12-month period.5. Based on Meeting ASHRAE Standard 62 for ventilation for acceptable indoor air quality, ASHRAE Standard 55 for thermal comfort, and IESNA Lighting Handbook for lighting quality.
The government estimates the average time needed to fill out this form is 6 hours (includes the time for entering energy data, Licensed Professional facility inspection, and notarizing the SEP) andwelcomes suggestions for reducing this level of effort. Send comments (referencing OMB control number) to the Director, Collection Strategies Division, U.S., EPA (2822T), 1200 Pennsylvania Ave.,NW, Washington, D.C. 20460.
EPA Form 5900-16

ENERGY STAR®
Data Checklistfor Commercial Buildings
In order for a building to qualify for the ENERGY STAR, a Professional Engineer (PE) or a Registered Architect (RA) must validate the accuracy of the data underlyingthe building's energy performance rating. This checklist is designed to provide an at-a-glance summary of a property's physical and operating characteristics, as well asits total energy consumption, to assist the PE or RA in double-checking the information that the building owner or operator has entered into Portfolio Manager.
Please complete and sign this checklist and include it with the stamped, signed Statement of Energy Performance.NOTE: You must check each box to indicate that each value is correct, OR include a note.
CRITERION VALUE AS ENTERED INPORTFOLIO MANAGER VERIFICATION QUESTIONS NOTES
Building Name Pinelands Preservation Is this the official building name to be displayed inthe ENERGY STAR Registry of LabeledBuildings?
Type Office Is this an accurate description of the space inquestion?
Location 17 Pemberton Road,
Southampton, NJ 08088 Is this address accurate and complete? Correctweather normalization requires an accurate zipcode.
Single Structure Single Facility
Does this SEP represent a single structure? SEPscannot be submitted for multiple-buildingcampuses (with the exception of acute care orchildren's hospitals) nor can they be submitted asrepresenting only a portion of a building
Bishop Farmstead (Office)
CRITERION VALUE AS ENTERED INPORTFOLIO MANAGER VERIFICATION QUESTIONS NOTES
Gross Floor Area 2,900 Sq. Ft.
Does this square footage include all supportingfunctions such as kitchens and break rooms usedby staff, storage areas, administrative areas,elevators, stairwells, atria, vent shafts, etc. Alsonote that existing atriums should only include thebase floor area that it occupies. Interstitial(plenum) space between floors should not beincluded in the total. Finally gross floor area is notthe same as leasable space. Leasable space is asubset of gross floor area.
Weekly operatinghours 45 Hours
Is this the total number of hours per week that theOffice space is 75% occupied? This numbershould exclude hours when the facility is occupiedonly by maintenance, security, or other supportpersonnel. For facilities with a schedule that variesduring the year, "operating hours/week" refers tothe total weekly hours for the schedule most oftenfollowed.
Workers on MainShift 9
Is this the number of employees present during themain shift? Note this is not the total number ofemployees or visitors who are in a building duringan entire 24 hour period. For example, if there aretwo daily 8 hour shifts of 100 workers each, theWorkers on Main Shift value is 100. The normalworker density ranges between 0.3 and 5.3workers per 1000 square feet (92.8 squaremeters)
Number of PCs 9 Is this the number of personal computers in theOffice?
Percent Cooled 50% or more Is this the percentage of the total floor space withinthe facility that is served by mechanical coolingequipment?
Percent Heated 50% or more Is this the percentage of the total floor space withinthe facility that is served by mechanical heatingequipment?
Page 1 of 3
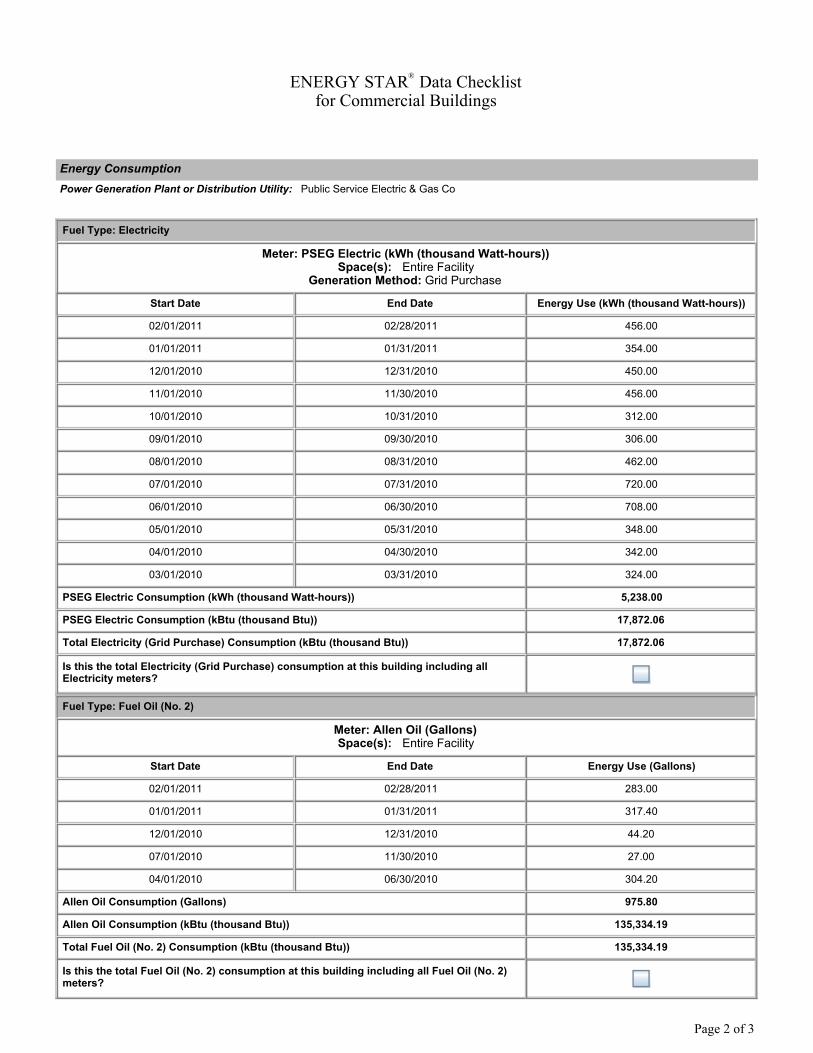
ENERGY STAR®
Data Checklistfor Commercial Buildings
Energy ConsumptionPower Generation Plant or Distribution Utility: Public Service Electric & Gas Co
Fuel Type: Electricity
Meter: PSEG Electric (kWh (thousand Watt-hours))Space(s): Entire Facility
Generation Method: Grid Purchase
Start Date End Date Energy Use (kWh (thousand Watt-hours))
02/01/2011 02/28/2011 456.00
01/01/2011 01/31/2011 354.00
12/01/2010 12/31/2010 450.00
11/01/2010 11/30/2010 456.00
10/01/2010 10/31/2010 312.00
09/01/2010 09/30/2010 306.00
08/01/2010 08/31/2010 462.00
07/01/2010 07/31/2010 720.00
06/01/2010 06/30/2010 708.00
05/01/2010 05/31/2010 348.00
04/01/2010 04/30/2010 342.00
03/01/2010 03/31/2010 324.00
PSEG Electric Consumption (kWh (thousand Watt-hours)) 5,238.00
PSEG Electric Consumption (kBtu (thousand Btu)) 17,872.06
Total Electricity (Grid Purchase) Consumption (kBtu (thousand Btu)) 17,872.06
Is this the total Electricity (Grid Purchase) consumption at this building including allElectricity meters?
Fuel Type: Fuel Oil (No. 2)
Meter: Allen Oil (Gallons)Space(s): Entire Facility
Start Date End Date Energy Use (Gallons)
02/01/2011 02/28/2011 283.00
01/01/2011 01/31/2011 317.40
12/01/2010 12/31/2010 44.20
07/01/2010 11/30/2010 27.00
04/01/2010 06/30/2010 304.20
Allen Oil Consumption (Gallons) 975.80
Allen Oil Consumption (kBtu (thousand Btu)) 135,334.19
Total Fuel Oil (No. 2) Consumption (kBtu (thousand Btu)) 135,334.19
Is this the total Fuel Oil (No. 2) consumption at this building including all Fuel Oil (No. 2)meters?
Page 2 of 3

Additional FuelsDo the fuel consumption totals shown above represent the total energy use of this building?Please confirm there are no additional fuels (district energy, generator fuel oil) used in this facility.
On-Site Solar and Wind EnergyDo the fuel consumption totals shown above include all on-site solar and/or wind power located atyour facility? Please confirm that no on-site solar or wind installations have been omitted from thislist. All on-site systems must be reported.
Certifying Professional (When applying for the ENERGY STAR, the Certifying Professional must be the same PE or RA that signed and stamped the SEP.)
Name: _____________________________________________ Date: _____________
Signature: ______________________________________ Signature is required when applying for the ENERGY STAR.
Page 3 of 3
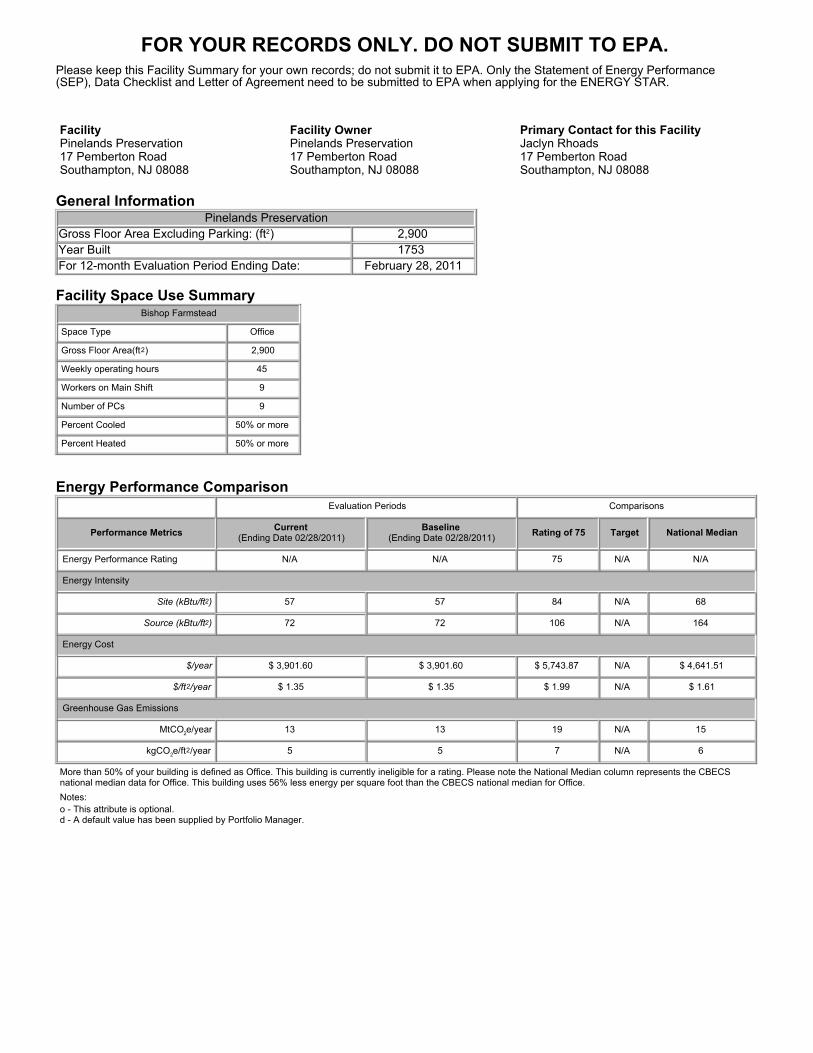
FOR YOUR RECORDS ONLY. DO NOT SUBMIT TO EPA.
Please keep this Facility Summary for your own records; do not submit it to EPA. Only the Statement of Energy Performance(SEP), Data Checklist and Letter of Agreement need to be submitted to EPA when applying for the ENERGY STAR.
FacilityPinelands Preservation17 Pemberton RoadSouthampton, NJ 08088
Facility OwnerPinelands Preservation17 Pemberton Road Southampton, NJ 08088
Primary Contact for this FacilityJaclyn Rhoads17 Pemberton Road Southampton, NJ 08088
General InformationPinelands Preservation
Gross Floor Area Excluding Parking: (ft2) 2,900 Year Built 1753 For 12-month Evaluation Period Ending Date: February 28, 2011
Facility Space Use SummaryBishop Farmstead
Space Type Office
Gross Floor Area(ft2) 2,900
Weekly operating hours 45
Workers on Main Shift 9
Number of PCs 9
Percent Cooled 50% or more
Percent Heated 50% or more
Energy Performance ComparisonEvaluation Periods Comparisons
Performance Metrics Current(Ending Date 02/28/2011)
Baseline(Ending Date 02/28/2011) Rating of 75 Target National Median
Energy Performance Rating N/A N/A 75 N/A N/A
Energy Intensity
Site (kBtu/ft2) 57 57 84 N/A 68
Source (kBtu/ft2) 72 72 106 N/A 164
Energy Cost
$/year $ 3,901.60 $ 3,901.60 $ 5,743.87 N/A $ 4,641.51
$/ft2/year $ 1.35 $ 1.35 $ 1.99 N/A $ 1.61
Greenhouse Gas Emissions
MtCO2e/year 13 13 19 N/A 15
kgCO2e/ft2/year 5 5 7 N/A 6
More than 50% of your building is defined as Office. This building is currently ineligible for a rating. Please note the National Median column represents the CBECSnational median data for Office. This building uses 56% less energy per square foot than the CBECS national median for Office. Notes:o - This attribute is optional.d - A default value has been supplied by Portfolio Manager.

APPENDIX T
Equipment Inventory

New Jersey BPU Energy Audit ProgramCHA #23261Pineland Preservation Alliance Bishop Farmstead Offices
Description QTY Manufacturer Name Model No. Serial No. Equipment Type /
Utility Capacity/Size /Efficiency Location Areas/Equipment Served
Date Installed
Remaining Useful Life
(years)Other Info.
Hot Water Boiler 1 Weil - McClain P-WGO-4 FF 7939342 Heating / Propane 40,000 Btuh input Basement Building 2004 17 Cast-Aluminum; Good Condition
Heating Hot Water Pumps 4 Taco 007-F5 - Primary Loop Pump / Electric 1/25 HP; 3250 RPM Basement
HHW boiler loop. Four areas - Kitchen, 1st Flr, 2nd Flr, Back
room
- - Good Condition
Domestic Hot Water Heater 1 . M40S5CX-6 FF 7939342 Heating / Propane 40 Gallon; 40,000 Btuh Basement Building - - Good Condition
AHU-1 1 Williamson Company
7527-25-2010--B8721716 - HVAC / Electric DX 1/3 HP supply fan Basement 1st Flr - - Fair Condition
AHU-2 1 Williamson Company
7527-25-2010--B8721725 - HVAC / Electric DX 1/3 HP supply fan Attic 2nd Flr - - Fair Condition
Condenser-1 1 Williamson Company 7420-02-2050 A8709834 Cooling / Electric DX 2.0 Tons; Outside AHU-1 - - Poor Condition
Condenser-2 1 Williamson Company 7420-25-2050 C8631259 Cooling / Electric DX 2.5 Tons; Outside AHU-2 - - Poor Condition
Refrigerator 1 Amana BX2ITE - Appliance / Electric DX - Kitchen - - - Fair ConditionDishwasher 1 Whirlpool - - Appliance / HW - Kitchen - - - Fair Condition
Equip Inventory - Rev 0.xlsPinelands

Energy Audit of Pinelands Preservation AllianceCHA Project No. 23261 Cost of Electricity: $0.168 $/kWhExisting Lighting $11.40 $/kW
No. of Fixtures Standard Fixture Code NYSERDA Fixture Code
Watts per Fixture kW/Space Exist Control
Annual Hours
Retrofit Control
Annual kWh
Field Code
No. of fixtures
before the retrofit
"Lighting Fixture Code" Example 2T 40 R F(U) = 2'x2' Troff 40 w Recess. Floor 2 lamps U shape
Code from Table of Standard Fixture Wattages
Value from Table of Standard Fixture Wattages
(Watts/Fixt) * (Fixt No.)
Pre-inst. control device
Estimated annual hours for the usage
group
Retrofit control device
(kW/space) * (Annual Hours)
Notes
117 3 CF 23 CFS23/1 23 0.07 SW 125 None 9 71 1 I 60 I60/1 60 0.06 SW 125 None 8 122 1 CF 15 CFS15/1 15 0.02 SW 500 OCC 8 122 1 CF 15 CFS15/1 15 0.02 SW 2000 None 30 108 1 I 65 I65/1 65 0.07 SW 2000 None 130 122 1 CF 15 CFS15/1 15 0.02 SW 250 None 4 117 4 CF 23 CFS23/1 23 0.09 SW 2000 None 184 249 1 T 30 W F 2 (MAG) RL/RB F32SS 81 0.08 SW 500 None 41 117 1 CF 23 CFS23/1 23 0.02 SW 2000 None 46 117 4 CF 23 CFS23/1 23 0.09 SW 2000 None 184 117 2 CF 23 CFS23/1 23 0.05 SW 500 None 23 117 3 CF 23 CFS23/1 23 0.07 SW 500 None 35 122 8 CF 15 CFS15/1 15 0.12 SW 2000 None 240 65 2 I 100 I100/1 100 0.20 SW 2000 None 400 73 10 I 120 I120/1 120 1.20 SW 500 D-OCC 600 73 6 I 120 I120/1 120 0.72 SW 500 D-OCC 360 250 4 LED Flood light 0 7 0.03 SW 500 D-OCC 14 229 1 WP200 I 1 i200/1 200 0.20 SW 2000 None 400 117 1 CF 23 CFS23/1 23 0.02 SW 2000 None 46 117 1 CF 23 CFS23/1 23 0.02 SW 500 None 12 71 3 I 60 I60/1 60 0.18 SW 125 None 23 71 3 I 60 I60/1 60 0.18 SW 260 None 47 237 3 WP 400 Po HPS hps400/1 465 1.40 Timer 260 None 363 141 3 HPS 250 HPS250/1 295 0.89 Timer 260 None 230
68 5.80 3,433
AtticOutside Porch LightsParking Lot LightsParking Lot Lights
kitchen - 1st floor1st floor conference room1st floor visitor room1st floor visitor room2nd floor end 2 person office2nd floor end 2 person office
Unique description of the location - Room number/Room name: Floor number (if applicable)
BasementBasement
2nd floor large office
EXISTING CONDITIONS
Area Description
1st floor single office
Total
2nd floor office restroom
1st Floor restroom2nd floor center office2nd floor center office2nd floor hallway
2nd floor restroom
1st floor 3 person office1st floor copy room1st floor rear vestibulekitchen - 1st floor
11/10/2011 Page 1, Existing