blackpool tramway extension to north station … · 1 1. introduction 1.1 this report provides the...
TRANSCRIPT

Blackpool Tramway Extension to North Station Monitoring and Evaluation Plan October 2017


i
Monitoring and Evaluation Blackpool Tramway Extension to North Station Contents
1. Introduction 1
2. Inputs 8
3. Outputs 11
4. Outcomes 16
5. Impacts 31
Appendices
Appendix A: Benefits Realisation Profile
Appendix B: Budget for Monitoring and Evaluation Plan

1
1. Introduction
1.1 This report provides the Monitoring and Evaluation Plan (M&E Plan) for the Blackpool and Fleetwood Tramway Extension to Blackpool North Station. The Monitoring and Evaluation (M&E) has been established in line with the requirements of the Lancashire Enterprise Partnership (LEP) monitoring and evaluation framework1. This is a proportionate approach for monitoring and evaluation in this context.
1.2 The purpose of M&E is to demonstrate that the processes, costs and governance, physical infrastructure, service level, and benefits of a scheme have been delivered and the original objectives for the scheme are met. Understanding the effects of a project provides evidence that investment was justified, and supports the development of future schemes. This is demonstrated through the collation of data and comparing it to targets, forecasts and estimates set out in the Benefits Realisation Profile.
1.3 The M&E Plan details the processes and requirements necessary to determine if the effects of the scheme have been realised, to determine, as far as is possible, causality between effects and the scheme and to identify lessons for future projects. Benefits are logged, tracked and allocated in the Benefits Realisation Profile. The Benefits Realisation Profile is Appendix A to this report.
Scheme Scheme Description 1.4 The Blackpool and Fleetwood Tramway underwent a major programme of
improvements in the four years to 2012 including improvements to tram infrastructure, highway infrastructure and new tram vehicles.
1.5 Although the tramway upgrade has been successful, there remains a lack of integration between the tram system – which moves people around economically important destinations in Blackpool – and the rail system – which allows rail access to tourism, jobs and services in Blackpool from the rest of the UK, and access to jobs and services in the rest of the UK (particularly Preston and Lancashire) from Blackpool. Interchange between rail and tram requires a transfer on foot of around 600 metres at the closest interchange points. This makes interchange journeys unattractive, especially considering that a walking trip is already likely to have been made to access the initial public transport mode and a further walk to the final destination.
1.6 There are three types of movements of people which are of particular importance to the economy of Blackpool and the wider region:
• Inward movement of tourists to Blackpool from regional and national origins
• The two-way movement of local residents between the North West and Blackpool for work, leisure and services
1 Growth Deal Monitoring and Evaluation Framework, Lancashire Enterprise Partnership, May 2016

2
• The internal movement of people between jobs, services and residential areas within Blackpool
1.7 Making these types of movement by public transport would be made significantly easier by improving the integration by tram and rail in Blackpool. A Preferred Option to complete the 600m gap between Blackpool North Station and the existing tram system has been developed.
1.8 The Preferred Option comprises a 550m twin track extension of the tramway from the Promenade, in a north easterly direction through Talbot Square and along Talbot Road terminating on a new tram stop to be situated on the existing pavement parallel to Talbot Road/High Street as indicated in Figure 1.
Figure 1: The Preferred Option Scheme
1.9 The junction between the existing tramway and the extension will be formed using a full delta junction that enables movements in all directions.
1.10 The new track will comprise an on-street track slab with embedded grooved rail enabling a flush surface to be created. Its construction will be similar to that already employed on the Blackpool tramway.
1.11 To accommodate the new tramway alignment, the current traffic arrangement along Talbot Road must be amended. Eastbound traffic between Talbot Square and Abingdon Street will be removed, with traffic re-routed via Clifton Street and Abingdon Street; the existing restrictions between Abingdon Street and Dickson Road/Topping Street will remain. Westbound traffic movements will remain unchanged.
1.12 To accommodate the new tramway alignment, new signalled junctions will be introduced at Promenade/Talbot Square, and at Talbot Road’s intersections with Dickson Road/Topping Street and Cookson Street.

3
1.13 To separate tram and traffic movements at the Delta junction the recently re-modelled Talbot Square will need to be reconfigured. The carriageway will be relocated such that it is adjacent to the Ibis Hotel; the tramway will lie immediately to the north of this with an area of public realm created between the tramway and the Counting House public house.
1.14 The North Pier stop will remain unaltered with separate side platforms for northbound and southbound directions located to the north and south of Talbot Square respectively. A new eastbound only stop (Talbot Square) will be created to allow passengers to board/alight the trams travelling onwards to North Station.
1.15 The terminus at Blackpool North Station will comprise two side platforms that are preceded by a facing scissors crossover which enables trams to be routed into/out of either platform. Whilst it may be possible to operate the proposed service platform from a single platform face this layout provides the necessary redundancy that is capable of coping with service perturbations or the ability to store a broken-down tram until such time as it can be recovered. Depending on the implemented timetable solution it is possible that services heading south towards Starr Gate and serviced heading north to Fleetwood could be operated from separate platforms to provide simple legibility to passengers.
1.16 The new stops will be similar in form and facilities to those that exist on the present tramway.
1.17 As with the existing tramway, the trams operating on the extension will be powered via an overhead line equipment (OLE) system. The OLE comprises an electrified contact wire located above the alignment of the tracks, with the power conveyed to the vehicle via a pantograph. The contact wire will generally be supported using discrete poles, as with the original tramway that ran along Talbot Road. The traction power voltage is nominally 650V DC.
Scheme Objectives 1.18 Six objectives were developed for the scheme, to:
1. Maximise growth of the Fylde Coast economy by enhancing accessibility and connectivity to key destinations within and outwith the sub-region.
2. Support and facilitate the sustainable growth of the Fylde Coast sub-region by complementing and, where possible, enhancing current development and regeneration proposals.
3. Reduce transport’s emissions of CO2 and other greenhouse gases by contributing to wider carbon reduction and mode shift policies for the authorities making up the Fylde Coast sub-region.
4. Promote quality of life through a safe and healthy built and natural environment.
5. Contribute to enhanced quality of life by improving access for all to jobs and services.
6. Ensure affordability, deliverability and Value for Money of the proposed scheme taking account of current Government guidance.

4
1.19 The Preferred Option:
• Will deliver passenger and economy benefits by improving accessibility and connectivity both within Blackpool, and to the wider sub-region for commuters and for visitors accessing the resort.
• Will facilitate urban realm enhancements in the town centre as well as improving access for employers in Blackpool to a larger labour pool. Improves the connectivity between the economically important seafront and the redeveloping town centre.
• Will make a modest contribution to wider carbon reduction and mode shift because opportunities to use public transport are improved for all.
• Will make a modest contribution to a safe and healthy built environment because opportunities to use public transport and the public realm are improved for all.
• Will contribute to enhanced quality of life by improving access to jobs and services within Blackpool and the wider sub-region.
• Represents high value for money to the public sector, is affordable within the context of the Blackpool Council and Lancashire LEP budgets for transport, and is a deliverable scheme.
1.20 Additionally, the scheme will also help to provide additional capacity along the Promenade, which can experience peak crowding.
Logic Map 1.21 The Logic Map is a diagrammatical representation of the connections between the
scheme objectives and the inputs, outputs, outcomes and impacts of the scheme. The logic map is the basis to establishing what will be monitored as part of the M&E Plan for the scheme. The Logic Map includes the following2:
• Inputs: What is invested
• Outputs: What has been produced
• Outcomes: Immediate and mature term results
• Impacts: Long term outcomes
2 DfT Best Practice Guidance for planning the Fuller Evaluations of Local Authority Major Schemes, 2013

5
Figure 2: Logic Map
Costs 1.22 Costs have been provided to show the budget required to complete the M&E
reporting process. The cost of the Promoters’ time has not been included.
1.23 Where data is required beyond the scope of that internally collected by the Promoters, costs have been acquired and inflated in line with the M&E reporting timeframes.
1.24 To ensure that the budget for M&E is robust, the cost for delivering the completion of the one and five years after opening reports have been costed with the assumption that they would be completed externally, by a consultant. Time allocated assumes the requirement for any analysis, reporting and project management. For this a value of £714 per day has been assigned for the one year after opening timescale. This is equivalent to £784 per day for the five years after opening timescale3.
1.25 The cost for external data collection is shown separately and is not assumed to be supplied by the consultant but by a data collection specialist.
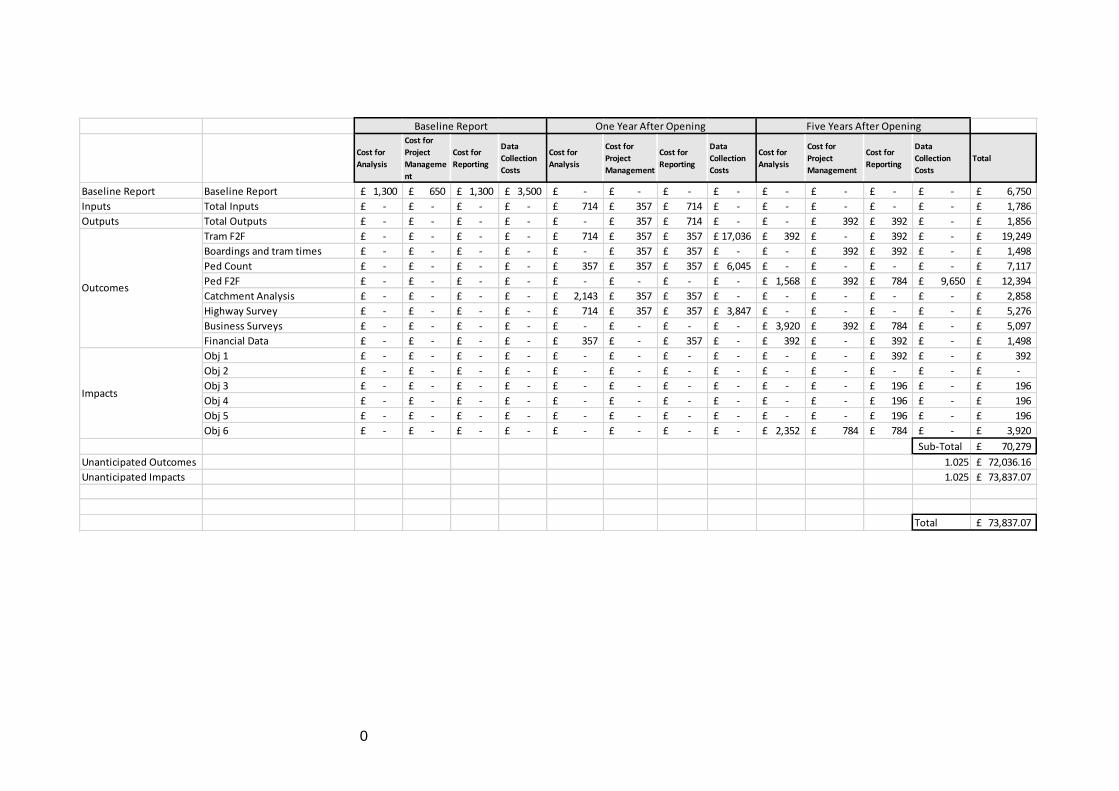
1.26 The total budget for the M&E work is just under £75,000. The breakdown of costs can be found in Appendix B.
3 Costs per day are equivalent to £650 per day in 2017 inflated by RPI+1 as specified in the WebTAG July 2017 Databook to 2021 and 2024

6
Reporting 1.27 The process of M&E occurs over three reporting timeframes: Baseline reporting, one
year after opening report, five years after opening report. The reporting will be shared between the promoters of the scheme (Blackpool Council and Blackpool Transport Services (BTS)) and the LEP.
Scheme Baseline Report 1.28 Before any evaluation is undertaken, a baseline must be established to understand
the effect of context on the outcomes and impacts of the scheme.
1.29 The Scheme Baseline Report, a standalone document, illustrates baseline information before the construction of the scheme in early 2018. The most contemporary socio-economic, transport and development context for the scheme must be documented within the report. Some internal resources may be required to complete the work.
1.30 There is one baseline value for which a survey would need to be conducted before scheme opening to provide a comparator value for after the schemes open. This is the highway journey time survey for the AM and PM peak periods (noted as 08:00-09:00 and 16:45-17:454) for routes affected by the scheme. Detail on this is included within Chapter 4.
1.31 The cost for the baseline report is £6,570, which is all external costs.
Table 1: Baseline Report Costs
Before Opening
Total
An
alys
is
Pro
ject
Man
age
me
nt
Re
po
rtin
g
Dat
a
Co
llect
ion
Time (days) 2 1 2 5
Cost £1,300 £650 £1,300 £3,500 £6,750
One Year After Opening Report 1.32 An initial report at least one year (but less than two years after scheme opening)
with a report published within two years of scheme opening.
1.33 The scheme opens in 2019. It is expected that immediate outcomes will begin to be observed one year after opening (2020). There is approximately one year after the observed outcomes to complete the first report (2021). The cost of the one year after opening report is included through this M&E Plan.
4 Transport Assessment for TWAO Application, Document Reference A14/4

7
Five years After Opening Report 1.34 A final report based on the ‘one year after’ data and for data collected across the five
years after scheme opening. The report is to be published within six years of scheme opening.
1.35 It is expected that more mature outcomes will begin to be observed five years after opening (2023). There is approximately one year after these observed outcomes to complete the five years after opening report (2024). The cost of the five years after opening report is included through this M&E Plan.

8
2. Inputs
Introduction 2.1 The M&E for the inputs have been guided by the LEP framework. The inputs are core
metrics that must be collected for all projects and programmes. The Logic Map also contains inputs that fall outside the scope of the LEP framework. These will also be monitored.
2.2 Table 2 shows the alignment of the LEP core metrics for inputs to those within the Logic Map.
Table 2: Inputs
Logic Map Description LEP Metric Description
Development Resources In-kind resources provided
Implementation Resources Expenditure and funding breakdown
Agreed service pattern
Construction contract
Methodology for M&E Development Resources/In-Kind Resources Provided 2.3 The LEP defines in-kind resources as “land, buildings, or other assets provided to
resource the intervention”.
2.4 These will be qualitatively assessed for each quarter up to the opening of the scheme. They will be reported on within the one year after opening report. There is no additional external cost to collect the data, it will be collected by the promoter.
Implementation Resources/Expenditure and Funding Breakdown 2.5 The LEP defines expenditure as “expenditure defrayed directly on the intervention,
broken down into LGF funds, other public sector funds and private funds”.
2.6 The LEP defines funding breakdown as “Non LGF funding delivered including public, private, and third part match funding, broken down by source. This should not include in-kind contributions”.
2.7 There is no additional external cost to collect the data. Data on implementation resources and expenditure can be collected through standard financial reporting processes by the scheme promoter in the period up to scheme opening. It is expected that these would be collected monthly by cost code. The breakdown would need to be reported on in the one year after opening report.

9
Agreed Service Pattern 2.8 The service pattern will be agreed in the service contract. This should align to the
patterns put forward in the Full Business Case. The service contract will be provided for the one year after opening report. There is no additional cost to collect this information.
Construction Contract 2.9 The construction contract will be included in the one year after opening report to
show that the construction of the works aligns to the proposed approaches of the Commercial Case.
2.10 The Promoters of the scheme will supply this information. There will be no additional cost.
Summary of Monitoring Methodology for Inputs Table 3: Summary of Inputs
Logic Map
Description
LEP Metric
Description
Monitoring
Approach
Data
Collection
Frequency
Period of
Data
Collection
Inclusion
in One
Year After
Opening
Report
Inclusion in
Five Years
After
Opening
Report
Development
Resources
In-kind
resources
provided
Qualitatively
assessed
Quarterly In the period
before
scheme
opening
✓
Implementation
Resources
Expenditure
and funding
breakdown
Internal
financial
reporting
Monthly In the period
before
scheme
opening
✓
Agreed service
pattern
Operating
contract used
for scheme
Once In the period
before
scheme
opening
✓
Construction
contract
Construction
contract used
for scheme
Once In the period
before
scheme
opening
✓
Cost of M&E 2.11 There will be no additional costs associated with the collection of data to monitor
the inputs of the scheme as this will be available from the Promoters. An internal resource cost would only be applicable to collate and analyse this information for the one year after opening report.

10
2.12 The total projected cost for the Monitoring and Evaluation of inputs is £1,786. The detail of this is shown below and in Appendix B.
Table 4: Costs for Inputs
One Year After Opening Five Years After Opening
Total A
nal
ysis
Pro
ject
Man
age
me
nt
Re
po
rtin
g
Dat
a
Co
llect
ion
An
alys
is
Pro
ject
Man
age
me
nt
Re
po
rtin
g
Dat
a
Co
llect
ion
Time
(days)
1 0.5 1 2.5
Cost £714 £357 £714 £1,786

11
3. Outputs
Introduction 3.1 The scheme will deliver outputs over two periods over the life of the scheme: during
construction and from delivery of the scheme.
3.2 The M&E for the outputs have been guided by the LEP framework. The outputs are core metrics that must be collected for all projects and programmes. However, the Logic Map also contains other outputs that fall outside the scope of the LEP framework. These will also be monitored.
3.3 The following shows the alignment of the LEP core metrics for outputs to those within the Logic Map.
Table 5: Outputs
Logic Map Description Logic Map Description LEP Metric Description
Outputs from Construction Traffic impacts from construction
Environmental impacts from
construction
Economic impacts from construction
Outputs from Provision of the
Scheme
Tram infrastructure provision Types of infrastructure delivered
Tram service changes Type of service improvement
delivered
Alterations to highway network Types of infrastructure delivered
Improvements to active modes
facilities
Types of infrastructure delivered
Alterations to urban realm Types of infrastructure delivered
Methodology for M&E Traffic Impacts from Construction and Economic Impacts from Construction 3.4 To build the scheme, there will be traffic management measures within Blackpool
town centre. This will be internally monitored by the Promoters and therefore does not require external data collection.
3.5 The traffic management will be qualitatively assessed through each phase of the construction (utilities, civils package on Talbot Road and civils work on the Promenade) up to the opening of the scheme. The information would be available to the Promoters and therefore there would be no additional external cost for this. It will be reported on within the one year after opening report.
3.6 As a result of minimising the impact of the construction programme and delivering appropriate traffic management measures in the town centre, it is expected that there will be no significant negative economic impacts.
12
Environmental Impacts from Construction 3.7 The Air Quality Assessment for the scheme shows that through an appropriate
Construction Dust Management Plan, the impact of dust will be negligible.
3.8 With correct management practices, the impact of site emissions will not be significant and the impact of temporary re-routing of traffic also will not be significant.
3.9 It would not be proportionate5 to monitor these outputs as they are temporary and will not have a significant effect over the life of the asset.
Tram Infrastructure Provision/Alterations to Urban Realm/Type of Infrastructure Delivered 3.10 The Blackpool North Tramway Extension will extend the current tramway from the
North Pier tram stop on the Promenade to Blackpool North Station, inland on Talbot Road.
3.11 As part of the scheme, the following infrastructure will be delivered:
• Approximately 550m of twin track
• Overhead line equipment (OLE) with 650V DC for the scheme
• New eastbound only stop at Talbot Square
• Terminus stop with two side platforms at Blackpool North Station
• Urban realm improvements between the tramway and Counting House public house
3.12 These form the outputs of the scheme and can be monitored by the Promoters to ensure what has been contractually agreed as part of the civil engineering works is delivered. There would be no external costs to undertake this monitoring. The outputs will be reported in the one year after opening report.
Tram Service Changes/Type of Service Improvement Delivered 3.13 The scheme will deliver the following service frequencies:
5 Document Reference Number A14/1

13
Figure 3: Tram Service Arrangement
Table 6: Service Frequencies of Blackpool Tram with New Scheme
Service Serves High Season
Shoulder Season
Winter High & Shoulder Evenings (after 1900)
Winter Evenings (after 2100)
T1 Fleetwood – Starr Gate6 6 5 4 47 2
T2 North Station – Pleasure Beach8 3 2 2 2 29
T3 Bispham – North Station 3 2 2 2 2
3.14 This information can be tracked through the high, shoulder and winter seasons by BTS or can be reviewed through seasonal review of published timetables. There would not be any external costs associated with the collection of this data. The services would be reported in the one year after opening and five years after opening reports.
Alterations to Highway Network/Improvements in Active Modes Facilities/Type of Infrastructure Delivered 3.15 The scheme requires some changes to the local highway network:
• New signalled junction at the Promenade/Talbot Road junction with pedestrian facilities and Advanced Cycle Stop Lines (ACSL)
• New signalled junction at the Talbot Road/Dickson Road/Topping Street junction with pedestrian facilities and new eastbound cycle lane
• New signalled junction at Talbot Road/Cookson Street junction with pedestrian facilities and ACSL
3.16 These can be monitored to ensure what has been contractually agreed as part of the civil engineering works is delivered. There would not be any external costs associated with the collection of this data. These will be reported in the one year after opening report.
6 Occasional trips start from or terminate at Pleasure Beach 7 2 trams per hour between Fleetwood and Bispham 8 A few trips run to or from Starr Gate 9 Runs as far south as Manchester Square

14
Summary of Monitoring Methodology for Outputs Table 7: Summary for Outputs
Logic Map
Description
LEP Metric
Description
Monitoring
Approach
Data
Collection
Frequency
Period of
Data
Collection
Inclusion
in One
Year After
Opening
Report
Inclusion in
Five Years
After
Opening
Report
Traffic impacts
from
construction
Qualitatively
assessed
Quarterly In the period
before
scheme
opening
✓ (✓)
Environmental
impacts from
construction
n/a n/a n/a n/a n/a
Economic
impacts from
construction
n/a n/a n/a n/a n/a
Tram
infrastructure
provision
Types of
infrastructure
delivered
Review of
delivery of
infrastructure
by civil
engineering
works
Once In the period
before
scheme
opening
✓
Tram service
changes
Type of
service
improvement
delivered
Through BTS
captured
information
or publicly
available
timetable
information
Seasonally After
opening
✓ (✓)
Alterations to
highway
network
Types of
infrastructure
delivered
Review of
delivery of
infrastructure
by civil
engineering
works
Once In the period
before
scheme
opening
✓
Improvements
to active modes
facilities
Types of
infrastructure
delivered
Review of
delivery of
infrastructure
by civil
engineering
works
Once In the period
before
scheme
opening
✓
Alterations to
urban realm
Types of
infrastructure
delivered
Review of
delivery of
infrastructure
by civil
engineering
works
Once In the period
before
scheme
opening
✓

15
Cost of M&E 3.17 There will be no additional costs associated with the collection of data to monitor
the outputs of the scheme as the required information will be available from the Promoters. An internal resource cost would only be applicable to collate and analyse this information for the one year after opening report.
3.18 The total projected cost for the Monitoring and Evaluation of outputs is £1,856. The detail of this is shown below and in Appendix B.
Table 8: Costs for Outputs
One Year After Opening Five Years After Opening
Total
An
alys
is
Pro
ject
Man
age
me
nt
Re
po
rtin
g
Dat
a
Co
llect
ion
An
alys
is
Pro
ject
Man
age
me
nt
Re
po
rtin
g
Dat
a
Co
llect
ion
Time
(days)
0 0.5 1 0 0.5 0.5 2.5
Cost £357 £714 £392 £392 £1,856

16
4. Outcomes
Introduction 4.1 The new scheme will give rise to a range of immediate and mature outcomes.
Immediate outcomes would be measurable by the end of the first year after opening. Mature outcomes are anticipated would be measurable by the end of the fifth year after opening. Both types of outcome can be further divided: as a result of the scheme being in place; and from scheme use.
4.2 The M&E for the outcomes has been guided by the LEP framework. These are classified within the ‘Additional Monitoring’ required for specific schemes. The outcomes have been aligned to the Logic Map. The Logic Map contains other outcomes that fall outside the scope of the LEP framework. These will also be monitored.
4.3 Tables 9 and 10 show the alignment of the LEP Additional Monitoring metrics with immediate and mature outcomes within the Logic Map.
4.4 The LEP specifies a number of outcomes which all schemes must monitor but which do not fall within the scope of this M&E Plan. These are listed at the end of this chapter.
Table 9: Immediate outcomes
Logic Map Description Logic Map Description LEP Metric Description
By Presence of Scheme Improved public transport integration
Enhanced connectivity to local tourist
attractions
Better connectivity across the Fylde Coast
sub-region
Better connectivity between deprived areas
and economic activity
Increase in public transport operating costs
Better built environment
Enhanced perceptions of personal safety
Change in highway journey times Average AM and PM peak journey
time on key routes (journey time
measurement)
From Scheme Use Changes to footfall along Talbot Road Pedestrian counts on new/existing
routes
Reductions in carbon emissions
Tram revenue
Unanticipated outcomes

17
Table 10: Mature Outcomes
Logic Map Description Logic Map Description LEP Metric Description
By Presence of Scheme Better integration of town centre, resort
core and promenade
Increased attractiveness of town centre to
developers, tourists and local people
From Scheme Use Non-user benefits Average AM and PM peak journey
time on key routes (journey time
measurement)
User benefits Annual average daily and peak
hour passenger boardings
Bus/light rail travel time in peak
period
Additional public transport use/mode shift
from highway
Commercially viable wider public transport
network
Change in visitor spend
Unanticipated outcomes
Methodology for M&E Introduction 4.5 This chapter has been arranged by data collection method rather than by outcome.
The data collection methods span across both immediate and mature outcomes.
On-Tram Face to Face Passenger Surveys 4.6 The following outcomes would be captured through face to face surveys on-tram and
at stops:
• Improved public transport integration
• Enhanced connectivity to local tourist attractions
• Enhanced perceptions of personal safety
• Additional public transport use/mode shift from highway (reduction in carbon emissions)
• Change in visitor spend

18
Survey Specification and Cost 4.7 The survey would need to be conducted in the following area in both directions:
Figure 4: Area for Face to Face and At Stop Tram Surveys
4.8 The survey would look to obtain information from 500 passengers from five weekdays and 500 passengers across a weekend, covering a representative sample of users. Surveying across weekdays and a weekend will capture: residents who use the tram to access services and employment in Blackpool; and, services and employment beyond Blackpool via the rail station as well as visitors to Blackpool. The survey would need to be undertaken in high season (July to August).
4.9 The survey would need to be succinct (less than 5 minutes) to enable completion over the short-tram journey along the new extension. The survey would ascertain basic information, supplemented with more detailed questions to understand how the outcomes had been met. For example:
• Basic Information
- The origin and destination of the passengers
- Purpose of their trip to Blackpool and trip on the tram
- Simple demographic information to demonstrate a representative sample
• Detailed Information
- How passengers feel integration between the tram/Blackpool North Station has changed
- How passengers feel about access to tourist attractions/services/employment opportunities
- Have passenger perceptions regarding personal security changed since the scheme opened
- How they travelled between origin and destination today and before scheme opening
- How often they travel to Blackpool and will/has the tram make/made them visit the town more frequently
4.10 The survey work would need to be undertaken for the one year after opening report.

19
4.11 Following analysis of the results, the carbon emissions saved would be calculated through the conversion of saved vehicle kilometres using the Marginal External Costs (MEC) approach set out within WebTAG10 .
4.12 Information from this survey could be used to ascertain the mature outcome for non-user benefits and change in visitor spend required for the five years after opening report.
4.13 The cost of this survey work and reporting for the one and five years after opening reports is shown below.
Table 11: Cost for On Tram and at Stop Surveys
One Year After Opening Five Years After Opening
Total
An
alys
is
Pro
ject
Man
age
me
nt
Re
po
rtin
g
Dat
a
Co
llect
ion
An
alys
is
Pro
ject
Man
age
me
nt
Re
po
rtin
g
Dat
a
Co
llect
ion
Time
(days)
1 0.5 0.5 0.5 0.5 3
Cost £714 £357 £357 £17,036 £392 £392 £19,249
Tram Data 4.14 On board information would be collected to demonstrate the outcomes for user
benefits.
4.15 The LEP framework requires that the following are collected:
• Annual average daily and peak hour passenger boardings
- Provides information about the capacity of the trams and therefore about the connectivity offer provided by the scheme
• Light rail travel time in peak period
- Provides information about whether the signal timings at junctions along the route are configured correctly
Survey Specification and Cost 4.16 BTS capture data for passenger numbers on the tram, there would be no external
cost for this. The passenger numbers would need to be isolated for the extension only section in both directions. The LEP only requires the passengers to be presented as annual average daily passenger boardings for twice in the year.
4.17 Light rail travel times can be captured through the stop to stop timings which the tram registers automatically. This would need to be collated for the high and low
10 https://www.gov.uk/government/uploads/system/uploads/attachment_data/file/625402/TAG_unit_a5.4_marginal_external_costs_jul17-2.pdf

20
season in the year before the one year after opening and in the year before the five years after opening report. There would be no external cost to obtain this data.
4.18 The findings would be presented in the one year after opening and five years after opening reports. The costs for the work are shown below.
Table 12: Cost for Tram Data
One Year After Opening Five Years After Opening
Total
An
alys
is
Pro
ject
Man
age
me
nt
Re
po
rtin
g
Dat
a
Co
llect
ion
An
alys
is
Pro
ject
Man
age
me
nt
Re
po
rtin
g
Dat
a
Co
llect
ion
Time
(days)
0.5 0.5 0.5 0.5 2
Cost £357 £357 £392 £392 £1,498
Comparator Information 4.19 The passenger numbers for the scheme before opening are captured by the forecast
values in the business case. The values are as follows:
Table 13: Baseline Passenger Numbers
Route Year High Season
Weekday
High Season
Weekend
Low Season
Weekday
Low Season
Weekend
North Station
to Pleasure
Beach
2018 1,365 2,770 1,070 1,281
2033 1,363 2,675 1,040 1,228
Pleasure Beach
to North
Station
2018 1,420 1,310 940 844
2033 1,384 1,285 918 835
Bispham to
North Station
2018 321 1,134 275 305
2033 317 1,088 267 302
North Station
to Bispham
2018 1,151 1,260 238 409
2033 1,129 1,251 235 405
4.20 The run times for the tram before opening also come from the model used in the business case. Run times are specified as:
• Bispham to Blackpool North Station: 14 minutes in either direction
• Pleasure Beach to Blackpool North Station: 15 minutes in either direction

21
Pedestrian Surveys 4.21 The scheme will provide improved urban realm for pedestrians. A count of footfall
along Talbot Road will provide the data to understand how many people use the urban realm environment.
4.22 Face to face surveys with pedestrians will help to reveal how well received the new urban realm infrastructure is by users, if they feel there is a better built environment, if there is an improved sense of integration between town centre, resort core and Promenade and if it has changed people’s perceptions on how attractive the town is. It may also help to reveal those who previously may have used car or taxi to make the same journey thereby providing an indication of vehicle kilometres saved.
Survey Specification and Cost 4.23 Two types of different data collection are required:
• Pedestrian count on Talbot Road
- Pedestrian counts (volume only) using video equipment. The count would be for 24 hour periods across two Friday, Saturday and Monday periods in October, reflecting the data from 2015.
• Face to face pedestrian surveys
- Short survey (approximately 5 minutes) undertaken in the high season along Talbot Road from North Pier to Blackpool North Station over weekdays and at least one weekend day to collect responses from 400 people about:
▪ The purpose of their journey
▪ Where they are coming from and heading to
▪ Why they have chosen to walk rather than use tram
▪ How they made the journey before scheme opening
▪ How the urban realm has changed the attractiveness of the town centre
▪ How the urban realm has changed the integration of areas within the town
4.24 The findings from the pedestrian count would be presented in the one year after opening report and the findings from the face to face pedestrian surveys would be presented within the five years after opening report.
4.25 These surveys are planned to occur in these years because it will spread the data collection beyond year one, to understand what user perceptions are over the longer-term. Also, it will take time for pedestrians to appreciate the changes in urban realm and therefore, a later survey would be more suitable.
4.26 The costs for the survey and reporting is shown below.

22
Table 14: Costs for Footfall Count
One Year After Opening Five Years After Opening
Total
An
alys
is
Pro
ject
Man
age
me
nt
Re
po
rtin
g
Dat
a
Co
llect
ion
An
alys
is
Pro
ject
Man
age
me
nt
Re
po
rtin
g
Dat
a
Co
llect
ion
Time
(days)
0.5 0.5 0.5 1.5
Cost £357 £357 £357 £6,045 £7,117
Table 15: Costs for Pedestrian Face to Face Survey
One Year After Opening Five Years After Opening
Total
An
alys
is
Pro
ject
Man
age
me
nt
Re
po
rtin
g
Dat
a
Co
llect
ion
An
alys
is
Pro
ject
Man
age
me
nt
Re
po
rtin
g
Dat
a
Co
llect
ion
Time
(days)
2 0.5 1 3.5
Cost £1,568 £392 £784 £9,650 £12,394
Comparator Survey Information 4.27 Pedestrian footfalls were collected in October 2015 for two Friday, Saturday and
Monday periods along Talbot Road.
Table 16: 2015 Pedestrian Counts
23
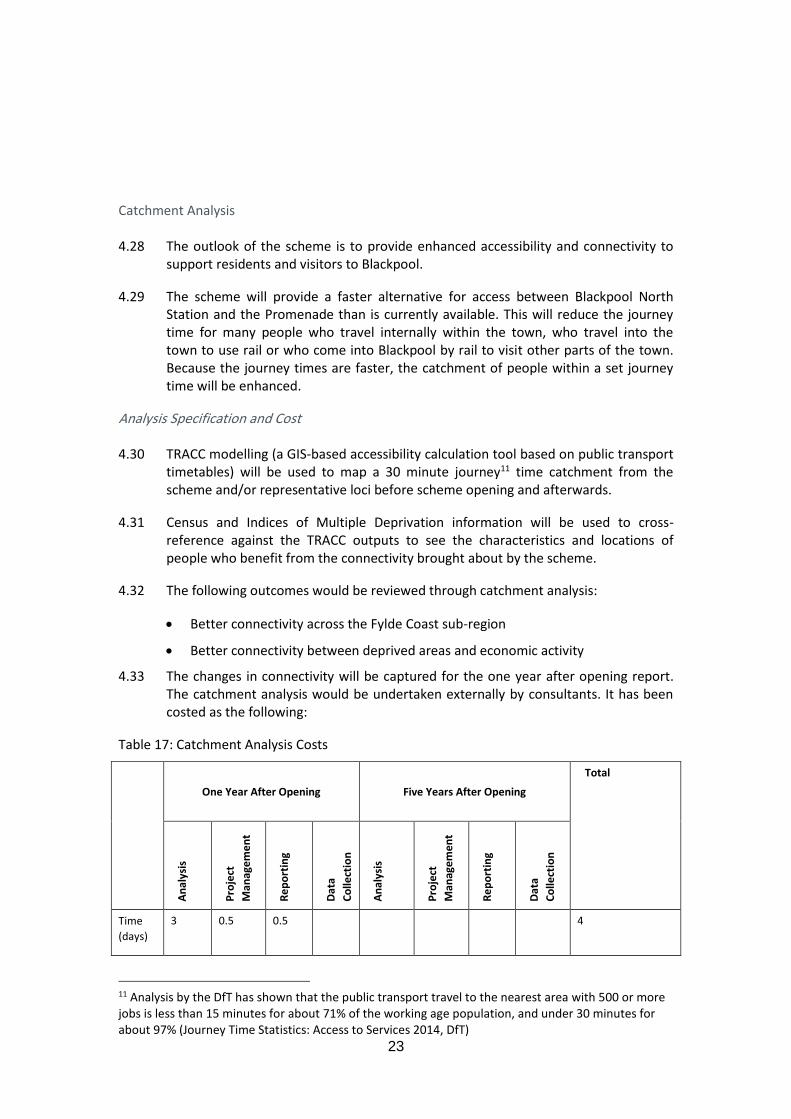
Catchment Analysis 4.28 The outlook of the scheme is to provide enhanced accessibility and connectivity to
support residents and visitors to Blackpool.
4.29 The scheme will provide a faster alternative for access between Blackpool North Station and the Promenade than is currently available. This will reduce the journey time for many people who travel internally within the town, who travel into the town to use rail or who come into Blackpool by rail to visit other parts of the town. Because the journey times are faster, the catchment of people within a set journey time will be enhanced.
Analysis Specification and Cost 4.30 TRACC modelling (a GIS-based accessibility calculation tool based on public transport
timetables) will be used to map a 30 minute journey11 time catchment from the scheme and/or representative loci before scheme opening and afterwards.
4.31 Census and Indices of Multiple Deprivation information will be used to cross-reference against the TRACC outputs to see the characteristics and locations of people who benefit from the connectivity brought about by the scheme.
4.32 The following outcomes would be reviewed through catchment analysis:
• Better connectivity across the Fylde Coast sub-region
• Better connectivity between deprived areas and economic activity
4.33 The changes in connectivity will be captured for the one year after opening report. The catchment analysis would be undertaken externally by consultants. It has been costed as the following:
Table 17: Catchment Analysis Costs
One Year After Opening Five Years After Opening
Total
An
alys
is
Pro
ject
Man
age
me
nt
Re
po
rtin
g
Dat
a
Co
llect
ion
An
alys
is
Pro
ject
Man
age
me
nt
Re
po
rtin
g
Dat
a
Co
llect
ion
Time
(days)
3 0.5 0.5 4
11 Analysis by the DfT has shown that the public transport travel to the nearest area with 500 or more jobs is less than 15 minutes for about 71% of the working age population, and under 30 minutes for about 97% (Journey Time Statistics: Access to Services 2014, DfT)

24
Cost £1,429 £357 £357 £2,858
Comparator Survey Information 4.34 TRACC uses public timetable information. To understand what the catchment of the
scheme was before opening, the Blackpool tram timetable without the scheme would be run through the model. This could be undertaken at the same time as the analysis for the one year after opening report work. This has been accommodated for in the costs.
Highway Surveys 4.35 Highway surveys will be required to understand the non-user benefits of the scheme
and any change in highway journey times.
4.36 The LEP framework indicates that average AM and PM peak journey time on key routes would be required to understand the outcome of the scheme for non-users. The LEP requests this to be measured bi-annually; however, annually would be more than sufficient for the context of this scheme.
4.37 Beyond the tram extension itself, the scheme will require some new signalled junctions at the following locations:
• Promenade/Talbot Road junction
• Talbot Road/Dickson Road/Topping Street junction
• Talbot Road/Cookson Street junction
4.38 The junction alterations could have an impact on the journey times for highway trips and therefore journey time surveys are required to understand the changes in journey time along certain routes before and after scheme opening.
Survey Specification and Cost 4.39 The scheme has not been specified to deliver material highway journey time
improvements. It would therefore be proportionate to include one survey for the one year after opening report only.
4.40 The specification of the survey would be for journey times for an AM Peak (08:00-09:00) and PM Peak (16:45-17:45) taken from a moving vehicle from which journey times are timed and split times taken. The vehicle would need to cover certain points on the route affected in both directions. The approximate coverage of the route would be:
• Along Talbot Road between Sainsburys Petrol Station and North Pier
• Promenade/Talbot Road junction north to Pleasant Street
• Promenade/Talbot Road junction south to Pleasure Beach
• Pleasant Street to Pleasure Beach

25
Table 18: Highway Survey Costs
One Year After Opening Five Years After Opening
Total
An
alys
is
Pro
ject
Man
age
me
nt
Re
po
rtin
g
Dat
a
Co
llect
ion
An
alys
is
Pro
ject
Man
age
me
nt
Re
po
rtin
g
Dat
a
Co
llect
ion
Time
(days)
1 0.5 0.5 2
Cost £714 £357 £357 £6,045 £5,276
Comparator Survey Information 4.41 A baseline survey would be conducted before the scheme opens to provide
comparator values. This is included in the Baseline Report costs in Chapter 1.
Business Surveys 4.42 Telephone interviews would be undertaken to obtain insights from local business
and developers about the effect of the scheme on the perceived attractiveness of the town, views on integration of the town centre, resort core and promenade and their views on the built environment.
Survey Specification and Cost 4.43 It is important to know the views of the local businesses and local developers who
the scheme may affect. A survey of around 15 businesses and developers in the area would be interviewed and their responses recorded and reviewed to understand their perceptions about how attractive the town centre is and what they think about the built environment.
4.44 Telephone surveys would be undertaken by external consultants for inclusion within the five years after opening report. The cost for this is shown below
Table 19: Costs for Telephone Surveys

26
One Year After Opening Five Years After Opening
Total
An
alys
is
Pro
ject
Man
age
me
nt
Re
po
rtin
g
Dat
a
Co
llect
ion
An
alys
is
Pro
ject
Man
age
me
nt
Re
po
rtin
g
Dat
a
Co
llect
ion
Time
(days)
5 0.5 1 6.5
Cost £3,920 £392 £784 £5,097
Financial Monitoring Data Collection 4.45 BTS will operate the new tram extension. BTS collect the following financial
information related to the operation of the tram and buses in Blackpool:
• Revenue
• Operating Costs
4.46 This information can be used to review the following outcomes of the scheme:
• Increase in public transport operating costs
- Through monitoring of operational costs for tram
• Tram revenue
- Through monitoring of tram revenue
• Commercially viable wider public transport network
- Through review of the operating costs against revenue on tram and bus to ensure that people have not moved away from bus for tram
Analysis Specification and Cost 4.47 BTS internally monitors revenue and record operating costs for both tram and bus.
The LEP framework indicates that this financial reporting should be collected quarterly. It would be appropriate to collect this information quarterly in the opening year and in the year before the five years opening report.
4.48 There will an internal resource cost associated with the analysis of these outcomes for the one and five years after opening reports and an external cost to report the information within the one and five years after opening reports. The cost is shown below.
Table 20: Costs for Reporting of Financial Data

27
One Year After Opening Five Years After Opening
Total
An
alys
is
Pro
ject
Man
age
me
nt
Re
po
rtin
g
Dat
a
Co
llect
ion
An
alys
is
Pro
ject
Man
age
me
nt
Re
po
rtin
g
Dat
a
Co
llect
ion
Time 0.5 0.5 0.5 0.5 2
Cost £357 £357 £392 £392 £1,498
Outcomes Required for all Schemes by LEP M&E Framework 4.49 The LEP provides a number of core metrics to be collected for all projects and
programmes as part of the monitoring process. For outcomes, they specify the following must be reviewed:
• Jobs connected to the intervention
- Permanent paid full time equivalent jobs that are directly connected to the intervention, measured by FTE at the predetermined “impact sites”.
• Commercial Floorspace
- For both direct employment sites and “impact” sites, the area and class of commercial floorspace completed.
• Housing unit starts and housing units completed
- For both direct employment sites and “impact” sites, the number of housing units started/completed.
4.50 The Blackpool and Fleetwood Tramway Extension to Blackpool North Station will not directly contribute to these outcomes and therefore it would not be proportionate to monitor them.
Unanticipated Outcomes 4.51 The scheme may produce some unanticipated outcomes. 2.5% has been added to
the total M&E costs to cover the capturing and consideration of any such outcomes.

28

29
Table 21: Summary of Monitoring Methodology for Outputs
Logic Map Description LEP Metric Description Monitoring Approach Data Collection Frequency Period of Data Collection Inclusion in One Year
After Opening Report
Inclusion in Five
Years After Opening
Report
Immediate Outcomes
Improved public transport integration Face to face tram survey Once for 1 year after opening. After Opening ✓
Enhanced connectivity to local tourist attractions Face to face tram survey Once for 1 year after opening. After Opening ✓
Better connectivity across the Fylde Coast sub-
region
TRACC analysis Once for 1 year after opening After Opening ✓
Better connectivity between deprived areas and
economic activity
TRACC analysis Once for 1 year after opening After Opening ✓
Increase in public transport operating costs Through BTS captured information Quarterly After Opening ✓ ✓
Better built environment Pedestrian survey Once for 5 years after opening After Opening ✓
Business survey Once for 5 years after opening ✓
Enhanced perceptions of personal safety Face to face tram survey Once for 1 year after opening. After Opening ✓
Change in highway journey times Average AM and PM peak
journey time per mile on key
routes (journey time
measurement)
Highway survey Once for 1 year after opening. After Opening ✓
Changes to footfall along Talbot Road Pedestrian counts on
new/existing routes
Footfall survey Once for 1 year after opening. After Opening ✓
Reductions in carbon emissions Face to face tram survey
Pedestrian survey
Once for 1 year after opening (face to
face tram survey).
Once for 5 years after opening (face to
face pedestrian survey)
After Opening ✓ ✓
Tram revenue Through BTS captured information Quarterly for the 1 year after opening
and 5 years after opening reports
After Opening ✓ ✓
Unanticipated outcomes Unknown Once for 1 year after opening. Once for 5
years after opening
After Opening ✓ ✓
Mature Outcomes
Better integration of town centre, resort core and
promenade
Face to face tram survey
Pedestrian survey
Once for 1 year after opening (face to
face tram survey).
Once for 5 years after opening (face to
face pedestrian survey)
After Opening ✓ ✓
Business survey Once for 5 years after opening ✓
Increased attractiveness of town centre to
developers, tourists and local people
Face to face tram survey Once for 1 year after opening (face to
face tram survey).
After Opening ✓ ✓

30
Logic Map Description LEP Metric Description Monitoring Approach Data Collection Frequency Period of Data Collection Inclusion in One Year
After Opening Report
Inclusion in Five
Years After Opening
Report
Pedestrian survey Once for 5 years after opening (face to
face pedestrian survey)
Business survey Once for 5 years after opening ✓
Non-user benefits Average AM and PM peak
journey time per mile on key
routes (journey time
measurement)
Highway survey Once for 1 year after opening. After Opening ✓ ✓
User benefits Annual average daily and peak
hour passenger boardings
Passenger counts
Biannually for the 1 year after opening
report and Biannually for the year before
the 5 years after opening reports
After Opening ✓ ✓
Bus/light rail travel time in
peak period
On board tram timing In high and low season for the year
before the 1 year after opening report
and in high and low season before the
five years after opening report
After Opening ✓ ✓
Additional public transport use/mode shift from
highway
Face to face tram survey
Pedestrian survey
Once for 1 year after opening (face to
face tram survey).
Once for 5 years after opening (face to
face pedestrian survey)
After Opening ✓ ✓
Commercially viable wider public transport
network
Through BTS captured information Quarterly for the year before the 1 year
after opening report and quarterly
before the five years after opening
report
After Opening ✓ ✓
Change in visitor spend Face to face tram survey Once for 1 year after opening. After Opening ✓
Unanticipated outcomes Unknown Once for 1 year after opening. Once for 5
years after opening
After Opening ✓ ✓

31
5. Impacts
Introduction 5.1 Impacts are longer-term outcomes of the scheme. They are not anticipated
to be directly measurable within the five years after opening or in some cases, measurable at all. Often, however, they can be inferred from results of the immediate and mature outcomes.
5.2 The impacts in the Logic Map have been aligned to the objectives of the scheme, shown in the first chapter of this report.
Table 22: Impacts
Scheme
Objective
Logic Map Description LEP Metric Description
1 Increased catchment of jobs and services available to local
people
Increased productivity
2 Strengthened market position of Blackpool
Increased attractiveness of redevelopment sites
3 Overall transport Green House Gases (GHG)
4 Enhanced quality of life through: improved air quality,
improved road safety, positive perception of personal
safety
Average annual CO2 emissions
Accident rate
Casualty rate
Nitrogen oxide and particulate
emissions
5 Improved access to employment, leisure, healthcare and
educational opportunities
6 Commercially viable mode and wider PT network
Value for money (monetised and non-monetised impacts)
Methodology for M&E
Objective 1 Impacts 5.3 The objective 1 impacts are
• Increased catchment of jobs and services available to local people
• Increased productivity
5.4 The TRACC analysis described in the previous chapter will indicate changes in the catchments of jobs and services available to local people of different socio-economic characteristics.

32
5.5 Productivity is not something that can easily be directly measured as it is based on a number of factors. However, if a larger catchment of people can reach more or higher skilled employment opportunities and businesses therefore have a greater labour pool because the scheme has made travel by public transport faster or more integrated, then it can be inferred that productivity is improved.
5.6 Commentary could be provided on these impacts following the catchment analysis required for the five years after opening report. The cost for this work is shown below.
Table 23: Costs for Reporting on Objective 1 Impacts
One Year After Opening Five Years After Opening
Total
An
alys
is
Pro
ject
Man
age
me
nt
Re
po
rtin
g
Dat
a
Co
llect
ion
An
alys
is
Pro
ject
Man
age
me
nt
Re
po
rtin
g
Dat
a
Co
llect
ion
Time 0.5 0.5
Cost £392 £392
Objective 2 Impacts 5.7 The objective 2 impacts are
• Strengthened market position of Blackpool
• Increased attractiveness of redevelopment sites
5.8 This is not an anticipated outcome for the scheme but could happen indirectly because of the presence of the scheme. Should there be redevelopment in Blackpool town centre or resort core, interviews with developers and local businesses should help to reveal the reason for this, specifically if the scheme helped to ground their investment decisions.
5.9 Commentary could be provided in the five years after opening report should this impact materialise.
Objective 3 Impacts and Objective 4 Impacts 5.10 The objective 3 impact is:
• Overall transport GHG
5.11 The objectives 4 impacts are:
• Enhanced quality of life through: improved air quality, improved road safety, positive perception of personal safety
5.12 Aligned to the impacts under objective 4 are the following LEP metrics:
• Average annual CO2 emissions

33
• Accident rate
• Casualty rate
• Nitrogen oxide and particulate emissions
5.13 Through the pedestrian and on tram face to face surveys it will be possible to calculate the vehicle kilometres saved as a result of people using the scheme. From this and the MEC approach as specified by WebTAG it is possible to ascertain changes in air quality and carbon emissions. The cost for this external analysis has been accounted for within the outcomes chapter under the section for pedestrian surveys.
5.14 In addition, because the scheme is located in an Air Quality Management Area (AQMA), standard monitoring of nitrogen oxide and particulates should be in place by the local authority. These measures can be used to show changes in local air quality. However, it would not be possible to directly attribute changes in air quality with the tram scheme.
5.15 Accidents and casualty information would be available to the Promoters through the STATS19 dataset. This is available annually and would illustrate changes in accidents within the vicinity of the scheme. However, it would not be possible to directly attribute changes in air quality with the tram scheme.
5.16 There would be an internal resource cost to analyse information associated with nitrogen oxide, particulates and STATS19 but an external cost associated with the reporting for the five years after opening report as shown below.
Table 24: Costs for Reporting on Objectives 3 and 4 Impacts
One Year After Opening Five Years After Opening
Total
An
alys
is
Pro
ject
Man
age
me
nt
Re
po
rtin
g
Dat
a
Co
llect
ion
An
alys
is
Pro
ject
Man
age
me
nt
Re
po
rtin
g
Dat
a
Co
llect
ion
Time 0.5 0.5
Cost £392 £392
Objective 5 5.17 The objective 5 impact is:
• Improved access to employment, leisure, healthcare and educational opportunities

34
5.18 This could be considered as part of the catchment analysis seeing if the larger catchment as a result of the scheme included key amenities.
5.19 There would be no additional external costs associated with this as it would be added to the TRACC work analysis elsewhere. There would only be an external cost to provide text for the five years after opening report as shown below.
Table 25: Costs for Reporting on Objective 5 Impacts
One Year After Opening Five Years After Opening
Total
An
alys
is
Pro
ject
Man
age
me
nt
Re
po
rtin
g
Dat
a
Co
llect
ion
An
alys
is
Pro
ject
Man
age
me
nt
Re
po
rtin
g
Dat
a
Co
llect
ion
Time 0.25 0.25
Cost £196 £196
Objective 6 5.20 The objective 6 impacts are:
• Commercially viable mode and wider public transport network
• Value for Money (monetised and non-monetised impacts)
5.21 The commercial viability of the trams and buses would already be reviewed as part of the work for the mature outcomes for the scheme. Data would be continually collected to analyse the commercial position of the trams and buses by BTS beyond the scope of the M&E reporting timeframes so could be reviewed at a later stage if required.
5.22 Value for Money (VfM) would be calculated through a re-run of the appraisal model used in the business case from the following information gathered over the course of the M&E timeframes:
• Scheme Costs
• Tram revenue
• Tram operating costs
• Tram run times
• Passenger numbers
• Highway journey times
• Changes in vehicle kilometres
5.23 An external consultant would be required to undertake this work. The projected cost for this work is shown below.

35
Table 26: Costs for Reporting on Objective 6 Impacts
One Year After Opening Five Years After Opening
Total
An
alys
is
Pro
ject
Man
age
me
nt
Re
po
rtin
g
Dat
a
Co
llect
ion
An
alys
is
Pro
ject
Man
age
me
nt
Re
po
rtin
g
Dat
a
Co
llect
ion
Time 3 1 1 5
Cost £2,352 £784 £784 £3,920
Unanticipated Impacts 5.24 The scheme may produce some unanticipated impacts. 2.5% has been
added to the total M&E costs to cover the capturing and consideration of any such outcomes.

Appendix A: Benefits Realisation Profile

ID Benefit Title Expected Level of Benefit Expected Level of Benefit (Source Data) Accountable Body Link to Logic Map Process for Measurement of Benefit Measurement Period Baseline ValueValue one year after
opening
Value five years after
opening
Costs and methods associated with analysis
of benefit
I1Development Resources / In-
Kind Resources Provided £1,286,000Cost Report Rev 07 September 2017 Promoter
Input Review of costs One Year After Opening (2020)
I2
Implementation Resources /
Expenditure and Funding
Breakdown £22,743,207
Cost Report Rev 07 September 2017 Promoter
Input Review of cost codes monthly One Year After Opening (2020)I3 Agreed Service Pattern Agreed pattern with BTS n/a Promoter Input Provide service agreement One Year After Opening (2020)
I4 Construction ContractContracts to complete the civils works package and utilities in place
n/a PromoterInput
Construction works aligns to the contract and approaches
of the Commercial Case One Year After Opening (2020)
OP1Traffic Impacts from
ConstructionAppropriate mitigation practices in place to reduce traffic impacts from construction
n/aContractor and
PromotersOutput
Quarterly qualitative assessment up to the opening of the
scheme One Year After Opening (2020)
OP2a
Approximately 550m of twin track
OJEU NoticeContractor and
PromotersOutput
OP2b
Overhead line equipment (OLE) with 650 V DC for the scheme
Business CaseContractor and
PromotersOutput
OP2c 1 new eastbound only stop at Talbot Square
Document Reference A14-4 Transport
Assessment Final Draft
Contractor and
Promoters Output
OP2d
1 terminus stop with two side platforms at Blackpool North Station
New Tramway Extension North Pier to
North Station online document for TWAO
Contractor and
PromotersOutput
OP2e Urban realm improvements between the tramway and Counting House public house
Document Reference A14-4 Transport
Assessment Final Draft
Contractor and
Promoters Output
OP3Tram Service Changes / Type of
Service Improvement DeliveredBusiness Case Promoter
Output
Tracked through the high, shoulder and winter seasons or
can be reviewed through seasonal review of published
timetables
One Year After Opening (2020)
and Five Years After Opening
(2023)
OP4a1 new signalled junction at the Promenade / Talbot Road junction with pedestrian facilities and Advanced Cycle Stop Lines
(ACSL)
New Tramway Extension North Pier to
North Station online document for TWAO
Contractor and
PromotersOutput
OP4b
1 new signalled junction at the Talbot Road / Dickson Road / Topping Street junction with pedestrian facilities and new
eastbound cycle lane
Document Reference A14-4 Transport
Assessment Final Draft
Contractor and
Promoters
Output
OP4c
1 new signalled junction at Talbot Road / Cookson Street junction with pedestrian facilities and ACSL
New Tramway Extension North Pier to
North Station online document for TWAO
Contractor and
PromotersOutput
IO1Improved public transport
integration Unknown n/a Promoter Immediate Outcome
On-tram and at stop face to face survey One Year After Opening (2020)
IO2Enhanced connectivity to local
tourist attractions Unknown n/a Promoter Immediate Outcome
On-tram and at stop face to face survey One Year After Opening (2020)
IO3Better connectivity across the
Fylde Coast sub-region Increased number of people within 30 minute catchment of scheme TRACC Analysis Promoter Immediate Outcome
TRACC analysis
One Year After Opening (2020)
and Five Years After Opening
(2023)
IO4
Better connectivity between
deprived areas and economic
activity
Increased number of people within deprived areas within 30 minute catchment of scheme TRACC Analysis Promoter Immediate Outcome
TRACC analysis and overlay census and IMD information
One Year After Opening (2020)
and Five Years After Opening
(2023)
IO5Increase in public transport
operating costs £20.5m from economic appraisal Promoter Immediate Outcome Internal monitoring of operating costs by BTS to be
collected quarterly
One Year After Opening (2020)
and Five Years After Opening
(2023)
IO6 Better built environment Unknown n/a Promoter Immediate OutcomeTelephone business surveys and pedestrian face to face
surveys Five Years After Opening (2023)
IO7Enhanced perceptions of
personal safetyUnknown n/a Promoter Immediate Outcome
On-tram and at stop face to face survey One Year After Opening (2020)
IO8
Change in highway journey
times / Average AM and PM
peak journey time per mile on
key routes
Unknown n/a Promoter Immediate OutcomeHighway journey time surveys in AM and PM peak along
Promenade and Talbot Road. Collected once for each
report after opening. One Year After Opening (2020)
IO9Changes to footfall along
Talbot Road2015 pedestrian counts Promoter Immediate Outcome
Pedestrian count on Talbot Road One Year After Opening (2020)
IO10 Reductions in carbon emissions £0.1m from economic appraisal/economic case Promoter Immediate Outcome On-tram and at stop face to face survey to reveal
information to complete Marginal External Costs analysis One Year After Opening (2020)
IO11 Tram revenue £27.2m from economic appraisal/economic case Promoter Immediate Outcome Internal monitoring of revenue by BTS to be collected
quarterly
One Year After Opening (2020)
and Five Years After Opening
(2023)
MO1
Better integration of town
centre, resort core and
promenade
Unknown n/a Promoter Mature OutcomeOn-tram and at stop face to face survey and business
telephone surveys
One Year After Opening (2020)
for the tram surveys. Only Five
Years After Opening (2023) for
business surveys
MO2
Increased attractiveness of
town centre to developers,
tourists and local people
Unknown n/a Promoter Mature OutcomeOn-tram and at stop face to face survey and business
telephone surveys
One Year After Opening (2020)
for the tram surveys. Only Five
Years After Opening (2023) for
business surveys
MO3 Non-user benefits £1.1m for commuters, £0.9m for business users, £2.0m for other users from economic appraisal/economic case Promoter Mature OutcomeHighway journey time surveys in AM and PM peak along
Promenade and Talbot Road. One Year After Opening (2020)
Monitoring to ensure that what has been agreed in the
contracts is delivered One Year After Opening (2020)
Alterations to Highway
Network / Improvements in
Active Modes Facilities / Type
of Infrastructure Delivered
Tracking the BenefitsLink to Monitoring and Evaluation Plan
Tram Infrastructure Provision /
Alterations to Urban Realm /
Type of Infrastructure
Delivered
Monitoring to ensure that what has been agreed in the
contracts is delivered One Year After Opening (2020)

ID Benefit Title Expected Level of Benefit Expected Level of Benefit (Source Data) Accountable Body Link to Logic Map Process for Measurement of Benefit Measurement Period Baseline ValueValue one year after
opening
Value five years after
opening
Costs and methods associated with analysis
of benefit
Tracking the BenefitsLink to Monitoring and Evaluation Plan
MO4 User benefits
Bispham to Blackpool North Station: 14 minutes in either direction
Pleasure Beach to Blackpool North Station: 15 minutes in either direction
Boardings: Final Model, run 48 21-09-17
Run times: Final Model inputsMature Outcome
Annual Average Daily and peak hour passenger boardings
and light rail travel times in peak periods
One Year After Opening (2020)
and Five Years After Opening
(2023)
MO5Additional public transport
use/mode shift from highway £1.1m for commuters, £0.9m for business users, £2.0m for other users from economic appraisal/economic case Promoter Mature Outcome On-tram and at stop face to face survey and pedestrian
surveys
One Year After Opening (2020)
and Five Years After Opening
(2023)
MO6Commercially viable wider
public transport networkUnknown n/a Promoter Mature Outcome Internal monitoring of revenue and operational costs by
BTS to be collected quarterly for bus and tram
One Year After Opening (2020)
and Five Years After Opening
(2023)
MO7 Change in visitor spend Unknown n/a Promoter Mature OutcomeOn-tram and at stop face to face survey One Year After Opening (2020) a
Objective 1 Impact 1
Increased catchment of jobs
and services available to local
people
Unknown n/a Promoter Impact
As a result of TRACC analysis elsewhere Five Years After Opening (2023)
Objective 1 Impact 2Increased productivity Unknown n/a Promoter ImpactAs a result of TRACC analysis elsewhere Five Years After Opening (2023)
Objective 2 Impact 1Strengthened market position
of BlackpoolUnknown n/a Promoter Impact
May arise from telephone surveys with businesses Five Years After Opening (2023)
Objective 2 Impact 2Increased attractiveness of
redevelopment sitesUnknown n/a Promoter Impact
May arise from telephone surveys with businesses Five Years After Opening (2023)
Objective 3 Impact 1Overall transport GHG Unknown n/a Promoter Impact Pedestrian and on-tram surveys through the MEC
analysis. Could also use monitoring data from the AQMA
Five Years After Opening (2023)
using data Objective 4 Impact 1Average annual CO2 emissions Unknown n/a Promoter Impact Pedestrian and on-tram surveys through the MEC Five Years After Opening (2023)
Objective 4 Impact 2Accident rate Unknown n/a Promoter ImpactSTATS19 data analysis Five Years After Opening (2023)
Objective 4 Impact 3Casualty rate Unknown n/a Promoter ImpactSTATS19 data analysis Five Years After Opening (2023)
Objective 4 Impact 4Nitrogen oxide and particulate
emissionsUnknown n/a Promoter Impact Pedestrian and on-tram surveys through the MEC
analysis. Could also use monitoring data from the AQMA Five Years After Opening (2023)
Objective 5 Impact 1
Improved access to
employment, leisure,
healthcare and educational
opportunities
Unknown n/a Promoter Impact
As a result of TRACC analysis elsewhere Five Years After Opening (2023)
Objective 6 Impact 1Commercially viable mode and
wider PT networkUnknown n/a Promoter Impact Internal monitoring of revenue and operational costs by
BTS to be collected quarterly for bus and tram
One Year After Opening (2020)
and Five Years After Opening
(2023)
Objective 6 Impact 2Value for money (monetised
and non-monetised impacts)Unknown n/a Promoter Impact
Re-run appraisal model with outturn information Five Years After Opening (2023)

Appendix B: Budget for Monitoring and Evaluation Plan
0
Cost for
Analysis
Cost for
Project
Manageme
nt
Cost for
Reporting
Data
Collection
Costs
Cost for
Analysis
Cost for
Project
Management
Cost for
Reporting
Data
Collection
Costs
Cost for
Analysis
Cost for
Project
Management
Cost for
Reporting
Data
Collection
Costs
Total
Baseline Report Baseline Report 1,300£ 650£ 1,300£ 3,500£ -£ -£ -£ -£ -£ -£ -£ -£ 6,750£
Inputs Total Inputs -£ -£ -£ -£ 714£ 357£ 714£ -£ -£ -£ -£ -£ 1,786£
Outputs Total Outputs -£ -£ -£ -£ -£ 357£ 714£ -£ -£ 392£ 392£ -£ 1,856£
Tram F2F -£ -£ -£ -£ 714£ 357£ 357£ 17,036£ 392£ -£ 392£ -£ 19,249£
Boardings and tram times -£ -£ -£ -£ -£ 357£ 357£ -£ -£ 392£ 392£ -£ 1,498£
Ped Count -£ -£ -£ -£ 357£ 357£ 357£ 6,045£ -£ -£ -£ -£ 7,117£
Ped F2F -£ -£ -£ -£ -£ -£ -£ -£ 1,568£ 392£ 784£ 9,650£ 12,394£
Catchment Analysis -£ -£ -£ -£ 2,143£ 357£ 357£ -£ -£ -£ -£ -£ 2,858£
Highway Survey -£ -£ -£ -£ 714£ 357£ 357£ 3,847£ -£ -£ -£ -£ 5,276£
Business Surveys -£ -£ -£ -£ -£ -£ -£ -£ 3,920£ 392£ 784£ -£ 5,097£
Financial Data -£ -£ -£ -£ 357£ -£ 357£ -£ 392£ -£ 392£ -£ 1,498£
Obj 1 -£ -£ -£ -£ -£ -£ -£ -£ -£ -£ 392£ -£ 392£
Obj 2 -£ -£ -£ -£ -£ -£ -£ -£ -£ -£ -£ -£ -£
Obj 3 -£ -£ -£ -£ -£ -£ -£ -£ -£ -£ 196£ -£ 196£
Obj 4 -£ -£ -£ -£ -£ -£ -£ -£ -£ -£ 196£ -£ 196£
Obj 5 -£ -£ -£ -£ -£ -£ -£ -£ -£ -£ 196£ -£ 196£
Obj 6 -£ -£ -£ -£ -£ -£ -£ -£ 2,352£ 784£ 784£ -£ 3,920£
Sub-Total 70,279£
Unanticipated Outcomes 1.025 72,036.16£
Unanticipated Impacts 1.025 73,837.07£
Total 73,837.07£
Five Years After OpeningOne Year After Opening
Impacts
Baseline Report
Outcomes

0

0