bls emplypayr 011946
TRANSCRIPT
U. S» Department of Labor Detailed Report
March. 12, 1946 Bureau of Labor Statistics Schloss - 35LEmployment and Occupational Outlook Branch
Division of Employment Statistics
EHPLOYI25J5T ATP’ i’JiY ROLLS
Detailed Report
January 1946
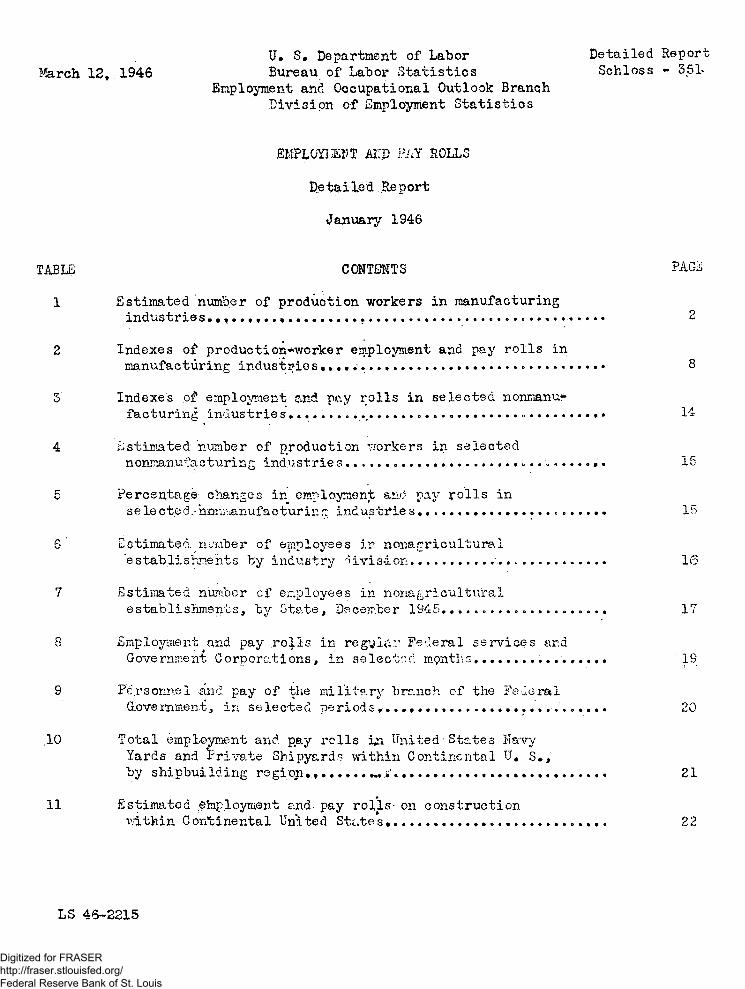
TABLE CONTENTS PAGiC
1 Estimated number of production workers in manufacturingindustries. .. . . . . . . . . . . . . . . . . . ............................................ ......... 2
2 Indexes of production*worker employment and pay rolls in
manufacturing industries . . . . . . .................................................. . 8
3 Indexes of employment and pay rolls in selected nonmanu*
facturing industries........................... ............................................. 14
4 iistimated number of production ?rorkers in selected
nonmanufacturing Industrie ................................................ .......... »• 15
5 Percentage changes in employment and pay rolls in
selected. nQniiianxifacturir.,7, industries......................... .................. 15
6 Estimated xiu/iber of employees in nonarrricultural
establishments by industry division................... ........................ 16
7 Estimated number cf employees in nonagricultural
establishments, by State, December 1945....................................... 17
8 Employment and pay rolls in regvl&r Federal services and
Government Corporations, in selected mpnths.. . . . . . . . . . . . . . . . 19
9 Personnel and pay of the military branch of the Federal
.Government, in selected p e r io d s .... , ............. 20
.10 Total employment and p_ay rolls in United-States Navy'
Yards and rrivate Shipyard,1? within Continental U* S .,
by shipbuilding region.,.......... ...................... ........................... .. 21
11 Estimated efo.p.1 oyment and- pay rolls- on construction
xvithin Continental United States*......................... .............. . 22
LS 46-2215
Digitized for FRASER http://fraser.stlouisfed.org/ Federal Reserve Bank of St. Louis
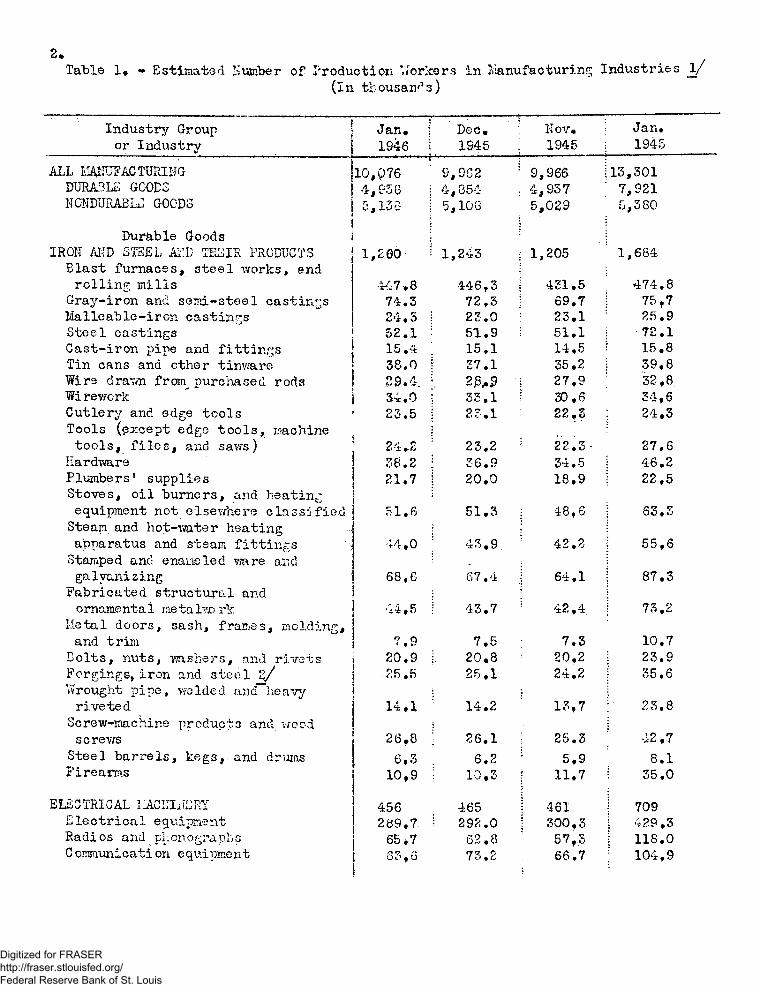
Table 1, - Estimated dumber o? Production ’Vorkors in Manufacturing Industries _l/
(in thousands)
Industry Group j
or Industry jJan, \
1946 i
Dec,
1945
Kov.
1945
Jan.
1945
ALL MA1IUFAC TURING |10,p ?6 S,SS2 5 9,966 i13,301DURABLE GOODS j 4,936 4,354 4,937 7,921HGNDURABLu GOODS j
1 5,13-3 5,108 5,029 5,3 80
1Durable Goods i
IROIJ AED STEEL AiTD TH3IR PRODUCTS ] 1,200 1,243 1,205 1,684
Blast furnaces, steel works, and jrolling mills •447,8 446,3 431.5 474.6
Gray-iron and semi-steel castings j 74.3 72.3 69.7 75,7
Malleable-iron castings | 24.5 i 23.0 23.1 25.9
Steel castings j 52.1 : 51.9 51.1 •72.1
Cast-iron pipe and fittings jj 15.4 15.1 14,5 ? 15.8
Tin cans and ether tinware j; 38.0 37.1 35.2 j 39.8
Wire dravm frorn purchased rods I 29.4. 2 & 9 i 27.9 32,8
Wirework ]| 3-r .0 33,1 30.6 ' 34,6Cutlery and edge tools ’; 23.5 23.1 22.3 24,3
Tools (except edge tools, machine (|tools, files, and saws) 1 24.2 23.2 22.3- 27.6
Hardwire 38.2 36.9 34.5 46.2
Plumbers’ supplies 21.7 20.0 18,9 22,5Stoves, oil burners, and heating
equipment not elsewhere classified 51.6 51.3 00 <y> 63.3
Steam and hot-water heating
apparatus and steam fittings ■ *4 . 0 43.9. 42.2 55,6
Stamped and enameled ware and .galvanizing 68,6 67.4 64.1 87.3
Fabricated structural andornamental laetalvjo rlc ■14,5 43.7 42,4. 73.2
Metal doors, sash, frames, melding,and trim 7.9 7.5 7.3 10.7
Bolts, nuts, v/ashers, and rivets jj 20.9 20.8 20.2 23.9
Forgings, iron and steel z/ i| 25.5 25.1 24.2 35.6
Wrought pipe, welded aiid”heavy ii1riveted 14.1 14.2 13,7 23.8
Screw-machine product3 and wood
sc rews 26.8 26.1 25.3 I 42,7
Steel barrels, kegs, and drums 6,3 6.2 5,9 8.1Firearms 10,9 10,3 11.7 35.0
ELECTRICAL l ACIIIiiCRI 456 465 461 709Electrical equipment 289.7 1 292.0 300,3 429.3Radios and phonographs ; 65*7 62.8 57.3 118.0Communication equipment S3,6 73.2 66.7 104.9
Digitized for FRASER http://fraser.stlouisfed.org/ Federal Reserve Bank of St. Louis
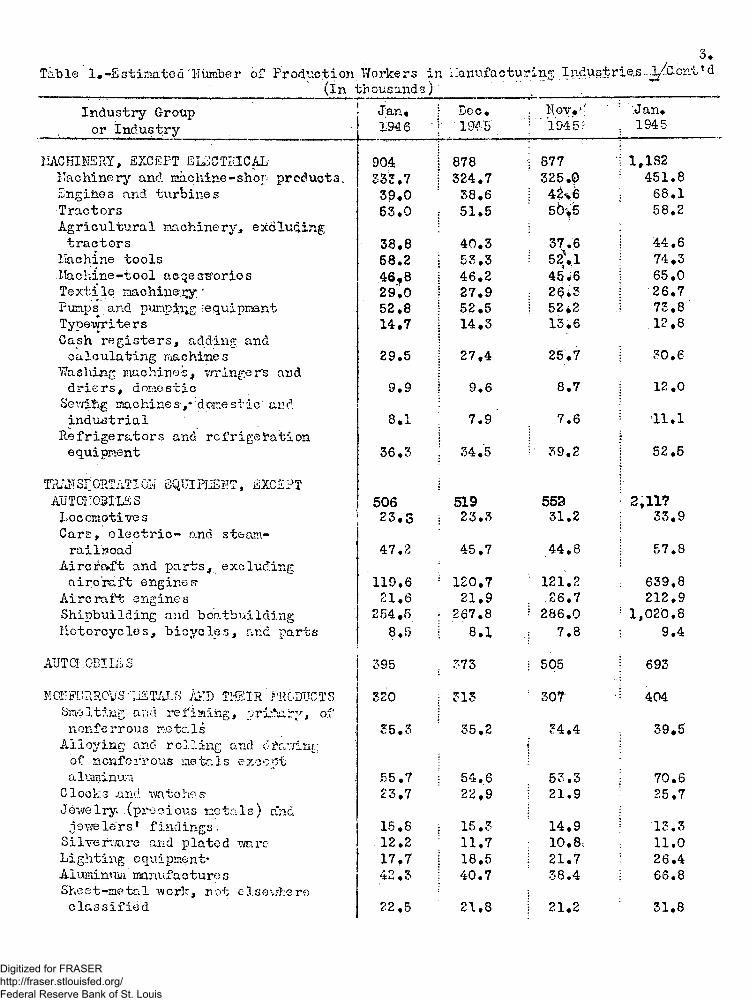
Table 1 ,-Estimatedlnunber of Production Workers(in thousands
in ilanufacturin"; Industries-l/C-cnt’d
) ....................
3.
Industry Group
or industry
Jan*IS46 ’:
Dec. 1 1945
Nov.-'
" 1945?
! Jan.; 1945
MACHINERY, -EXCEPT ELECTRICAL-
;
904 1 878 877 i 1,132
Hachinery and machine-shop products. 533.7 ; 324.7 325.0 451.8
Engines and turbines 39.0 38.6 ; 42v6 68.1
Tractors 53.0 : 51.5 5b\S 58.2
Agricultural machinery, excluding tractors
1
38.8
i
40.3!
37.6 I 44.6
Hachine tools 58.2 ; 53.3 52^.1 74,3
Machine-tool acqe.srrorios 46., 8 ! 46.2 45.6 i 65.0
Texti le machine';^.' 29,0 ! 27.9 26.3 26.7
Pumps and pumping. ^equipment 52.8 1 52.5 52*2 .! 73.8
Typewriters 14.7 | 14.3 13.6 12.8
Cash registers, adding and calculating machines
:
29.5
1
! 27*4 25.7 j 30.6
Washing machines, wringer's and driers, doraestio 9.9
;:1 9,6 8,7 12.0
Sevang machines,* doir.estic' and
industrial
:
8*1
1
7.9 7.6
•
11.1
Refrigerators and refrigeration equipment
!
36.3i. 34.5 39,2
i
j 52.5:
TRAN3PORTATIOIiT SQTJIPKBHT, EXCEPT AUTCEGSlIiSS 506
!
519 553
:
; 2,117Locomotives 23 .3 23.3 31,2 33.9
Cars, electric- and stean\- railuoad 47.2 45.7 44.8
!
57.8
Airc^oft and parts, excluding aircr-aft engine,*? 119,6 1 120.7 ; 121.2
:
639,8
Aircraft enginea 21.6 21.9 . 26.7 212,9
Shipbuilding and boatbuilding 254.5 267.8 f 286.0 ; 1,020,8
Motorcycles, bicycles, raid part a 8.5 8.1 | 7 .8 • 9,4
AUTGr'.QBILiiiS 395 :. 373i ; 505 693:
HCl:FO?,ROliS ISTALS AZD THEIR PRODUCTS 320 r 315 307 -1 404Smelting and refining, primary, o.f
nonferrous metals
!
35.3
:
35,2 34.4 39.5Alloying and rolling and otcr:fin[;
of nonferrous mete.Is exco^t a luminui 55.7
i::
54.6
i
53.3 70,6Clocks jand vmtohes- 23.7 22,9 21.9 25,7
Jewelry. (precious netals-) a*nd 2ewe le r s ’ findings . 15.8 15.3 14,9 ; 13.3
Silverware and plated -ware 12.2 11,7 10 .8: 11.0Lighting equipment* 17,7 ! 18.5 ! 21.7 26.4Aluminum raaauifactures 42 .3 40.7 38.4 66.8
Shest-metal work, not elsavfcero classified 22,5 21.8 : 21.2 31.8
Digitized for FRASER http://fraser.stlouisfed.org/ Federal Reserve Bank of St. Louis
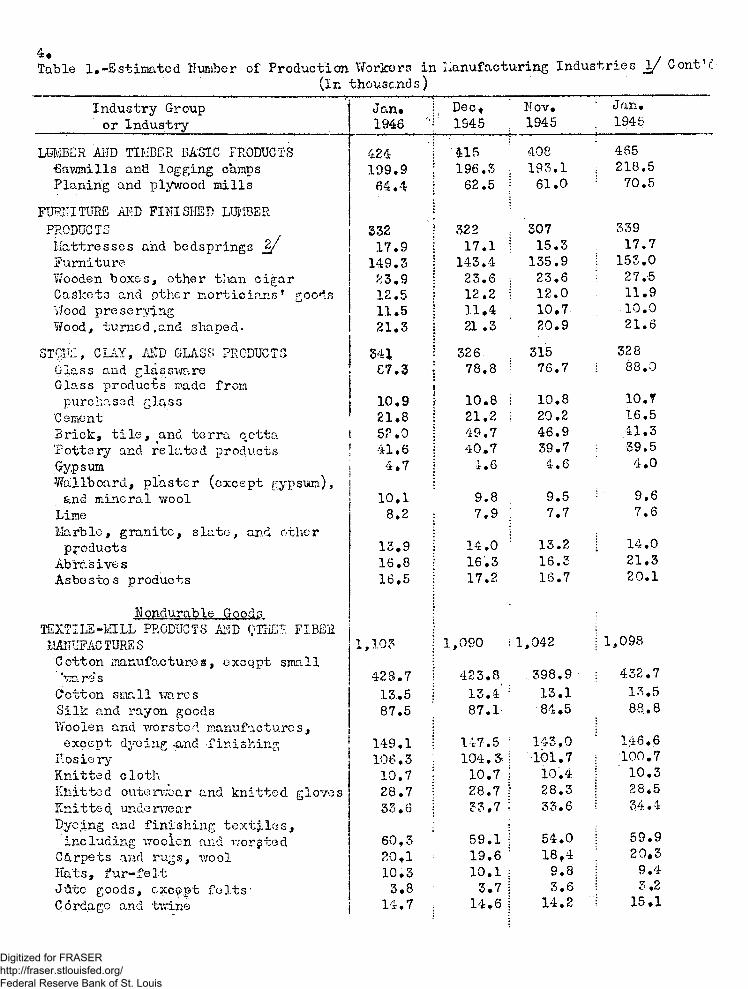
4 .Table 1 ,-Estimated Humber of Production Workers in llanufacturing Industries \ f Cont'i
(in thousands)
Industry Group
or Industry<jan.1946
Deo*
1945
IT ov. 1945
Jan.
1945
UMBER AHD TIflBGR BASIC PRODUCTS
•Sawmills and logging camps Planing and plywood mills
FURNITURE AHD FINISHED LUMBER
PRODUCTS
Mattresses and bedsprings % / Furniture
'wooden boxes, other than cigar Caskets and pther morticians’ goo4s VIood preserving
Yfood, turned,and shaped.
STOK, CLAY, M D GLASS PRODUCTS
Glass and glassware Glass produces made from
purchased glass
‘Cement
Brick, tile, and terra cctta
‘Pottery and related products
GypsumWallboard, plaster (except gypsum),
and mineral wool
Lime
Marble, granite, slate, and other products
Abrasives Asbestos products
Kondurable Goods
TEXT1LE-MILL PRODUCTS Ai'ID OTHER FIBER I5ANUFACTURES
Cotton manufactures, excqpt small
’’tare’s
(?otton small wares
Silk and rayon goods
Woolen ana worsted manufactures, except dyeing -and finishing
F.osie ry
Knitted cloth
Khitted outervpar and knitted gloves Kni tto d. unde rwe a r
Dyeing and finishing textiles,
including woolen and worsted CS.rpets and rugs, wool
Hats, fur-felt .
J&tc goods, except felts- Cordage and twine
424 415 408 465
199.9 196.3 193.1 218.5
64.4 62,5 61.0 70.5
332 322 307 339
17.9 17.1 15.3 17.7
149.3 143.4 135.9 153.0
23.9 23.6 23.6 27.5
12.5 12.2 12,0 11.9
11.5 11,4 10.7- 10.0
21.3 21 ,3 20.9 21.6
341 326 315 328
£7.3 78,8 76,7 88.0
10.9 10.8 10,8 10, T■21.8 21.2 20.2 16.5
5P.0 49.7 46.9 41.3
41.6 40.7 39.7 39.5
4 .7 i.6 4.6 4.0
10.1 9.8 9.5 9.6
8.2 7,9 7.7 7.6
13.9 14.0 13.2 14.0
16.8 16.3 16.3 21.3
16.5 17.2 16.7 20.1
,10? 1,090 1,042 1,098
428.7 423.8 398.9 432.7
13.5 13.4 ; 13.1 13.5
87.5 87.1- 84.5 88.8
149.1 147.5 143.0 146.6
106,3 104 . 3- •101.7 100.7
10.7 | 10.7 10.4 ' 10.3
28.7 ! 28,7 28.3 28.5
33.6 j 33,7 33.6 34.4
60,3 59.1 54.0 59.9
20,1 = 19.6 18,4 20,3
10.3 10.1 9.8 9.4
3.8 3.7 3.6 3.2
14.7 14.6 14.2 1 15.1
Digitized for FRASER http://fraser.stlouisfed.org/ Federal Reserve Bank of St. Louis
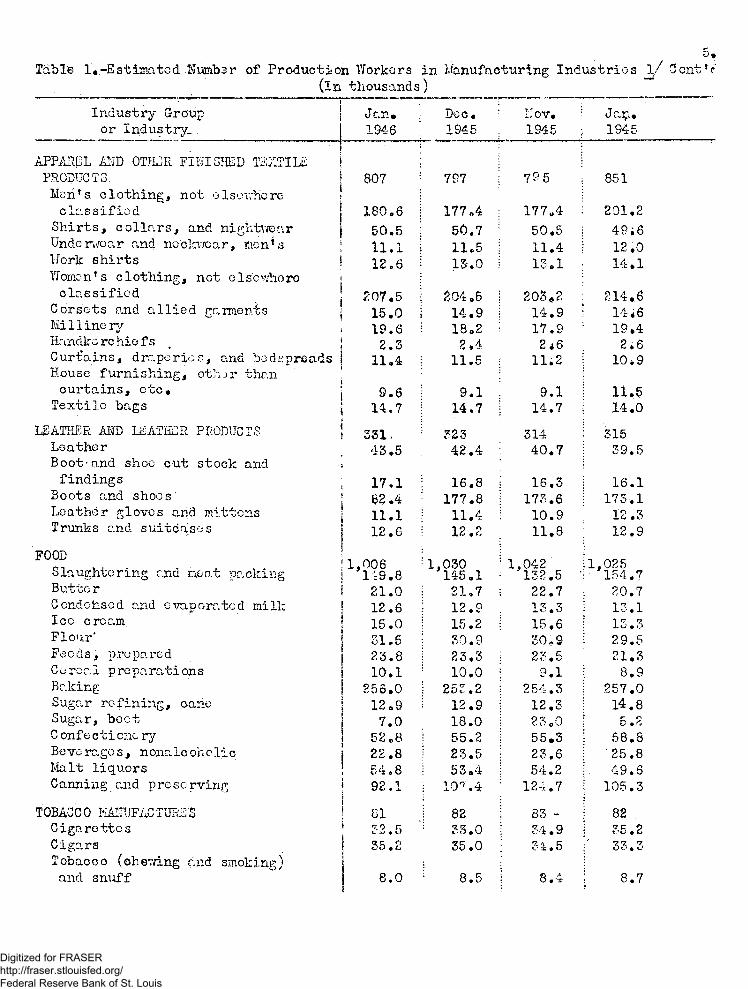
Table 1 .-Estimated Kurabsr of Production Workers in Mmufdcturing Industries 1/ Cent’ e
(in thousands)
/ 5 *
Industry Group
or Industry.Jan.
1946
Deo.1945
Uov.
1945
Jr.9 ,
1945
APPAREL A2JD OTHER FINISHED TEXTILE PRODUCTS. I 607 797 795 851
Men’ s clothing, not oIsev.'hcrc
classified j 180.6 177*4 177.4 201.2
Shirts, collars, and nightwear j 50.5 50.7 50.5 49;6Underwoar and neckwear, men’ s 11.1 11.5 11.4 12.0Work shirts ! 12.6 13.0 13.1 14.1Women1 s clothing, not elserdaoro
classifiedi 207.5 204.5 208*2 214.6
Corsets and allied garments 15.0 14.9 14.9 14*6Mil-line ry 19.6 i 18«2 17.9 19.4Handko re hie fs 2.3 2.4 2 <6 2.6Curtains, draperies, and bedspreads 11.4 11.5 11.2 10 *9House furnishing, ctlvjr than
curtains, etc* 9.6 9.1 9.1 11.5Textile bags { 14.7 14.7 14.7 14.0
LEATHER AND USATECR PRODUCTS. 331. 323 314 315Leather 43.5 42.4 : 40.7 39.5Boot'and shoe cut stock and ;
findingsl
17.1 : 16.8 16,3 16.1Boots and shoes’ !: 82.4 177.8 173.6 173.1Leather gloves arid mittens !| 11.1 11.4 10.9 12 .3Trunks and suitcases j
!| 12.61
12.2 11.8 12.9
FOOD i1
11,006 | 119.8
1,030 1,042 1,025Slaughtering and neat packing j 145.1 ; 132.5 • 154.7Butter |i 21.0 21.7 22.7 20.7G ondchsod and evaporated mill: 12.6 12.9 13.3 13.1Ice cream j 15.0 15.2 15.6 13.3Flour' 31.5 30.9 30*9 2.9.5Feeds, prepared 23.8 23.3 OVy t; 21.3Cereal preparations 10.1 10.0 9.1 8.9 'Baking 256.0 253.2 254.3 257.0Sugar refining, oane 12 o 9 12.9 12.3 14.8Sugar, beet 7.0 18.0 23.0 5.2C onfecti one ry 52.8 55.2 55.3 58.8Beverages, nonalcoholic 22.8 23.5 23.6 25.8Malt liquors . c 4 » 8 53.4 54.2 . 49.6Canning and preserving ! 92.1
!10,7.4 124.7 105.3
TOBACCO M6ITTJFACHIRE'S ! 81 82 83 - 82Cigarettes 1 32.5 33.0 34.9 35.2Cigars 35.2 35.0 34.5 33.3Tobacco (chewing and smoking) and snuff 8.0 ! 8.5 •
GO 8.7
Digitized for FRASER http://fraser.stlouisfed.org/ Federal Reserve Bank of St. Louis

6.Table 1 .-Estimated Number of Production Workers in Manufacturing Industries _l/Cont’d
(in thousands) _________
Industry Group or Industry
Jan.1946
Dec*
: 1945
11 ov*
1945Jan.1945
PAPER MiD ALLIED PRODUCTS 330
1 i ’ J ‘ T t-
1. 325 317 ,314Paper and pulp 156.6 1 153.1 148.2 147.3Paper goods, other . 44.4 44.2 43.2 4-1.8Envelopes 9.8 9.8 9.6 9.5PapCr bags 13.6 ! 13.4 13.2 13.1Paper boxes.
PRINTING, PUB LI SHIHS, iilTD ALLIED
82.8 ! 81.6:
i
80.5i
77.7
:INDUSTRIES • 359 ! 355 347 ' 32.4Newspapers and periodicals 122.3 : 121.9 119.8 i 109.6Printing book and job 148.5 ! 146.0 142.6 ! 134.2Lithographing 27.3 1 26.9 26.0 : ' 24.4Bookbinding 29.1 : 28.7 | 28.4 27.9
CHEMICALS AHD ALLIED PRODUCTS 444 I 441 ! 444 628Paints, varnishes, and. colors Drugs, medicines, and
33.0 1 32.3
:
31.7:
29.7
Insecticides 49.2 : 48.6 48.0 49.2Perfumes and cosmetics 12.0 ; 12.2 12.4 12.2Soap • 13.6 : 13.6 13.6 13.4Rayon and allied products Chemicals, not elsov.rhore
59.3 57.7 56.9 54.1
classified L ll-i.6 ! 112.8 110.6 115.2Explosives and safety fuses 2 / i 17.3 : 21 .5 26.32 95.1Compressed and liquefied gases ! 5.6 ! 5 .5 5.5 5 .9Ammunition, sma11-arms I 9.6 9.9 11.3 61.0Fireworks 2.0 2.2 3.1 25.9Cottonseed oil 17.7 19.4 20.6 19.8Fertilizers 24*4 22.2 20.8 23.1
PRODUCTS OF PETRCLEUi.I AND CCAL 141 : 139 138 133Petroleum refining 96.1 i 95.1 95.1 91.4Coke and by-products 23.7 23.0 22.4 22.2Pnving materials 1.4 1.6 1.8 1.4Roofing materials 10.4 10.1 9.8 9.5
RUBBER PRODUCTS 191 : 189 181 199
Rubber tires and inner tubes 98.8 96.2 91.4 96.7Rubber boots and shoes 16.3 i 15.9 15.4 17.9Rubber goods, other 65.7 i 64.4 61.6 71.5
MISC£TT..'JTSO'JS IHDuSTRIES
Instruments (professional and
scientific), and firo control
342 j 337:
326 ill
equipment 22.1 ; 22.4 22.4 58.8Photographic appa ratus Optical instru2’.iohts and
22.0 22.4 21.5 28.0i
ophthalmic goods 30 .2 19.9 19.4 23.6Pianos, organs, and parts 6.8 6.1 5.6 7.3Games, toys, and dolls 17.6 17.5 15.9 16.5Buttons 9.6 9.4 9.2 9.2Fire extinguishers 2.3 I 2.4 : 2.3
■.......... ........ .... _4.8
Digitized for FRASER http://fraser.stlouisfed.org/ Federal Reserve Bank of St. Louis
le 19-Estimated IJumber of Produotion VJorkers in llanufacturing Industries Jl/oont!d
Estimates for the major industry groups have been adjusted to levels indicated
by the final 1945 data made available by the Bureau of Employment Security
of the Federal Security Agency and should not be compared with the manufac
turing employment estimates of production workers plus salaried employees
appearing in Table 6* Estimates for individual industries have been adjusted
tc levels indicated by the 1939 Census of Manufactures, but not to Federal
Security Agency data* For this reason, together with the fr.ct that this Bureau
has not prepared estimates for certain industries, the sum of the individual
industry estimates will not agree with totals shown for the major industry, groups#
Revisions have been made as follows in the data for earlier months:
7*
Forgings, iron and steel - October 1045 production workers to 24*3*
Mattresses and bedsprings ■* October 1945 production workers to 14.3.
Explosives and safety fuses - October 1S45 production workers to 29S,
Digitized for FRASER http://fraser.stlouisfed.org/ Federal Reserve Bank of St. Louis
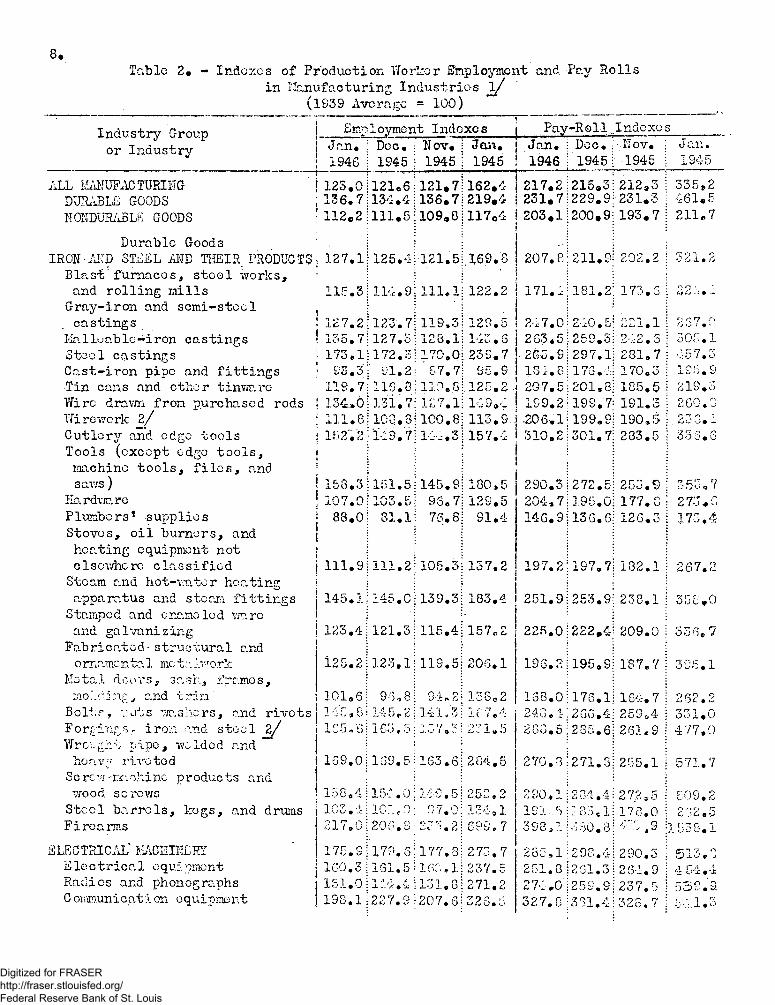
Table 2, - Indozcs of Production Worlcor Employment and Pay Rolls
in Ifanufacturing Industrio-s l /
(1939 Average = 100)
8*
Industry Group
or Industry
Err
--- —. .... i
loyment Indexes Pay-Roll .Indexc s
Jan. :
1946 !
Doc. :
! 1945 1
; Nov. ! Jan,
1 1945! 1945
Jan. :
1946 !
! Dec,
! 1945
11 ov.
1945
Jan.
1945
ALL Mi JJUFAC TURI 1\> G■ -- !12.5,0j! 121o6 j121.7!162.4 217.2!: 215.3 212.3 335,2
DURABLE GOODS 136.7!! 134.4!!136.7!219.4 231.7 !229.9 231,3 461.5
NONDURABLE GOODS
Durable Goods
112.2]
:
111,5 i 109,8 ! U 7 e4\ [: •■
203.1!; 200.9 193,7 211,7
IRON-AND STEEL AND THEIR PRODUCTS | 127.ll Blast furnaces, steelworks, •
|125.4!: • ;
!121,5! 169,8
! !
207.8 ■211,9;
202.2 321.2
and rolling mills Gray-iron and semi-stool
115.81! I K . 9!i:
i111.lj122,2 171.4 :181.2::
173.6
castings 12 7.2!;123.7 1119,3!129,5 247.0 |240.5 221.1 267.0
Malloable~iron castings 135.7:!127.5 !128,1!143,6 263.5 !259.3 242.3 305.1
Stool castings 173,1 ;172,5 1170.0! 239.7 • 26-3.9:!297.1 281.7 457,3
Cast-iron pipe and fittings es.s:j U1.2 ! S7.7! 95.9 134,8-!173.4 170.3 195.9
Tin cans and other tinware 119.7i!115,8 ! 110. 8|. 125.2- 20-7,5 • 201*8 185.5 219.5
Wire drawn from purchased rods 134*6 !131.7 : 127,1! 149,4 199,2'!199.7 191.3 260.0
Wi rework 2 / 111.8 108.8 !100.8! 113.9 . •206,1 ;199,9 190,5 230.4
Cutlery and edge tools Tools (except edge tools,
machine tools, files, and
15 2". 2
;
149.7!
::I
j 144,31-157.4: *: :
310.2 1301,7:r:
283.5 333.6
saws ) 158.3 !151.5 145.9; 180,5 290.3:!272.5 253.9 353,7Hardware 107.0!1103.5 96,7! 129.5 204.7 j196,0 177. C 273. GPlumbers1 supplies
Stoves, oil burners, and
heating equipment not i
| 88.0;|
i i
i 81.1
::
76.8! 91,4
:j
146.9;j 136,6
!:
126,3 173,4
elsewhere classified
Steam and hot-watcr heating 1
i 111.9
!
111.2 105.3! 137.2 :
197,2 197,7 182.1 267,2
apparatus and steam fittings j
Stamped and enameled ware |
! 145.1:1 :! i
145.0 139.3-: 183.4:
251.9 253,9: 238.1 356.0
and ga1 vaniz ing
Fabricated-structural and
I 123. 4 ;:i
121.3 115 ,4 ;15702j
225.0 222.4 209,0 33S, 7
ornamental metaIworlc
Metal doors, sash, frames,125.2!
:123,1 119.5! 206.1
:196,2 195.9 187.7 395,1
mo'Ai:\gj and trim 101.6! 96,8 9-4,2! 13 Go 2 168,0 176,1 164, 7 262,2Bolt?. i?ats washers, and rivets 145,ei 145,2 141v 3; 1c 7,4 241;. 4 266,4 259.4 331,0Forgingsr iron and stool 2 / Wrought pipe, welded and ~~
l e s . s j 163.5;1C*7,3! 2:: 1,5
; i
28G.5:! 285,6 261.9 477,0
heav •' rive tod
Scrcw-machine products and
169.0j:i
169,5 163.6!284.5;
270 ,8 j! 271.3
:
255,1 571,7
wood screws 150.4! 154.0 1C-S.5! 252.2 280.1:! 204.4 272,5 509,2Steel barrels, kegs, and drums 103.4: IClc 9;: 07.0!134.1 191.Sii]83s 1 178.0 262,5Firearms 217.0|200.8 23".2 !699,7 398,1 330.8 4- .9 1538.1
ELECTRICAL MACHINERY 175.9! 179.6 177.8! 273.7 285,1■ 298.4 290.3 513,2Electrical equipment 1G0.3 !161.5 160,1!237.5 251,8 1201.3 264.9 4 54,4Radies -and phonographs 151.0!; 144,4 131,8;271,2 274,0 259,9 237.5 5S9 .aC ornrounicati on equipment 198.1!
:227.9 207.6!326,5 327.0 331.4 326.7
;54.1.3
Digitized for FRASER http://fraser.stlouisfed.org/ Federal Reserve Bank of St. Louis
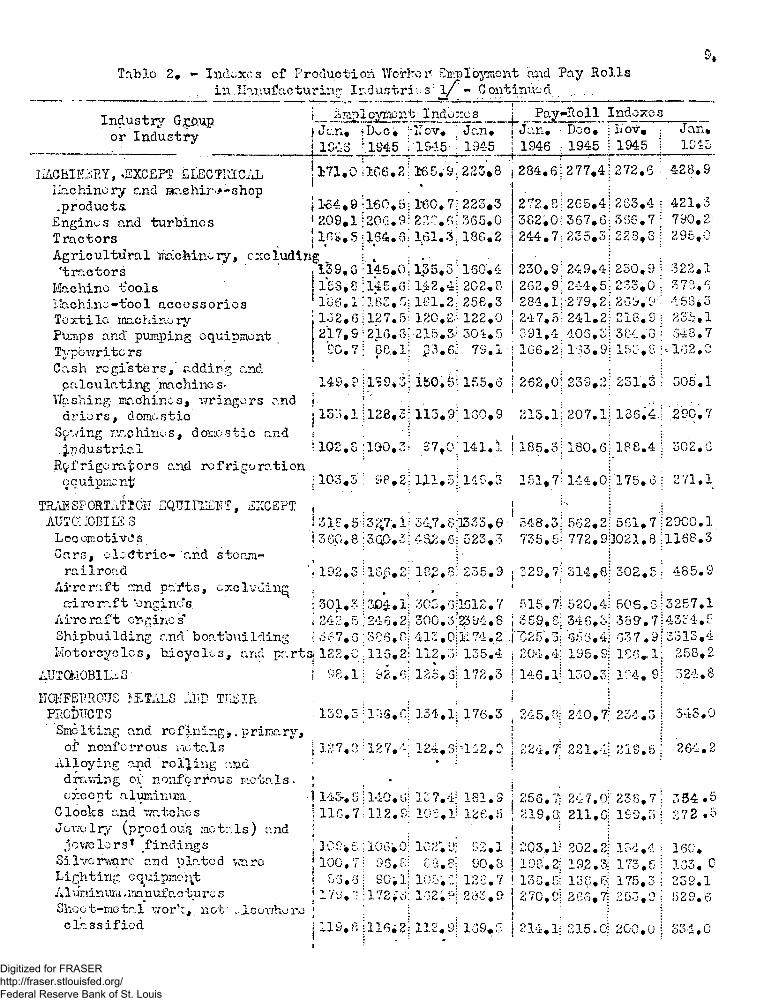
Table 2* •* Indexes of Production Vtforkor Sfcplbyiacnt and Pay Rolls
in llar.ufacturinr;: Industri \ f - Continued.........
9*
Industry G.c&up
or Industry
■ anigloyitont' I ndexes
Jan, * DvO * rlTov, ; Jan*
1246 1945 |'1S45- • 194-5T
Pay-Roll Indexes____
Jan* : Doc* \ liavm ; Jan*
1946 : 1945 I 1945 1D4J
IlACEIHiRY, .EXCEPT SLSCTRICAL. llachinery and raaehir^shop
.products
Engines and turbines
Tractors
Agricultural ircicM-nory, excluding ’tractors
Machine tools
iiichinc-tbol accossorios Te xt i le mac hino ry
pumps and' pumping equipment Typewrite rs
Cash registers,’ adding and
.calculating machines-
171*0 !ir,6.2; 165.9 ; 225*3 j 284*6; 277*4
j 1-64*9 ;i«0*5:160*7: 223*3 272.8j 265*4 * 209*1 |20G*9l 22C.fi! 365*0 [ 382*0; 367*6 jins*5|164*6l 161.3; 1SG.2 244*7;235*3
:. i . . : -139.6 145*0.. 1.35*3:160*4 230.9; 249*4
158*8 ;i45*G:142*4! 202*8 j 262*9:244*5
106*1:IBS*5;181.2; 256*3 ! 284.1: 279,2
, 132*6 :127.5; 1.20*2-1 122*0 ; 247.5 : 241.2 217,9 :216,8;-215*3-: 304*5 1 391*4- 406,3
'2C*7| 88.* 1- p 3 ,& 79*1:1 106.2! 133,9
272,6 : 428,9
263,4 ; 421*3
336*7! 790* 228*8 ; 295,
230.9; 322*
233*0- 378* 26S,9:- 458* 218.9; 235. '3 84, *8 : 648.
•153*8h 102*
149,? jl*>2.3; lfc0.S!155,3 j 262,0! 239,2
Washing- tnr.chincs, wringers and j jdriers, domestic j 133.1 jl2S,3: 113*9; 160*9 213.1; 207*1- 136.4
Sowing jx.ohinos, d ones tic and 1 ' iIndustrie-! "*■ 102*8 : 190,3? 27,0! 141.1 j 185*3; 180.6; 188.4
Refrigerators and refrigeration
231*3; 305.1
290, 7
equipment
IRAK SPORTATIOH EQUIPLEFf, EXCEPT AUTCaOBIIiS 3
Loc cmotivO s
Cars, elocJtric-'and steam-
railroad
Aircraft and pa'tft.s, excluding aircraft ‘engines
Ai*rc raft engine s*
Shipbuilding and boatbuilding
Ivlotorcycles, bicycles, and parts
AUTOMOBILES
ITCKFEPROUS J3CTALS -jvp Th£IR PRODUCTS
Smelting and refining,. primary,
of nonferrous iictals
Alloying and rolling and dravdng of nonferrous metals, except aluminum
Clocks and nr. to ho s
Jov.xtlry (precious, metals) and .jewelers* findings
Silvorwa.ro and plated -ware Lighting equipment
Aluninura, manufacture s
Shoo t-raetal work,, not ...Isewhero classified
103,3\ 98,2
302* 3
111*5; 119,3 151,7; 144.01 175*6 •: 271*1
318*513,^7;. l-: 34.7.803 3 3 ,6 548.3; 562*2! 561*7=2900*1.
j 360,8 :3qp,2Ua2.6| 523,3 735,51 772 * 913021*8 ;U 68*3* • \
J 192.3 ilS£*2| 182*8! 235*9 j 329,7| 314,ej 3 0 2 ,5 i 485*9' : :
; 301 ,3!30£*1; 305,613512.7 515,7; 520,4: 50S .6:3257.1
I 242,5 ;246,2| 300,3;23&4,8 I 359*8; 346*3! 3 8 2 .714334.5
i o67,6 ;3C6,Gi 412*0;ii74.2 j'T;25*3; 656*4; 637,*9: £313*4
122*0 j 116,2; 112,3= 135.4 j 204,4; 195*9! 186,1; 258,2
98,1 ! 92*6! 125*5: 172*3 ! 146*1! I0O .3! 1P4* 9! 324.8
132*5 : IDS,O'- 134,1; 176,3 245,0; 240* T 234*3 i 343.0! = ' :! : . i
127*3 ;127*-; 124,Si’142*0 ! 224*7 221*4: 21S.5! 264.2
1143*,5 •; 140,Uj 137.4; 181.3 | 256.7! 247.0! 238.7: 334*5
| 116*7:112*2: 102,1$ 126*5 | 219.8: 211, Cj 129*3 j 272 *5
302*5 : 106*0! 102**2! 22*1 | 2Q3f l? 202.2! 184.4
100*7! 96.8; G8.8; 20*8 ! .128.2; 192.3! 173,5
86,6! 90* 1: 105;C-i 128.7 I 130.5: 138.5! 175*3172 ,” : 172,*6: 162iPi 283,9
: r
119,8 ; 116*2; 112.9; 169,5
160.
133, 0
239.12 70 * 2! 266, 7\ 2 53 . 2 ; 1329.6
i214,1; 215.0! 200.0 j 334*0
q
}~j 03
h-J
O CO
Digitized for FRASER http://fraser.stlouisfed.org/ Federal Reserve Bank of St. Louis

Table Z* - Indexes of Production Tforker Employment and’ Pay Rolls
in Manufacturing Industries l / - Continued
10.Industry Grpup
or Industry
Kmploynint Inde xos Pay-Roll Indexes
Jan. DOC. : 11 ov. .' Jan. Jan. Dec.;Nov. Jan.
194*6 1945ji 1945; 1945 1946 1945! 1945 j 1945
LUMBER AI-TD TTt-R R, BASIC PRODUCTS 100. S | 98.6 i 97.0. 110.6 170.4 166.0! 164.3 ! 199. 2
SeAvmi 11 s tind logging camps 69.4 | 68;1i; 67.1; 75.9 • 116.6 113.71 114.0 j 137. 9
Planing and plywood mills 88.7 ;• 86; 1 :
83.9; 97.1 146.9 142.8! 137.3 j 167. 2
FUR1TITURE Ai'D FINISHED LUMBER :
PRODUCTS 101.2 1 98.1 S3. 6: 103.3 184.2 179.8! 165.8 ! 194. 0
Marttress.es and' bedsprings 2 / 37. 7 = 93.4 p'J 9 : . « ; 96.4 173.7 161.7! 137.8 ! 178. 0
Furniture 93.8 ; 20.1 1 85.3 ; 96.1 169.3 164.3! 151.1 ; 180. '-J
Wooden £>oxes, othor than cigar '34.2 ; S3, 2 93.0; 108.3 185.4 188.8: 179.4 | 211. o
Caskets and other morticians* ! , i
’goods 100.6 ! 97. S 96.6; 95.7 169.8 164.7: 153.0 ; 170. 9
Wood preserving 102.7.jlOl.4 91-. 8 ; 38.9 203.9 211.0! 205.3 ! 190. 6
•Wood, and shaped- 2 / •96.9 •,96.6 95.2! 98.1 179.3 178.2; 168.0 | 178. 9
STOKE, C U T , AMD GLASS PRODUCTS 116.1 •111.0 10 7.-.1 \111.6 J189.2 185.5; 177.4 1 189. 0
Glass and . gla s swaro 125.0 {112.9!|109.9! 126.1 ; i92 .i 1S2.1I 170.3 ! 201. 8
Glass products mc.dc from : :I;purchased glass 100.6 lOS.O!! 103.1! 106.7 !178.9 .lGO.Sj 184.8 ! 185; 3
Cement 91.5 : 89.0;! i'].c,8; 69.1 ! 134.4 136.8::135.4 ! '107. 3
Bricl^, tile, and terra cotta 91.5* | 87.5 ! 62.6;„ 72 .S ! 154.6 1-,: 7.5: 139.1 | 117.-2
Pottery and relatad products 125.8 123.0 !113.9!*119.3 1 195.5 195.3! 188.1 i 184. 5
Gypsum ?6.0 \ 93.8]! 92.4 | 81.2 i 161.2 158.4j 155.1 I 142. 6
Walljboard, plaster (oxcept : : 1 :
gypsum), ‘and mineral vrool 124.1 il2l.ll: 117.7! 118.5 • 232.0 228.3! 220.6 ! 218. 6
Line 86.2 : 83.7;: 8i.-i! 81.0 171.1 171.8! 167.5 ; 151, 0
Har>le, gfc\nito, . slate, and ; : * :other products 75.0 75.4;: 71. 3 ; 75.. 7 111.5 115.6! 105.3 j 117. 8
Abra fives' 217,. P 211.2! 210.7! 275.2 336.6 337.8: 328.8 | 482. 8
Asbestos'products 103.8 108.iji105.2|126.4 208.2 213.0;
•206.7 ; 265. 9
TEXT! IE • -MI LL PRODUCTS Al’D OTHER
:
:.!
:
FI Ijii. * i . uuVUt1 i-C TIi o GG.-x : 95.3! 91.1 96.0 j 186.0 184.1! 171.3 ; 176. 3
C c m a n u f a c t u r e s , 'except ‘ :
wares 108.3:; 107.0; 100.7 109.3 217.0 216.2! 199.9 ! 210. 3
C otto a small ivaros 101.6: 1*00.3; • 98.5 101.1 135.6 191.5; 178.2 ! 193. 7
Sij.Ir and rayon goods ”73.1!; 72.7! 70.5 74.1 150.1 14-8.8! 142.0 j 133. -.c
Woo lor. - and worsted manufactures, \! i:
' c x c d y e i n g and finishing ; 99. 9 90.0 = 95.3 98.3 206.6 200.0; 184.0 | 193. 5
Hosiery bo . b Gb.6! vi\.:« 0 •33.3 115.7 113. Ij 109.0 ; 102. 9
Knitted cloth 98.0]j 97.8! 94.9 94.2 189.8! 186. 7! 180.1 j 169.
Knitted outerwear rtnd knitted : ::
: :
gloves 102.1! 101.9! 100.5 101.4- 196.3) 197. 7j 192.5 ! 185. 0
Knitted underwear 37.3 j: 07.6] 07.1 o c r> «.< i-'# 165.9! 166.1! 101.5 ) 134. 7
Dyeing and finishing textiles, ii ! ! r:
including woolen and worsted SO. 2 88.3; 00.3 89« 6 166.2! 164.4! 142.8 ; 152. 2Carpets and rugs, v.rool 70.7 76. cj 72.0 7 r * / */ • 1S5.1! 132.5; 124.S ! 138. 6Hat s, fur-fcIt 70. 7 69.7! 67. r» .1 ’
-••-••- 151.9; 147.4! 140.6 ; 125. 3
Jute goods, exccpt felts 105.0 105.7! 100.0 90.4 205.0! O A ^ • tvUOf wj; 198.8 ; 179. 3
Cordage and Wine 121... 120.5! 117 . 2 ; 125.1 229.2! OOOu u O # v: 220.4 ! 235. 3
Digitized for FRASER http://fraser.stlouisfed.org/ Federal Reserve Bank of St. Louis
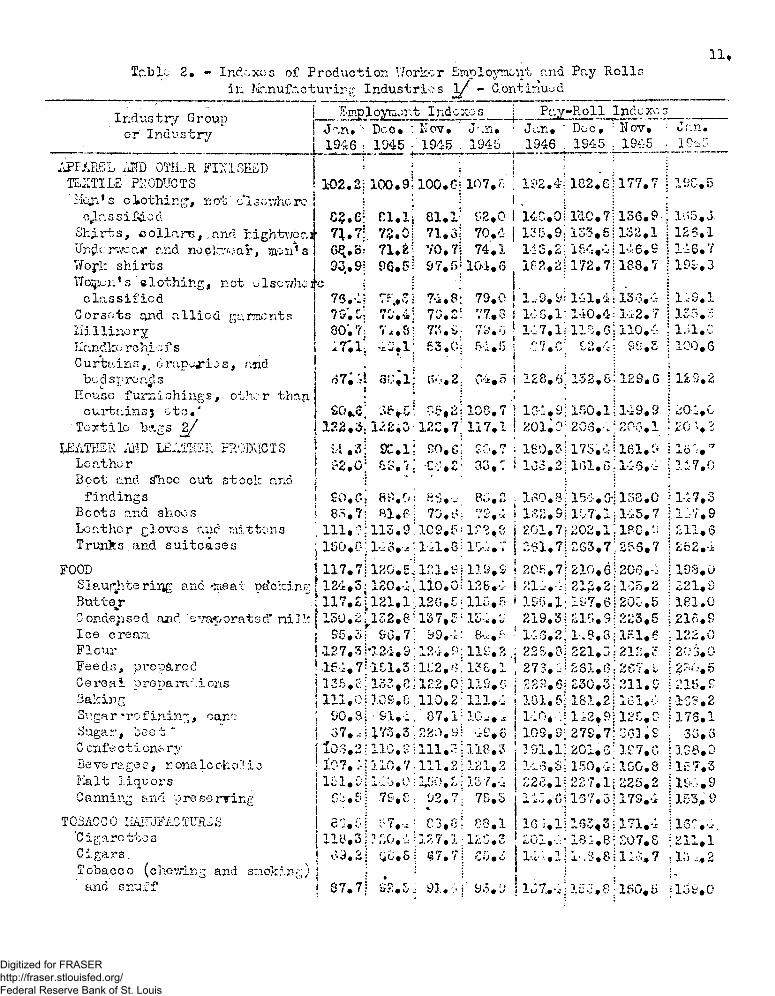
Tc-blo 2. - Ind'.xos of Production Uorb:.r Bmployrsont raid Pay Rolls
in Manufacturing Industries l / - C.ontirluud
11,
Industry Group
or Industry
APF&REL iuTD OTrLR FiriSEiSD TEXTILE PRODUCTS
Mcja’ s clothing, not' eloev.'hcrc cJ.assiSd.od C§,6| 81,1; 81,1 52.0 ! 14C .0!l4C .7U36.9
Shirts, collare,,and Mghtwoaif 71.?!. 7$.0j 71.6- 70*4 j 155*9; 153.5! 152,1115.2; 154,4!146,9
182.2! 172.7! 188.7Ungcrwcc.r and no plcr/oar, moil’ s ITofl: shirts
YJo^wn's elothing, not ^Iscv/hcjk classified
Corsets and allied garments Millinorj Kandkx; r c hi c f s
Curtains,, drupejri^s, and bedspreads
Houso furnishiiigs, othor thnji curtainsj cto.'
Textile M gs 2 /
LEATHER AriD LEATIiSR PRODUCTS Leather
Boot and s*hoe cut stoclc and
findings
Boots and shoos
Leather gloves and laittons Trunks and suitcases
__Eg.ployraent Indcxo s___
Jan. ' Dec* : Nov, ' J-.n*
1946 : 1945 • 1945 ; 1945
_ Pay-Roll Indexo s______
Jan. ' Doc. : Nov. : Jan.
1946 . 1945 ; 1945 • 1945
102.2; 100.9' 100*01107,?; ! 192.4e\ 182.6 :177,'I
08.6:
93.9!
71 .t- Y0.7
SQ.ij; 97,5
74.1104.6
74.8:7 fs es:
%/ 0 i* •73. v £3.0:
79,0
77.87 9 • <}
54.5
FOOD
Slaughtering and *jneat packing ButterCondensed aiid evaporated’ nil!;Ice creartFlourFe e d s , p re pa re c!
C e re a i p re pa ra . i oris
Baking
St;gar -rofining, cane Sugar, beet *
C enfecti on? ry3e ve ra gas, r ona 1c oh 0 i 0
Malt liquors
Canning and preserving'
TOBACCO liAil'JFACIURoS ‘C igare tts s
Cigars.
Tobacco (cheering and s:.iokr.ng) and snuff
« j76*4? 7F,"i
7G.s! 75*4!
80'.7: 7 ..S :
x7'.i; 4j'.l;
67. ?t <5v.l; (v>«2. v'i.o
! : IS0*e; r.e,8j 108.7
132,$! 122,7!; 117.1
oc.i; so. si so, 7
i?2,o'; &s,7.* •c;*2; 8 3 ,: l '. •
SO.C.; ftf'.o! 85,28 a ,7j Bl,6; 70.1V 75.-1
111. «: 113 . 9' 10 9, 5: 1 ?. 2 , S
15U,i- . 1'.: O. .c • l il.G- I'/.v't »
117.71 120 .e’- m .g i l ! 3 ,S124.S: 120. ;-: Ho.Ol 128*v
117. Z [ 121 * 1 12G* 5; 115. 5
150 .2p.32.8t 13 7, 5 : 154,5
95 0 O : 9 0 • ? : J?v/fc • £»*.•: 0127,31-124.9:124.0: 119,2 .
154, 7! 151,3 ! 152, *?! 138,1
235,8:133,8! 122.0; 119,5lll .O i109 ,6 ;110* 2:111,4
90 .81 • &l, i; 87*1-10--. i
67. -;j 173.3; 220. 9 ! 49.6103.2; 110.lv i 111,^! 118,3
3.07, ; 110, 7 • Ill * 2! 121, 2
151. 01145 .01 3£0. 1 115 7.4C5.5j -7S.8.- 92,7! 78,o
* * !
eo.o! ;;7 , r es.e; os.i118.3 j ? no.4 j 127.1: 12S.3
C * ^ ; 5,0.6: §*S . f : C . O
j » - . j,87*7; '»?:0C4 9j.0 .* I Bo* :J
1^9.9; 141.4-13.3,4
14G .1 '140 .4!Iu 2 .7 1 :7 .1 ;1 1 5 .0 ;110.4
r/.c : £2.4! so*s
19C.5
; li*»5,d
?12S.l;146 ,7
j 199,3
!1 ,9 ,1 I 135,5 ; 1J1.C • 100.6
128.6'! 132,6:129,6 i U 9 .2 * : :
i :•164.9; 150.1;149.9
201.0; 205.'.; 200,1
180.3 ;175 .4 :161 ,9
103.2| 161.6j 146.4': «
160,8 ;154. (H 138.0 1S2.S!157,1 ;145.7 201.7; 202.i; IRC.'.;
261. 7{ 263 ,7 :. 256.7
! 205.7 ;210,6!206.4
i 214,-W 212 ,2!1C5.2
i 195.l j 197.6!205.5
219.3;£15,9!223,5
! 146,2! 1 .8 ,G ;151,6
225,8!221,5:212,?
275,:^ 261,6: 267, l>
222,6! 230,3:211.5 101,5;181,21161.4 140, .1 li2,9| 125,5
109,9; 279,7:563,9
3 51.1!201.6
146.51150.4 228.11227,1 14:, Gj 167,5
;•16 5,11163,3201.4 • ie:-.e
• -
197. C 150*8 225.2 179*4
171.4
207.8
I 20%?
I 16 '.•*'7 11-7.0
i 147,3
li:;7,9 ! 211,6 \252,4
!198,0 • 221,9 :181,0 !216.9 ; 122.0! 203.0
!2?y.5 I 215.9
!123.2 |176,1
. 3o.C>I1S8.0i 157.3|194.9
! 153.* 9 :18':,--.211,1
5 1»5 , 2
157.,4-11 5 5 .81 5 0 .5 i 159.0
Digitized for FRASER http://fraser.stlouisfed.org/ Federal Reserve Bank of St. Louis
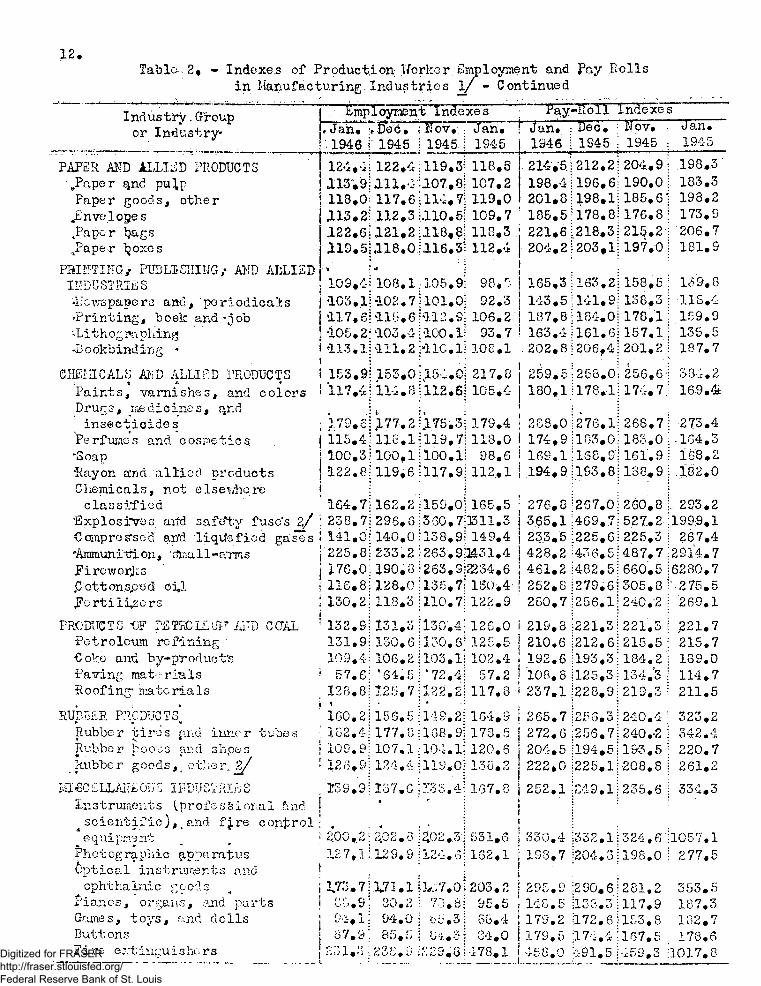
12.Table- 2, - Indexes of Production Worker fimployKient and Pr.y Rolls
inManufacturing Industries l / - Continued
Pay-fcoll indexesIndustry.Group
or Industry
PAPER AND ALLIED PRODUCTS .Paper qnd pu},p
Paper goods, other .Envelopes
.Paper tytgs JPaper Ijoxes
PRINTINGy PUBLISHING/ AKD ALLIEDINDUSTRIES
♦newspapers and, periodicals •Printing, boek and-job -Litho^ iTi phing
-Bookbindirig *
CHEHtCALS AiTD ALLIED PRODUCTS• % *■ *
Paintsj varnishes, and colors Drurcs, medicines, and insecticides
Perfumes and cosmetics "Soap'Rayon a'nd allied products Chemicals, not elsewhere
classified 'Explosives axtd safety fuse's %/ €ompros*scd anti liqtfsfiod gases "Ammunition, tfmall-a'rrris JireworJis tfCott on sped oj*l .Fertilisers
PRODUCTS W PETRCLLOF AIID OCTAL Petroleum refining '€ oke anti by-product's
Paving materials
Roofing* materials
RUBBER PRODUCTS*.Rubber tiros find inner tubes Rubber bo cos and shpe s Rubber goods,4 other. 2/
KteC£LLAI?i;Quo IE D U S IR IiiSInstruments (.professional find
scientific ), # and f^re control equipment
Photographic apparatus Optical instruments and ophthalmic goods
Pianos, organs, and parts Games, toys, and dolls Butt onsFire e:;tinguishors
~Empl oyraont 1 nde xes
, Jan, v5e c ,
'1946 r 1945
124,4;122,4;
113*9Ull,4 118,0?117,6- 113.21 112,3: J.22,6; 121,2; ai9^5|*118*0 i
i' j *•
103,4i108,1:
{L05,lU02.7| i l 7 #6|aib,6i *3.05,2; "103,4 *113,1 j i l l ,2:
! :I 153,9; 153.0! ! 117,4:*114.8 i
; 179,Si JL77. 2 115.4:11c.1 100,3!100.1 122.8;119,6
164,7;162,2: ! 238,7! 296.6; : 141.0:' 140.0: j 225.8! 233.2 j 176,0;190,0i ! 116,8:128.0: ; 130.2;118.3
! 132. Si
131.9j
109.4!
; 57.6! , 128.0!
! 160.2: ' 102.4! ! 109.9: ! 126,9]
131,3
130,6i 106.2j *64.5 125.7;
156.5;177.8107.1124.4;
159*9!137,6
CG.S! 30.2 O'i.l; 94.0
TITOV. : Jan. !HJan. Dec. nov. ; Jan.
; 1945 i 1S45 1946 ! 1945 ; 1945 : 1945
; 119.3! 118,S 214.5. ;212.2! 204.9 j 198.3
•5207.. 81 107.2 198.4 ; 196.6; 190.0 ! 183.3
llK .7; 119.0 201.8 !198.1! 185,6'1 198,2
!.110.5! 109.7 ! 185.5 ; 178.8; 176,8 ! 173.9
1118,8: 118.3 :; 221.6 1218.3! 215,2 : 206.7
.jJ.16,3;• :
112.4 |[204.2[
! 203.1; 197,0 ! 181,9
: 105.9: 98* r-
1
165,3 : 163.2]!158,5 ; 139.8
jioi.oj 92.3 143.5 ! 141.9!'138.3 i 118.4
:*1I2.S: 106.2 187.8 ; 184.0; 178,1 ! 159.9
iioo.il 93.7 163.4 : 161.6! 157.1 : 135.5i-llC.l! 108,1 .202,8 !206,4; 201,2 ! 187.7
1,154.0! 217,8 269.5 :258,0: 256,6 ! 384.2
j112.6? 105.4 180,1 j178.1!.174,7 ; 169.4t
1X75 . 3 ! 179,4 j 2G8.0• i ; 276.1
:268,7 273.4
•119,7: 118,0 I 174,9 ! 103,0 183,0 ■164.3: I00,l! 98.6 i 169.1 ;168,9 161.9 168.2
:117,9! 112,1 ! 194.9 ; 193,8 188.9 102.0
!150,0! 165,5 ;; 276.8 ^267,0 260.8 293.2! 250,7!3311,3 3.65,1 ;469,7 527.2 199:9,1
! 138,9! 149,4 23.3.5 ;225.6 225.3 267,4
! 263,93431,4 428,2 436*5 487.7 2914,7
!g63,9:2234.6 461,2 !482,5 660.5 6280,7
; 135.7; 150,4- 1252.8 ;279.6 305.8 '275 .5
|no.7| 122.9 280,7 ;256.1 240 .'2 269.1
! 130.4; 126.0 219.8 ;221.3 221.3 ^21.7
! 130. 6-125.5 210.6 !212.6 215.5 215.7! 103.1! 102.4 192.6 !193,3 134.2 189.0!* 72, 4; 57.2 10F5,8 1125.3 134.3 114.7!122.2! 117.8 I| 237,1 :228.9 219.3 211.5
!149,2! 164.S ! 265,7 12.58.3 240.4 323.2:168.9! 173.5 272.6 ;256.7 240.-2 342.4: 104.1; 120.6 204,5 1194.5: 153.5 220.7; 113*0! :
136.2 222,0 1225.1! 208.8 261.2
p:3S.4; 167,8 252.1 ;249.l| 235.6 334.3
1;^)2.3j
I
531,6
1
330.4 1332.1 i324,6 ;105'7.1
: O: •
162,1 193.7 ]204.o 1198.0 ! 277.5
: 1 iiafJ 7,0** 203,2 295.9 ;2 90. 5 281.2 353.55 73,81 95.5 148.5 1133.3 117.9 : 187.3j 6c,3: 86. 4 179.2 !172.6 153.8 132,71 ou.3! c’<i.Q 179.5 P. 74. 4 167.5 178.6!225.G; 478.1 45C.0 491.5 459,3 1017.8Digitized for FRASER
http://fraser.stlouisfed.org/ Federal Reserve Bank of St. Louis
Tabic 2# - Indexes of Production Worker Employment and- Pay Soils
in Manufacturing “Industries l / m Continued
Indexes for the jaaj or industry groups have been adjusted to levels indicated
by the final 1943 data made available by the Bureau of Employment Security
of the Federal Security Agency*
Revisions have beo# rnado as follows in the indexes for earlier months:
Wirewojrk - September and October 1945 nay-roll indexes to 167*6 and
173*
•Forgingsj iron and-steel.- October 1945 employment index to 158*3; pay-j’oll index to 271*1*
Hatt-rossos and bodsprings - August and October pay-roll indexes to 155*4 and 130*0 respectively; -October 1G45 employment index to 77*8*
Wood, turned and shaped.- October 1945 pay-roll index to 161*4*
Textile bags - Soptonbeo: and October 1945 pay-roll indexes to 205*7 and ’205*4*~
Rubbter goods, other - October 1S45 pay-roll index to 204*3*
-Explosives and safety fuses - October 1S45 employment index to 4r0 9 ^ ; pay^roll index to 626*2*
13* ’
Digitized for FRASER http://fraser.stlouisfed.org/ Federal Reserve Bank of St. Louis
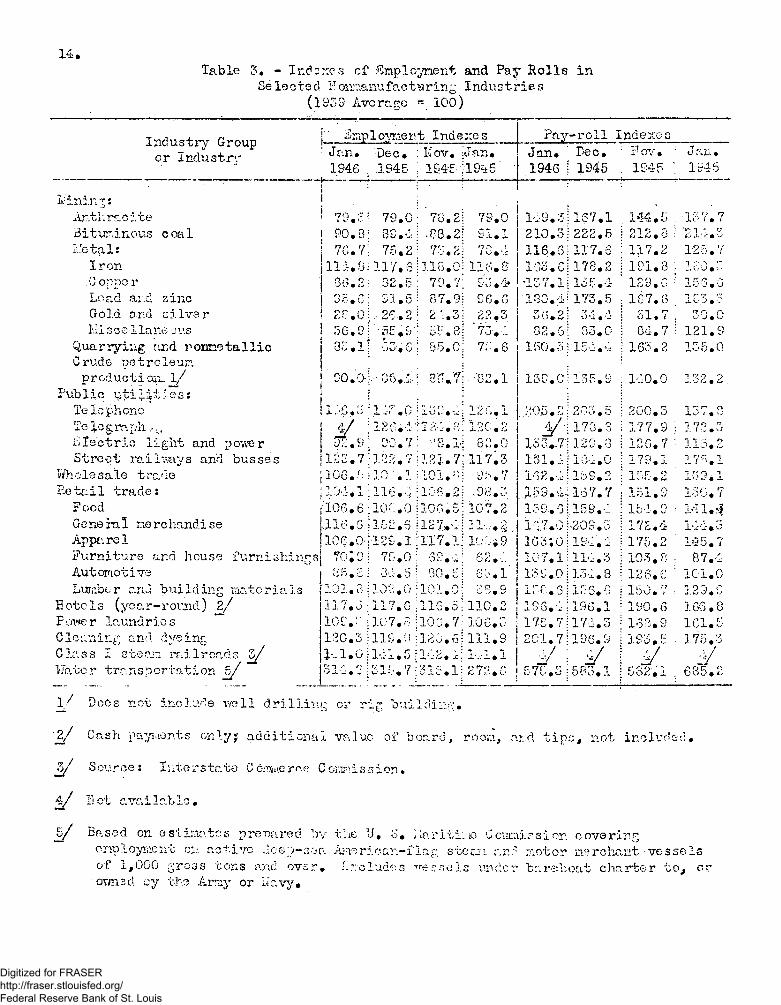
Table 3. - Indexes cf fimplcynent and Pay Rolls in
Selected Fon:.;axiufac t w r in Industries
(1933 Average - 100)
14.
Industry Group or Industry
; Bmployner t Indexe s Pay-roll Indexes
Jan# •'Dec. : l\ov. !Jan. Jan. Dec. ; Fov. ; Jan.
194G .r, * ! 1 S 4 5 ; i&4-£ :•• ;1945' ' 1946 ; 1945 . 1945 ; 1S45
1
Anthracite 79.2 i 79. 0 ! 78 .2j 7S.0 ! 149.3 167.1 .144 .5 i 137.7
Biturdnous coal 90.8! 8S.ii.83.2i Sl.l 210.3 222.5 i 212.8 ;O' ! 1 - i i.> J .* s: •
Iletal: 76.7: 75.2' 73.21 n n 1i V.; • *.•: 116.8 ■117.3 ; 117.2 125.7
Iron 118.0! 117.6jllB.Oi 116.0 183.6 178.2 ! 191.8 ; 188.8Copper '86.2; 82.5; 70.7; 93.4- ’137.1 135.4 ' 129.8 ? 158.8Lead ar.d zinc 35. 0:; S I .5 \ 87.91 06. g 180.4; 173.-5 ; 187.6 ; 183.8G0Id and si1 ve r 28 .0 !; . 26.2 \ 28.3: 22.3 3(5*2! 34.4 ; ol.7 . 30.0Mi sc a 1lane 0us 5G.0
3S.l1; "-S6;&r'^ .8 ; ' 73. 82.8; 83.0 i 84.7 1 121.9
Quarrying and ronnetallic [ 82; Cl 65.0; 78. S 150.3j158.4 j 163.2 135.0C rude pe t rc leuin •
production., l / 1! 00.0[ i • 08..4; BS.7; ■ '82.1 130.0; 135.9 :180.0 132.2.Public utilities: I :f r
Telephone !! JL ,:*Lj 0 Oi 12;'. 4 n>- j.S:
128.1 208.2j283.5 ;200.3 157.8Te lo g ra pii,v
v :128.2 i / i 178.3 !177.9 j 172.8
Electric light and power 35.9:: 00.7i .‘-’S.l-i 82.0 13 3.-7; 128.8 ;128 .7 i 115.2Street railways and busses 122. 7 ;|122.7i121.7; 117.3 if>i..i\188.0 ;179 .1 17% 1
Wholesale treble j 106.8 i•101.11101.8! 9:5.7 1G2.-1-! lbS.2 i185.2 133*1Retail trade: :: 104. 1 :; llo.-, ;I'J-S#ki: ,98.3 .159.-1.; 187.7 • 151.9 130.7
Food 'I0G .6 ;1108.0jlOG.o; 107.2 159.61 159.8 |158.8 ! M l . *Ge ne ra 1 no rc handi se Jl'o.s :! 152.6 il27»'8i 31,:. 2.. 18.7.0 i-209.3 ! 172.4 18-8*3Apparel 106. 0-i;-i20.i:Ti7.ii I'.'.i9 183;0; 198. i !175.2 155.7Furniture and house furnishings] 7o;oj: 70.0: 58.4; C‘ O 1U <0 • - 107.1; 118.3 ;103 .8 ; 87.8Automotive 35.3; 84.5; 30.5; 68.1 138.0: 138.8 i 126.8 ■101.0Lumber and building materials ■101.3! 102. 0 iici.oj 38.9 188.6! 158. 8 ;150 .7 : 129.8
EoteIs (year-round) 2/ 117. 0 ;117.6 ;il6..5: 110.2 198.8; 196.1 !190.6 166.8Fower laundries 10C.3 I107.0 jl00.7; 108.3 178.71 178.3 \168.9 181.5'Cleaning and dyeing .120.3 I119. 9 ;12G.Sj 111.9 201.7! 196.9 • 1 O'? K: • 175.3Class I stean railroads z /
Viator transportation b /
J--1.0 j 314.2:
l-;ix.5 : J.-.--2. i ;
31;.'. 7 =315.1; ......................... J
1 ,1 .1
272.Gy i
57E.S. 583.1! yj 582,1 ,
. .............................
y685.2
\/ Does not include wall drilling or rig building*
_2 / C a s h p a y m e n t s o n l y ; a d d i t i o n a l v a l u e o f b o a r d , r o o r a , a i _ . d t i p s , n o t i n o l v d s - J ,
7jJ Source : liyfcerste.t© Corrauerce Cor'j'isnior.•
H o t o . v a i l r , b l e ,
5 / B a s e d o n e s t i r . - i o . t c s p r o w r e d b y t h e U. S . • l a r i t i ; 1 0 C o n c a i ? s i o n c ove r i r 5
enployiiient c:» active Jeep-soa Anerioar.-flag stean cn.*1 motor nsreliant vessels
of i ,000 gross cons and over* fJrcludos vessels under bar^hoat charter to^ or ■own3d by the Array or iiavy#
Digitized for FRASER http://fraser.stlouisfed.org/ Federal Reserve Bank of St. Louis
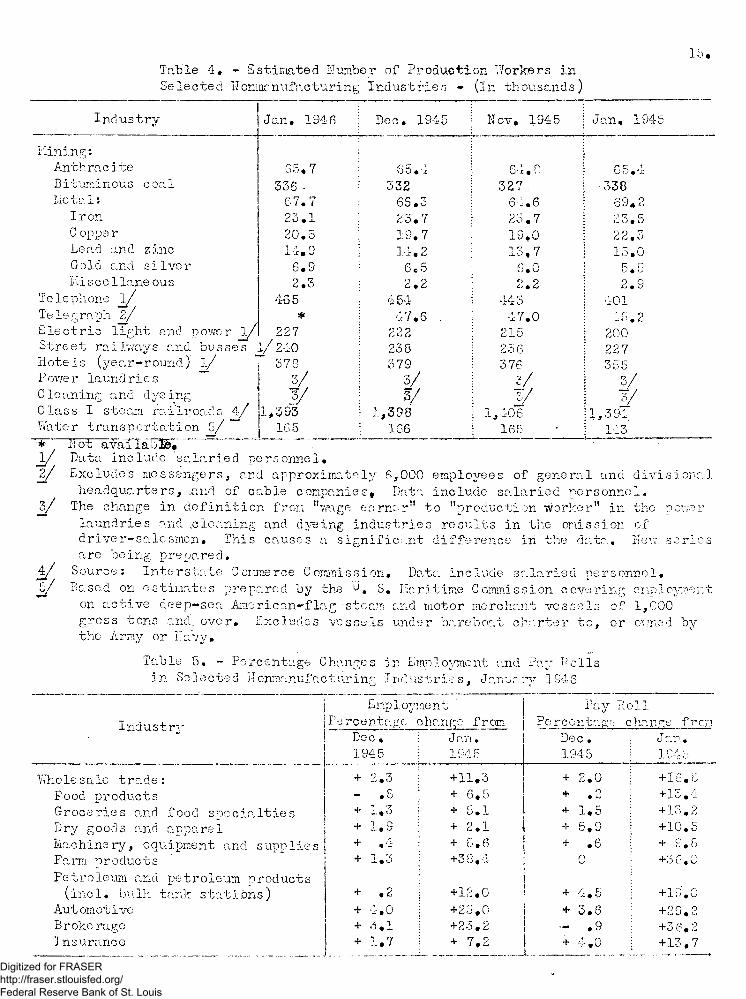
Table 4* - Estimated Humber of Production Workers in
Selected I'lonmanufacturing Industries *• (in thousands)
15*
Industry Jan. 1946 Dec# 1945 Nov. 1945 Jan* 1945
zinc
si lver
Mining:Anthracite
Biturrrinous coal Meta1:
I. r on
C oppe r
Lead and
Gold and
Miseellaneous
Telephone l /
Telegraph z /E lect-ric light and powe r l / Street railways and busse's 1. HoteIs (year-round) l /P owe r la und ri e s
Cleaning and dye ing Glass I steam railroad
Water transportation 5
~7Tot avaTIauST’ ~
y
£
i /
.1 /5 /
65.7
335 -67.7 23.1
20.5 14,9
6.9 2.3
465 *
227
240 378
% 1*333
1G 5
i
65.4
33266.3
23.7
19.7
14.26.5
2.2454
47.6222238379
%1,398
166
64.8
327 .64.6
23.7
19.0
13.7 6.0
2.2443
47.0
215 2363 76
Ky
1,406165
65.4
33869.2
2 3.5
22.3
15.0
5.5 2.9
401
45.2 200 227
. 355
Ky
1,394
143
Data include salaried personnel.
Excludes messengers, and approximately 6,000 employees of general and divisional
headquarters, .and of cable companies. Data include salaried personnel.
The change in definition from Hvage earner11 to "production worker” in the power
laundries and .cleaning and dyeing industries results in the omission of driver-salesmen# This causes a significant difference in the data. Hew series are being prepared*
Source: Interstate Commerce Commission# Data include salaried personnel#
Based on estimates prepared by the ^# S# Maritime Commission covering employment
on active deep-sea American^flag steam and motor merchant vessels of 1,000
gross tons and. over# Excludes vessels under bareboat charter to, or owned by the Army or Navy.
Table 5. - Percentage Changes in Employment and Pay Rolls
in Selected Honmanufacturing Industries, January 1S46
Industry
Employment Percentage change from
Pay Roll
Percentage change fromDoc #
1945Jan • 1945
Dec.
1945
o C.Xj. •
1945
Wholesale trade: + 2 #3 +11.3 + 2.0 +16. o
Food products - .8 + 6.5 * .2 +13.4
Groceries and food specialties + 1.3 + 5.1 + 1.5 + 13 . 2
Dry goods and apparel + 1.9 + 2.1 + 5.9 +10.5
Machinery, equipment and supplies + *4 + 8.6 + .6 + 9.8
Farm products + 1.3 +38.40
+36,0
Petroleum and petroleum products(incl# bulk tank stations) + .2 +12.0 ! + 4 .5 +1S.0
Automotive + . 0 +23.0 * 3.6 +29.2Broke rage + 3.1 +23.2 - .9 +3 6,2Insurance + 1*7 + 7.2 + 4 .0 +13,7
Digitized for FRASER http://fraser.stlouisfed.org/ Federal Reserve Bank of St. Louis

Table 6, - Estimated IJumber of Employees in IT,««agr:-.cul'|<Hfc.l Establishments
by Industry Division
16.
. (in thousands)
IndustryDivision
*
Jan#:
1&43
De.cv ; 194'5
: Nov,
f 1945
i' Jan.
| 1945
2ccc.l j / '35,839 | 36,319 . 35,639 •37,952
Manufacturing 2 / •12,048i| 11*914 1 11,970 15,555
*Mining 811
:
! ,802 :
793 801
Contract Construction and Federal forcd account construction
I:
1,120
:j
| 1,042
1
1,014;
582
Transportation and public utilities 3,891 j 3,896|
j 3,871 3,740;
Trade 7,512:I 7,960 !
] 4,936
7,571 : 7,030
Finance, service, and miscellaneous 4,984. !1 4,845 4,350
Fede ra 1, State and 1 oca 1 'govs rnment,
excluding Federal force‘ account
construction
i; 5j473
I!
! 5 i:7£p: 5,575•- ... _
:
— i------------- ----------------------------------- -----------
\/ Estimates include all full-and part-tiiae v/aga and salary workers’*i»nonagriculturo.1 establishments v«*ho are employed'during the pay period ending
nearest .the..15th of the ^lonth. Proprietors, self-employed pers.ons., .domostic
servants, and personnel of the armed forces are excluded.*
2 / Estimates for manufacturing have been adjusted to .levels indicated by final1*942 data made* available by the Bureau of Employment Security of. the Federal
Security. Agency#. Since the estimated number of production workers in
manufacturing industries have been ‘further adjusted to final 1943 date.,
subsequent to Deccrnbcr 1942, the tivo sots of 'animates are uiot comparable#
Digitized for FRASER http://fraser.stlouisfed.org/ Federal Reserve Bank of St. Louis
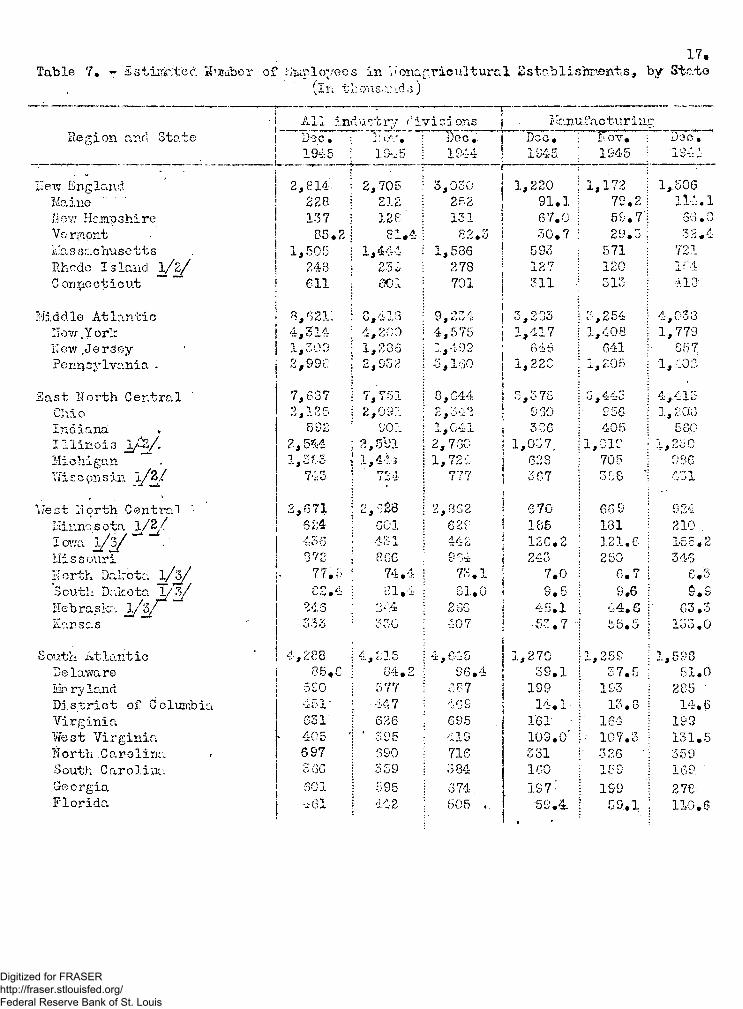
Table 7. - astirfr.ted Sibber of .Employees in 1'ono.fricultural Sstablisbmnts, by S%e.t©
(In thousands)
17.
Hew England
Maine
liovi Hampshire Vo rrripnt Massachusetts
Rhode Island. } /% /C ormecticut
Middle Atlantic
Uow.Yorl:Hew,Jersey
Pennsylvania .
East Horth Central OhioIndiana .Illinois j / V .
Miohigan
Vifisopnsin }/%/■
VJest Horth Central '•
Minnesota _!/§ /
I owa ^ 2/MissouriHorth Dakota 1/ o /
South Dakota l/j5/
Hebraska 1/ 3/ * “* Kansas
South Atlantic Delaware
MarylandDistrict of Columbia
Virginia
West Virginia
Horth-.CarolinaSouth Carolina
GeorgiaFlorida
65.2 i 81.4 82.3
.,506 i 1,444 1,536
248 ■ 233 ! 273
611 ;:
eoi I 701
5, <5211 !: 8,418 • 9,234
:,314 ; 4,200 i 4,575.,303 ; 1,235 j 1,499:,993 j
:C, , 9<’> A :
; .: 5#l^O
’,637 |
; :
! 7,751 !; 8,344,125 :| 2,091 j 2,342892 : 901 ii 1,041
,544 ;; i V & i |; 2,730
, 0 f,-c- ■;! i,44-i ]; 1,72 •:743 1: 724 !
: ' :: 777:
,671 |: -'Pei ‘ 2,832324 : C01 629
433 • 431 442372 j| BGG 93477.3 ; 74.4 73.1
32.4 •31. 61.0
2d 3 244 2oG333 330 407
,288 ! 4,215 4 , 64585,6 i! 04.2 96.4
5S0 I 577 337451' i -447 r c
•331 ! 626 i 695405 ! * 395 ; 419697 ! 590 7163 Go | 339 I 384
SOI | 595 | 674.--•61 : 442 ; 505 .
:
1,220 : 1,172 : 1,506
91.1 : 79.2 j 114.1
67.0 | 59.71 66.0
30.7 : 29.3 ; 38.4
593 571 i 721127 \ 120 !
311 : 313 | 413;
3,203 !3,254 j 4,033
1,417 | 1,408 : 1,7796 ” fci ; 641 !• 857
1,220 : 1,205 i 1,402-
3,37o:i 3,443 j 4,415
930 r 956 j. 1,203
336 j 405 j 5601,037. h-,C19 ; 1,230
628 I 705 ; 980367 j 358
:1 431
670 1 669i ' ’j 924
185 I 181 i 210
126.2 : 121.6 i 1.55.2243 ! 250 i 345
7.0 : 6 .7 \ 6.3
9.5 : 9.6 ! S..S45.1 1 44 .6 r 63.3-53 . 7 1 55.5
:j 133,0
1,270 ! 1,259 1 1,59839.1 ! 37.5 : 51.0
199 i 193 1 285.14.1 i 13.8 1 14.6
161 • !■ 164 1 193109.0' j- 107.3 i 131.5331 326 : 359160 i 159 | 169
197: | 199 j 27859.4 r 59.1 ; 110.6
All industry divisions Manufacturing
Region and State 1 1)3 c. ; I: 0*7. 1 Dec.. 1945 : 19-.-S5 j 1944
DOC. HOV. ; D'-JC,
1945 ; 1945 i 134’
2,814 ! 2,705
228
13721 £ 126
3,030
252
131
Digitized for FRASER http://fraser.stlouisfed.org/ Federal Reserve Bank of St. Louis
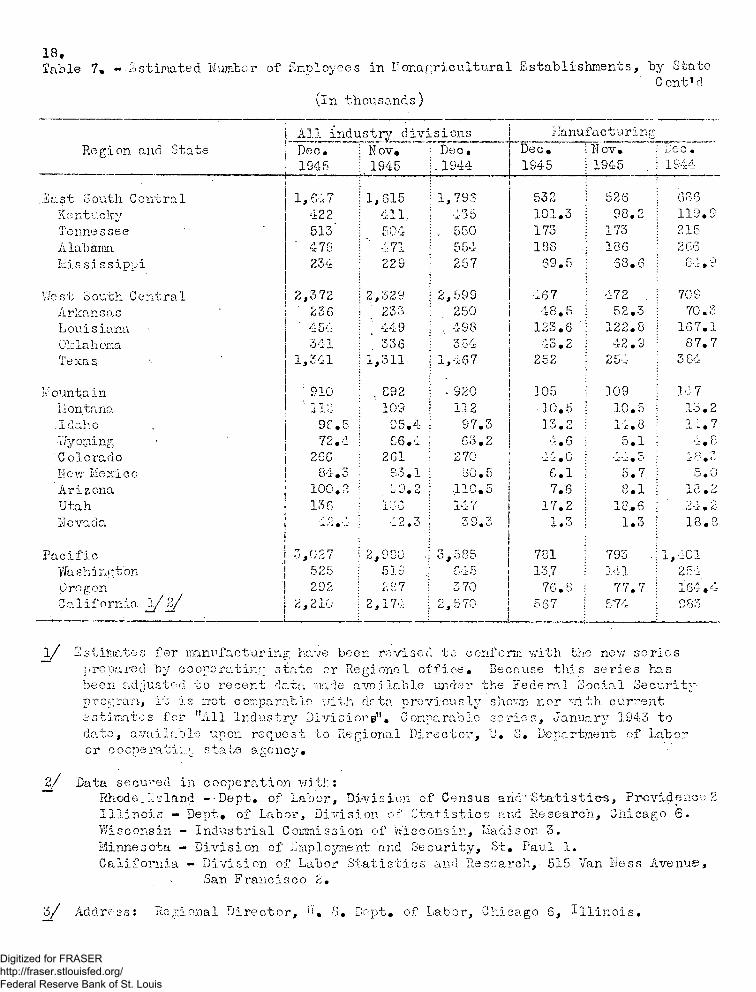
Table 7» — -Estimated Number of Employees in .IIonagricultural Establishments, by tftateC ontT d
(in thousands)
18«
Region and State
All industry divisions Manufacturing
Dec.1945
Nov*1945
Deo. . 1944
Deo.
1945
• K ov.
j 1945 .
Dec . 1944
East South Central 1, 647 1,615 1,795 532 j 526 606
Kentucky 422 411, 435 101.3 ! 98.2 119.9
Tennessee .513' 504 , 550 173 ! 173 215
Alabama ' 478 471 554 138 ; 186 266
Mississippi 234 22S 257 69.5 : 58.6 84,9
We s t S outh C e nt ra 1 2,372 2,329 2,599 467 ; 472 70S
Arkansas 236 233 250 48.5 : 52.3 70.3
Louisiana ' 454 : ' 449 ' 498 1 123.6 ! 122.8 167.1
Oklahoma 341 i ' 336 384 ! 43.2 | 4 2 .S 87.7
Texas 1,341 !1,311!
1,467 252 j 254 3 84
Mountain 910 . G92 - S20 105 ; 109 147
lion tana 1 112 ' 109 112 • 10.5 j 10.5 13.2
I dah 0 90.5 95.4 S7.3 13.2 : 14.8 14.7
Wyoming 72.4 66.4 63.2 4.6 j 5.1 4 .8
Colorado 260 261 270 44.0 * .i tr : # "J 48.3
Uew Mexico 84.3 S3 .1 BO. 5 6.1 1 5 .7 5.0
Arizona j 100.2 ■ ' i •? V V • O ■110.5 7.6 ! 8.1 18.2
Utah ; 136 133 147 17.2 ; 18.6 O • O X # C,
Nevada j1| 42.4!
42.3 39.3 1.3 ! 1.3 18.8
I
Pacific ]
!3,027 2,980 • 3,505 701 j 793 1,401
Washington 525 5 IS 645 137 I 141 254
Ore port 292 287 370 76.8 77.7 164.4California } / z / 2,210
-- -----:2,174 2,570 567 ! 574- C83
l / Estimates for manufacturing have been revised tc conform with the new series
prepared' by cooperating state or Regional office* Because this series has been adjusted to recent data made available under the Federal Social Security
program, it is not comparable with dr.ta previously shown nor with current
estimates for "All Industry Divisiongjn# Comparable series, January 1943 to
date, available upon request to Regional Director, U# S. Department, of Labor or cooperating state agency#
2/ Data secured in cooperation with:Rhode, Island --Dept, of Labor, Division of Census and"'Statistics, Providence 2 Illinois - Dept# of Labor, Division of Statistics and Research, Chicago S-
Wisconsin - Industrial Commission of Wisconsin, Madison 3.
Minnesota - Division of Employment and Security, St# Paul 1.
California - Division of Labor Statistics and Research, 515 Van Mess Avenue, San Francisco 2.
3 / Address: Regional Director, TJ# S# Dept# of Labor, Chicago 6, Illinois,
Digitized for FRASER http://fraser.stlouisfed.org/ Federal Reserve Bank of St. Louis
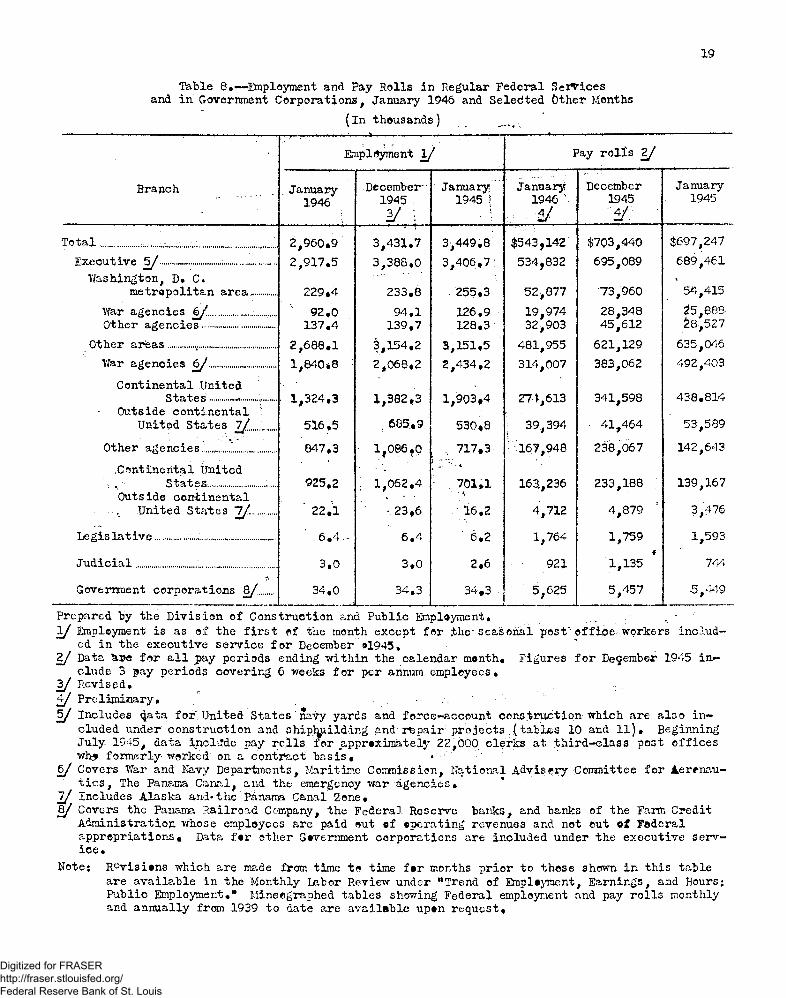
19
Table 8#— Employment and Pay Rolls in Regular Federal Sei^ices and in Government Corporations, January 1946 and Seledted Other Months
(in thousands)p.y—■»«■«* ... » ....it -......... ..... . , ... MM.
Employment 1/ Pay rolls 2 /
Branch ..January1946
December^- 1945 ;
u \
January 1945 ]
January 1946 ■
: i /
December19454 /
January1945
Total .......... .... / , 2,960#9 3,431.7 3,449.8 $543,142 $703,440 $697,247
Executive 5 / ............... .... .......... 2,917#5 3,388#0 3,406.7; 534,832 695,089 689,461
Wajshington, D# C.metropolitan area,...... 229 #4 233.8 . 255.3 52,877 73,960 54,415
War agencies 6/ ........... ...... 92.0 94 #1 126.9 19,974 28,348 25,888
Other agencies.................... 137.4 139.7 128.3 32,903 45,612 £8,527
Other areas............................. 2 ,688.1 3,154.2 3,151.5 481,955 621,129 635,046
War agencies 6/ .................. 1,840*8 2,068#2 2,434.2 314,007 383,062 492,403
Continental UnitedStates .................. • 1,324.3 1,882,3 1,903*4 274,613 341,598 438.814
Outside continental United States 7/t.. 516.5 ; 685*9 530*8 ; 39,394 • 41,464 53,589
Other agencies ........... 847.3 1*086.0 , 717*3 •167,948 238,067 . 142,643
.Continental United V., States............... ;.. 925.2 : 1,062.4 701.1 163,236 233,188 139,167
Outside continental ’ '■ *v
United States 7/....... ' 22.1 *. 23*6 : 16.2 4,712 4,879 3,476
Legis lative................... .............. 6 .4 ~ 6.4 6.2 1, 764 1,759 1,593
Judicial................ ..................... 3#0 3.0 2*6 921 1,135 744
Government corporations 8/ 34.0 34.3 34*3 - 5 ,,625 5,457 •5,449
Prepared by the Division of Construction and Public Employment* ,
1 / Employment is as of the first sf the month except for ,the- seasonal post-office-workers included in the executive service for December *1945*
2 / Data Upe fsr all pay periods ending within the calendar month# Figures for De§eraber 1945 in** elude 3 pay periods covering 6 weeks for per annum employees#
y . Revised#4 / Preliminary#
5 / Includes 4^ta for United States navy yards and force--account construction which are also included under construction and shipbuilding and'rfepair; projects ( tables 10 and 11)# Beginning July 1945, data include pay rolls for approximately 22,000 clerics at third-class post offices wh* formerly-warked on a contract basis# - ;
6/ Covers War and Navy Departments, Maritime Commission, National Advisory Committee for Aerenau- tics, The Panama Carual, and the emergency war agencies#
i j Includes Alaska and* the Panama Canal 2.one#8/ Covers the Panama Railroad Company, the Federal Reserve banks, and banks of the Farm Credit
Administration whose employees are paid mat of operating revenues and not out ot Federal appropriations# Data for other Government corporations are included under the executive service «
Note* Revisions which are made from time t* time for months prior to these shown in this table are available in the Monthly Labor Review under “Trend of Eraplojnnent, Earnings, and Hours; Public Employment • H Mine ©graphed tables showing Federal employment and pay rolls monthly and annually from 1939 to date are available upon request#
Digitized for FRASER http://fraser.stlouisfed.org/ Federal Reserve Bank of St. Louis
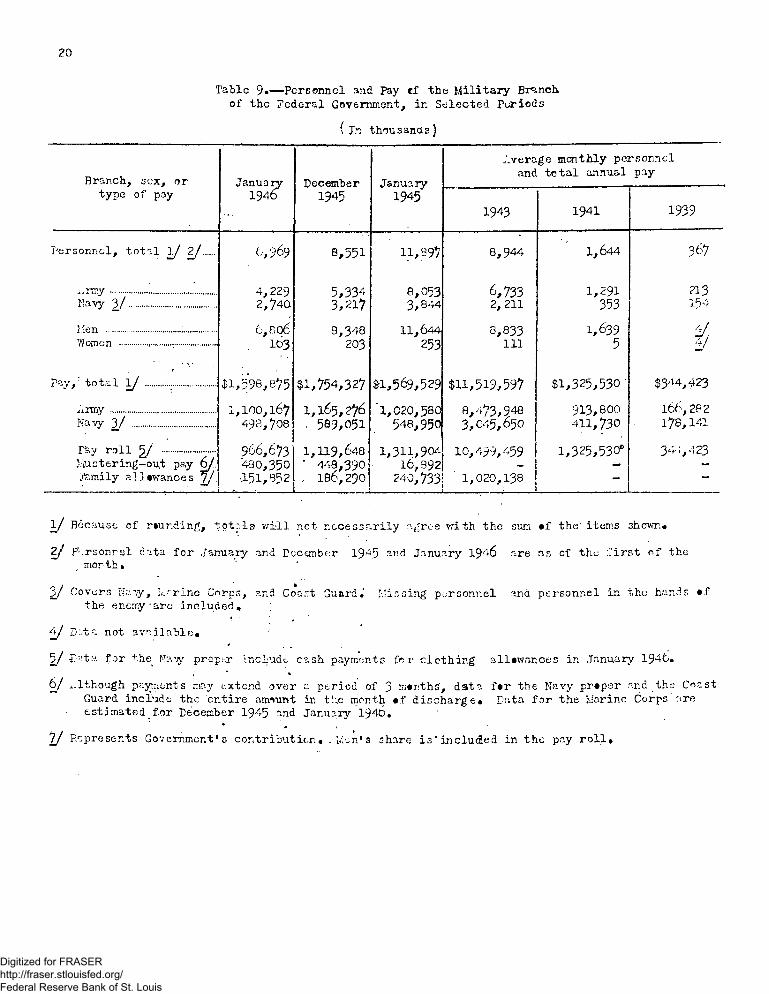
20
Table 9•— Personnel and Pay cf the Military Branch of the Federal Government, in Selected Periods
(in thousands)
Branch, sex, or type of pay
January1946
December1945
January1945
Average monthly personnel and total annual pay
1943 1941 1939
Personnel, total l/ 2/ t-,969 8,551 ll,«9/ 8,944 1,644 367
4,229 5,334 8,053 6,733 1,291 213tfavy 3 / ....................... 2,740 3,217 3,844 2,211 353 154
Men ................... :......... 6, 6 06 8,348 11,644 8,833 1,639 y .Women ............. ............ 163 203 253 111 5 v
P%v,: total 1/ .................... $1,596,875 $1,754,327 *1,569,529 $11, 519,597 $1, 325,530 ■ $344,423
Army ............................ 1, 100,167 1,165,276 1,020,580 8,473,948 913,800 166,282Na-vy 3 / ...................... 498,708 ■ 589,051 548,950 3 , 045,650 411,730 l7S,141
Tay roll 5/ .............. 966,673 1,119,648 1,311,90* 10,499,459 1 1, 325, 530° 344,423Iviustering-out pay 6/. 480,350 ' 448,390 16,892 - i — —Lfemily allowances ( j . •151,852 . 18t>, 2901 240,733 ! 1, 020,138 J
! . t— “
1/ Because of rounding, tot'Is will not nccessa.rily a^ree with the sum of the items ;shown.
2/ Personnel data for January and December 19^5 ^ d January 1946 are an of the first of the month.
3/ Covers Na iy, ■v.'-rine Corps, and Coast Guard.* Hissing personnel ana personnel in the hands of the enemy-are included,
4 / D:ita not available.
5 / £*ata for the Naw proper include cash payments for clothing allowances in January 1946.
6/ although parents may .extend over a period of 3 months, data for the Navy proper and the Coast Guard include the entire amount in the month of discharge. Data for the Marine Corps are estimated for December 1945 and January 1940 #
7 / Represents Government's contribution. . Men's share is* included in the pay roll.
Digitized for FRASER http://fraser.stlouisfed.org/ Federal Reserve Bank of St. Louis
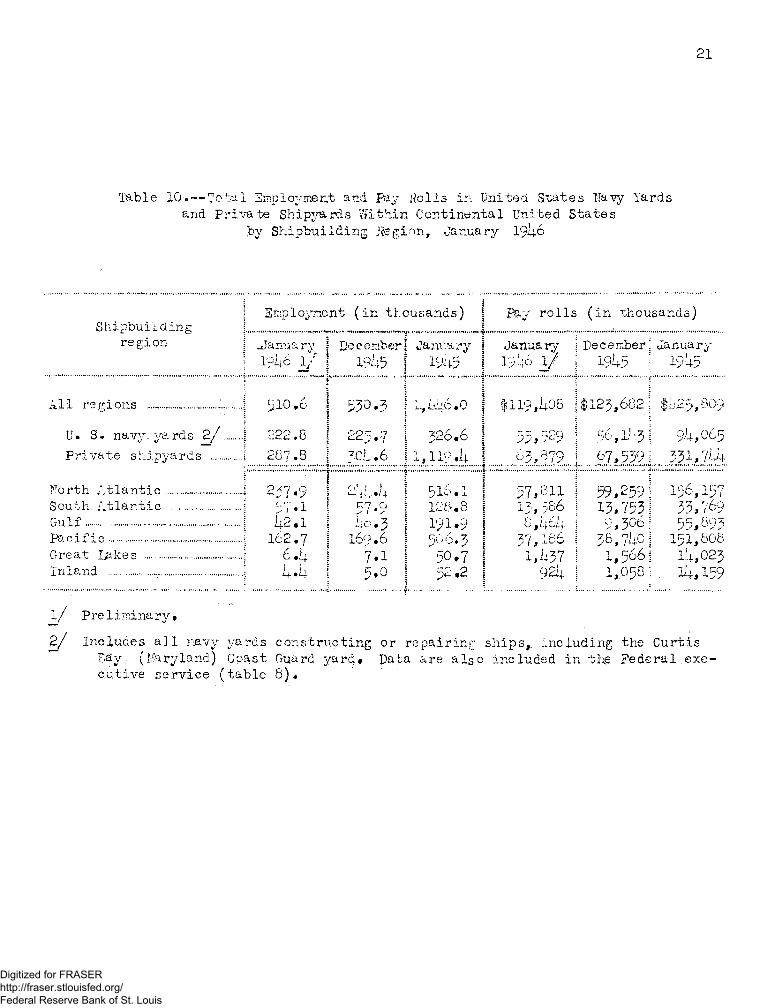
21
Table 10. — Total Employment and Pay Rolls in United States Navy Yards
and Private Shipyards Within Continental United States
by Shipbuilding jfcgion, January 19I4-6
Shipbuildingregion
: i | Employment (in thousands) j Pav rolls* V (in thousands)
| .January f lieeember\ .January j January December! January
j 1946 i7 1 191+5 I 1945 1 1946 1/ 191+5 ■ 1945
l / Preliminary*
All regions .... .............'.....j 510.6 f 530.35
] -,446.0 j 1119,1+08 $123,682|
]]• Sm navy, yards 2 / .... j 222.8IJ .V*}"" n \ c-e-p* 'i i 326.6 | 55,529 56,l>:.3i
Private shipyards..,.....1 287.8 1 * oL»6 = 1,119 .i+ }....... £3,879„_ 67,539.;.
;Morth Atlantic....... ...........j.South Atlantic ..... ...........J
Pacific ................*...............|
2^7#9
57a 1+2.1
162.7 6 .1+
• h-.-»457.9'•0 .3
169.6 7.1
! 516.1 I : 128*8 i
1 191*9 I ! 5-6.3 i
j 50 .7 |
57,31113,386 8,1+61+
37,166 1,1+37
59,259! 13,753! 9,306!
58, 71+0 ;
1, 566j
5.0 ] 52.2 1 921+ 1,0501
^25,009
9-4,065
331,744
156,15733,76955,393
151,8081-4,023
14,159
2 / Includes all navy yards constructing or repairing ships,, including the Curtis
Bay.- (Maryland) Coast Guard yard# Tata are also included in the Federal exe- cutive service (table 8)*
Digitized for FRASER http://fraser.stlouisfed.org/ Federal Reserve Bank of St. Louis
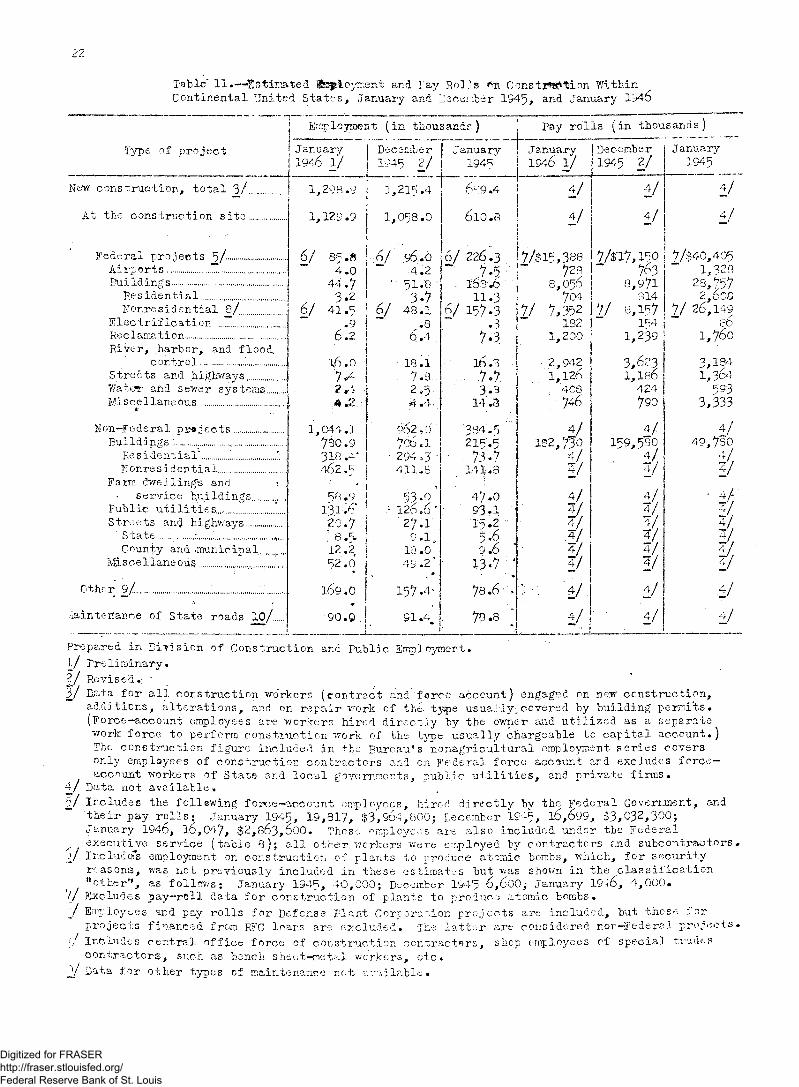
22
Table' 11 . -Ht 8tixna te& l&Sployment and Fay Rolls f>n Constj*t*£%ion Within
Continental United States, January and December 1945, and January 194b
Type of project
Employment (in thousands)
January 1946 1/
December
1945 2 /January
1945*
Pay rolls (in thousands)
J anuary
1940 1 /
December
1945 2 /
January
1945
New construction, total 3/..
At the construction site,.
Federal projects 5/- Airports............ T....Buildings................
Residential.
1 .298.9
1.129.9
1,215.4
1,058.0
Fonres i d e n tial 8 / ..........
Electrification ...Z...........Reclamation..........................
River, harbor, and flood.control..... ................
Streets and highways.
6/
6/
Wate*r and sewer systems'. Mi see llane ous........... .........
Non-Federal projects. Buildings
Residential'ITonre s i den t i a J
85.84 .0
44.73.2
41 *5
.96.2
16.07*4?*\
4 .2
w
1,044.1
780.9 31B.4- -162.5
Farm dwelling's and
service b.uildings....public utilities...,,.,......S tre e t s and hi ghways......
‘ State....,,........ ..... s..........
County arid .municipal...
Miscellaneous...................
0/
Other 9/..
Laintertanoe of State roads 10 /..
58.9
2o.y8.5,
12 .2 52.0
*
169.0
90:..Q .
I
§6, .<3 4 .2
51.8
3-748 .1
.86.4 .
19.1
7.3..2 .5 ,4 .4r
S62,0' 706.1 294 .,3 •
411 .S
53.0 ’ 120.6'
27.19 -1»
IB .0 49 .2 ’
*
157.4'
91.4.
699.4
6l0.8
6/ 226.3
l6a ’2 11.3
h / 157.3 .3
7.3
16.3... ,7 .7.
3..914.3
384-5215:.5
73.7141.8
47-0 93 A 15 .2 5 f 9.6
13.7
78.6
7b .8
\ u
y4/
[2/S15,3ae
| 8,0567 M
7,352 182
1,200
2,942
1,126. ’ 4C8
74 6 ±1
182,730 4/y4/
■ H4/
2/
. y4/
2/
4 /
1 /
7/n%i5o7^3
8,971314
8,1571^4
1,239
3,623i,is6
424
790
4/159,580 ... 1 / y
4/
4/5 /
1/
4/
y4/
7/$40,405
1,328
28,757 2,608
7 / 26,149 8b
1,760
3,1841,304
5S33,333
4 /49,780
4 /
5 /
, 4/
H4/
i f
4/
■' 4/
Prepared in Dirision of Construction and Public Employment•
l / Preliminary.
? / Revised.; '
3 / Bata for all construction workers (contract and fcrce- account) engaged on nesr construction,
additions, alterations, and on repair work of the; tyvpe usually^covered by building permits.
(Force—account employees are workers hired directly by the owner and utilized as a separate work force to perform construction work of the type usually chargeable to capital account.)
The construction figure included in the Bureau’ s nonagricultural employment series covers only employees of construction contractors and on Federal force account and excludes force—
account workers of State and local governments, public utilities, and private firms.4 / Data not available.
5 / Includes the following force-account employees, hired directly by the Federal Government, and
their pay rolls; January 1945, 19,817, $3 ,904 ,800 ; December 1945, 16,699, 33^^32,3^0;January 1940, 16,04'7, $2 ,863 ,000 . These employees are also included under the Federal executive service (table 8 ); all other workers were employed by contractors and subcontractors«
J/ Includes employment on construction of plants to produce atomic bombs, which, for security
reasons, was not previously included in these estimates but was shown in the classification 11 other” , as follows; January 1945, 40 ,000 ; December 1945 6 ,600 ; January 1946, 4 ,000 .
If Excludes pay—roll data for construction of plants to produce atomic bombs.
J Employees and pay rolls for Defense Plant Corporation projects are included, but those for
projects financed from RFC loans are excluded. The latter are considered nor—Federal projects«
y Infcxu.de s central office force of construction contractors, shop employees cf special trades
contractors, such as bench sheet-metal workers, etc.
V Data for other types of maintenance net available*
Digitized for FRASER http://fraser.stlouisfed.org/ Federal Reserve Bank of St. Louis