blue & green - cdn.cseindia.orgcdn.cseindia.org/userfiles/sakshi_water lecture jaipur.pdf ·...
TRANSCRIPT
7 February 2013
BLUE & GREENagenda for water efficiency for agenda for water efficiency for greener buildings
Sakshi C. DasguptaSustainable Building Programme, CSE
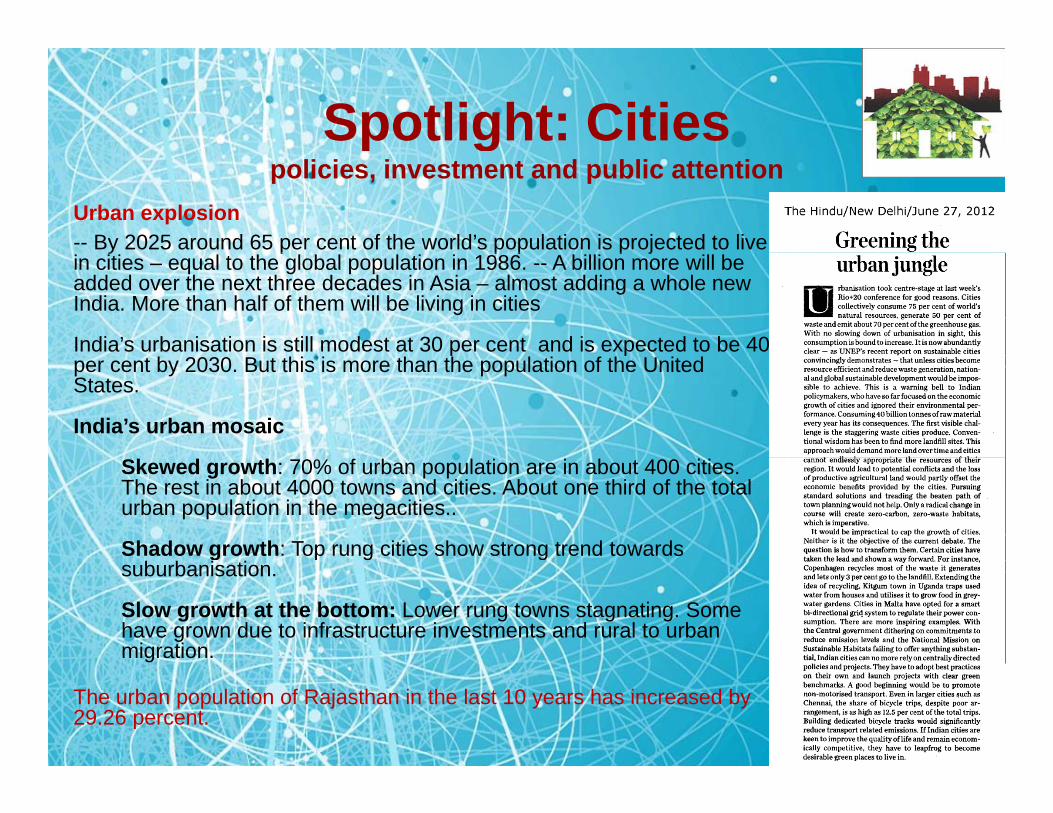
Spotlight: Citiesp gpolicies, investment and public attention
Urban explosion-- By 2025 around 65 per cent of the world’s population is projected to live y p p p p jin cities – equal to the global population in 1986. -- A billion more will be added over the next three decades in Asia – almost adding a whole new India. More than half of them will be living in cities
India’s urbanisation is still modest at 30 per cent and is expected to be 40 p pper cent by 2030. But this is more than the population of the United States.
India’s urban mosaic
Skewed growth: 70% of urban population are in about 400 cities. The rest in about 4000 towns and cities. About one third of the total urban population in the megacities..
Shadow growth: Top rung cities show strong trend towards suburbanisation.
Slow growth at the bottom: Lower rung towns stagnating. Some have grown due to infrastructure investments and rural to urban migration.
The urban population of Rajasthan in the last 10 years has increased by 29.26 percent.
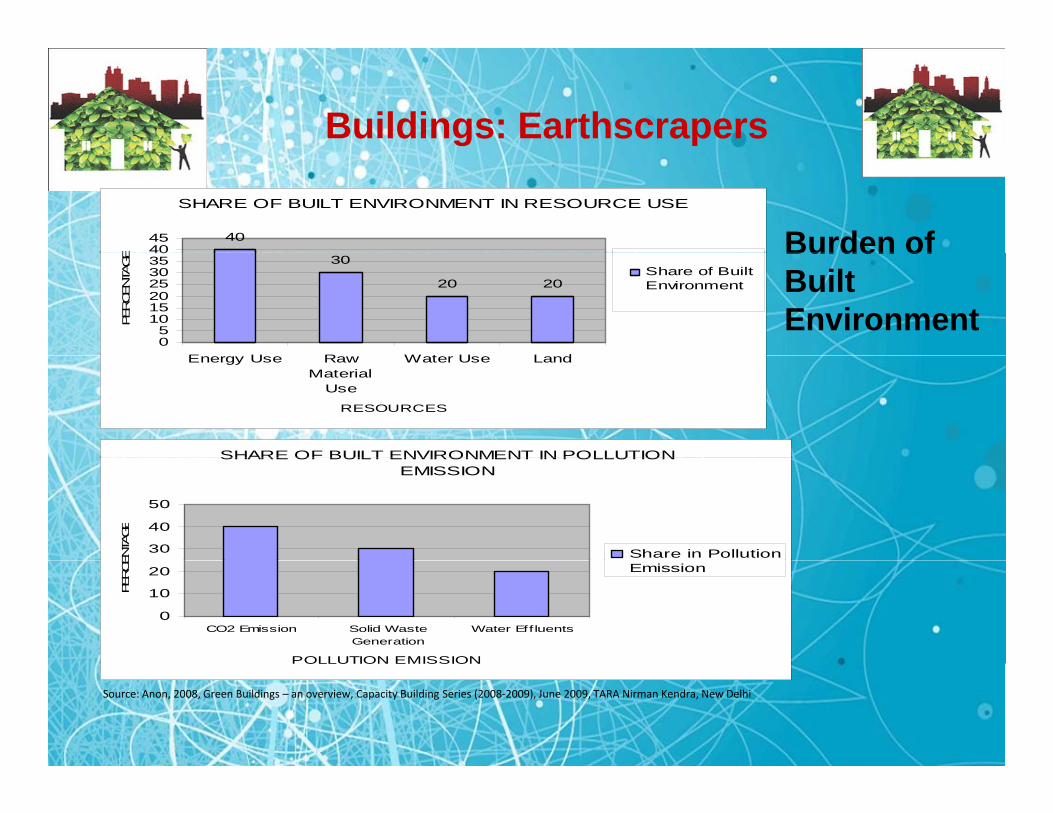
Buildings: Earthscrapers
SHARE OF BUILT ENVIRONMENT IN RESOURCE USE
404045
E Burden of30
20 20
05
10152025303540
E U R W t U L d
PER
CENTA
GE
Share of BuiltEnvironment
Burden of Built Environment
Energy Use RawMaterial
Use
Water Use Land
RESOURCES
SHARE OF BUILT ENVIRONMENT IN POLLUTIONSHARE OF BUILT ENVIRONMENT IN POLLUTION EMISSION
30
40
50
ENTA
GE
Share in Pollution
0
10
20
CO2 Emission Solid WasteGeneration
Water Effluents
POLLUTION EMISSION
PERCE Emission
POLLUTION EMISSION
Source: Anon, 2008, Green Buildings – an overview, Capacity Building Series (2008‐2009), June 2009, TARA Nirman Kendra, New Delhi
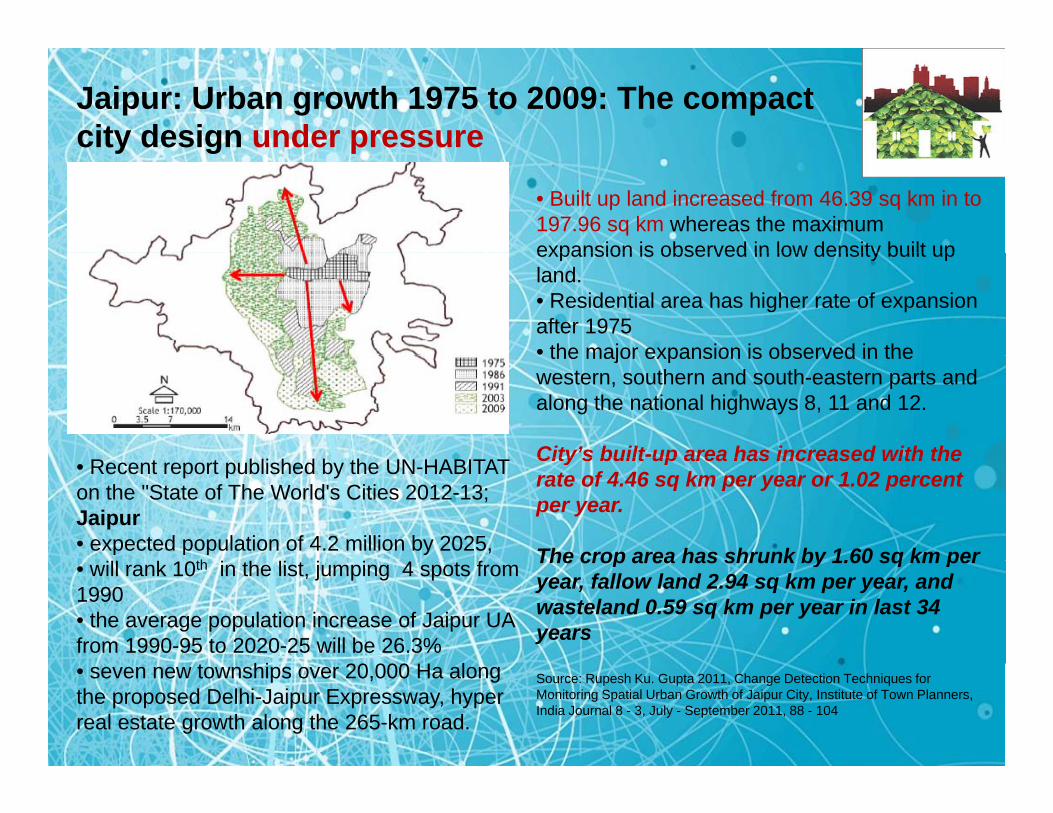
Jaipur: Urban growth 1975 to 2009: The compact city design under pressurey g p
• Built up land increased from 46.39 sq km in to 197.96 sq km whereas the maximumexpansion is observed in low density built upexpansion is observed in low density built up land.• Residential area has higher rate of expansion after 1975• the major expansion is observed in thethe major expansion is observed in the western, southern and south-eastern parts and along the national highways 8, 11 and 12.
City’s built-up area has increased with theCity s built up area has increased with the rate of 4.46 sq km per year or 1.02 percent per year.
The crop area has shrunk by 1.60 sq km per
• Recent report published by the UN-HABITAT on the "State of The World's Cities 2012-13; Jaipur • expected population of 4.2 million by 2025,
th The crop area has shrunk by 1.60 sq km per year, fallow land 2.94 sq km per year, and wasteland 0.59 sq km per year in last 34 years
• will rank 10th in the list, jumping 4 spots from 1990• the average population increase of Jaipur UA from 1990-95 to 2020-25 will be 26.3%
hi 20 000 H l Source: Rupesh Ku. Gupta 2011, Change Detection Techniques for Monitoring Spatial Urban Growth of Jaipur City, Institute of Town Planners, India Journal 8 - 3, July - September 2011, 88 - 104
• seven new townships over 20,000 Ha along the proposed Delhi-Jaipur Expressway, hyper real estate growth along the 265-km road.
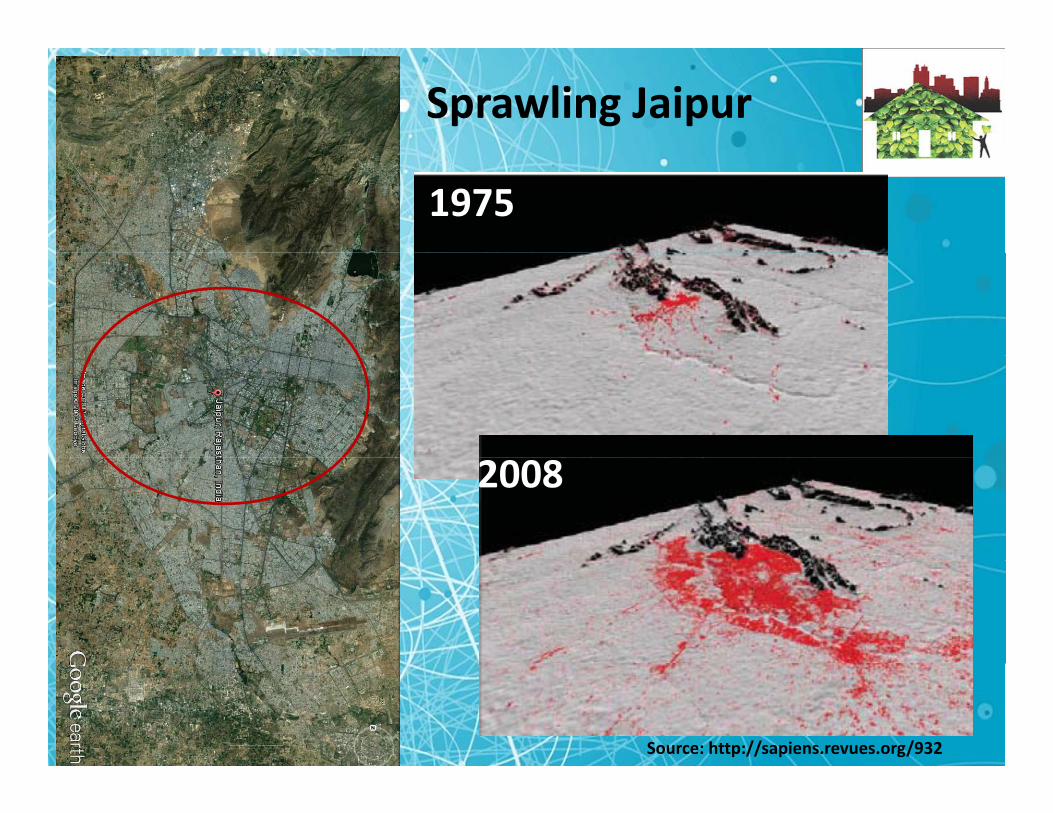
Sprawling Jaipur
1975
2008
Source: http://sapiens.revues.org/932
City: The focal point of climate mitigation and energy security discussions
Cities: the central focus of discussion in the Rio+20 conference ….
Energy Outlook 2009 tracks cities for the first time
• Already 2/3rd of world’s energy is consumed in cities – by half of world’s population.
• By 2030 cities will be consuming 73% of world energy.
• Globally cities account for 70% of CO2 emissions.
• Big increase in global CO2 from increase in floor space in buildings of various types, -- especially in non-OECD countries.
• Massive increase expected in ownership of household appliance
Cities collectively consume 75% of world natural resources, generates 50% ofCities collectively consume 75% of world natural resources, generates 50% of waste, and emits 70% of greenhouse gases.
Water for Growth
• Though energy issues are dominating the city and green buildings debatey g g
• But water is emerging as a major limitingBut water is emerging as a major limiting factor for real estate growth
• Reduce water imprints of urban consumption – buildings represent theconsumption – buildings represent the microcosm of urban demand
Trends in building spaces – how big is the problem?
We don’t know enough…………. Real estate sector lacks transparencyVery poor data base on trends in building spaces in India:
Ministry of housing and poverty alleviation tracks demand for housing but not other
big is the problem?
Ministry of housing and poverty alleviation tracks demand for housing but not other built up areas. Planning commission and others on trends in the construction sector. But buildings are a very small component of the construction industry…..
Real estate service providers investment banks and research foundations are theReal estate service providers, investment banks, and research foundations are the principal source of information……But very opaque and not verifiable……
A few cities – Hyderabad, Bangalore, Chennai, Delhi, Mumbai have a little better data due to new growth etcdata due to new growth etc.
Disparate estimates make a curious jigsaw ….. But indicative of an explosive trend: Eg.
Constructed area in 2005: close to 25 billion square feetConstructed area in 2005: close to 25 billion square feet. Expected to be 5 times and reach to approximately 104 billion square feet by 2030. A CAGR between 5 to 10 percent to be achieved ….. Hospitality and Retail to achieve higher CAGRs -- 8– 10%. By 2030, -- 7 to 11 times of the level in 2005times of the level in 2005. Maximum growth in residential and commercial sector -- four to five times of 2005 figures. (EDF)
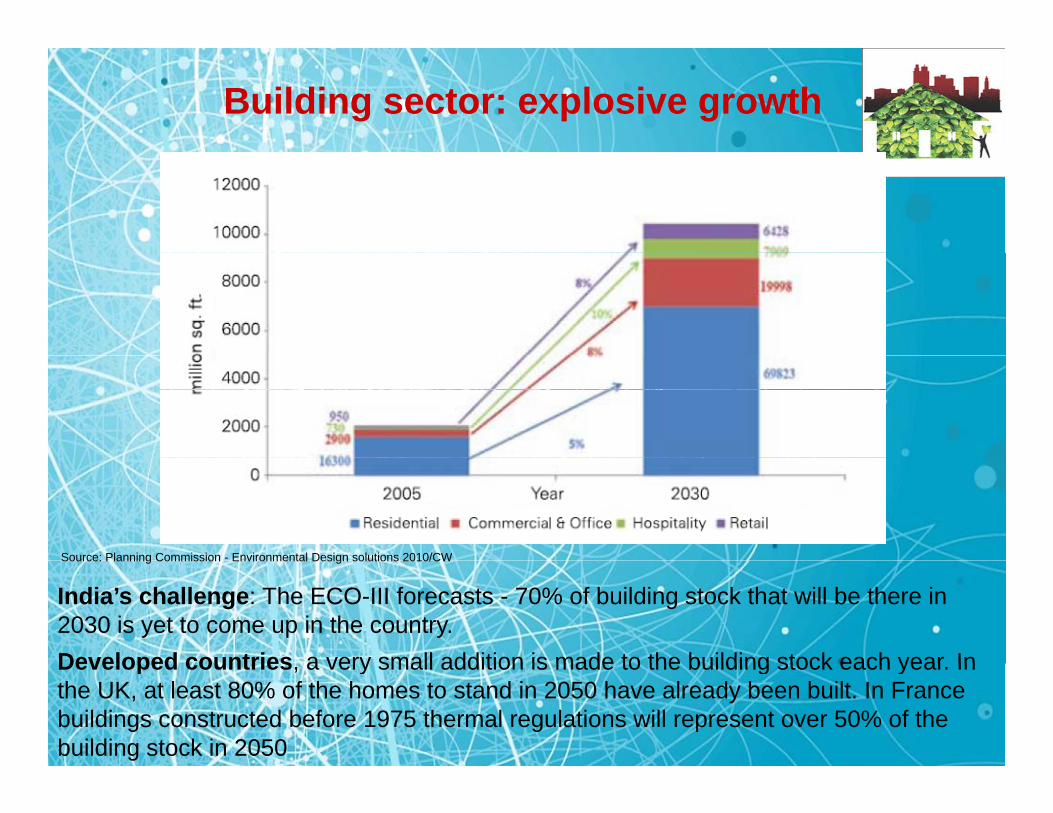
Building sector: explosive growth
Source: Planning Commission - Environmental Design solutions 2010/CW
India’s challenge: The ECO-III forecasts - 70% of building stock that will be there in 2030 is yet to come up in the country.Developed countries a very small addition is made to the building stock each year In
Source: Planning Commission Environmental Design solutions 2010/CW
Developed countries, a very small addition is made to the building stock each year. In the UK, at least 80% of the homes to stand in 2050 have already been built. In Francebuildings constructed before 1975 thermal regulations will represent over 50% of the building stock in 2050
Lifestyle pressure
Middle class growing rapidly: g g p y
The 2010 McKinsey study on urban infrastructure estimates that the seeker class (with household income of 200,000 – 500,000 per annum) will be the most dominating income class and is expected to be half of all urban g phouseholds by 2025
Cities will see more concentrated buying power, transformation of lifestyle and aspiration for high end resource intensive comfort level. p g
The seeker class will demand
L i• Luxury services
• Uninterrupted supplies
• Services at par with western world• Services at par with western world
Townships: Made to orderTownships: Made to order
A report by McKinsey states that there is a need to build around 20-25 new townships closer to 20 metros and cities across the country.
IDFC’s India Infrastructure report 2009 states -- the size of private ‘integrated’IDFC s India Infrastructure report 2009 states the size of private integrated townships ranges from 100 to over 1000 acres
Around 32 townships coming up around the major metros with an aerial b 30000 40000 l Thi i i icoverage between 30000-40000 acres alone. This is increasing.
On Delhi Mumbai Industrial Corridor (DMIC), 6 townships are on the cards.
Reliable government estimates on actual number of townships and their actual aerial coverage are still scarce.
T t d W lk t W k G T ith t b hTouted as Walk to Work Green Towns – without green benchmar
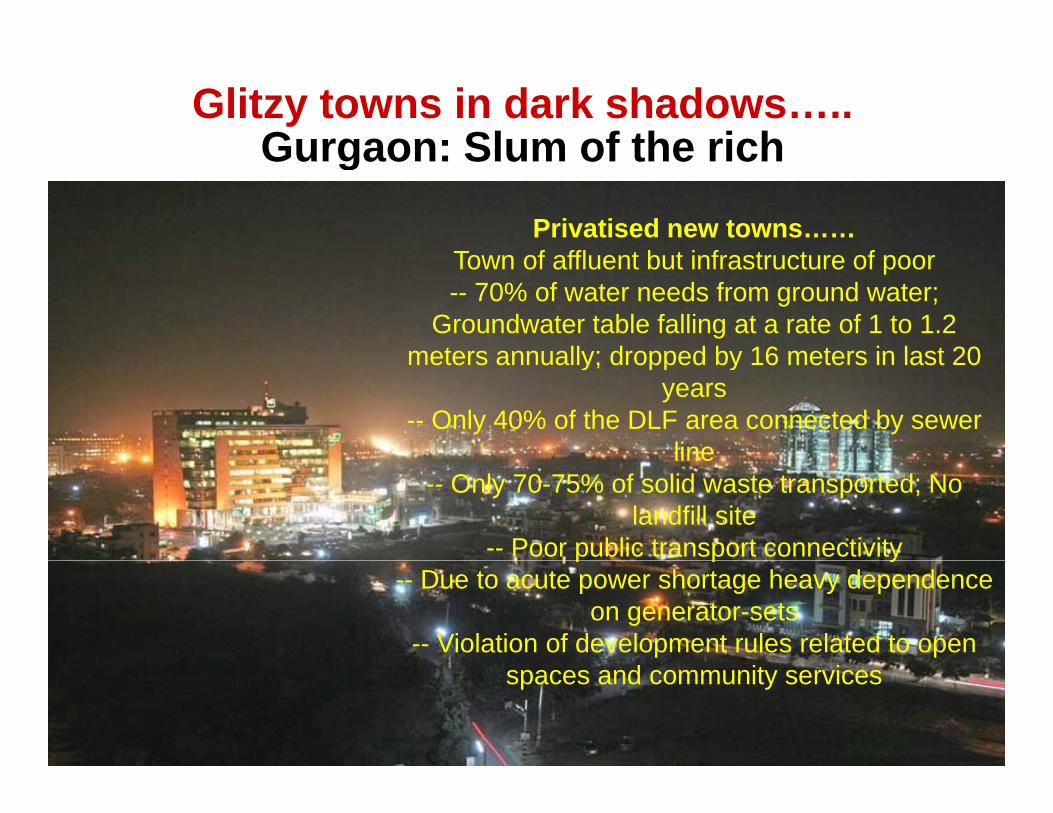
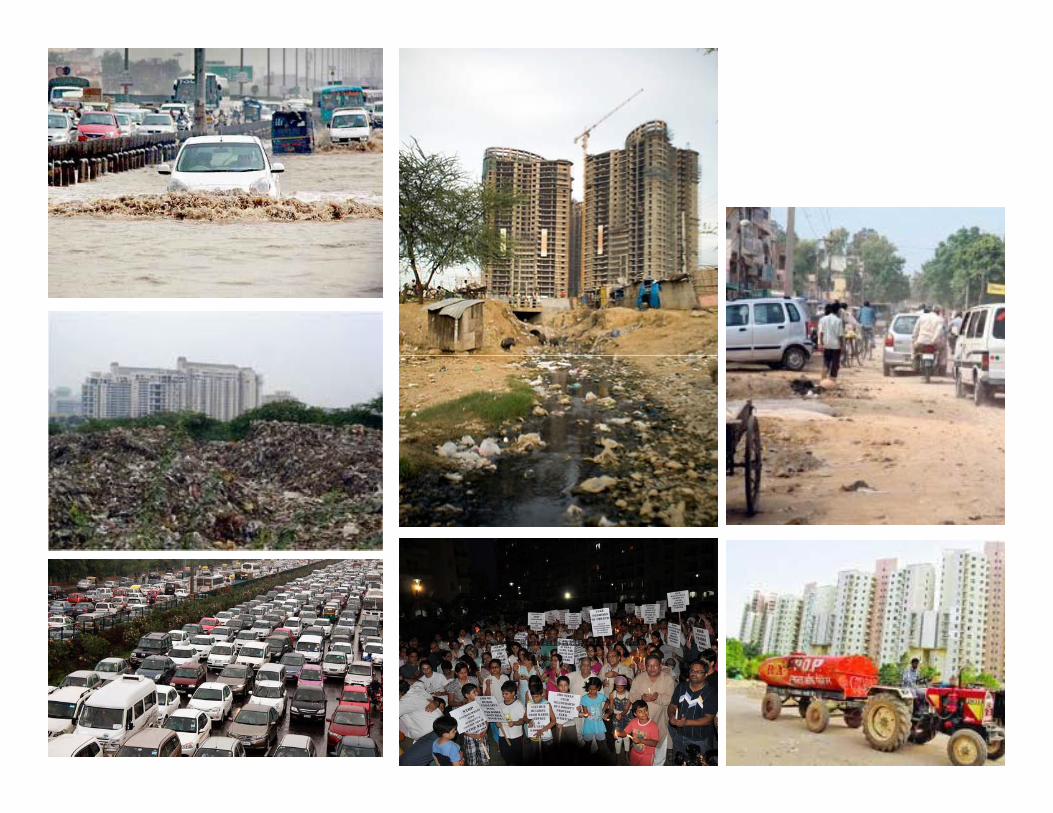
Glitzy towns in dark shadows…..Gurgaon: Slum of the richGurgaon: Slum of the rich
Privatised new towns……T f ffl t b t i f t t fTown of affluent but infrastructure of poor-- 70% of water needs from ground water;
Groundwater table falling at a rate of 1 to 1.2 meters annually; dropped by 16 meters in last 20meters annually; dropped by 16 meters in last 20
years-- Only 40% of the DLF area connected by sewer
lineline-- Only 70-75% of solid waste transported; No
landfill site-- Poor public transport connectivity p p y
-- Due to acute power shortage heavy dependence on generator-sets
-- Violation of development rules related to open spaces and community services
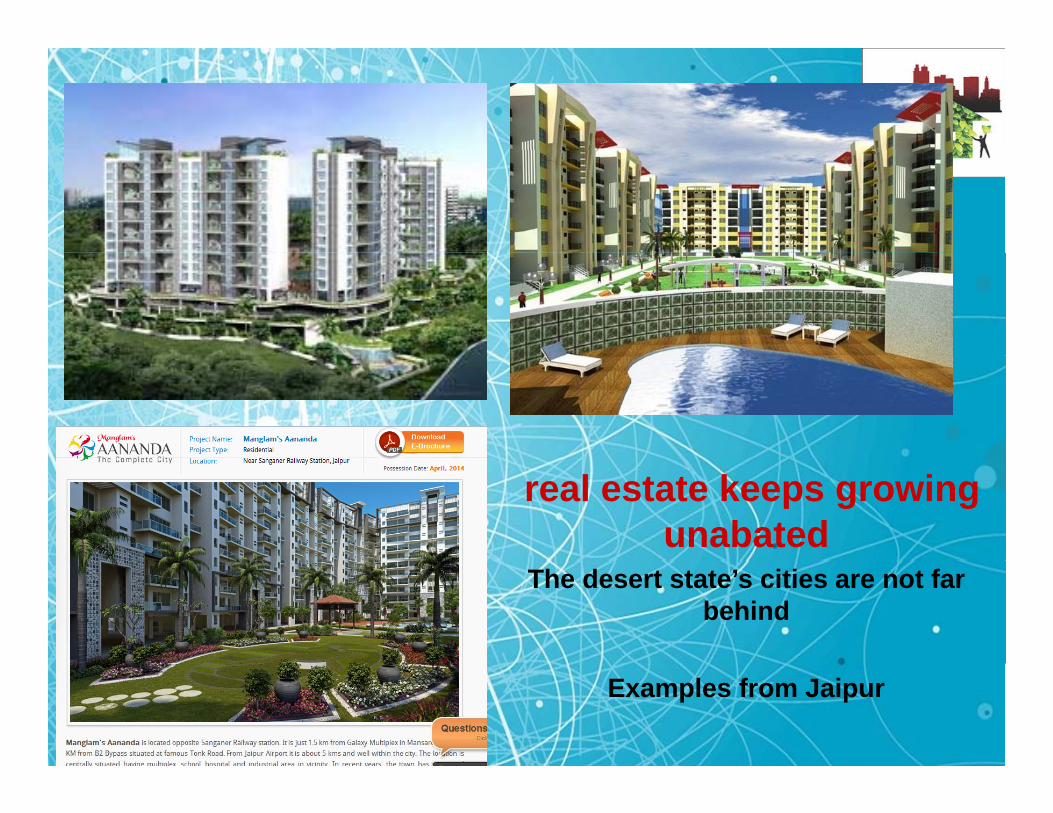
real estate keeps growing unabated
The desert state’s cities are not far behind
Examples from Jaipur

Promise the world, but is it
feasible orfeasible or sustainable?
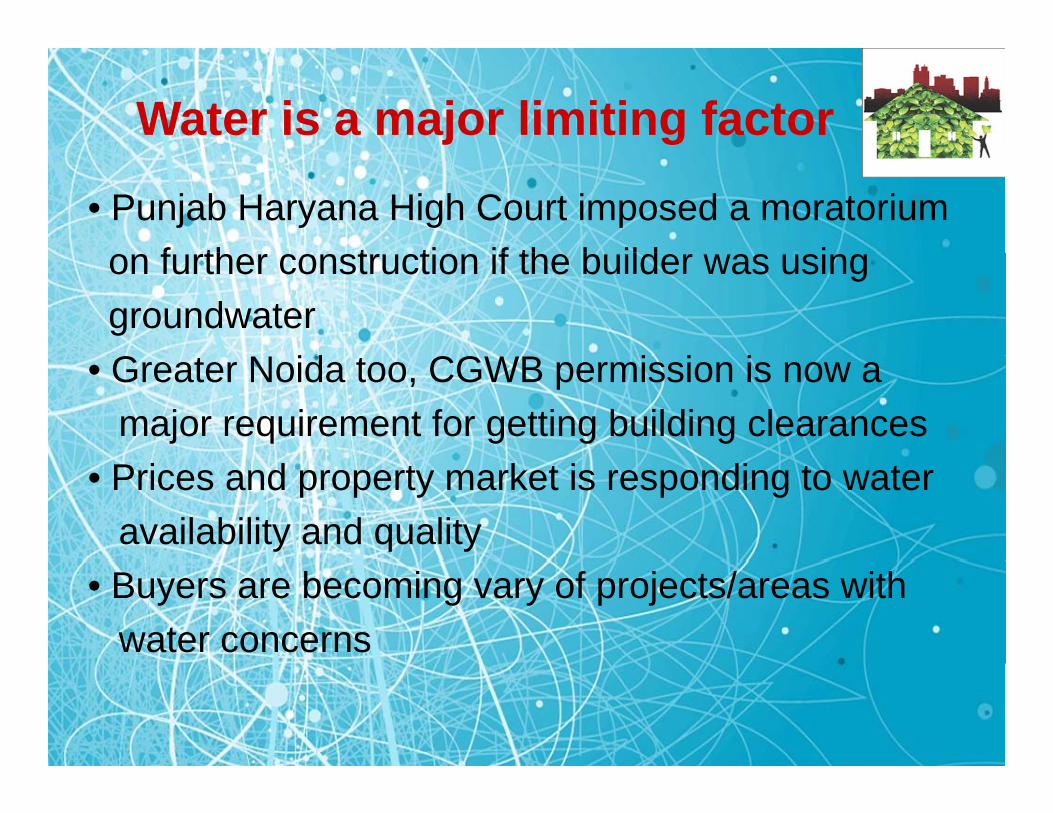
Water is a major limiting factor
• Punjab Haryana High Court imposed a moratorium f th t ti if th b ild ion further construction if the builder was using
groundwater G N id CGWB i i i• Greater Noida too, CGWB permission is now a major requirement for getting building clearances
• Prices and property market is responding to water availability and quality
• Buyers are becoming vary of projects/areas with water concerns
Green Regulations and Good Practicesgcomes to the rescue
R i t h ti b l• Rainwater harvesting bye laws• Wastewater treatment is emerging as a mandatory requirement in several clearances
• Dual plumbing is been prescribed• increased impetus to reuse of treated wastewater in horticulture etc.
But, Safeguards are Extremely Crucial , g yaccountability is the key
• Benchmarking- how much is been consumed and generated
• Monitoring against the set benchmarks set• Monitoring – against the set benchmarks set
• Appropriate Practice - doing it the correct way
• Regular Operation and Maintenance- sustaining the systems
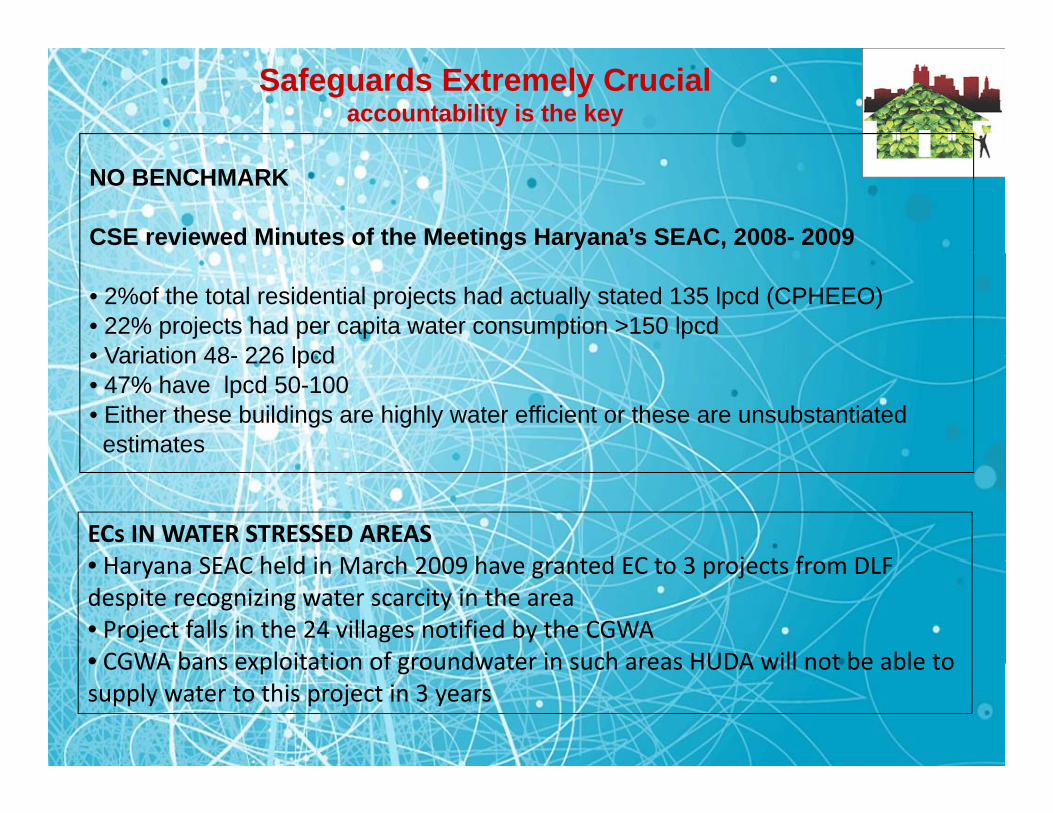
Safeguards Extremely Crucial accountability is the key
NO BENCHMARK
CSE reviewed Minutes of the Meetings Haryana’s SEAC, 2008- 2009
• 2%of the total residential projects had actually stated 135 lpcd (CPHEEO)• 22% projects had per capita water consumption >150 lpcd• Variation 48 226 lpcd• Variation 48- 226 lpcd • 47% have lpcd 50-100• Either these buildings are highly water efficient or these are unsubstantiated estimates
ECs IN WATER STRESSED AREAS H SEAC h ld i M h 2009 h t d EC t 3 j t f DLF• Haryana SEAC held in March 2009 have granted EC to 3 projects from DLF
despite recognizing water scarcity in the area• Project falls in the 24 villages notified by the CGWA• CGWA bans exploitation of groundwater in such areas HUDA will not be able to• CGWA bans exploitation of groundwater in such areas HUDA will not be able to supply water to this project in 3 years
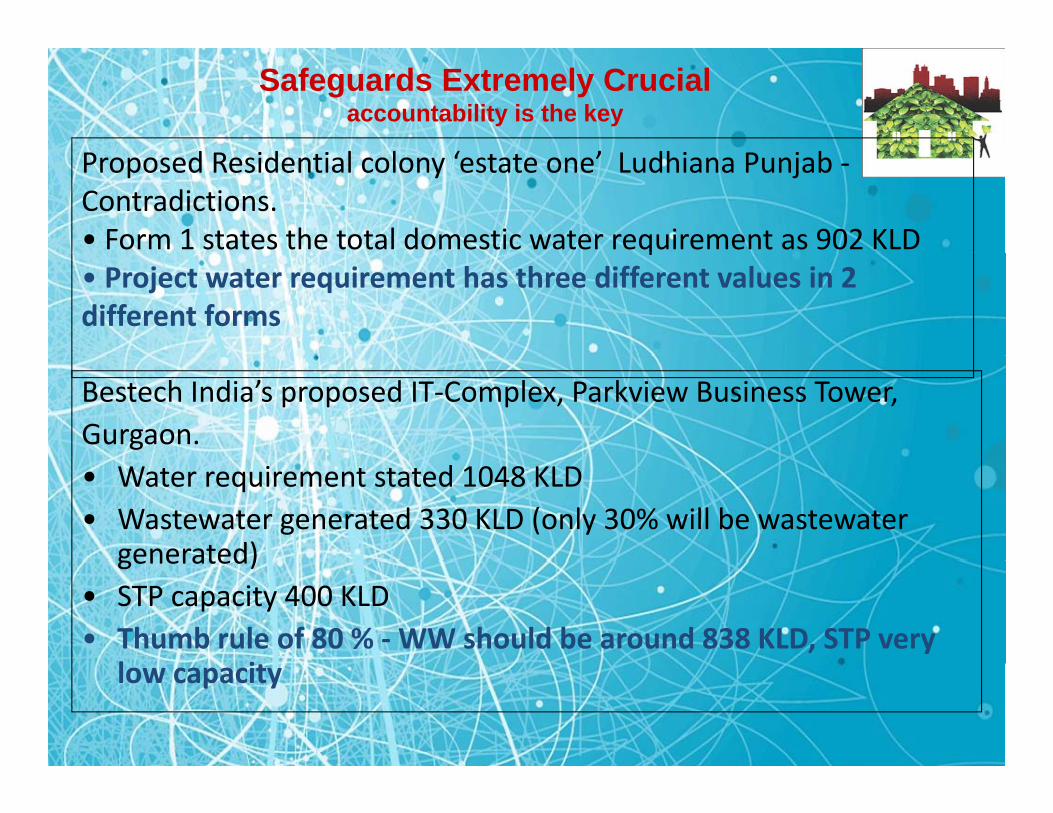
Safeguards Extremely Crucial accountability is the key
Proposed Residential colony ‘estate one’ Ludhiana Punjab ‐Contradictions. • Form 1 states the total domestic water requirement as 902 KLDq• Project water requirement has three different values in 2 different forms
Bestech India’s proposed IT‐Complex, Parkview Business Tower, Gurgaon. • Water requirement stated 1048 KLD • Wastewater generated 330 KLD (only 30% will be wastewater
generated)generated)• STP capacity 400 KLD• Thumb rule of 80 % ‐WW should be around 838 KLD, STP very
l ilow capacity
Low Hanging Fruits water efficiency is attainablewater efficiency is attainable
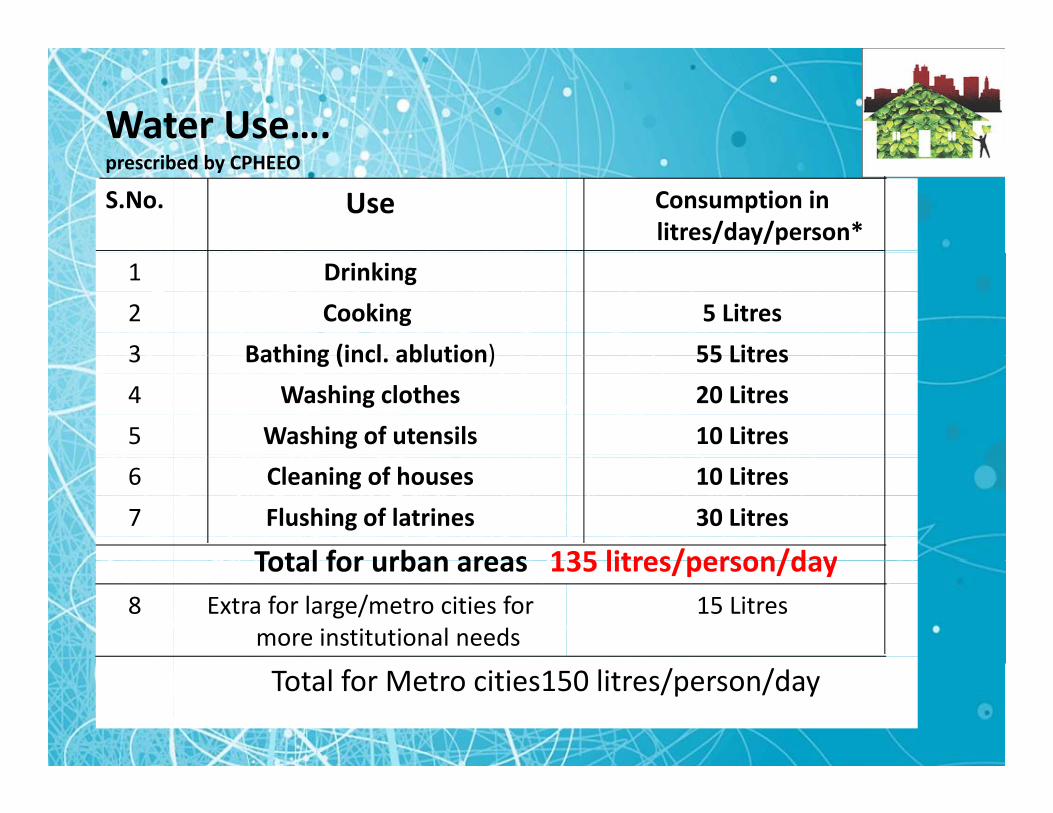
Water Use….prescribed by CPHEEO
Consumption in litres/day/person*
UseS.No.
55 LitresBathing (incl ablution)35 LitresCooking2
Drinking1
10 LitresWashing of utensils520 LitresWashing clothes455 LitresBathing (incl. ablution)3
Total for urban areas 135 litres/person/day30 LitresFlushing of latrines710 LitresCleaning of houses6
15 LitresExtra for large/metro cities for more institutional needs
8
Total for urban areas 135 litres/person/day
Total for Metro cities150 litres/person/day
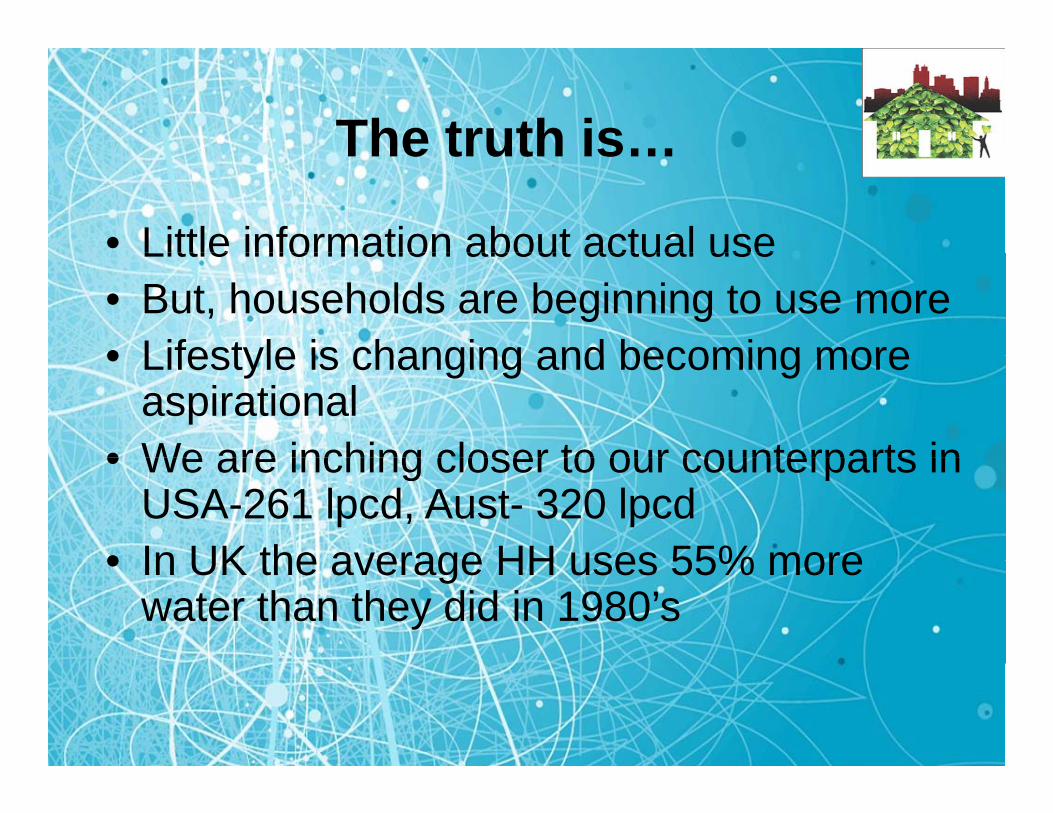
The truth is…
• Little information about actual use
The truth is…
Little information about actual use • But, households are beginning to use more • Lifestyle is changing and becoming more• Lifestyle is changing and becoming more
aspirational • We are inching closer to our counterparts in• We are inching closer to our counterparts in
USA-261 lpcd, Aust- 320 lpcd• In UK the average HH uses 55% more• In UK the average HH uses 55% more
water than they did in 1980’s
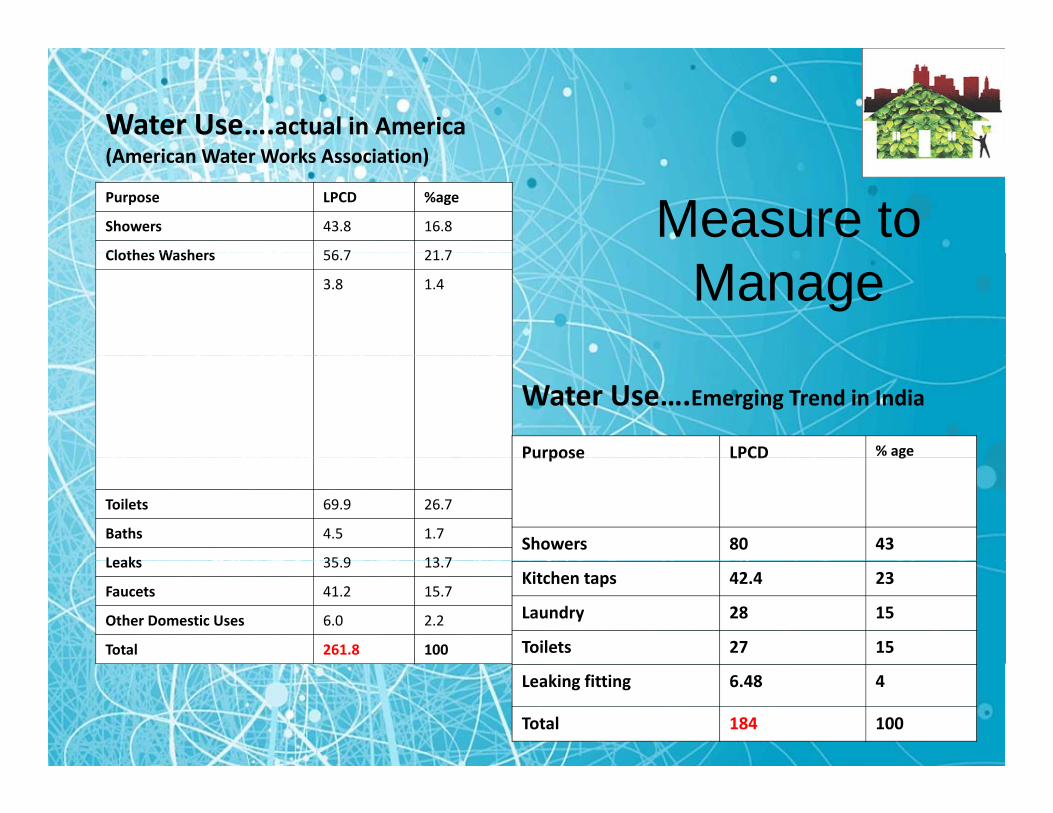
Water Use….actual in America(A i W t W k A i ti )(American Water Works Association)
Purpose LPCD %age
Showers 43.8 16.8
Clothes Washers 56 7 21 7Measure to
Clothes Washers 56.7 21.7
3.8 1.4 Manage
Water Use….Emerging Trend in India
Purpose LPCD % age
Toilets 69.9 26.7
Baths 4.5 1.7
Leaks 35 9 13 7
Purpose LPCD g
Showers 80 43Leaks 35.9 13.7
Faucets 41.2 15.7
Other Domestic Uses 6.0 2.2
Total 261.8 100
Kitchen taps 42.4 23
Laundry 28 15
Toilets 27 15
Leaking fitting 6.48 4
Total 184 100
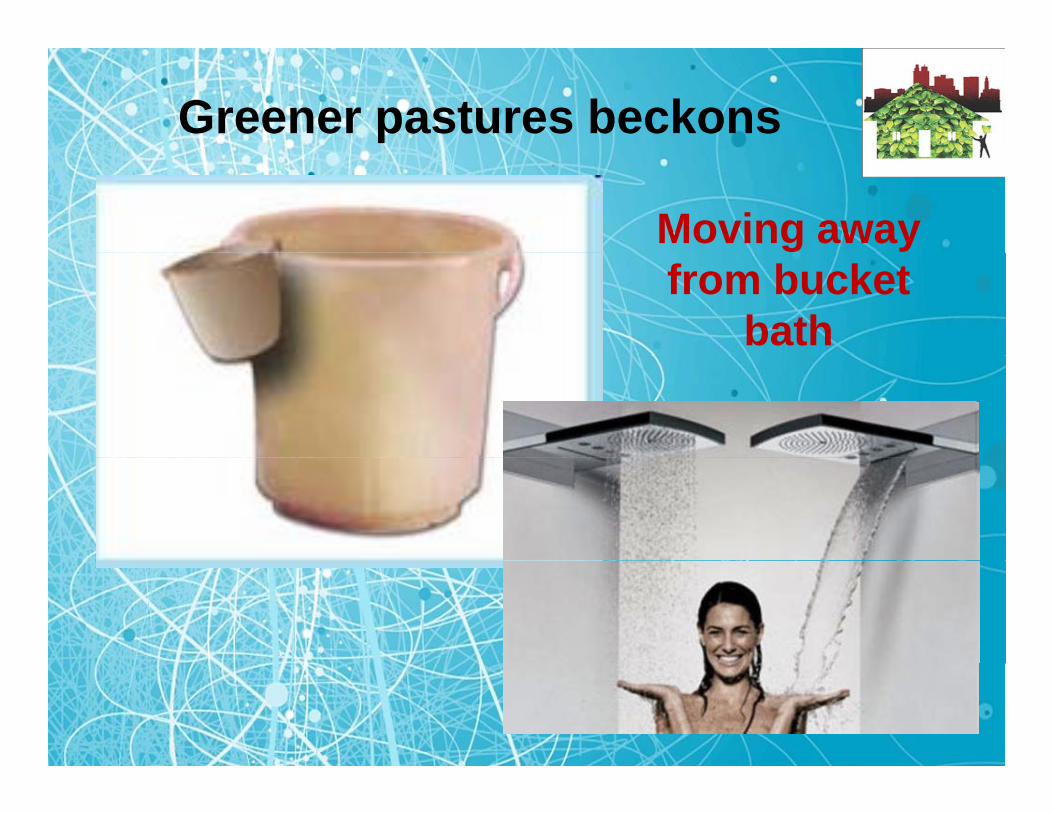
Greener pastures beckons
Moving away from bucket
bath


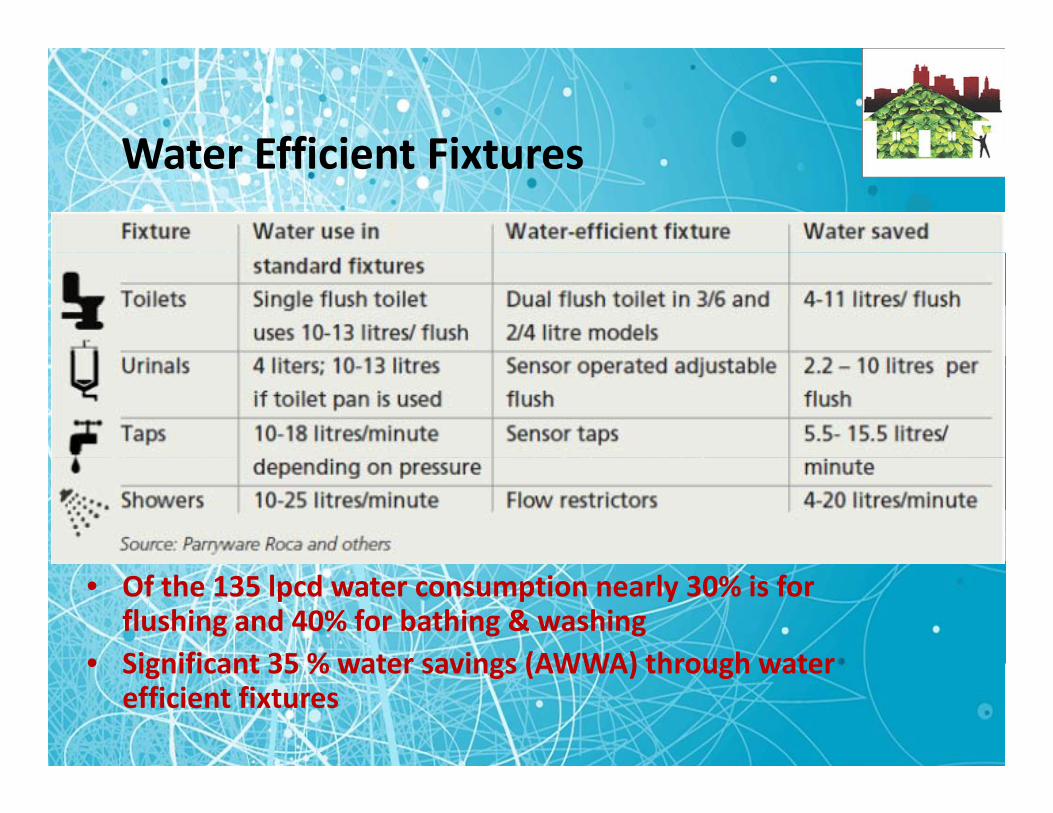
Water Efficient FixturesWater Efficient Fixtures
• Of the 135 lpcd water consumption nearly 30% is for flushing and 40% for bathing & washing
• Significant 35 % water savings (AWWA) through water• Significant 35 % water savings (AWWA) through water efficient fixtures


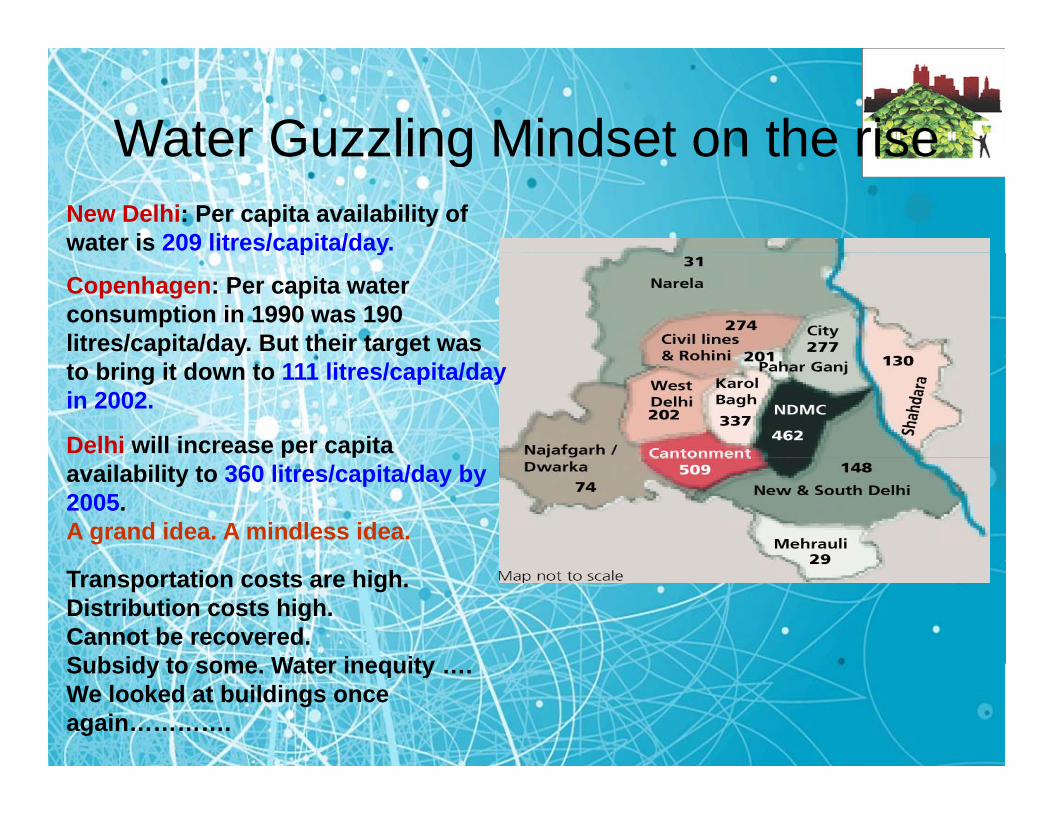
Water Guzzling Mindset on the riseWater Guzzling Mindset on the rise New Delhi: Per capita availability of water is 209 litres/capita/day.p y
Copenhagen: Per capita water consumption in 1990 was 190 litres/capita/day. But their target was p y gto bring it down to 111 litres/capita/day in 2002.
Delhi will increase per capita availability to 360 litres/capita/day by 2005. A grand idea. A mindless idea.
Transportation costs are high.Distribution costs high. Cannot be recovered. Subsidy to some Water inequitySubsidy to some. Water inequity ….We looked at buildings once again………….
A Glance at the Status No standards on Water Efficiency in BISVoluntary standards on manufacturing process, leakage, material etcmaterial etc.National Building Code makes no reference to water efficiencyManufacturers claim to have their own tests
• No independent validation of water use and performance efficacy
• No incentives for manufacturers to develop and promote• No incentives for manufacturers to develop and promote water efficient technologies except for green building rating system
• Almost 45‐50% sanitaryware market is informal• A large segment of the big and small cities and rural areas
catered by the informal manufacturerscatered by the informal manufacturers• Low consumer awareness on water use
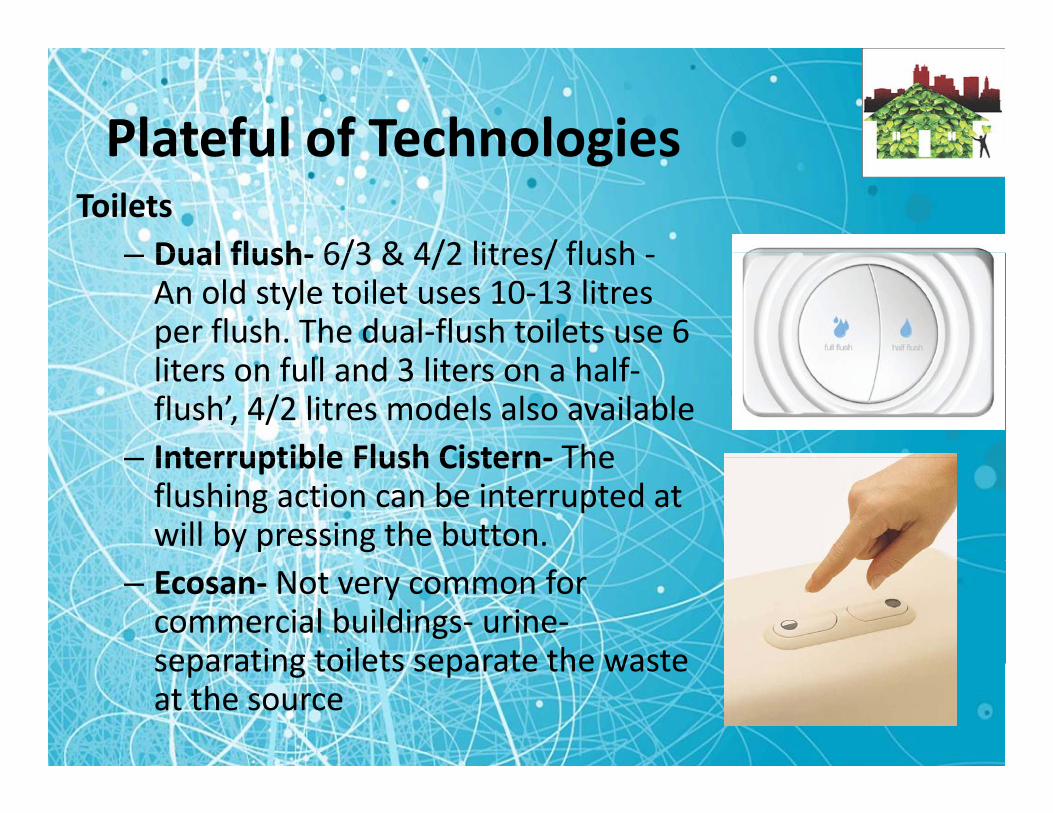
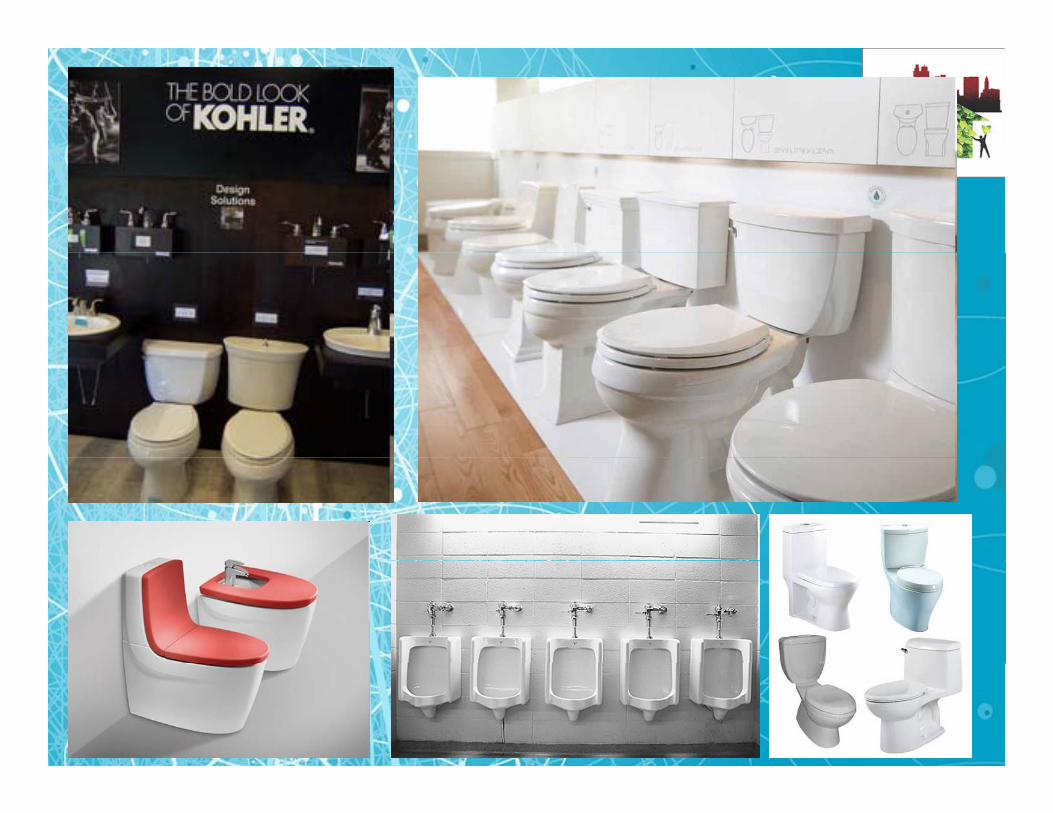
Plateful of TechnologiesPlateful of TechnologiesToilets
Dual flush 6/3 & 4/2 litres/ flush– Dual flush‐ 6/3 & 4/2 litres/ flush ‐An old style toilet uses 10‐13 litres per flush. The dual‐flush toilets use 6 liters on full and 3 liters on a half‐flush’, 4/2 litres models also available
– Interruptible Flush Cistern‐ The– Interruptible Flush Cistern‐ The flushing action can be interrupted at will by pressing the button.
– Ecosan‐ Not very common for commercial buildings‐ urine‐separating toilets separate the wasteseparating toilets separate the waste at the source
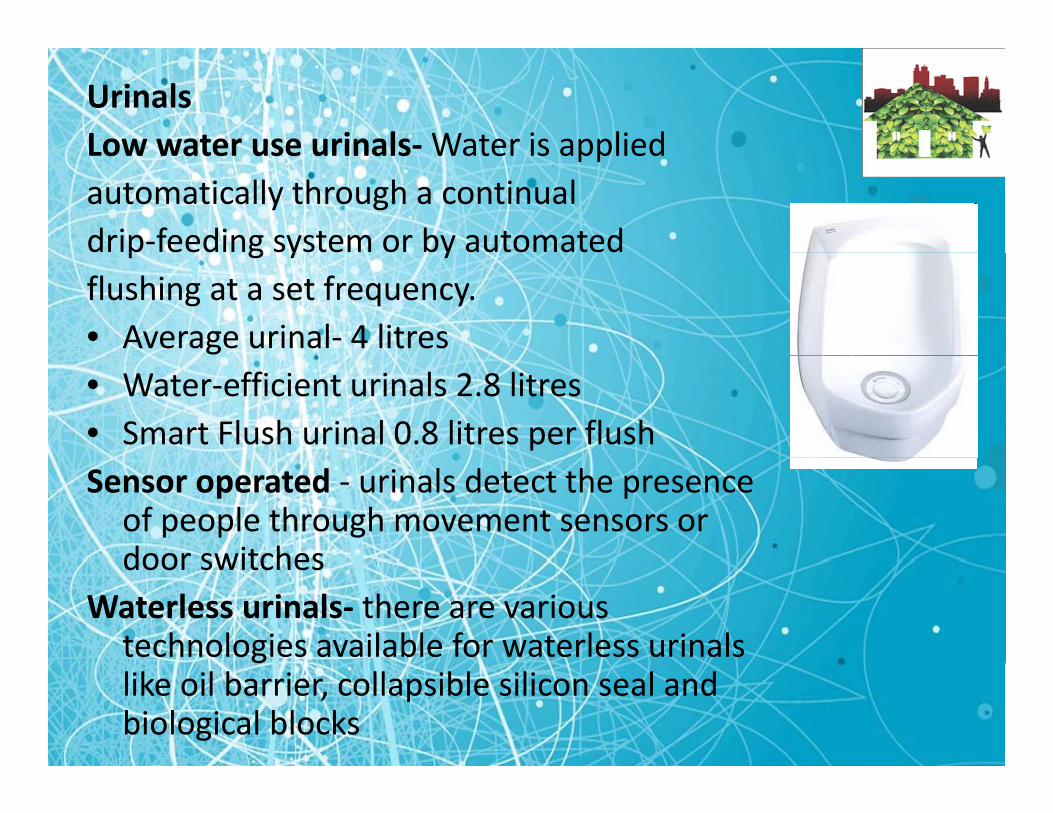
UrinalsLow water use urinals‐Water is appliedLow water use urinals Water is applied automatically through a continualdrip‐feeding system or by automated p g y yflushing at a set frequency. • Average urinal‐ 4 litres • Water‐efficient urinals 2.8 litres • Smart Flush urinal 0.8 litres per flush Sensor operated ‐ urinals detect the presence of people through movement sensors or door switchesdoor switches
Waterless urinals‐ there are various technologies available for waterless urinals glike oil barrier, collapsible silicon seal and biological blocks
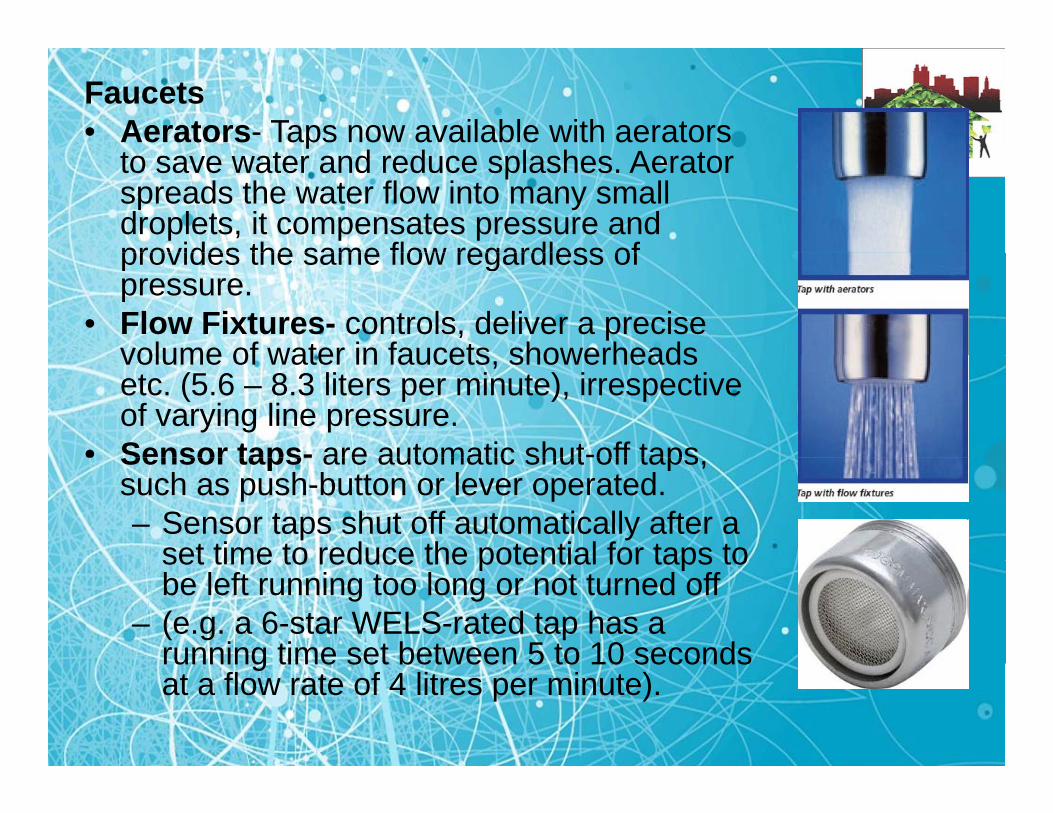
Faucets • Aerators- Taps now available with aerators
d d l h Ato save water and reduce splashes. Aerator spreads the water flow into many small droplets, it compensates pressure and provides the same flow regardless ofprovides the same flow regardless of pressure.
• Flow Fixtures- controls, deliver a precise volume of water in faucets showerheadsvolume of water in faucets, showerheads etc. (5.6 – 8.3 liters per minute), irrespective of varying line pressure.
• Sensor taps- are automatic shut-off tapsSensor taps- are automatic shut off taps, such as push-button or lever operated. – Sensor taps shut off automatically after a
set time to reduce the potential for taps toset time to reduce the potential for taps to be left running too long or not turned off
– (e.g. a 6-star WELS-rated tap has a running time set between 5 to 10 secondsrunning time set between 5 to 10 seconds at a flow rate of 4 litres per minute).
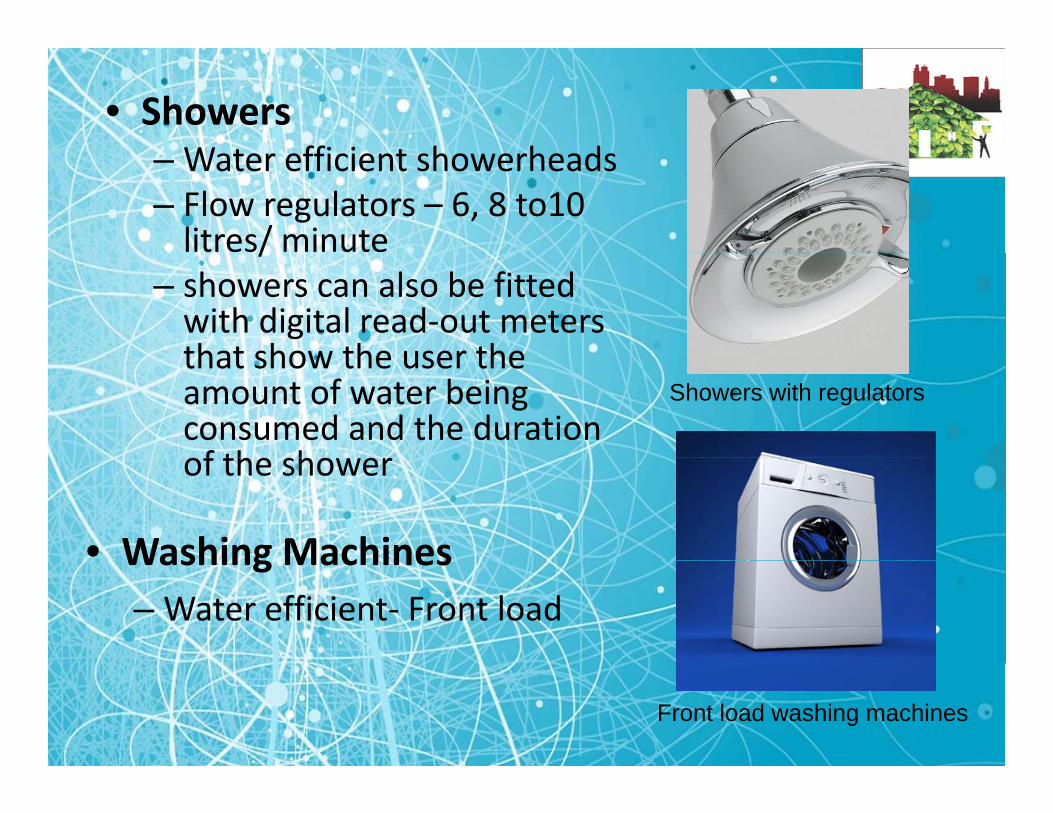
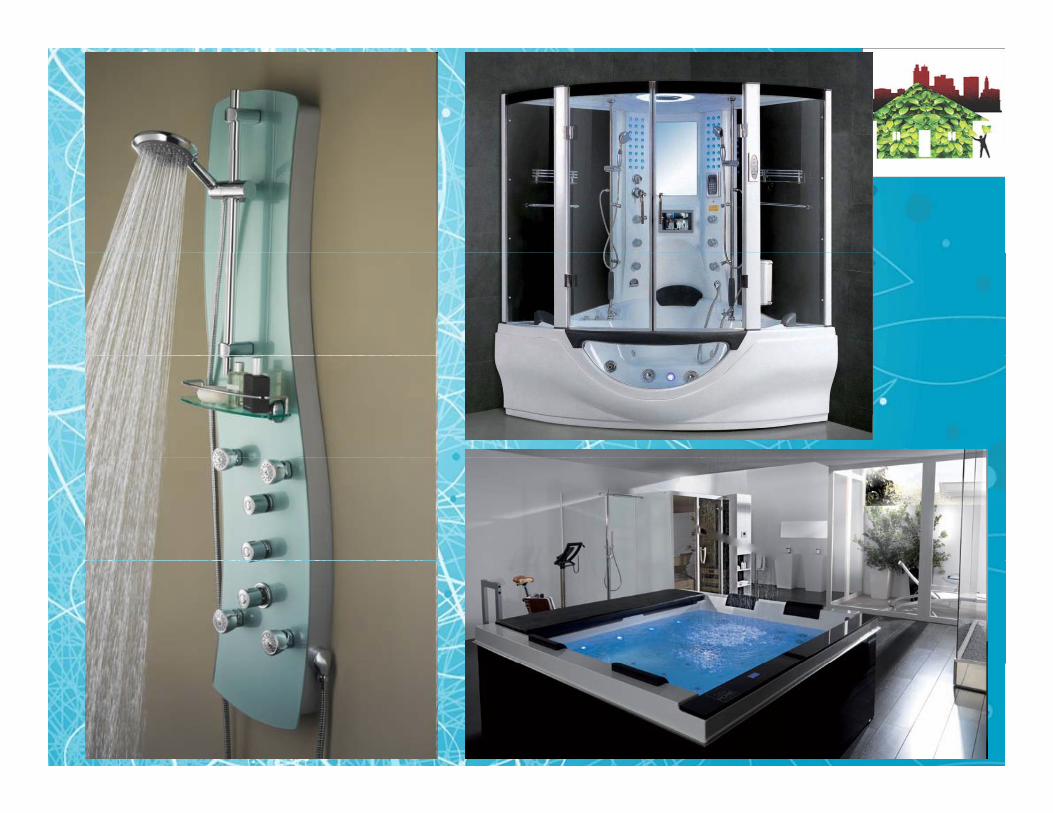
• Showers W t ffi i t h h d– Water efficient showerheads
– Flow regulators – 6, 8 to10 litres/ minute /
– showers can also be fitted with digital read‐out meters that show the user thethat show the user the amount of water being consumed and the duration of the sho er
Showers with regulators
of the shower
• Washing MachinesWashing Machines– Water efficient‐ Front load
Front load washing machines
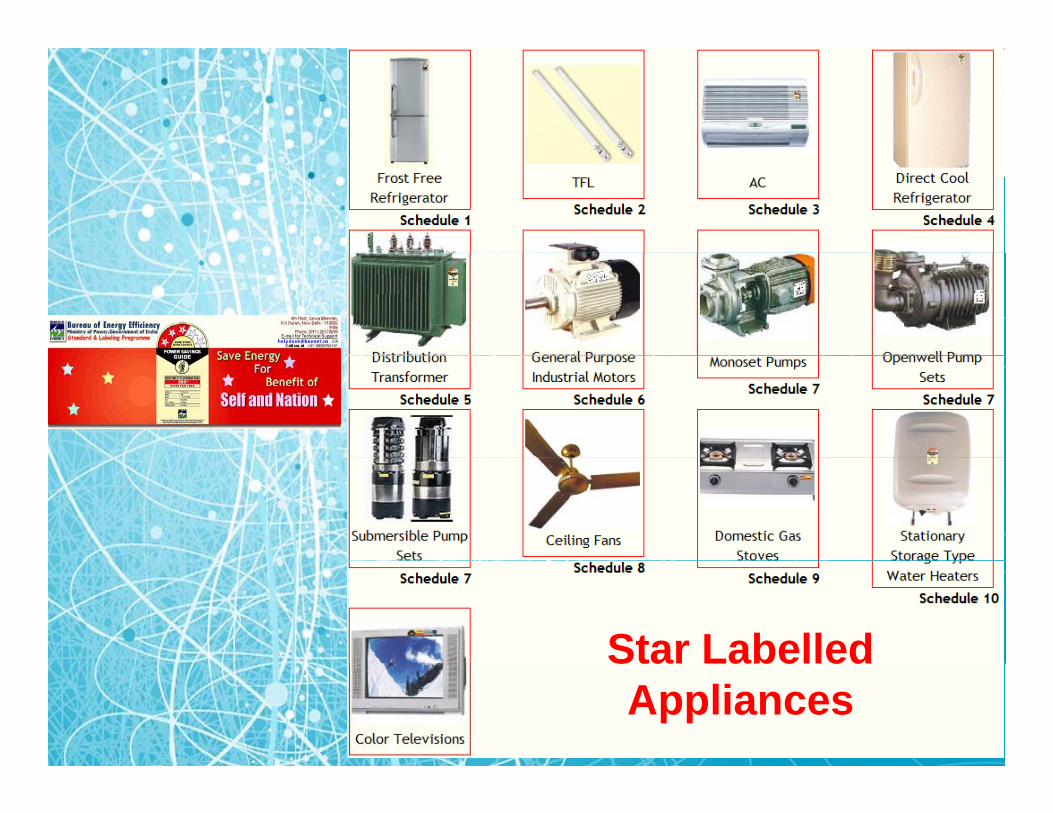
Star LabelledStar Labelled Appliances
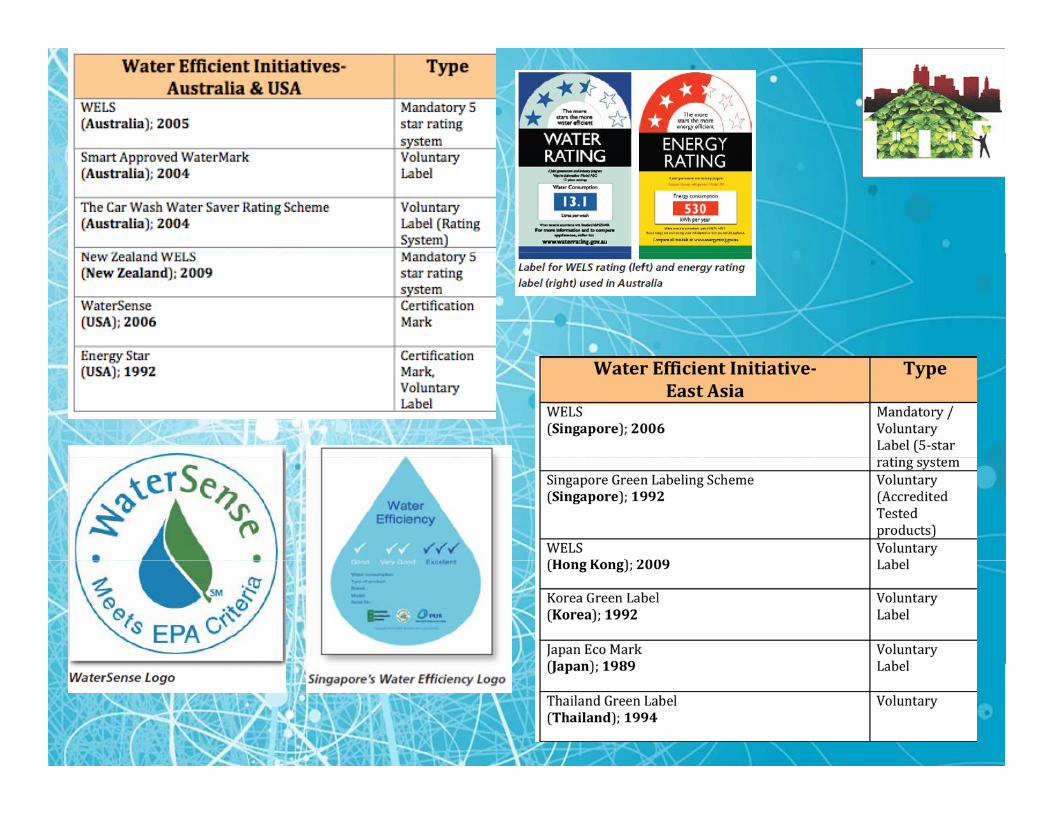
International BenchmarksInternational Benchmarks• Australia’s Water Efficiency Labelling and y gStandards (WELS)made mandatory by the Water Efficiency Labelling and Standards Act 2005‐ Australia’s Department of the Environment, Water, Heritage and the Arts.
• USA’s WaterSense (2006), implemented by the Environmental Protection Agency under the Energy Policy Act, 1992.
International Benchmarks• Water Efficient Product Labelling Scheme in
International BenchmarksWater Efficient Product Labelling Scheme in United Kingdom, operated by The Bathroom Manufacturers Association of UK , recognizedManufacturers Association of UK , recognized by UK government
• Water Efficiency Labelling Scheme (WELS), 2006 i l t d b th P bli Utiliti2006, implemented by the Public Utilities Board (PUB)

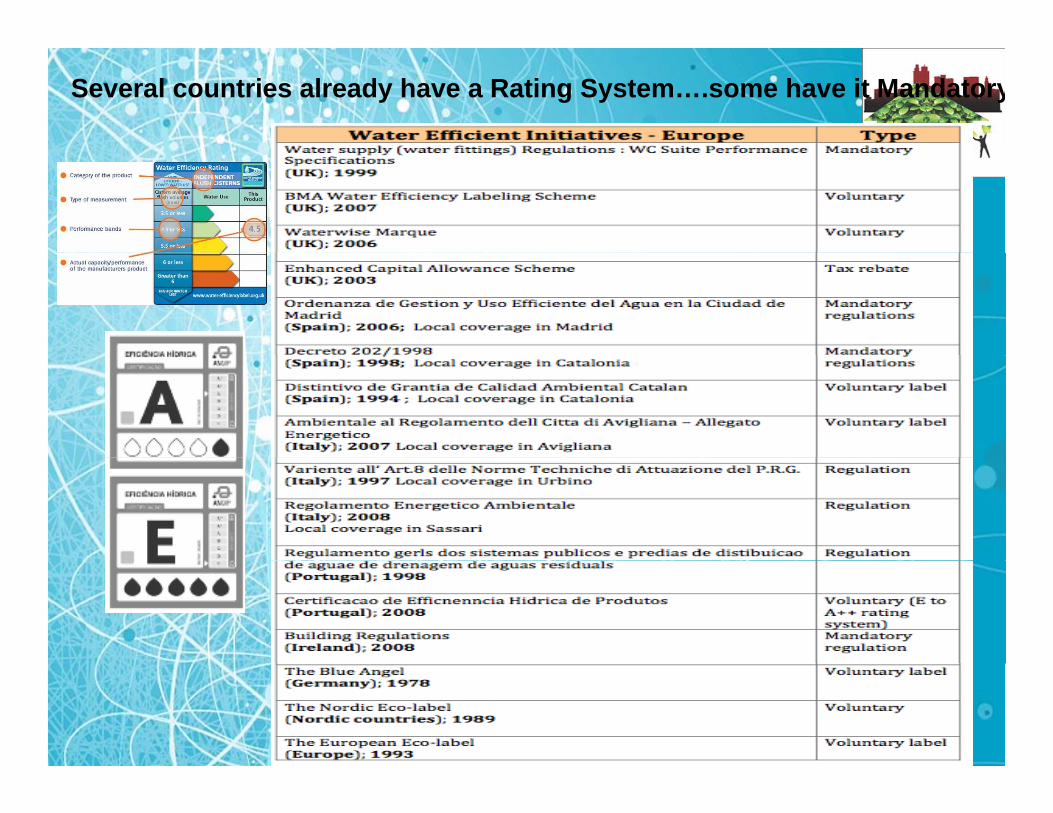
Several countries already have a Rating System….some have it Mandatory
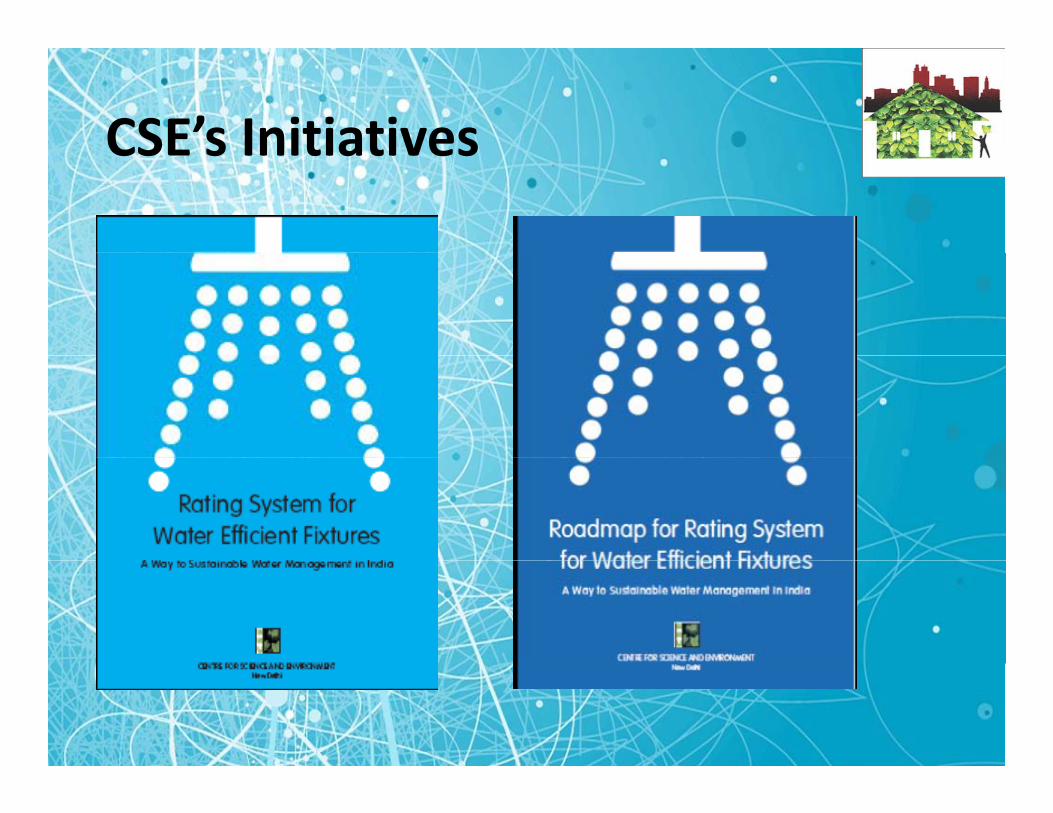
CSE’s InitiativesCSE s Initiatives

Draft Rating System for yWater Efficient Fixtures
Other Common Sense InterventionsOther Common Sense Interventions
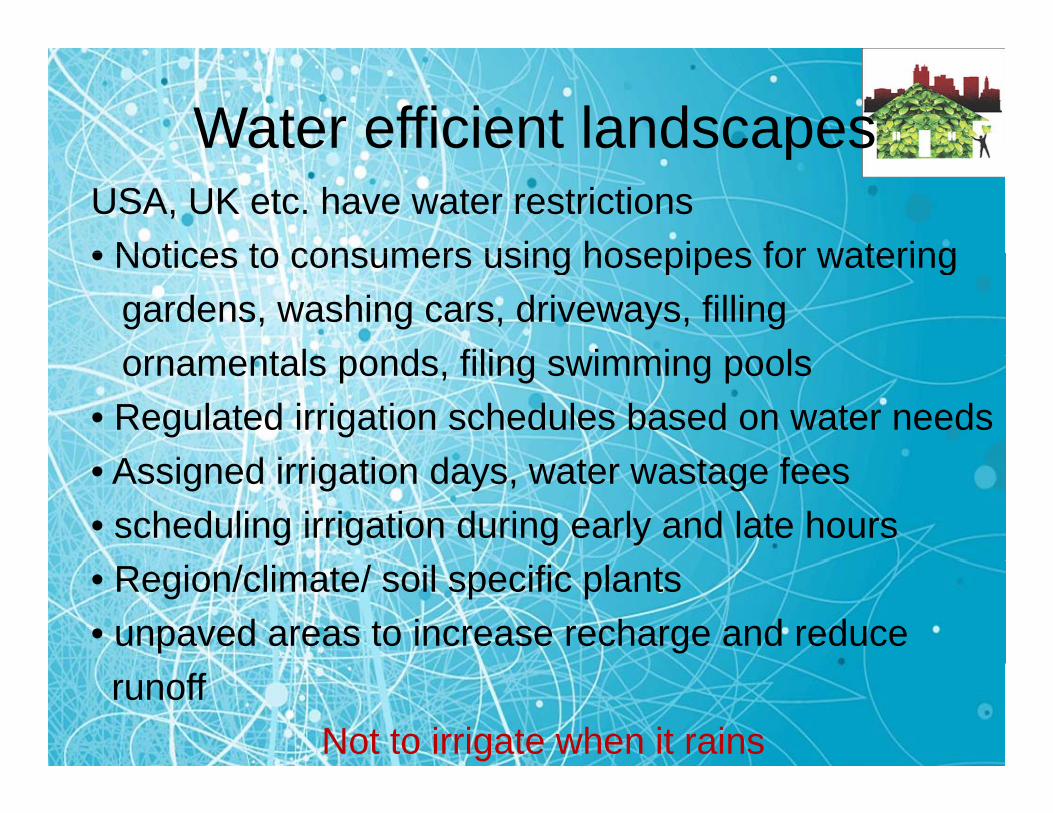
Water efficient landscapespUSA, UK etc. have water restrictions • Notices to consumers using hosepipes for watering• Notices to consumers using hosepipes for watering
gardens, washing cars, driveways, filling t l d fili i i lornamentals ponds, filing swimming pools
• Regulated irrigation schedules based on water needsA i d i i ti d t t f• Assigned irrigation days, water wastage fees
• scheduling irrigation during early and late hours • Region/climate/ soil specific plants • unpaved areas to increase recharge and reduce runoff
Not to irrigate when it rains
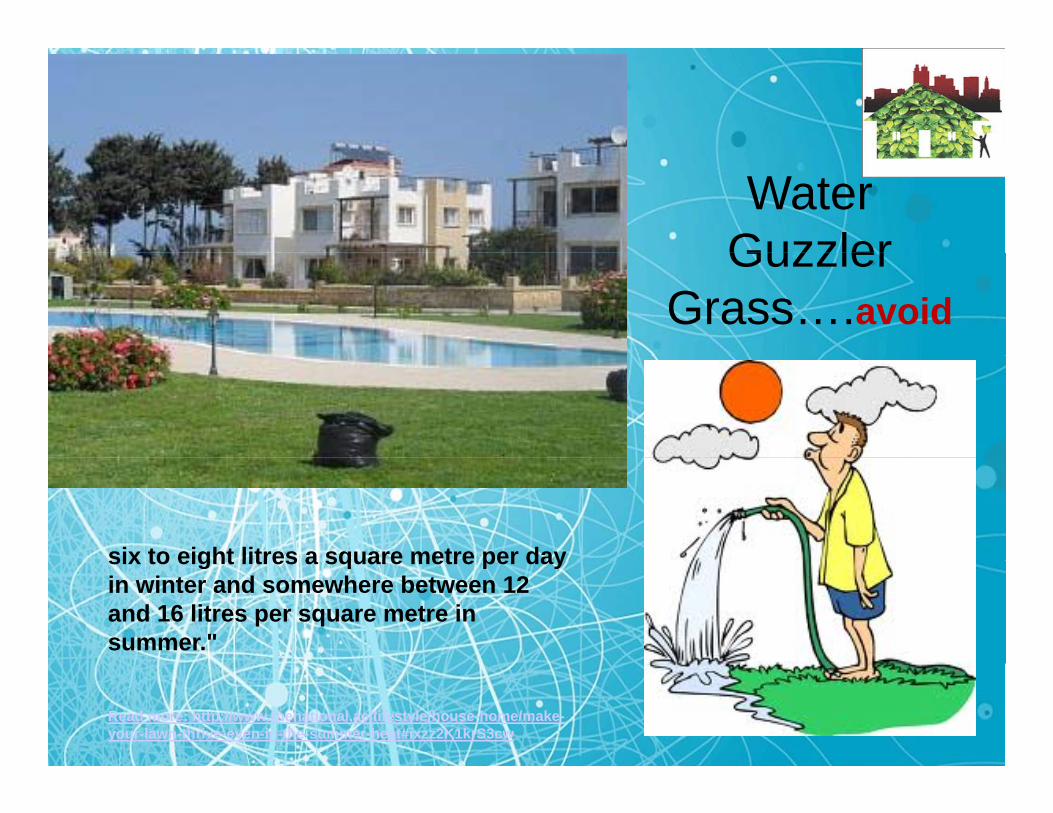
WaterGuzzlerGuzzler
Grass….avoid
six to eight litres a square metre per daysix to eight litres a square metre per day in winter and somewhere between 12 and 16 litres per square metre in summer."
Read more: http://www.thenational.ae/lifestyle/house-home/make-your-lawn-thrive-even-in-the-summer-heat#ixzz2K1krS3cw
Capacity Building of Water System ManagersWater System Managers
• With increase in gated communities and growing role of RWAs in managing them, need to address some concernsTh RWH d WWTS ft i t ll d b b ild b t• The RWH and WWTS are often installed by builders but have to be managed by the RWAs
• Some instances where these systems are not been• Some instances where these systems are not been managed properly leading to serious concerns or have gone into disrepairgone into disrepair
• Ensuring awareness and capacity building is mandated for RWAs to handle these systems
• It is a great opportunity for decentralizing water systems

Thank you for your attention !Thank you for your attention !