book of business vp financial review template. tmd-8303-ad-0011 rev. 0 date: july 2010 2 agenda...
TRANSCRIPT

Book of Business
VP Financial Review Template

TMD-8303-AD-0011 Rev. 0 Date: July 2010 2
Agenda
1. Review of Prior Meeting Questions/Actions
15 Minutes2. Monthly Overview
45 Minutesa. Customer Variancesb. Line of Business & Level 4 Variancesc. In-Market and Adjacent Wins (incl. White Space)d. Margin Improvement
e. Losses & At Risk Accountsf. Accounts Receivable
3. KAM Review
30 Minutesa. Account Discussion
4. KAM Review
30 Minutesa. Overviewb. Account Discussion
Appendix – Account Details
TMD-8303-AD-0011 Rev. 0 Date: July 2010

TMD-8303-AD-0011 Rev. 0 Date: July 2010 3
Review of Prior Meeting Questions/ActionsOpen Items
Number Account Question/Action/To-Do StatusMeeting
DateAccount Manager
VPBest Action
OwnerDue Date Answer/Response/Action % Completed
1 Rite Aid
Get greater visibility of the snow and landscaping
numbers. In particularly what happened with land year vs
prior year.
J 3/25/10 Craig Nesbitt Kevin Longland Craig Nesbitt 4/30/10 Reforecasted landscaping numbers. 100%
2 UpsellWhere will the $42k EBITA
that wont be achieved at Rite Aid be made up from.
K 3/25/10 Craig Nesbitt Kevin Longland Craig Nesbitt 4/30/10We had a conference call with Owen Davies regarding a retro-fit of
EMS equipment at 50-60 sites. Will visit a potential store on April 27. 50%
3 Jo Ann'sIs the 10/11 GP impact only -
$166k. Does this fall to EBITA.
K 3/25/10 Bill Graber Kevin Longland Stephen Kemp 4/30/10 70%
4 BBBY
What numbers will BBBY hit at 30 June. How are we
tracking towards upsell of $285k EBITA. What revenue
has been brought forward from 10/11.
K 4/22/10 Bill Graber Kevin Longland Bill Graber 4/30/10 0%
5 Weis MarketLook at full year trajectory.
Does this incorporate $265k included in wins?
K 4/22/10 Bill Graber Kevin Longland Bill Graber 4/30/10 0%
6 BBBYWhy is the snow margin low
this year? K 4/22/10 Bill Graber Kevin Longland Bill Graber 5/15/10 0%
7 Jo Ann'sMargin Improvement - who is the owner for this account?
Bill?K 4/22/10 Bill Graber Kevin Longland Stephen Kemp 5/15/10 0%
8 MichaelsDid we take the floorcare
credit yet this year? K 4/22/10 Victor Smith Kevin Longland Victor Smith 5/15/10 0%
9American
Eagle
What is happening YTD? Where will end up at 30
June?K 4/22/10
Dave DeSousa
Kevin Longland Dave DeSousa 5/15/10 0%
10 R&MDave DeSousa to work with Rob Donely on setting up
R&M workshops.K 4/22/10
Dave DeSousa
Kevin Longland Dave DeSousa 5/15/10 0%
11 Rite AidIs the current trajectory correct? Please verify. J 4/22/10 Craig Nesbitt Kevin Longland Craig Nesbitt 4/30/10
The current trajectory us correct. There was an issue with the report snow number v forecast. This has now been corrected.
100%
12 Rite AidWhen was Rite Aid given the
3% discount? J 4/22/10 Craig Nesbitt Kevin Longland Craig Nesbitt 4/30/10 Rite Aid was given a 3% discount effective March 1. 100%
13 Upsell
Ensure all self perform upsell related to Kevin's accounts are listed. Ensure Jerry and
his team are meeting targets.
K 4/22/10 All Kevin Longland Stephen Kemp 5/15/10 0%
14Margin
Improvement
What is the margin improvement acceptance rate
by individual.K 4/22/10 All Kevin Longland Stephen Kemp 5/15/10 0%
15 DSOOn the AR sheet, include
Kevin's total DSO as well as Carl's and Steve's.
K 4/22/10 All Kevin Longland Stephen Kemp 5/15/10 0%
16 Rite AidA risk mitigation strategy
needs to be created to minimize our risk for Rite Aid.
K 4/22/10 Craig Nesbitt Kevin Longland Craig Nesbitt 5/15/10 On going 50%
17 Borders
Unless the overdue debt is cleaned up ASAP, the
Borders account will be put on credit watch.
K 4/22/10Dave
DeSousaKevin Longland Dave DeSousa 5/15/10 0%

TMD-8303-AD-0011 Rev. 0 Date: July 2010 4
Highs
Monthly OverviewCustomer Variances
Lows
Forecast (or Budget when applicable) Prior Year Full Year Forecast
Month YTD Month YTD Official Forecast/Budget Curent Trajectory
Revenue
Gross
Profit
Gross
Margin Revenue
Gross
Profit
Gross
Margin Revenue
Gross
Profit
Gross
Margin Revenue
Gross
Profit
Gross
Margin Revenue
Gross
Profit
Gross
Margin Revenue
Gross
Profit
Gross
Margin
Fcst/Budget/PY 12,267 2,792 22.8% 124,814 29,216 23.4% 10,810 2,657 24.6% 121,195 31,853 26.3% 149,784 35,294 23.6%
American Eagle 196 179 68 33 207 180 137 22 1,262 415
Apple Computer 85 (111) 620 (80) (48) (256) (371) (721) 5,342 1,446
Bed Bath & Beyond 645 (73) 1,030 320 1,032 113 1,496 690 16,844 4,000
Borders 128 135 242 117 435 181 2,813 447 6,593 1,346
Clear Channel 524 131 822 218 524 131 822 218 - -
Dick's Sporting Goods 95 36 332 121 34 44 397 162 1,461 361
FedEx Kinko's 53 (25) 73 (4) 21 (61) (346) 396 8,193 2,860
Gap (20) (24) 683 230 (179) (76) (2,845) (1,018) 6,857 2,025
Michaels 154 (95) (985) (124) 721 (103) 7,834 963 28,793 5,023
Rite Aid 492 960 (302) 856 930 880 612 363 15,632 4,032
YRW (97) (3) (376) (14) (325) (51) (4,377) (557) 8,328 991
Other 20 (220) 120 213 330 (221) 2,106 (444) 33,197 7,895
Subtotal 132,501 30,396 22.9% 149,784 35,294 23.6%
Event Snow 567 314 3,000 1,331 620 577 670 60 15,680 4,323 - -
Margin/ Upsell 1,603 575
Actual 15,110 3,996 26.4% 130,142 32,433 24.9% 15,110 3,996 26.4% 130,142 32,433 24.9% 149,784 35,294 23.6% 149,784 35,294 23.6%
Variance 2,843 1,204 5,327 3,216 4,300 1,339 8,947 580 - -

TMD-8303-AD-0011 Rev. 0 Date: July 2010 5
Monthly ReviewLine of Business & Level 4 Variances
Forecast Prior Year
Month YTD Month YTD
Revenue
Gross
Profit
Gross
Margin Revenue
Gross
Profit
Gross
Margin Revenue
Gross
Profit
Gross
Margin Revenue
Gross
Profit
Gross
Margin
Fcst/Budget/PY 12,267 2,792 22.8% 124,814 29,216 23.4% 10,810 2,657 24.6% 121,195 31,853 26.3%
Janitorial 117 (106) 600 149 (140) (256) (2,905) (1,545)
Landscaping 352 859 (369) 705 1,000 849 262 326
IFS 576 1 (355) (15) 1,125 11 5,947 827
R&M 1,232 136 2,453 1,046 1,839 208 4,221 770
Event Snow 567 314 3,000 1,331 620 577 670 60
Seasonal Snow (1) (0) (2) (0) (145) (50) 753 141
Actual 15,110 3,996 26.4% 130,142 32,433 24.9% 15,110 3,996 26.4% 130,142 32,433 24.9%
Variance 2,843 1,204 5,327 3,216 4,300 1,339 8,947 580
Forecast Prior Year Full Year Forecast
Month YTD Month YTD Official Forecast/Budget Curent Trajectory
Revenue
Gross
Profit
Gross
Margin Revenue
Gross
Profit
Gross
Margin Revenue
Gross
Profit
Gross
Margin Revenue
Gross
Profit
Gross
Margin Revenue
Gross
Profit
Gross
Margin Revenue
Gross
Profit
Gross
Margin
Fcst/Budget/PY 12,267 2,792 22.8% 124,814 29,216 23.4% 10,810 2,657 24.6% 121,195 31,853 26.3% 149,784 35,294 23.6%
Bill Graber 661 (198) 1,061 279 1,169 14 1,646 662 26,343 6,249
Craig Arnold 524 131 822 218 524 131 822 218 - -
Craig Nesbitt 353 891 (702) 771 734 745 63 698 40,152 9,032
Dave DeSousa 429 311 759 626 694 360 3,989 1,077 16,875 3,993
Jim Winkler 123 (173) 1,463 123 (223) (412) (4,832) (2,595) 18,498 5,529
Level 5 32 22 (90) (7) 61 26 (1,243) (503) 1,840 569
Victor Smith 154 (95) (985) (124) 721 (103) 7,834 963 28,793 5,023
Event Snow 567 314 3,000 1,331 620 577 670 60 15,680 4,323
Margin/ Upsell 1,603 575
Actual 15,110 3,996 26.4% 130,142 32,433 24.9% 15,110 3,996 26.4% 130,142 32,433 24.9% 149,784 35,294 23.6% 149,784 35,294 23.6%
Variance 2,843 1,204 5,327 3,216 4,300 1,339 8,947 580 - -

TMD-8303-AD-0011 Rev. 0 Date: July 2010 6
Monthly OverviewIn-Market & Adjacent Wins
09/10 Upsells (as reported in April Business Review)
09/10 Upsells (reported in March)
09/10 EBITA Updates
Customer Owner Start Date Line of Business 09/10 Target
Pending
Negotiation Sold
Total
Opportunity Realized Comment
BBBY K. Longland March 2010 Electrical Project 285,000 - 285,000 285,000 103,751 Recognizing Rite Aid K. Longland March 2010 Floorcare 43,792 - - - - Lost Rite Aid K. Longland Feb 2010 Land 19,250 - 3,000 3,000 3,000 Complete Pep Boys K. Longland Feb 2010 Land 2,450 450 2,000 2,450 2,000 Recognizing Manhattan K. Longland Feb 2010 Floorcare 2,250 - 2,250 2,250 2,250 Complete
Total 352,742 450 292,250 292,700 111,001
09/10 Upsells (April)
09/10 EBITA Updates
Customer Owner Start Date Line of Business 09/10 Target
Pending
Negotiation Sold
Total
Opportunity Realized Comment
BBBY K. Longland March 2010 Electrical Project 285,000 - 285,000 285,000 285,000 Complete Rite Aid K. Longland March 2010 Floorcare 43,792 - - - - Lost Rite Aid K. Longland Feb 2010 Land 19,250 - 19,250 19,250 19,250 Complete Pep Boys K. Longland Feb 2010 Land 2,450 - 2,450 2,450 2,450 Complete Manhattan K. Longland Feb 2010 Floorcare 2,250 - 2,250 2,250 2,250 Complete
Total 352,742 - 308,950 308,950 308,950
09/10 EBITA Updates
Customer Owner Start Date Line of Business 09/10 Target
Pending
Negotiation Sold
Total
Opportunity Realized Comment
BBBY K. Longland March 2010 Electrical Project 285,000 - 285,000 285,000 285,000 Closed Rite Aid K. Longland March 2010 Floorcare 43,792 - - - - Canceled Rite Aid K. Longland Feb 2010 Land 19,250 - 19,250 19,250 19,250 Closed Pep Boys K. Longland Feb 2010 Land 2,450 - 2,450 2,450 2,450 Closed Manhattan K. Longland Feb 2010 Floorcare 2,250 - 2,250 2,250 2,250 Closed
Total 352,742 - 308,950 308,950 308,950

TMD-8303-AD-0011 Rev. 0 Date: July 2010 7
Monthly OverviewIn-Market & Adjacent Wins (cont)
Wins
09/10 Impact 10/11 Impact
Customer Line of Business Revenue Gross Profit EBITA Revenue Gross Profit EBITA
Kindacare Janitorial 3,536 826 179 14,144 3,304 716 Weis Market Janitorial 265 66 13 1,400 322 70 Jos A Bank R&M 45 11 2 180 45 9 JoAnn's Janitorial 178 (42) (42) 600 (115) (115)
Golf Galaxy Janitorial 5 2 0 - - -
Total 4,029 863 153 16,324 3,556 680

TMD-8303-AD-0011 Rev. 0 Date: July 2010 8
Monthly OverviewMargin Improvement
09/10 Margin Improvement (as reported in April business review)
09/10 Margin Improvement (reported in March)Updates
Targets Pending Negotiated Total
Customer Acct Manager LOB Effective Date Improvement Type 12-Month 09/10 Benefit Negotiation Savings Opportunity Realized Comment
Rite Aid Longland Janitorial March 1st Lower vendor rates 150,639 50,213 36,691 7,722 44,413 3,055 Open Rite Aid Longland Janitorial March 1st Lower vendor rates 95,159 31,720 13,120 13,800 26,920 3,077 Open Borders Longland R&M March 1st Lower supply rates (e.g. filters) 92,359 33,358 - 146,000 146,000 - Open Davids Bridal Longland Carpet Extraction March 1st Lower vendor rates 53,987 17,996 12,198 2,598 14,796 473 Open Michael's Longland Janitorial March 1st Lower vendor rates 52,671 17,557 - 17,557 17,557 4,235 Open Williams Sonoma Longland Janitorial March 1st Lower vendor rates 42,213 14,071 11,402 1,169 12,571 - Open Davids Bridal Longland Janitorial March 1st Lower vendor rates 36,805 12,268 8,230 838 9,068 - Open Apple Longland Janitorial March 1st Lower vendor rates 31,788 10,596 7,396 1,400 8,796 - Open BBBY Longland Lighting Feb 1st Lower vendor rates 29,262 29,262 - 50,000 50,000 - Open Davids Bridal Longland R&M March 1st Lower vendor rates 14,476 4,825 1,473 2,152 3,625 - Open BBBY Longland Lighting Feb 1st Early Fee participation 11,705 8,778 - 15,000 15,000 - Open
BBBY Longland Sanding Feb 1st Lower supply rates (e.g. chemicals) 3,242 3,242 - 5,539 5,539 1,108 Closed Coach Longland Janitorial March 1st Lower vendor rates 2,851 950 550 169 719 - Closed J Crew Longland Janitorial March 1st Lower vendor rates - - 9,847 453 10,300 - Open BBBY Longland Janitorial April 1st Lower vendor rates - - - 17,000 17,000 - Closed American Eagle Longland Janitorial March 1st Lower vendor rates - - 3,775 842 4,617 - Open 617,155
Additional Target Accounts 617,155 234,836 104,682 282,239 386,921 11,948
09/10 EBITA Updates
EBITA Targets Pending Negotiated Total
Customer Acct Manager LOB Effective Date Improvement Type 12-Month 09/10 Benefit Negotiation Savings Opportunity Realized Comment
Rite Aid Longland Janitorial Mar. 2010 Lower vendor rates 150,639 50,213 15,000 7,722 22,722 5,500 Recognizing Rite Aid Longland Janitorial Mar. 2010 Lower vendor rates 95,159 31,720 15,000 13,800 28,800 8,500 Recognizing Borders Longland R&M Mar. 2010 Lower supply rates (e.g. filters) 92,359 33,358 - 146,000 146,000 146,000 CompleteDavids Bridal Longland Carpet Extraction Mar. 2010 Lower vendor rates 53,987 17,996 4,000 3,945 7,945 473 Recognizing Michael's Longland Janitorial Mar. 2010 Lower vendor rates 52,671 17,557 - 17,557 17,557 17,557 Recognizing Williams Sonoma Longland Janitorial Mar. 2010 Lower vendor rates 42,213 14,071 3,500 2,729 6,229 - Open Davids Bridal Longland Janitorial Mar. 2010 Lower vendor rates 36,805 12,268 - - - - Open Apple Longland Janitorial Mar. 2010 Lower vendor rates 31,788 10,596 2,000 1,926 3,926 - Open BBBY Longland Lighting Feb 2010 Lower vendor rates 29,262 29,262 - 50,000 50,000 35,000 Recognizing Davids Bridal Longland R&M Mar. 2010 Lower vendor rates 14,476 4,825 - 3,800 3,800 - Open BBBY Longland Lighting Feb 2010 Early Fee participation 11,705 8,778 - 15,000 15,000 10,000 Recognizing BBBY Longland Sanding Feb 2010 Lower supply rates (e.g. chemicals) 3,242 3,242 - 5,539 5,539 1,108 Recognizing Coach Longland Janitorial Mar. 2010 Lower vendor rates 2,851 950 - 169 169 169 Recognizing American Eagle Longland Janitorial Mar. 2010 Lower vendor rates - - 3,000 601 3,601 - Open
Total 617,155 234,836 42,500 268,788 311,288 224,307

TMD-8303-AD-0011 Rev. 0 Date: July 2010 9
Monthly OverviewMargin Improvement
09/10 Margin Improvement (April)
09/10 Margin Improvement
Updates
Targets Pending Negotiated Total
Customer Acct Manager LOB Effective Date Improvement Type 12-Month 09/10 Benefit Negotiation Savings Opportunity Realized Comment
Rite Aid Longland Janitorial March 1st Lower vendor rates 150,639 50,213 36,691 7,722 44,413 5,500 Open Rite Aid Longland Janitorial March 1st Lower vendor rates 95,159 31,720 13,120 13,800 26,920 8,500 Open Borders Longland R&M March 1st Lower supply rates (e.g. filters) 92,359 33,358 - 146,000 146,000 146,000 Open Davids Bridal Longland Carpet Extraction March 1st Lower vendor rates 53,987 17,996 10,851 3,945 14,796 - Open Michael's Longland Janitorial March 1st Lower vendor rates 52,671 17,557 - 17,557 17,557 17,557 Open Williams Sonoma Longland Janitorial March 1st Lower vendor rates 42,213 14,071 9,642 2,729 12,371 - Open Davids Bridal Longland Janitorial March 1st Lower vendor rates 36,805 12,268 9,068 - 9,068 - Open Apple Longland Janitorial March 1st Lower vendor rates 31,788 10,596 6,870 1,926 8,796 - Open BBBY Longland Lighting Feb 1st Lower vendor rates 29,262 29,262 - 50,000 50,000 35,000 Open Davids Bridal Longland Janitorial March 1st Lower vendor rates 14,476 4,825 (175) 3,800 3,625 - Open BBBY Longland Lighting Feb 1st Early Fee participation 11,705 8,778 - 15,000 15,000 10,000 Open BBBY Longland Sanding Feb 1st Lower supply rates (e.g. chemicals) 3,242 3,242 - 5,539 5,539 1,108 Closed Coach Longland Janitorial March 1st Lower vendor rates 2,851 950 550 169 719 169 Closed J Crew Longland Janitorial March 1st Lower vendor rates - - 9,847 453 10,300 - Open BBBY Longland Janitorial April 1st Lower vendor rates - - - 17,000 17,000 5,000 Closed American Eagle Longland Janitorial March 1st Lower vendor rates - - 3,775 842 4,617 842 Open
Additional Target Accounts 617,155 234,836 100,239 286,482 386,721 229,676

TMD-8303-AD-0011 Rev. 0 Date: July 2010 10
Monthly OverviewLosses & At Risk Accounts
Losses
09/10 Impact 10/11 Impact
Customer Line of Business Revenue Gross Profit EBITA Revenue Gross Profit EBITA
Gambro Janitorial (102) (13) (5) - - - Fedex Janitorial (621) (193) (31) (4,966) (1,546) (248)Citizens Bank Janitorial (121) (24) (6) (486) (87) (24)Apple Janitorial (10) (3) (0) (40) (13) (2)Liz Claiborne Janitorial (178) (75) (9) (710) (302) (36)Williams Sonoma Janitorial (45) (17) (2) (134) (51) (7)Cumberland Farms Land/ Snow (190) (77) (10) (350) (128) (18)Gap R&M (160) (39) (8) (959) (232) (19)
Gap Janitorial (31) (11) (2) (188) (46) (9)
Total (1,457) (452) (73) (7,834) (2,405) (363)

TMD-8303-AD-0011 Rev. 0 Date: July 2010 11
Monthly OverviewLosses & At Risk Accounts (cont)
At Risk Accounts (Fiscal 09-10 P&L)
Gross P&L Net P&L Change
Customer Line of Business Revenue GP EBITA
Retention
%
Date of
Retention Revenue GP EBITA Revenue GP EBITA
Coach Stores Janitorial 450 153 23 95% Jun. 10 448 152 22 2 1 0
Coach Stores Repairs 514 135 26 95% Jun. 10 512 135 26 2 1 0
Total 964 288 48 960 287 48 4 1 0

TMD-8303-AD-0011 Rev. 0 Date: July 2010 12
Monthly OverviewLosses & At Risk Accounts (cont)
At Risk Accounts (Fiscal 10-11 P&L)Gross P&L Net P&L Change
Customer Line of Business Revenue GP EBITA
Retention
%
Date of
Retention Revenue GP EBITA Revenue GP EBITA
Rite Aid Janitorial 5,903 1,397 295 80% Jun. 10 5,805 1,374 290 98 23 5
Rite Aid Landscaping 8,520 1,921 426 80% Apr. 11 8,094 1,825 405 426 96 21
Rite Aid Snow Event 15,327 3,790 766 80% Jun. 10 15,072 3,727 754 255 63 13
Borders Repairs 6,398 1,255 320 95% Jan. 11 6,238 1,223 312 160 31 8
Gap Janitorial 4,999 1,525 250 80% Jan. 11 4,499 1,372 225 500 152 25
Gap Repairs 1,536 372 77 50% Sep. 10 896 217 45 640 155 32
Staples Land / Snow 540 - 27 70% Nov. 10 432 - 22 108 - 5
Staples Repairs 132 59 7 70% Nov. 10 106 47 5 26 12 1
Bed Bath & Beyond Janitorial 9,411 2,682 471 100% Mar. 16 9,411 2,682 471 - - -
Bed Bath & Beyond Landscaping 600 216 30 100% Mar. 16 600 216 30 - - -
Bed Bath & Beyond Repairs 4,152 859 208 100% Mar. 16 4,152 859 208 - - -
Bed Bath & Beyond Snow Event 516 201 26 100% Mar. 16 516 201 26 - - -
American Eagle Janitorial 1,015 374 51 85% Jun. 11 1,003 369 50 13 5 1
Apple Computer Janitorial 5,273 1,529 264 90% Feb. 11 5,053 1,465 253 220 64 11
Citizens Bank Snow Event 914 181 46 80% Jul. 10 731 145 37 183 36 9
Coach Stores Janitorial 450 153 23 95% Jun. 10 428 145 21 23 8 1
Coach Stores Repairs 514 135 26 95% Jun. 10 489 129 24 26 7 1
Davids Bridal Janitorial 795 213 40 90% May. 11 782 209 39 13 4 1
Davids Bridal Repairs 370 81 18 90% May. 11 363 80 18 6 1 0
Dick's Sporting Goods Repairs 1,399 313 70 85% Jan. 10 1,294 290 65 105 24 5
FedEx Kinko's Janitorial 2,208 416 110 10% May. 10 221 42 11 1,987 374 99
FedEx Kinko's Repairs 210 42 11 50% Jul. 10 105 21 5 105 21 5
FedEx Kinko's Snow Event 206 66 10 50% Jul. 10 103 33 5 103 33 5
Jo Ann Stores Janitorial 7,066 1,420 353 100% Apr. 12 7,066 1,420 353 - - -
Kindercare Learning CenterJanitorial 14,144 3,304 707 100% Apr. 12 14,144 3,304 707 - - -
Michael's Janitorial 14,119 2,005 706 80% Jan. 11 12,707 1,805 635 1,412 201 71
Michael's IFS 12,866 2,386 643 100% Jan. 12 12,866 2,386 643 - - -
Nobel Repairs 1,560 234 78 99% Jul. 10 1,544 232 77 16 2 1
US Bank Janitorial 3,812 513 191 80% Jun. 10 3,749 504 187 64 9 3
US Postal Office Janitorial 3,881 524 194 80% Jan. 10 3,493 472 175 388 52 19
Weis Market Janitorial 1,400 322 70 70% Jun. 11 1,365 314 68 35 8 2
Williams Sonoma Janitorial 2,184 852 109 90% Sep. 10 2,002 781 100 182 71 9
Williams Sonoma Repairs 314 107 16 90% Sep. 10 288 98 14 26 9 1
Total 132,738 29,446 6,637 125,618 27,986 6,281 7,120 1,460 356

TMD-8303-AD-0011 Rev. 0 Date: July 2010 13
Monthly OverviewAccounts Receivable
USM Total AR (Billed & Un-Billed)
Customer Un-Billed Current 0-30 31-60 61-90 >90 Un-Billed Current Past Due Total DSO Payment Terms
Michaels 1,787,694 3,265,865 190,491 8,814 10,901 124,034 1,787,694 3,265,865 334,240 5,387,799 67.7 Net 30
Rite Aid 2,994,604 294,685 (31,466) 75,082 6,948 33,876 2,994,604 294,685 84,440 3,373,728 24.2 Net 30
Bed Bath & Beyond 2,927,775 539,083 69,802 (71,891) (24,461) (261,995) 2,927,775 539,083 (288,545) 3,178,313 66.5 2% early fee 3% rebate
Borders 453,501 609,968 162,849 48,066 38,836 125,211 453,501 609,968 374,962 1,438,431 71.3 Net 30 - 2% P Card
GAP 162,785 548,825 406,187 40,548 38,102 2,405 162,785 548,825 487,242 1,198,852 54.3 Net 45
APPLE 428,734 529,902 84,407 49,553 10,540 74,360 428,734 529,902 218,861 1,177,497 61.3 Net 45
YRC 349,598 537,814 214,239 (376) (0) (0) 349,598 537,814 213,863 1,101,274 59.7
Joann Stores 566,486 497,507 1,346 2,138 2,494 (6,382) 566,486 497,507 (404) 1,063,589 68.1 Net 30
FEDEX 713,131 46,636 37,269 - - (10,164) 713,131 46,636 27,104 786,871 32.7 Net 30
USPS 304,800 284,012 (30,026) - (84) (16,040) 304,800 284,012 (46,150) 542,662 56.6
William Sonoma 68,166 178,510 123,805 39,473 17,886 4,010 68,166 178,510 185,174 431,850 47.4
Ann Taylor (240,334) 14,318 150,005 262,254 228,075 976 (240,334) 14,318 641,309 415,292 254.7
DICKS 59,895 210,115 83,640 3,032 4,260 (2,015) 59,895 210,115 88,917 358,927 55.2
J Crew 67,567 97,157 84,997 3,304 32,218 36,709 67,567 97,157 157,228 321,952 91.7
Jos A Bank 222,170 51,413 - 781 (0) 624 222,170 51,413 1,405 274,989 84.0
KLC 246,600 46,480 0 (0) (0) (22,400) 246,600 46,480 (22,400) 270,680 50.0
Staples 174,229 70,741 - 465 7,621 (459) 174,229 70,741 7,628 252,597 40.3
American Eagle 84,508 103,186 26,453 554 - 2,512 84,508 103,186 29,519 217,213 49.4
Forman Mills 24,021 102,181 22,310 28,411 - - 24,021 102,181 50,721 176,923 102.0
Citizens Bank (1,707) 178,819 - (370) - - (1,707) 178,819 (370) 176,741 31.4
Total 12,015,637 8,804,198 1,881,724 533,910 430,530 120,054 12,015,637 8,804,198 2,966,218 23,786,053 48.6
Nottberg 39.0
Ridge 60.2
Total
Billed Billed

KAM Accounts

TMD-8303-AD-0011 Rev. 0 Date: July 2010 15
Level 4 Account Review – KAMMichaels
Month YTD
Variance Variance Full Year Forecast
Actual
Forecast/
Budget Prior Year
Forecast/
Budget Prior Year Actual
Forecast/
Budget Prior Year
Forecast/
Budget Prior Year Forecast
Current
Trajectory Variance
RevenueJanitorial 1,434 1,332 1,314 102 120 11,592 11,400 8,883 192 2,709 14,697 15,010 313
IFS 1,110 1,058 509 52 601 10,717 11,894 5,592 (1,177) 5,125 14,096 13,184 (912)
Total 2,545 2,390 1,823 154 721 22,309 23,294 14,475 (985) 7,834 28,793 28,194 (599)
Gross ProfitJanitorial 226 191 209 35 18 1,876 1,768 1,522 108 354 2,566 2,567 0
IFS 80 211 201 (130) (121) 1,840 2,072 1,230 (232) 610 2,457 2,294 (163)
Total 307 402 410 (95) (103) 3,716 3,840 2,752 (124) 963 5,023 4,861 (163)
Gross MarginJanitorial 15.8% 14.4% 15.9% -1.4% 0.1% 16.2% 15.5% 17.1% -0.3% 1.4% 17.5% 17.1% -0.4%
IFS 7.2% 19.9% 39.5% 12.7% 32.2% 17.2% 17.4% 22.0% 10.2% 14.8% 17.4% 17.4% 0.0%
Total 12.1% 16.8% 22.5% 11.2% 32.3% 16.7% 16.5% 19.0% 9.9% 16.1% 17.4% 17.2% -0.4%

KAM Accounts

TMD-8303-AD-0011 Rev. 0 Date: July 2010 17
Level 4 Account Review – KAMAccounts Overview
Forecast (or Budget when applicable) Prior Year Full Year Forecast
Month YTD Month YTD Official Forecast/Budget Curent Trajectory
Revenue
Gross
Profit
Gross
Margin Revenue
Gross
Profit
Gross
Margin Revenue
Gross
Profit
Gross
Margin Revenue
Gross
Profit
Gross
Margin Revenue
Gross
Profit
Gross
Margin Revenue
Gross
Profit
Gross
Margin
Fcst/Budget/PY 1,527 470 30.8% 15,536 4,602 29.6% 1,874 709 37.8% 21,831 7,320 33.5% 19,112 5,753 30.1%
Apple 85 (111) 620 (80) (48) (256) (371) (721) 5,342 1,446
Avenue 22 7 46 13 29 10 (3) (1) 158 39
Bebe (17) (7) (53) (33) (11) 1 (259) (107) 202 73
Bose 3 1 3 (0) 6 3 (77) (26) 141 59
Citizens Bank 4 3 9 3 (5) 2 (21) (5) 1,084 220
Coach Stores (21) (16) (84) (39) (22) (20) (903) (402) 985 279
Cumberland Farms (52) (21) (51) (20) (52) (21) (32) 3 376 149
Gap (20) (24) 683 230 (179) (76) (2,845) (1,018) 6,857 2,025
Staples 34 (25) 26 (48) 28 (28) 462 96 755 266
Williams Sonoma 85 22 265 96 33 (25) (783) (415) 2,599 972
Event Snow 28 12 423 137 23 12 (711) (244) 613 198
Margin/ Upsell - 26
Actual 1,679 309 18.4% 17,422 4,862 27.9% 1,674 309 18.5% 16,288 4,481 27.5% 19,112 5,753 30.1% 19,112 5,753 30.1%
Variance 151 (161) 1,886 260 (200) (399) (5,543) (2,840) - -

TMD-8303-AD-0011 Rev. 0 Date: July 2010 18
Level 4 Account Review – KAMApple
Month YTD
Variance Variance Full Year Forecast
Actual
Forecast/
Budget Prior Year
Forecast/
Budget Prior Year Actual
Forecast/
Budget Prior Year
Forecast/
Budget Prior Year Forecast
Current
Trajectory Variance
RevenueJanitorial 499 414 547 85 (48) 5,133 4,513 5,493 620 (360) 5,340 6,535 1,195
Repairs - - 0 - (0) 2 2 13 - (11) 2 2 0
Total 499 414 548 85 (48) 5,135 4,515 5,505 620 (371) 5,342 6,537 1,195
Gross ProfitJanitorial 21 132 278 (111) (256) 1,101 1,181 1,818 (80) (718) 1,446 1,497 51
Repairs - - 0 - (0) 0 0 4 (0) (4) 0 0 (0)
Total 21 132 278 (111) (256) 1,101 1,181 1,822 (80) (721) 1,446 1,497 51
Gross MarginJanitorial 4.3% 32.0% 50.7% 27.7% 46.5% 21.4% 26.2% 33.1% -4.7% -11.7% 27.1% 22.9% -4.2%
Repairs 0.0% 0.0% 6.9% 0.0% 6.9% 11.0% 20.5% 31.2% -9.5% -20.2% 20.5% 11.0% -9.5%
Total 4.3% 32.0% 50.7% 27.7% 53.4% 21.4% 26.2% 33.1% -14.2% -31.8% 27.1% 22.9% -13.7%

TMD-8303-AD-0011 Rev. 0 Date: July 2010 19
Level 4 Account Review – KAMGap
Month YTD
Variance Variance Full Year Forecast
Actual
Forecast/
Budget Prior Year
Forecast/
Budget Prior Year Actual
Forecast/
Budget Prior Year
Forecast/
Budget Prior Year Forecast
Current
Trajectory Variance
RevenueJanitorial 220 363 432 (143) (212) 4,530 4,336 6,038 195 (1,508) 5,237 5,237 -
Repairs 251 128 217 123 33 1,853 1,365 3,191 488 (1,338) 1,621 2,208 587
Snow Event 16 - - 16 16 430 87 - 343 430 87 430 343
Total 487 491 649 (4) (163) 6,813 5,787 9,229 1,026 (2,415) 6,944 7,875 931
Gross ProfitJanitorial 68 111 135 (43) (67) 1,485 1,386 2,134 98 (649) 1,661 1,661 -
Repairs 50 31 59 19 (9) 434 302 803 132 (369) 364 530 166
Snow Event 5 - - 5 5 188 37 - 151 188 37 188 151
Total 122 142 193 (19) (71) 2,107 1,726 2,937 381 (830) 2,063 2,379 317
Gross MarginJanitorial 30.8% 30.5% 31.1% -0.3% 0.4% 32.8% 32.0% 35.3% 1.2% 4.6% 31.7% 31.7% 0.0%
Repairs 19.8% 24.2% 27.0% 4.4% 7.2% 23.4% 22.1% 25.2% 2.3% 5.4% 22.5% 24.0% 1.5%
Snow Event 31.4% 0.0% 0.0% -31.4% -31.4% 43.8% 43.1% 0.0% 11.7% -31.4% 43.1% 43.8% 0.7%

Appendix – Account Details
TMD-8303-AD-0011 Rev. 0 Date: July 2010 21
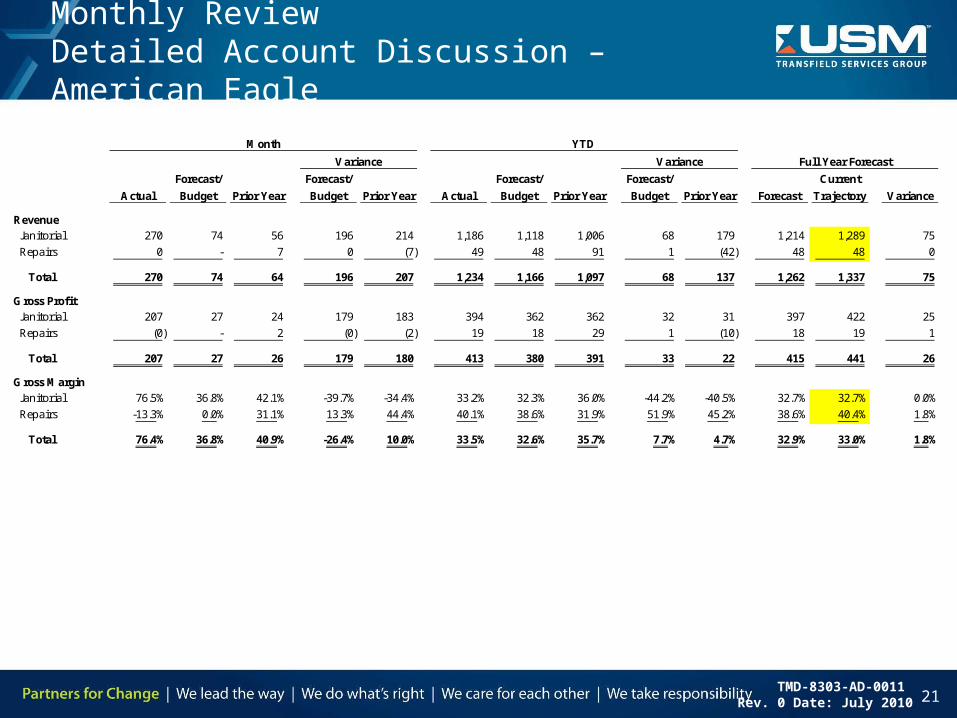
Monthly ReviewDetailed Account Discussion – American Eagle
Month YTD
Variance Variance Full Year Forecast
Actual
Forecast/
Budget Prior Year
Forecast/
Budget Prior Year Actual
Forecast/
Budget Prior Year
Forecast/
Budget Prior Year Forecast
Current
Trajectory Variance
RevenueJanitorial 270 74 56 196 214 1,186 1,118 1,006 68 179 1,214 1,289 75
Repairs 0 - 7 0 (7) 49 48 91 1 (42) 48 48 0
Total 270 74 64 196 207 1,234 1,166 1,097 68 137 1,262 1,337 75
Gross ProfitJanitorial 207 27 24 179 183 394 362 362 32 31 397 422 25
Repairs (0) - 2 (0) (2) 19 18 29 1 (10) 18 19 1
Total 207 27 26 179 180 413 380 391 33 22 415 441 26
Gross MarginJanitorial 76.5% 36.8% 42.1% -39.7% -34.4% 33.2% 32.3% 36.0% -44.2% -40.5% 32.7% 32.7% 0.0%
Repairs -13.3% 0.0% 31.1% 13.3% 44.4% 40.1% 38.6% 31.9% 51.9% 45.2% 38.6% 40.4% 1.8%
Total 76.4% 36.8% 40.9% -26.4% 10.0% 33.5% 32.6% 35.7% 7.7% 4.7% 32.9% 33.0% 1.8%

TMD-8303-AD-0011 Rev. 0 Date: July 2010 22
Monthly ReviewDetailed Account Discussion – Bed Bath
Month YTD
Variance Variance Full Year Forecast
Actual
Forecast/
Budget Prior Year
Forecast/
Budget Prior Year Actual
Forecast/
Budget Prior Year
Forecast/
Budget Prior Year Forecast
Current
Trajectory Variance
RevenueJanitorial 684 827 763 (144) (79) 6,505 6,646 7,529 (141) (1,024) 8,490 8,323 (167)
Landscaping 107 96 88 11 18 646 627 555 19 91 747 773 26
Repair 1,440 662 347 778 1,093 7,420 6,268 4,991 1,152 2,429 7,606 10,376 2,770
Snow Event 72 5 33 67 39 452 458 621 (6) (169) 458 484 26
Total 2,303 1,591 1,232 712 1,071 15,023 13,998 13,696 1,025 1,327 17,302 19,957 2,655
Gross ProfitJanitorial 214 227 72 (13) 142 1,856 1,803 1,518 53 338 2,320 2,308 (12)
Landscaping 23 32 16 (9) 7 244 253 104 (9) 140 295 222 (73)
Repair 79 130 115 (51) (36) 1,392 1,117 1,180 275 212 1,385 1,996 611
Snow Event 82 - 35 82 47 152 175 222 (23) (71) 175 184 9
Total 399 389 239 10 160 3,644 3,347 3,025 297 620 4,175 4,710 535
Gross MarginJanitorial 31.3% 27.5% 9.4% -3.9% -21.9% 28.5% 27.1% 20.2% -4.2% -11.2% 27.3% 27.7% 0.4%
Landscaping 21.9% 33.5% 18.6% 11.7% -3.3% 37.8% 40.4% 18.8% 18.5% -3.0% 39.5% 28.8% -10.7%
Repair 5.5% 19.6% 33.2% 14.1% 27.7% 18.8% 17.8% 23.6% 12.3% 18.1% 18.2% 19.2% 1.0%
Snow Event 114.6% 0.0% 106.9% -114.6% -7.7% 33.5% 38.2% 35.8% -76.5% -78.9% 38.2% 37.9% -0.3%
Total 17.3% 24.5% 19.4% -92.7% -5.2% 24.3% 23.9% 22.1% -49.8% -74.9% 24.1% 23.6% -9.6%

TMD-8303-AD-0011 Rev. 0 Date: July 2010 23
Monthly ReviewDetailed Account Discussion - Borders
Month YTD
Variance Variance Full Year Forecast
Actual
Forecast/
Budget Prior Year
Forecast/
Budget Prior Year Actual
Forecast/
Budget Prior Year
Forecast/
Budget Prior Year Forecast
Current
Trajectory Variance
RevenueLandscaping - 24 24 (24) (24) 217 285 293 (69) (76) 285 269 (16)
Repairs 692 540 233 152 459 5,538 5,228 2,649 310 2,889 6,308 6,308 0
Snow Event - - 23 - (23) (0) (0) 490 - (490) - - -
Total 692 564 280 128 412 5,755 5,513 3,432 242 2,323 6,593 6,577 (16)
Gross ProfitLandscaping - 4 5 (4) (5) (17) 55 70 (72) (88) 55 52 (3)
Repairs 260 106 60 154 200 1,268 1,079 734 189 534 1,291 1,437 146
Snow Event - - 8 - (8) (0) (0) 186 - (186) - - -
Total 260 110 73 149 187 1,251 1,134 990 117 261 1,346 1,489 142
Gross MarginLandscaping 0.0% 17.4% 21.9% 17.4% 21.9% -8.0% 19.2% 24.0% 19.2% 24.0% 19.2% 19.2% 0.0%
Repairs 37.5% 19.6% 25.6% -17.9% -11.9% 22.9% 20.6% 27.7% -16.9% -9.8% 20.5% 22.8% 2.3%
Snow Event 0.0% 0.0% 34.5% 0.0% 34.5% 100.0% 100.0% 37.9% 100.0% 37.9% 0.0% 0.0% 0.0%
Total 37.5% 19.5% 26.0% -0.5% 44.4% 21.7% 20.6% 28.8% 102.3% 52.0% 20.4% 22.6% 2.3%

TMD-8303-AD-0011 Rev. 0 Date: July 2010 24
Monthly ReviewDetailed Account Discussion – Clear Channel
Month YTD
Variance Variance Full Year Forecast
Actual
Forecast/
Budget Prior Year
Forecast/
Budget Prior Year Actual
Forecast/
Budget Prior Year
Forecast/
Budget Prior Year Forecast
Current
Trajectory Variance
RevenueSnow Event (7) - - (7) (7) 103 - - 103 103 101 (101)
IFS 524 - - 524 524 822 - - 822 822 594 (594)
Total 517 - - 517 517 925 - - 925 925 695 - (695)
Gross ProfitJanitorial (1) - - (1) (1) 24 - - 24 24 16 - (16)
Repairs 131 - - 131 131 218 - - 218 218 109 - (109)
Total 130 - - 130 130 241 - - 241 241 125 - (125)
Gross MarginJanitorial 15.2% 0.0% 0.0% -15.2% -15.2% 22.9% 0.0% 0.0% -15.2% -15.2% 15.7% -15.7%
Repairs 25.0% 0.0% 0.0% -25.0% -25.0% 26.5% 0.0% 0.0% -25.0% -25.0% 18.4% -18.4%
Total 25.2% 0.0% 0.0% -40.3% -40.3% 26.1% 0.0% 0.0% -40.3% -40.3% 18.0% #DIV/0! -34.1%

TMD-8303-AD-0011 Rev. 0 Date: July 2010 25
Monthly ReviewDetailed Account Discussion – Dick’s
Month YTD
Variance Variance Full Year Forecast
Actual
Forecast/
Budget Prior Year
Forecast/
Budget Prior Year Actual
Forecast/
Budget Prior Year
Forecast/
Budget Prior Year Forecast
Current
Trajectory Variance
RevenueJanitorial 45 - 61 45 (15) 130 62 85 68 45 101 (101)
Repairs 160 110 111 50 49 1,442 1,178 1,091 264 351 594 (594)
Total 205 110 172 95 34 1,572 1,240 1,175 332 397 695 - (695)
Gross ProfitJanitorial 7 - 17 7 (9) 40 25 23 15 17 16 - (16)
Repairs 53 25 (0) 28 53 392 286 247 107 145 109 - (109)
Total 60 25 17 36 44 432 311 270 121 162 125 - (125)
Gross MarginJanitorial 16.2% 0.0% 27.7% -16.2% 11.5% 30.7% 40.8% 27.0% 24.6% 10.8% 15.7% -15.7%
Repairs 33.1% 22.4% -0.2% -10.7% -33.3% 27.2% 24.3% 22.7% -8.8% -10.4% 18.4% -18.4%
Total 29.4% 22.4% 9.6% -26.9% -21.8% 27.5% 25.1% 23.0% 15.8% 0.4% 18.0% #DIV/0! -34.1%

TMD-8303-AD-0011 Rev. 0 Date: July 2010 26
Monthly ReviewDetailed Account Discussion - Fedex
Month YTD
Variance Variance Full Year Forecast
Actual
Forecast/
Budget Prior Year
Forecast/
Budget Prior Year Actual
Forecast/
Budget Prior Year
Forecast/
Budget Prior Year Forecast
Current
Trajectory Variance
RevenueJanitorial 668 656 689 11 (21) 6,610 6,654 7,093 (45) (483) 7,967 7,342 (625)
Repairs 49 7 7 42 42 299 181 162 117 137 226 306 80
Event Snow 8 17 15 (9) (7) 207 199 202 8 6 199 243 43
Total 725 680 711 44 14 7,116 7,035 7,456 80 (341) 8,392 7,891 (501)
Gross ProfitJanitorial 174 205 241 (31) (67) 2,323 2,352 1,958 (29) 364 2,815 2,674 (141)
Repairs 8 2 2 6 6 62 37 30 25 31 45 62 16
Event Snow (3) 6 5 (9) (8) 61 64 65 (4) (4) 64 78 14
Total 179 213 248 (34) (69) 2,445 2,453 2,053 (8) 392 2,925 2,814 (111)
Gross MarginJanitorial 26.0% 31.2% 34.9% 5.3% 8.9% 35.1% 35.3% 27.6% 9.3% 1.6% 35.3% 36.4% 1.1%
Repairs 16.4% 23.8% 23.8% 7.4% 7.4% 20.6% 20.3% 18.7% 3.9% 2.3% 20.1% 20.1% 0.0%
Event Snow -36.9% 36.1% 36.1% 73.0% 73.0% 29.3% 32.2% 32.1% 69.1% 69.0% 32.2% 32.3% 0.1%
Total 24.7% 31.3% 34.8% 85.7% 89.4% 34.4% 34.9% 27.5% 82.4% 72.9% 34.9% 35.7% 1.1%

TMD-8303-AD-0011 Rev. 0 Date: July 2010 27
Monthly ReviewDetailed Account Discussion – Rite Aid
Month YTD
Variance Variance Full Year Forecast
Actual
Forecast/
Budget Prior Year
Forecast/
Budget Prior Year Actual
Forecast/
Budget Prior Year
Forecast/
Budget Prior Year Forecast
Current
Trajectory Variance
RevenueJanitorial 603 542 646 61 (43) 4,909 4,931 4,883 (22) 26 6,010 6,010 0
Landscaping 1,967 1,533 857 434 1,110 6,316 6,588 6,521 (272) (204) 8,056 7,446 (610)
Repairs - - - - - - - 0 - (0) - - -
Event Snow 518 27 (79) 490 597 16,499 14,189 14,751 2,310 1,747 14,202 15,984 1,782
Seasonal Snow (3) - 135 (3) (137) 1,558 1,566 768 (8) 791 1,566 1,563 (3)
Total 3,085 2,103 1,559 982 1,527 29,282 27,274 26,923 2,008 2,359 29,834 31,004 1,170
Gross ProfitJanitorial 145 120 166 26 (21) 1,279 1,235 1,184 44 95 1,477 1,478 1
Landscaping 1,330 395 379 935 951 2,619 1,808 2,505 811 114 2,135 2,065 (70)
Repairs - - - - - - - 0 - (0) - - -
Event Snow 241 7 (299) 234 540 4,965 3,818 4,482 1,146 482 3,822 4,731 910
Seasonal Snow - - 49 - (49) 420 420 266 (0) 154 420 419 (1)
Total 1,716 521 295 1,195 1,421 9,283 7,281 8,437 2,002 845 7,854 8,694 840
Gross MarginJanitorial 24.1% 22.1% 25.7% -2.0% 1.6% 26.1% 25.0% 24.3% 1.0% 0.2% 24.6% 24.6% 0.0%
Landscaping 67.6% 25.8% 44.2% -41.8% -23.4% 41.5% 27.4% 38.4% -40.2% -29.2% 26.5% 27.7% 1.2%
Repairs 0.0% 0.0% 0.0% 0.0% 0.0% 0.0% 0.0% 47.4% 0.0% 47.4% 0.0% 0.0% 0.0%
Event Snow 46.6% 24.4% 376.8% -22.1% 330.2% 30.1% 26.9% 30.4% -19.6% -16.2% 26.9% 29.6% 2.7%
Seasonal Snow 0.0% 0.0% 36.8% 0.0% 36.8% 26.9% 26.8% 34.6% 26.8% 34.6% 26.8% 26.8% 0.0%
Total 55.6% 24.8% 18.9% -66.0% 345.2% 31.7% 26.7% 31.3% -32.0% 36.8% 26.3% 28.0% 3.9%
TMD-8303-AD-0011 Rev. 0 Date: July 2010 28
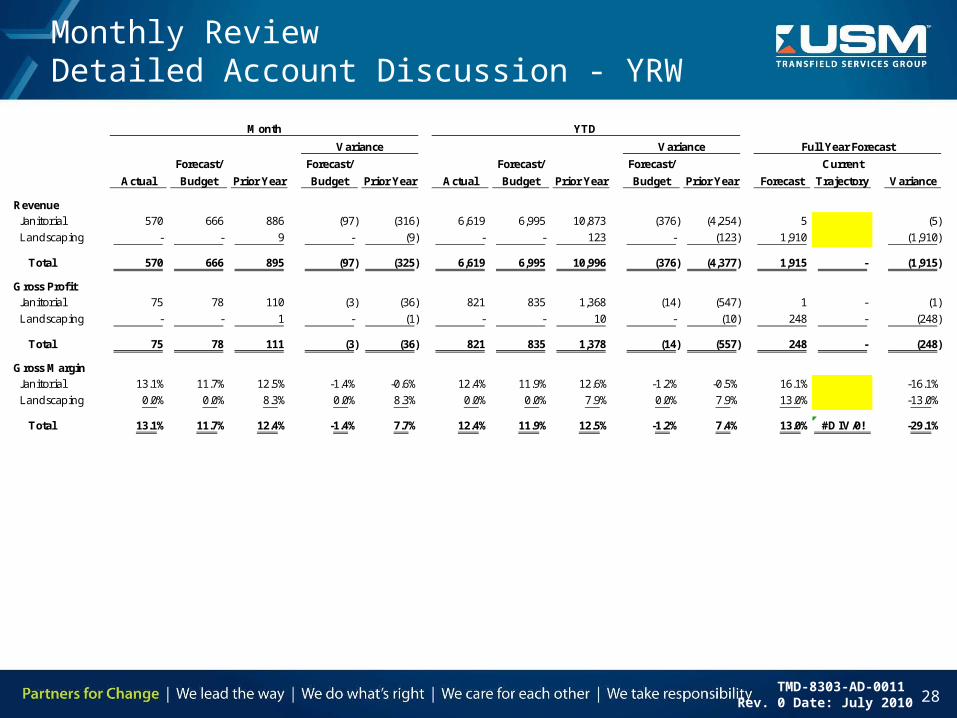
Monthly ReviewDetailed Account Discussion - YRW
Month YTD
Variance Variance Full Year Forecast
Actual
Forecast/
Budget Prior Year
Forecast/
Budget Prior Year Actual
Forecast/
Budget Prior Year
Forecast/
Budget Prior Year Forecast
Current
Trajectory Variance
RevenueJanitorial 570 666 886 (97) (316) 6,619 6,995 10,873 (376) (4,254) 5 (5)
Landscaping - - 9 - (9) - - 123 - (123) 1,910 (1,910)
Total 570 666 895 (97) (325) 6,619 6,995 10,996 (376) (4,377) 1,915 - (1,915)
Gross ProfitJanitorial 75 78 110 (3) (36) 821 835 1,368 (14) (547) 1 - (1)
Landscaping - - 1 - (1) - - 10 - (10) 248 - (248)
Total 75 78 111 (3) (36) 821 835 1,378 (14) (557) 248 - (248)
Gross MarginJanitorial 13.1% 11.7% 12.5% -1.4% -0.6% 12.4% 11.9% 12.6% -1.2% -0.5% 16.1% -16.1%
Landscaping 0.0% 0.0% 8.3% 0.0% 8.3% 0.0% 0.0% 7.9% 0.0% 7.9% 13.0% -13.0%
Total 13.1% 11.7% 12.4% -1.4% 7.7% 12.4% 11.9% 12.5% -1.2% 7.4% 13.0% #DIV/0! -29.1%