boston presentation final
TRANSCRIPT

LIGHT VEHICLE COMMERCIAL INDUSTRIAL
MPG
KeyBanc Industrial, Automotive and Transportation Conference
May 28, 2015
2
Disclaimer
This presentation and any related statements contains certain “forward-looking statements” about MPG’s financial results and estimates and business prospects within the meaning of the Private Securities Litigation Reform Act of 1995. Forward-looking statements may be identified by words such as “expects,” “intends,” “anticipates,” “plans,” “project,” “believes,” “seeks,” “targets,” “forecast,” “estimates,” “will” or other words of similar meaning and include, but are not limited to, statements regarding the outlook for the Company’s future business, prospects, and financial performance; the industry outlook, our backlog and our 2015 financial guidance. Forward-looking statements are based on management’s current expectations and assumptions, which are subject to inherent uncertainties, risks, and changes in circumstances that are difficult to predict. Actual outcomes and results may differ materially due to global political, economic, business, competitive, market, regulatory, and other factors and risks, including, but not limited to, the following: volatility in the global economy impacting demand for new vehicles and our products; a decline in vehicle production levels, particularly with respect to platforms for which we are a significant supplier, or the financial distress of any of our major customers; seasonality in the automotive industry; our significant competition; our dependence on large-volume customers for current and future sales; a reduction in outsourcing by our customers, the loss or discontinuation of material production or programs, or a failure to secure sufficient alternative programs; our failure to offset continuing pressure from our customers to reduce our prices; our inability to realize all of the sales expected from awarded business or fully recover pre-production costs; our failure to increase production capacity or over-expanding our production in times of overcapacity; our reliance on key machinery and tooling to manufacture components for powertrain and safety-critical systems that cannot be easily replicated; program launch difficulties; a disruption in our supply or delivery chain which causes one or more of our customers to halt production; work stoppages or production limitations at one or more of our customer’s facilities; a catastrophic loss of one of our key manufacturing facilities; failure to protect our know-how and intellectual property; the disruption or harm to our business as a result of any acquisitions or joint ventures we make; a significant increase in the prices of raw materials and commodities we use; the damage to or termination of our relationships with key third-party suppliers; our failure to maintain our cost structure; the incurrence of significant costs if we close any of our manufacturing facilities; potential significant costs at our facility in Sandusky, Ohio; the failure of or disruptions in our information technology networks and systems, or the inability to successfully implement upgrades to our enterprise resource planning systems; the incurrence of significant costs, liabilities, and obligations as a result of environmental requirements and other regulatory risks; extensive and growing governmental regulations; the adverse impact of climate change and related energy legislation and regulation; the incurrence of material costs related to legal proceedings; our inability to recruit and retain key personnel; any failure to maintain satisfactory laborrelations; pension and other postretirement benefit obligations; risks related to our global operations; competitive threats posed by global operations and entering new markets; foreign exchange rate fluctuations; increased costs and obligations as a result of becoming a public company; the failure of our internal controls to meet the standards required by Sarbanes-Oxley; our substantial indebtedness; our inability, or the inability of our customers or our suppliers, to obtain and maintain sufficient debt financing, including working capital lines; our exposure to a number of different tax uncertainties; the mix of profits and losses in various jurisdictions adversely affecting our tax rate; disruption from the combination of our operations and diversion of management’s attention; our limited history of working as a single company and the inability to integrate HHI, Metaldyne, and Grede successfully and achieve the anticipated benefits.
For the reasons described above, we caution you against relying on any forward-looking statements, which should also be read in conjunction with the other cautionary statements that are included elsewhere in this press release and in our public filings, including under the heading “Risk Factors” in our filings that we make from time to time w ith the Securities and Exchange Commission. You should not consider any list of such factors to be an exhaustive statement of all of the risks, uncertainties, or potentially inaccurate assumptions that could cause our current expectations or beliefs to change. Further, any forward-looking statement speaks only as of the date on which it is made, and we undertake no obligation to update or revise any forward-looking statement to reflect events or circumstances after the date on which the statement is made or to reflect the occurrence of unanticipated events, except as otherwise may be required by law.
Non-GAAP Financial Measures
Combined Net Sales -We define Combined Net Sales as the net sales of MPG plus the net sales of Grede prior to our acquisition of Grede. We present Combined Net Sales because our management considers it to be a useful, supplemental
indicator of our performance when comparing periods before and after our acquisition of Grede. For a reconciliation of Combined Net Sales to net sales, the most directly comparable GAAP measure, see Appendix to this presentation.
Adjusted EBITDA and Combined Adjusted EBITDA -We define Adjusted EBITDA as net income (loss) before interest expense, provision for (benefit from) income taxes and depreciation and amortization, with further adjustments to reflect the additions and eliminations of
certain income statement items, including (i) gains and losses on foreign currency and fixed assets and debt transaction expenses, (ii) stock-based compensation and other non-cash charges, (iii) sponsor management fees and other income and expense items that we consider to be not indicative of our ongoing operations, (iv) specified non-recurring items and (v) other adjustments. We define Combined Adjusted EBITDA as Adjusted EBITDA plus the Adjusted EBITDA of Grede prior to our acquisition of Grede. We believe Adjusted EBITDA is used by investors as a supplemental measure to evaluate the overall operating performance of companies in our industry. Management uses Adjusted EBITDA (i) as a measurement used in comparing our operating performance on a consistent basis, (ii) to calculate incentive compensation for our employees, (iii) for planning purposes, including the preparation of our internal annual operating budget, (iv) to evaluate the performance and effectiveness of our operational strategies and (v) to assess compliance with various metrics associated with our agreements governing our indebtedness. Accordingly, we believe that Adjusted EBITDA provides useful information to investors and others in understanding and evaluating our operating performance in the same manner as our management. We present Combined Adjusted EBITDA because our management considers it to be a useful, supplemental indicator of our performance when comparing periods before and after our acquisition of Grede. For a reconciliation of Adjusted EBITDA and Combined Adjusted EBITDA to net income, the most directly comparable measure determined under U.S. generally accepted accounting principles (“GAAP”), see Appendix to this presentation
Adjusted Free Cash Flow and Combined Adjusted Free Cash Flow -We define Adjusted Free Cash Flow as Adjusted EBITDA less capital expenditures. Capital expenditures can be found in our consolidated statements of cash flows as a component of cash flows from investing activities. We
define Combined Adjusted Free Cash Flow as Adjusted Free Cash Flow plus the Adjusted Free Cash Flow of Grede prior to our acquisition of Grede. We present Adjusted Free Cash Flow because our management considers it to be a useful, supplemental indicator of our performance. When measured over time, Adjusted Free Cash Flow provides supplemental information to investors concerning our results of operations and our ability to generate cash flows to satisfy mandatory debt service requirements and make other non-discretionary expenditures. We present Combined Adjusted Free Cash Flow because our management considers it to be a useful, supplemental indicator of our performance when comparing periods before and after our acquisition of Grede. For a reconciliation of Adjusted Free Cash Flow and Combined Adjusted Free Cash Flow to net income, the most directly comparable GAAP measure, see Appendix to this presentation.Combined Non-GAAP Capex -
We define Combined Capex as the capital expenditures of MPG (“Capex”) plus the capital expenditures of Grede prior to our acquisition of Grede. We present Combined Capex because our management considers it to be a useful, supplemental indicator of our performance when comparing periods before and after our acquisition of Grede. For a reconciliation of Combined Capex to Capex, the most directly comparable GAAP measure, see “ADJUSTEMENTS TO RECONCILE TO US GAAP”.
2

3
Agenda
Introduction Paul SuberVice President of Investor Relations
Company Overview George ThanopoulosChief Executive Officer
Financial Results Mark Blaufuss Chief Financial Officer and Treasurer
Investing for Value Creation George Thanopoulos
Q & A SessionGeorge ThanopoulosMark Blaufuss
Paul Suber

COMPANY OVERVIEW
MPG

5
MPG Overview
Metaldyne Performance Group Becomes Public
o MPG was created by combining three leading metal forming companies - HHI, Metaldyne and Grede
o The result is MPG – a $3.1B leading provider of highly-engineered metal components
Products utilized in powertrain and safety-critical applications
MPG serves the global light, commercial and industrial vehicle markets
o Key Strategy Points
Capturing expected growth in powertrain and safety critical components
Delivering strong profitability and cash flow generation
Capitalizing on our global scale and cross-selling opportunities
Transformative Merger Positions MPG for Future Growth
North America, 83%
EU13%
Rest of World4%
MPG 2014 Geographic Footprint
1. Combined Adjusted EBITDA / % of Combined Net Sales (Non-GAAP)

6
Leading Portfolio of Metal Forming Technologies and Value Add Processes
Deep Process and Product Expertise
Technology Vehicle Application Products
Advanced Machining
and Assembly
Powertrain Safety-Critical Other
Aluminum Die Casting
Powertrain
Cold and WarmForging and Machining
Powertrain
Ductile IronCasting
and Machining
Powertrain Safety-Critical Other
Grey IronCasting andMachining
Powertrain
Hot Forgingand Machining
Powertrain Safety-Critical Other
Powder Metal Powertrain
Rubber and Viscous Dampening Assemblies
Powertrain

7
Engine
Powertrain
DrivelineTransmission
MPG Light Vehicle Product Portfolio
Focused on High Growth Product Categories
Key Product Lines
Balance Shaft Assemblies
Isolation Pulleys and Crankshaft Dampers
Bearing Caps
Connecting Rods
Variable Valve Timing Components
Timing Gears and Sprockets
Turbo Charger Housings
Key Product Lines
Axle carriers
Axle Components
Differential Cases
Transfer Case Sprockets Gears and Shafts
Differential Gears, Pinions and Assemblies
Key Product Lines
Aluminum Valve Bodies
Clutch Modules and Assemblies
Gears and Hubs
Hollow and Solid Shafts
Planetary Carriers
Key Product Lines
Brake Components (Calipers, Anchors)
Control Arms Inner and Outer Bearing Rings Steering Knuckles and Shafts
Suspension Arms, Brackets and Attachments
Suspension Links Tie-Rod Ends and Sockets Wheel Bearings
Chassis and Suspension Other Specialty Products
Key Product Lines
Anchors, Housings and Supports
Brackets
Spacers
Structural Components
Safety-Critical Other

8
Engine Covers
Turbo Housings
MPG Commercial Vehicle and Industrial Equipment Product Portfolio
Engine
Key Product Lines
Manifolds
Connecting Rods
Flywheel Covers
Powertrain
Transmission
Key Product Lines
Gears
Shifts
Valve Bodies
Key Product Lines
Brackets
Gear Housings
Pump Housings
Knuckles
Suspension Links
Calipers
Steering, Suspension, Chassis, and Brake Parts Other Specialty Products
Key Product Lines
Scrolls
Housings
Hydraulic Valve Bodies
Hydraulic Housings
Pump Housings
Structural Component
Safety-Critical
Key Product Lines
Axle Housings
Differential Cases
Hubs
Driveline
Planetary Carriers
Gears
Housings
Differential Cases
Other
End Market Diversification and Additional Growth Opportunities

9
Advanced Machining and Assembly
Aluminum Die Casting
Forging and Related Machining
Iron Casting and Related Machining
Powder Metal and Related Machining
Administrative/Sales/Engineering
Warehouse
Premier Asset Base Positions MPG for Global Growth
Highly Valuable Global Manufacturing Footprint
U.S.
Mexico
Brazil
England
Spain
France
Czech Republic
Germany
China
India
South Korea
61 locations
Ability to meet anticipated growth by adding select equipment
Combined manufacturing, technical and commercial footprint across four continents
Serves customers’ global Powertrain manufacturing needs
Geographic Footprint Advantages
Luxembourg
Japan

FINANCIAL RESULTS
MPG

11
Near – Term Value Creation
Focus on Strong Profitability and
Cash Flow Generation
Debt ReductionMaintain or Grow Dividend
o Secure growth through new business wins
o Execute on vertical integration/cross-selling
o Focused cash flow model
Continue Driving Shareholder Value

12
Q1 2015 and FY 2014 Financial Results
($ in Millions) First Quarter 20152014 Combined Non-
GAAP Results1
Net Sales $765.2 $3,144.0
Adjusted EBITDA 132.6 545.1
Percent of Net Sales 17.3% 17.3%
Capex 60.7 168.2
Adjusted Free Cash Flow2 $71.9 376.9
1 See Appendix for reconciliation to GAAP2 Defined as Adjusted EBITDA less Capex
Financial information is presented on a combined non-GAAP basis to give affect to the combination of the three business units as of January 1, 2014

13
Treasury Updates for Q1 2015
May Refinancing
o MPG launched a refinancing in April 2015
Converted a portion of USD based term loan into 225 million Euro based term loan
Reduced interest rates translate into annual cash savings of $6.6 million
o In addition to the currency hedge provided by the Euro Term Loan, MPG will continue to evaluate any necessary earnings/cash flow hedging strategies
Other Treasury Actions
o Voluntary $10 million prepayment of the Term Loan was made during Q1 2015
o MPG paid its first cash dividend of $0.09 per common share on May 26, 2015
Old Structure New Structure
Tranche Coupon Tranche Coupon
USD Term Loan L+3.25%, 1.00 % Floor 1,326.6$ USD Term Loan L+2.75%, 1.00 % Floor 1,072.6$
New EUR Term Loan (1) E+2.75%, 1.00% Floor 254.1
Bonds 7.375% 600.0 Bonds 7.375% 600.0
Total Debt 1,926.6$ Total Debt 1,926.6$
(1) 225 million Euros

14
Capital Expenditure Guidelines
IRR > 25% Adjusted EBITDA > 15%
Payback < 4 yrs.
o MPG reviews potential investments on several levels
Strategic fit
Customer, product and geography
Financial criteria
Key Investment Financial Metrics
Disciplined Approach to Investment for Value Creation

15
2015 Guidance Ranges
Guidance 2015E 1
Net Sales $3.0 - $3.15 billion
Adjusted EBITDA2 $520 - $560 million
Capital Expenditures $210 - $220 million
Adjusted Free Cash Flow3 $310 - $340 million
1 Represents reaffirmation of guidance provided earlier this year2 See Appendix for reconciliation to GAAP3 Defined as Adjusted EBITDA less Capex, utilizing high and low ends of Adjusted EBITDA and Capex
o Incorporates assumptions included on page 24 of appendix
Assumption Updates
o USD to EUR 1.08 (changed from 1.12)
o Metals Market $236 per gross ton (changed from $250 per gross ton)
o Industrial Market volumes are soft
o Certain North American Passenger Car platform volumes are soft
o Commercial Vehicle volumes remain robust
MPG Reaffirming Earlier Guidance Despite Recent Market Moves

16
Near – Term Value Creation
Focus on Strong
Profitability and Cash Flow Generation
Debt Reduction
Maintain or Grow
Dividend
Continue Driving Shareholder Value
o Secure growth through new business wins
o Execute on vertical integration/cross-selling
o Focused cash flow model
Q1 2015: 17.3% Adjusted EBITDA Margin and $71.9 million Adjusted Free Cash Flow
$10 million in Voluntary Debt
Reduction in Q1 2015
$0.09 Dividend per Share Paid in
May 2015

INVESTING FOR VALUE CREATION
MPG

18
206 211 222 233 219
123 117 115 118 122
329 328 337 351 341
2014 2015 2016 2017 2018
Construction Equipment Agricultural Equipment
296 325 287 275 268
226 230235 247 250
522555
522 522 518
2014 2015 2016 2017 2018
FTR Class 8 ACT Class 5-7
17.0 17.4 17.9 18.3 18.6
2014 2015 2016 2017 2018
North America Light Vehicle Production1
Industry Growth Projections
20.1 20.1 20.521.2
22.0
2014 2015 2016 2017 2018
European Light Vehicle Production1
North America Class 5-8 Vehicle Production2 Industrial Equipment Production3
Positive Outlook for Primary Regions and Markets
1. Vehicle Production in millions: IHS April 20152. Vehicle Production in thousands: FTR and ACT March 20153. Yengst, Q1 20154. Industrial includes Construction, Agriculture and other
North America, 83%
EU13%
Rest of World4%
MPG 2014 End Market Contribution
Light Vehicle78%
Commercial12%
Industrial4
9%
Other1%
MPG 2014 Geographic Footprint

19
MPG’s New Business/Growth Projects
Differential Assemblies: Invest in machining/assembly
equipment and automation to support new powertrain application. Increased content and vertical integration for MPG.
Total Planned Investment $15 - $20 million
Project Complete Early 2017
Projected Peak Revenue $40 - $45 million in 2020
9 speed Transmission Business: Support growth in new transmission business resulting from industry shift to advanced high speed transmissions in an effort to meet CAFE standards.
Total Planned Investment $10 - $15 million
Project Complete 2018
Projected Peak Revenue $15 - $20 million in 2020
Market Dynamics MPG Investment Examples
2.0 2.5 3.1 3.2 3.5 3.5 3.51.1
1.31.9
2.9 3.0 3.5 3.8
0.91.4
2.5
3.13.5
3.5 3.5
0.1
0.7
1.21.9
2.2 2.4
4.05.4
8.1
10.411.8
12.7 13.2
2015 2016 2017 2018 2019 2020 2021
CVT 8-Speed 9-Speed 10- Speed
8/9/10 and CVT Transmission Forecast2
Investing to Capture Expected Powertrain Growth
1. IHS Light Vehicle Production North America March 20152. IHS March 2015 for North American; production in millions

20
MPG’s Cost Saving/Efficiency Improvement Projects
Molding Line Expansion: Install new vertical molding machine and related support equipment to improve efficiency. This improvement also yields us 30% increase in capacity for growth.
Total Investment $15 - $20 million
Project Complete Early 2016
Payback2 < 3 years
Footprint Optimization: Consolidate one of our smaller casting facilities into one of our largest casting facilities. Replacing 3 older molding lines with new state of the art line for improved efficiency and added capacity.
Total Investment $4 - $8 million
Project Complete Early 2016
Payback2 < 2 years
15.4%
16.7%17.3% 17.3%
2012 2013 2014 Q1 2015
Adjusted EBITDA Margin1
1. Combined Adjusted EBITDA / % of Combined Net Sales (non-GAAP)2. Direct savings + Revenue Growth
Maintain or Expand Margins Through Investment in Cost Reduction/Efficiency
Continue to Invest in Business for Future Growth and Returns

21
Long – Term Value Creation
Benefit from Expected Growth in Powertrain and
Safety-Critical Components
Capitalize on Global Scale and
Capabilities
Take Advantage of Cross-Sell
Opportunities
Long – Term Net Sales Target of > $4 Billion
oRamp-up of new programs
o Capture value-added, powertrain content
o Continue global expansion of leadership products

Q & A SESSION
MPG

APPENDIX
MPG

24
Assumptions
Industry Production / Assumptions 2015E
Light Vehicle SAAR North America ~2.5%
Light Vehicle SAAR Europe ~0%
Light Vehicle SAAR Asia ~3.5%
NAFTA Heavy Truck Class 5-8 ~5%
FX Rates End of Q1 2015 February Month End 12/31/14 Rate
USD to Euro 1.08 1.12 1.22
Mexican Peso to USD 15.24 14.94 14.78
Chinese Yuan to USD 6.14 6.16 6.14
Korean Won to USD 1,111 1,100 1,096
Metals Market – Chicago #1 Bundles $236 per gross ton $250 per gross ton $347 per gross ton
IHS January 2015FTR and ACT December 2014FX Rates and Metals Market Rate March 2015
25
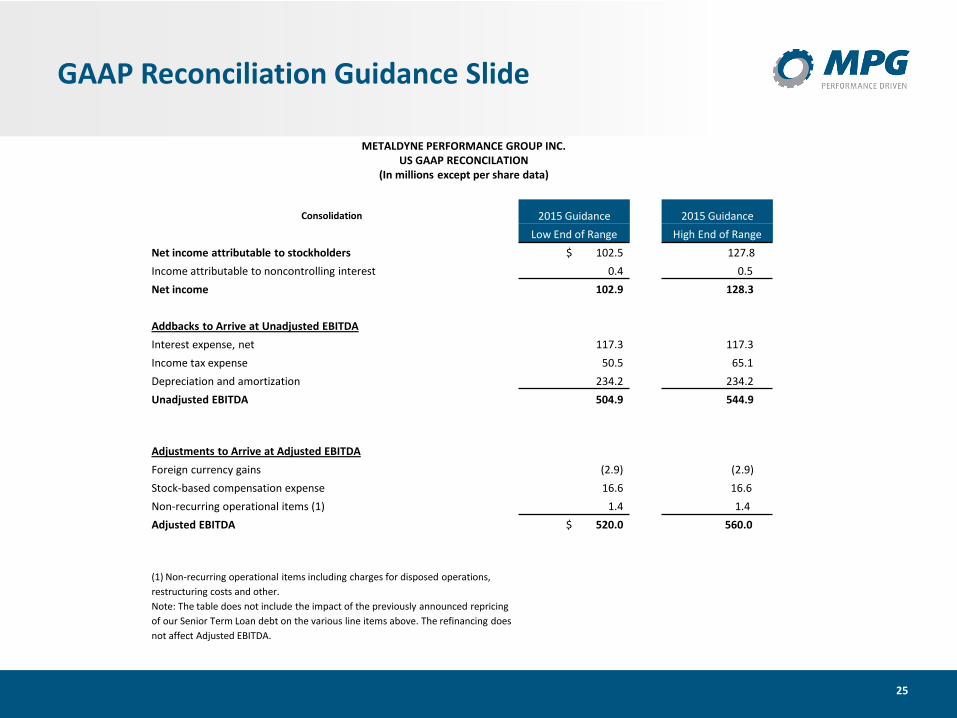
GAAP Reconciliation Guidance Slide
Consolidation 2015 Guidance 2015 Guidance
Low End of Range High End of Range
Net income attributable to stockholders $ 102.5 127.8
Income attributable to noncontrolling interest 0.4 0.5
Net income 102.9 128.3
Addbacks to Arrive at Unadjusted EBITDA
Interest expense, net 117.3 117.3
Income tax expense 50.5 65.1
Depreciation and amortization 234.2 234.2
Unadjusted EBITDA 504.9 544.9
Adjustments to Arrive at Adjusted EBITDA
Foreign currency gains (2.9) (2.9)
Stock-based compensation expense 16.6 16.6
Non-recurring operational items (1) 1.4 1.4
Adjusted EBITDA $ 520.0 560.0
(1) Non-recurring operational items including charges for disposed operations,
restructuring costs and other.
Note: The table does not include the impact of the previously announced repricing
of our Senior Term Loan debt on the various line items above. The refinancing does
not affect Adjusted EBITDA.
METALDYNE PERFORMANCE GROUP INC. US GAAP RECONCILATION
(In millions except per share data)

26
GAAP Reconciliation Slides Full Year
Consolidation Full Year
12/31/2014
Net Sales $2,717.0
Grede pre-acquisition Net Sales 427.0
Combined Net Sales (non-GAAP) 3,144.0
Adjusted EBITDA 478.6
Grede pre-acquisition Adjusted EBITDA 66.5
Combined Adjusted EBITDA 545.1
Capex 156.4
Grede pre-acquisition Capex 11.8
Combined Capex 168.2
Adjusted Free Cash Flows 322.2
Grede pre-acquisition Adjusted Free Cash Flows 54.7
Combined Adjusted Free Cash Flows $376.9
METALDYNE PERFORMANCE GROUP INC. US GAAP RECONCILATION
(In millions)

27
GAAP Reconciliation Full Year
Consolidation Full Year12/31/2014
Net income attributable to shareholders $72.8 Minority Interest Income/Loss 0.4
Net income 73.3
Addbacks to Arrive at Unadjusted EBITDAInterest Expense 99.9 Loss on Debt Transactions 60.7 Income Tax Expenses (19.1)Total Depreciation and Amortization 210.8
Unadjusted EBITDA 425.6
Adjustments to Arrive at Adjusted EBITDAG(L) on Foreign Currency (15.7)Total Gain or (Loss) on Fixed Assets 2.1 Debt transaction expenses 3.0 Stock-based Compensation 17.3 Sponsor Management Fee 5.1 Non-recurring acquisition and purchase accounting related items (1) 23.0 Non-recurring operational items (2) 18.2
Adjusted EBITDA $478.6
(1) Acquisition and related purchase accounting items including transaction costs, adjustments to inventory step-ups and other.
(2) Non-recurring operational items including charges for disposed operations, impairment charges, insurance proceeds, curtailment gain and other.
METALDYNE PERFORMANCE GROUP INC. US GAAP RECONCILATION to Net Income and EBITDA
(In millions)
28
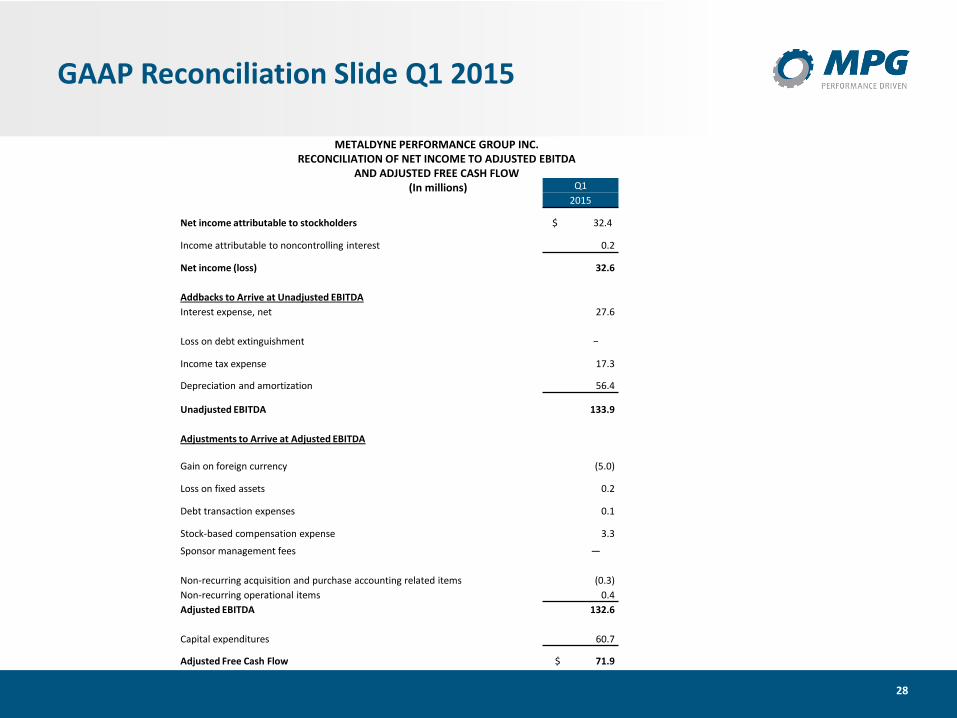
GAAP Reconciliation Slide Q1 2015
Q1
2015
Net income attributable to stockholders $ 32.4
Income attributable to noncontrolling interest 0.2
Net income (loss) 32.6
Addbacks to Arrive at Unadjusted EBITDA
Interest expense, net 27.6
Loss on debt extinguishment −
Income tax expense 17.3
Depreciation and amortization 56.4
Unadjusted EBITDA 133.9
Adjustments to Arrive at Adjusted EBITDA
Gain on foreign currency (5.0)
Loss on fixed assets 0.2
Debt transaction expenses 0.1
Stock-based compensation expense 3.3
Sponsor management fees —
Non-recurring acquisition and purchase accounting related items (0.3)
Non-recurring operational items 0.4
Adjusted EBITDA 132.6
Capital expenditures 60.7
Adjusted Free Cash Flow $ 71.9
METALDYNE PERFORMANCE GROUP INC. RECONCILIATION OF NET INCOME TO ADJUSTED EBITDA
AND ADJUSTED FREE CASH FLOW(In millions)