boston, usa, august 5-11, 2012 · boston, usa, august 5-11, ... bangladeshi 440 1.12492 932 ......
TRANSCRIPT
Session 6C: Gender and Well-Being I
Time: Thursday, August 9, 2012 PM
Paper Prepared for the 32nd General Conference of
The International Association for Research in Income and Wealth
Boston, USA, August 5-11, 2012
Gendered Income Inequalities in the UK: A Comparison Across Ethnic Groups
Alita Nandi and Lucinda Platt
For additional information please contact:
Name: Alita Nandi
Affiliation: ISER, University of Essex, UK
Email Address: [email protected]
This paper is posted on the following website: http://www.iariw.org
1
Gendered Income Inequalities in the UK: A Comparison across Ethnic
Groups
Alita Nandia and Lucinda Platt
b
2012
a Institute for Social and Economic Research, University of Essex
b Institute of Education, University of London
2
1. Introduction and aims
Individual income inequalities between men and women are substantial and persistent.
However, apart from certain analyses in relation to specific groups such as older men and
women, the analysis of gendered income inequalities focuses predominantly on labour
income, rather than on individual incomes from all sources. Such gendered inequalities in
earned income are widely reported and accepted as indicative of wider gendered social
structures. That is, they are typically presented as evidence of social stratification and trends
in pay gaps are typically understood as revealing the extent to which gendered discrimination
in employment is increasing or decreasing. However, they are only partial representations of
gendered income inequalities since they only cover those in paid employment (and often
focus only on those in full-time employment). To the extent that women moving into the
labour market move into worse or better paid jobs, apparent trends in earnings inequality will
be subject to changes in participation. In addition women, out of the labour market are also
potentially subject to income inequalities relative to men. Thus to capture women’s relative
disadvantage a measure of income gaps is potentially more illuminating.
A further issue is that pay gaps or even income gaps are typically estimated at the mean or
median. They thus summarise a whole distribution of income in one value. Yet that does not
acknowledge the diversity of experience among women, nor that gaps may be particularly
acute for women in specific positions, and that pay disadvantage and pay discrimination are
not equivalent. Not only may pay gaps themselves be sensitive to changes in the distribution
of men’s rather than women’s earnings, the issues facing women on different parts of the
income distribution may be very different. There is not necessarily common cause across
women in either their income experience or in the potential solutions to it. Another form of
heterogeneity among women is that they come from different ethnic groups, which have been
extensively linked to differential labour market and income positions. However, there is also
difference within groups that has been disguised by their treatment as meaningful entities.
This within-group diversity can also shed light on our understanding of the experience and
prospects of the group.
Finally, inequalities are of concern in their own right; but it is also important to see them in
the context of overall welfare. The implications of large gender inequalities among the badly
off and the well-off bring different issues of preferences and also potential solutions and
interventions to bear. As was noted in early debates on ‘family wages’ (Rowntree 1918;
Rathbone 1924) women may calculate a trade-off between their own and their husband’s
earnings power; however, such calculations if they entrench differential incomes clearly
increase ‘dependence’ and exacerbate the income challenges faced by single women (whether
with children or not) (Cadbury et al. 1907).
Our paper therefore makes three main contributions: it explores gendered inequalities from
the perspective of income rather than pay; it acknowledges and explores distributional issues
and inequalities at different income points and across different ethnic groups, thus taking
account of heterogeneity among women; and it relates income inequalities faced by women
to their levels of household income, thus making it possible to evaluate them in relation to
overall welfare and differential policy implications that arise from that.
To do this we pool a series of annual cross sectional data sets with detailed information both
on income and the ethnic group of family members, alongside other information: The Family
Resources Survey and its derived data set Households Below Average Income. This uniquely
enables us to explore both individual and household income across men and women of
3
different ethnic groups, with sufficient sample sizes for detailed analysis. We describe the
data in the next section (Section 2). This is followed by a more detailed discussion of the
background and key features of ethnic minorities in the UK in Section 3, which provides the
context for the analysis of gendered income inequalities that makes up the main substance of
the paper in Sections 4 and 5. Section 6 briefly concludes.
2. Data Description
In this paper, we use data from the Family Resources Survey (FRS) and its derived dataset,
Households Below Average Income (HBAI). The FRS is an annual cross-sectional survey
which collects detailed information on income sources for a nationally representative sample
of private households in the UK. It also collects information on socio-demographic
characteristics including age, sex, ethnic group, occupation, educational qualification and
labour market characteristics such as employment status, hours worked, wages, occupation,
etc. The target sample size each year is around 24,000. In order to obtain analytical sample
sizes for analysis of ethnic minority women, we pool data from seven consecutive waves
(2003-04 to 2009-10). Due to differences in the coding of ethnic group for Northern Ireland
we restrict the analysis to that of Great Britain only. As we use data from HBAI, which
excludes partnered individuals whose partners are temporarily absent from the household, our
analysis also excludes these individuals. Table 1 shows the distribution of the sample used in
our analysis by gender and ethnic group. This corresponds to national estimates of these
subpopulations across Great Britain.
Table 1: Distribution of sample by gender and ethnic group
Male Female All Female to Male Ratio
White British 125,884 141,017 266,901 1.12
(88.9%) 88.5% 88.7%
Indian 2,550 2,613 5,163 1.02
(1.8%) (1.6%) (1.7%)
Pakistani 1,538 1,610 3,148 1.05
(1.1%) (1.0%) (1.0%)
Bangladeshi 440 492 932 1.12
(0.3%) (0.3%) (0.3%)
Chinese 417 556 973 1.33
(0.3%) (0.3%) (0.3%)
Caribbean 1,161 1,541 2,702 1.33
(0.8%) (1.0%) (0.9%)
African 1,207 1,573 2,780 1.30
(0.9%) (1.0%) (0.9%)
Mixed 983 1,179 2,162 1.20
(0.7%) (0.7%) (0.7%)
Other 7358 8694 16052 1.18
(5.2%) (5.5%) (5.3%)
All groups 141,538 159,275 300,813 1.13
All statistics reported in this paper are weighted using sample weights which account for
sampling design and non-response. These weights are designed to scale up the sample to the
UK population.
4
All nominal figures are deflated by the consumer price index for October of the respective
year (with October 2007 as the base year) using consumer price indices supplied by the
Office of National Statistics (2011).
We use weekly individual income net of taxes as a measure of individual income. The
different sources of income are earnings, self-employment income, disability and other
benefit income, retirement pension income plus other pension incomes, investment income,
working tax credit received as benefit and other sources of income including transfers and
gifts.
As a measure of household income we use net equivalised weekly household income
available in the FRS datasets. This figure is computed by adding up income, net of taxes, of
all individuals in the household and then dividing it by the OECD equivalence factor for that
household composition (which has a value of 1 for a single person with no children). Note
this does not exclude housing costs.
When computing household level statistics for different ethnic groups we assign the ethnic
group of household head of household to the entire household.
We compute different inequality measures using ineqdeco, a Stata user-defined program
(version 2.0.2 Stephen P. Jenkins, May 2008).
3. Background and context
There is widespread recognition of women’s occupational disadvantage and of gendered
inequalities in work and specifically pay. The economic disadvantage in earnings faced by
women is much discussed and the pay gap is frequently regarded as totemic of levels of
gender stratification in society and the discrimination faced by women (see e.g. Perfect
2011). For example, the Fawcett Society in the UK campaigns explicitly around raw pay gaps
as a measure of women’s economic disadvantage and of labour market inequality; and the
Woman and Work Commission report of 2006 (updated in 2009) implied that pay gaps
represented systematic devaluation of women in the labour market. The Commission also
equated pay gaps with low pay – or low income, thus divorcing them from the distribution
and suggesting that the average could be extrapolated across women. After all pay gaps are
typically measured at the mean or median, and are most often reported for full-time wages
only.
While extensive analysis of pay gaps has shown the complexity of the factors that contribute
to differences in average pay between men and women, including interruptions to
participation due to mothering responsibilities (England 2005; Olsen et al. 2010),
participation in part-time paid work (Manning and Petrongolo 2008) and occupational
segregation (England 2005), common to most research on women’s economic disadvantage is
a willingness to accept labour market disadvantage as an adequate measure of gendered
economic inequality, and to focus on the mean or midpoint (median) of the distribution.
On the other hand, those focusing on interrogating income inequalities between men and
women, typically focus on the distribution of incomes within couples specifically, and the
role of sharing or intra-household negotiation (e.g. Vogler and Pahl 1994). Though valuable
in aiding our understanding of negotiations between those with different earning power, and
enhancing our understanding of issues of autonomy and economic control, it leaves aggregate

5
inequalities encompassing single men and women and their relative positions within societies
unexplored.
A focus on women's average labour income relative to men's or on household level
distributions of income, may miss much of the complexity of how inequalities themselves
affect different groups of men and women in different ways. The importance of intersections
of gendered and ethnic inequalities are increasingly acknowledged. For example, Browne and
Misra write that
Most sociologists...who study economic inequality readily acknowledge that any
analysis of women that ignores race will be incomplete.... (Browne and Misra 2003:
487)
However, often for practical reasons to do with sample sizes, and lack of data which can take
good account of varying work histories across ethnic groups as well as between men and
women, economic inequalities at the intersection of gender and ethnicity have not received
extensive attention (for partial UK exceptions see Platt 2006, Longhi and Platt 2008). Perfect
(2011) highlighted the need for greater attention to pay gaps by ethnicity.
Examination of ethnic heterogeneity is both informative in itself and can shed light on the
ways in which economic inequalities are influenced by issues of labour market selectivity and
the different consequences of gendering of family responsibilities in households with
different earnings (and income generation) potential across household members. For
example Platt (2006) speculated that observed pay gaps across ethnic groups were driven by
different average forms of household composition: where women could afford to be in low-
paid / part-time work; where only full-time work was economically viable, and where (low)
paid-employment was not, at the household level, necessarily an economically rational
choice, and therefore paid work was rare, but well-remunerated for those women who
undertook it.
Such ethnic differentiations thus draw valuable attention to potential differences in the
implications of pay gaps, to their limitations as measures of overall economic well-being,
and to the heterogeneity experienced by different ‘groups’ of women, where such groupings
correspond to clear differences in average experience.
The UK’s ethnic groups as measured by existing categorisations, provide a set of
subpopulations where differences in average experience across a range of demographic and
labour market experiences are relatively well defined (Platt 2007, 2011). Examination of
variation across ethnic groups draws attention to three clear ways in which a focus on mean
pay gaps is insufficient to capture gendered economic inequalities: labour market
participation; relative household income position; and heterogeneity in the form of dispersion
of incomes (income inequalities among women and within groups). Ethnic differentiation
thus provides a way in to exploring broader understandings of gendered inequalities, based on
individual and household income and recognising diversity of experience across groups.
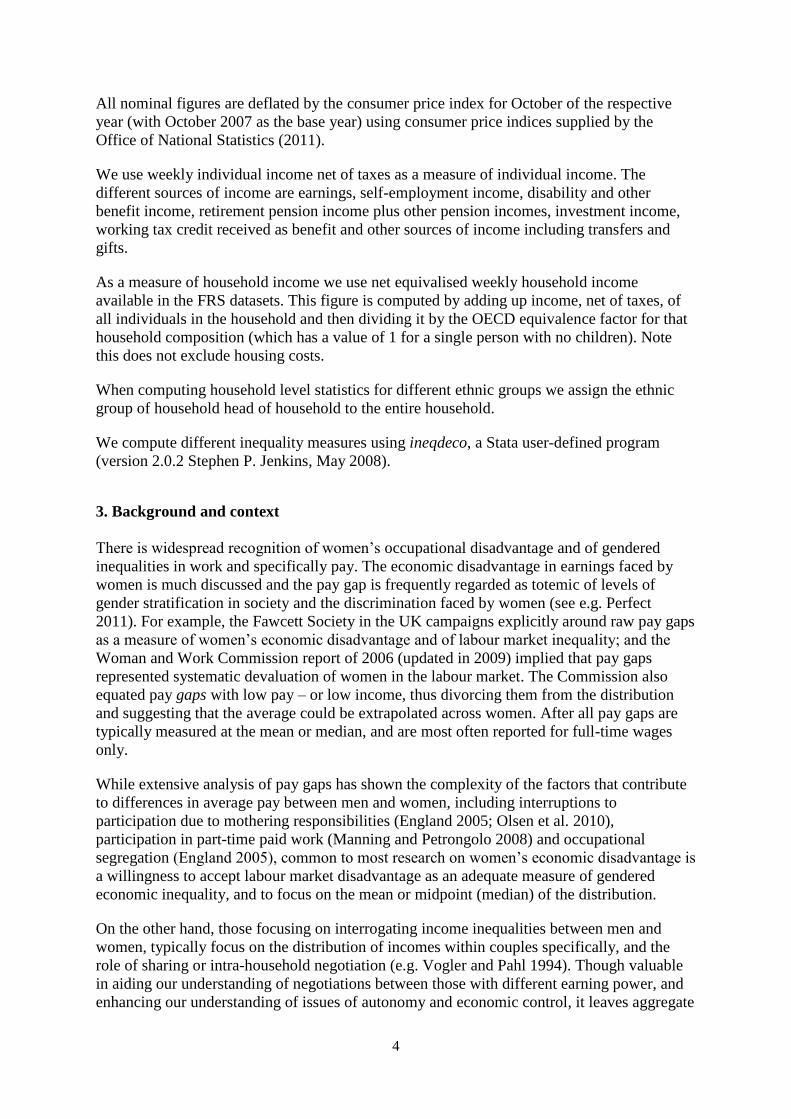
First, a focus on labour income fails to consider all those who are not participating in the
labour market. As the proportion of women not in paid employment (particularly full-time
paid employment) varies by ethnic group, the proportion of women left out of this analysis of
gender disadvantage is dramatically higher for some ethnic groups, such as Bangladeshi and
Pakistani (see Figure 1).
6
Figure 1: Employment status of working age women across different ethnic groups
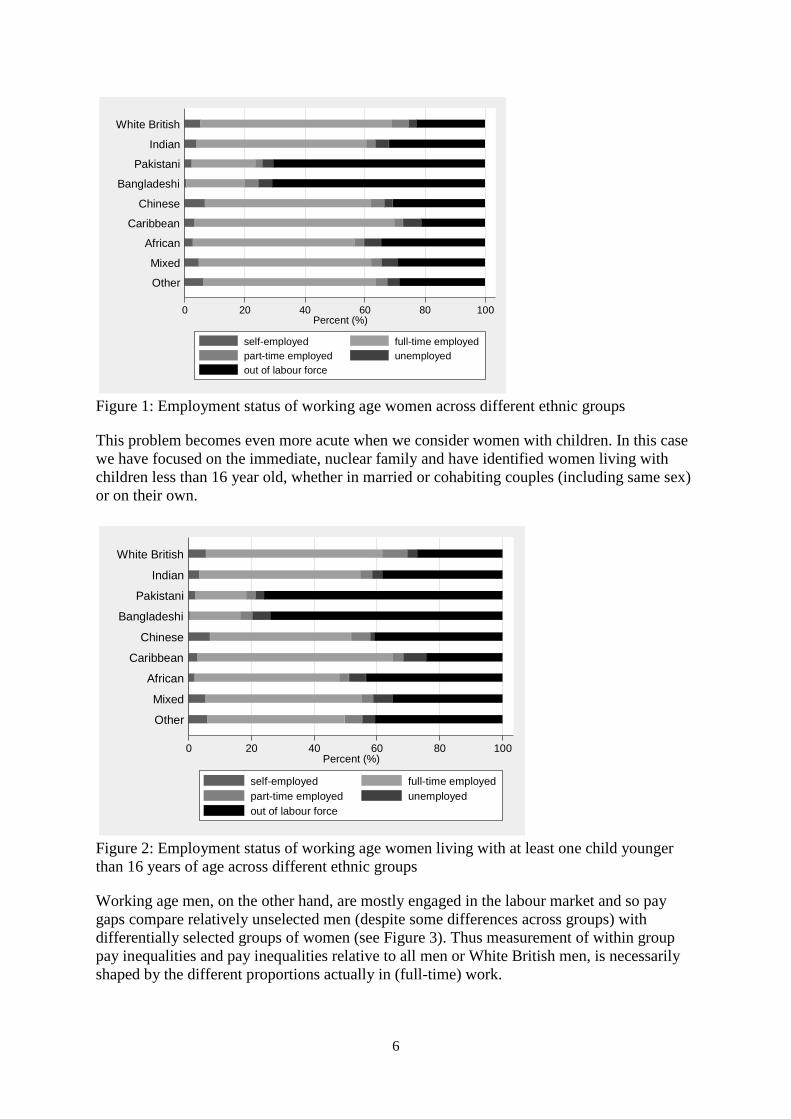
This problem becomes even more acute when we consider women with children. In this case
we have focused on the immediate, nuclear family and have identified women living with
children less than 16 year old, whether in married or cohabiting couples (including same sex)
or on their own.
Figure 2: Employment status of working age women living with at least one child younger
than 16 years of age across different ethnic groups
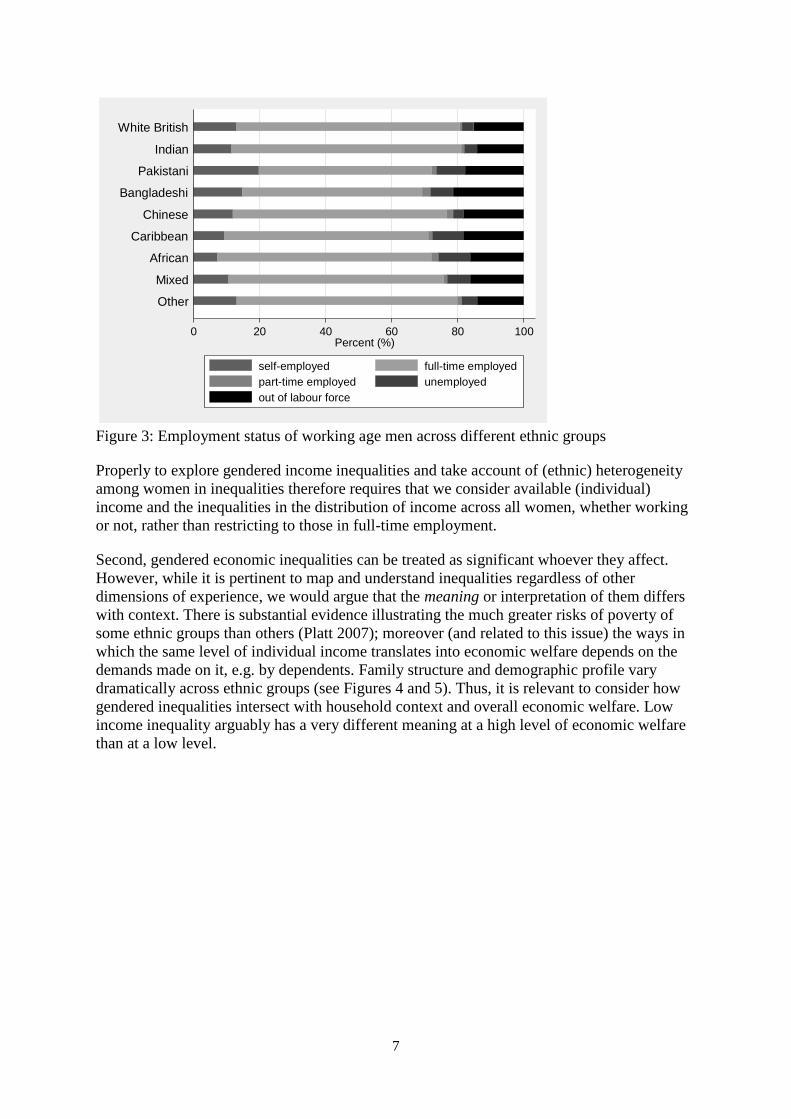
Working age men, on the other hand, are mostly engaged in the labour market and so pay
gaps compare relatively unselected men (despite some differences across groups) with
differentially selected groups of women (see Figure 3). Thus measurement of within group
pay inequalities and pay inequalities relative to all men or White British men, is necessarily
shaped by the different proportions actually in (full-time) work.
0 20 40 60 80 100Percent (%)
Other
Mixed
African
Caribbean
Chinese
Bangladeshi
Pakistani
Indian
White British
self-employed full-time employed
part-time employed unemployed
out of labour force
0 20 40 60 80 100Percent (%)
Other
Mixed
African
Caribbean
Chinese
Bangladeshi
Pakistani
Indian
White British
self-employed full-time employed
part-time employed unemployed
out of labour force
7
Figure 3: Employment status of working age men across different ethnic groups
Properly to explore gendered income inequalities and take account of (ethnic) heterogeneity
among women in inequalities therefore requires that we consider available (individual)
income and the inequalities in the distribution of income across all women, whether working
or not, rather than restricting to those in full-time employment.
Second, gendered economic inequalities can be treated as significant whoever they affect.
However, while it is pertinent to map and understand inequalities regardless of other
dimensions of experience, we would argue that the meaning or interpretation of them differs
with context. There is substantial evidence illustrating the much greater risks of poverty of
some ethnic groups than others (Platt 2007); moreover (and related to this issue) the ways in
which the same level of individual income translates into economic welfare depends on the
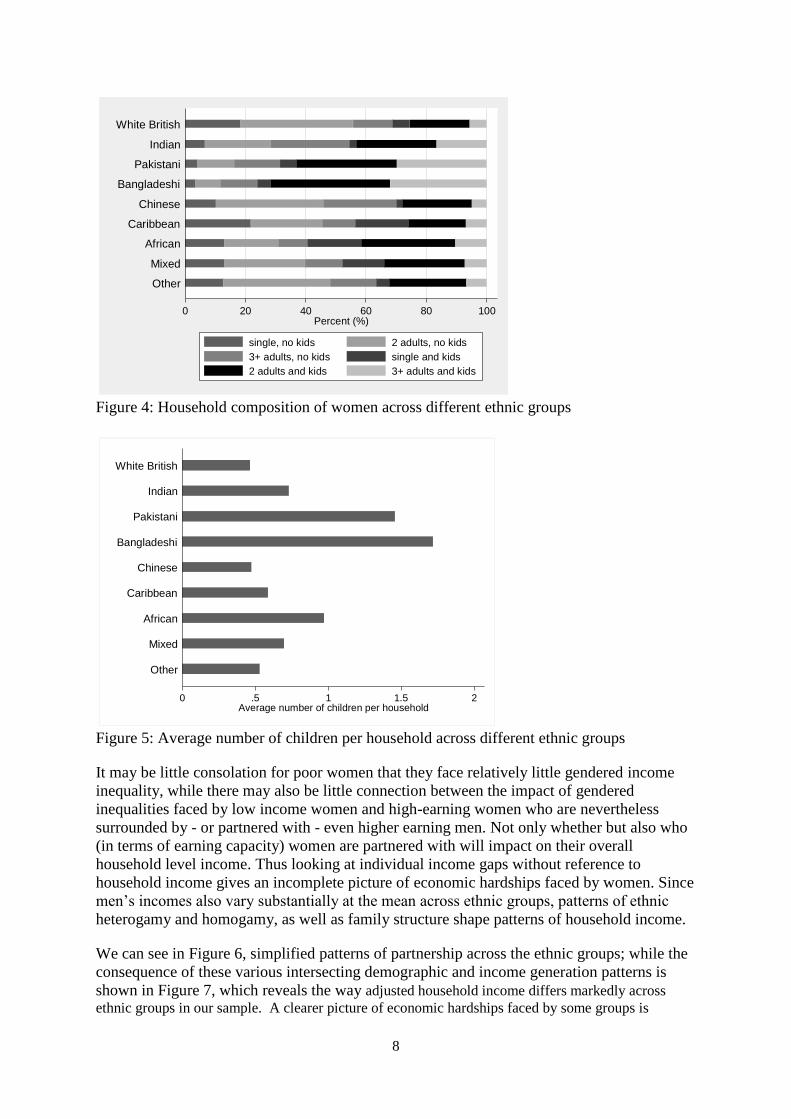
demands made on it, e.g. by dependents. Family structure and demographic profile vary
dramatically across ethnic groups (see Figures 4 and 5). Thus, it is relevant to consider how
gendered inequalities intersect with household context and overall economic welfare. Low
income inequality arguably has a very different meaning at a high level of economic welfare
than at a low level.
0 20 40 60 80 100Percent (%)
Other
Mixed
African
Caribbean
Chinese
Bangladeshi
Pakistani
Indian
White British
self-employed full-time employed
part-time employed unemployed
out of labour force
8
Figure 4: Household composition of women across different ethnic groups
Figure 5: Average number of children per household across different ethnic groups
It may be little consolation for poor women that they face relatively little gendered income
inequality, while there may also be little connection between the impact of gendered
inequalities faced by low income women and high-earning women who are nevertheless
surrounded by - or partnered with - even higher earning men. Not only whether but also who
(in terms of earning capacity) women are partnered with will impact on their overall
household level income. Thus looking at individual income gaps without reference to
household income gives an incomplete picture of economic hardships faced by women. Since
men’s incomes also vary substantially at the mean across ethnic groups, patterns of ethnic
heterogamy and homogamy, as well as family structure shape patterns of household income.
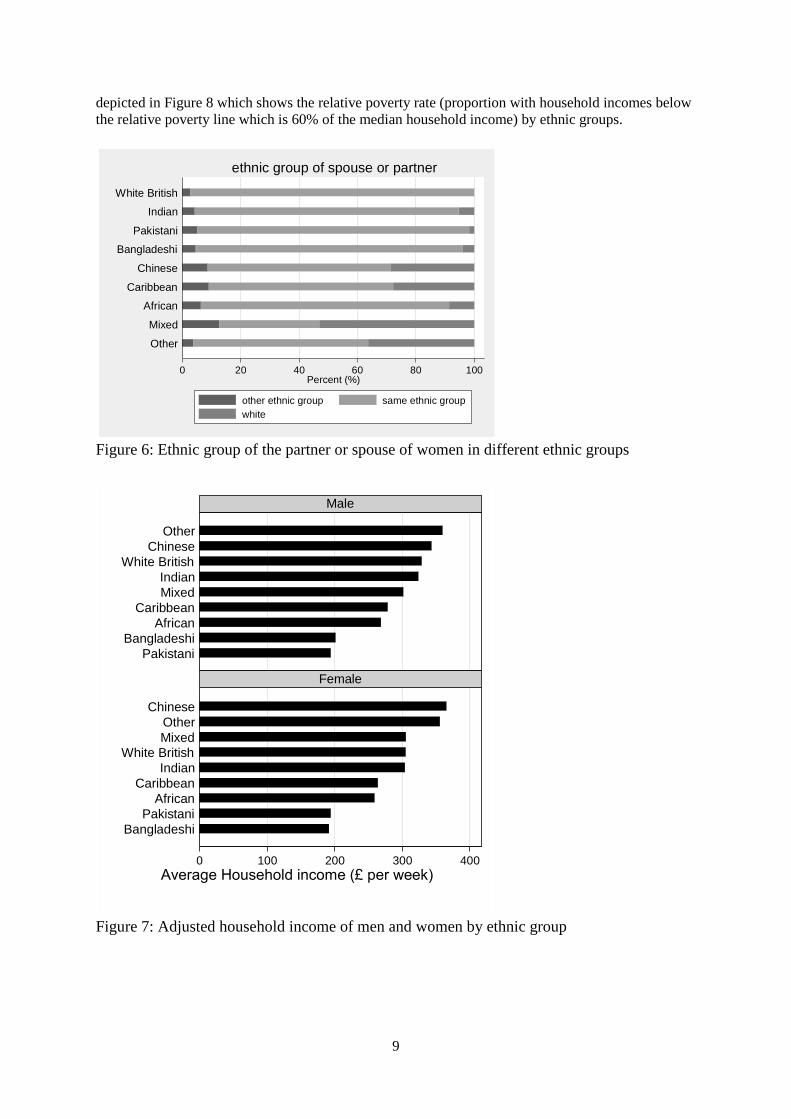
We can see in Figure 6, simplified patterns of partnership across the ethnic groups; while the
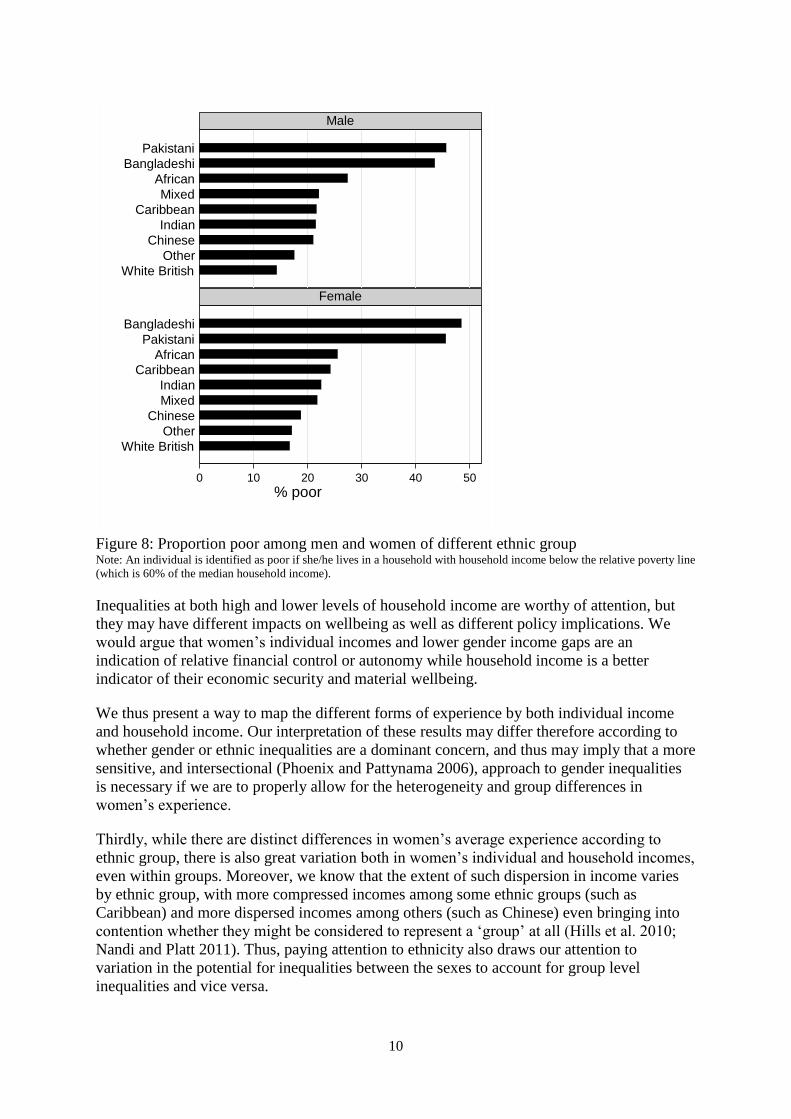
consequence of these various intersecting demographic and income generation patterns is
shown in Figure 7, which reveals the way adjusted household income differs markedly across
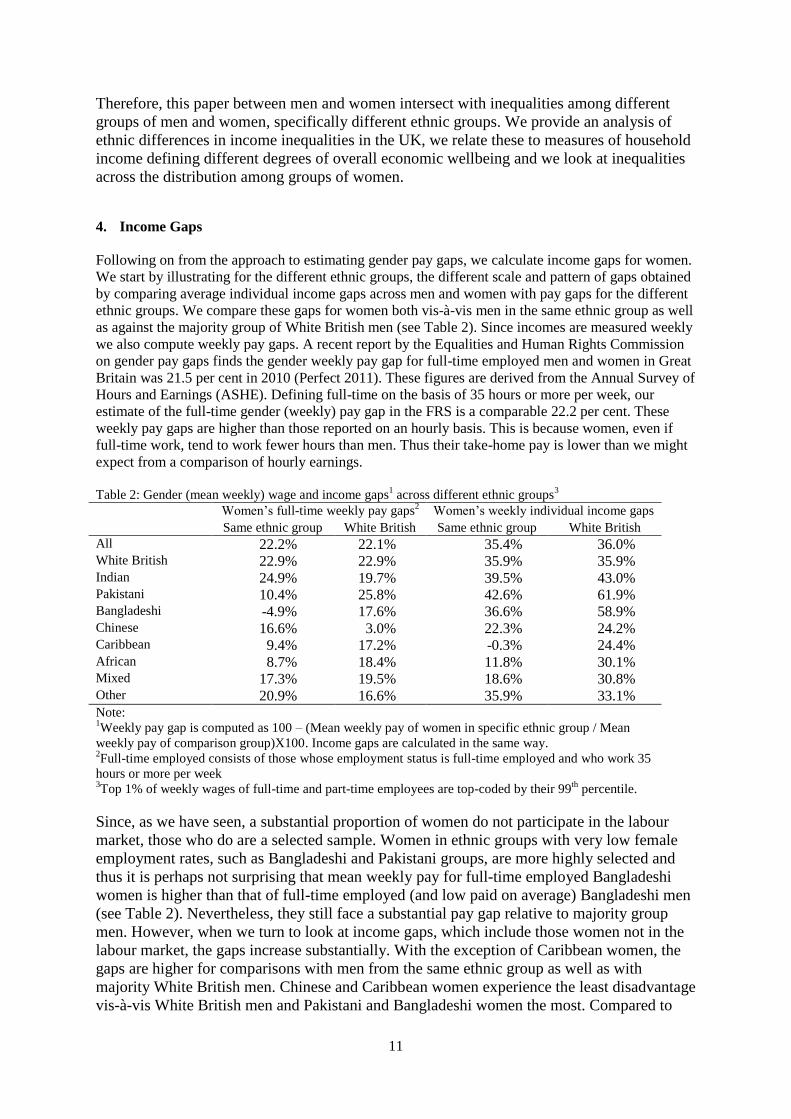
ethnic groups in our sample. A clearer picture of economic hardships faced by some groups is
0 20 40 60 80 100Percent (%)
Other
Mixed
African
Caribbean
Chinese
Bangladeshi
Pakistani
Indian
White British
single, no kids 2 adults, no kids
3+ adults, no kids single and kids
2 adults and kids 3+ adults and kids
0 .5 1 1.5 2Average number of children per household
Other
Mixed
African
Caribbean
Chinese
Bangladeshi
Pakistani
Indian
White British
9
depicted in Figure 8 which shows the relative poverty rate (proportion with household incomes below
the relative poverty line which is 60% of the median household income) by ethnic groups.
Figure 6: Ethnic group of the partner or spouse of women in different ethnic groups
Figure 7: Adjusted household income of men and women by ethnic group
0 20 40 60 80 100Percent (%)
Other
Mixed
African
Caribbean
Chinese
Bangladeshi
Pakistani
Indian
White British
ethnic group of spouse or partner
other ethnic group same ethnic group
white
0 100 200 300 400
Pakistani
Bangladeshi
African
Caribbean
Mixed
Indian
White British
Chinese
Other
Bangladeshi
Pakistani
African
Caribbean
Indian
White BritishMixed
Other
Chinese
Male
Female
Average Household income (£ per week)
10
Figure 8: Proportion poor among men and women of different ethnic group Note: An individual is identified as poor if she/he lives in a household with household income below the relative poverty line
(which is 60% of the median household income).
Inequalities at both high and lower levels of household income are worthy of attention, but
they may have different impacts on wellbeing as well as different policy implications. We
would argue that women’s individual incomes and lower gender income gaps are an
indication of relative financial control or autonomy while household income is a better
indicator of their economic security and material wellbeing.
We thus present a way to map the different forms of experience by both individual income
and household income. Our interpretation of these results may differ therefore according to
whether gender or ethnic inequalities are a dominant concern, and thus may imply that a more
sensitive, and intersectional (Phoenix and Pattynama 2006), approach to gender inequalities
is necessary if we are to properly allow for the heterogeneity and group differences in
women’s experience.
Thirdly, while there are distinct differences in women’s average experience according to
ethnic group, there is also great variation both in women’s individual and household incomes,
even within groups. Moreover, we know that the extent of such dispersion in income varies
by ethnic group, with more compressed incomes among some ethnic groups (such as
Caribbean) and more dispersed incomes among others (such as Chinese) even bringing into
contention whether they might be considered to represent a ‘group’ at all (Hills et al. 2010;
Nandi and Platt 2011). Thus, paying attention to ethnicity also draws our attention to
variation in the potential for inequalities between the sexes to account for group level
inequalities and vice versa.
0 10 20 30 40 50
White British
Other
Chinese
Indian
Caribbean
Mixed
African
Bangladeshi
Pakistani
White British
Other
Chinese
Mixed
Indian
CaribbeanAfrican
Pakistani
Bangladeshi
Male
Female
% poor
11
Therefore, this paper between men and women intersect with inequalities among different
groups of men and women, specifically different ethnic groups. We provide an analysis of
ethnic differences in income inequalities in the UK, we relate these to measures of household
income defining different degrees of overall economic wellbeing and we look at inequalities
across the distribution among groups of women.
4. Income Gaps
Following on from the approach to estimating gender pay gaps, we calculate income gaps for women.
We start by illustrating for the different ethnic groups, the different scale and pattern of gaps obtained
by comparing average individual income gaps across men and women with pay gaps for the different
ethnic groups. We compare these gaps for women both vis-à-vis men in the same ethnic group as well
as against the majority group of White British men (see Table 2). Since incomes are measured weekly
we also compute weekly pay gaps. A recent report by the Equalities and Human Rights Commission
on gender pay gaps finds the gender weekly pay gap for full-time employed men and women in Great
Britain was 21.5 per cent in 2010 (Perfect 2011). These figures are derived from the Annual Survey of
Hours and Earnings (ASHE). Defining full-time on the basis of 35 hours or more per week, our
estimate of the full-time gender (weekly) pay gap in the FRS is a comparable 22.2 per cent. These
weekly pay gaps are higher than those reported on an hourly basis. This is because women, even if
full-time work, tend to work fewer hours than men. Thus their take-home pay is lower than we might
expect from a comparison of hourly earnings.
Table 2: Gender (mean weekly) wage and income gaps
1 across different ethnic groups
3
Women’s full-time weekly pay gaps2 Women’s weekly individual income gaps
Same ethnic group White British Same ethnic group White British
All 22.2% 22.1% 35.4% 36.0% White British 22.9% 22.9% 35.9% 35.9% Indian 24.9% 19.7% 39.5% 43.0% Pakistani 10.4% 25.8% 42.6% 61.9% Bangladeshi -4.9% 17.6% 36.6% 58.9% Chinese 16.6% 3.0% 22.3% 24.2% Caribbean 9.4% 17.2% -0.3% 24.4% African 8.7% 18.4% 11.8% 30.1% Mixed 17.3% 19.5% 18.6% 30.8% Other 20.9% 16.6% 35.9% 33.1% Note: 1Weekly pay gap is computed as 100 – (Mean weekly pay of women in specific ethnic group / Mean
weekly pay of comparison group)X100. Income gaps are calculated in the same way. 2Full-time employed consists of those whose employment status is full-time employed and who work 35
hours or more per week 3Top 1% of weekly wages of full-time and part-time employees are top-coded by their 99
th percentile.
Since, as we have seen, a substantial proportion of women do not participate in the labour
market, those who do are a selected sample. Women in ethnic groups with very low female
employment rates, such as Bangladeshi and Pakistani groups, are more highly selected and
thus it is perhaps not surprising that mean weekly pay for full-time employed Bangladeshi
women is higher than that of full-time employed (and low paid on average) Bangladeshi men
(see Table 2). Nevertheless, they still face a substantial pay gap relative to majority group
men. However, when we turn to look at income gaps, which include those women not in the
labour market, the gaps increase substantially. With the exception of Caribbean women, the
gaps are higher for comparisons with men from the same ethnic group as well as with
majority White British men. Chinese and Caribbean women experience the least disadvantage
vis-à-vis White British men and Pakistani and Bangladeshi women the most. Compared to
12
men of the same ethnic group, African and Caribbean women are the least disadvantaged and
Pakistani and Bangladeshi women the most.
The lack of an individual income gap for Caribbean women reflects first that men in full-time
employment are relatively more selected than for other groups, through relatively high
unemployment rates and second that Caribbean women in employment are relatively less
selected give high rates of full-time participation. Thus including non-employed women does
not suppress Caribbean women’s incomes as much as for other women, and including non-
employed men in the reference category suppresses their average more than for other groups.
An additional factor is likely to be the fact that Caribbean women have the highest rates of
lone-parenthood, and thus those mothers not in the labour market are more likely to be the
sole recipients of child-related benefits that might otherwise be attributed in whole or in part
to the partner.
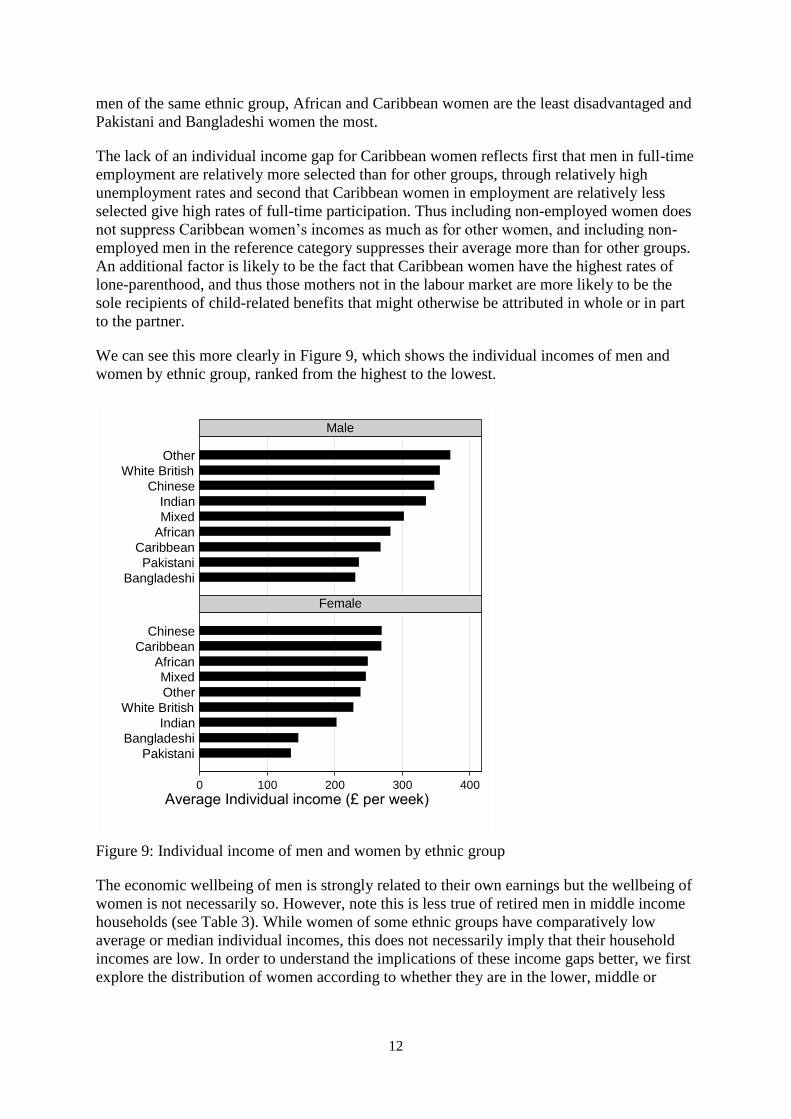
We can see this more clearly in Figure 9, which shows the individual incomes of men and
women by ethnic group, ranked from the highest to the lowest.
Figure 9: Individual income of men and women by ethnic group
The economic wellbeing of men is strongly related to their own earnings but the wellbeing of
women is not necessarily so. However, note this is less true of retired men in middle income
households (see Table 3). While women of some ethnic groups have comparatively low
average or median individual incomes, this does not necessarily imply that their household
incomes are low. In order to understand the implications of these income gaps better, we first
explore the distribution of women according to whether they are in the lower, middle or
0 100 200 300 400
Bangladeshi
Pakistani
Caribbean
African
Mixed
Indian
Chinese
White British
Other
Pakistani
Bangladeshi
Indian
White British
Other
MixedAfrican
Caribbean
Chinese
Male
Female
Average Individual income (£ per week)
13
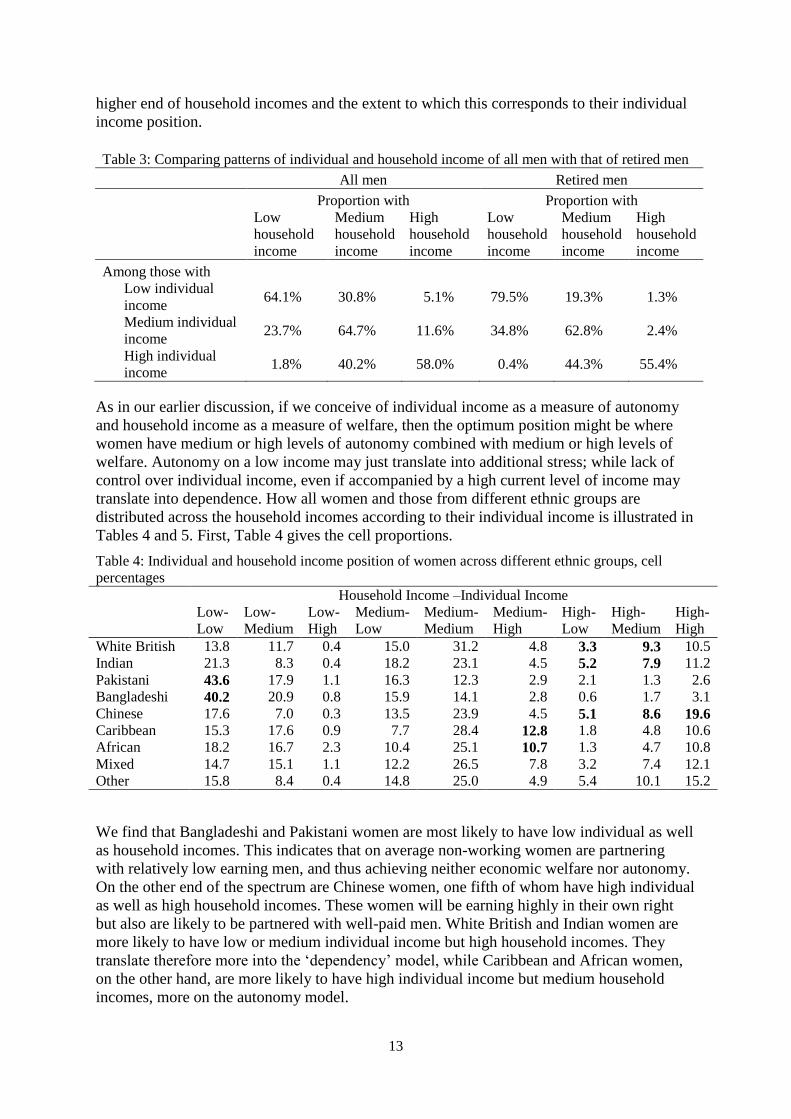
higher end of household incomes and the extent to which this corresponds to their individual
income position.
Table 3: Comparing patterns of individual and household income of all men with that of retired men
All men Retired men
Proportion with Proportion with
Low
household
income
Medium
household
income
High
household
income
Low
household
income
Medium
household
income
High
household
income
Among those with
Low individual
income 64.1% 30.8% 5.1% 79.5% 19.3% 1.3%
Medium individual
income 23.7% 64.7% 11.6% 34.8% 62.8% 2.4%
High individual
income 1.8% 40.2% 58.0% 0.4% 44.3% 55.4%
As in our earlier discussion, if we conceive of individual income as a measure of autonomy
and household income as a measure of welfare, then the optimum position might be where
women have medium or high levels of autonomy combined with medium or high levels of
welfare. Autonomy on a low income may just translate into additional stress; while lack of
control over individual income, even if accompanied by a high current level of income may
translate into dependence. How all women and those from different ethnic groups are
distributed across the household incomes according to their individual income is illustrated in
Tables 4 and 5. First, Table 4 gives the cell proportions.
Table 4: Individual and household income position of women across different ethnic groups, cell
percentages
Household Income –Individual Income
Low-
Low
Low-
Medium
Low-
High
Medium-
Low
Medium-
Medium
Medium-
High
High-
Low
High-
Medium
High-
High
White British 13.8 11.7 0.4 15.0 31.2 4.8 3.3 9.3 10.5
Indian 21.3 8.3 0.4 18.2 23.1 4.5 5.2 7.9 11.2
Pakistani 43.6 17.9 1.1 16.3 12.3 2.9 2.1 1.3 2.6
Bangladeshi 40.2 20.9 0.8 15.9 14.1 2.8 0.6 1.7 3.1
Chinese 17.6 7.0 0.3 13.5 23.9 4.5 5.1 8.6 19.6
Caribbean 15.3 17.6 0.9 7.7 28.4 12.8 1.8 4.8 10.6
African 18.2 16.7 2.3 10.4 25.1 10.7 1.3 4.7 10.8
Mixed 14.7 15.1 1.1 12.2 26.5 7.8 3.2 7.4 12.1
Other 15.8 8.4 0.4 14.8 25.0 4.9 5.4 10.1 15.2
We find that Bangladeshi and Pakistani women are most likely to have low individual as well
as household incomes. This indicates that on average non-working women are partnering
with relatively low earning men, and thus achieving neither economic welfare nor autonomy.
On the other end of the spectrum are Chinese women, one fifth of whom have high individual
as well as high household incomes. These women will be earning highly in their own right
but also are likely to be partnered with well-paid men. White British and Indian women are
more likely to have low or medium individual income but high household incomes. They
translate therefore more into the ‘dependency’ model, while Caribbean and African women,
on the other hand, are more likely to have high individual income but medium household
incomes, more on the autonomy model.

14
Table 5 gives a clearer picture of the relationship between individual and household incomes,
but looking at the shares within each individual income group who are in each household
income group. We see that, 70 per cent of Bangladeshi and Pakistani women with low
individual incomes are also likely to have low household income compared to less than 50
per cent for White British, Indian, Mixed and Other groups. Women with low individual
incomes in these latter groups are also most likely to have high household income – around
10 to 14 per cent. On the other hand, even among that small proportion of Pakistani and
Bangladeshi women with high individual incomes, nearly 10 per cent have low household
income nevertheless, whereas by contrast, 77 per cent of Chinese women with high
individual incomes have a high household income and almost none live in low income
households.
Table 5: Distribution of household income for women with low, medium or high
individual income across different ethnic groups
Among women with
low individual income,
proportion of women
whose household
income is
Among women with
medium individual
income, proportion of
women whose household
income is
Among women with high
individual income,
proportion of women
whose household income
is
Low Medium High Low Medium High Low Medium High
White British 44.2 46.4 9.5 24.3 59.7 16.0 3.1 33.5 63.5
Indian 49.4 39.9 10.7 23.4 58.5 18.1 2.7 30.6 66.8
Pakistani 70.8 26.7 3.5 58.9 37.8 3.6 19.3 46.2 34.5
Bangladeshi 75.4 23.5 1.1 60.7 35.6 3.7 17.2 41.4 41.4
Chinese 52.3 35.0 12.7 21.7 59.9 18.4 1.6 21.7 76.7
Caribbean 63.4 30.4 6.2 36.9 54.9 8.3 4.3 55.7 40.1
African 63.2 32.7 4.1 41.7 50.6 7.7 12.9 48.9 38.2
Mixed 50.2 39.6 10.3 33.7 52.4 13.9 5.5 40.8 53.8
Other 45.4 40.9 13.7 22.4 57.5 20.0 2.7 26.9 70.4
Having illustrated the different patterns of individual and household income and which are
dominant for the different ethnic groups, it is then instructive to ascertain what are the
gendered inequalities faced at the different levels of household income, and how they map on
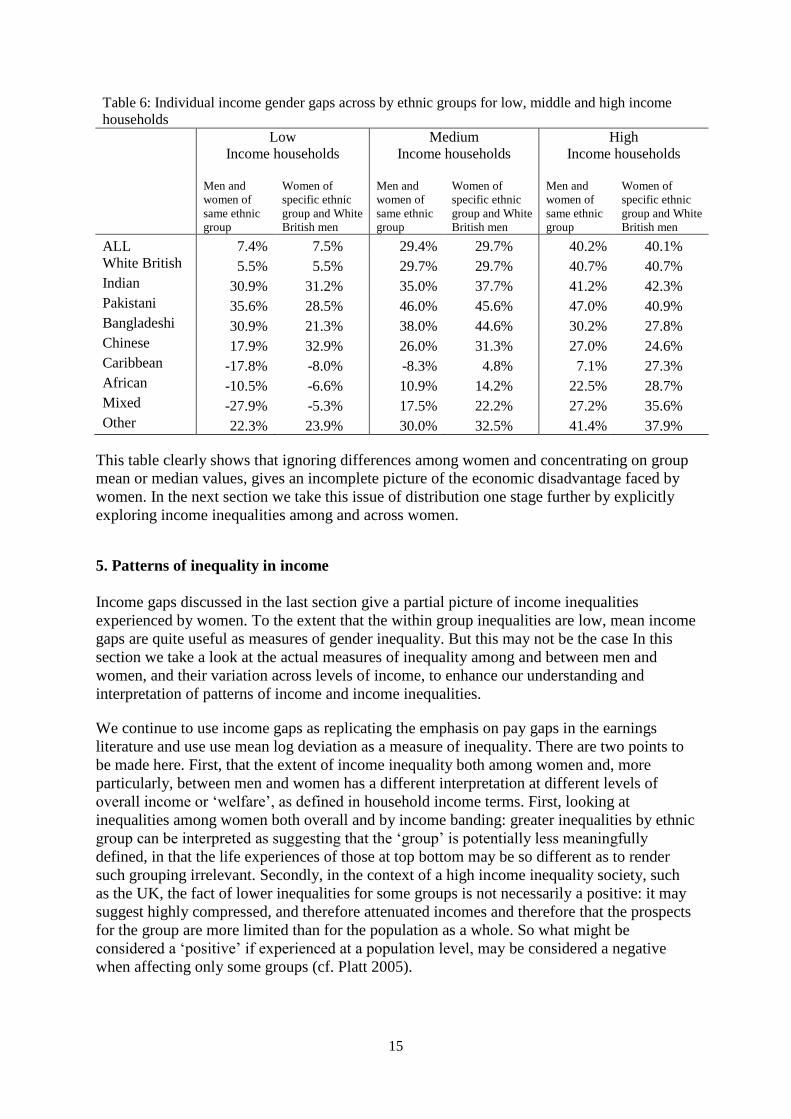
to these patterns of Prevalence. Table 6 shows that, across the board, income gaps are the
smallest in the worst off households and largest in the best off households. This might be
seen not only as expected by theories of the ‘glass ceiling’ (though contra this see Bihagen
and Ohls 2006), but also to some degree reassuring in that low income tallies with lower
inequalities and thus is to a certain extent a consequence of the similarity of income
generation opportunities within couples or between single men and women. However, when
we look across ethnic groups, we find that for Pakistani and Bangladeshi women who are
heavily concentrated in the low household income group, their income gaps are substantial
and similar to those in the high household income group. We also see how Caribbean
women’s relative advantage in terms of individual income gaps is heavily concentrated
among those in low income households and to a lesser extent middle income households. It
is therefore important to consider these distributional issues when moving towards normative
evaluations of income gaps and their relative size.
15
Table 6: Individual income gender gaps across by ethnic groups for low, middle and high income
households
Low
Income households
Medium
Income households
High
Income households
Men and
women of
same ethnic
group
Women of
specific ethnic
group and White
British men
Men and
women of
same ethnic
group
Women of
specific ethnic
group and White
British men
Men and
women of
same ethnic
group
Women of
specific ethnic
group and White
British men
ALL 7.4% 7.5% 29.4% 29.7% 40.2% 40.1%
White British 5.5% 5.5% 29.7% 29.7% 40.7% 40.7%
Indian 30.9% 31.2% 35.0% 37.7% 41.2% 42.3%
Pakistani 35.6% 28.5% 46.0% 45.6% 47.0% 40.9%
Bangladeshi 30.9% 21.3% 38.0% 44.6% 30.2% 27.8%
Chinese 17.9% 32.9% 26.0% 31.3% 27.0% 24.6%
Caribbean -17.8% -8.0% -8.3% 4.8% 7.1% 27.3%
African -10.5% -6.6% 10.9% 14.2% 22.5% 28.7%
Mixed -27.9% -5.3% 17.5% 22.2% 27.2% 35.6%
Other 22.3% 23.9% 30.0% 32.5% 41.4% 37.9%
This table clearly shows that ignoring differences among women and concentrating on group
mean or median values, gives an incomplete picture of the economic disadvantage faced by
women. In the next section we take this issue of distribution one stage further by explicitly
exploring income inequalities among and across women.
5. Patterns of inequality in income
Income gaps discussed in the last section give a partial picture of income inequalities
experienced by women. To the extent that the within group inequalities are low, mean income
gaps are quite useful as measures of gender inequality. But this may not be the case In this
section we take a look at the actual measures of inequality among and between men and
women, and their variation across levels of income, to enhance our understanding and
interpretation of patterns of income and income inequalities.
We continue to use income gaps as replicating the emphasis on pay gaps in the earnings
literature and use use mean log deviation as a measure of inequality. There are two points to
be made here. First, that the extent of income inequality both among women and, more
particularly, between men and women has a different interpretation at different levels of
overall income or ‘welfare’, as defined in household income terms. First, looking at
inequalities among women both overall and by income banding: greater inequalities by ethnic
group can be interpreted as suggesting that the ‘group’ is potentially less meaningfully
defined, in that the life experiences of those at top bottom may be so different as to render
such grouping irrelevant. Secondly, in the context of a high income inequality society, such
as the UK, the fact of lower inequalities for some groups is not necessarily a positive: it may
suggest highly compressed, and therefore attenuated incomes and therefore that the prospects
for the group are more limited than for the population as a whole. So what might be
considered a ‘positive’ if experienced at a population level, may be considered a negative
when affecting only some groups (cf. Platt 2005).
16
Differential individual income inequalities between men and women at different household
income levels indicate different approaches to addressing such inequalities. At the lower
income end, high inequalities are likely to be driven by non-employment (i.e. often zero or
low incomes among women), while at the higher end, they highlight the problems of ‘glass
ceilings’ and the complex issues surrounding how to evaluate success in attaining a high-
earning position, while not achieving on the level of male counterparts (Hagan 1990).
Although at the higher end, the inequalities may also be driven, albeit to a lesser extent, by
zero incomes of not employmeed women in partnership with high income men. For this high
income group, we might hypothesise that they will face lower within-sex inequalities,
because they are likely to be in work and doing relatively well, but without the extreme
incomes that cause men to have such highly polarised incomes; but that the between-sex
contribution will be relatively high, indicating that they are not attaining to the range of
incomes that characterise male high and very high earners.
Tables 7 and 8, below, illustrate the patterns relative to these hypotheses, using the measure
of mean log deviation, as our preferred measure of inequality.
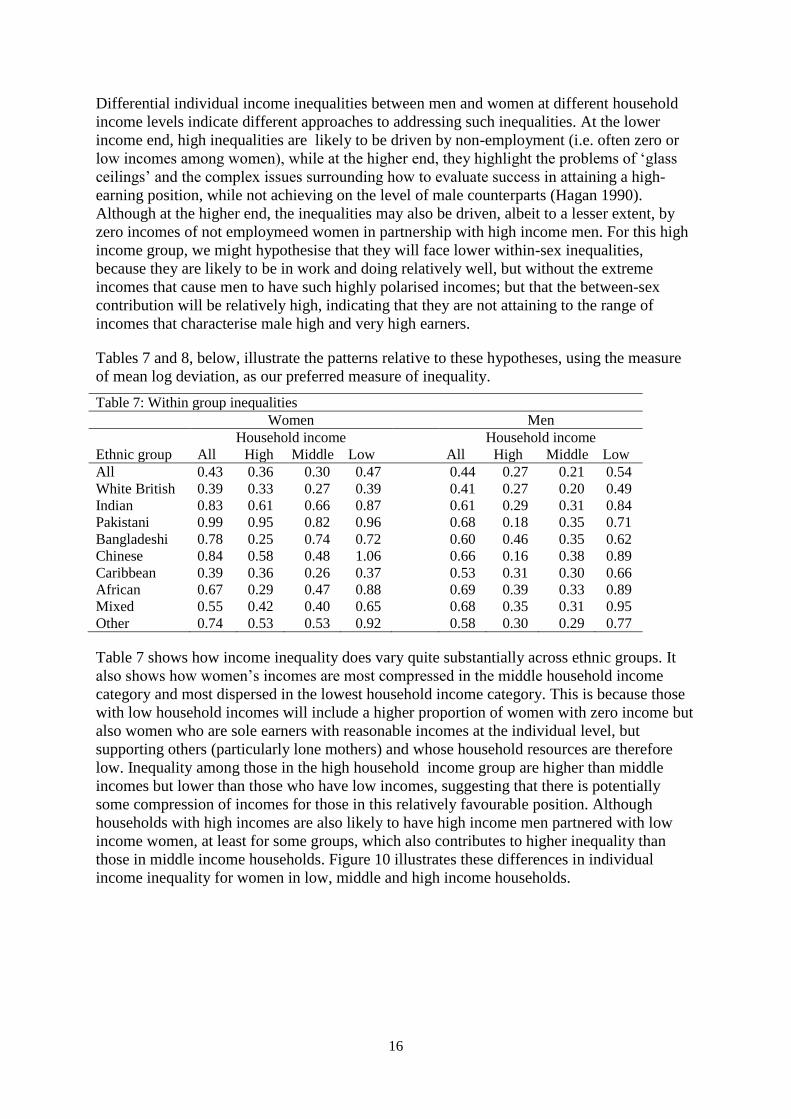
Table 7: Within group inequalities
Women Men
Household income Household income
Ethnic group All High Middle Low All High Middle Low
All 0.43 0.36 0.30 0.47 0.44 0.27 0.21 0.54
White British 0.39 0.33 0.27 0.39 0.41 0.27 0.20 0.49
Indian 0.83 0.61 0.66 0.87 0.61 0.29 0.31 0.84
Pakistani 0.99 0.95 0.82 0.96 0.68 0.18 0.35 0.71
Bangladeshi 0.78 0.25 0.74 0.72 0.60 0.46 0.35 0.62
Chinese 0.84 0.58 0.48 1.06 0.66 0.16 0.38 0.89
Caribbean 0.39 0.36 0.26 0.37 0.53 0.31 0.30 0.66
African 0.67 0.29 0.47 0.88 0.69 0.39 0.33 0.89
Mixed 0.55 0.42 0.40 0.65 0.68 0.35 0.31 0.95
Other 0.74 0.53 0.53 0.92 0.58 0.30 0.29 0.77
Table 7 shows how income inequality does vary quite substantially across ethnic groups. It
also shows how women’s incomes are most compressed in the middle household income
category and most dispersed in the lowest household income category. This is because those
with low household incomes will include a higher proportion of women with zero income but
also women who are sole earners with reasonable incomes at the individual level, but
supporting others (particularly lone mothers) and whose household resources are therefore
low. Inequality among those in the high household income group are higher than middle
incomes but lower than those who have low incomes, suggesting that there is potentially
some compression of incomes for those in this relatively favourable position. Although
households with high incomes are also likely to have high income men partnered with low
income women, at least for some groups, which also contributes to higher inequality than
those in middle income households. Figure 10 illustrates these differences in individual
income inequality for women in low, middle and high income households.
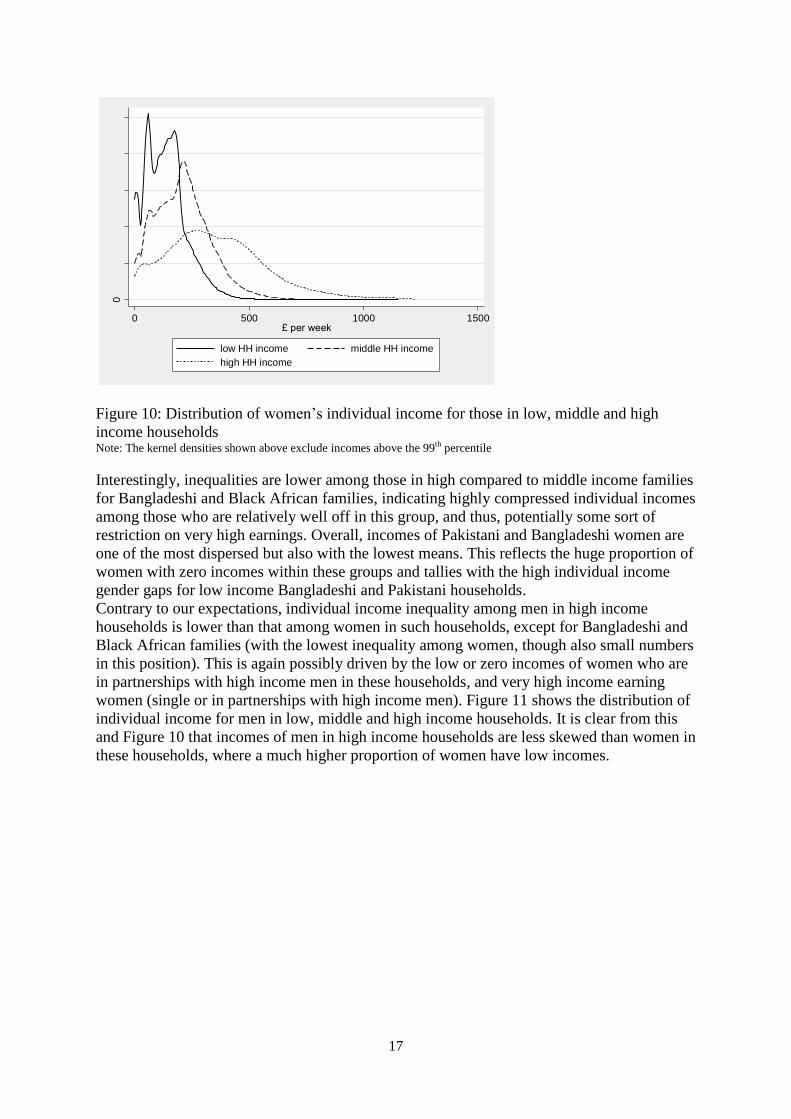
17
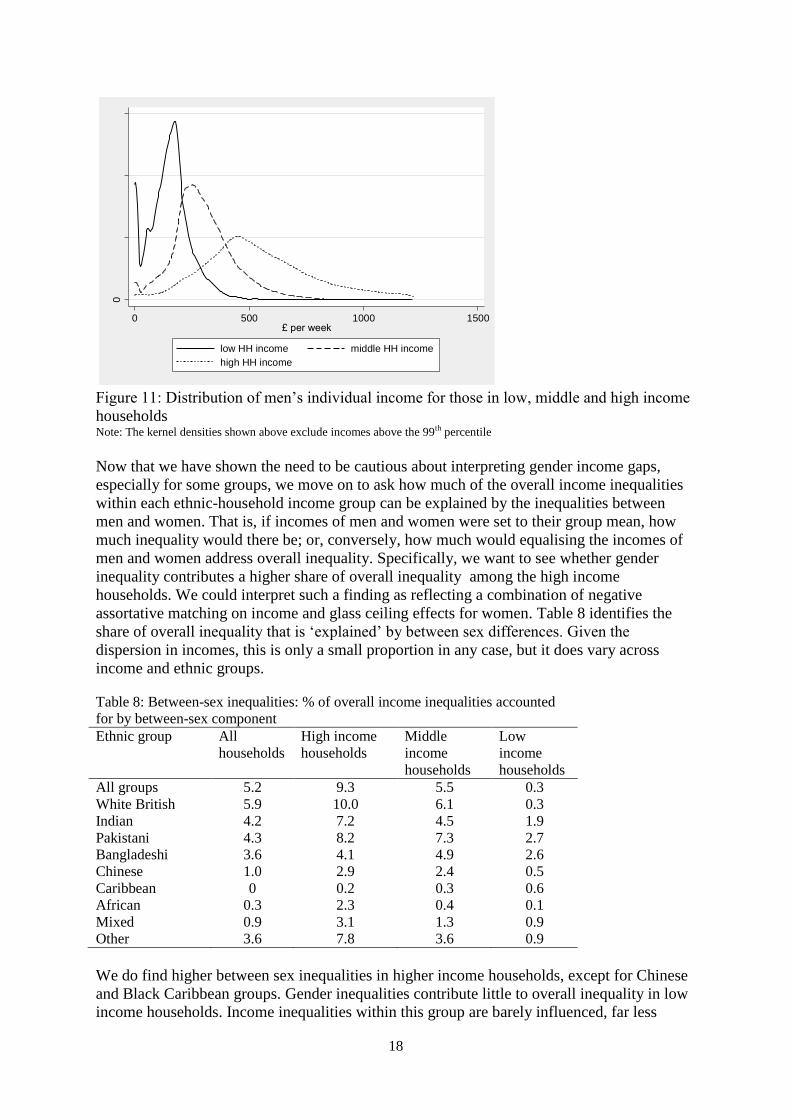
Figure 10: Distribution of women’s individual income for those in low, middle and high
income households Note: The kernel densities shown above exclude incomes above the 99th percentile
Interestingly, inequalities are lower among those in high compared to middle income families
for Bangladeshi and Black African families, indicating highly compressed individual incomes
among those who are relatively well off in this group, and thus, potentially some sort of
restriction on very high earnings. Overall, incomes of Pakistani and Bangladeshi women are
one of the most dispersed but also with the lowest means. This reflects the huge proportion of
women with zero incomes within these groups and tallies with the high individual income
gender gaps for low income Bangladeshi and Pakistani households.
Contrary to our expectations, individual income inequality among men in high income
households is lower than that among women in such households, except for Bangladeshi and
Black African families (with the lowest inequality among women, though also small numbers
in this position). This is again possibly driven by the low or zero incomes of women who are
in partnerships with high income men in these households, and very high income earning
women (single or in partnerships with high income men). Figure 11 shows the distribution of
individual income for men in low, middle and high income households. It is clear from this
and Figure 10 that incomes of men in high income households are less skewed than women in
these households, where a much higher proportion of women have low incomes.
0
.001
.002
.003
.004
.005
0 500 1000 1500£ per week
low HH income middle HH income
high HH income
18
Figure 11: Distribution of men’s individual income for those in low, middle and high income
households Note: The kernel densities shown above exclude incomes above the 99th percentile
Now that we have shown the need to be cautious about interpreting gender income gaps,
especially for some groups, we move on to ask how much of the overall income inequalities
within each ethnic-household income group can be explained by the inequalities between
men and women. That is, if incomes of men and women were set to their group mean, how
much inequality would there be; or, conversely, how much would equalising the incomes of
men and women address overall inequality. Specifically, we want to see whether gender
inequality contributes a higher share of overall inequality among the high income
households. We could interpret such a finding as reflecting a combination of negative
assortative matching on income and glass ceiling effects for women. Table 8 identifies the
share of overall inequality that is ‘explained’ by between sex differences. Given the
dispersion in incomes, this is only a small proportion in any case, but it does vary across
income and ethnic groups.
Table 8: Between-sex inequalities: % of overall income inequalities accounted
for by between-sex component
Ethnic group All
households
High income
households
Middle
income
households
Low
income
households
All groups 5.2 9.3 5.5 0.3
White British 5.9 10.0 6.1 0.3
Indian 4.2 7.2 4.5 1.9
Pakistani 4.3 8.2 7.3 2.7
Bangladeshi 3.6 4.1 4.9 2.6
Chinese 1.0 2.9 2.4 0.5
Caribbean 0 0.2 0.3 0.6
African 0.3 2.3 0.4 0.1
Mixed 0.9 3.1 1.3 0.9
Other 3.6 7.8 3.6 0.9
We do find higher between sex inequalities in higher income households, except for Chinese
and Black Caribbean groups. Gender inequalities contribute little to overall inequality in low
income households. Income inequalities within this group are barely influenced, far less
0
.002
.004
.006
0 500 1000 1500£ per week
low HH income middle HH income
high HH income
19
driven by, gendered inequalities. Equalising the position of low income women with the
distribution of incomes of low income men, will do little to improve their economic welfare
on average. At the other end of the spectrum, for women in higher income households, while
they experience a better standard of living there are substantial remaining inequalities in their
position relative to men who are economically well-off. This is consistent with the higher
individual income gender gaps we found among high income households. For better off
women, addressing gendered income inequalities may be best tackled by reductions in
income inequalities overall and the suppression of very high earnings. This is unlikely to
reduce their welfare, and may actually increase their relative autonomy within couple
households as well as between individual men and women.
5. Conclusions
Individual income reflects employment opportunities (affected both by child-rearing
responsibilities and expected pay), pay if employed and economic assistance from the state.
In this paper, we have highlighted the need to look at this overall income gender gap rather
than concentrate only on gender pay gaps, if we are more fully to understand gendered
economic inequalities, and how they differ across population subgroups. We have also shown
that women in different ethnic groups and income classes have very different experiences,
and that these varying inequalities have rather different policy implications, according to
where they occur.
Specifically, we have shown that gender gaps for individual income are much higher than
gender pay gaps; and that this is true for all ethnic groups except for Black Caribbeans, who
have the lowest individual income gender gaps. Part of the difference between pay and
individual income gaps is driven by zero or very low incomes of non-employed women. Thus
pay gaps underestimate the relative income position of women relative to men and
additionally, it is potentially misleading about the relative income inequalities faced by
different groups of women. For example, not only is the proportion not employed higher
among women, but it is extremely high among Pakistani and Bangladeshi groups. This means
that, for these groups in particular, gender pay gaps compare almost all men with a very
select sample of women (women for whom employment opportunities were such that it was
optimal to be employed rather than stay at home.
We also suggested that gendered economic inequalities should be considered both in relation
to their severity or extent but also in relation to whether they occurred in situations of
relatively high or relatively low welfare. The implication of high or low economic
inequalities is likely to be different at higher and lower incomes. We found that income
gender gaps were lowest among low income households and highest among high income
households. This may reflect some form of glass ceiling effects for relatively well-off
women. But it should also be considered as indicative of negative assortative matching on
income, that may possibly arise as a reflection of some women with highly paid partners
‘choosing’ to forego full-time or more highly paid work while they can nevertheless enjoy a
high standard of living. The implications of such ‘choices’ are very different from those that
result from well-paid professional women who nevertheless face a glass ceiling in
employment. The finding is also reflected in between sex inequalities being highest among
high income households, but not for all ethnic groups (exceptions are Chinese and Black
Caribbean).
20
The fact that the within-sex inequalities within the high income group are substantial but not
as high as among low-income women, indicates that there are far fewer women at this level
of household income with zero or very low incomes, but nevertheless there is great diversity
in the levels of overall economic independence.
Using an ‘ethnic group’ lens to explore gendered economic inequalities highlighted pertinent
aspects of the experiences of groups as well as more general issues about exploring and
subsuming the experience of subpopulations in aggregate statistics. For example, in relation
to the later point, among the Chinese group of women we found that they had highly
dispersed incomes, reflected in high within-group inequalities. However, at each income level
they had low between-sex inequalities, indicating that economically the experience of their
individual incomes mapped onto that of men at each level. This suggests that conceiving of
this group as a single ‘group’ may be misleading and that in fact it is a relatively segmented
population. In terms of reflecting adequately the economic experience of particular women
the position of Black Caribbean women was quite telling. This group experiences the least
disadvantage compared to Caribbean men, particularly within low income households where
they experience an advantage. In fact, they have the second highest mean individual incomes
compared to women in other ethnic groups. However, this income advantage is not translated
into higher economic well-being. With the highest proportion of single mothers, and on
average lower incomes among their partners, there are high proportions of this group living in
low income households. Thus looking at the differential experience of groups also reveals
how addressing gendered income inequalities is only part of addressing economic
disadvantage of women relating to their structural position as carers of children, and the
rewards that women do manage to achieve in the labour market may not give them the family
level returns that might be implied by a focus on their pay.
21
References
Bihagen, E. and Ohls, M. 2006. The glass ceiling – where is it? Women’s and men’s career prospects
in the private vs. the public sector in Sweden 1979-2000. The Sociological Review :22-46.
Browne, Irene & J. Misra. 2003. The intersection of gender and race in the labour market. Annual
Review of Sociology, 29: 487-513.
Cadbury, E., Matheson, M.C., and Shann, G. 1907. Women’s Work and Wages. Chicago: University
of Chicago Press.
England, P. 2005. Gender inequality in labour markets: the role of motherhood and segregation.
Social Politics 12(2): 264-288.
Hagan, J. 1990. The gender stratification of income inequality among lawyers.
Social Forces 68(3): 835-855
Longhi, S. & L. Platt. 2009.
Longhi, S. and Platt, L. 2008 Pay Gaps Across Equalities Areas. EHRC Research Report 9.
Manchester: Equalities and Human Rights Commission.
Manning, A. & B. Petrongolo, 2008. The Part-Time Pay Penalty for Women in Britain. Economic
Journal, 118(526): F28-F51.
Nandi, A. and Platt, L. 2010. Ethnic Minority Women’s Poverty and Economic Well Being
A report for the Government Equalities Office
Office of National Statistics. 2011. http://www.ons.gov.uk/ons/rel/cpi/consumer-price-
indices/september-2011/new-component.html, Table5a,b,c of
“cpidetailedreferencetablesjanuary2012_tcm77-255278-1.xls”
Olsen, W., H. Heuvelman, V. Gash, L. Vandecasteele, P. Walthery. 2010. The Gender Pay Gap In
The UK 1995-2007. London: Government Equalities Office.
Perfect, D. 2011. “Gender Pay Gaps” Briefing paper 2, Equality and Human Rights Commission
Phoenix, A. and Pattynama, P. 2006.Intersectionality. European Journal of Women’s Studies 13 (3):
187-192.
Platt, L. 2005. The intergenerational social mobility of minority ethnic groups. Sociology 39 (3):
445-461.
Platt, L. 2006. Pay Gaps: The Position of Ethnic Minority Women and Men. Manchester: Equal
Opportunities Commission.
Platt, L. 2007. Ethnicity and Poverty in the UK. Bristol: The Policy Press. Platt, L. 2011 Understanding inequalities: Social stratification and difference. Cambridge: Polity.
Rathbone, E. 1924. The Disinherited Family. London: Arnold.
Rowntree, B.S. 1918.The Human Needs of Labour. Thomas Nelson.
22
Vogler, C. and J. Pahl. 1994. Money, power and inequality within marriage. The Sociological Review,
42: 263–288.
Women and Work Commission. 2006. Shaping a Fairer Future. London: Women and Work
Commission.
Data Acknowledgements
Department for Work and Pensions, National Centre for Social Research and Office for National
Statistics. Social and Vital Statistics Division, Family Resources Survey, 2003-2004 [computer file].
4th Edition. Colchester, Essex: UK Data Archive [distributor], December 2007. SN: 5139.
Department for Work and Pensions, National Centre for Social Research and Office for National
Statistics. Social and Vital Statistics Division, Family Resources Survey, 2004-2005 [computer file].
2nd Edition. Colchester, Essex: UK Data Archive [distributor], December 2007. SN: 5291.
Department for Work and Pensions, National Centre for Social Research and Office for National
Statistics. Social and Vital Statistics Division, Family Resources Survey, 2005-2006 [computer file].
Colchester, Essex: UK Data Archive [distributor], November 2007. SN: 5742.
Department for Work and Pensions, National Centre for Social Research and Office for National
Statistics. Social and Vital Statistics Division, Family Resources Survey, 2006-2007 [computer file].
2nd Edition. Colchester, Essex: UK Data Archive [distributor], July 2009. SN: 6079.
Department for Work and Pensions, National Centre for Social Research and Office for National
Statistics. Social and Vital Statistics Division, Family Resources Survey, 2007-2008 [computer file].
Colchester, Essex: UK Data Archive [distributor], July 2009. SN: 6252.
Department for Work and Pensions, National Centre for Social Research and Office for National
Statistics. Social and Vital Statistics Division, Family Resources Survey, 2008-2009 [computer file].
Colchester, Essex: UK Data Archive [distributor], August 2010. SN: 6523,
http://dx.doi.org/10.5255/UKDA-SN-6523-1
Department for Work and Pensions, National Centre for Social Research and Office for National
Statistics. Social and Vital Statistics Division, Family Resources Survey, 2009-2010 [computer file].
Colchester, Essex: UK Data Archive [distributor], November 2011. SN: 6886,
http://dx.doi.org/10.5255/UKDA-SN-6886-1
Department for Work and Pensions, Households Below Average Income, 1994/95-2009/10 [computer
file]. 5th Edition. Colchester, Essex: UK Data Archive [distributor], November 2011. SN: 5828,
http://dx.doi.org/10.5255/UKDA-SN-5828-2