botswana transport & infrastructure
TRANSCRIPT

1TRANSPORT & INFRASTRUCTURE STATISTICS REPORT, 2018Statistics Botswana
TITICS REPORTSTATISTISTI 2018
BOTSWANA TRANSPORT& INFRASTRUCTURE
2 TRANSPORT & INFRASTRUCTURE STATISTICS REPORT, 2018 Statistics Botswana
Published by
STATISTICS BOTSWANAPrivate Bag 0024, GaboroneTel: 3671300 Fax: 3952201
E-mail: [email protected]: www.statsbots.org.bw
September 2018
ISBN NO: 978-99968-081-5
Contact Unit: Transport and Infrastructure Statistics Unit Ministry of Transport and Communications
Tel: +267 361 2000
Copyright © Statistics Botswana 2019
No part of this information shall be reproduced, stored in a retrieval system, or even transmitted in any form or by any
means, whether electronically, mechanically, photocopying or otherwise, without the prior permission of Statistics Botswana.
3TRANSPORT & INFRASTRUCTURE STATISTICS REPORT, 2018Statistics Botswana
EPORTST STICS REPOEPOTATIS 2018
BOTSWANA TRANSPORT& INFRASTRUCTURE
4 TRANSPORT & INFRASTRUCTURE STATISTICS REPORT, 2018 Statistics Botswana
TABLE OF CONTENT
PREFACE...........................................................................................................................................................................5
ABBREVIATIONS................................................................................................................................................................6
EXECUTIVE SUMMARY......................................................................................................................................................7
1. ROAD TRANSPORT.......................................................................................................................................................81.1 Road Network..................................................................................................................................................81.2. Motor Vehicle Registrations...........................................................................................................................12
2. ROAD SAFETY............................................................................................................................................................162.1 Accident Trend.............................................................................................................................................162.2 Accident Severity.........................................................................................................................................182.2.1 Accident Severity by Junction Control.....................................................................................................182.2.2 Accident Severity by Day of the Week..................................................................................................192.2.3 Accident Severity by Time of Occurrence.............................................................................................202.2.4 Accident Severity by Police District.........................................................................................................222.2.5 Accident Severity by Road Surface Type.................................................................................................242.3 Road Traffic Violations by Month..................................................................................................................242.4 Casualties..…………………………………………………………………………...........................................…..25
3. AIR TRANSPORT........................................................................................................................................................343.1 Aircraft Movements......................................................................................................................................343.2 Air Passenger Movements...........................................................................................................................353.3 Air Cargo & Mail Traffic................................................................................................................................37
4. RAILWAY TRANSPORT.............................................................................................................................................384.1 Rail Passengers...............................................................................................................................................384.2 Rail Goods Traffic...........................................................................................................................................394.3 Revenue From Rail Goods Traffic.................................................................................................................40
5. WATER TRANSPORT....................................................................................................................................................40
6. CONTRIBUTION OF THE TRANSPORT SECTOR TO THE ECONOMY..........................................................................42
APPENDICES..................................................................................................................................................................44Appendix 2: Road Safety........................................................................................................................................55Appendix 3: Air Transport........................................................................................................................................61Appendix 5: Passengers by Mode of Transport....................................................................................................69
5TRANSPORT & INFRASTRUCTURE STATISTICS REPORT, 2018Statistics Botswana
PREFACE
This report presents Transport and Infrastructure Statistics for the calendar year 2018. In addition to the quarterly Stats Brief, Statistics Botswana produces this annual report which shows the trend in the status and performance of transport infrastructure and the related services over the years with emphasis on the year 2018.
Statistics relating to road, rail, air and water transport, road safety as well as the contribution of the transport industry to the Gross Domestic Product are covered in this report.
Administrative data from the following organizations was used to produce this report: Department of Transport Road And Safety, Botswana Police Service, Civil Aviation Authority Botswana, Botswana Railways, Central Transport Organization, Ministry Of Local Government and Rural Development. Statistics Botswana acknowledges and extends gratitude to these organizations for their assistance and support in the production of this report.
For more information and further enquiries, contact the Directorate of Stakeholder Relations on +267 367 1300. This publication, and all other Statistics Botswana outputs are available on the website at (http://www.statsbots.org.bw) and at the Statistics Botswana Information Resource Centre (Head-Office, Gaborone).
___________________Dr. Burton MguniStatistician GeneralSeptember 2019
6 TRANSPORT & INFRASTRUCTURE STATISTICS REPORT, 2018 Statistics Botswana
ABBREVIATIONS
.. Not Available- Zero Value“BA” Permit Botswana Annual Operations PermitKg Kilogram “N” North“P” Permit Passenger Permit“S” South“W” WestMTC Ministry of Transport and CommunicationsGovt GovernmentKm KilometreCTO Central Transport OrganizationNon-sch Non scheduledSched ScheduledDRTS Department of Road Transport & Safety
7TRANSPORT & INFRASTRUCTURE STATISTICS REPORT, 2018Statistics Botswana
EXECUTIVE SUMMARY
This section gives only the highlights of the results. More detailed results are shown in the respective sections.
Total road network in Botswana measured 31,761.9 km in 2018, of which 18,507 km (58.3 percent) was under the care of Central Government while 13,254.9 km (41.7 percent) was maintained by Local authorities.
The number of licensed vehicles in Botswana rose by 4.9 percent in 2018 after having increased from 527,901 vehicles recorded in 2017 to 553,648 vehicles in 2018. Out of this total, privately owned vehicles made up 97.7 percent of the total while government vehicles made up only 2.3 percent. The bulk of first registrations (83.5 percent) were used vehicles while 16.3 percent were brand new vehicles.
In 2018, the number of road accidents recorded totalled 17,341 accidents, a decrease of 2.5 percent from 17,786 accidents recorded in 2017. On average road accidents declined by 1.1 percent from 2009 to date. They assumed a downward trend between 2009 and 2014 after declining by 3.3 percent on average over the six year period. In 2015 and 2016 road accidents went up but only to fall again in 2017 and 2018.
The number of accidents per 1,000 vehicles went down by 7.0 percent in 2018, from 33.7 in 2017 to 33.1 in 2018. Accidents per 10,000 population declined from 78.6 in 2017 to 75.3 in 2018, a 4.2 percent decrease.
Casualties in 2018 were 6,243, of which 7.4 percent were fatalities. In 2018 Casualties decreased by 1.5 percent, from 6,335 casualties recorded in 2017 to 6,243 casualties in 2018.
There was an increase of 17.2 percent in aircraft movements recorded in 2018 after registering 81,693 aircraft movements in 2018 compared to 77,079 movements recorded in 2017. Most of aircraft movements were domestic (77.0 percent), while a few (23.0 percent) of them were international. Despite a high number of aircraft movements being domestic, international passengers accounted for 58.3 percent of total air passengers while domestic passengers made 41.7 percent.
Goods transported through rail increased by 0.4 percent from 1,542,519 net tonnes in 2017 to 1,549,282 net tonnes in 2018. Total imports increased by 13.2 percent in 2018 compared to 2017, while total exports declined by 0.6 percent. Local traffic, Botswana origin and transit traffic went down in 2018 compared to 2017. Botswana total (which is total imports plus Botswana origin) increased by 4.5 percent in 2018. Revenue generated from transportation of goods by rail increased by 5.9 percent from P289 million in 2017 to P306 million in 2018.
The number of people who used the Kazungula Pontoon to either cross in or out of Botswana was 569,410 in 2018, which was an increase of 17.6 percent from the number of people who used the Pontoon in 2017. Arrivals made 50.6 percent of the total people who used the Pontoon, while 49.4 percent departed from Botswana.
8 TRANSPORT & INFRASTRUCTURE STATISTICS REPORT, 2018 Statistics Botswana
1. ROAD TRANSPORT
1.1 Road Network
Roads in Botswana are managed and maintained under the Central Government and Local Authorities.
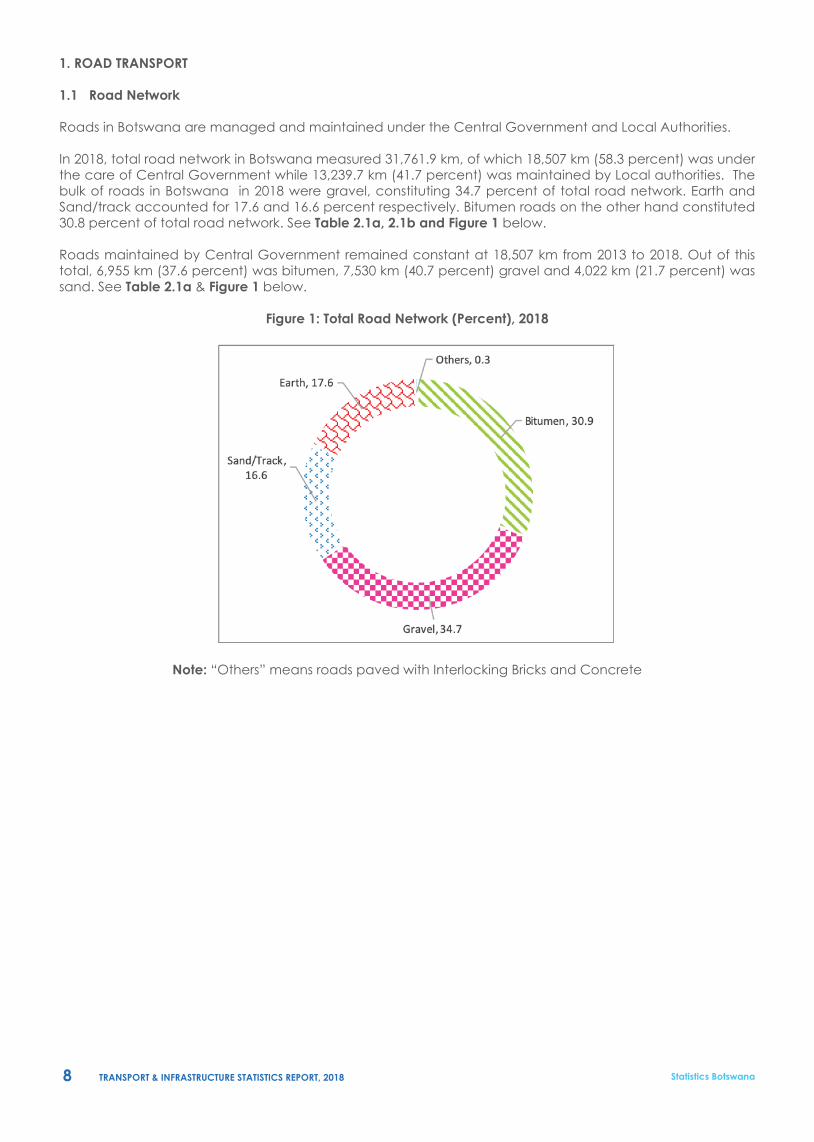
In 2018, total road network in Botswana measured 31,761.9 km, of which 18,507 km (58.3 percent) was under the care of Central Government while 13,239.7 km (41.7 percent) was maintained by Local authorities. The bulk of roads in Botswana in 2018 were gravel, constituting 34.7 percent of total road network. Earth and Sand/track accounted for 17.6 and 16.6 percent respectively. Bitumen roads on the other hand constituted 30.8 percent of total road network. See Table 2.1a, 2.1b and Figure 1 below.
Roads maintained by Central Government remained constant at 18,507 km from 2013 to 2018. Out of this total, 6,955 km (37.6 percent) was bitumen, 7,530 km (40.7 percent) gravel and 4,022 km (21.7 percent) was sand. See Table 2.1a & Figure 1 below.
Figure 1: Total Road Network (Percent), 2018
Note: “Others” means roads paved with Interlocking Bricks and Concrete
9TRANSPORT & INFRASTRUCTURE STATISTICS REPORT, 2018Statistics Botswana
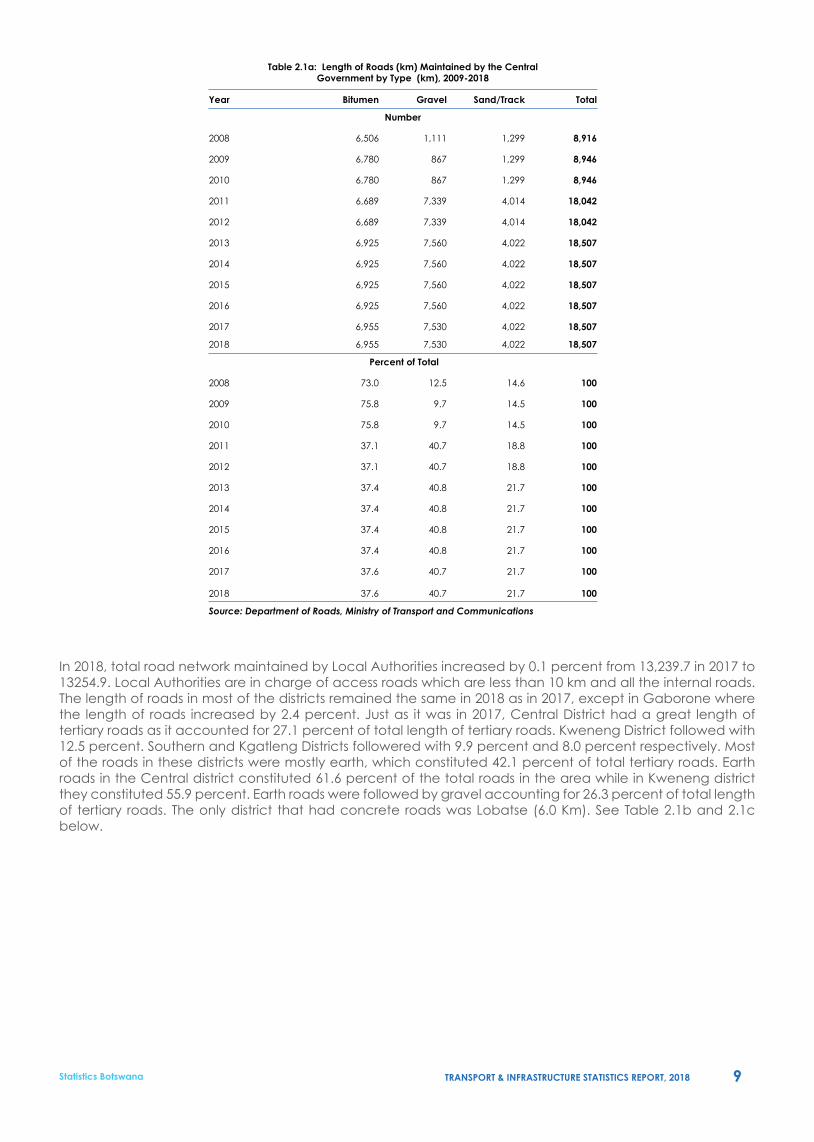
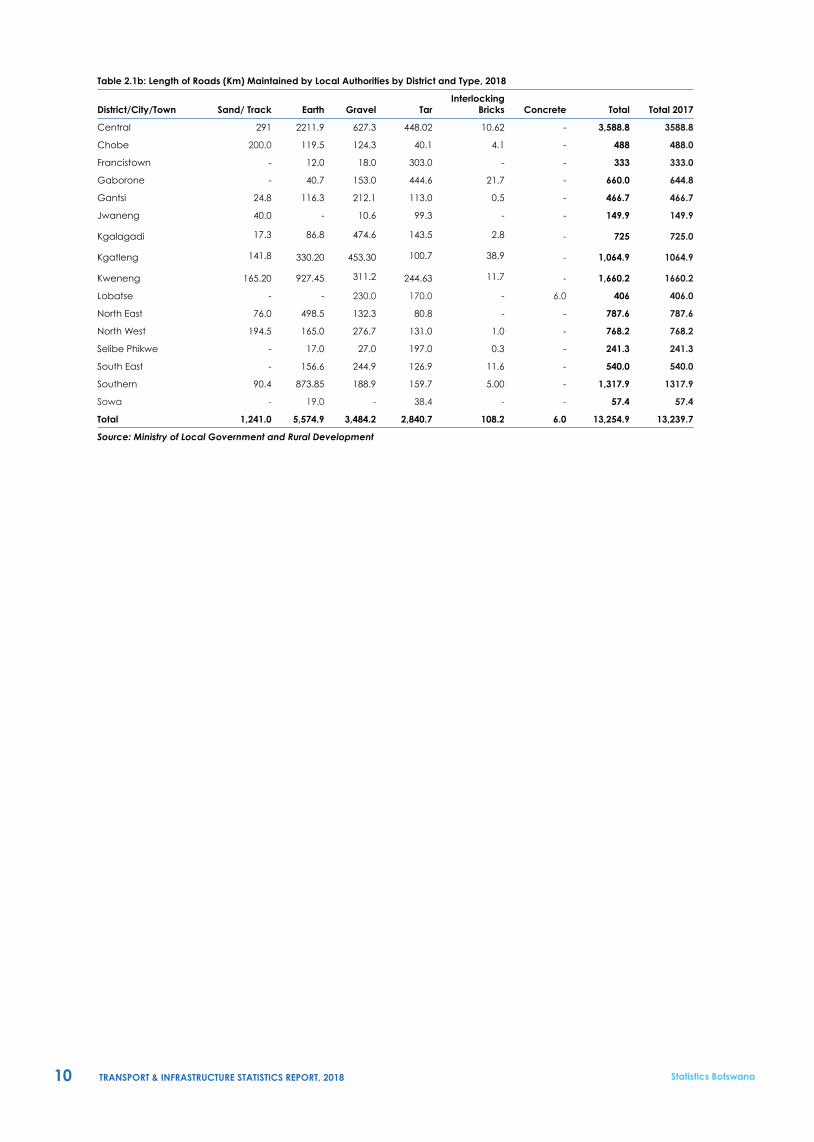
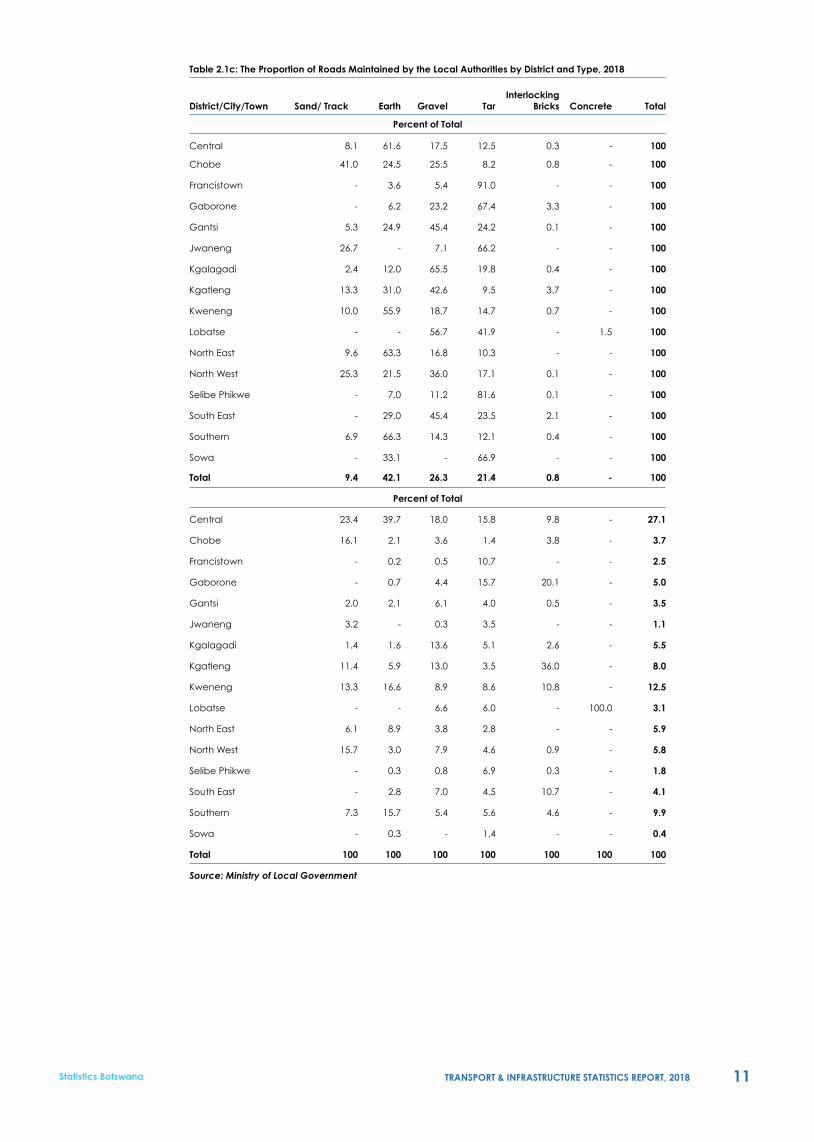
In 2018, total road network maintained by Local Authorities increased by 0.1 percent from 13,239.7 in 2017 to 13254.9. Local Authorities are in charge of access roads which are less than 10 km and all the internal roads. The length of roads in most of the districts remained the same in 2018 as in 2017, except in Gaborone where the length of roads increased by 2.4 percent. Just as it was in 2017, Central District had a great length of tertiary roads as it accounted for 27.1 percent of total length of tertiary roads. Kweneng District followed with 12.5 percent. Southern and Kgatleng Districts followered with 9.9 percent and 8.0 percent respectively. Most of the roads in these districts were mostly earth, which constituted 42.1 percent of total tertiary roads. Earth roads in the Central district constituted 61.6 percent of the total roads in the area while in Kweneng district they constituted 55.9 percent. Earth roads were followed by gravel accounting for 26.3 percent of total length of tertiary roads. The only district that had concrete roads was Lobatse (6.0 Km). See Table 2.1b and 2.1c below.
Table 2.1a: Length of Roads (km) Maintained by the Central Government by Type (km), 2009-2018
Year Bitumen Gravel Sand/Track Total
Number
2008 6,506 1,111 1,299 8,916
2009 6,780 867 1,299 8,946
2010 6,780 867 1,299 8,946
2011 6,689 7,339 4,014 18,042
2012 6,689 7,339 4,014 18,042
2013 6,925 7,560 4,022 18,507
2014 6,925 7,560 4,022 18,507
2015 6,925 7,560 4,022 18,507
2016 6,925 7,560 4,022 18,507
2017 6,955 7,530 4,022 18,507
2018 6,955 7,530 4,022 18,507
Percent of Total
2008 73.0 12.5 14.6 100
2009 75.8 9.7 14.5 100
2010 75.8 9.7 14.5 100
2011 37.1 40.7 18.8 100
2012 37.1 40.7 18.8 100
2013 37.4 40.8 21.7 100
2014 37.4 40.8 21.7 100
2015 37.4 40.8 21.7 100
2016 37.4 40.8 21.7 100
2017 37.6 40.7 21.7 100
2018 37.6 40.7 21.7 100
Source: Department of Roads, Ministry of Transport and Communications
10 TRANSPORT & INFRASTRUCTURE STATISTICS REPORT, 2018 Statistics Botswana
Table 2.1b: Length of Roads (Km) Maintained by Local Authorities by District and Type, 2018
District/City/Town Sand/ Track Earth Gravel TarInterlocking
Bricks Concrete Total Total 2017
Central 291 2211.9 627.3 448.02 10.62 - 3,588.8 3588.8
Chobe 200.0 119.5 124.3 40.1 4.1 - 488 488.0
Francistown - 12.0 18.0 303.0 - - 333 333.0
Gaborone - 40.7 153.0 444.6 21.7 - 660.0 644.8
Gantsi 24.8 116.3 212.1 113.0 0.5 - 466.7 466.7
Jwaneng 40.0 - 10.6 99.3 - - 149.9 149.9
Kgalagadi 17.3 86.8 474.6 143.5 2.8 - 725 725.0
Kgatleng 141.8 330.20 453.30 100.7 38.9 - 1,064.9 1064.9
Kweneng 165.20 927.45 311.2 244.63 11.7 - 1,660.2 1660.2
Lobatse - - 230.0 170.0 - 6.0 406 406.0
North East 76.0 498.5 132.3 80.8 - - 787.6 787.6
North West 194.5 165.0 276.7 131.0 1.0 - 768.2 768.2
Selibe Phikwe - 17.0 27.0 197.0 0.3 - 241.3 241.3
South East - 156.6 244.9 126.9 11.6 - 540.0 540.0
Southern 90.4 873.85 188.9 159.7 5.00 - 1,317.9 1317.9
Sowa - 19.0 - 38.4 - - 57.4 57.4
Total 1,241.0 5,574.9 3,484.2 2,840.7 108.2 6.0 13,254.9 13,239.7
Source: Ministry of Local Government and Rural Development
11TRANSPORT & INFRASTRUCTURE STATISTICS REPORT, 2018Statistics Botswana
Table 2.1c: The Proportion of Roads Maintained by the Local Authorities by District and Type, 2018
District/City/Town Sand/ Track Earth Gravel TarInterlocking
Bricks Concrete Total
Percent of Total
Central 8.1 61.6 17.5 12.5 0.3 - 100
Chobe 41.0 24.5 25.5 8.2 0.8 - 100
Francistown - 3.6 5.4 91.0 - - 100
Gaborone - 6.2 23.2 67.4 3.3 - 100
Gantsi 5.3 24.9 45.4 24.2 0.1 - 100
Jwaneng 26.7 - 7.1 66.2 - - 100
Kgalagadi 2.4 12.0 65.5 19.8 0.4 - 100
Kgatleng 13.3 31.0 42.6 9.5 3.7 - 100
Kweneng 10.0 55.9 18.7 14.7 0.7 - 100
Lobatse - - 56.7 41.9 - 1.5 100
North East 9.6 63.3 16.8 10.3 - - 100
North West 25.3 21.5 36.0 17.1 0.1 - 100
Selibe Phikwe - 7.0 11.2 81.6 0.1 - 100
South East - 29.0 45.4 23.5 2.1 - 100
Southern 6.9 66.3 14.3 12.1 0.4 - 100
Sowa - 33.1 - 66.9 - - 100
Total 9.4 42.1 26.3 21.4 0.8 - 100
Percent of Total
Central 23.4 39.7 18.0 15.8 9.8 - 27.1
Chobe 16.1 2.1 3.6 1.4 3.8 - 3.7
Francistown - 0.2 0.5 10.7 - - 2.5
Gaborone - 0.7 4.4 15.7 20.1 - 5.0
Gantsi 2.0 2.1 6.1 4.0 0.5 - 3.5
Jwaneng 3.2 - 0.3 3.5 - - 1.1
Kgalagadi 1.4 1.6 13.6 5.1 2.6 - 5.5
Kgatleng 11.4 5.9 13.0 3.5 36.0 - 8.0
Kweneng 13.3 16.6 8.9 8.6 10.8 - 12.5
Lobatse - - 6.6 6.0 - 100.0 3.1
North East 6.1 8.9 3.8 2.8 - - 5.9
North West 15.7 3.0 7.9 4.6 0.9 - 5.8
Selibe Phikwe - 0.3 0.8 6.9 0.3 - 1.8
South East - 2.8 7.0 4.5 10.7 - 4.1
Southern 7.3 15.7 5.4 5.6 4.6 - 9.9
Sowa - 0.3 - 1.4 - - 0.4
Total 100 100 100 100 100 100 100
Source: Ministry of Local Government
12 TRANSPORT & INFRASTRUCTURE STATISTICS REPORT, 2018 Statistics Botswana
1.2. Motor Vehicle Registrations
The annual stock of vehicles comprises of government owned motor vehicles and privately owned motor vehicles. Privately owned vehicles are categorized into first registrations and renewals.1.2.1 National Vehicle Stock
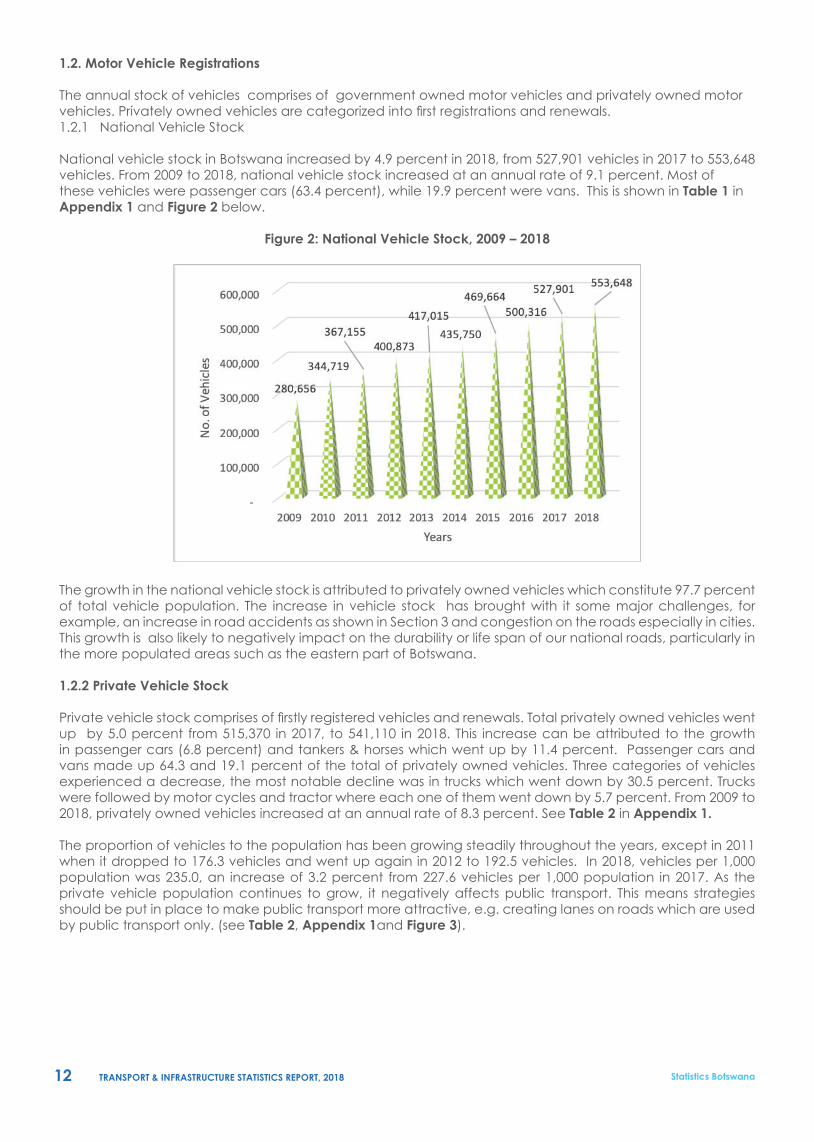
National vehicle stock in Botswana increased by 4.9 percent in 2018, from 527,901 vehicles in 2017 to 553,648 vehicles. From 2009 to 2018, national vehicle stock increased at an annual rate of 9.1 percent. Most of these vehicles were passenger cars (63.4 percent), while 19.9 percent were vans. This is shown in Table 1 in Appendix 1 and Figure 2 below.
Figure 2: National Vehicle Stock, 2009 – 2018
The growth in the national vehicle stock is attributed to privately owned vehicles which constitute 97.7 percent of total vehicle population. The increase in vehicle stock has brought with it some major challenges, for example, an increase in road accidents as shown in Section 3 and congestion on the roads especially in cities. This growth is also likely to negatively impact on the durability or life span of our national roads, particularly in the more populated areas such as the eastern part of Botswana.
1.2.2 Private Vehicle Stock
Private vehicle stock comprises of firstly registered vehicles and renewals. Total privately owned vehicles went up by 5.0 percent from 515,370 in 2017, to 541,110 in 2018. This increase can be attributed to the growth in passenger cars (6.8 percent) and tankers & horses which went up by 11.4 percent. Passenger cars and vans made up 64.3 and 19.1 percent of the total of privately owned vehicles. Three categories of vehicles experienced a decrease, the most notable decline was in trucks which went down by 30.5 percent. Trucks were followed by motor cycles and tractor where each one of them went down by 5.7 percent. From 2009 to 2018, privately owned vehicles increased at an annual rate of 8.3 percent. See Table 2 in Appendix 1.
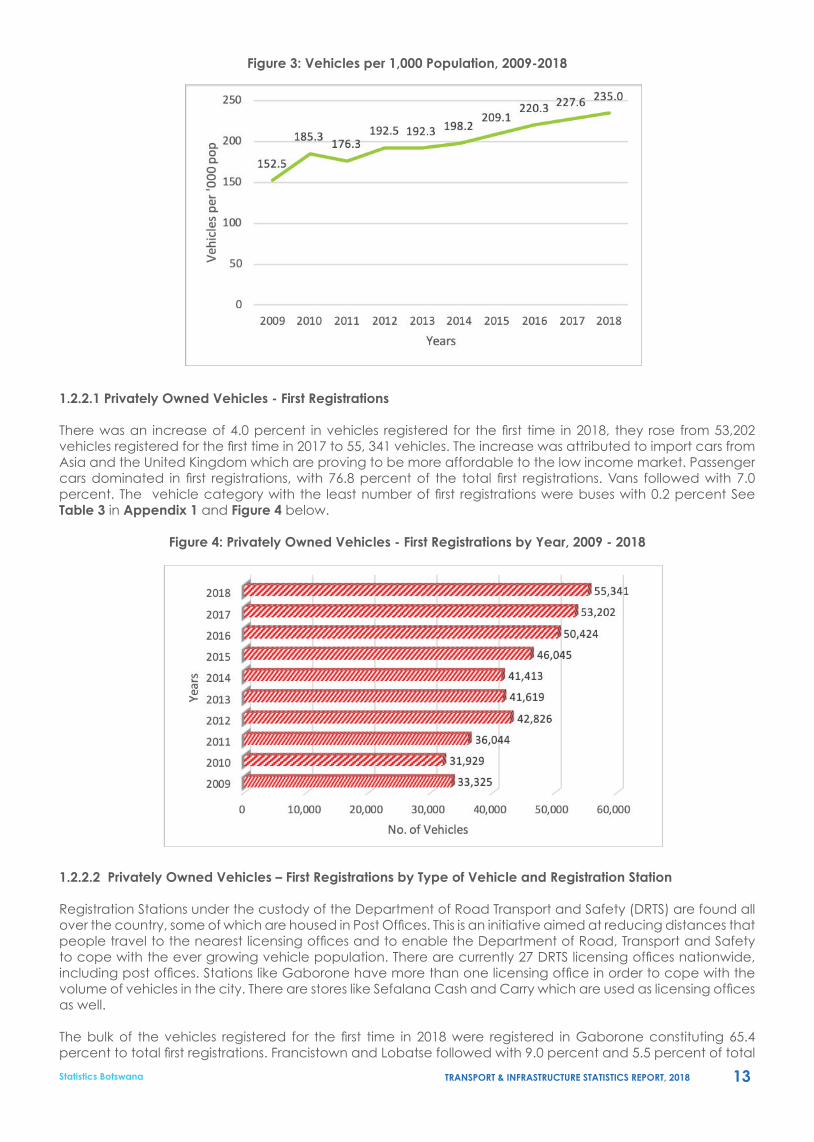
The proportion of vehicles to the population has been growing steadily throughout the years, except in 2011 when it dropped to 176.3 vehicles and went up again in 2012 to 192.5 vehicles. In 2018, vehicles per 1,000 population was 235.0, an increase of 3.2 percent from 227.6 vehicles per 1,000 population in 2017. As the private vehicle population continues to grow, it negatively affects public transport. This means strategies should be put in place to make public transport more attractive, e.g. creating lanes on roads which are used by public transport only. (see Table 2, Appendix 1and Figure 3).
13TRANSPORT & INFRASTRUCTURE STATISTICS REPORT, 2018Statistics Botswana
Figure 3: Vehicles per 1,000 Population, 2009-2018
1.2.2.1 Privately Owned Vehicles - First Registrations
There was an increase of 4.0 percent in vehicles registered for the first time in 2018, they rose from 53,202 vehicles registered for the first time in 2017 to 55, 341 vehicles. The increase was attributed to import cars from Asia and the United Kingdom which are proving to be more affordable to the low income market. Passenger cars dominated in first registrations, with 76.8 percent of the total first registrations. Vans followed with 7.0 percent. The vehicle category with the least number of first registrations were buses with 0.2 percent See Table 3 in Appendix 1 and Figure 4 below.
Figure 4: Privately Owned Vehicles - First Registrations by Year, 2009 - 2018
1.2.2.2 Privately Owned Vehicles – First Registrations by Type of Vehicle and Registration Station
Registration Stations under the custody of the Department of Road Transport and Safety (DRTS) are found all over the country, some of which are housed in Post Offices. This is an initiative aimed at reducing distances that people travel to the nearest licensing offices and to enable the Department of Road, Transport and Safety to cope with the ever growing vehicle population. There are currently 27 DRTS licensing offices nationwide, including post offices. Stations like Gaborone have more than one licensing office in order to cope with the volume of vehicles in the city. There are stores like Sefalana Cash and Carry which are used as licensing offices as well.
The bulk of the vehicles registered for the first time in 2018 were registered in Gaborone constituting 65.4 percent to total first registrations. Francistown and Lobatse followed with 9.0 percent and 5.5 percent of total
14 TRANSPORT & INFRASTRUCTURE STATISTICS REPORT, 2018 Statistics Botswana
first registrations respectively. The stations with the least number of registrations were Shakawe and Sowa with 0.01 percent of total first registrations each. (Tables 4 and 4a, Appendix 1).
1.2.2.3 Privately Owned Vehicles - First Registrations by Vehicle Type and Body Type
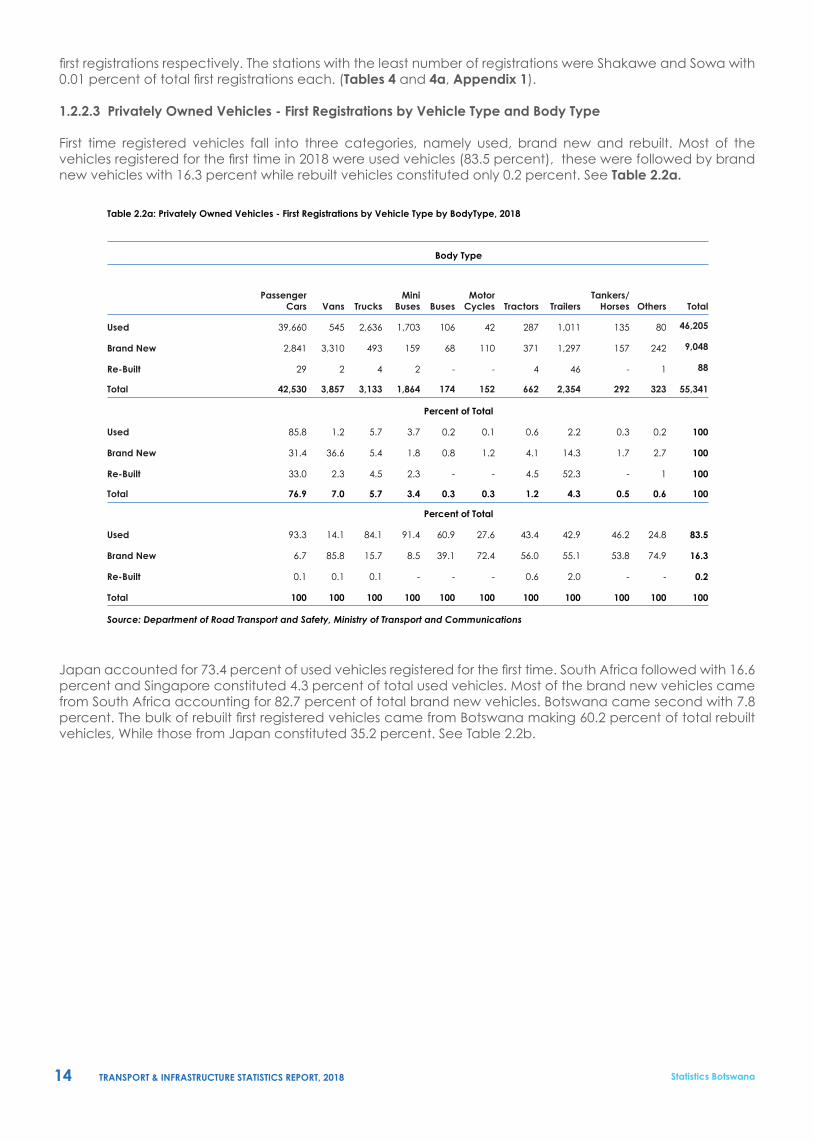
First time registered vehicles fall into three categories, namely used, brand new and rebuilt. Most of the vehicles registered for the first time in 2018 were used vehicles (83.5 percent), these were followed by brand new vehicles with 16.3 percent while rebuilt vehicles constituted only 0.2 percent. See Table 2.2a.
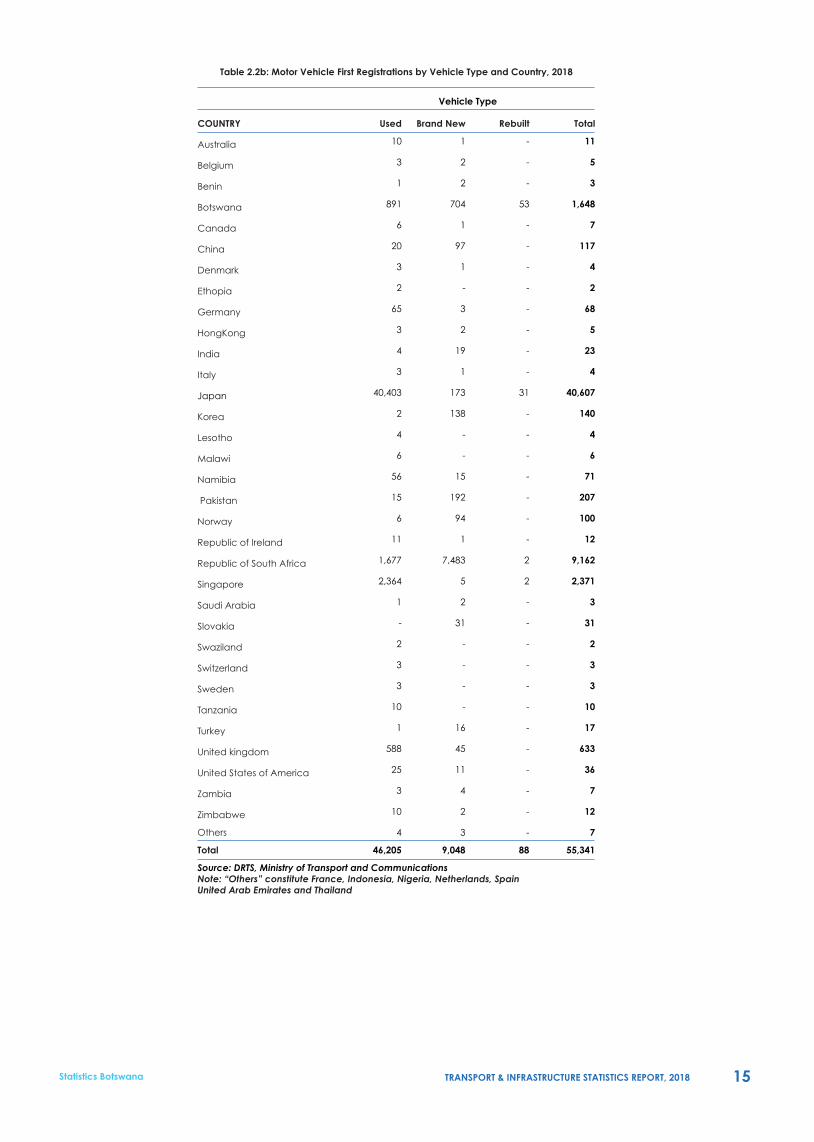
Japan accounted for 73.4 percent of used vehicles registered for the first time. South Africa followed with 16.6 percent and Singapore constituted 4.3 percent of total used vehicles. Most of the brand new vehicles came from South Africa accounting for 82.7 percent of total brand new vehicles. Botswana came second with 7.8 percent. The bulk of rebuilt first registered vehicles came from Botswana making 60.2 percent of total rebuilt vehicles, While those from Japan constituted 35.2 percent. See Table 2.2b.
Table 2.2a: Privately Owned Vehicles - First Registrations by Vehicle Type by BodyType, 2018
Body Type
Passenger Cars Vans Trucks
Mini Buses Buses
Motor Cycles Tractors Trailers
Tankers/ Horses Others Total
Used 39,660 545 2,636 1,703 106 42 287 1,011 135 80 46,205
Brand New 2,841 3,310 493 159 68 110 371 1,297 157 242 9,048
Re-Built 29 2 4 2 - - 4 46 - 1 88
Total 42,530 3,857 3,133 1,864 174 152 662 2,354 292 323 55,341
Percent of Total
Used 85.8 1.2 5.7 3.7 0.2 0.1 0.6 2.2 0.3 0.2 100
Brand New 31.4 36.6 5.4 1.8 0.8 1.2 4.1 14.3 1.7 2.7 100
Re-Built 33.0 2.3 4.5 2.3 - - 4.5 52.3 - 1 100
Total 76.9 7.0 5.7 3.4 0.3 0.3 1.2 4.3 0.5 0.6 100
Percent of Total
Used 93.3 14.1 84.1 91.4 60.9 27.6 43.4 42.9 46.2 24.8 83.5
Brand New 6.7 85.8 15.7 8.5 39.1 72.4 56.0 55.1 53.8 74.9 16.3
Re-Built 0.1 0.1 0.1 - - - 0.6 2.0 - - 0.2
Total 100 100 100 100 100 100 100 100 100 100 100
Source: Department of Road Transport and Safety, Ministry of Transport and Communications
15TRANSPORT & INFRASTRUCTURE STATISTICS REPORT, 2018Statistics Botswana
Table 2.2b: Motor Vehicle First Registrations by Vehicle Type and Country, 2018
Vehicle Type
COUNTRY Used Brand New Rebuilt Total
Australia 10 1 - 11
Belgium 3 2 - 5
Benin 1 2 - 3
Botswana 891 704 53 1,648
Canada 6 1 - 7
China 20 97 - 117
Denmark 3 1 - 4
Ethopia 2 - - 2
Germany 65 3 - 68
HongKong 3 2 - 5
India 4 19 - 23
Italy 3 1 - 4
Japan 40,403 173 31 40,607
Korea 2 138 - 140
Lesotho 4 - - 4
Malawi 6 - - 6
Namibia 56 15 - 71
Pakistan 15 192 - 207
Norway 6 94 - 100
Republic of Ireland 11 1 - 12
Republic of South Africa 1,677 7,483 2 9,162
Singapore 2,364 5 2 2,371
Saudi Arabia 1 2 - 3
Slovakia - 31 - 31
Swaziland 2 - - 2
Switzerland 3 - - 3
Sweden 3 - - 3
Tanzania 10 - - 10
Turkey 1 16 - 17
United kingdom 588 45 - 633
United States of America 25 11 - 36
Zambia 3 4 - 7
Zimbabwe 10 2 - 12
Others 4 3 - 7
Total 46,205 9,048 88 55,341
Source: DRTS, Ministry of Transport and CommunicationsNote: “Others” constitute France, Indonesia, Nigeria, Netherlands, SpainUnited Arab Emirates and Thailand
16 TRANSPORT & INFRASTRUCTURE STATISTICS REPORT, 2018 Statistics Botswana
1.2.2.4 Privately Owned Vehicles – First Registrations by Type and Make of Vehicle
In 2018, Toyota continued to dominate the vehicle market as the most firstly registered vehicle in Botswana. It constituted 40.2 percent of the firstly registered vehicles and 79.6 percent of these Toyota vehicles were passenger cars. Honda and Volkwagen followed Toyota with 12.7 percent and 8.2 percent respectively. Mazda made up 7.3 percent while Nissan constituted 6.5 percent of the total. BMW and Mercedes benz, some of the most expensive vehicles in the country, constituted only 4.3 percent and 2.3 percent respectively. See Tables 5 and 5a in Appendix 1 for details.
1.2.2.5 Privately Owned Vehicles – Renewals by Year and Type of Vehicle
Renewals are licenses of vehicles renewed each year. The month of first registration serves as the annual time for renewal. Renewals of privately owned vehicles increased by 5.1 percent in 2018 after licenses for 485,769 vehicles were renewed as opposed to those of 462,168 vehicles in 2017. The type of vehicle which had most renewals was the passenger car (62.9 percent), followed by vans (20.4 percent). Three categories of vehicle renewals declined, namely vans (0.1 percent), motor cycles (4.9 percent) and tractors (4.1 percent). (Table 6, Appendix 1).
1.2.2.6 Privately Owned Vehicles - Renewals by Type and Make of Vehicle Toyota was the most renewed vehicle in 2018; it accounted for 46.5 percent of total renewals with 65.2 percent of those vehicles being passenger cars. Toyota was followed by Nissan with 7.3 percent, Honda (5.8 percent), Mazda (5.5) and Mercedes Benz with 3.7 percent. Daewoo accounted for the least number of total renewals with 0.03 percent only. See Tables 7 and 7a in Appendix 1.
1. 2.3 Government Vehicle Stock
These vehicles are under the custody of Central Transport Organisation (CTO) and are owned by the Government. CTO is a government department responsible for procurement, management, repair and disposal of government vehicles. The government fleet increased by 0.1 percent from 12,531 vehicles recorded in 2017 to 12,538 vehicles in 2018. Passenger cars, Vans and Trucks declined by 1.8, 0.1 and 39.8 percent respectively. There was no change in motor cycles and tractors while trailers and tankers & horses increased by 29.7 and 10.1 percent respectively. The composition of government fleet changes frequently as new vehicles or donated vehicles enter the government fleet. Old vehicles are boarded and some of the vehicles move to the private sector as government departments are privatized. See Table 8, Appendix 1.
2. ROAD SAFETY
This report publishes only accidents reported to the Botswana Police. The report shows vehicle accidents categorized by road traffic violations, accident severity and casualties.
2.1 Accident Trend
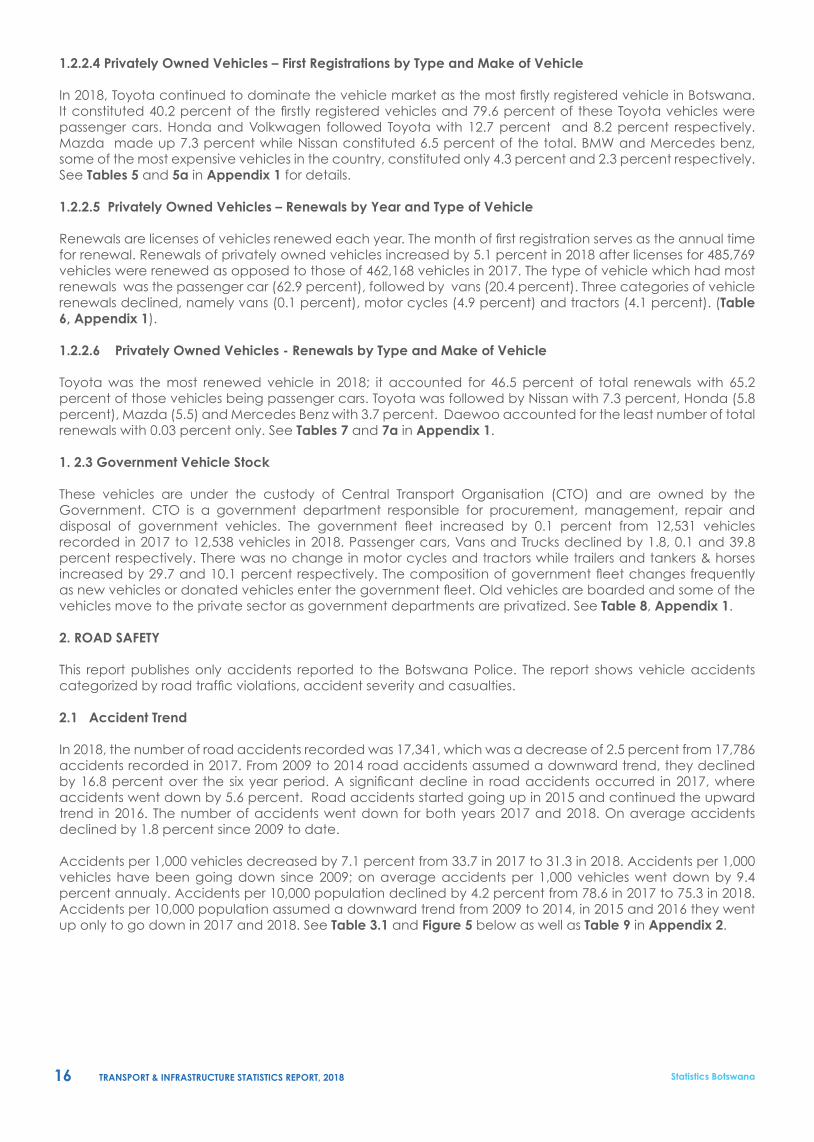
In 2018, the number of road accidents recorded was 17,341, which was a decrease of 2.5 percent from 17,786 accidents recorded in 2017. From 2009 to 2014 road accidents assumed a downward trend, they declined by 16.8 percent over the six year period. A significant decline in road accidents occurred in 2017, where accidents went down by 5.6 percent. Road accidents started going up in 2015 and continued the upward trend in 2016. The number of accidents went down for both years 2017 and 2018. On average accidents declined by 1.8 percent since 2009 to date.
Accidents per 1,000 vehicles decreased by 7.1 percent from 33.7 in 2017 to 31.3 in 2018. Accidents per 1,000 vehicles have been going down since 2009; on average accidents per 1,000 vehicles went down by 9.4 percent annualy. Accidents per 10,000 population declined by 4.2 percent from 78.6 in 2017 to 75.3 in 2018. Accidents per 10,000 population assumed a downward trend from 2009 to 2014, in 2015 and 2016 they went up only to go down in 2017 and 2018. See Table 3.1 and Figure 5 below as well as Table 9 in Appendix 2.
17TRANSPORT & INFRASTRUCTURE STATISTICS REPORT, 2018Statistics Botswana
Figure 5: Road Accident Trend, 2009 - 2018
Table 3.1: Motor Vehicle Accident Trend, 2009 - 2018
Number Estimated Accidents Accidents
of Registered Population Per ‘000 Per 10,000
Year Accidents Vehicles (‘000s) Vehicles Population
2009 20,000 280,639 1,776 71.3 112.6
2010 18,978 344,719 1,800 55.1 105.4
2011 18,001 367,155 2,025 49.0 88.9
2012 17,527 400,873 2,066 43.7 86.6
2013 17,062 417,015 2,107 40.9 84.3
2014 16,641 435,750 2,147 38.2 82.2
2015 17,654 469,664 2,187 37.6 80.7
2016 18,373 500,316 2,226 36.7 82.5
2017 17,786 527,901 2,264 33.7 78.6
2018 17,341 553,648 2,303 31.3 75.3
Annual Percentage Change
2009 (2.0) 9.4 1.2 (10.5) (3.2)
2010 (5.1) 22.8 1.4 (22.7) (6.4)
2011 (5.1) 6.5 12.5 (10.9) (15.7)
2012 (2.6) 9.2 2.0 (10.8) (2.6)
2013 (2.7) 4.0 2.0 (6.4) (2.7)
2014 (2.5) 4.5 1.9 (6.7) (2.5)
2015 6.1 7.8 1.9 (1.6) (1.8)
2016 4.1 6.5 1.8 (2.3) 2.2
2017 (5.6) 10.7 3.5 (14.7) (8.7)
2018 (2.5) 4.9 1.7 (7.1) (4.2)
Source: Botswana Police Service (Road Traffic Accident Unit)
18 TRANSPORT & INFRASTRUCTURE STATISTICS REPORT, 2018 Statistics Botswana
2.2 Accident Severity
2.2.1 Accident Severity by Junction Control
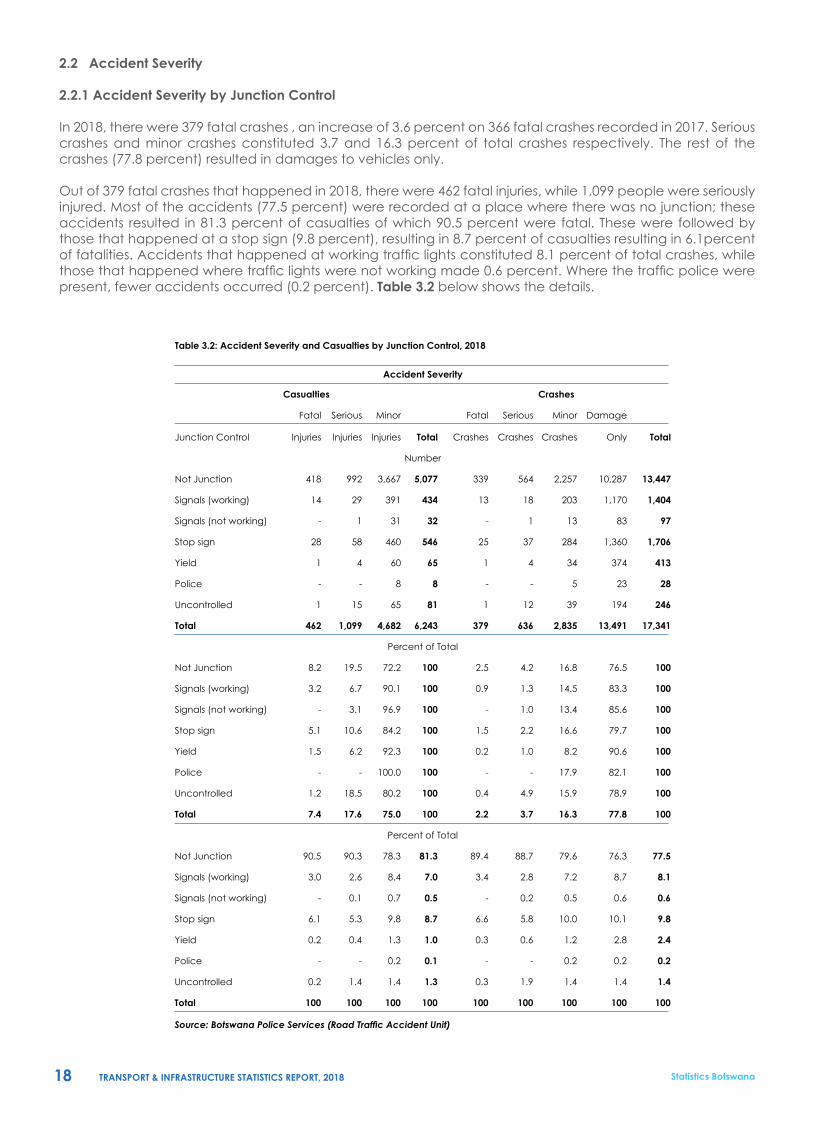
In 2018, there were 379 fatal crashes , an increase of 3.6 percent on 366 fatal crashes recorded in 2017. Serious crashes and minor crashes constituted 3.7 and 16.3 percent of total crashes respectively. The rest of the crashes (77.8 percent) resulted in damages to vehicles only.
Out of 379 fatal crashes that happened in 2018, there were 462 fatal injuries, while 1,099 people were seriously injured. Most of the accidents (77.5 percent) were recorded at a place where there was no junction; these accidents resulted in 81.3 percent of casualties of which 90.5 percent were fatal. These were followed by those that happened at a stop sign (9.8 percent), resulting in 8.7 percent of casualties resulting in 6.1percent of fatalities. Accidents that happened at working traffic lights constituted 8.1 percent of total crashes, while those that happened where traffic lights were not working made 0.6 percent. Where the traffic police were present, fewer accidents occurred (0.2 percent). Table 3.2 below shows the details.
Table 3.2: Accident Severity and Casualties by Junction Control, 2018
Accident Severity
Casualties Crashes
Fatal Serious Minor Fatal Serious Minor Damage
Junction Control Injuries Injuries Injuries Total Crashes Crashes Crashes Only Total
Number
Not Junction 418 992 3,667 5,077 339 564 2,257 10,287 13,447
Signals (working) 14 29 391 434 13 18 203 1,170 1,404
Signals (not working) - 1 31 32 - 1 13 83 97
Stop sign 28 58 460 546 25 37 284 1,360 1,706
Yield 1 4 60 65 1 4 34 374 413
Police - - 8 8 - - 5 23 28
Uncontrolled 1 15 65 81 1 12 39 194 246
Total 462 1,099 4,682 6,243 379 636 2,835 13,491 17,341
Percent of Total
Not Junction 8.2 19.5 72.2 100 2.5 4.2 16.8 76.5 100
Signals (working) 3.2 6.7 90.1 100 0.9 1.3 14.5 83.3 100
Signals (not working) - 3.1 96.9 100 - 1.0 13.4 85.6 100
Stop sign 5.1 10.6 84.2 100 1.5 2.2 16.6 79.7 100
Yield 1.5 6.2 92.3 100 0.2 1.0 8.2 90.6 100
Police - - 100.0 100 - - 17.9 82.1 100
Uncontrolled 1.2 18.5 80.2 100 0.4 4.9 15.9 78.9 100
Total 7.4 17.6 75.0 100 2.2 3.7 16.3 77.8 100
Percent of Total
Not Junction 90.5 90.3 78.3 81.3 89.4 88.7 79.6 76.3 77.5
Signals (working) 3.0 2.6 8.4 7.0 3.4 2.8 7.2 8.7 8.1
Signals (not working) - 0.1 0.7 0.5 - 0.2 0.5 0.6 0.6
Stop sign 6.1 5.3 9.8 8.7 6.6 5.8 10.0 10.1 9.8
Yield 0.2 0.4 1.3 1.0 0.3 0.6 1.2 2.8 2.4
Police - - 0.2 0.1 - - 0.2 0.2 0.2
Uncontrolled 0.2 1.4 1.4 1.3 0.3 1.9 1.4 1.4 1.4
Total 100 100 100 100 100 100 100 100 100
Source: Botswana Police Services (Road Traffic Accident Unit)

19TRANSPORT & INFRASTRUCTURE STATISTICS REPORT, 2018Statistics Botswana
2.2.2 Accident Severity by Day of the Week
The weekend days (Friday, Saturday and Sunday) in 2018 accounted for half (50.0 percent) of all accidents that occurred in 2018. The day of the week that had a high number of accidents in 2018 was Saturday with 18.4 percent of total accidents. Friday followed with 16.8 percent while Sunday made up14.7 percent. The day that recorded the least number of accidents was Tuesday with 12.1 percent. Comparing 2018 to 2017, the same pattern was recorded where Saturday had a high number of accidents. Most of the days realized a decrease in the number of accidents in 2018 compared to 2017, except Wenesday which increased by 1.9 percent. See Table 3.3 below.
Table 3.3: Accident Severity by Day of the Week, 2018
Accident Severity (Crashes)
Fatal Serious Minor Damage
Day of the Week Crashes Crashes Crashes Only Total
Total 2017
Number
Sunday 84 120 484 1,866 2,554 2,581
Monday 32 75 310 1,782 2,199 2,282
Tuesday 27 61 299 1,708 2,095 2,195
Wenesday 27 61 342 1,695 2,125 2,085
Thursday 35 74 348 1,796 2,253 2,265
Friday 59 104 448 2,306 2,917 3,011
Saturday 115 141 604 2,338 3,198 3,367
Total 379 636 2,835 13,491 17,341 17,786
Percent of Day of the Week
Sunday 3.3 4.7 19.0 73.1 100
Monday 1.5 3.4 14.1 81.0 100
Tuesday 1.3 2.9 14.3 81.5 100
Wenesday 1.3 2.9 16.1 79.8 100
Thursday 1.6 3.3 15.4 79.7 100
Friday 2.0 3.6 15.4 79.1 100
Saturday 3.6 4.4 18.9 73.1 100
Total 2.2 3.7 16.3 77.8 100
Percent of Accident Severity
Sunday 22.2 18.9 17.1 13.8 14.7
Monday 8.4 11.8 10.9 13.2 12.7
Tuesday 7.1 9.6 10.5 12.7 12.1
Wenesday 7.1 9.6 12.1 12.6 12.3
Thursday 9.2 11.6 12.3 13.3 13.0
Friday 15.6 16.4 15.8 17.1 16.8
Saturday 30.3 22.2 21.3 17.3 18.4
Total 100 100 100 100 100
Source: Botswana Police Services ( Road Accident Statistics Unit)
20 TRANSPORT & INFRASTRUCTURE STATISTICS REPORT, 2018 Statistics Botswana
2.3 Accident Severity by Time of Occurrence
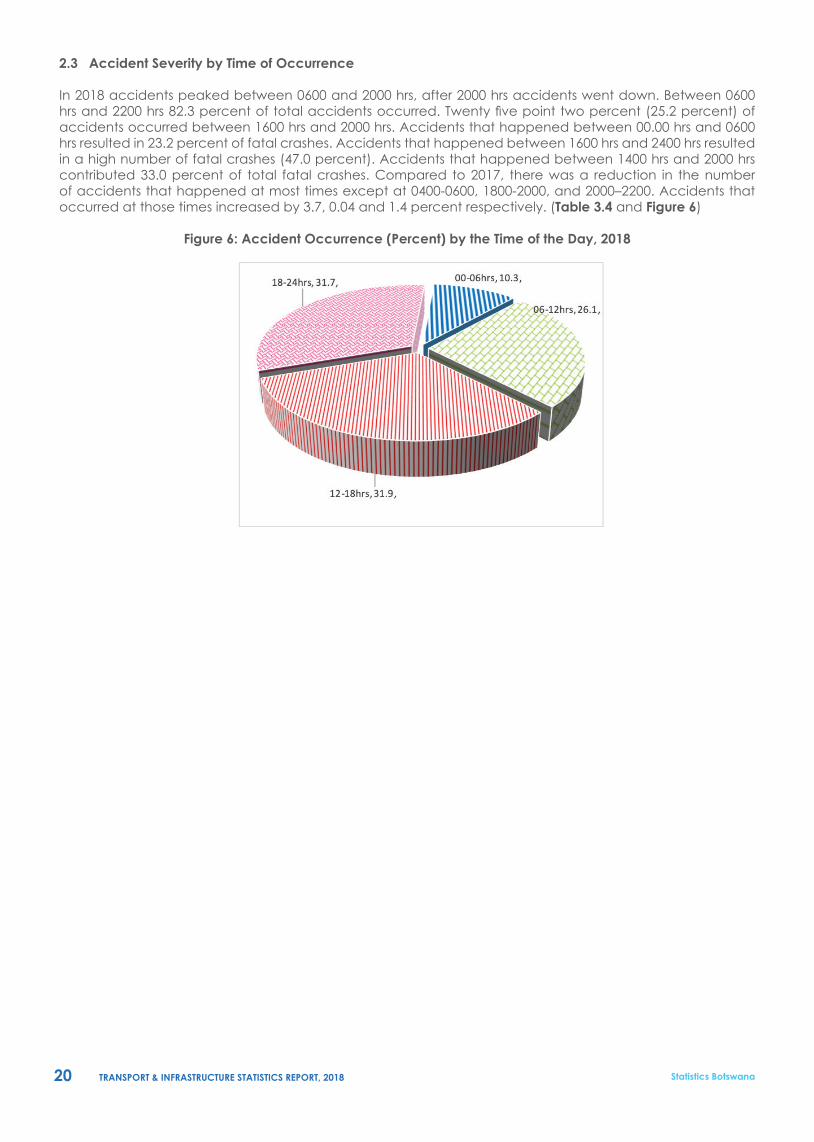
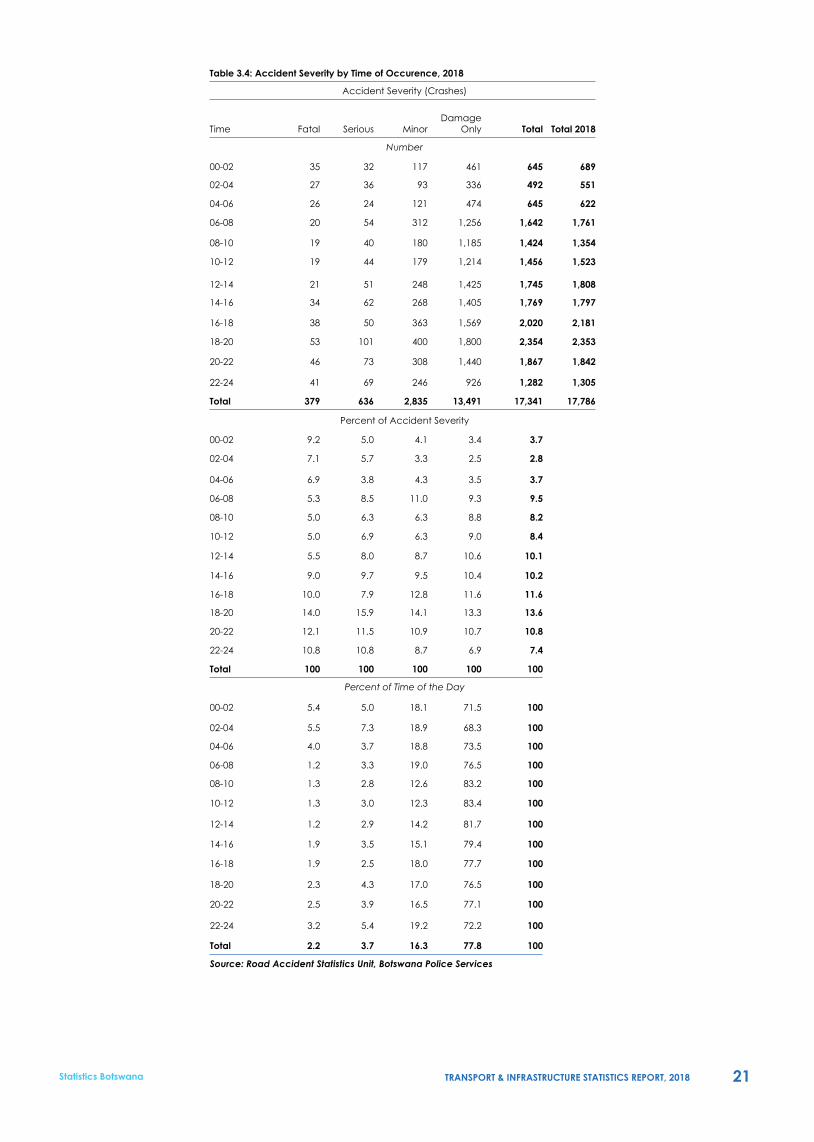
In 2018 accidents peaked between 0600 and 2000 hrs, after 2000 hrs accidents went down. Between 0600 hrs and 2200 hrs 82.3 percent of total accidents occurred. Twenty five point two percent (25.2 percent) of accidents occurred between 1600 hrs and 2000 hrs. Accidents that happened between 00.00 hrs and 0600 hrs resulted in 23.2 percent of fatal crashes. Accidents that happened between 1600 hrs and 2400 hrs resulted in a high number of fatal crashes (47.0 percent). Accidents that happened between 1400 hrs and 2000 hrs contributed 33.0 percent of total fatal crashes. Compared to 2017, there was a reduction in the number of accidents that happened at most times except at 0400-0600, 1800-2000, and 2000–2200. Accidents that occurred at those times increased by 3.7, 0.04 and 1.4 percent respectively. (Table 3.4 and Figure 6)
Figure 6: Accident Occurrence (Percent) by the Time of the Day, 2018
21TRANSPORT & INFRASTRUCTURE STATISTICS REPORT, 2018Statistics Botswana
Table 3.4: Accident Severity by Time of Occurence, 2018
Accident Severity (Crashes)
Time Fatal Serious Minor Damage
Only Total Total 2018
Number
00-02 35 32 117 461 645 689
02-04 27 36 93 336 492 551
04-06 26 24 121 474 645 622
06-08 20 54 312 1,256 1,642 1,761
08-10 19 40 180 1,185 1,424 1,354
10-12 19 44 179 1,214 1,456 1,523
12-14 21 51 248 1,425 1,745 1,808
14-16 34 62 268 1,405 1,769 1,797
16-18 38 50 363 1,569 2,020 2,181
18-20 53 101 400 1,800 2,354 2,353
20-22 46 73 308 1,440 1,867 1,842
22-24 41 69 246 926 1,282 1,305
Total 379 636 2,835 13,491 17,341 17,786
Percent of Accident Severity
00-02 9.2 5.0 4.1 3.4 3.7
02-04 7.1 5.7 3.3 2.5 2.8
04-06 6.9 3.8 4.3 3.5 3.7
06-08 5.3 8.5 11.0 9.3 9.5
08-10 5.0 6.3 6.3 8.8 8.2
10-12 5.0 6.9 6.3 9.0 8.4
12-14 5.5 8.0 8.7 10.6 10.1
14-16 9.0 9.7 9.5 10.4 10.2
16-18 10.0 7.9 12.8 11.6 11.6
18-20 14.0 15.9 14.1 13.3 13.6
20-22 12.1 11.5 10.9 10.7 10.8
22-24 10.8 10.8 8.7 6.9 7.4
Total 100 100 100 100 100
Percent of Time of the Day
00-02 5.4 5.0 18.1 71.5 100
02-04 5.5 7.3 18.9 68.3 100
04-06 4.0 3.7 18.8 73.5 100
06-08 1.2 3.3 19.0 76.5 100
08-10 1.3 2.8 12.6 83.2 100
10-12 1.3 3.0 12.3 83.4 100
12-14 1.2 2.9 14.2 81.7 100
14-16 1.9 3.5 15.1 79.4 100
16-18 1.9 2.5 18.0 77.7 100
18-20 2.3 4.3 17.0 76.5 100
20-22 2.5 3.9 16.5 77.1 100
22-24 3.2 5.4 19.2 72.2 100
Total 2.2 3.7 16.3 77.8 100
Source: Road Accident Statistics Unit, Botswana Police Services
22 TRANSPORT & INFRASTRUCTURE STATISTICS REPORT, 2018 Statistics Botswana
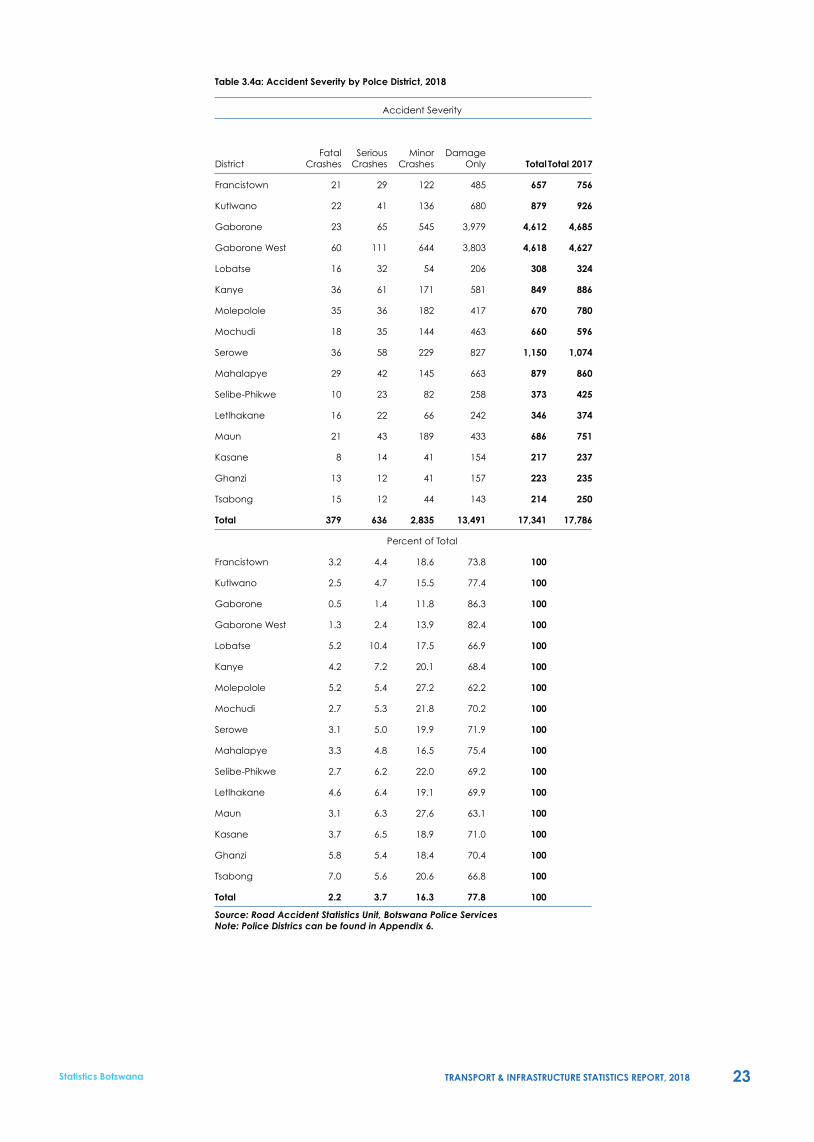
2.2.4 Accident Severity by Police District
Most of the accidents occurred in Gaborone and Gaborone West, they each accounted for 26.6 percent of total accidents. The two districts were followed by Serowe with 6.6 percent of total accidents. Kutlwano and Mahalapye followed with 5.1 percent each. The Police district with the least number of accidents was Tsabong with 1.2 percent of total accidents. Most of the districts experienced a reduction in road accidents in 2018 compared to 2017. Only three districts had an increase in road accidents, Mochudi (10.7 percent), Serowe (7.1 percent) and Mahalapye with 2.2 percent. See Table 3.4a below and Table 10 in Appendix 2.
23TRANSPORT & INFRASTRUCTURE STATISTICS REPORT, 2018Statistics Botswana
Table 3.4a: Accident Severity by Polce District, 2018
Accident Severity
DistrictFatal
CrashesSerious
CrashesMinor
CrashesDamage
Only Total Total 2017
Francistown 21 29 122 485 657 756
Kutlwano 22 41 136 680 879 926
Gaborone 23 65 545 3,979 4,612 4,685
Gaborone West 60 111 644 3,803 4,618 4,627
Lobatse 16 32 54 206 308 324
Kanye 36 61 171 581 849 886
Molepolole 35 36 182 417 670 780
Mochudi 18 35 144 463 660 596
Serowe 36 58 229 827 1,150 1,074
Mahalapye 29 42 145 663 879 860
Selibe-Phikwe 10 23 82 258 373 425
Letlhakane 16 22 66 242 346 374
Maun 21 43 189 433 686 751
Kasane 8 14 41 154 217 237
Ghanzi 13 12 41 157 223 235
Tsabong 15 12 44 143 214 250
Total 379 636 2,835 13,491 17,341 17,786
Percent of Total
Francistown 3.2 4.4 18.6 73.8 100
Kutlwano 2.5 4.7 15.5 77.4 100
Gaborone 0.5 1.4 11.8 86.3 100
Gaborone West 1.3 2.4 13.9 82.4 100
Lobatse 5.2 10.4 17.5 66.9 100
Kanye 4.2 7.2 20.1 68.4 100
Molepolole 5.2 5.4 27.2 62.2 100
Mochudi 2.7 5.3 21.8 70.2 100
Serowe 3.1 5.0 19.9 71.9 100
Mahalapye 3.3 4.8 16.5 75.4 100
Selibe-Phikwe 2.7 6.2 22.0 69.2 100
Letlhakane 4.6 6.4 19.1 69.9 100
Maun 3.1 6.3 27.6 63.1 100
Kasane 3.7 6.5 18.9 71.0 100
Ghanzi 5.8 5.4 18.4 70.4 100
Tsabong 7.0 5.6 20.6 66.8 100
Total 2.2 3.7 16.3 77.8 100
Source: Road Accident Statistics Unit, Botswana Police ServicesNote: Police Districs can be found in Appendix 6.

24 TRANSPORT & INFRASTRUCTURE STATISTICS REPORT, 2018 Statistics Botswana
2.2.5 Accident Severity by Road Surface Type
Most of the accidents in 2018 occurred in tarred roads (88.9 percent), resulting in 89.2 percent of fatal crashes. Tarred roads were followed by gravel roads with 6.1 percent of total accidents which resulted in 7.9 percent of fatal crashes. Sand had the second lowest number of accidents (2.9 percent), resulting in 2.4 percent of fatal crashes. See Table 3.5.
Table 3.5: Accident Severity by Type of the Road Surface, 2018
Accident Severity
Fatal Serious Minor Damage
Road Surface Type Crashes Crashes Crashes Only TotalTotal 2017
Number
Tar 338 548 2,534 11,996 15,416 15655
Gravel 30 63 209 763 1,065 1218
Sand 9 20 60 412 501 523
Other 2 5 32 320 359 390
Total 379 636 2,835 13,491 17,341 17786
Percent of Road Surface Type
Tar 2.2 3.6 16.4 77.8 100
Gravel 2.8 5.9 19.6 71.6 100
Sand 1.8 4.0 12.0 82.2 100
Other 0.6 1.4 8.9 89.1 100
Total 2.2 3.7 16.3 77.8 100
Percent of Accident Severity
Tar 89.2 86.2 89.4 88.9 88.9
Gravel 7.9 9.9 7.4 5.7 6.1
Sand 2.4 3.1 2.1 3.1 2.9
Other 0.5 0.8 1.1 2.4 2.1
Total 100 100 100 100 100
Source: Botswana Police Services ( Road Accident Statistics Unit)
2.3 Road Traffic Violations by Month
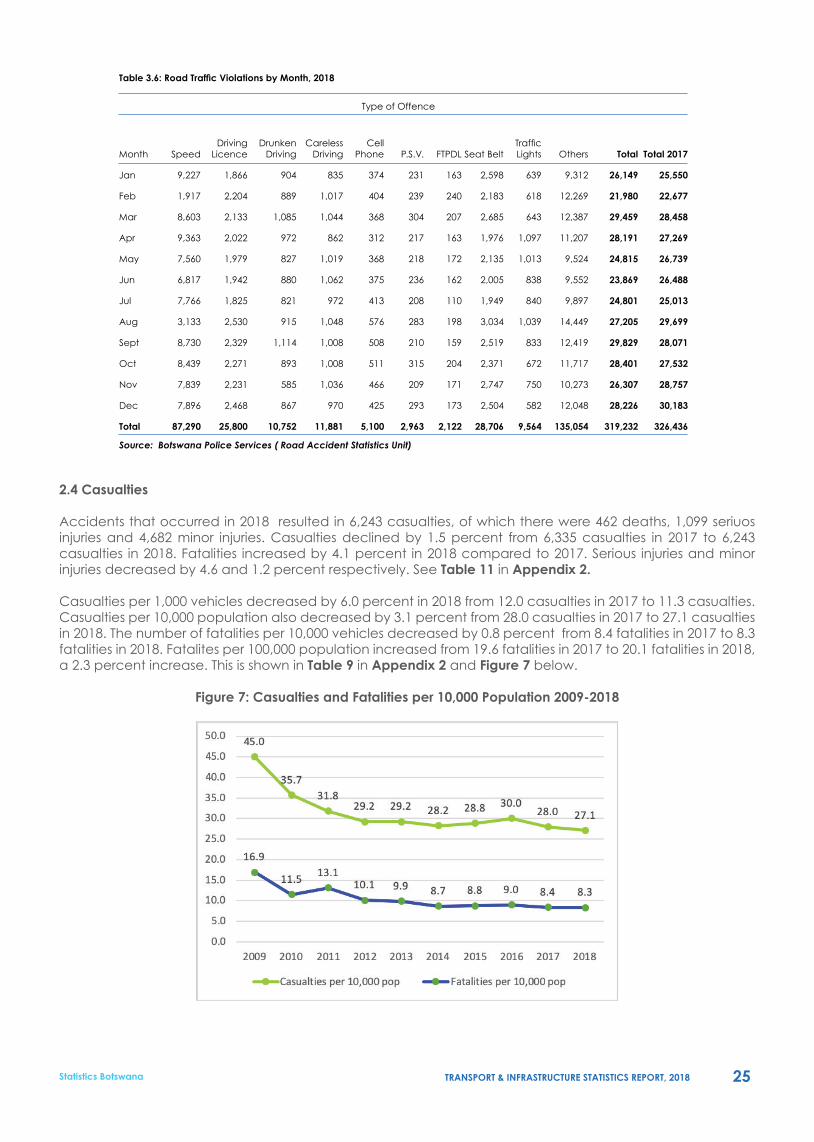
Road traffic violations are cases where motorists violate traffic laws and regulations, for example not obeying traffic signs or over speeding. There were 319,232 traffic violations in 2018, a 2.2 percent decrease on 326,436 traffic violations in 2017. The month that had the most traffic violations was September accounting for 9.3 percent of total traffic violations. September was followed by March with 9.2 percent of total traffic violations. The month with the least number of traffic violations was February with 6.9 percent of total traffic violations. The category that had the most traffic violations was overspeeding with 27.3 percent. Overspeeding was followed by driving without a licence with 8.1 percent of total traffic violations. See Table 3.6 below.
25TRANSPORT & INFRASTRUCTURE STATISTICS REPORT, 2018Statistics Botswana
Table 3.6: Road Traffic Violations by Month, 2018
Type of Offence
Month SpeedDriving
LicenceDrunken
DrivingCareless
DrivingCell
Phone P.S.V. FTPDL Seat BeltTraffic Lights Others Total Total 2017
Jan 9,227 1,866 904 835 374 231 163 2,598 639 9,312 26,149 25,550
Feb 1,917 2,204 889 1,017 404 239 240 2,183 618 12,269 21,980 22,677
Mar 8,603 2,133 1,085 1,044 368 304 207 2,685 643 12,387 29,459 28,458
Apr 9,363 2,022 972 862 312 217 163 1,976 1,097 11,207 28,191 27,269
May 7,560 1,979 827 1,019 368 218 172 2,135 1,013 9,524 24,815 26,739
Jun 6,817 1,942 880 1,062 375 236 162 2,005 838 9,552 23,869 26,488
Jul 7,766 1,825 821 972 413 208 110 1,949 840 9,897 24,801 25,013
Aug 3,133 2,530 915 1,048 576 283 198 3,034 1,039 14,449 27,205 29,699
Sept 8,730 2,329 1,114 1,008 508 210 159 2,519 833 12,419 29,829 28,071
Oct 8,439 2,271 893 1,008 511 315 204 2,371 672 11,717 28,401 27,532
Nov 7,839 2,231 585 1,036 466 209 171 2,747 750 10,273 26,307 28,757
Dec 7,896 2,468 867 970 425 293 173 2,504 582 12,048 28,226 30,183
Total 87,290 25,800 10,752 11,881 5,100 2,963 2,122 28,706 9,564 135,054 319,232 326,436
Source: Botswana Police Services ( Road Accident Statistics Unit)
2.4 Casualties
Accidents that occurred in 2018 resulted in 6,243 casualties, of which there were 462 deaths, 1,099 seriuos injuries and 4,682 minor injuries. Casualties declined by 1.5 percent from 6,335 casualties in 2017 to 6,243 casualties in 2018. Fatalities increased by 4.1 percent in 2018 compared to 2017. Serious injuries and minor injuries decreased by 4.6 and 1.2 percent respectively. See Table 11 in Appendix 2.
Casualties per 1,000 vehicles decreased by 6.0 percent in 2018 from 12.0 casualties in 2017 to 11.3 casualties. Casualties per 10,000 population also decreased by 3.1 percent from 28.0 casualties in 2017 to 27.1 casualties in 2018. The number of fatalities per 10,000 vehicles decreased by 0.8 percent from 8.4 fatalities in 2017 to 8.3 fatalities in 2018. Fatalites per 100,000 population increased from 19.6 fatalities in 2017 to 20.1 fatalities in 2018, a 2.3 percent increase. This is shown in Table 9 in Appendix 2 and Figure 7 below.
Figure 7: Casualties and Fatalities per 10,000 Population 2009-2018
26 TRANSPORT & INFRASTRUCTURE STATISTICS REPORT, 2018 Statistics Botswana
2.4.1 Casualties by Gender
Out of the 6,243 casualties recorded in 2018, 4,018 were male (64.4 percent) and the remaining 2,225 were female (35.6 percent). During the same year 332 males lost their lives, which was 8.3 percent of total male casualties while 130 females lost their lives( 5.8 percent of female casualties). Male casualties who suffered serious injuries accounted for 17.8 percent of male casualties while female serious injuries accounted for 17.2 percent of female casualties. See Table 12, Appendix 2.
2.4.2 Casualties by District and Type of Road User
The District refered to here is the Police district. The district that had a high number of casualties was Gaborone West constituting 19.3 percent of total casualties. Gaborone West also accounted for a high number of car casualties with 22.8 percent of total car casualties. Gaborone and Serowe followed with 15.9 and 8.6 percent of car casualties respectively. Mochudi, Molepolole and Kanye accounted for 6.4 percent of car casualties each. Maun had a high number of Pick-up casualties accounting for 11.5 percent of total pick-up users. Gaborone West followed with 10.2 percent casualties of total Pick-up users. Other districts with a high number of Pick-up casualties were Gaborone (9.9 percent), Serowe (9.8 percent), and Molepolole with 8.1 percent. The tractor users had the least number of casualties accounting for 0.2 percent of total casualties. See Table 13, Appendix 2.
2.4.3 Severity of Injury and Cause of Accident
In 2018, most of the accidents were caused by human error, with driver carelessness causing 54.8 percent of casualties which resulted in 47.6 percent of total fatalities. This was followed by driver losing control with 20.6 percent causing 26.8 percent of total fatalities. Pedestrian error caused 5.6 percent of casualties, Animals (domestic & wild) resulted in 5.5 percent of total casualties, while unlicenced driver and driving under the influence of alcohol or drugs resulted in 4.7 and 4.0 percent of total casualties respectively. As most of the accidents were caused by driver carelessness, education about road safety should be directed mostly towards drivers and enforcement in order to reduce the number of accidents. See Table 14, Appendix 2. 2.4.4 Casualty by District
The highest number of male and female casualties in 2018 were recorded at Gaborone West constituting 18.0 and 21.5 percent of total male and female casualties. Gaborone followed with 13.4 percent of total male casualties and 17.3 percent total female casualties. Serowe accounted for 9.0 and 8.6 percent male and female casualties respectively. With regard to male fatalities, Gaborone West recorded 13.3 percent of total male fatalities. It was was followed by Serowe with 10.5 percent. Kanye incurred 9.6 percent of total male fatalities while Molepolole accounted for 8.7 percent. Mahalapye and Maun each constituteed 7.2 percent of total male fatalities. Concerning females, Gaborone West accounted for 18.5 percent of total female fatalities. Molepolole followed with 12.3 percent of female fatalities. Serowe and Gaborone accounted for 10.0 percent each of female fatalities respectively, while Mahalapye constituted 8.5 percent. (Table 12 in Appendix 2).
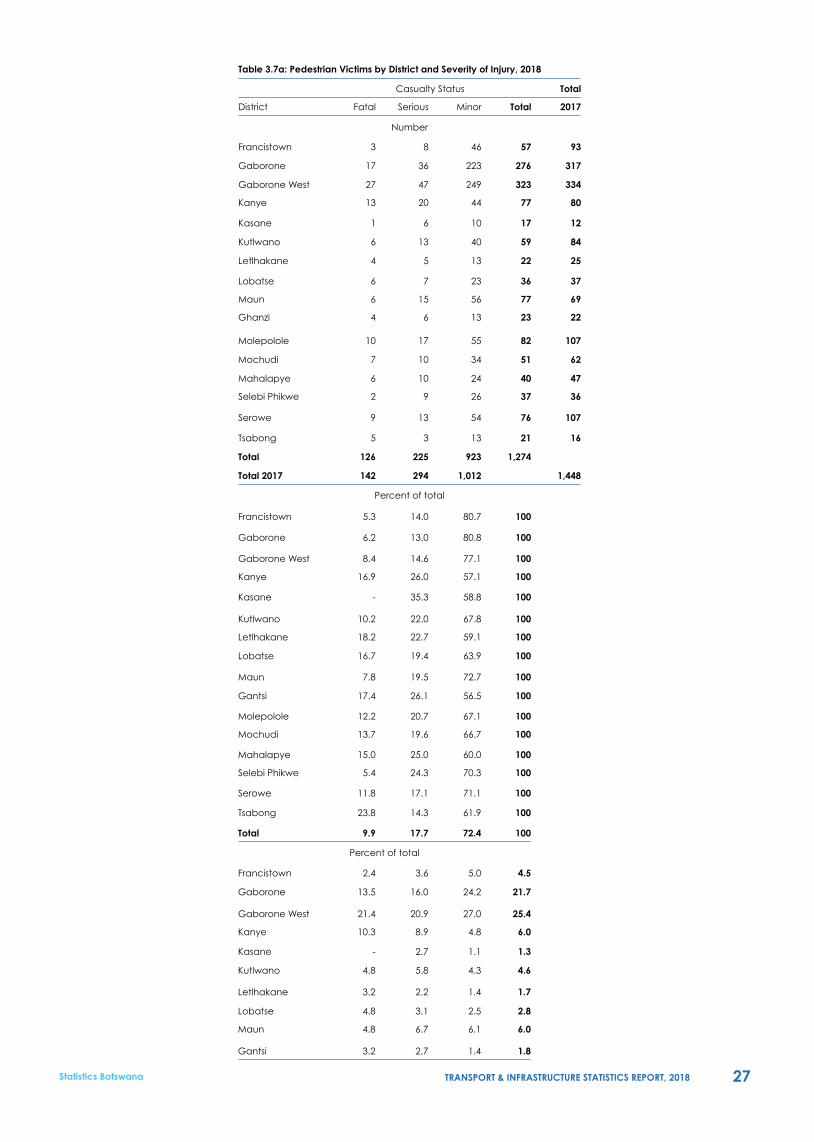
Pedestrian casualties in 2018 were 1,274, which was 12.0 decrease compared to pedestrian casualties in 2017. Gaborone West recorded 25.4 percent of total pedestrian victims while Gaborone accounted for 21.7 percent. Other areas which had a high number of pedestrian victims were Molepolole constituting 6.4 percent of total pedestrian casualties. Kanye, Maun and Serowe accounted for 6.0 percent of total pedestrian casualties each. Compared to 2017, pedestrian casualties went down in most of the districts, except in four districts where pedestrian casualties increased. In Kasane pedestrian casualties increased by 41.7 percent, Maun (11.6 percent), Ghanzi (4.5 percent) and Selebi Phikwe with 2.8 percent. Pedestrian fatalities in 2018 decreased by 12.7 percent compared to 2017. Gaborone West had a high number of fatalities with 21.4 percent of total pedestrian fatalities. Gaborone and Kanye followed with 13.5 and 10.3 percent respectively. Molepolole and Serowe accounted for 7.9 and 7.1 percent respectively while Mochudi accounted for 5.6 percent of total pedestrian fatalities. See Table 3.7a below.
27TRANSPORT & INFRASTRUCTURE STATISTICS REPORT, 2018Statistics Botswana
Table 3.7a: Pedestrian Victims by District and Severity of Injury, 2018
Casualty Status Total
District Fatal Serious Minor Total 2017
Number
Francistown 3 8 46 57 93
Gaborone 17 36 223 276 317
Gaborone West 27 47 249 323 334
Kanye 13 20 44 77 80
Kasane 1 6 10 17 12
Kutlwano 6 13 40 59 84
Letlhakane 4 5 13 22 25
Lobatse 6 7 23 36 37
Maun 6 15 56 77 69
Ghanzi 4 6 13 23 22
Molepolole 10 17 55 82 107
Mochudi 7 10 34 51 62
Mahalapye 6 10 24 40 47
Selebi Phikwe 2 9 26 37 36
Serowe 9 13 54 76 107
Tsabong 5 3 13 21 16
Total 126 225 923 1,274
Total 2017 142 294 1,012 1,448
Percent of total
Francistown 5.3 14.0 80.7 100
Gaborone 6.2 13.0 80.8 100
Gaborone West 8.4 14.6 77.1 100
Kanye 16.9 26.0 57.1 100
Kasane - 35.3 58.8 100
Kutlwano 10.2 22.0 67.8 100
Letlhakane 18.2 22.7 59.1 100
Lobatse 16.7 19.4 63.9 100
Maun 7.8 19.5 72.7 100
Gantsi 17.4 26.1 56.5 100
Molepolole 12.2 20.7 67.1 100
Mochudi 13.7 19.6 66.7 100
Mahalapye 15.0 25.0 60.0 100
Selebi Phikwe 5.4 24.3 70.3 100
Serowe 11.8 17.1 71.1 100
Tsabong 23.8 14.3 61.9 100
Total 9.9 17.7 72.4 100
Percent of total
Francistown 2.4 3.6 5.0 4.5
Gaborone 13.5 16.0 24.2 21.7
Gaborone West 21.4 20.9 27.0 25.4
Kanye 10.3 8.9 4.8 6.0
Kasane - 2.7 1.1 1.3
Kutlwano 4.8 5.8 4.3 4.6
Letlhakane 3.2 2.2 1.4 1.7
Lobatse 4.8 3.1 2.5 2.8
Maun 4.8 6.7 6.1 6.0
Gantsi 3.2 2.7 1.4 1.8

28 TRANSPORT & INFRASTRUCTURE STATISTICS REPORT, 2018 Statistics Botswana
Table 3.7a: Pedestrian Victims by District and Severity of Injury, 2018 (Cont)
Mahalapye 7.9 7.6 6.0 6.4
Molepolole 5.6 4.4 3.7 4.0
Mochudi 4.8 4.4 2.6 3.1
Selebi Phikwe 1.6 4.0 2.8 2.9
Serowe 7.1 5.8 5.9 6.0
Tsabong 4.0 1.3 1.4 1.6
Total 100 100 100 100
Source: Botswana Police Services ( Road Accident Statistics Unit)
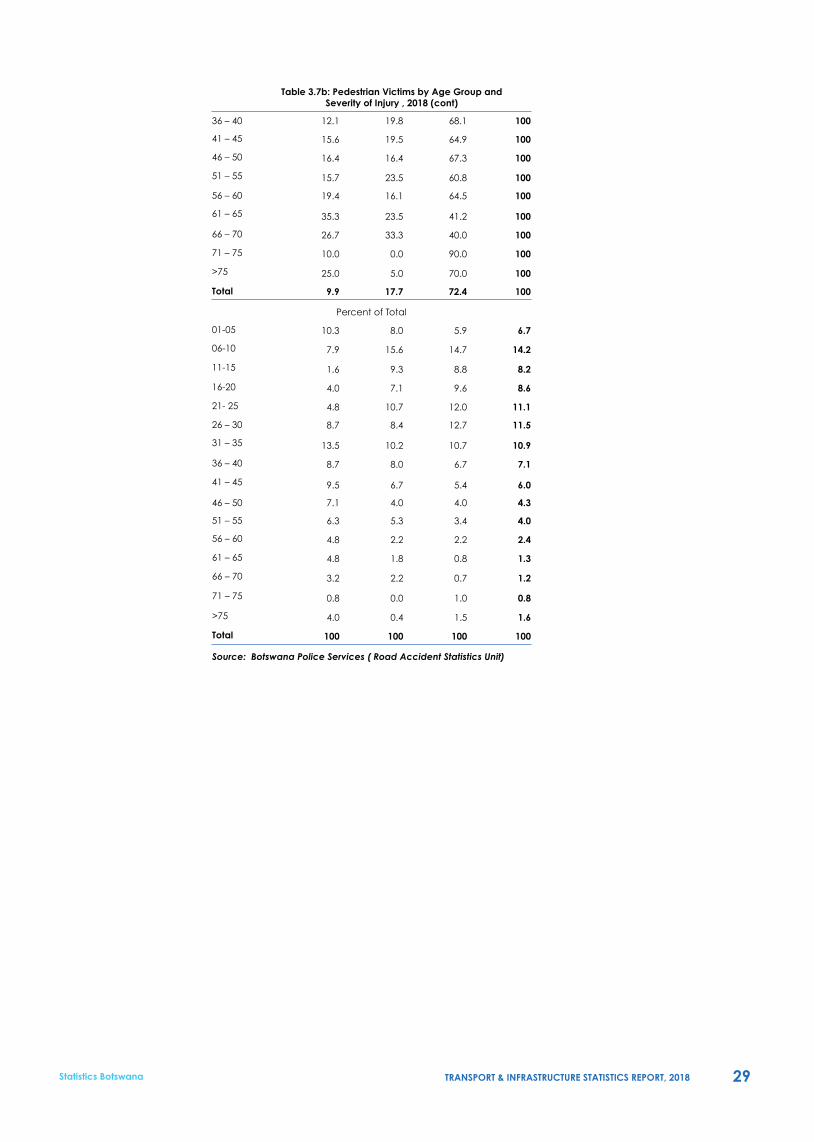
2.4.5 Pedestrian Casualty by Age Goup
The groups that were prone to accidents regarding pedestrians were were 6-10 year olds with 14.2 percent of total pedestrian casualties and 26-30 year olds with 11.5 percent of total pedestrian casualties. The groups that followed were 21-25 year olds and the 31-35 year olds with 11.1 and 10.9 percent of total pedestrian casualties respectively. The age group that had more fatalities was the 31-35 accounting for 13.5 percent of total fatalities. The 01-05 age group followed with 10.3 percent of total fatalities. Age group 41-45 accounted for 9.5 percent while 26-30 and 36-40 accounted for 8.7 percent each. The age group which was most vulnerable to accidents was the 26-40 accounting for 47.6 percent of total casualties. Compared to 2017, most of the age groups pedestrian casualties decreased except the 46-50 age group where pedestrian casualties increased by 12.2 percent. See Table 3.7 b below
Table 3.7b: Pedestrian Victims by Age Group and Severity of Injury , 2018
Age Group Fatal Serious Injury Minor Injury TotalTotal 2017
Number
01-05 13 18 54 85 105
06-10 10 35 136 181 195
11-15 2 21 81 104 125
16-20 5 16 89 110 136
21- 25 6 24 111 141 162
26 – 30 11 19 117 147 170
31 – 35 17 23 99 139 146
36 – 40 11 18 62 91 108
41 – 45 12 15 50 77 81
46 – 50 9 9 37 55 49
51 – 55 8 12 31 51 53
56 – 60 6 5 20 31 35
61 – 65 6 4 7 17 20
66 – 70 4 5 6 15 25
71 – 75 1 - 9 10 11
>75 5 1 14 20 27
Total 126 225 923 1,274 1448
Percent of Total
01-05 15.3 21.2 63.5 100
06-10 5.5 19.3 75.1 100
11-15 1.9 20.2 77.9 100
16-20 4.5 14.5 80.9 100
21- 25 4.3 17.0 78.7 100
26 – 30 7.5 12.9 79.6 100
31 – 35 12.2 16.5 71.2 100
29TRANSPORT & INFRASTRUCTURE STATISTICS REPORT, 2018Statistics Botswana
Table 3.7b: Pedestrian Victims by Age Group and Severity of Injury , 2018 (cont)
36 – 40 12.1 19.8 68.1 100
41 – 45 15.6 19.5 64.9 100
46 – 50 16.4 16.4 67.3 100
51 – 55 15.7 23.5 60.8 100
56 – 60 19.4 16.1 64.5 100
61 – 65 35.3 23.5 41.2 100
66 – 70 26.7 33.3 40.0 100
71 – 75 10.0 0.0 90.0 100
>75 25.0 5.0 70.0 100
Total 9.9 17.7 72.4 100
Percent of Total
01-05 10.3 8.0 5.9 6.7
06-10 7.9 15.6 14.7 14.2
11-15 1.6 9.3 8.8 8.2
16-20 4.0 7.1 9.6 8.6
21- 25 4.8 10.7 12.0 11.1
26 – 30 8.7 8.4 12.7 11.5
31 – 35 13.5 10.2 10.7 10.9
36 – 40 8.7 8.0 6.7 7.1
41 – 45 9.5 6.7 5.4 6.0
46 – 50 7.1 4.0 4.0 4.3
51 – 55 6.3 5.3 3.4 4.0
56 – 60 4.8 2.2 2.2 2.4
61 – 65 4.8 1.8 0.8 1.3
66 – 70 3.2 2.2 0.7 1.2
71 – 75 0.8 0.0 1.0 0.8
>75 4.0 0.4 1.5 1.6
Total 100 100 100 100
Source: Botswana Police Services ( Road Accident Statistics Unit)
30 TRANSPORT & INFRASTRUCTURE STATISTICS REPORT, 2018 Statistics Botswana
2.4.6 Driver Casualties by Age
There were 2, 220 driver casualties in 2018, a 5.2 percent increase compared to driver casualties in 2017. The 31-35 age group accounted for 20.9 percent of total driver casualties. This age group was followed by the 26-30 with 19.4 percent. Age groups 36-40 and 41-45 accounted for 17.2 and 13.3 percent of total driver casualties respectively. The 21-25 age group constituted 9.9 percent of driver casualties. Compared to 2017, the 26-30 age group casualties increased by 20.4 percent while the 41-45 age group casualties increased by 44.4 percent. The other age group where there was an increase in driver casualties was the 51-55 age group (24.1 percent). See Table 15, Appendix 2.
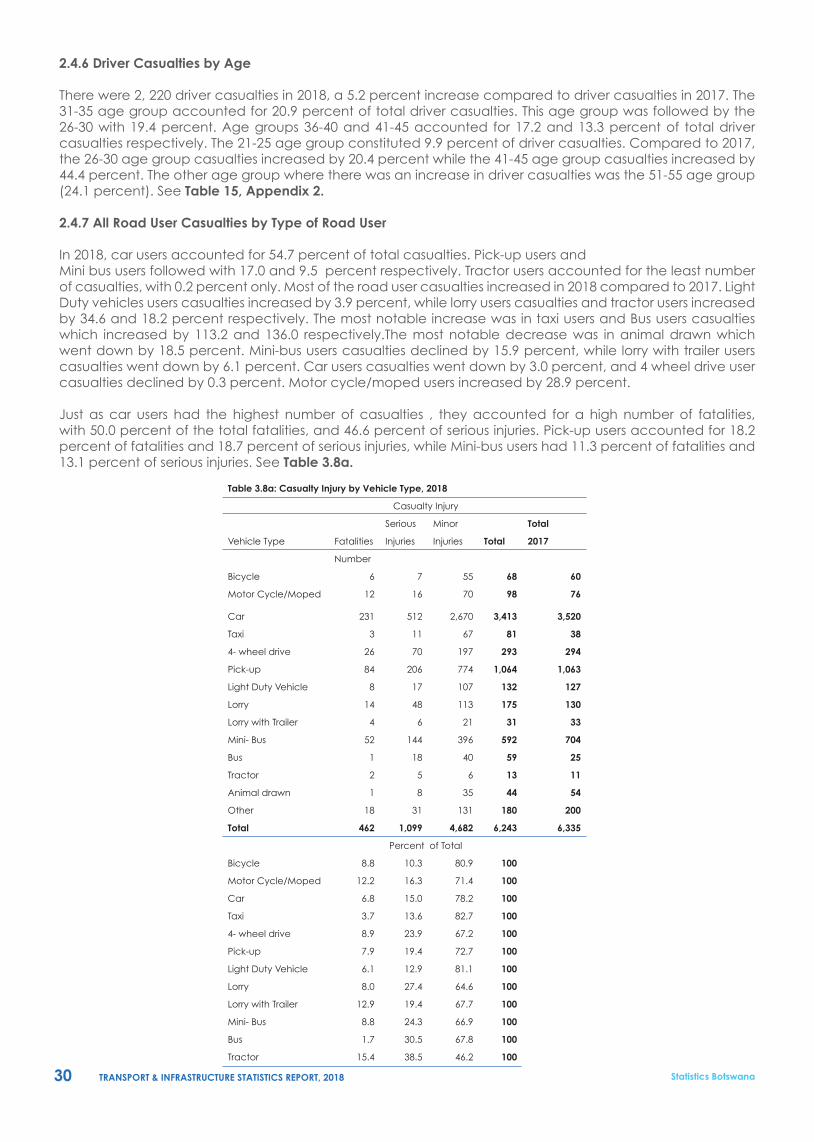
2.4.7 All Road User Casualties by Type of Road User
In 2018, car users accounted for 54.7 percent of total casualties. Pick-up users and Mini bus users followed with 17.0 and 9.5 percent respectively. Tractor users accounted for the least number of casualties, with 0.2 percent only. Most of the road user casualties increased in 2018 compared to 2017. Light Duty vehicles users casualties increased by 3.9 percent, while lorry users casualties and tractor users increased by 34.6 and 18.2 percent respectively. The most notable increase was in taxi users and Bus users casualties which increased by 113.2 and 136.0 respectively.The most notable decrease was in animal drawn which went down by 18.5 percent. Mini-bus users casualties declined by 15.9 percent, while lorry with trailer users casualties went down by 6.1 percent. Car users casualties went down by 3.0 percent, and 4 wheel drive user casualties declined by 0.3 percent. Motor cycle/moped users increased by 28.9 percent.
Just as car users had the highest number of casualties , they accounted for a high number of fatalities, with 50.0 percent of the total fatalities, and 46.6 percent of serious injuries. Pick-up users accounted for 18.2 percent of fatalities and 18.7 percent of serious injuries, while Mini-bus users had 11.3 percent of fatalities and 13.1 percent of serious injuries. See Table 3.8a.
Table 3.8a: Casualty Injury by Vehicle Type, 2018
Casualty Injury
Serious Minor Total
Vehicle Type Fatalities Injuries Injuries Total 2017
Number
Bicycle 6 7 55 68 60
Motor Cycle/Moped 12 16 70 98 76
Car 231 512 2,670 3,413 3,520
Taxi 3 11 67 81 38
4- wheel drive 26 70 197 293 294
Pick-up 84 206 774 1,064 1,063
Light Duty Vehicle 8 17 107 132 127
Lorry 14 48 113 175 130
Lorry with Trailer 4 6 21 31 33
Mini- Bus 52 144 396 592 704
Bus 1 18 40 59 25
Tractor 2 5 6 13 11
Animal drawn 1 8 35 44 54
Other 18 31 131 180 200
Total 462 1,099 4,682 6,243 6,335
Percent of Total
Bicycle 8.8 10.3 80.9 100
Motor Cycle/Moped 12.2 16.3 71.4 100
Car 6.8 15.0 78.2 100
Taxi 3.7 13.6 82.7 100
4- wheel drive 8.9 23.9 67.2 100
Pick-up 7.9 19.4 72.7 100
Light Duty Vehicle 6.1 12.9 81.1 100
Lorry 8.0 27.4 64.6 100
Lorry with Trailer 12.9 19.4 67.7 100
Mini- Bus 8.8 24.3 66.9 100
Bus 1.7 30.5 67.8 100
Tractor 15.4 38.5 46.2 100

31TRANSPORT & INFRASTRUCTURE STATISTICS REPORT, 2018Statistics Botswana
Table 3.8a: Casualty Injury by Vehicle Type, 2018 (cont)
Animal drawn 2.3 18.2 79.5 100
Other 10.0 17.2 72.8 100
Total 7.4 17.6 75.0 100
Percent of Total
Bicycle 1.3 0.6 1.2 1.1
Motor Cycle/Moped 2.6 1.5 1.5 1.6
Car 50.0 46.6 57.0 54.7
Taxi 0.6 1.0 1.4 1.3
4- wheel drive 5.6 6.4 4.2 4.7
Pick-up 18.2 18.7 16.5 17.0
Light Duty Vehicle 1.7 1.5 2.3 2.1
Lorry 3.0 4.4 2.4 2.8
Lorry with Trailer 0.9 0.5 0.4 0.5
Mini- Bus 11.3 13.1 8.5 9.5
Bus 0.2 1.6 0.9 0.9
Tractor 0.4 0.5 0.1 0.2
Animal drawn 0.2 0.7 0.7 0.7
Other 3.9 2.8 2.8 2.9
Total 100 100 100 100
Source: Botswana Police Services ( Road Accident Statistics Unit)
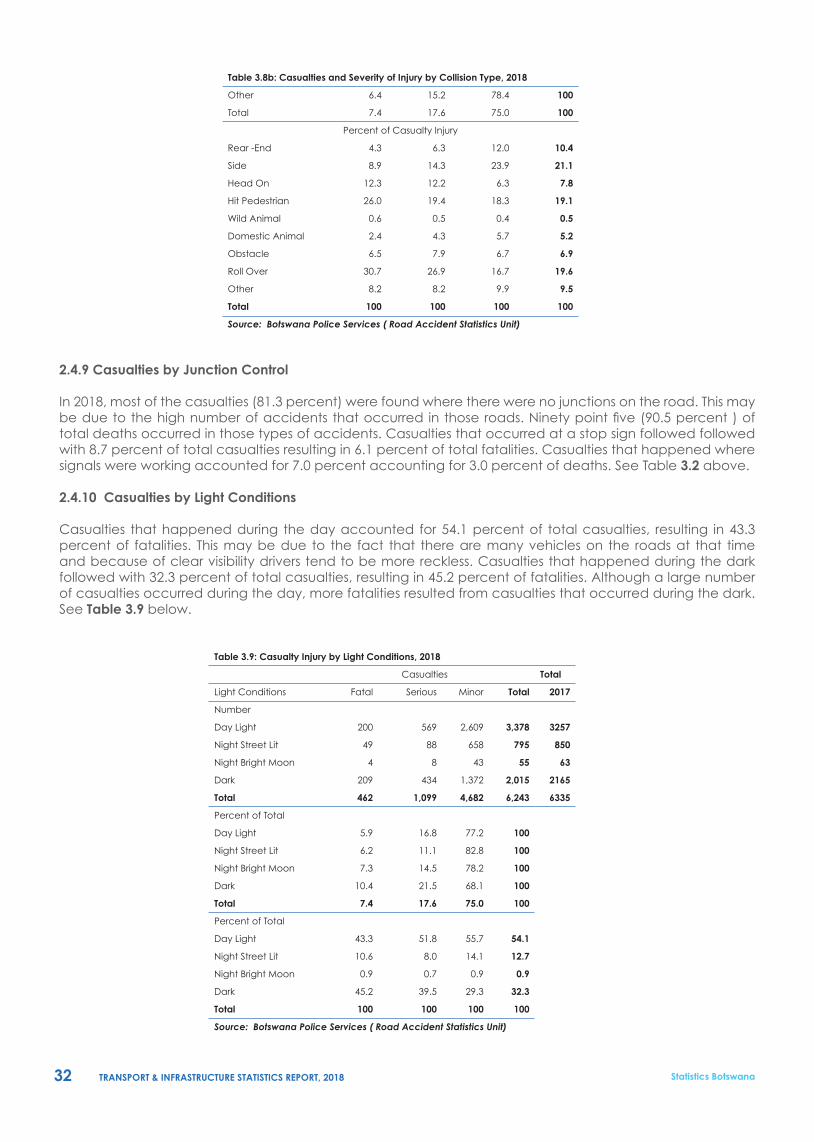
2.4.8 Casualties and Severity of Injury by Collision Type
This sub-section looks at how accidents happen in our roads and the resulting casualties from those accidents. The type of accident that resulted in more casualties is the “side” accounting for 21.1 percent of total casualties, and 8.9 of fatalities. The “roll over” followed with 19.6 percent of total casualties. The “hit a pedestrian” accounted for 19.1 percent, while the “rear end” constituted 10.4 percent of total casualties. “Head on collision” and and “Obstacle” accounted for 7.8 and 6.9 percent respectively. The “roll over” collision type resulted in more fatalities with 30.7 percent of total fatalities. The “hit a pedestrian” followed accounting for 26.0 percent of total fatalities. Other collision types that resulted in more deaths were the “head on” and “side”, accounting for 12.3 and 8.9 percent of total fatalities respectively. See Table 3.8b.
Table 3.8b: Casualties and Severity of Injury by Collision Type, 2018
Casualty Injury
Serious Minor Total
Collision Type Fatalities Injuries Injuries Total 2016
Number
Rear -End 20 69 560 649 817
Side 41 157 1,120 1,318 1116
Head On 57 134 297 488 414
Hit Pedestrian 120 213 859 1,192 1409
Wild Animal 3 6 20 29 27
Domestic Animal 11 47 265 323 301
Obstacle 30 87 312 429 344
Roll Over 142 296 784 1,222 1224
Other 38 90 465 593 683
Total 462 1,099 4,682 6,243 6335
Percent of Collision Type
Rear -End 3.1 10.6 86.3 100
Side 3.1 11.9 85.0 100
Head On 11.7 27.5 60.9 100
Hit Pedestrian 10.1 17.9 72.1 100
Wild Animal 10.3 20.7 69.0 100
Domestic Animal 3.4 14.6 82.0 100
Obstacle 7.0 20.3 72.7 100
Roll Over 11.6 24.2 64.2 100
32 TRANSPORT & INFRASTRUCTURE STATISTICS REPORT, 2018 Statistics Botswana
2.4.9 Casualties by Junction Control
In 2018, most of the casualties (81.3 percent) were found where there were no junctions on the road. This may be due to the high number of accidents that occurred in those roads. Ninety point five (90.5 percent ) of total deaths occurred in those types of accidents. Casualties that occurred at a stop sign followed followed with 8.7 percent of total casualties resulting in 6.1 percent of total fatalities. Casualties that happened where signals were working accounted for 7.0 percent accounting for 3.0 percent of deaths. See Table 3.2 above.
2.4.10 Casualties by Light Conditions
Casualties that happened during the day accounted for 54.1 percent of total casualties, resulting in 43.3 percent of fatalities. This may be due to the fact that there are many vehicles on the roads at that time and because of clear visibility drivers tend to be more reckless. Casualties that happened during the dark followed with 32.3 percent of total casualties, resulting in 45.2 percent of fatalities. Although a large number of casualties occurred during the day, more fatalities resulted from casualties that occurred during the dark. See Table 3.9 below.
Table 3.8b: Casualties and Severity of Injury by Collision Type, 2018
Other 6.4 15.2 78.4 100
Total 7.4 17.6 75.0 100
Percent of Casualty Injury
Rear -End 4.3 6.3 12.0 10.4
Side 8.9 14.3 23.9 21.1
Head On 12.3 12.2 6.3 7.8
Hit Pedestrian 26.0 19.4 18.3 19.1
Wild Animal 0.6 0.5 0.4 0.5
Domestic Animal 2.4 4.3 5.7 5.2
Obstacle 6.5 7.9 6.7 6.9
Roll Over 30.7 26.9 16.7 19.6
Other 8.2 8.2 9.9 9.5
Total 100 100 100 100
Source: Botswana Police Services ( Road Accident Statistics Unit)
Table 3.9: Casualty Injury by Light Conditions, 2018
Casualties Total
Light Conditions Fatal Serious Minor Total 2017
Number
Day Light 200 569 2,609 3,378 3257
Night Street Lit 49 88 658 795 850
Night Bright Moon 4 8 43 55 63
Dark 209 434 1,372 2,015 2165
Total 462 1,099 4,682 6,243 6335
Percent of Total
Day Light 5.9 16.8 77.2 100
Night Street Lit 6.2 11.1 82.8 100
Night Bright Moon 7.3 14.5 78.2 100
Dark 10.4 21.5 68.1 100
Total 7.4 17.6 75.0 100
Percent of Total
Day Light 43.3 51.8 55.7 54.1
Night Street Lit 10.6 8.0 14.1 12.7
Night Bright Moon 0.9 0.7 0.9 0.9
Dark 45.2 39.5 29.3 32.3
Total 100 100 100 100
Source: Botswana Police Services ( Road Accident Statistics Unit)

33TRANSPORT & INFRASTRUCTURE STATISTICS REPORT, 2018Statistics Botswana
2.4.11 Casualties by Injury and Age
The age group that incurred a high number of casualties was the 26-30 age group accounting for 17.3 percent of total casualties. It was followed by the 31-35 age group with 16.4 percent of total casualties. The age group of 21-40 accounted for 59.1 percent of total casualties. This is the age group that make the workforce, so this may be explained by the fact that they are always on the road. The age groups 21-25 and 36-40 years accounted for 12.9 and 12.3 percent of total casualties respectively. The age group 31-35 years incurred the highest number of fatalities (16.0 percent) and serious injuries (15.8 percent). The 26-30 age group followed with 13.6 percent fatalities and 15.6 serious injuries. The age groups 21-25 and 36-40 accounted for 11.5 and 11.0 percent fatalities respectively. See Table 3.10.
Table 3.10: Casualties by Injury and Age, 2018
Casualties Total
Age Fatal Serious Minor Total 2017
Number
01-05 27 43 127 197 199
06-10 15 57 232 304 300
11-15 7 33 167 207 239
16-20 17 63 303 383 423
21-25 53 142 613 808 874
26-30 63 171 849 1,083 1041
31-35 74 174 778 1,026 1063
36-40 51 136 583 770 790
41-45 49 94 395 538 470
46-50 25 69 228 322 309
51-55 23 47 163 233 210
56-60 18 28 107 153 166
61-65 16 20 53 89 99
66-70 8 13 38 59 73
71-75 4 4 20 28 31
>75 12 5 26 43 48
Total 462 1,099 4,682 6,243 6335
Percent of Total
01-05 13.7 21.8 64.5 100
06-10 4.9 18.8 76.3 100
11-15 3.4 15.9 80.7 100
16-20 4.4 16.4 79.1 100
21-25 6.6 17.6 75.9 100
26-30 5.8 15.8 78.4 100
31-35 7.2 17.0 75.8 100
36-40 6.6 17.7 75.7 100
41-45 9.1 17.5 73.4 100
46-50 7.8 21.4 70.8 100
51-55 9.9 20.2 70.0 100
56-60 11.8 18.3 69.9 100
61-65 18.0 22.5 59.6 100
66-70 13.6 22.0 64.4 100
71-75 14.3 14.3 71.4 100
>75 27.9 11.6 60.5 100
Total 7.4 17.6 75.0 100
Percent of Total
01-05 5.8 3.9 2.7 3.2
06-10 3.2 5.2 5.0 4.9
11-15 1.5 3.0 3.6 3.3
16-20 3.7 5.7 6.5 6.1
21-25 11.5 12.9 13.1 12.9
26-30 13.6 15.6 18.1 17.3
31-35 16.0 15.8 16.6 16.4
36-40 11.0 12.4 12.5 12.3
34 TRANSPORT & INFRASTRUCTURE STATISTICS REPORT, 2018 Statistics Botswana
Table 3.10: Casualties by Injury and Age, 2018 (cont)
36-40 11.0 12.4 12.5 12.3
41-45 10.6 8.6 8.4 8.6
46-50 5.4 6.3 4.9 5.2
51-55 5.0 4.3 3.5 3.7
56-60 3.9 2.5 2.3 2.5
61-65 3.5 1.8 1.1 1.4
66-70 1.7 1.2 0.8 0.9
71-75 0.9 0.4 0.4 0.4
>75 2.6 0.5 0.6 0.7
Total 100 100 100 100
Source: Botswana Police Services ( Road Accident Statistics Unit)
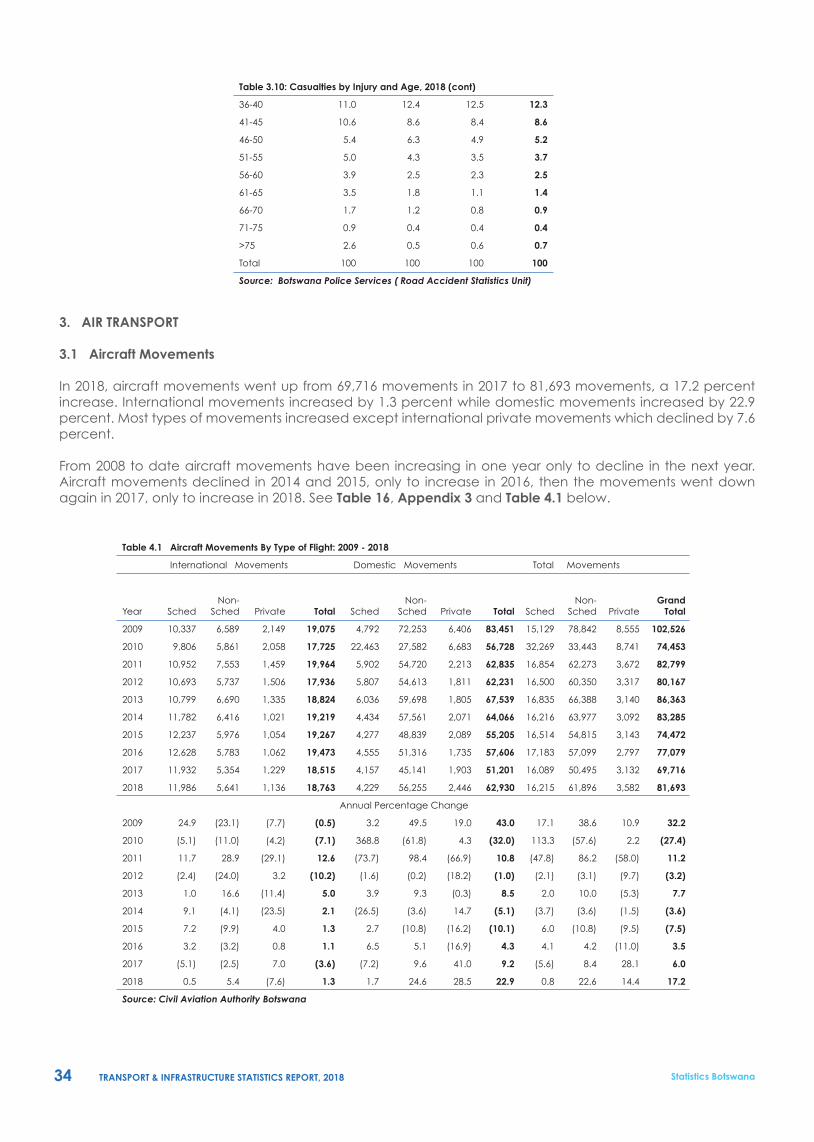
3. AIR TRANSPORT
3.1 Aircraft Movements
In 2018, aircraft movements went up from 69,716 movements in 2017 to 81,693 movements, a 17.2 percent increase. International movements increased by 1.3 percent while domestic movements increased by 22.9 percent. Most types of movements increased except international private movements which declined by 7.6 percent.
From 2008 to date aircraft movements have been increasing in one year only to decline in the next year. Aircraft movements declined in 2014 and 2015, only to increase in 2016, then the movements went down again in 2017, only to increase in 2018. See Table 16, Appendix 3 and Table 4.1 below.
Table 4.1 Aircraft Movements By Type of Flight: 2009 - 2018
International Movements Domestic Movements Total Movements
Non-Sched
Non-Sched
Non-Sched
Grand TotalYear Sched Private Total Sched Private Total Sched Private
2009 10,337 6,589 2,149 19,075 4,792 72,253 6,406 83,451 15,129 78,842 8,555 102,526
2010 9,806 5,861 2,058 17,725 22,463 27,582 6,683 56,728 32,269 33,443 8,741 74,453
2011 10,952 7,553 1,459 19,964 5,902 54,720 2,213 62,835 16,854 62,273 3,672 82,799
2012 10,693 5,737 1,506 17,936 5,807 54,613 1,811 62,231 16,500 60,350 3,317 80,167
2013 10,799 6,690 1,335 18,824 6,036 59,698 1,805 67,539 16,835 66,388 3,140 86,363
2014 11,782 6,416 1,021 19,219 4,434 57,561 2,071 64,066 16,216 63,977 3,092 83,285
2015 12,237 5,976 1,054 19,267 4,277 48,839 2,089 55,205 16,514 54,815 3,143 74,472
2016 12,628 5,783 1,062 19,473 4,555 51,316 1,735 57,606 17,183 57,099 2,797 77,079
2017 11,932 5,354 1,229 18,515 4,157 45,141 1,903 51,201 16,089 50,495 3,132 69,716
2018 11,986 5,641 1,136 18,763 4,229 56,255 2,446 62,930 16,215 61,896 3,582 81,693
Annual Percentage Change
2009 24.9 (23.1) (7.7) (0.5) 3.2 49.5 19.0 43.0 17.1 38.6 10.9 32.2
2010 (5.1) (11.0) (4.2) (7.1) 368.8 (61.8) 4.3 (32.0) 113.3 (57.6) 2.2 (27.4)
2011 11.7 28.9 (29.1) 12.6 (73.7) 98.4 (66.9) 10.8 (47.8) 86.2 (58.0) 11.2
2012 (2.4) (24.0) 3.2 (10.2) (1.6) (0.2) (18.2) (1.0) (2.1) (3.1) (9.7) (3.2)
2013 1.0 16.6 (11.4) 5.0 3.9 9.3 (0.3) 8.5 2.0 10.0 (5.3) 7.7
2014 9.1 (4.1) (23.5) 2.1 (26.5) (3.6) 14.7 (5.1) (3.7) (3.6) (1.5) (3.6)
2015 7.2 (9.9) 4.0 1.3 2.7 (10.8) (16.2) (10.1) 6.0 (10.8) (9.5) (7.5)
2016 3.2 (3.2) 0.8 1.1 6.5 5.1 (16.9) 4.3 4.1 4.2 (11.0) 3.5
2017 (5.1) (2.5) 7.0 (3.6) (7.2) 9.6 41.0 9.2 (5.6) 8.4 28.1 6.0
2018 0.5 5.4 (7.6) 1.3 1.7 24.6 28.5 22.9 0.8 22.6 14.4 17.2
Source: Civil Aviation Authority Botswana
35TRANSPORT & INFRASTRUCTURE STATISTICS REPORT, 2018Statistics Botswana
3.1.1 Aicraft Movements by Airport
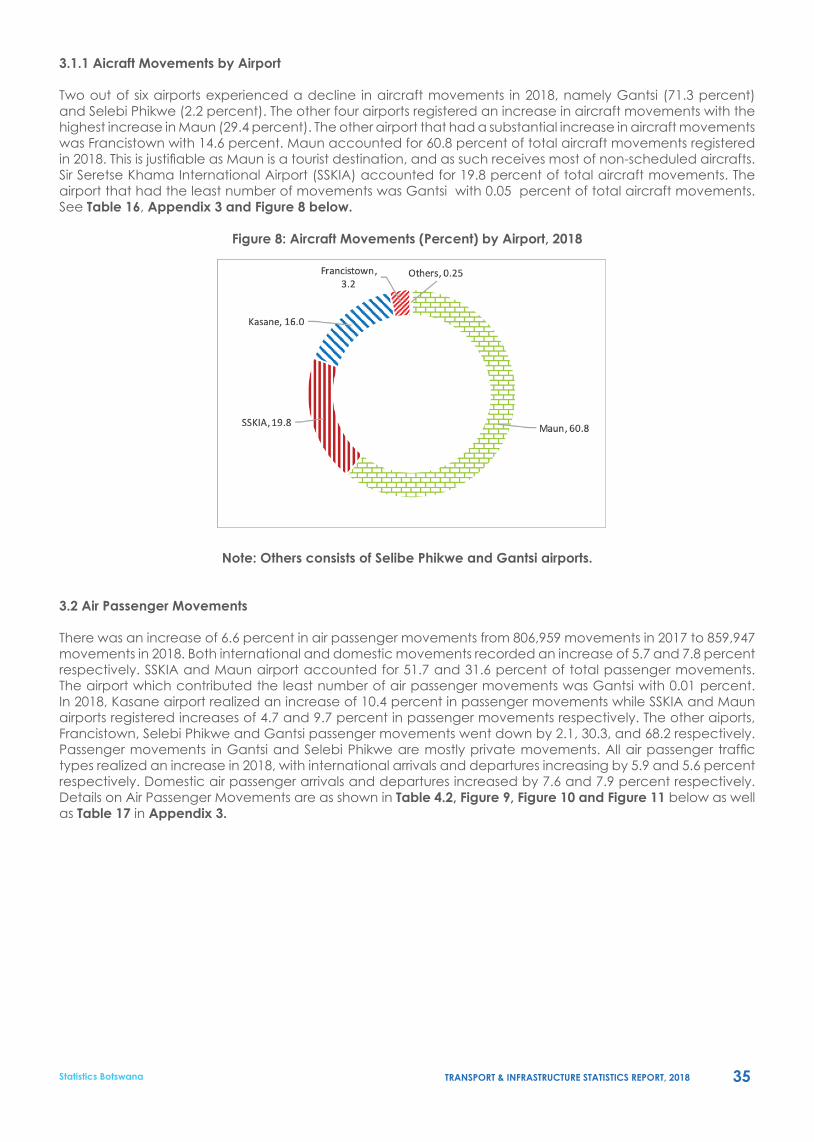
Two out of six airports experienced a decline in aircraft movements in 2018, namely Gantsi (71.3 percent) and Selebi Phikwe (2.2 percent). The other four airports registered an increase in aircraft movements with the highest increase in Maun (29.4 percent). The other airport that had a substantial increase in aircraft movements was Francistown with 14.6 percent. Maun accounted for 60.8 percent of total aircraft movements registered in 2018. This is justifiable as Maun is a tourist destination, and as such receives most of non-scheduled aircrafts. Sir Seretse Khama International Airport (SSKIA) accounted for 19.8 percent of total aircraft movements. The airport that had the least number of movements was Gantsi with 0.05 percent of total aircraft movements. See Table 16, Appendix 3 and Figure 8 below.
Figure 8: Aircraft Movements (Percent) by Airport, 2018
Note: Others consists of Selibe Phikwe and Gantsi airports.
3.2 Air Passenger Movements
There was an increase of 6.6 percent in air passenger movements from 806,959 movements in 2017 to 859,947 movements in 2018. Both international and domestic movements recorded an increase of 5.7 and 7.8 percent respectively. SSKIA and Maun airport accounted for 51.7 and 31.6 percent of total passenger movements. The airport which contributed the least number of air passenger movements was Gantsi with 0.01 percent. In 2018, Kasane airport realized an increase of 10.4 percent in passenger movements while SSKIA and Maun airports registered increases of 4.7 and 9.7 percent in passenger movements respectively. The other aiports, Francistown, Selebi Phikwe and Gantsi passenger movements went down by 2.1, 30.3, and 68.2 respectively. Passenger movements in Gantsi and Selebi Phikwe are mostly private movements. All air passenger traffic types realized an increase in 2018, with international arrivals and departures increasing by 5.9 and 5.6 percent respectively. Domestic air passenger arrivals and departures increased by 7.6 and 7.9 percent respectively. Details on Air Passenger Movements are as shown in Table 4.2, Figure 9, Figure 10 and Figure 11 below as well as Table 17 in Appendix 3.

36 TRANSPORT & INFRASTRUCTURE STATISTICS REPORT, 2018 Statistics Botswana
Figure 9: International and Domestic Air Passenger Movements, 2009-2018
Table 4.2: International and Domestic Air Passenger Traffic, 2009 - 2018
Total International & Domestic
Traffic
International Traffic Domestic Traffic
Arrivals Departures Total Arrivals Departures Total
Year Number of Passengers
2009 192,903 195,787 388,690 192,193 191,303 383,496 772,186
2010 197,689 199,830 397,519 189,727 187,525 377,252 774,771
2011 204,693 208,867 413,560 186,978 186,917 373,895 787,455
2012 195,925 202,669 398,594 182,625 179,256 361,881 760,475
2013 199,999 206,439 406,438 190,233 186,984 377,217 783,655
2014 203,707 209,718 413,425 172,306 169,990 342,296 755,721
2015 203,030 209,675 412,705 154,524 153,677 308,201 720,906
2016 215,701 223,402 439,103 164,095 160,948 325,043 764,146
2017 231,323 242,553 473,876 168,043 165,040 333,083 806,959
2018 244,899 256,098 500,997 180,831 178,119 358,950 859,947
Annual Percentage Change
2009 22.6 25.8 24.1 29.1 29.8 29.4 26.7
2010 2.5 2.1 2.3 (1.3) (2.0) (1.6) 0.3
2011 3.5 4.5 4.0 (1.4) (0.3) (0.9) 1.6
2012 (4.3) (3.0) (3.6) (2.3) (4.1) (3.2) (3.4)
2013 2.1 1.9 (1.7) 1.7 0.0 0.9 (0.5)
2014 1.9 1.6 1.7 (9.4) (9.1) (9.3) (3.6)
2015 (0.3) -0.0 (0.2) (10.3) (9.6) (10.0) (4.6)
2016 13.9 15.7 14.8 8.7 7.4 8.1 11.9
2017 13.5 14.6 14.1 10.2 10.7 10.4 12.5
2018 5.9 5.6 5.7 7.6 7.9 7.8 6.6
Source: Civil Aviation Authority Botswana

37TRANSPORT & INFRASTRUCTURE STATISTICS REPORT, 2018Statistics Botswana
Figure 10: Air Passenger Traffic, 2009 - 2018
Figure 11: Air Passenger Movements (Percent) by Airport, 2018
“Others” constitutes S/Phikwe and Ghanzi airports
3.2.1 Air Passenger Movements by Type of Flight
In 2018, scheduled passenger movements accounted for 75.0 percent of total passenger movements while non-scheduled and private passenger movements constituted 23.8 and 1.2 percent respectively. Out of 859,947 air passengers, arrivals accounted for, 49.5 percent of total passengers, and passenger departures constituted 50.5 percent of total passengers. As for passenger departures, 75.6 percent were scheduled while 23.3 percent were non-scheduled and 1.1 percent were private. Scheduled and non-scheduled arrivals went up by 5.5 and 9.7 respectively, private arrivals went up by 11.5 percent. In departures, scheduled and non-scheduled passengers increased by 5.5 and 10.2 percent respectively while private departures increased by 6.0 percent. (see Table 18, Appendix 3). 3.3 Air Cargo & Mail Traffic
There was a decline of 12.7 percent of air cargo from 459,909 kgs carried in 2017 to 396,940 kgs carried in 2018. Since 2013 air cargo has been declining at an average rate of 8.8 percent per annum. A notable decrease was in 2017 when cargo decreased by 22.0 percent. International cargo declined by 15.8 percent while domestic cargo increased by 7.8 percent. Some of the reasons for the decline of air cargo is the cancellation

38 TRANSPORT & INFRASTRUCTURE STATISTICS REPORT, 2018 Statistics Botswana
and schedule change of flights. Flights operating to and from Botswana do not have flights dedicated to carrying cargo. See Table 4.3 below.
Since 2013 there has not been any mail carried by air. This could be attributed to the the emergence of more cost effective means of communication in recent years. These include, but are not limited to, mobile phones.
4. RAILWAY TRANSPORT
4.1 Rail Passengers
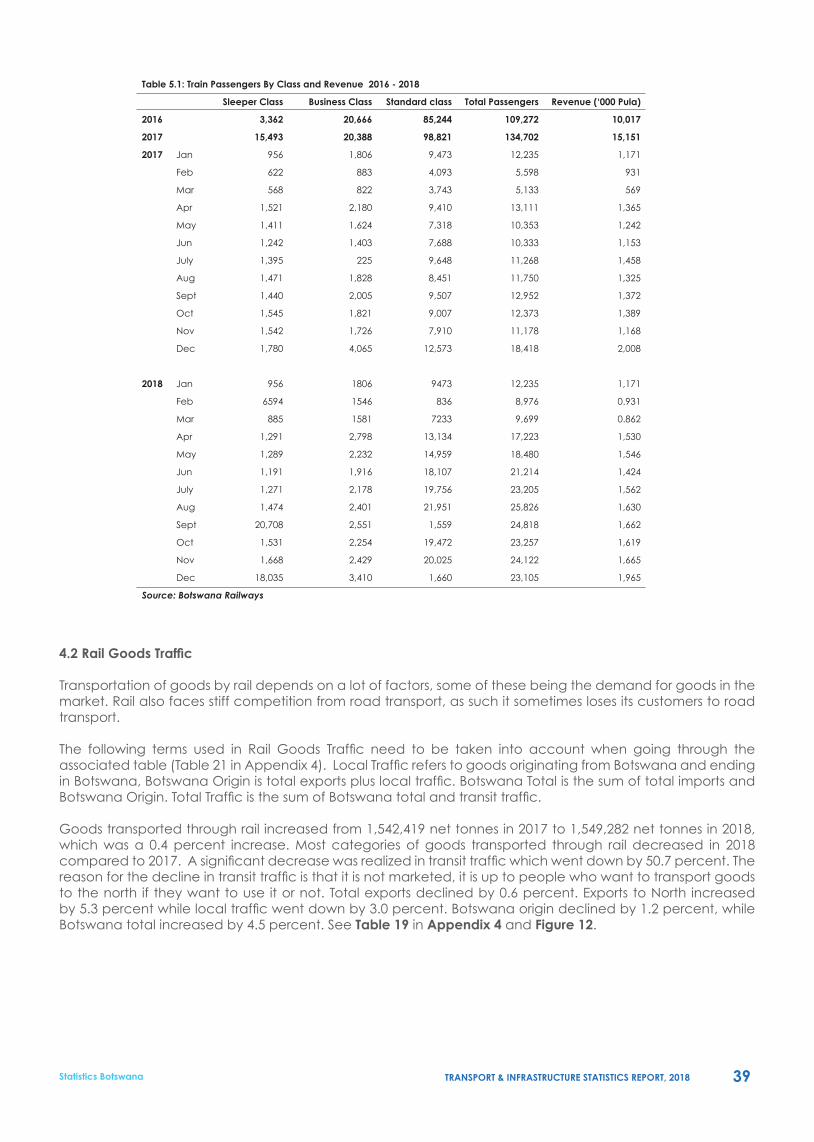
The passenger train was reinstated in April 2016, hence data for 2016 relates to only three quarters. Passengers transported using rail in 2018 increased by 72.4 percent from 134,702 passengers in 2017 to 232,160 in 2018. This growth was attributed to the introduction of a commuter train operating between Lobatse and Gaborone. Out of the passengers transported using rail in 2018, 24.5 percent used sleeper class, 11.7 percent used business class while 63.8 percent used standard class. In 2018 P15,776 million was generated in the transportation of passengers, which was a 4.1 percent increase of revenue generated in 2017. See Table 5.1 below
Table 4.3: Cargo and Mail Traffic, 2009-2018
Cargo Traffic (Kgs) Mail Traffic (Kgs)
Year International Domestic Total International Domestic Total
2009 704,397 232,490 936,887 - 1,683 1,683
2010 260,246 547,115 807,361 - 2,878 2,878
2011 530,284 294,697 824,981 - 2,664 2,664
2012 978,302 26,434 1,004,736 - 519 519
2013 697,297 238,468 935,765 - - -
2014 639,343 160,607 799,950 - - -
2015 564,182 121,746 685,928 - - -
2016 496,179 86,958 583,137 - - -
2017 395,299 59,610 454,909 - - -
2018 332,708 64,232 396,940 - - -
Annual Percentage Change
2009 (16.2) 2.2 (12.3) - 17.8 15.7
2010 (63.1) 135.3 (13.8) - 71.0 71.0
2011 103.8 (46.1) 2.2 - (7.4) (7.4)
2012 84.5 (91.0) 21.8 - (80.5) (80.5)
2013 (28.7) 802.1 (6.9) - - -
2014 (8.3) (32.7) (14.5) - - -
2015 (11.8) (24.2) (14.3) - - -
2016 (12.1) (28.6) (15.0) - - -
2017 (20.3) (31.4) (22.0) - - -
2018 (15.8) 7.8 (12.7) - - -
Percent of Total
2009 75.2 24.8 100 - 100 100
2010 32.2 67.8 100 - 100 100
2011 64.3 35.7 100 - 100 100
2012 97.4 2.6 100 - - -
2013 74.5 25.5 100 - - -
2014 79.9 20.1 100 - - -
2015 82.3 17.7 100 - - -
2016 85.1 14.9 100 - - -
2017 86.9 13.1 100 - - -
2018 83.8 16.2 100 - - -
Source: Air Botswana
39TRANSPORT & INFRASTRUCTURE STATISTICS REPORT, 2018Statistics Botswana
Table 5.1: Train Passengers By Class and Revenue 2016 - 2018
Sleeper Class Business Class Standard class Total Passengers Revenue (‘000 Pula)
2016 3,362 20,666 85,244 109,272 10,017
2017 15,493 20,388 98,821 134,702 15,151
2017 Jan 956 1,806 9,473 12,235 1,171
Feb 622 883 4,093 5,598 931
Mar 568 822 3,743 5,133 569
Apr 1,521 2,180 9,410 13,111 1,365
May 1,411 1,624 7,318 10,353 1,242
Jun 1,242 1,403 7,688 10,333 1,153
July 1,395 225 9,648 11,268 1,458
Aug 1,471 1,828 8,451 11,750 1,325
Sept 1,440 2,005 9,507 12,952 1,372
Oct 1,545 1,821 9,007 12,373 1,389
Nov 1,542 1,726 7,910 11,178 1,168
Dec 1,780 4,065 12,573 18,418 2,008
2018 Jan 956 1806 9473 12,235 1,171
Feb 6594 1546 836 8,976 0.931
Mar 885 1581 7233 9,699 0.862
Apr 1,291 2,798 13,134 17,223 1,530
May 1,289 2,232 14,959 18,480 1,546
Jun 1,191 1,916 18,107 21,214 1,424
July 1,271 2,178 19,756 23,205 1,562
Aug 1,474 2,401 21,951 25,826 1,630
Sept 20,708 2,551 1,559 24,818 1,662
Oct 1,531 2,254 19,472 23,257 1,619
Nov 1,668 2,429 20,025 24,122 1,665
Dec 18,035 3,410 1,660 23,105 1,965
Source: Botswana Railways
4.2 Rail Goods Traffic
Transportation of goods by rail depends on a lot of factors, some of these being the demand for goods in the market. Rail also faces stiff competition from road transport, as such it sometimes loses its customers to road transport.
The following terms used in Rail Goods Traffic need to be taken into account when going through the associated table (Table 21 in Appendix 4). Local Traffic refers to goods originating from Botswana and ending in Botswana, Botswana Origin is total exports plus local traffic. Botswana Total is the sum of total imports and Botswana Origin. Total Traffic is the sum of Botswana total and transit traffic. Goods transported through rail increased from 1,542,419 net tonnes in 2017 to 1,549,282 net tonnes in 2018, which was a 0.4 percent increase. Most categories of goods transported through rail decreased in 2018 compared to 2017. A significant decrease was realized in transit traffic which went down by 50.7 percent. The reason for the decline in transit traffic is that it is not marketed, it is up to people who want to transport goods to the north if they want to use it or not. Total exports declined by 0.6 percent. Exports to North increased by 5.3 percent while local traffic went down by 3.0 percent. Botswana origin declined by 1.2 percent, while Botswana total increased by 4.5 percent. See Table 19 in Appendix 4 and Figure 12.

40 TRANSPORT & INFRASTRUCTURE STATISTICS REPORT, 2018 Statistics Botswana
Figure 12: Rail Goods Traffic by Direction (Net tonnes) 2009-2018
4.3 Revenue From Rail Goods Traffic
Revenue generated from transportation of goods by rail increased from P289 million in 2017 to P306 million in 2018, which was a 5.9 percent increase. Except for three categories of goods transported, the rest of the goods transported realized an increase in revenue. Revenue generated from imports from North declined by 12.3 percent, while revenue generated from local traffic and transit traffic decreased by 0.7 percent and 35.1 percent respectively. Table 20, Appendix 4.
5. WATER TRANSPORT
This section shows the movement of vehicles and passengers who use the Pontoon on the Zambezi river to and from Zambia, Democtratic Republic of Congo and Angola.
The number of people who used the Kazungula Pontoon to either cross in or out of Botswana was 569,410 an increase of 17.6 percent from the 484,023 people who used the Pontoon in 2017. Arrivals constituted 50.6 percent of total passengers while departures accounted for 49.4 percent of total passengers. Compared to 2017, arrivals increased by 12.8 percent and departures went up by 23.0 percent in 2018. This is shown in Table 6.1.

41TRANSPORT & INFRASTRUCTURE STATISTICS REPORT, 2018Statistics Botswana
Table 6.2: Kazungula Pontoon Transportation Of Vehicles, 2013 - 2018
Vehicles In Vehicles Out Total
2013 25,911 29,247 55,158
2014 17,704 34,249 51,953
2015 26,851 46,693 73,544
2016 30,260 32,908 63,168
2017 23,803 31,152 54,955
2018 25,881 35,530 61,411
Percentage of Total
2013 47.0 53.0 100
2014 34.1 65.9 100
2015 36.5 63.5 100
2016 47.9 52.1 100
2017 43.3 56.7 100
2018 42.1 57.9 100
Annual Percentage Change
2013 .. .. ..
2014 (31.7) 17.1 (5.8)
2015 51.7 36.3 41.6
2016 12.7 (29.5) (14.1)
2017 (21.3) (5.3) (13.0)
2018 8.7 14.1 11.7
Source: Botswana Revenue Services
Table 6.1: Kazungula Pontoon Passengers by Month, 2013 - 2018
Arrivals Departures Grand Total
Year/Month Batswana Foreigners Total Batswana Foreigners Total
2013 190,823 194,571 385,394 26,629 26,393 53,022 438,416
2014 188,012 193,262 381,274 33,534 33,749 67,283 448,557
2015 185,656 193,058 378,714 48,876 49,150 98,026 476,740
2016 189,196 190,784 379,980 60,846 61,933 122,779 502,759
2017 63,315 191,800 255,115 60,935 167,973 228,908 484,023
2018 Jan 3,898 15,844 19,742 3,397 12,946 16,343 36,085
Feb 3,882 15,049 18,931 3,429 13,064 16,493 35,424
March 4,812 14,930 19,742 4,787 13,466 18,253 37,995
Total 12,592 45,823 58,415 11,613 39,476 51,089 109,504
April 6,639 21,313 27,952 6,158 18,921 25,079 53,031
May 6,248 22,617 28,865 5,701 19,799 25,500 54,365
June 5,846 19,332 25,178 5,976 19,079 25,055 50,233
Total 18,733 63,262 81,995 17,835 57,799 75,634 157,629
July 7,696 22,506 30,202 7,634 21,688 29,322 59,524
August 6,391 20,108 26,499 6,870 21,505 28,375 54,874
Sept 5,304 14,432 19,736 5,664 15,038 20,702 40,438
Total 19,391 57,046 76,437 20,168 58,231 78,399 154,836
Oct .. .. 24,485 .. .. 24,812 49,297
Nov 21,803 .. .. 23,930 45,733
Dec .. .. 24,716 .. .. 27,695 52,411
Total .. .. 71,004 .. .. 76,437 147,441
Source: Kazungula Immigration Office, Ministry of Labour and Home Affairs
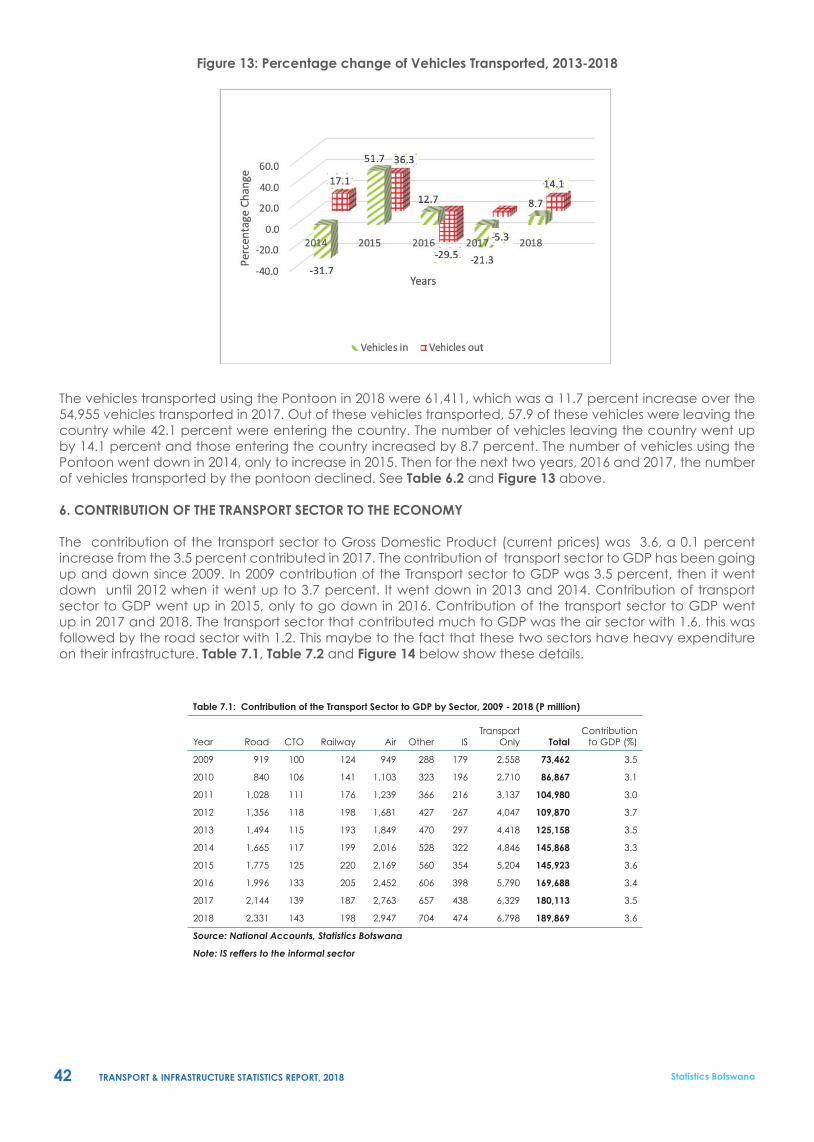
42 TRANSPORT & INFRASTRUCTURE STATISTICS REPORT, 2018 Statistics Botswana
Figure 13: Percentage change of Vehicles Transported, 2013-2018
The vehicles transported using the Pontoon in 2018 were 61,411, which was a 11.7 percent increase over the 54,955 vehicles transported in 2017. Out of these vehicles transported, 57.9 of these vehicles were leaving the country while 42.1 percent were entering the country. The number of vehicles leaving the country went up by 14.1 percent and those entering the country increased by 8.7 percent. The number of vehicles using the Pontoon went down in 2014, only to increase in 2015. Then for the next two years, 2016 and 2017, the number of vehicles transported by the pontoon declined. See Table 6.2 and Figure 13 above.
6. CONTRIBUTION OF THE TRANSPORT SECTOR TO THE ECONOMY
The contribution of the transport sector to Gross Domestic Product (current prices) was 3.6, a 0.1 percent increase from the 3.5 percent contributed in 2017. The contribution of transport sector to GDP has been going up and down since 2009. In 2009 contribution of the Transport sector to GDP was 3.5 percent, then it went down until 2012 when it went up to 3.7 percent. It went down in 2013 and 2014. Contribution of transport sector to GDP went up in 2015, only to go down in 2016. Contribution of the transport sector to GDP went up in 2017 and 2018. The transport sector that contributed much to GDP was the air sector with 1.6, this was followed by the road sector with 1.2. This maybe to the fact that these two sectors have heavy expenditure on their infrastructure. Table 7.1, Table 7.2 and Figure 14 below show these details.
Table 7.1: Contribution of the Transport Sector to GDP by Sector, 2009 - 2018 (P million)
Transport Only Total
Contributionto GDP (%)Year Road CTO Railway Air Other IS
2009 919 100 124 949 288 179 2,558 73,462 3.5
2010 840 106 141 1,103 323 196 2,710 86,867 3.1
2011 1,028 111 176 1,239 366 216 3,137 104,980 3.0
2012 1,356 118 198 1,681 427 267 4,047 109,870 3.7
2013 1,494 115 193 1,849 470 297 4,418 125,158 3.5
2014 1,665 117 199 2,016 528 322 4,846 145,868 3.3
2015 1,775 125 220 2,169 560 354 5,204 145,923 3.6
2016 1,996 133 205 2,452 606 398 5,790 169,688 3.4
2017 2,144 139 187 2,763 657 438 6,329 180,113 3.5
2018 2,331 143 198 2,947 704 474 6,798 189,869 3.6
Source: National Accounts, Statistics Botswana
Note: IS reffers to the informal sector
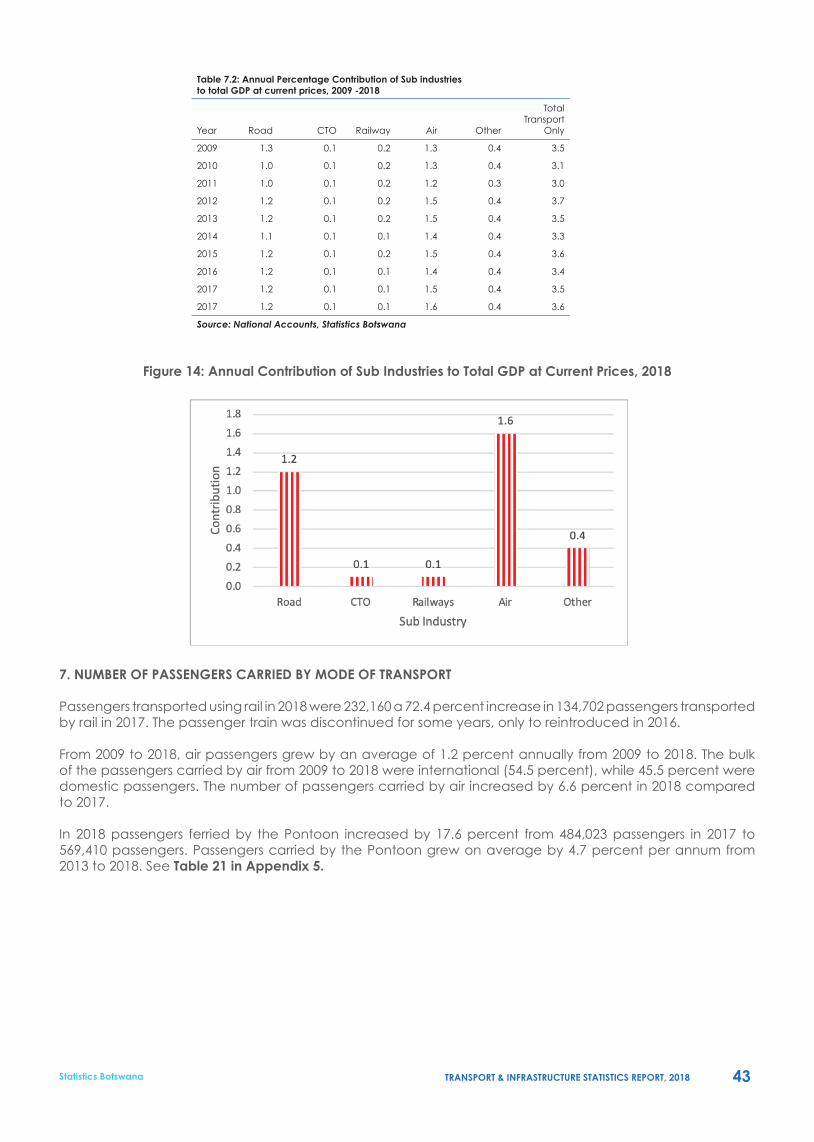
43TRANSPORT & INFRASTRUCTURE STATISTICS REPORT, 2018Statistics Botswana
Table 7.2: Annual Percentage Contribution of Sub industries to total GDP at current prices, 2009 -2018
Year Road CTO Railway Air Other
Total Transport
Only
2009 1.3 0.1 0.2 1.3 0.4 3.5
2010 1.0 0.1 0.2 1.3 0.4 3.1
2011 1.0 0.1 0.2 1.2 0.3 3.0
2012 1.2 0.1 0.2 1.5 0.4 3.7
2013 1.2 0.1 0.2 1.5 0.4 3.5
2014 1.1 0.1 0.1 1.4 0.4 3.3
2015 1.2 0.1 0.2 1.5 0.4 3.6
2016 1.2 0.1 0.1 1.4 0.4 3.4
2017 1.2 0.1 0.1 1.5 0.4 3.5
2017 1.2 0.1 0.1 1.6 0.4 3.6
Source: National Accounts, Statistics Botswana
Figure 14: Annual Contribution of Sub Industries to Total GDP at Current Prices, 2018
7. NUMBER OF PASSENGERS CARRIED BY MODE OF TRANSPORT Passengers transported using rail in 2018 were 232,160 a 72.4 percent increase in 134,702 passengers transported by rail in 2017. The passenger train was discontinued for some years, only to reintroduced in 2016.
From 2009 to 2018, air passengers grew by an average of 1.2 percent annually from 2009 to 2018. The bulk of the passengers carried by air from 2009 to 2018 were international (54.5 percent), while 45.5 percent were domestic passengers. The number of passengers carried by air increased by 6.6 percent in 2018 compared to 2017.
In 2018 passengers ferried by the Pontoon increased by 17.6 percent from 484,023 passengers in 2017 to 569,410 passengers. Passengers carried by the Pontoon grew on average by 4.7 percent per annum from 2013 to 2018. See Table 21 in Appendix 5.
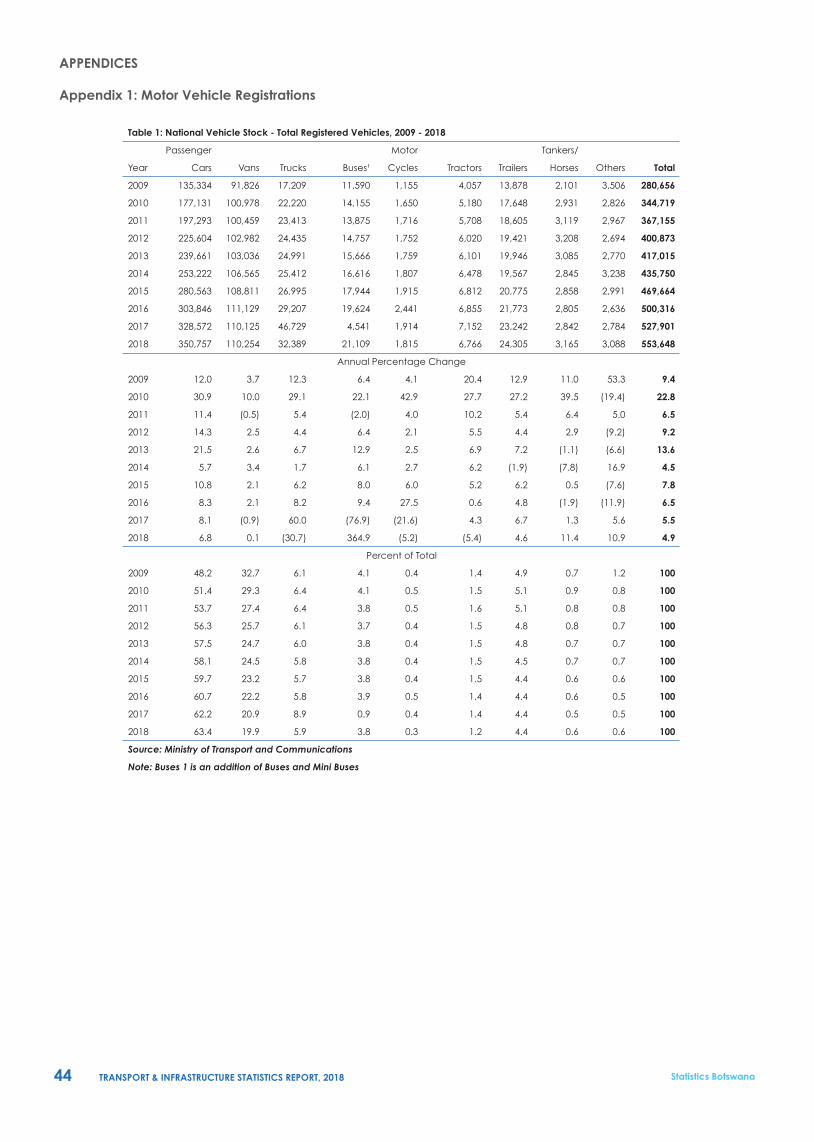
44 TRANSPORT & INFRASTRUCTURE STATISTICS REPORT, 2018 Statistics Botswana
APPENDICES
Appendix 1: Motor Vehicle Registrations
Table 1: National Vehicle Stock - Total Registered Vehicles, 2009 - 2018
Passenger Motor Tankers/
Year Cars Vans Trucks Buses¹ Cycles Tractors Trailers Horses Others Total
2009 135,334 91,826 17,209 11,590 1,155 4,057 13,878 2,101 3,506 280,656
2010 177,131 100,978 22,220 14,155 1,650 5,180 17,648 2,931 2,826 344,719
2011 197,293 100,459 23,413 13,875 1,716 5,708 18,605 3,119 2,967 367,155
2012 225,604 102,982 24,435 14,757 1,752 6,020 19,421 3,208 2,694 400,873
2013 239,661 103,036 24,991 15,666 1,759 6,101 19,946 3,085 2,770 417,015
2014 253,222 106,565 25,412 16,616 1,807 6,478 19,567 2,845 3,238 435,750
2015 280,563 108,811 26,995 17,944 1,915 6,812 20,775 2,858 2,991 469,664
2016 303,846 111,129 29,207 19,624 2,441 6,855 21,773 2,805 2,636 500,316
2017 328,572 110,125 46,729 4,541 1,914 7,152 23,242 2,842 2,784 527,901
2018 350,757 110,254 32,389 21,109 1,815 6,766 24,305 3,165 3,088 553,648
Annual Percentage Change
2009 12.0 3.7 12.3 6.4 4.1 20.4 12.9 11.0 53.3 9.4
2010 30.9 10.0 29.1 22.1 42.9 27.7 27.2 39.5 (19.4) 22.8
2011 11.4 (0.5) 5.4 (2.0) 4.0 10.2 5.4 6.4 5.0 6.5
2012 14.3 2.5 4.4 6.4 2.1 5.5 4.4 2.9 (9.2) 9.2
2013 21.5 2.6 6.7 12.9 2.5 6.9 7.2 (1.1) (6.6) 13.6
2014 5.7 3.4 1.7 6.1 2.7 6.2 (1.9) (7.8) 16.9 4.5
2015 10.8 2.1 6.2 8.0 6.0 5.2 6.2 0.5 (7.6) 7.8
2016 8.3 2.1 8.2 9.4 27.5 0.6 4.8 (1.9) (11.9) 6.5
2017 8.1 (0.9) 60.0 (76.9) (21.6) 4.3 6.7 1.3 5.6 5.5
2018 6.8 0.1 (30.7) 364.9 (5.2) (5.4) 4.6 11.4 10.9 4.9
Percent of Total
2009 48.2 32.7 6.1 4.1 0.4 1.4 4.9 0.7 1.2 100
2010 51.4 29.3 6.4 4.1 0.5 1.5 5.1 0.9 0.8 100
2011 53.7 27.4 6.4 3.8 0.5 1.6 5.1 0.8 0.8 100
2012 56.3 25.7 6.1 3.7 0.4 1.5 4.8 0.8 0.7 100
2013 57.5 24.7 6.0 3.8 0.4 1.5 4.8 0.7 0.7 100
2014 58.1 24.5 5.8 3.8 0.4 1.5 4.5 0.7 0.7 100
2015 59.7 23.2 5.7 3.8 0.4 1.5 4.4 0.6 0.6 100
2016 60.7 22.2 5.8 3.9 0.5 1.4 4.4 0.6 0.5 100
2017 62.2 20.9 8.9 0.9 0.4 1.4 4.4 0.5 0.5 100
2018 63.4 19.9 5.9 3.8 0.3 1.2 4.4 0.6 0.6 100
Source: Ministry of Transport and Communications
Note: Buses 1 is an addition of Buses and Mini Buses
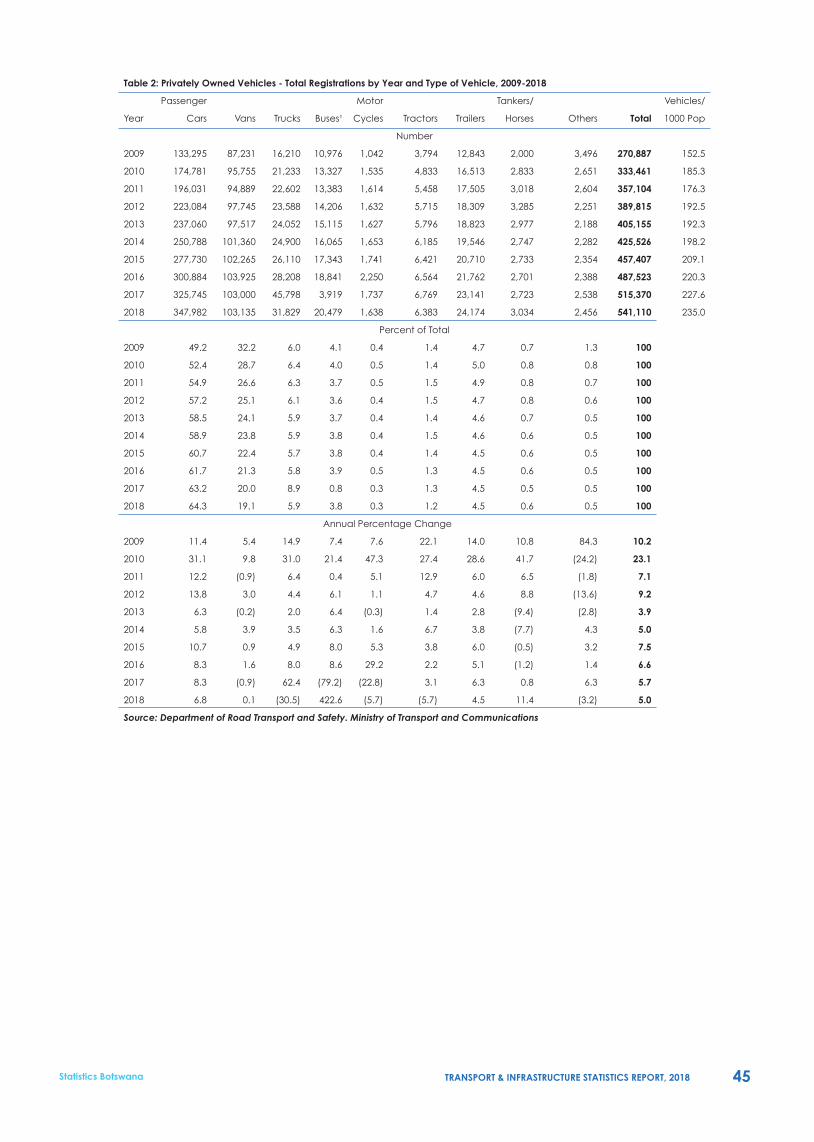
45TRANSPORT & INFRASTRUCTURE STATISTICS REPORT, 2018Statistics Botswana
Table 2: Privately Owned Vehicles - Total Registrations by Year and Type of Vehicle, 2009-2018
Passenger Motor Tankers/ Vehicles/
Year Cars Vans Trucks Buses¹ Cycles Tractors Trailers Horses Others Total 1000 Pop
Number
2009 133,295 87,231 16,210 10,976 1,042 3,794 12,843 2,000 3,496 270,887 152.5
2010 174,781 95,755 21,233 13,327 1,535 4,833 16,513 2,833 2,651 333,461 185.3
2011 196,031 94,889 22,602 13,383 1,614 5,458 17,505 3,018 2,604 357,104 176.3
2012 223,084 97,745 23,588 14,206 1,632 5,715 18,309 3,285 2,251 389,815 192.5
2013 237,060 97,517 24,052 15,115 1,627 5,796 18,823 2,977 2,188 405,155 192.3
2014 250,788 101,360 24,900 16,065 1,653 6,185 19,546 2,747 2,282 425,526 198.2
2015 277,730 102,265 26,110 17,343 1,741 6,421 20,710 2,733 2,354 457,407 209.1
2016 300,884 103,925 28,208 18,841 2,250 6,564 21,762 2,701 2,388 487,523 220.3
2017 325,745 103,000 45,798 3,919 1,737 6,769 23,141 2,723 2,538 515,370 227.6
2018 347,982 103,135 31,829 20,479 1,638 6,383 24,174 3,034 2,456 541,110 235.0
Percent of Total
2009 49.2 32.2 6.0 4.1 0.4 1.4 4.7 0.7 1.3 100
2010 52.4 28.7 6.4 4.0 0.5 1.4 5.0 0.8 0.8 100
2011 54.9 26.6 6.3 3.7 0.5 1.5 4.9 0.8 0.7 100
2012 57.2 25.1 6.1 3.6 0.4 1.5 4.7 0.8 0.6 100
2013 58.5 24.1 5.9 3.7 0.4 1.4 4.6 0.7 0.5 100
2014 58.9 23.8 5.9 3.8 0.4 1.5 4.6 0.6 0.5 100
2015 60.7 22.4 5.7 3.8 0.4 1.4 4.5 0.6 0.5 100
2016 61.7 21.3 5.8 3.9 0.5 1.3 4.5 0.6 0.5 100
2017 63.2 20.0 8.9 0.8 0.3 1.3 4.5 0.5 0.5 100
2018 64.3 19.1 5.9 3.8 0.3 1.2 4.5 0.6 0.5 100
Annual Percentage Change
2009 11.4 5.4 14.9 7.4 7.6 22.1 14.0 10.8 84.3 10.2
2010 31.1 9.8 31.0 21.4 47.3 27.4 28.6 41.7 (24.2) 23.1
2011 12.2 (0.9) 6.4 0.4 5.1 12.9 6.0 6.5 (1.8) 7.1
2012 13.8 3.0 4.4 6.1 1.1 4.7 4.6 8.8 (13.6) 9.2
2013 6.3 (0.2) 2.0 6.4 (0.3) 1.4 2.8 (9.4) (2.8) 3.9
2014 5.8 3.9 3.5 6.3 1.6 6.7 3.8 (7.7) 4.3 5.0
2015 10.7 0.9 4.9 8.0 5.3 3.8 6.0 (0.5) 3.2 7.5
2016 8.3 1.6 8.0 8.6 29.2 2.2 5.1 (1.2) 1.4 6.6
2017 8.3 (0.9) 62.4 (79.2) (22.8) 3.1 6.3 0.8 6.3 5.7
2018 6.8 0.1 (30.5) 422.6 (5.7) (5.7) 4.5 11.4 (3.2) 5.0
Source: Department of Road Transport and Safety. Ministry of Transport and Communications
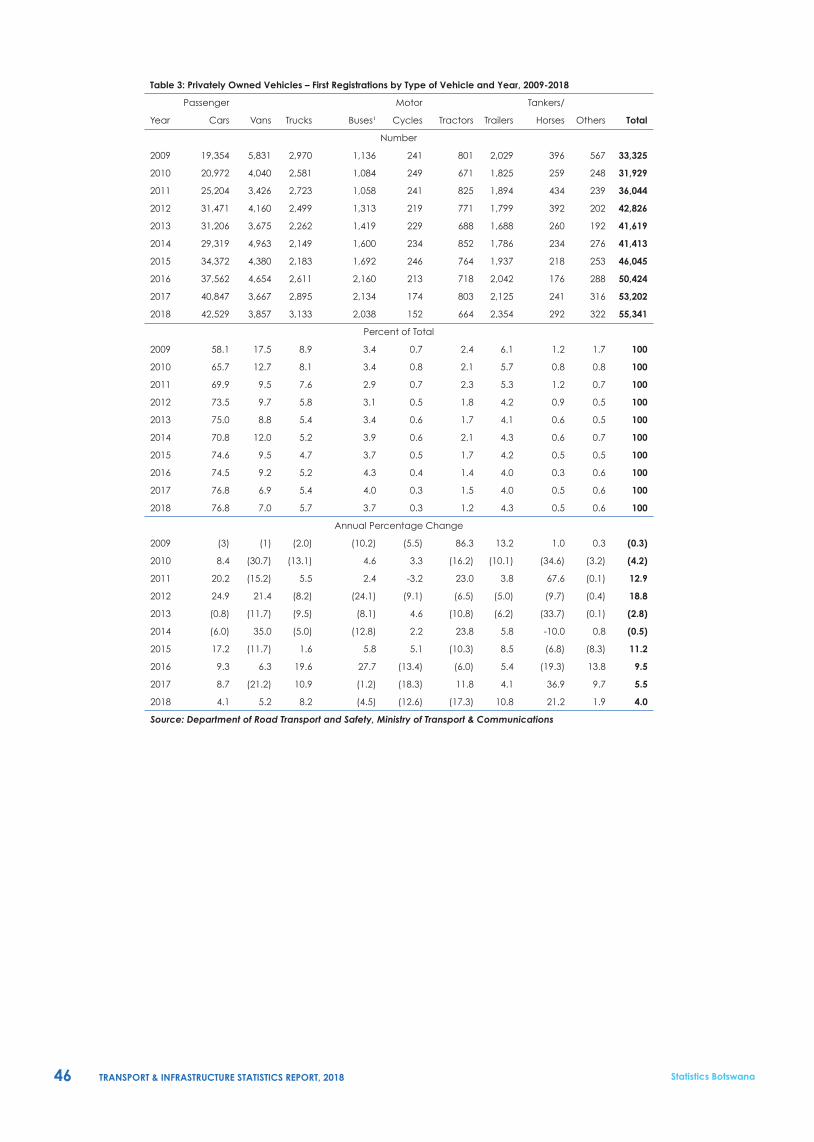
46 TRANSPORT & INFRASTRUCTURE STATISTICS REPORT, 2018 Statistics Botswana
Table 3: Privately Owned Vehicles – First Registrations by Type of Vehicle and Year, 2009-2018
Passenger Motor Tankers/
Year Cars Vans Trucks Buses¹ Cycles Tractors Trailers Horses Others Total
Number
2009 19,354 5,831 2,970 1,136 241 801 2,029 396 567 33,325
2010 20,972 4,040 2,581 1,084 249 671 1,825 259 248 31,929
2011 25,204 3,426 2,723 1,058 241 825 1,894 434 239 36,044
2012 31,471 4,160 2,499 1,313 219 771 1,799 392 202 42,826
2013 31,206 3,675 2,262 1,419 229 688 1,688 260 192 41,619
2014 29,319 4,963 2,149 1,600 234 852 1,786 234 276 41,413
2015 34,372 4,380 2,183 1,692 246 764 1,937 218 253 46,045
2016 37,562 4,654 2,611 2,160 213 718 2,042 176 288 50,424
2017 40,847 3,667 2,895 2,134 174 803 2,125 241 316 53,202
2018 42,529 3,857 3,133 2,038 152 664 2,354 292 322 55,341
Percent of Total
2009 58.1 17.5 8.9 3.4 0.7 2.4 6.1 1.2 1.7 100
2010 65.7 12.7 8.1 3.4 0.8 2.1 5.7 0.8 0.8 100
2011 69.9 9.5 7.6 2.9 0.7 2.3 5.3 1.2 0.7 100
2012 73.5 9.7 5.8 3.1 0.5 1.8 4.2 0.9 0.5 100
2013 75.0 8.8 5.4 3.4 0.6 1.7 4.1 0.6 0.5 100
2014 70.8 12.0 5.2 3.9 0.6 2.1 4.3 0.6 0.7 100
2015 74.6 9.5 4.7 3.7 0.5 1.7 4.2 0.5 0.5 100
2016 74.5 9.2 5.2 4.3 0.4 1.4 4.0 0.3 0.6 100
2017 76.8 6.9 5.4 4.0 0.3 1.5 4.0 0.5 0.6 100
2018 76.8 7.0 5.7 3.7 0.3 1.2 4.3 0.5 0.6 100
Annual Percentage Change
2009 (3) (1) (2.0) (10.2) (5.5) 86.3 13.2 1.0 0.3 (0.3)
2010 8.4 (30.7) (13.1) 4.6 3.3 (16.2) (10.1) (34.6) (3.2) (4.2)
2011 20.2 (15.2) 5.5 2.4 -3.2 23.0 3.8 67.6 (0.1) 12.9
2012 24.9 21.4 (8.2) (24.1) (9.1) (6.5) (5.0) (9.7) (0.4) 18.8
2013 (0.8) (11.7) (9.5) (8.1) 4.6 (10.8) (6.2) (33.7) (0.1) (2.8)
2014 (6.0) 35.0 (5.0) (12.8) 2.2 23.8 5.8 -10.0 0.8 (0.5)
2015 17.2 (11.7) 1.6 5.8 5.1 (10.3) 8.5 (6.8) (8.3) 11.2
2016 9.3 6.3 19.6 27.7 (13.4) (6.0) 5.4 (19.3) 13.8 9.5
2017 8.7 (21.2) 10.9 (1.2) (18.3) 11.8 4.1 36.9 9.7 5.5
2018 4.1 5.2 8.2 (4.5) (12.6) (17.3) 10.8 21.2 1.9 4.0
Source: Department of Road Transport and Safety, Ministry of Transport & Communications
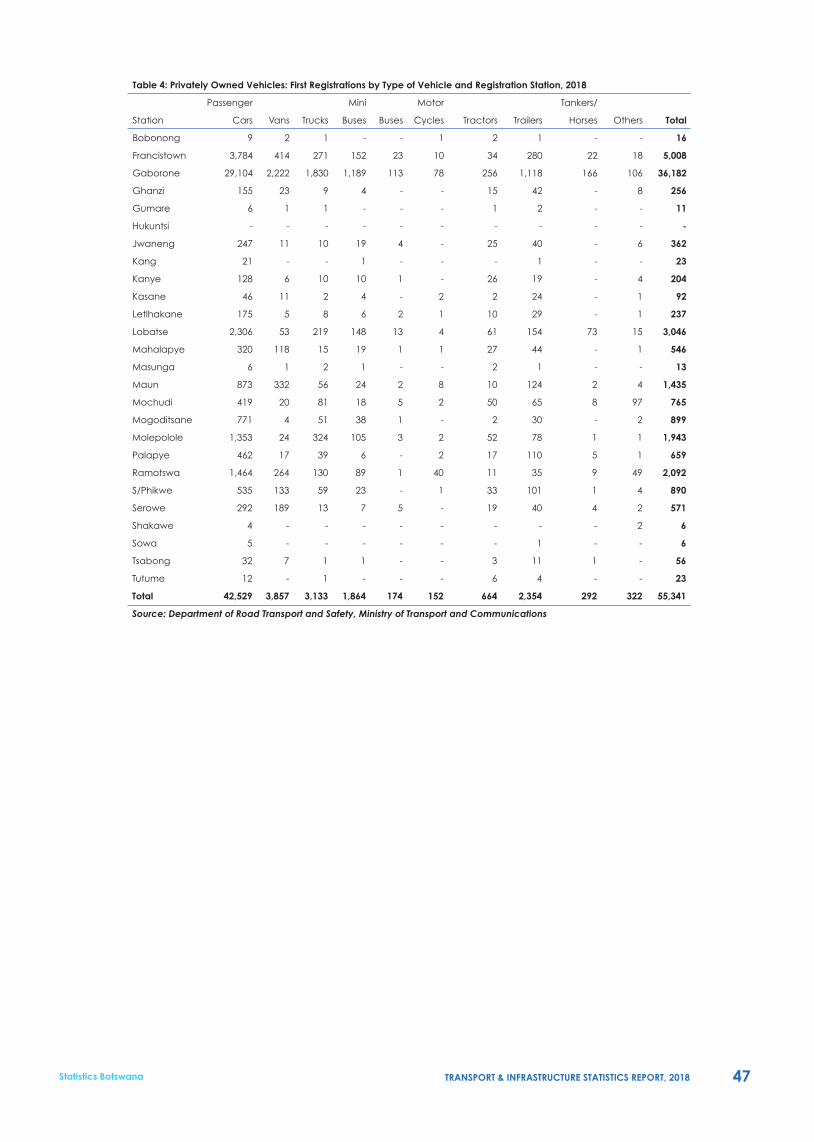
47TRANSPORT & INFRASTRUCTURE STATISTICS REPORT, 2018Statistics Botswana
Table 4: Privately Owned Vehicles: First Registrations by Type of Vehicle and Registration Station, 2018
Passenger Mini Motor Tankers/
Station Cars Vans Trucks Buses Buses Cycles Tractors Trailers Horses Others Total
Bobonong 9 2 1 - - 1 2 1 - - 16
Francistown 3,784 414 271 152 23 10 34 280 22 18 5,008
Gaborone 29,104 2,222 1,830 1,189 113 78 256 1,118 166 106 36,182
Ghanzi 155 23 9 4 - - 15 42 - 8 256
Gumare 6 1 1 - - - 1 2 - - 11
Hukuntsi - - - - - - - - - - -
Jwaneng 247 11 10 19 4 - 25 40 - 6 362
Kang 21 - - 1 - - - 1 - - 23
Kanye 128 6 10 10 1 - 26 19 - 4 204
Kasane 46 11 2 4 - 2 2 24 - 1 92
Letlhakane 175 5 8 6 2 1 10 29 - 1 237
Lobatse 2,306 53 219 148 13 4 61 154 73 15 3,046
Mahalapye 320 118 15 19 1 1 27 44 - 1 546
Masunga 6 1 2 1 - - 2 1 - - 13
Maun 873 332 56 24 2 8 10 124 2 4 1,435
Mochudi 419 20 81 18 5 2 50 65 8 97 765
Mogoditsane 771 4 51 38 1 - 2 30 - 2 899
Molepolole 1,353 24 324 105 3 2 52 78 1 1 1,943
Palapye 462 17 39 6 - 2 17 110 5 1 659
Ramotswa 1,464 264 130 89 1 40 11 35 9 49 2,092
S/Phikwe 535 133 59 23 - 1 33 101 1 4 890
Serowe 292 189 13 7 5 - 19 40 4 2 571
Shakawe 4 - - - - - - - - 2 6
Sowa 5 - - - - - - 1 - - 6
Tsabong 32 7 1 1 - - 3 11 1 - 56
Tutume 12 - 1 - - - 6 4 - - 23
Total 42,529 3,857 3,133 1,864 174 152 664 2,354 292 322 55,341
Source: Department of Road Transport and Safety, Ministry of Transport and Communications

48 TRANSPORT & INFRASTRUCTURE STATISTICS REPORT, 2018 Statistics Botswana
Table 4a: Privately Owned Vehicles: First Registrations (Percent) by Type of Vehicle and Registration Station, 2018
Passenger Mini Motor Tankers/
Station Cars Vans Trucks Buses Buses Cycles Tractors Trailers Horses Others Total
Bobonong 56.3 12.5 6.3 - - 6.3 12.5 6.3 - - 100
Francistown 75.6 8.3 5.4 3.0 0.5 0.2 0.7 5.6 0.4 0.4 100
Gaborone 80.4 6.1 5.1 3.3 0.3 0.2 0.7 3.1 0.5 0.3 100
Ghanzi 60.5 9.0 3.5 1.6 - - 5.9 16.4 - 3.1 100
Gumare 54.5 9.1 9.1 - - - 9.1 18.2 - - 100
Hukuntsi - - - - - - - - - - -
Jwaneng 68.2 3.0 2.8 5.2 1.1 - 6.9 11.0 - 1.7 100
Kang 91.3 - - 4.3 - - - 4.3 - - 100
Kanye 62.7 2.9 4.9 4.9 0.5 - 12.7 9.3 - 2.0 100
Kasane 50.0 12.0 2.2 4.3 - 2.2 2.2 26.1 - 1.1 100
Letlhakane 73.8 2.1 3.4 2.5 0.8 0.4 4.2 12.2 - 0.4 100
Lobatse 75.7 1.7 7.2 4.9 0.4 0.1 2.0 5.1 2.4 0.5 100
Mahalapye 58.6 21.6 2.7 3.5 0.2 0.2 4.9 8.1 - 0.2 100
Masunga 46.2 7.7 15.4 7.7 - - 15.4 7.7 - - 100
Maun 60.8 23.1 3.9 1.7 0.1 0.6 0.7 8.6 0.1 0.3 100
Mochudi 54.8 2.6 10.6 2.4 0.7 0.3 6.5 8.5 1.0 12.7 100
Mogodit-sane
85.8 0.4 5.7 4.2 0.1 - 0.2 3.3 - 0.2 100
Molepolole 69.6 1.2 16.7 5.4 0.2 0.1 2.7 4.0 0.1 0.1 100
Palapye 70.1 2.6 5.9 0.9 - 0.3 2.6 16.7 0.8 0.2 100
Ramotswa 70.0 12.6 6.2 4.3 - 1.9 0.5 1.7 0.4 2.3 100
S/Phikwe 60.1 14.9 6.6 2.6 - 0.1 3.7 11.3 0.1 0.4 100
Serowe 51.1 33.1 2.3 1.2 0.9 - 3.3 7.0 0.7 0.4 100
Shakawe 66.7 - - - - - - - - 33.3 100
Sowa 83.3 - - - - - - 16.7 - - 100
Tsabong 57.1 12.5 1.8 1.8 - - 5.4 19.6 1.8 - 100
Tutume 52.2 - 4.3 - - - 26.1 17.4 - - 100
Total 76.8 7.0 5.7 3.4 0.3 0.3 1.2 4.3 0.5 0.6 100
Source: Department of Road Transport and Safety, Ministry of Transport and Communications
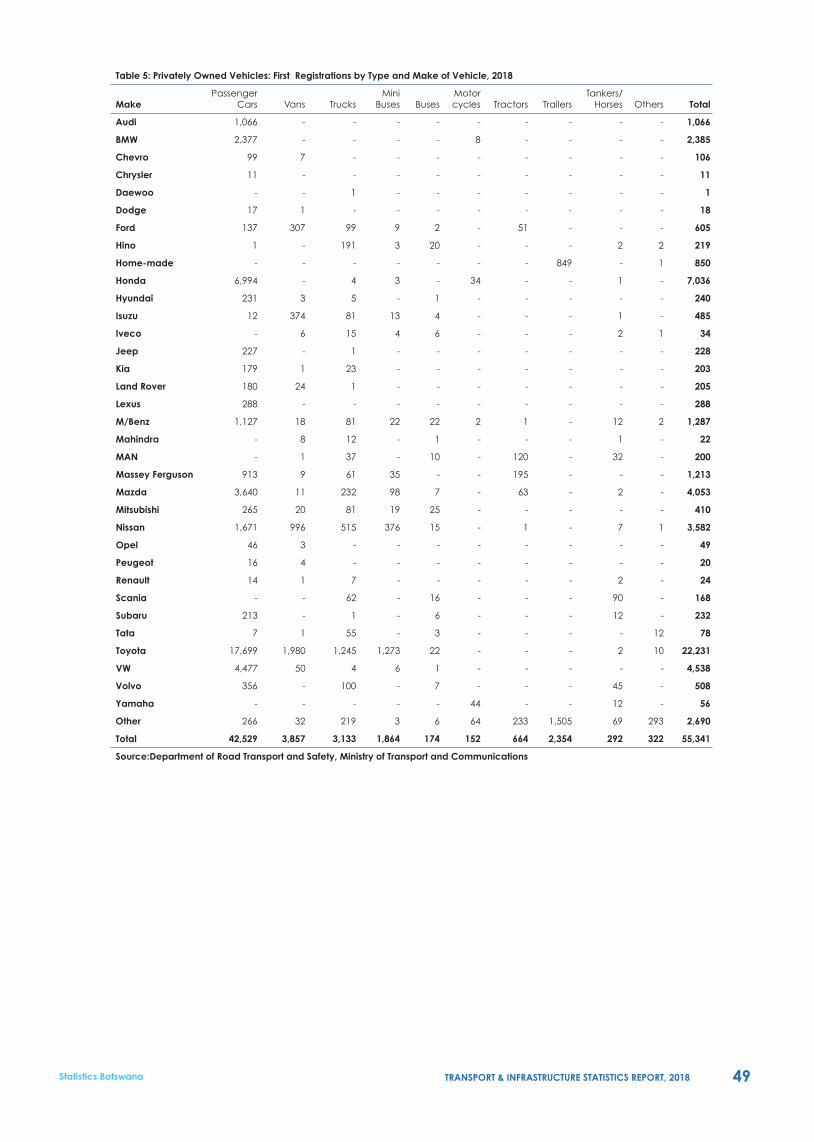
49TRANSPORT & INFRASTRUCTURE STATISTICS REPORT, 2018Statistics Botswana
Table 5: Privately Owned Vehicles: First Registrations by Type and Make of Vehicle, 2018
MakePassenger
Cars Vans TrucksMini
Buses BusesMotor cycles Tractors Trailers
Tankers/ Horses Others Total
Audi 1,066 - - - - - - - - - 1,066
BMW 2,377 - - - - 8 - - - - 2,385
Chevro 99 7 - - - - - - - - 106
Chrysler 11 - - - - - - - - - 11
Daewoo - - 1 - - - - - - - 1
Dodge 17 1 - - - - - - - - 18
Ford 137 307 99 9 2 - 51 - - - 605
Hino 1 - 191 3 20 - - - 2 2 219
Home-made - - - - - - - 849 - 1 850
Honda 6,994 - 4 3 - 34 - - 1 - 7,036
Hyundai 231 3 5 - 1 - - - - - 240
Isuzu 12 374 81 13 4 - - - 1 - 485
Iveco - 6 15 4 6 - - - 2 1 34
Jeep 227 - 1 - - - - - - - 228
Kia 179 1 23 - - - - - - - 203
Land Rover 180 24 1 - - - - - - - 205
Lexus 288 - - - - - - - - - 288
M/Benz 1,127 18 81 22 22 2 1 - 12 2 1,287
Mahindra - 8 12 - 1 - - - 1 - 22
MAN - 1 37 - 10 - 120 - 32 - 200
Massey Ferguson 913 9 61 35 - - 195 - - - 1,213
Mazda 3,640 11 232 98 7 - 63 - 2 - 4,053
Mitsubishi 265 20 81 19 25 - - - - - 410
Nissan 1,671 996 515 376 15 - 1 - 7 1 3,582
Opel 46 3 - - - - - - - - 49
Peugeot 16 4 - - - - - - - - 20
Renault 14 1 7 - - - - - 2 - 24
Scania - - 62 - 16 - - - 90 - 168
Subaru 213 - 1 - 6 - - - 12 - 232
Tata 7 1 55 - 3 - - - - 12 78
Toyota 17,699 1,980 1,245 1,273 22 - - - 2 10 22,231
VW 4,477 50 4 6 1 - - - - - 4,538
Volvo 356 - 100 - 7 - - - 45 - 508
Yamaha - - - - - 44 - - 12 - 56
Other 266 32 219 3 6 64 233 1,505 69 293 2,690
Total 42,529 3,857 3,133 1,864 174 152 664 2,354 292 322 55,341
Source:Department of Road Transport and Safety, Ministry of Transport and Communications

50 TRANSPORT & INFRASTRUCTURE STATISTICS REPORT, 2018 Statistics Botswana
Table 5a: Privately Owned Vehicles: First Registrations (Percent) by Type and Make of Vehicle 2018
MakePassenger
Cars Vans Trucks Mini Buses BusesMotor cycles Tractors Trailers
Tankers/Horses Others Total
Audi 100.0 - - - - - - - - - 100
BMW 99.7 - - - - 0.3 - - - - 100
Chevro 93.4 6.6 - - - - - - - - 100
Chrysler 100.0 - - - - - - - - - 100
Daewoo - - 100.0 - - - - - - - 100
Dodge 94.4 5.6 - - - - - - - - 100
Ford 22.6 50.7 16.4 1.5 0.3 - 8.4 - - - 100
Hino 0.5 - 87.2 1.4 9.1 - - - 0.9 0.9 100
Home-made - - - - - - - 99.9 - 0.1 100
Honda 99.4 - 0.1 - - 0.5 - - 0.0 - 100
Hyundai 96.3 1.3 2.1 - 0.4 - - - - - 100
Isuzu 2.5 77.1 16.7 2.7 0.8 - - - 0.2 - 100
Iveco - 17.6 44.1 11.8 17.6 - - - 5.9 2.9 100
Jeep 99.6 - 0.4 - - - - - - - 100
Kia 88.2 0.5 11.3 - - - - - - - 100
Land Rover 87.8 11.7 0.5 - - - - - - - 100
Lexus 100.0 - - - - - - - - - 100
M/Benz 87.6 1.4 6.3 1.7 1.7 0.2 0.1 - 0.9 0.2 100
Mahindra - 36.4 54.5 - 4.5 - - - 4.5 - 100
MAN - 0.5 18.5 - 5.0 - 60.0 - 16.0 - 100
Massey Ferguson
75.3 0.7 5.0 2.9 - - 16.1 - - - 100
Mazda 89.8 0.3 5.7 2.4 0.2 - 1.6 - 0.0 - 100
Mitsubishi 64.6 4.9 19.8 4.6 6.1 - - - - - 100
Nissan 46.6 27.8 14.4 10.5 0.4 - - - 0.2 - 100
Opel 93.9 6.1 - - - - - - - - 100
Peugeot 80.0 20.0 - - - - - - - - 100
Renault 58.3 4.2 29.2 - - - - - 8.3 - 100
Scania - - 36.9 - 9.5 - - - 53.6 - 100
Subaru 91.8 - 0.4 - 2.6 - - - 5.2 - 100
Tata 9.0 1.3 70.5 - 3.8 - - - - 15.4 100
Toyota 79.6 8.9 5.6 5.7 0.1 - - - 0.0 - 100
VW 98.7 1.1 0.1 0.1 0.0 - - - - - 100
Volvo 70.1 - 19.7 - 1.4 - - - 8.9 - 100
Yamaha - - - - - 78.6 - - 21.4 - 100
Other 9.9 1.2 8.1 0.1 0.2 2.4 8.7 55.9 2.6 10.9 100
Total 76.8 7.0 5.7 3.4 0.3 0.3 1.2 4.3 0.5 0.6 100
Source:Department of Road Transport and Safety, Ministry of Transport and Communications

51TRANSPORT & INFRASTRUCTURE STATISTICS REPORT, 2018Statistics Botswana
Table 6: Privately Owned Vehicles- Renewals by Year and Type of Vehicle, 2009 - 2018
Passenger Motor Tankers/
Year Cars Vans Trucks Buses1 Cycles Tractors Trailers Horses Others Total
Number
2008 99,581 76,845 11,073 9,189 703 2,678 9,469 1,413 1,364 212,325
2009 113,941 81,400 13,240 9,840 801 2,993 10,814 1,604 2,902 237,535
2010 153,989 91,715 18,652 12,243 1,286 4,162 14,688 2,464 2,303 301,502
2011 153,931 91,947 18,479 12,266 1,071 4,668 14,663 2,475 2,302 301,802
2012 191,653 93,531 21,104 12,893 1,413 4,944 16,510 2,714 2,227 346,989
2013 205,854 93,842 21,790 13,696 1,398 5,108 17,135 2,717 1,996 363,536
2014 221,469 96,397 22,751 14,465 1,419 5,333 17,760 2,513 2,006 384,113
2015 243,358 97,885 23,927 15,651 1,495 5,657 18,773 2,515 2,101 411,362
2016 263,322 99,271 25,597 17,122 1,596 5,846 19,720 2,525 2,100 437,099
2017 284,898 99,333 26,955 17,733 1,563 5,966 21,016 2,482 2,222 462,168
2018 305,453 99,278 28,696 18,441 1,486 5,719 21,820 2,742 2,134 485,769
Percent of Total
2009 48.0 34.3 5.6 4.1 0.3 1.3 4.6 0.7 1.2 100
2010 51.1 30.4 6.2 4.1 0.4 1.4 4.9 0.8 0.8 100
2011 51.0 30.5 6.1 4.1 0.4 1.5 4.9 0.8 0.8 100
2012 55.2 27.0 6.1 3.7 0.4 1.4 4.8 0.8 0.6 100
2013 56.6 25.8 6.0 3.8 0.4 1.4 4.7 0.7 0.5 100
2014 57.7 25.1 5.9 3.8 0.4 1.4 4.6 0.7 0.5 100
2015 59.2 23.8 5.8 3.8 0.4 1.4 4.6 0.6 0.5 100
2016 60.2 22.7 5.9 3.9 0.4 1.3 4.5 0.6 0.5 100
2017 61.6 21.5 5.8 3.8 0.3 1.3 4.5 0.5 0.5 100
2018 62.9 20.4 5.9 3.8 0.3 1.2 4.5 0.6 0.4 100
Annual Percentage Change
2009 14.4 5.9 19.6 7.1 13.9 11.8 14.2 13.5 112.8 11.87
2010 35.1 12.7 40.9 24.4 60.5 39.1 35.8 53.6 (20.6) 26.93
2011 (0.0) 0.3 (0.9) 0.2 (16.7) 12.2 (0.2) 0.4 (0.0) 0.10
2012 24.5 1.7 14.2 5.1 31.9 5.9 12.6 9.7 (3.3) 14.97
2013 7.4 0.3 3.3 6.2 (1.1) 3.3 3.8 0.1 (10.4) 4.77
2014 7.6 2.7 4.4 5.6 1.5 4.4 3.6 (7.5) 0.5 5.66
2014 7.6 2.7 4.4 5.6 1.5 4.4 3.6 (7.5) 0.5 5.7
2015 9.9 1.5 5.2 8.2 5.4 6.1 5.7 0.1 4.7 7.1
2016 8.2 1.4 7.0 9.4 6.8 3.3 5.0 0.4 -0.0 6.3
2017 8.2 0.1 5.3 3.6 -2.1 2.1 6.6 -1.7 5.8 5.7
2018 7.2 (0.1) 6.5 4.0 (4.9) (4.1) 3.8 10.5 (4.0) 5.1
Source: Department of Road Transport and Safety, Ministry of Transport andCommunications
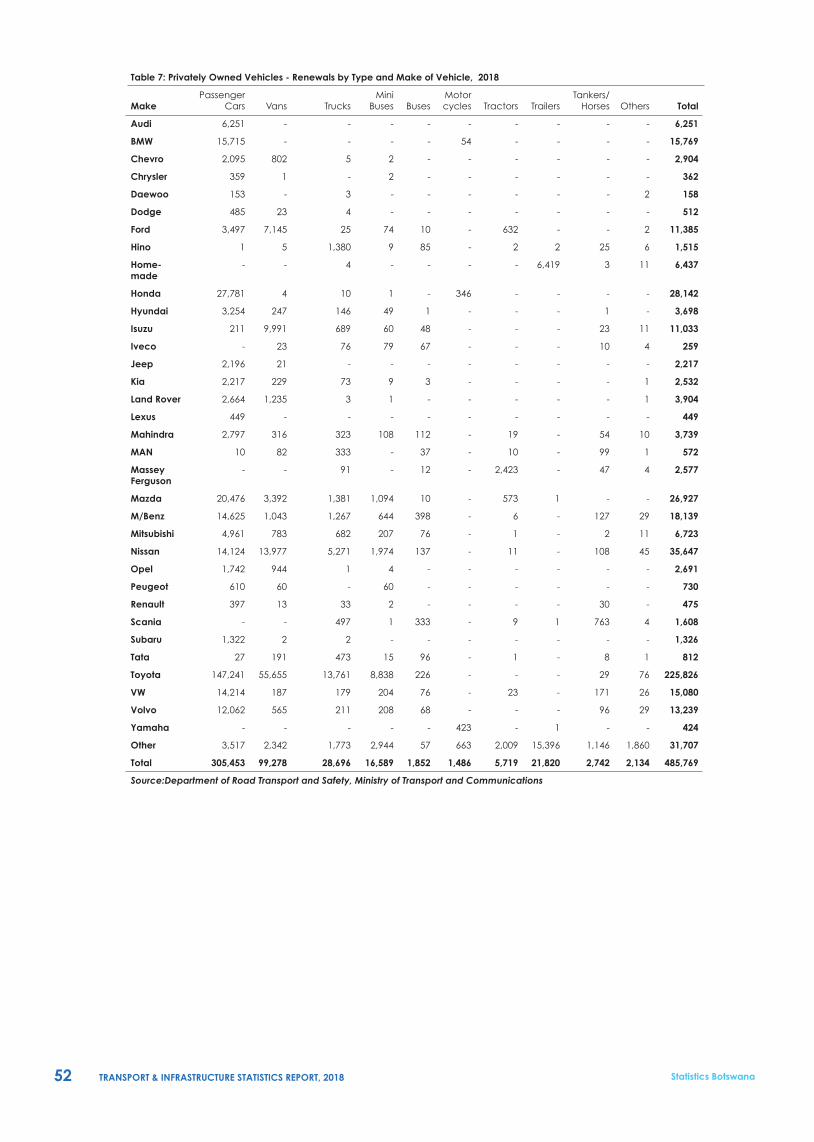
52 TRANSPORT & INFRASTRUCTURE STATISTICS REPORT, 2018 Statistics Botswana
Table 7: Privately Owned Vehicles - Renewals by Type and Make of Vehicle, 2018
MakePassenger
Cars Vans TrucksMini
Buses BusesMotor cycles Tractors Trailers
Tankers/ Horses Others Total
Audi 6,251 - - - - - - - - - 6,251
BMW 15,715 - - - - 54 - - - - 15,769
Chevro 2,095 802 5 2 - - - - - - 2,904
Chrysler 359 1 - 2 - - - - - - 362
Daewoo 153 - 3 - - - - - - 2 158
Dodge 485 23 4 - - - - - - - 512
Ford 3,497 7,145 25 74 10 - 632 - - 2 11,385
Hino 1 5 1,380 9 85 - 2 2 25 6 1,515
Home-made
- - 4 - - - - 6,419 3 11 6,437
Honda 27,781 4 10 1 - 346 - - - - 28,142
Hyundai 3,254 247 146 49 1 - - - 1 - 3,698
Isuzu 211 9,991 689 60 48 - - - 23 11 11,033
Iveco - 23 76 79 67 - - - 10 4 259
Jeep 2,196 21 - - - - - - - - 2,217
Kia 2,217 229 73 9 3 - - - - 1 2,532
Land Rover 2,664 1,235 3 1 - - - - - 1 3,904
Lexus 449 - - - - - - - - - 449
Mahindra 2,797 316 323 108 112 - 19 - 54 10 3,739
MAN 10 82 333 - 37 - 10 - 99 1 572
Massey Ferguson
- - 91 - 12 - 2,423 - 47 4 2,577
Mazda 20,476 3,392 1,381 1,094 10 - 573 1 - - 26,927
M/Benz 14,625 1,043 1,267 644 398 - 6 - 127 29 18,139
Mitsubishi 4,961 783 682 207 76 - 1 - 2 11 6,723
Nissan 14,124 13,977 5,271 1,974 137 - 11 - 108 45 35,647
Opel 1,742 944 1 4 - - - - - - 2,691
Peugeot 610 60 - 60 - - - - - - 730
Renault 397 13 33 2 - - - - 30 - 475
Scania - - 497 1 333 - 9 1 763 4 1,608
Subaru 1,322 2 2 - - - - - - - 1,326
Tata 27 191 473 15 96 - 1 - 8 1 812
Toyota 147,241 55,655 13,761 8,838 226 - - - 29 76 225,826
VW 14,214 187 179 204 76 - 23 - 171 26 15,080
Volvo 12,062 565 211 208 68 - - - 96 29 13,239
Yamaha - - - - - 423 - 1 - - 424
Other 3,517 2,342 1,773 2,944 57 663 2,009 15,396 1,146 1,860 31,707
Total 305,453 99,278 28,696 16,589 1,852 1,486 5,719 21,820 2,742 2,134 485,769
Source:Department of Road Transport and Safety, Ministry of Transport and Communications

53TRANSPORT & INFRASTRUCTURE STATISTICS REPORT, 2018Statistics Botswana
Table 7a: Privately Owned Vehicles - Renewals (Percent) by Type and Make of Vehicle 2018
MakePassenger
Cars Vans TrucksMini
Buses BusesMotor cycles Tractors Trailers
Tankers/ Horses Others Total
Audi 100.0 - - - - - - - - - 100
BMW 99.7 - - - - 0.3 - - - - 100
Chevro 72.1 27.6 0.2 0.1 - - - - - - 100
Chrysler 99.2 0.3 - 0.6 - - - - - - 100
Daewoo 96.8 - 1.9 - - - - - - 1.3 100
Dodge 94.7 4.5 0.8 - - - - - - - 100
Ford 30.7 62.8 0.2 0.6 0.1 - 5.6 - - - 100
Hino - - 91.1 0.1 0.6 - - - 0.2 - 100
Home-made - - 0.1 - - - - 99.7 - 0.2 100
Honda 98.7 - - - - 1.2 - - - - 100
Hyundai 88.0 6.7 3.9 1.3 - - - - - - 100
Isuzu 1.9 90.6 6.2 0.5 0.4 - - - 0.2 0.1 100
Iveco - 8.9 29.3 30.5 25.9 - - - 3.9 1.5 100
Jeep 99.1 0.9 - - - - - - - - 100
Kia 87.6 9.0 2.9 0.4 0.1 - - - - - 100
Land Rover 68.2 31.6 0.1 - - - - - - - 100
Lexus 100.0 - - - - - - - - - 100
Mahindra 74.8 8.5 8.6 2.9 3.0 - 0.5 - 1.4 0.3 100
MAN 1.7 14.3 58.2 - 6.5 - 1.7 - 17.3 0.2 100
Massey Ferguson
- - 3.5 - 0.5 - 94.0 - 1.8 0.2 100
Mazda 76.0 12.6 5.1 4.1 0.0 - 2.1 - - - 100
M/Benz 80.6 5.8 7.0 3.6 2.2 - 0.0 - 0.7 0.2 100
Mitsubishi 73.8 11.6 10.1 3.1 1.1 - 0.0 - 0.0 0.2 100
Nissan 39.6 39.2 14.8 5.5 0.4 - 0.0 - 0.3 0.1 100
Opel 64.7 35.1 0.0 0.1 - - - - - - 100
Peugeot 83.6 8.2 - 8.2 - - - - - - 100
Renault 83.6 2.7 6.9 0.4 - - - - 6.3 - 100
Scania - - 30.9 0.1 20.7 - 0.6 0.1 47.5 0.2 100
Subaru 99.7 0.2 0.2 - - - - - - - 100
Tata 3.3 23.5 58.3 1.8 11.8 - 0.1 - 1.0 0.1 100
Toyota 65.2 24.6 6.1 3.9 0.1 - - - 0.0 0.0 100
VW 94.3 1.2 1.2 1.4 0.5 - 0.2 - 1.1 0.2 100
Volvo 91.1 4.3 1.6 1.6 0.5 - - - 0.7 0.2 100
Yamaha - - - - - 99.8 - 0.2 - - 100
Other 11.1 7.4 5.6 9.3 0.2 2.1 6.3 48.6 3.6 5.9 100
Total 62.9 20.4 5.9 3.4 0.4 0.3 1.2 4.5 0.6 0.4 100
Source:Department of Road Transport and Safety, Ministry of Transport and Communications
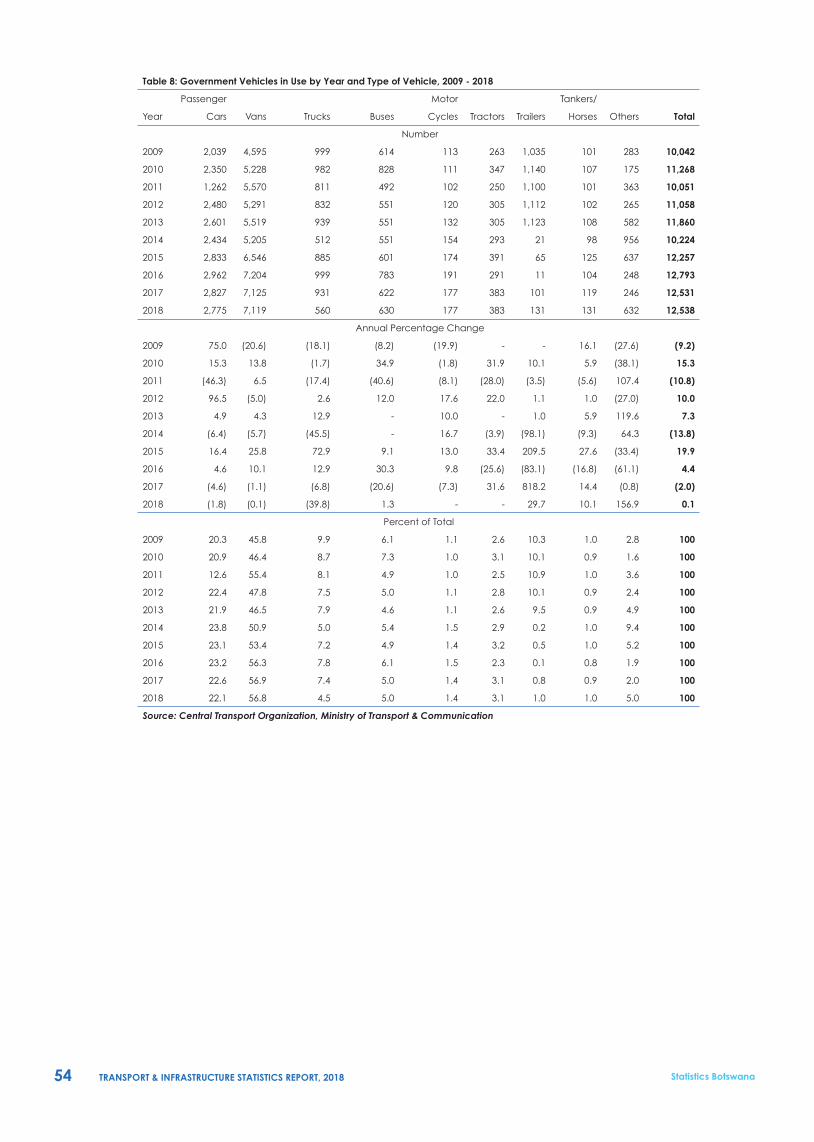
54 TRANSPORT & INFRASTRUCTURE STATISTICS REPORT, 2018 Statistics Botswana
Table 8: Government Vehicles in Use by Year and Type of Vehicle, 2009 - 2018
Passenger Motor Tankers/
Year Cars Vans Trucks Buses Cycles Tractors Trailers Horses Others Total
Number
2009 2,039 4,595 999 614 113 263 1,035 101 283 10,042
2010 2,350 5,228 982 828 111 347 1,140 107 175 11,268
2011 1,262 5,570 811 492 102 250 1,100 101 363 10,051
2012 2,480 5,291 832 551 120 305 1,112 102 265 11,058
2013 2,601 5,519 939 551 132 305 1,123 108 582 11,860
2014 2,434 5,205 512 551 154 293 21 98 956 10,224
2015 2,833 6,546 885 601 174 391 65 125 637 12,257
2016 2,962 7,204 999 783 191 291 11 104 248 12,793
2017 2,827 7,125 931 622 177 383 101 119 246 12,531
2018 2,775 7,119 560 630 177 383 131 131 632 12,538
Annual Percentage Change
2009 75.0 (20.6) (18.1) (8.2) (19.9) - - 16.1 (27.6) (9.2)
2010 15.3 13.8 (1.7) 34.9 (1.8) 31.9 10.1 5.9 (38.1) 15.3
2011 (46.3) 6.5 (17.4) (40.6) (8.1) (28.0) (3.5) (5.6) 107.4 (10.8)
2012 96.5 (5.0) 2.6 12.0 17.6 22.0 1.1 1.0 (27.0) 10.0
2013 4.9 4.3 12.9 - 10.0 - 1.0 5.9 119.6 7.3
2014 (6.4) (5.7) (45.5) - 16.7 (3.9) (98.1) (9.3) 64.3 (13.8)
2015 16.4 25.8 72.9 9.1 13.0 33.4 209.5 27.6 (33.4) 19.9
2016 4.6 10.1 12.9 30.3 9.8 (25.6) (83.1) (16.8) (61.1) 4.4
2017 (4.6) (1.1) (6.8) (20.6) (7.3) 31.6 818.2 14.4 (0.8) (2.0)
2018 (1.8) (0.1) (39.8) 1.3 - - 29.7 10.1 156.9 0.1
Percent of Total
2009 20.3 45.8 9.9 6.1 1.1 2.6 10.3 1.0 2.8 100
2010 20.9 46.4 8.7 7.3 1.0 3.1 10.1 0.9 1.6 100
2011 12.6 55.4 8.1 4.9 1.0 2.5 10.9 1.0 3.6 100
2012 22.4 47.8 7.5 5.0 1.1 2.8 10.1 0.9 2.4 100
2013 21.9 46.5 7.9 4.6 1.1 2.6 9.5 0.9 4.9 100
2014 23.8 50.9 5.0 5.4 1.5 2.9 0.2 1.0 9.4 100
2015 23.1 53.4 7.2 4.9 1.4 3.2 0.5 1.0 5.2 100
2016 23.2 56.3 7.8 6.1 1.5 2.3 0.1 0.8 1.9 100
2017 22.6 56.9 7.4 5.0 1.4 3.1 0.8 0.9 2.0 100
2018 22.1 56.8 4.5 5.0 1.4 3.1 1.0 1.0 5.0 100
Source: Central Transport Organization, Ministry of Transport & Communication

55TRANSPORT & INFRASTRUCTURE STATISTICS REPORT, 2018Statistics Botswana
Appendix 2: Road Safety
Table 9: Motor Vehicle Accidents - Trend in Accidents, 2009 - 2018
Number Estimated Accidents Casualties Fatalities
Number of of Registered Pop Per ‘000 Per 10,000 Per ‘000 Per 10,000 Per ‘10,000 Per 100,000
Year Accidents Casualties Fatalities vehicles (‘000s) Vehicles Population Vehicles Pop Vehicles Pop
2009 20,000 7,970 475 280,639 1,776 71.3 113.0 28.4 45 16.9 27.0
2010 18,978 6,430 397 344,719 1,800 55.0 105.4 18.7 35.7 11.5 22.1
2011 18,001 6,436 483 367,155 2,025 49.0 88.9 17.5 31.8 13.1 23.9
2012 17,527 6,035 404 401,015 2,066 43.7 84.8 15.0 29.2 10.10 19.6
2013 17,062 6,157 411 417,015 2,107 40.9 81.0 14.8 29.2 9.90 19.5
2014 16,641 6,065 377 435,750 2,147 38.2 77.5 13.9 28.2 8.70 17.6
2015 17,654 6,303 411 469,664 2,187 37.6 80.7 13.4 28.8 8.75 18.8
2016 18,373 6,687 450 500,316 2,226 36.7 82.5 13.4 30.0 9.0 20.2
2017 17,786 6,335 444 527,901 2,264 33.7 78.6 12.0 28.0 8.4 19.6
2018 17,341 6,243 462 553,648 2,303 31.3 75.3 11.3 27.1 8.3 20.1
Annual Percentage Change
2009 (2.0) (2.3) 4.4 9.4 1.2 (10.9) (1.7) (11.3) (4.5) (2.2) 3.8
2010 (5.1) (19.3) (16.4) 22.8 1.4 (22.9) (6.7) (34.2) (32.0) (20.7) (18.1)
2011 (5.1) 0.1 21.7 6.5 12.5 (10.9) (15.7) (6.4) 13.9 (10.9) 8.1
2012 (2.6) (6.2) (16.4) 9.2 2.0 (10.8) (4.6) (14.3) (22.9) (8.1) (18.2)
2013 (2.7) 2.0 1.7 4.0 2.0 (6.4) (4.5) (1.3) (2.0) 0.0 (0.2)
2014 (5.1) 0.5 (6.7) 8.7 3.9 (12.6) (8.6) (7.3) (13.9) (3.3) (10.2)
2015 6.1 3.9 9.0 7.8 1.9 (1.6) 4.1 (3.5) 0.6 2.0 7.0
2016 4.1 6.1 9.5 6.5 1.8 (2.3) 2.2 (0.4) 4.1 2.8 7.6
2017 4.1 6.1 9.5 6.5 1.8 (2.3) 2.2 (0.4) 4.1 2.8 7.6
2018 (2.5) (1.5) 4.1 4.9 1.7 (7.0) (4.2) (6.0) (3.1) (0.8) 2.3
Source: Accident Statistics Unit, Botswana Police ServicesNote: Pop is Population
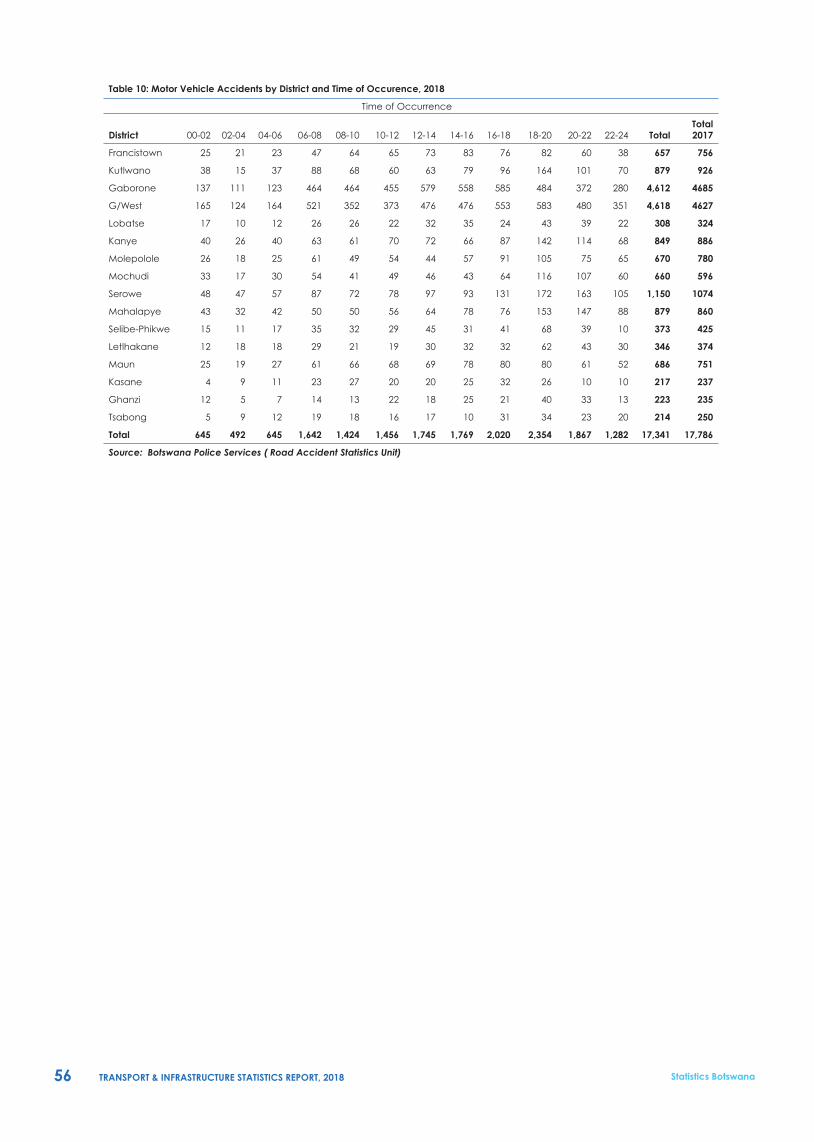
56 TRANSPORT & INFRASTRUCTURE STATISTICS REPORT, 2018 Statistics Botswana
Table 10: Motor Vehicle Accidents by District and Time of Occurence, 2018
Time of Occurrence
District 00-02 02-04 04-06 06-08 08-10 10-12 12-14 14-16 16-18 18-20 20-22 22-24 TotalTotal 2017
Francistown 25 21 23 47 64 65 73 83 76 82 60 38 657 756
Kutlwano 38 15 37 88 68 60 63 79 96 164 101 70 879 926
Gaborone 137 111 123 464 464 455 579 558 585 484 372 280 4,612 4685
G/West 165 124 164 521 352 373 476 476 553 583 480 351 4,618 4627
Lobatse 17 10 12 26 26 22 32 35 24 43 39 22 308 324
Kanye 40 26 40 63 61 70 72 66 87 142 114 68 849 886
Molepolole 26 18 25 61 49 54 44 57 91 105 75 65 670 780
Mochudi 33 17 30 54 41 49 46 43 64 116 107 60 660 596
Serowe 48 47 57 87 72 78 97 93 131 172 163 105 1,150 1074
Mahalapye 43 32 42 50 50 56 64 78 76 153 147 88 879 860
Selibe-Phikwe 15 11 17 35 32 29 45 31 41 68 39 10 373 425
Letlhakane 12 18 18 29 21 19 30 32 32 62 43 30 346 374
Maun 25 19 27 61 66 68 69 78 80 80 61 52 686 751
Kasane 4 9 11 23 27 20 20 25 32 26 10 10 217 237
Ghanzi 12 5 7 14 13 22 18 25 21 40 33 13 223 235
Tsabong 5 9 12 19 18 16 17 10 31 34 23 20 214 250
Total 645 492 645 1,642 1,424 1,456 1,745 1,769 2,020 2,354 1,867 1,282 17,341 17,786
Source: Botswana Police Services ( Road Accident Statistics Unit)
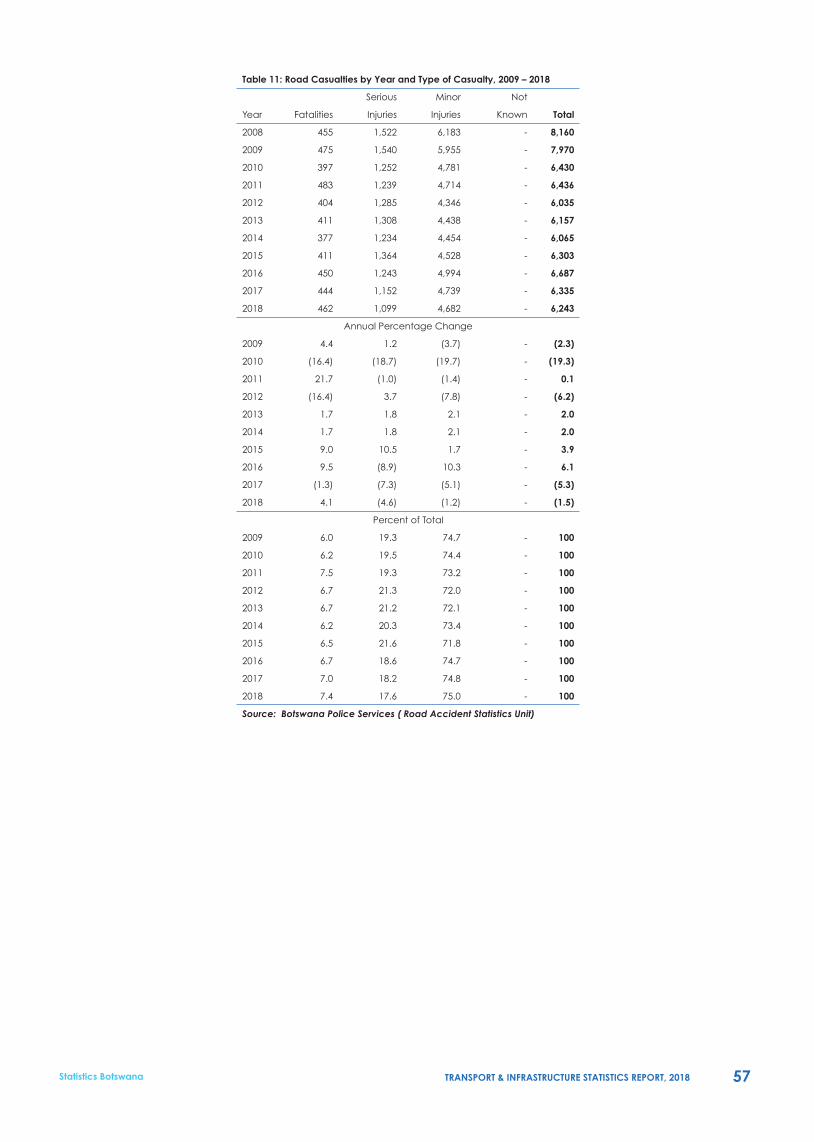
57TRANSPORT & INFRASTRUCTURE STATISTICS REPORT, 2018Statistics Botswana
Table 11: Road Casualties by Year and Type of Casualty, 2009 – 2018
Serious Minor Not
Year Fatalities Injuries Injuries Known Total
2008 455 1,522 6,183 - 8,160
2009 475 1,540 5,955 - 7,970
2010 397 1,252 4,781 - 6,430
2011 483 1,239 4,714 - 6,436
2012 404 1,285 4,346 - 6,035
2013 411 1,308 4,438 - 6,157
2014 377 1,234 4,454 - 6,065
2015 411 1,364 4,528 - 6,303
2016 450 1,243 4,994 - 6,687
2017 444 1,152 4,739 - 6,335
2018 462 1,099 4,682 - 6,243
Annual Percentage Change
2009 4.4 1.2 (3.7) - (2.3)
2010 (16.4) (18.7) (19.7) - (19.3)
2011 21.7 (1.0) (1.4) - 0.1
2012 (16.4) 3.7 (7.8) - (6.2)
2013 1.7 1.8 2.1 - 2.0
2014 1.7 1.8 2.1 - 2.0
2015 9.0 10.5 1.7 - 3.9
2016 9.5 (8.9) 10.3 - 6.1
2017 (1.3) (7.3) (5.1) - (5.3)
2018 4.1 (4.6) (1.2) - (1.5)
Percent of Total
2009 6.0 19.3 74.7 - 100
2010 6.2 19.5 74.4 - 100
2011 7.5 19.3 73.2 - 100
2012 6.7 21.3 72.0 - 100
2013 6.7 21.2 72.1 - 100
2014 6.2 20.3 73.4 - 100
2015 6.5 21.6 71.8 - 100
2016 6.7 18.6 74.7 - 100
2017 7.0 18.2 74.8 - 100
2018 7.4 17.6 75.0 - 100
Source: Botswana Police Services ( Road Accident Statistics Unit)
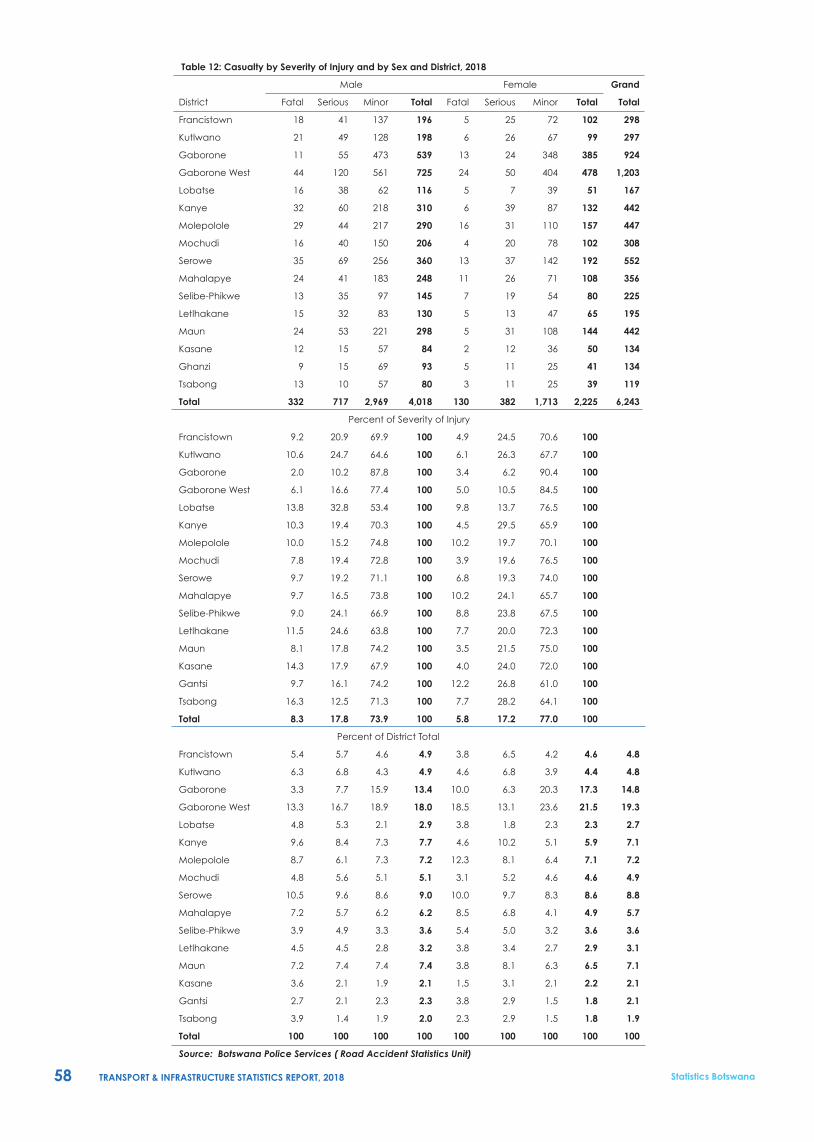
58 TRANSPORT & INFRASTRUCTURE STATISTICS REPORT, 2018 Statistics Botswana
Table 12: Casualty by Severity of Injury and by Sex and District, 2018
Male Female Grand
District Fatal Serious Minor Total Fatal Serious Minor Total Total
Francistown 18 41 137 196 5 25 72 102 298
Kutlwano 21 49 128 198 6 26 67 99 297
Gaborone 11 55 473 539 13 24 348 385 924
Gaborone West 44 120 561 725 24 50 404 478 1,203
Lobatse 16 38 62 116 5 7 39 51 167
Kanye 32 60 218 310 6 39 87 132 442
Molepolole 29 44 217 290 16 31 110 157 447
Mochudi 16 40 150 206 4 20 78 102 308
Serowe 35 69 256 360 13 37 142 192 552
Mahalapye 24 41 183 248 11 26 71 108 356
Selibe-Phikwe 13 35 97 145 7 19 54 80 225
Letlhakane 15 32 83 130 5 13 47 65 195
Maun 24 53 221 298 5 31 108 144 442
Kasane 12 15 57 84 2 12 36 50 134
Ghanzi 9 15 69 93 5 11 25 41 134
Tsabong 13 10 57 80 3 11 25 39 119
Total 332 717 2,969 4,018 130 382 1,713 2,225 6,243
Percent of Severity of Injury
Francistown 9.2 20.9 69.9 100 4.9 24.5 70.6 100
Kutlwano 10.6 24.7 64.6 100 6.1 26.3 67.7 100
Gaborone 2.0 10.2 87.8 100 3.4 6.2 90.4 100
Gaborone West 6.1 16.6 77.4 100 5.0 10.5 84.5 100
Lobatse 13.8 32.8 53.4 100 9.8 13.7 76.5 100
Kanye 10.3 19.4 70.3 100 4.5 29.5 65.9 100
Molepolole 10.0 15.2 74.8 100 10.2 19.7 70.1 100
Mochudi 7.8 19.4 72.8 100 3.9 19.6 76.5 100
Serowe 9.7 19.2 71.1 100 6.8 19.3 74.0 100
Mahalapye 9.7 16.5 73.8 100 10.2 24.1 65.7 100
Selibe-Phikwe 9.0 24.1 66.9 100 8.8 23.8 67.5 100
Letlhakane 11.5 24.6 63.8 100 7.7 20.0 72.3 100
Maun 8.1 17.8 74.2 100 3.5 21.5 75.0 100
Kasane 14.3 17.9 67.9 100 4.0 24.0 72.0 100
Gantsi 9.7 16.1 74.2 100 12.2 26.8 61.0 100
Tsabong 16.3 12.5 71.3 100 7.7 28.2 64.1 100
Total 8.3 17.8 73.9 100 5.8 17.2 77.0 100
Percent of District Total
Francistown 5.4 5.7 4.6 4.9 3.8 6.5 4.2 4.6 4.8
Kutlwano 6.3 6.8 4.3 4.9 4.6 6.8 3.9 4.4 4.8
Gaborone 3.3 7.7 15.9 13.4 10.0 6.3 20.3 17.3 14.8
Gaborone West 13.3 16.7 18.9 18.0 18.5 13.1 23.6 21.5 19.3
Lobatse 4.8 5.3 2.1 2.9 3.8 1.8 2.3 2.3 2.7
Kanye 9.6 8.4 7.3 7.7 4.6 10.2 5.1 5.9 7.1
Molepolole 8.7 6.1 7.3 7.2 12.3 8.1 6.4 7.1 7.2
Mochudi 4.8 5.6 5.1 5.1 3.1 5.2 4.6 4.6 4.9
Serowe 10.5 9.6 8.6 9.0 10.0 9.7 8.3 8.6 8.8
Mahalapye 7.2 5.7 6.2 6.2 8.5 6.8 4.1 4.9 5.7
Selibe-Phikwe 3.9 4.9 3.3 3.6 5.4 5.0 3.2 3.6 3.6
Letlhakane 4.5 4.5 2.8 3.2 3.8 3.4 2.7 2.9 3.1
Maun 7.2 7.4 7.4 7.4 3.8 8.1 6.3 6.5 7.1
Kasane 3.6 2.1 1.9 2.1 1.5 3.1 2.1 2.2 2.1
Gantsi 2.7 2.1 2.3 2.3 3.8 2.9 1.5 1.8 2.1
Tsabong 3.9 1.4 1.9 2.0 2.3 2.9 1.5 1.8 1.9
Total 100 100 100 100 100 100 100 100 100
Source: Botswana Police Services ( Road Accident Statistics Unit)

59TRANSPORT & INFRASTRUCTURE STATISTICS REPORT, 2018Statistics Botswana
Table 13: Casualties by Police District and Type of Road User, 2018
District Cyclist M/Cycle Car Taxi 4WD Pick-up LDV Lorry Buses TractorAnimal Drawn Other Total
Francistown 3 4 170 - 22 53 7 14 18 - 1 6 298
Kutlwano 5 5 146 - 17 50 6 15 39 - 10 4 297
Gaborone 14 27 544 2 29 105 25 11 119 1 1 46 924
Gaborone West
16 27 777 6 30 109 22 20 140 1 1 54 1,203
Lobatse 2 4 98 1 6 28 2 7 13 - - 6 167
Kanye 4 9 218 3 13 83 7 12 74 3 5 11 442
Molepolole 2 5 217 2 30 86 10 21 46 7 13 8 447
Mochudi 1 3 218 4 4 42 1 12 18 - - 5 308
Serowe 9 8 295 18 15 104 13 16 60 - 2 12 552
Mahalapye 1 2 199 2 25 56 13 17 27 1 4 9 356
Selibe-Phikwe 4 - 88 2 15 58 4 13 35 - 2 4 225
Letlhakane 2 - 89 1 26 43 6 13 6 - 2 7 195
Maun 4 3 210 35 27 122 5 19 9 - 2 6 442
Kasane - - 56 3 3 24 5 8 34 - - 1 134
Ghanzi 1 - 47 - 15 54 2 5 9 - - 1 134
Tsabong - 1 41 2 16 47 4 3 4 - 1 - 119
Total 68 98 3,413 81 293 1,064 132 206 651 13 44 180 6,243
Source: Botswana Police Services ( Road Accident Statistics Unit)
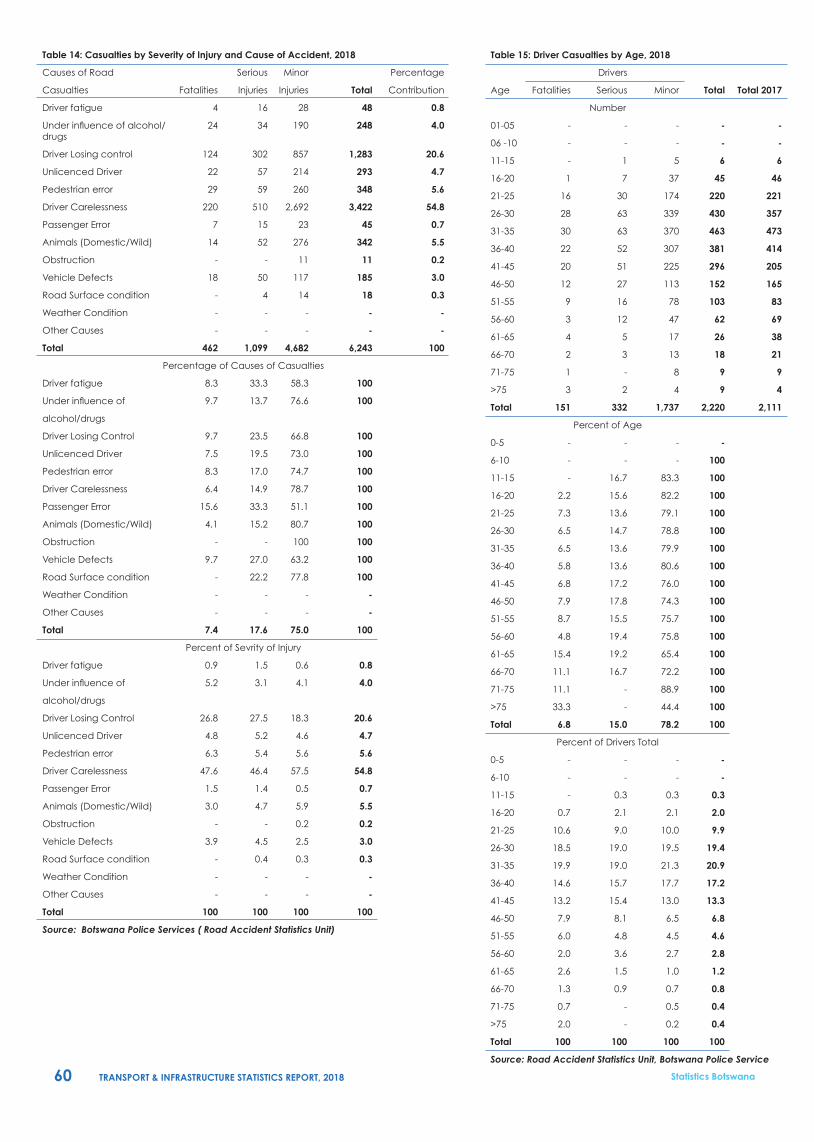
60 TRANSPORT & INFRASTRUCTURE STATISTICS REPORT, 2018 Statistics Botswana
Table 14: Casualties by Severity of Injury and Cause of Accident, 2018
Causes of Road Serious Minor Percentage
Casualties Fatalities Injuries Injuries Total Contribution
Driver fatigue 4 16 28 48 0.8
Under influence of alcohol/ drugs
24 34 190 248 4.0
Driver Losing control 124 302 857 1,283 20.6
Unlicenced Driver 22 57 214 293 4.7
Pedestrian error 29 59 260 348 5.6
Driver Carelessness 220 510 2,692 3,422 54.8
Passenger Error 7 15 23 45 0.7
Animals (Domestic/Wild) 14 52 276 342 5.5
Obstruction - - 11 11 0.2
Vehicle Defects 18 50 117 185 3.0
Road Surface condition - 4 14 18 0.3
Weather Condition - - - - -
Other Causes - - - - -
Total 462 1,099 4,682 6,243 100
Percentage of Causes of Casualties
Driver fatigue 8.3 33.3 58.3 100
Under influence of 9.7 13.7 76.6 100
alcohol/drugs
Driver Losing Control 9.7 23.5 66.8 100
Unlicenced Driver 7.5 19.5 73.0 100
Pedestrian error 8.3 17.0 74.7 100
Driver Carelessness 6.4 14.9 78.7 100
Passenger Error 15.6 33.3 51.1 100
Animals (Domestic/Wild) 4.1 15.2 80.7 100
Obstruction - - 100 100
Vehicle Defects 9.7 27.0 63.2 100
Road Surface condition - 22.2 77.8 100
Weather Condition - - - -
Other Causes - - - -
Total 7.4 17.6 75.0 100
Percent of Sevrity of Injury
Driver fatigue 0.9 1.5 0.6 0.8
Under influence of 5.2 3.1 4.1 4.0
alcohol/drugs
Driver Losing Control 26.8 27.5 18.3 20.6
Unlicenced Driver 4.8 5.2 4.6 4.7
Pedestrian error 6.3 5.4 5.6 5.6
Driver Carelessness 47.6 46.4 57.5 54.8
Passenger Error 1.5 1.4 0.5 0.7
Animals (Domestic/Wild) 3.0 4.7 5.9 5.5
Obstruction - - 0.2 0.2
Vehicle Defects 3.9 4.5 2.5 3.0
Road Surface condition - 0.4 0.3 0.3
Weather Condition - - - -
Other Causes - - - -
Total 100 100 100 100
Source: Botswana Police Services ( Road Accident Statistics Unit)
Table 15: Driver Casualties by Age, 2018
Drivers
Age Fatalities Serious Minor Total Total 2017
Number
01-05 - - - - -
06 -10 - - - - -
11-15 - 1 5 6 6
16-20 1 7 37 45 46
21-25 16 30 174 220 221
26-30 28 63 339 430 357
31-35 30 63 370 463 473
36-40 22 52 307 381 414
41-45 20 51 225 296 205
46-50 12 27 113 152 165
51-55 9 16 78 103 83
56-60 3 12 47 62 69
61-65 4 5 17 26 38
66-70 2 3 13 18 21
71-75 1 - 8 9 9
>75 3 2 4 9 4
Total 151 332 1,737 2,220 2,111
Percent of Age
0-5 - - - -
6-10 - - - 100
11-15 - 16.7 83.3 100
16-20 2.2 15.6 82.2 100
21-25 7.3 13.6 79.1 100
26-30 6.5 14.7 78.8 100
31-35 6.5 13.6 79.9 100
36-40 5.8 13.6 80.6 100
41-45 6.8 17.2 76.0 100
46-50 7.9 17.8 74.3 100
51-55 8.7 15.5 75.7 100
56-60 4.8 19.4 75.8 100
61-65 15.4 19.2 65.4 100
66-70 11.1 16.7 72.2 100
71-75 11.1 - 88.9 100
>75 33.3 - 44.4 100
Total 6.8 15.0 78.2 100
Percent of Drivers Total
0-5 - - - -
6-10 - - - -
11-15 - 0.3 0.3 0.3
16-20 0.7 2.1 2.1 2.0
21-25 10.6 9.0 10.0 9.9
26-30 18.5 19.0 19.5 19.4
31-35 19.9 19.0 21.3 20.9
36-40 14.6 15.7 17.7 17.2
41-45 13.2 15.4 13.0 13.3
46-50 7.9 8.1 6.5 6.8
51-55 6.0 4.8 4.5 4.6
56-60 2.0 3.6 2.7 2.8
61-65 2.6 1.5 1.0 1.2
66-70 1.3 0.9 0.7 0.8
71-75 0.7 - 0.5 0.4
>75 2.0 - 0.2 0.4
Total 100 100 100 100
Source: Road Accident Statistics Unit, Botswana Police Service
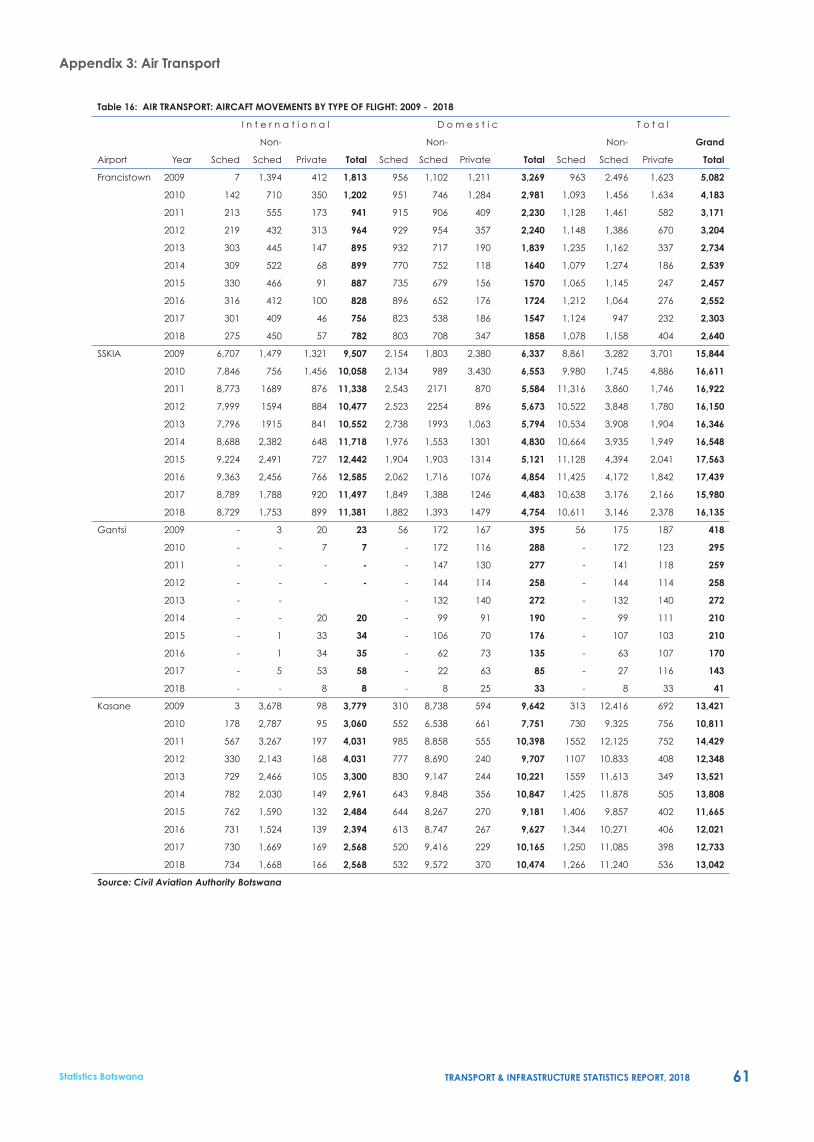
61TRANSPORT & INFRASTRUCTURE STATISTICS REPORT, 2018Statistics Botswana
Table 15: Driver Casualties by Age, 2018
Drivers
Age Fatalities Serious Minor Total Total 2017
Number
01-05 - - - - -
06 -10 - - - - -
11-15 - 1 5 6 6
16-20 1 7 37 45 46
21-25 16 30 174 220 221
26-30 28 63 339 430 357
31-35 30 63 370 463 473
36-40 22 52 307 381 414
41-45 20 51 225 296 205
46-50 12 27 113 152 165
51-55 9 16 78 103 83
56-60 3 12 47 62 69
61-65 4 5 17 26 38
66-70 2 3 13 18 21
71-75 1 - 8 9 9
>75 3 2 4 9 4
Total 151 332 1,737 2,220 2,111
Percent of Age
0-5 - - - -
6-10 - - - 100
11-15 - 16.7 83.3 100
16-20 2.2 15.6 82.2 100
21-25 7.3 13.6 79.1 100
26-30 6.5 14.7 78.8 100
31-35 6.5 13.6 79.9 100
36-40 5.8 13.6 80.6 100
41-45 6.8 17.2 76.0 100
46-50 7.9 17.8 74.3 100
51-55 8.7 15.5 75.7 100
56-60 4.8 19.4 75.8 100
61-65 15.4 19.2 65.4 100
66-70 11.1 16.7 72.2 100
71-75 11.1 - 88.9 100
>75 33.3 - 44.4 100
Total 6.8 15.0 78.2 100
Percent of Drivers Total
0-5 - - - -
6-10 - - - -
11-15 - 0.3 0.3 0.3
16-20 0.7 2.1 2.1 2.0
21-25 10.6 9.0 10.0 9.9
26-30 18.5 19.0 19.5 19.4
31-35 19.9 19.0 21.3 20.9
36-40 14.6 15.7 17.7 17.2
41-45 13.2 15.4 13.0 13.3
46-50 7.9 8.1 6.5 6.8
51-55 6.0 4.8 4.5 4.6
56-60 2.0 3.6 2.7 2.8
61-65 2.6 1.5 1.0 1.2
66-70 1.3 0.9 0.7 0.8
71-75 0.7 - 0.5 0.4
>75 2.0 - 0.2 0.4
Total 100 100 100 100
Source: Road Accident Statistics Unit, Botswana Police Service
Table 16: AIR TRANSPORT: AIRCAFT MOVEMENTS BY TYPE OF FLIGHT: 2009 - 2018
I n t e r n a t i o n a l D o m e s t i c T o t a l
Non- Non- Non- Grand
Airport Year Sched Sched Private Total Sched Sched Private Total Sched Sched Private Total
Francistown 2009 7 1,394 412 1,813 956 1,102 1,211 3,269 963 2,496 1,623 5,082
2010 142 710 350 1,202 951 746 1,284 2,981 1,093 1,456 1,634 4,183
2011 213 555 173 941 915 906 409 2,230 1,128 1,461 582 3,171
2012 219 432 313 964 929 954 357 2,240 1,148 1,386 670 3,204
2013 303 445 147 895 932 717 190 1,839 1,235 1,162 337 2,734
2014 309 522 68 899 770 752 118 1640 1,079 1,274 186 2,539
2015 330 466 91 887 735 679 156 1570 1,065 1,145 247 2,457
2016 316 412 100 828 896 652 176 1724 1,212 1,064 276 2,552
2017 301 409 46 756 823 538 186 1547 1,124 947 232 2,303
2018 275 450 57 782 803 708 347 1858 1,078 1,158 404 2,640
SSKIA 2009 6,707 1,479 1,321 9,507 2,154 1,803 2,380 6,337 8,861 3,282 3,701 15,844
2010 7,846 756 1,456 10,058 2,134 989 3,430 6,553 9,980 1,745 4,886 16,611
2011 8,773 1689 876 11,338 2,543 2171 870 5,584 11,316 3,860 1,746 16,922
2012 7,999 1594 884 10,477 2,523 2254 896 5,673 10,522 3,848 1,780 16,150
2013 7,796 1915 841 10,552 2,738 1993 1,063 5,794 10,534 3,908 1,904 16,346
2014 8,688 2,382 648 11,718 1,976 1,553 1301 4,830 10,664 3,935 1,949 16,548
2015 9,224 2,491 727 12,442 1,904 1,903 1314 5,121 11,128 4,394 2,041 17,563
2016 9,363 2,456 766 12,585 2,062 1,716 1076 4,854 11,425 4,172 1,842 17,439
2017 8,789 1,788 920 11,497 1,849 1,388 1246 4,483 10,638 3,176 2,166 15,980
2018 8,729 1,753 899 11,381 1,882 1,393 1479 4,754 10,611 3,146 2,378 16,135
Gantsi 2009 - 3 20 23 56 172 167 395 56 175 187 418
2010 - - 7 7 - 172 116 288 - 172 123 295
2011 - - - - - 147 130 277 - 141 118 259
2012 - - - - - 144 114 258 - 144 114 258
2013 - - - 132 140 272 - 132 140 272
2014 - - 20 20 - 99 91 190 - 99 111 210
2015 - 1 33 34 - 106 70 176 - 107 103 210
2016 - 1 34 35 - 62 73 135 - 63 107 170
2017 - 5 53 58 - 22 63 85 - 27 116 143
2018 - - 8 8 - 8 25 33 - 8 33 41
Kasane 2009 3 3,678 98 3,779 310 8,738 594 9,642 313 12,416 692 13,421
2010 178 2,787 95 3,060 552 6,538 661 7,751 730 9,325 756 10,811
2011 567 3,267 197 4,031 985 8,858 555 10,398 1552 12,125 752 14,429
2012 330 2,143 168 4,031 777 8,690 240 9,707 1107 10,833 408 12,348
2013 729 2,466 105 3,300 830 9,147 244 10,221 1559 11,613 349 13,521
2014 782 2,030 149 2,961 643 9,848 356 10,847 1,425 11,878 505 13,808
2015 762 1,590 132 2,484 644 8,267 270 9,181 1,406 9,857 402 11,665
2016 731 1,524 139 2,394 613 8,747 267 9,627 1,344 10,271 406 12,021
2017 730 1,669 169 2,568 520 9,416 229 10,165 1,250 11,085 398 12,733
2018 734 1,668 166 2,568 532 9,572 370 10,474 1,266 11,240 536 13,042
Source: Civil Aviation Authority Botswana
Appendix 3: Air Transport
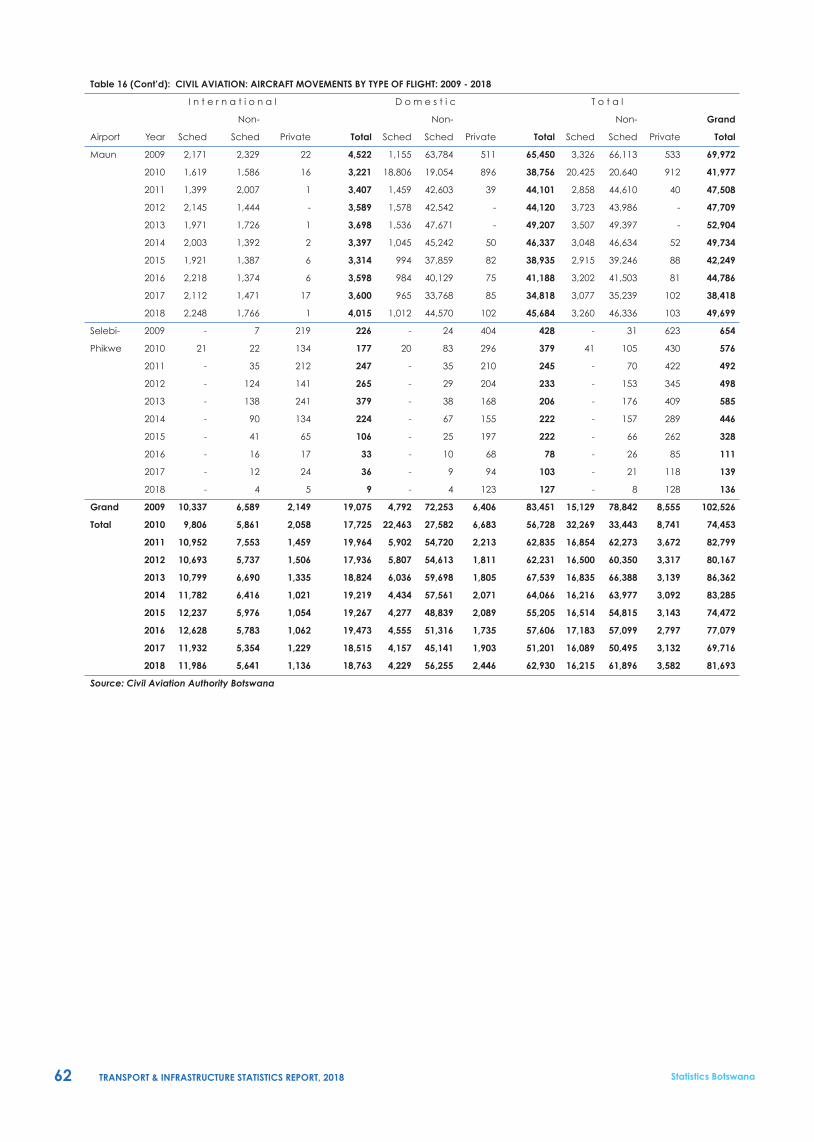
62 TRANSPORT & INFRASTRUCTURE STATISTICS REPORT, 2018 Statistics Botswana
Table 16 (Cont’d): CIVIL AVIATION: AIRCRAFT MOVEMENTS BY TYPE OF FLIGHT: 2009 - 2018
I n t e r n a t i o n a l D o m e s t i c T o t a l
Non- Non- Non- Grand
Airport Year Sched Sched Private Total Sched Sched Private Total Sched Sched Private Total
Maun 2009 2,171 2,329 22 4,522 1,155 63,784 511 65,450 3,326 66,113 533 69,972
2010 1,619 1,586 16 3,221 18,806 19,054 896 38,756 20,425 20,640 912 41,977
2011 1,399 2,007 1 3,407 1,459 42,603 39 44,101 2,858 44,610 40 47,508
2012 2,145 1,444 - 3,589 1,578 42,542 - 44,120 3,723 43,986 - 47,709
2013 1,971 1,726 1 3,698 1,536 47,671 - 49,207 3,507 49,397 - 52,904
2014 2,003 1,392 2 3,397 1,045 45,242 50 46,337 3,048 46,634 52 49,734
2015 1,921 1,387 6 3,314 994 37,859 82 38,935 2,915 39,246 88 42,249
2016 2,218 1,374 6 3,598 984 40,129 75 41,188 3,202 41,503 81 44,786
2017 2,112 1,471 17 3,600 965 33,768 85 34,818 3,077 35,239 102 38,418
2018 2,248 1,766 1 4,015 1,012 44,570 102 45,684 3,260 46,336 103 49,699
Selebi- 2009 - 7 219 226 - 24 404 428 - 31 623 654
Phikwe 2010 21 22 134 177 20 83 296 379 41 105 430 576
2011 - 35 212 247 - 35 210 245 - 70 422 492
2012 - 124 141 265 - 29 204 233 - 153 345 498
2013 - 138 241 379 - 38 168 206 - 176 409 585
2014 - 90 134 224 - 67 155 222 - 157 289 446
2015 - 41 65 106 - 25 197 222 - 66 262 328
2016 - 16 17 33 - 10 68 78 - 26 85 111
2017 - 12 24 36 - 9 94 103 - 21 118 139
2018 - 4 5 9 - 4 123 127 - 8 128 136
Grand 2009 10,337 6,589 2,149 19,075 4,792 72,253 6,406 83,451 15,129 78,842 8,555 102,526
Total 2010 9,806 5,861 2,058 17,725 22,463 27,582 6,683 56,728 32,269 33,443 8,741 74,453
2011 10,952 7,553 1,459 19,964 5,902 54,720 2,213 62,835 16,854 62,273 3,672 82,799
2012 10,693 5,737 1,506 17,936 5,807 54,613 1,811 62,231 16,500 60,350 3,317 80,167
2013 10,799 6,690 1,335 18,824 6,036 59,698 1,805 67,539 16,835 66,388 3,139 86,362
2014 11,782 6,416 1,021 19,219 4,434 57,561 2,071 64,066 16,216 63,977 3,092 83,285
2015 12,237 5,976 1,054 19,267 4,277 48,839 2,089 55,205 16,514 54,815 3,143 74,472
2016 12,628 5,783 1,062 19,473 4,555 51,316 1,735 57,606 17,183 57,099 2,797 77,079
2017 11,932 5,354 1,229 18,515 4,157 45,141 1,903 51,201 16,089 50,495 3,132 69,716
2018 11,986 5,641 1,136 18,763 4,229 56,255 2,446 62,930 16,215 61,896 3,582 81,693
Source: Civil Aviation Authority Botswana
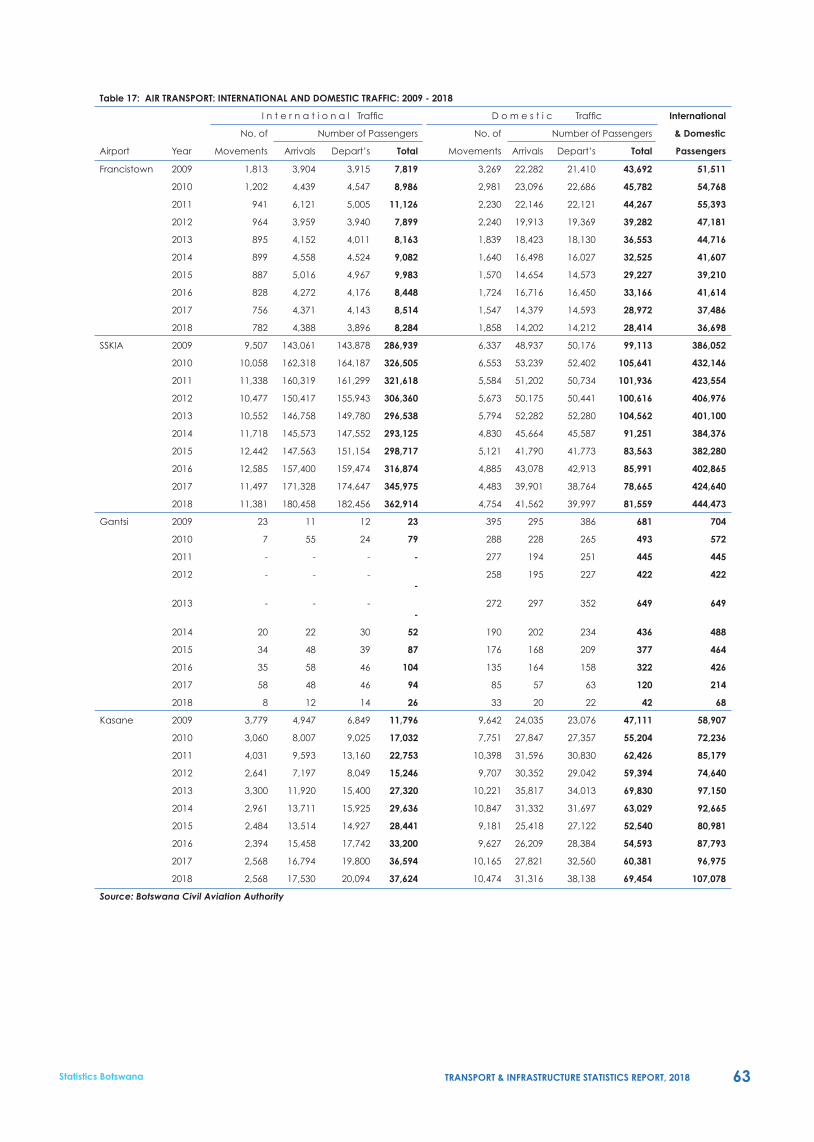
63TRANSPORT & INFRASTRUCTURE STATISTICS REPORT, 2018Statistics Botswana
Table 17: AIR TRANSPORT: INTERNATIONAL AND DOMESTIC TRAFFIC: 2009 - 2018
I n t e r n a t i o n a l Traffic D o m e s t i c Traffic International
No. of Number of Passengers No. of Number of Passengers & Domestic
Airport Year Movements Arrivals Depart’s Total Movements Arrivals Depart’s Total Passengers
Francistown 2009 1,813 3,904 3,915 7,819 3,269 22,282 21,410 43,692 51,511
2010 1,202 4,439 4,547 8,986 2,981 23,096 22,686 45,782 54,768
2011 941 6,121 5,005 11,126 2,230 22,146 22,121 44,267 55,393
2012 964 3,959 3,940 7,899 2,240 19,913 19,369 39,282 47,181
2013 895 4,152 4,011 8,163 1,839 18,423 18,130 36,553 44,716
2014 899 4,558 4,524 9,082 1,640 16,498 16,027 32,525 41,607
2015 887 5,016 4,967 9,983 1,570 14,654 14,573 29,227 39,210
2016 828 4,272 4,176 8,448 1,724 16,716 16,450 33,166 41,614
2017 756 4,371 4,143 8,514 1,547 14,379 14,593 28,972 37,486
2018 782 4,388 3,896 8,284 1,858 14,202 14,212 28,414 36,698
SSKIA 2009 9,507 143,061 143,878 286,939 6,337 48,937 50,176 99,113 386,052
2010 10,058 162,318 164,187 326,505 6,553 53,239 52,402 105,641 432,146
2011 11,338 160,319 161,299 321,618 5,584 51,202 50,734 101,936 423,554
2012 10,477 150,417 155,943 306,360 5,673 50,175 50,441 100,616 406,976
2013 10,552 146,758 149,780 296,538 5,794 52,282 52,280 104,562 401,100
2014 11,718 145,573 147,552 293,125 4,830 45,664 45,587 91,251 384,376
2015 12,442 147,563 151,154 298,717 5,121 41,790 41,773 83,563 382,280
2016 12,585 157,400 159,474 316,874 4,885 43,078 42,913 85,991 402,865
2017 11,497 171,328 174,647 345,975 4,483 39,901 38,764 78,665 424,640
2018 11,381 180,458 182,456 362,914 4,754 41,562 39,997 81,559 444,473
Gantsi 2009 23 11 12 23 395 295 386 681 704
2010 7 55 24 79 288 228 265 493 572
2011 - - - - 277 194 251 445 445
2012 - - - -
258 195 227 422 422
2013 - - - -
272 297 352 649 649
2014 20 22 30 52 190 202 234 436 488
2015 34 48 39 87 176 168 209 377 464
2016 35 58 46 104 135 164 158 322 426
2017 58 48 46 94 85 57 63 120 214
2018 8 12 14 26 33 20 22 42 68
Kasane 2009 3,779 4,947 6,849 11,796 9,642 24,035 23,076 47,111 58,907
2010 3,060 8,007 9,025 17,032 7,751 27,847 27,357 55,204 72,236
2011 4,031 9,593 13,160 22,753 10,398 31,596 30,830 62,426 85,179
2012 2,641 7,197 8,049 15,246 9,707 30,352 29,042 59,394 74,640
2013 3,300 11,920 15,400 27,320 10,221 35,817 34,013 69,830 97,150
2014 2,961 13,711 15,925 29,636 10,847 31,332 31,697 63,029 92,665
2015 2,484 13,514 14,927 28,441 9,181 25,418 27,122 52,540 80,981
2016 2,394 15,458 17,742 33,200 9,627 26,209 28,384 54,593 87,793
2017 2,568 16,794 19,800 36,594 10,165 27,821 32,560 60,381 96,975
2018 2,568 17,530 20,094 37,624 10,474 31,316 38,138 69,454 107,078
Source: Botswana Civil Aviation Authority

64 TRANSPORT & INFRASTRUCTURE STATISTICS REPORT, 2018 Statistics Botswana
Table 17 (Cont’d): AIR TRANSPORT: INTERNATIONAL AND DOMESTIC TRAFFIC: 2009 - 2018
I n t e r n a t i o n a l Traffic D o m e s t i c Traffic International
No. of Number of Passengers No. of Number of Passengers & Domestic
Airport Year Movements Arrivals Depart’s Total Movements Arrivals Depart’s Total Passengers
Maun 2009 4,522 40,650 40,784 81,434 65,450 95,281 95,264 190,545 271,979
2010 3,221 22,577 21,757 44,334 38,756 83,894 83,633 167,527 211,861
2011 3,407 29,274 29,001 58,275 44,101 81,529 82,648 164,177 222,452
2012 3,589 34,010 34,425 68,435 44,120 81,631 79,743 161,374 229,809
2013 3,698 36,627 36,720 73,347 49,207 83,122 81,870 164,992 238,339
2014 3,397 39,410 41,235 80,645 46,337 78,233 76,018 154,251 234,896
2015 3,314 36,701 38,426 75,127 38,935 72,186 69,646 141,832 216,959
2016 3,598 38,470 41,929 80,399 41,188 77,812 72,916 150,728 231,127
2017 3,600 38,756 43,889 82,645 34,818 85,761 78,928 164,689 247,334
2018 4,015 42,497 49,624 92,121 45,684 93,639 85,654 179,293 271,414
S/Phikwe 2009 226 330 349 679 428 1,363 991 2,354 3,033
2010 156 293 290 583 399 1,423 1,182 2,605 3,188
2011 247 386 402 788 245 317 333 650 1,438
2012 265 318 299 617 233 383 484 867 1,484
2013 379 542 528 1,070 206 292 339 631 1,701
2014 224 433 452 885 222 377 427 804 1,689
2015 106 188 162 350 222 308 354 662 1,012
2016 33 43 35 78 78 116 127 243 321
2017 36 26 28 54 103 124 132 256 310
2018 9 14 14 28 127 92 96 188 216
Grand 2009 19,870 192,903 195,787 388,690 85,521 192,193 191,303 383,496 772,186
Total 2010 17,704 197,689 199,830 397,519 56,728 189,727 187,525 377,252 774,771
2011 19,964 205,693 208,867 414,560 62,835 186,984 186,917 373,901 788,461
2012 17,936 195,901 202,656 398,557 62,231 182,649 179,306 361,955 760,512
2013 18,824 199,999 206,439 406,438 67,539 190,233 186,984 377,217 783,655
2014 19,219 203,707 209,718 413,425 64,066 172,306 169,990 342,296 755,721
2015 19,267 203,030 209,675 412,705 55,205 154,524 153,677 308,201 720,906
2016 19,473 215,701 223,402 439,103 57,637 164,095 160,948 325,043 764,146
2017 18,515 231,323 242,553 473,876 51,201 168,043 165,040 333,083 806,959
2018 18,763 244,899 256,098 500,997 62,930 180,831 178,119 358,950 859,947
Source: Civil Aviation Authority Botswana
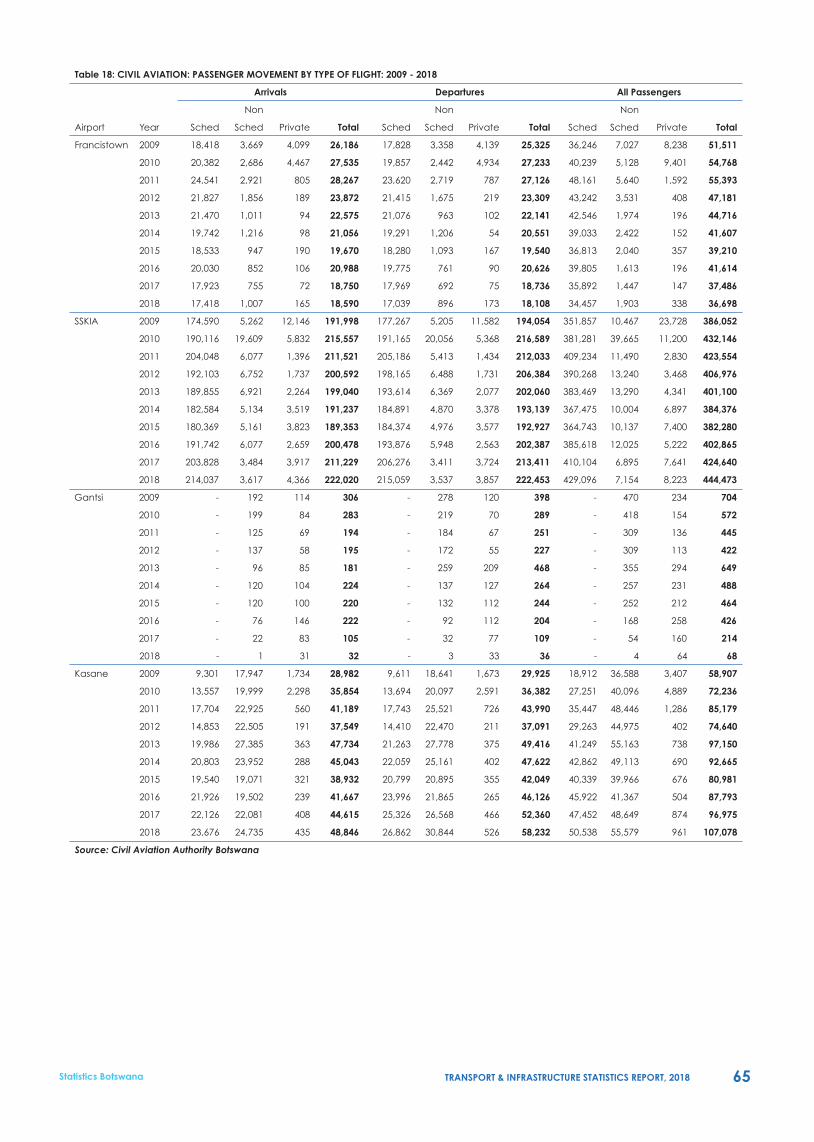
65TRANSPORT & INFRASTRUCTURE STATISTICS REPORT, 2018Statistics Botswana
Table 18: CIVIL AVIATION: PASSENGER MOVEMENT BY TYPE OF FLIGHT: 2009 - 2018
Arrivals Departures All Passengers
Non Non Non
Airport Year Sched Sched Private Total Sched Sched Private Total Sched Sched Private Total
Francistown 2009 18,418 3,669 4,099 26,186 17,828 3,358 4,139 25,325 36,246 7,027 8,238 51,511
2010 20,382 2,686 4,467 27,535 19,857 2,442 4,934 27,233 40,239 5,128 9,401 54,768
2011 24,541 2,921 805 28,267 23,620 2,719 787 27,126 48,161 5,640 1,592 55,393
2012 21,827 1,856 189 23,872 21,415 1,675 219 23,309 43,242 3,531 408 47,181
2013 21,470 1,011 94 22,575 21,076 963 102 22,141 42,546 1,974 196 44,716
2014 19,742 1,216 98 21,056 19,291 1,206 54 20,551 39,033 2,422 152 41,607
2015 18,533 947 190 19,670 18,280 1,093 167 19,540 36,813 2,040 357 39,210
2016 20,030 852 106 20,988 19,775 761 90 20,626 39,805 1,613 196 41,614
2017 17,923 755 72 18,750 17,969 692 75 18,736 35,892 1,447 147 37,486
2018 17,418 1,007 165 18,590 17,039 896 173 18,108 34,457 1,903 338 36,698
SSKIA 2009 174,590 5,262 12,146 191,998 177,267 5,205 11,582 194,054 351,857 10,467 23,728 386,052
2010 190,116 19,609 5,832 215,557 191,165 20,056 5,368 216,589 381,281 39,665 11,200 432,146
2011 204,048 6,077 1,396 211,521 205,186 5,413 1,434 212,033 409,234 11,490 2,830 423,554
2012 192,103 6,752 1,737 200,592 198,165 6,488 1,731 206,384 390,268 13,240 3,468 406,976
2013 189,855 6,921 2,264 199,040 193,614 6,369 2,077 202,060 383,469 13,290 4,341 401,100
2014 182,584 5,134 3,519 191,237 184,891 4,870 3,378 193,139 367,475 10,004 6,897 384,376
2015 180,369 5,161 3,823 189,353 184,374 4,976 3,577 192,927 364,743 10,137 7,400 382,280
2016 191,742 6,077 2,659 200,478 193,876 5,948 2,563 202,387 385,618 12,025 5,222 402,865
2017 203,828 3,484 3,917 211,229 206,276 3,411 3,724 213,411 410,104 6,895 7,641 424,640
2018 214,037 3,617 4,366 222,020 215,059 3,537 3,857 222,453 429,096 7,154 8,223 444,473
Gantsi 2009 - 192 114 306 - 278 120 398 - 470 234 704
2010 - 199 84 283 - 219 70 289 - 418 154 572
2011 - 125 69 194 - 184 67 251 - 309 136 445
2012 - 137 58 195 - 172 55 227 - 309 113 422
2013 - 96 85 181 - 259 209 468 - 355 294 649
2014 - 120 104 224 - 137 127 264 - 257 231 488
2015 - 120 100 220 - 132 112 244 - 252 212 464
2016 - 76 146 222 - 92 112 204 - 168 258 426
2017 - 22 83 105 - 32 77 109 - 54 160 214
2018 - 1 31 32 - 3 33 36 - 4 64 68
Kasane 2009 9,301 17,947 1,734 28,982 9,611 18,641 1,673 29,925 18,912 36,588 3,407 58,907
2010 13,557 19,999 2,298 35,854 13,694 20,097 2,591 36,382 27,251 40,096 4,889 72,236
2011 17,704 22,925 560 41,189 17,743 25,521 726 43,990 35,447 48,446 1,286 85,179
2012 14,853 22,505 191 37,549 14,410 22,470 211 37,091 29,263 44,975 402 74,640
2013 19,986 27,385 363 47,734 21,263 27,778 375 49,416 41,249 55,163 738 97,150
2014 20,803 23,952 288 45,043 22,059 25,161 402 47,622 42,862 49,113 690 92,665
2015 19,540 19,071 321 38,932 20,799 20,895 355 42,049 40,339 39,966 676 80,981
2016 21,926 19,502 239 41,667 23,996 21,865 265 46,126 45,922 41,367 504 87,793
2017 22,126 22,081 408 44,615 25,326 26,568 466 52,360 47,452 48,649 874 96,975
2018 23,676 24,735 435 48,846 26,862 30,844 526 58,232 50,538 55,579 961 107,078
Source: Civil Aviation Authority Botswana
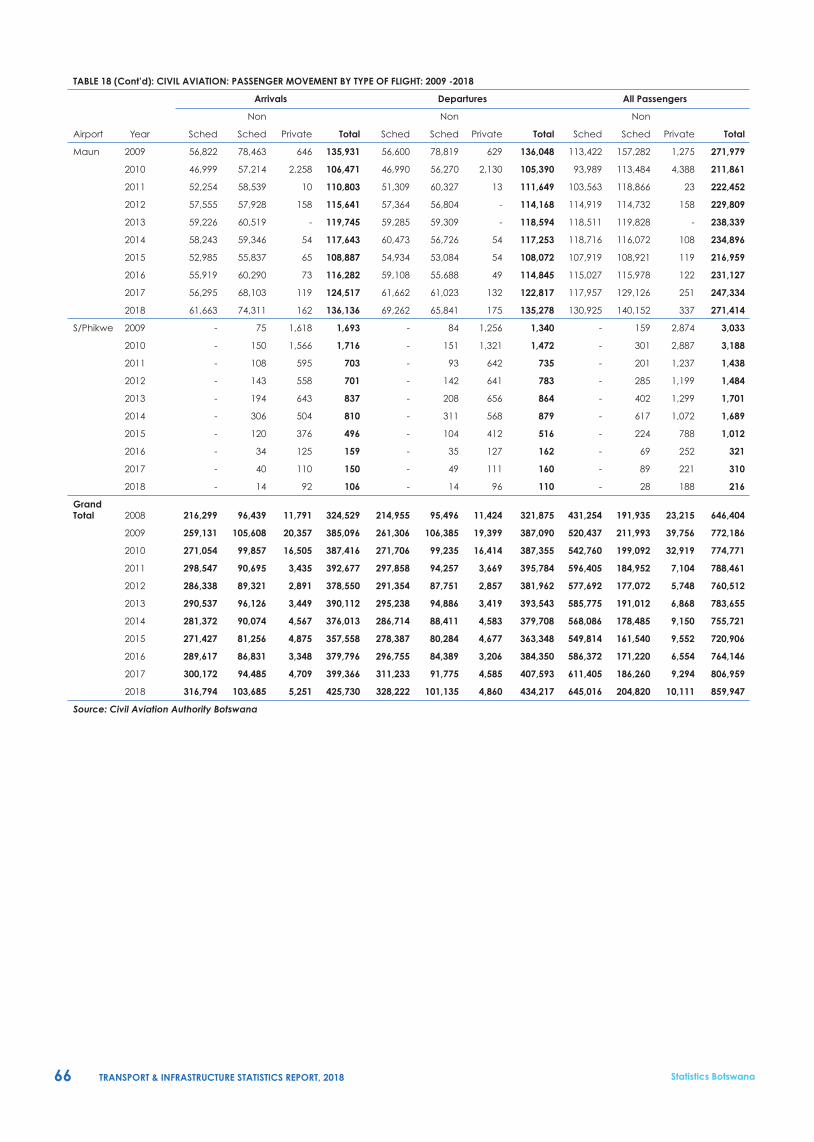
66 TRANSPORT & INFRASTRUCTURE STATISTICS REPORT, 2018 Statistics Botswana
TABLE 18 (Cont’d): CIVIL AVIATION: PASSENGER MOVEMENT BY TYPE OF FLIGHT: 2009 -2018
Arrivals Departures All Passengers
Non Non Non
Airport Year Sched Sched Private Total Sched Sched Private Total Sched Sched Private Total
Maun 2009 56,822 78,463 646 135,931 56,600 78,819 629 136,048 113,422 157,282 1,275 271,979
2010 46,999 57,214 2,258 106,471 46,990 56,270 2,130 105,390 93,989 113,484 4,388 211,861
2011 52,254 58,539 10 110,803 51,309 60,327 13 111,649 103,563 118,866 23 222,452
2012 57,555 57,928 158 115,641 57,364 56,804 - 114,168 114,919 114,732 158 229,809
2013 59,226 60,519 - 119,745 59,285 59,309 - 118,594 118,511 119,828 - 238,339
2014 58,243 59,346 54 117,643 60,473 56,726 54 117,253 118,716 116,072 108 234,896
2015 52,985 55,837 65 108,887 54,934 53,084 54 108,072 107,919 108,921 119 216,959
2016 55,919 60,290 73 116,282 59,108 55,688 49 114,845 115,027 115,978 122 231,127
2017 56,295 68,103 119 124,517 61,662 61,023 132 122,817 117,957 129,126 251 247,334
2018 61,663 74,311 162 136,136 69,262 65,841 175 135,278 130,925 140,152 337 271,414
S/Phikwe 2009 - 75 1,618 1,693 - 84 1,256 1,340 - 159 2,874 3,033
2010 - 150 1,566 1,716 - 151 1,321 1,472 - 301 2,887 3,188
2011 - 108 595 703 - 93 642 735 - 201 1,237 1,438
2012 - 143 558 701 - 142 641 783 - 285 1,199 1,484
2013 - 194 643 837 - 208 656 864 - 402 1,299 1,701
2014 - 306 504 810 - 311 568 879 - 617 1,072 1,689
2015 - 120 376 496 - 104 412 516 - 224 788 1,012
2016 - 34 125 159 - 35 127 162 - 69 252 321
2017 - 40 110 150 - 49 111 160 - 89 221 310
2018 - 14 92 106 - 14 96 110 - 28 188 216
Grand Total 2008 216,299 96,439 11,791 324,529 214,955 95,496 11,424 321,875 431,254 191,935 23,215 646,404
2009 259,131 105,608 20,357 385,096 261,306 106,385 19,399 387,090 520,437 211,993 39,756 772,186
2010 271,054 99,857 16,505 387,416 271,706 99,235 16,414 387,355 542,760 199,092 32,919 774,771
2011 298,547 90,695 3,435 392,677 297,858 94,257 3,669 395,784 596,405 184,952 7,104 788,461
2012 286,338 89,321 2,891 378,550 291,354 87,751 2,857 381,962 577,692 177,072 5,748 760,512
2013 290,537 96,126 3,449 390,112 295,238 94,886 3,419 393,543 585,775 191,012 6,868 783,655
2014 281,372 90,074 4,567 376,013 286,714 88,411 4,583 379,708 568,086 178,485 9,150 755,721
2015 271,427 81,256 4,875 357,558 278,387 80,284 4,677 363,348 549,814 161,540 9,552 720,906
2016 289,617 86,831 3,348 379,796 296,755 84,389 3,206 384,350 586,372 171,220 6,554 764,146
2017 300,172 94,485 4,709 399,366 311,233 91,775 4,585 407,593 611,405 186,260 9,294 806,959
2018 316,794 103,685 5,251 425,730 328,222 101,135 4,860 434,217 645,016 204,820 10,111 859,947
Source: Civil Aviation Authority Botswana
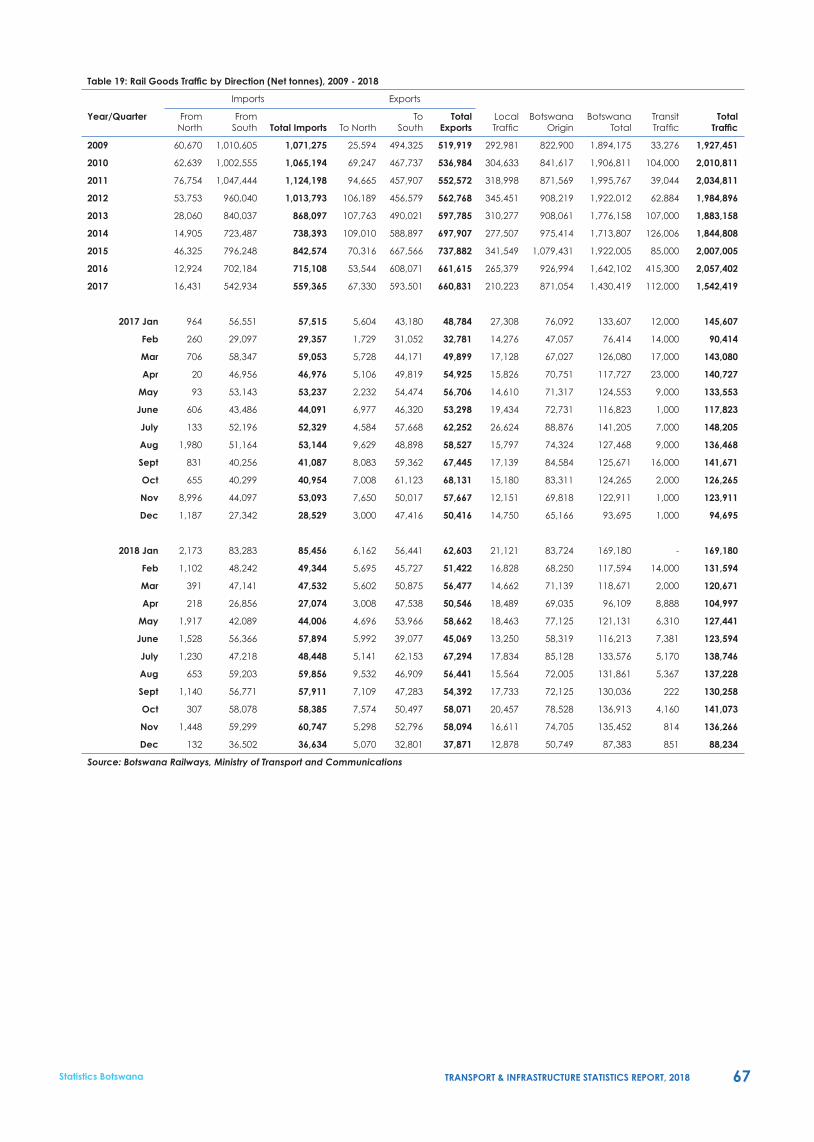
67TRANSPORT & INFRASTRUCTURE STATISTICS REPORT, 2018Statistics Botswana
Table 19: Rail Goods Traffic by Direction (Net tonnes), 2009 - 2018
Imports Exports
Year/Quarter From North
From South Total Imports To North
To South
Total Exports
Local Traffic
Botswana Origin
Botswana Total
Transit Traffic
Total Traffic
2009 60,670 1,010,605 1,071,275 25,594 494,325 519,919 292,981 822,900 1,894,175 33,276 1,927,451
2010 62,639 1,002,555 1,065,194 69,247 467,737 536,984 304,633 841,617 1,906,811 104,000 2,010,811
2011 76,754 1,047,444 1,124,198 94,665 457,907 552,572 318,998 871,569 1,995,767 39,044 2,034,811
2012 53,753 960,040 1,013,793 106,189 456,579 562,768 345,451 908,219 1,922,012 62,884 1,984,896
2013 28,060 840,037 868,097 107,763 490,021 597,785 310,277 908,061 1,776,158 107,000 1,883,158
2014 14,905 723,487 738,393 109,010 588,897 697,907 277,507 975,414 1,713,807 126,006 1,844,808
2015 46,325 796,248 842,574 70,316 667,566 737,882 341,549 1,079,431 1,922,005 85,000 2,007,005
2016 12,924 702,184 715,108 53,544 608,071 661,615 265,379 926,994 1,642,102 415,300 2,057,402
2017 16,431 542,934 559,365 67,330 593,501 660,831 210,223 871,054 1,430,419 112,000 1,542,419
2017 Jan 964 56,551 57,515 5,604 43,180 48,784 27,308 76,092 133,607 12,000 145,607
Feb 260 29,097 29,357 1,729 31,052 32,781 14,276 47,057 76,414 14,000 90,414
Mar 706 58,347 59,053 5,728 44,171 49,899 17,128 67,027 126,080 17,000 143,080
Apr 20 46,956 46,976 5,106 49,819 54,925 15,826 70,751 117,727 23,000 140,727
May 93 53,143 53,237 2,232 54,474 56,706 14,610 71,317 124,553 9,000 133,553
June 606 43,486 44,091 6,977 46,320 53,298 19,434 72,731 116,823 1,000 117,823
July 133 52,196 52,329 4,584 57,668 62,252 26,624 88,876 141,205 7,000 148,205
Aug 1,980 51,164 53,144 9,629 48,898 58,527 15,797 74,324 127,468 9,000 136,468
Sept 831 40,256 41,087 8,083 59,362 67,445 17,139 84,584 125,671 16,000 141,671
Oct 655 40,299 40,954 7,008 61,123 68,131 15,180 83,311 124,265 2,000 126,265
Nov 8,996 44,097 53,093 7,650 50,017 57,667 12,151 69,818 122,911 1,000 123,911
Dec 1,187 27,342 28,529 3,000 47,416 50,416 14,750 65,166 93,695 1,000 94,695
2018 Jan 2,173 83,283 85,456 6,162 56,441 62,603 21,121 83,724 169,180 - 169,180
Feb 1,102 48,242 49,344 5,695 45,727 51,422 16,828 68,250 117,594 14,000 131,594
Mar 391 47,141 47,532 5,602 50,875 56,477 14,662 71,139 118,671 2,000 120,671
Apr 218 26,856 27,074 3,008 47,538 50,546 18,489 69,035 96,109 8,888 104,997
May 1,917 42,089 44,006 4,696 53,966 58,662 18,463 77,125 121,131 6,310 127,441
June 1,528 56,366 57,894 5,992 39,077 45,069 13,250 58,319 116,213 7,381 123,594
July 1,230 47,218 48,448 5,141 62,153 67,294 17,834 85,128 133,576 5,170 138,746
Aug 653 59,203 59,856 9,532 46,909 56,441 15,564 72,005 131,861 5,367 137,228
Sept 1,140 56,771 57,911 7,109 47,283 54,392 17,733 72,125 130,036 222 130,258
Oct 307 58,078 58,385 7,574 50,497 58,071 20,457 78,528 136,913 4,160 141,073
Nov 1,448 59,299 60,747 5,298 52,796 58,094 16,611 74,705 135,452 814 136,266
Dec 132 36,502 36,634 5,070 32,801 37,871 12,878 50,749 87,383 851 88,234
Source: Botswana Railways, Ministry of Transport and Communications
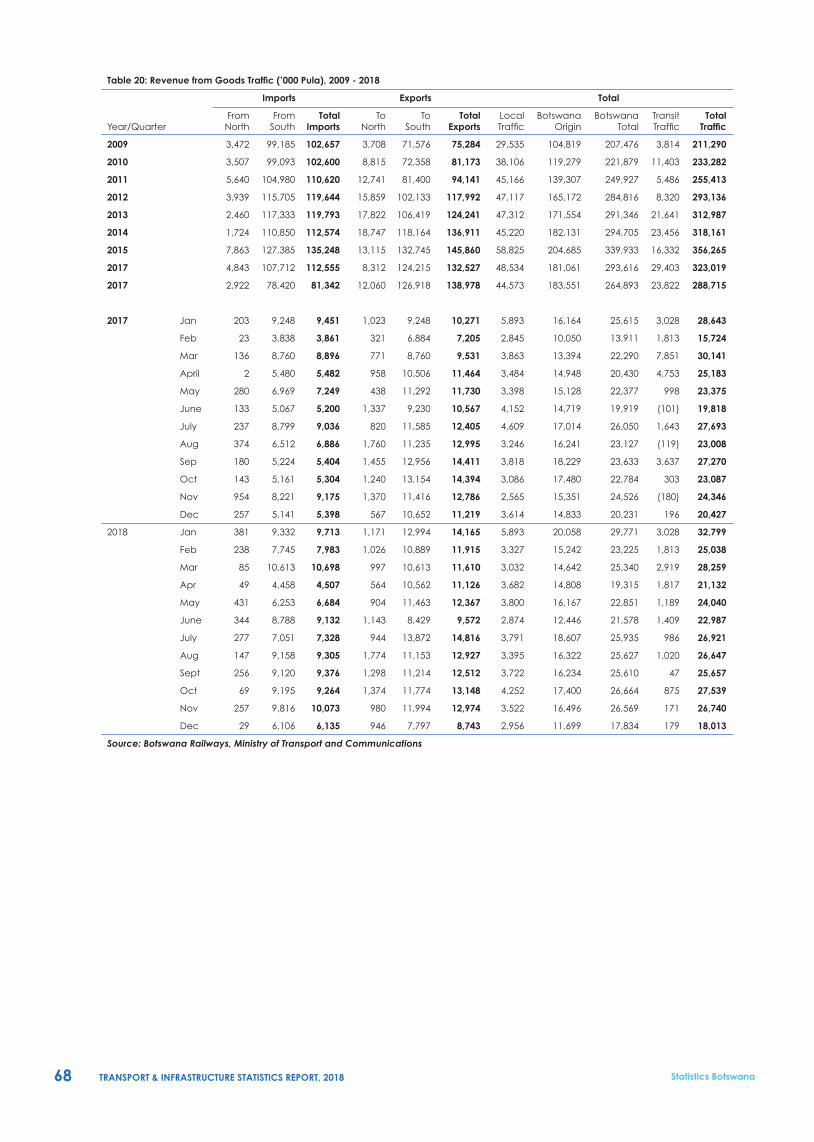
68 TRANSPORT & INFRASTRUCTURE STATISTICS REPORT, 2018 Statistics Botswana
Table 20: Revenue from Goods Traffic (’000 Pula), 2009 - 2018
Imports Exports Total
Year/QuarterFrom North
From South
Total Imports
To North
To South
Total Exports
Local Traffic
Botswana Origin
Botswana Total
Transit Traffic
Total Traffic
2009 3,472 99,185 102,657 3,708 71,576 75,284 29,535 104,819 207,476 3,814 211,290
2010 3,507 99,093 102,600 8,815 72,358 81,173 38,106 119,279 221,879 11,403 233,282
2011 5,640 104,980 110,620 12,741 81,400 94,141 45,166 139,307 249,927 5,486 255,413
2012 3,939 115,705 119,644 15,859 102,133 117,992 47,117 165,172 284,816 8,320 293,136
2013 2,460 117,333 119,793 17,822 106,419 124,241 47,312 171,554 291,346 21,641 312,987
2014 1,724 110,850 112,574 18,747 118,164 136,911 45,220 182,131 294,705 23,456 318,161
2015 7,863 127,385 135,248 13,115 132,745 145,860 58,825 204,685 339,933 16,332 356,265
2017 4,843 107,712 112,555 8,312 124,215 132,527 48,534 181,061 293,616 29,403 323,019
2017 2,922 78,420 81,342 12,060 126,918 138,978 44,573 183,551 264,893 23,822 288,715
2017 Jan 203 9,248 9,451 1,023 9,248 10,271 5,893 16,164 25,615 3,028 28,643
Feb 23 3,838 3,861 321 6,884 7,205 2,845 10,050 13,911 1,813 15,724
Mar 136 8,760 8,896 771 8,760 9,531 3,863 13,394 22,290 7,851 30,141
April 2 5,480 5,482 958 10,506 11,464 3,484 14,948 20,430 4,753 25,183
May 280 6,969 7,249 438 11,292 11,730 3,398 15,128 22,377 998 23,375
June 133 5,067 5,200 1,337 9,230 10,567 4,152 14,719 19,919 (101) 19,818
July 237 8,799 9,036 820 11,585 12,405 4,609 17,014 26,050 1,643 27,693
Aug 374 6,512 6,886 1,760 11,235 12,995 3,246 16,241 23,127 (119) 23,008
Sep 180 5,224 5,404 1,455 12,956 14,411 3,818 18,229 23,633 3,637 27,270
Oct 143 5,161 5,304 1,240 13,154 14,394 3,086 17,480 22,784 303 23,087
Nov 954 8,221 9,175 1,370 11,416 12,786 2,565 15,351 24,526 (180) 24,346
Dec 257 5,141 5,398 567 10,652 11,219 3,614 14,833 20,231 196 20,427
2018 Jan 381 9,332 9,713 1,171 12,994 14,165 5,893 20,058 29,771 3,028 32,799
Feb 238 7,745 7,983 1,026 10,889 11,915 3,327 15,242 23,225 1,813 25,038
Mar 85 10,613 10,698 997 10,613 11,610 3,032 14,642 25,340 2,919 28,259
Apr 49 4,458 4,507 564 10,562 11,126 3,682 14,808 19,315 1,817 21,132
May 431 6,253 6,684 904 11,463 12,367 3,800 16,167 22,851 1,189 24,040
June 344 8,788 9,132 1,143 8,429 9,572 2,874 12,446 21,578 1,409 22,987
July 277 7,051 7,328 944 13,872 14,816 3,791 18,607 25,935 986 26,921
Aug 147 9,158 9,305 1,774 11,153 12,927 3,395 16,322 25,627 1,020 26,647
Sept 256 9,120 9,376 1,298 11,214 12,512 3,722 16,234 25,610 47 25,657
Oct 69 9,195 9,264 1,374 11,774 13,148 4,252 17,400 26,664 875 27,539
Nov 257 9,816 10,073 980 11,994 12,974 3,522 16,496 26,569 171 26,740
Dec 29 6,106 6,135 946 7,797 8,743 2,956 11,699 17,834 179 18,013
Source: Botswana Railways, Ministry of Transport and Communications
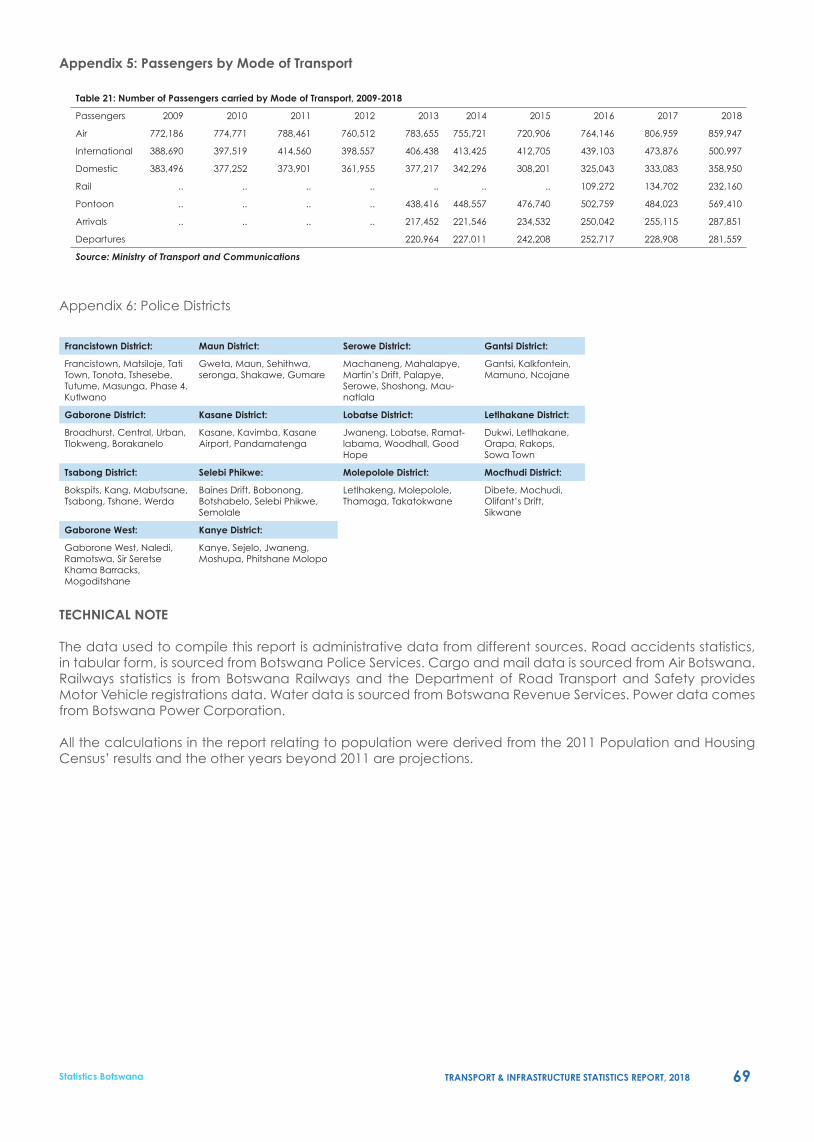
69TRANSPORT & INFRASTRUCTURE STATISTICS REPORT, 2018Statistics Botswana
Table 21: Number of Passengers carried by Mode of Transport, 2009-2018
Passengers 2009 2010 2011 2012 2013 2014 2015 2016 2017 2018
Air 772,186 774,771 788,461 760,512 783,655 755,721 720,906 764,146 806,959 859,947
International 388,690 397,519 414,560 398,557 406,438 413,425 412,705 439,103 473,876 500,997
Domestic 383,496 377,252 373,901 361,955 377,217 342,296 308,201 325,043 333,083 358,950
Rail .. .. .. .. .. .. .. 109,272 134,702 232,160
Pontoon .. .. .. .. 438,416 448,557 476,740 502,759 484,023 569,410
Arrivals .. .. .. .. 217,452 221,546 234,532 250,042 255,115 287,851
Departures 220,964 227,011 242,208 252,717 228,908 281,559
Source: Ministry of Transport and Communications
Appendix 5: Passengers by Mode of Transport
Appendix 6: Police Districts
Francistown District: Maun District: Serowe District: Gantsi District:
Francistown, Matsiloje, Tati Town, Tonota, Tshesebe, Tutume, Masunga, Phase 4, Kutlwano
Gweta, Maun, Sehithwa, seronga, Shakawe, Gumare
Machaneng, Mahalapye, Martin’s Drift, Palapye, Serowe, Shoshong, Mau-natlala
Gantsi, Kalkfontein, Mamuno, Ncojane
Gaborone District: Kasane District: Lobatse District: Letlhakane District:
Broadhurst, Central, Urban, Tlokweng, Borakanelo
Kasane, Kavimba, Kasane Airport, Pandamatenga
Jwaneng, Lobatse, Ramat-labama, Woodhall, Good Hope
Dukwi, Letlhakane, Orapa, Rakops, Sowa Town
Tsabong District: Selebi Phikwe: Molepolole District: Mocfhudi District:
Bokspits, Kang, Mabutsane, Tsabong, Tshane, Werda
Baines Drift, Bobonong, Botshabelo, Selebi Phikwe, Semolale
Letlhakeng, Molepolole, Thamaga, Takatokwane
Dibete, Mochudi, Olifant’s Drift, Sikwane
Gaborone West: Kanye District:
Gaborone West, Naledi, Ramotswa, Sir Seretse Khama Barracks, Mogoditshane
Kanye, Sejelo, Jwaneng, Moshupa, Phitshane Molopo
TECHNICAL NOTE
The data used to compile this report is administrative data from different sources. Road accidents statistics, in tabular form, is sourced from Botswana Police Services. Cargo and mail data is sourced from Air Botswana. Railways statistics is from Botswana Railways and the Department of Road Transport and Safety provides Motor Vehicle registrations data. Water data is sourced from Botswana Revenue Services. Power data comes from Botswana Power Corporation.
All the calculations in the report relating to population were derived from the 2011 Population and Housing Census’ results and the other years beyond 2011 are projections.

70 TRANSPORT & INFRASTRUCTURE STATISTICS REPORT, 2018 Statistics BotswanaISBN NO: 978-99968-081-5